Report on Bogoslof (United States) — December 2017
Bulletin of the Global Volcanism Network, vol. 42, no. 12 (December 2017)
Managing Editor: Edward Venzke.
Edited by A. Elizabeth Crafford.
Bogoslof (United States) Explosions in July and August 2017; new lava dome visible 20-22 August destroyed by explosions that end on 30 August
Please cite this report as:
Global Volcanism Program, 2017. Report on Bogoslof (United States) (Crafford, A.E., and Venzke, E., eds.). Bulletin of the Global Volcanism Network, 42:12. Smithsonian Institution. https://doi.org/10.5479/si.GVP.BGVN201712-311300
Bogoslof
United States
53.93°N, 168.03°W; summit elev. 150 m
All times are local (unless otherwise noted)
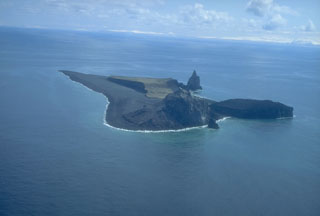
Intermittent eruptions from Bogoslof, 40 km N of the main Aleutian arc (BGVN 42:09, figure 2), have created and destroyed several distinct islands at the summit of this submarine volcano. Previous eruptions in 1927 and 1992 created lava domes that were subsequently heavily eroded, before the most recent eruption began in December 2016 (figure 16). Numerous explosions with ash plumes significantly changed the morphology of the island between December 2016 and March 2017. Ash plumes rose to over 10 km altitude during May-July 2017 multiple times. A lava dome briefly emerged in early June before it was destroyed by subsequent explosions. This report continues with an account of activity between July and December 2017. Eruptive activity ended on 30 August. Information comes primarily from the Alaska Volcano Observatory (AVO) and the Anchorage Volcanic Ash Advisory Center (VAAC).
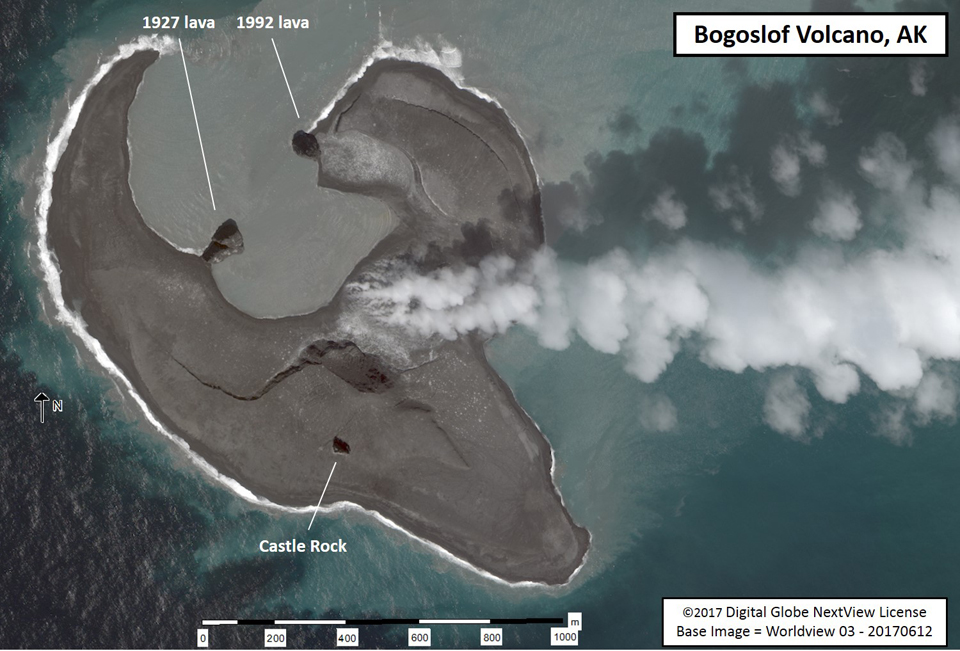 |
Figure 16. Worldview satellite image of Bogoslof collected at 2313 UTC on 12 June 2017, two days after a lava dome that appeared in the lagoon was destroyed. The circular embayments were formed by a series of more than 40 explosions that began in mid-December 2016. These explosions greatly reshaped the island as material was removed and redeposited as air fall. Vigorous steaming was visible from a region S of the most active vent areas in the lagoon. Lava extrusion produced a circular dome that first rose above the water on 5 June and grew to a diameter of ~160 m before being destroyed by an explosion early in the day on 10 June. Courtesy of AVO. |
New explosions during 2, 4, 8, and 9-10 July 2017 produced ash plumes that rose from 6.1 to 11 km altitude. Although significant ash clouds were produced, there were no reports of ashfall in nearby communities. After almost a month of quiet, an eruption on 7 August created new tephra deposits, and extended the N shore of the island. This eruption created a significant SO2 plume that was recorded by satellite instruments. Intermittent pulses of tremor were recorded during mid-August. A new lava dome grew between 20 and 22 August to 160 m in diameter before it was destroyed in a series of explosions during 26-30 August. Thermal anomalies were observed in satellite data several times during September, and they tapered off into early October. Steam emissions were still visible in early November when the last weak thermal anomaly was reported. By early December, significant erosion had begun to change the island's shape, and only minor steam emissions were visible in clear satellite images.
Beginning at 1248 local time (AKDT) on 2 July 2017, a significant explosive event was detected in seismic and infrasound data, and observed in satellite imagery. The event lasted about 16 minutes, and produced an ash plume that rose to 11 km altitude and drifted E, passing N of Dutch Harbor. No explosions were reported the following day, but two events were detected in seismic, infrasound, and satellite data on 4 July. The first, at 1651, lasted 13 minutes and produced an eruption cloud that rose to 8.5 km altitude and drifted SE; the second 11-minute-long eruption began at 1907, and produced a small cloud that rose to 9.8 km altitude and drifted SE.
On the morning of 8 July 2017, an eruption with a total duration of 19 minutes began at 1015 AKDT and produced a volcanic cloud reaching an altitude of 9.1 km that drifted N. Overnight during 9-10 July Bogoslof erupted several times; the first two explosions during the 3-hour-long eruption produced a small ash cloud that rose to 6.1 km altitude and drifted SE, dissipating rapidly. Later on 10 July, an 8-minute-long eruption began at 1000 AKDT and a 15-minute-long eruption began at 1706 AKDT; neither produced a significant plume. None of the eruptions on 8, 9, or 10 July caused ashfall in local communities. Weakly elevated surface temperatures were observed in clear satellite images on 12 and 16 July.
Following almost a month of quiet, Bogoslof erupted again on 7 August 2017. The eruption was detected in seismic, infrasound, satellite, and lightning data. The eruption began at 1000 AKDT and lasted for about three hours, producing an ash plume that rose to 9.7 km altitude according to AVO, and drifted S over Umnak Island, then out over the Pacific Ocean. The Anchorage VAAC initially reported the plume at 10.4 km altitude moving S. A later pilot report noted an altitude of 12.2 km. Satellite measurements of sulfur dioxide (SO2) in the eruption cloud indicated the second highest mass of SO2 erupted since the onset of activity in December 2016 (figure 17). Satellite images of the island taken on 8 August showed new tephra deposits had surrounded the vent area, forming a new crater lake, and extending the N shore of the island by 250 m (figure 18).
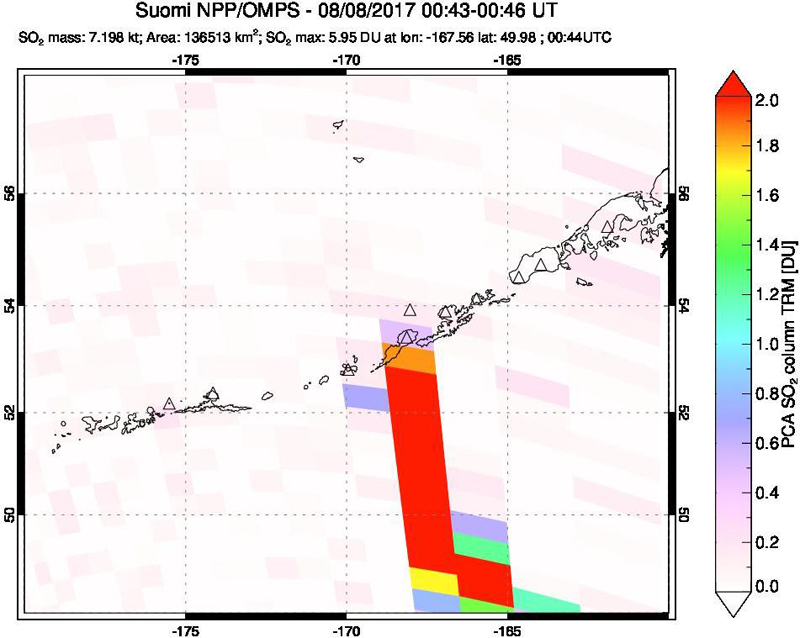 |
Figure 17. Although the data is coarsely pixelated, it is clear that a substantial SO2 plume emerged from Bogoslof during the 7 August eruption, as recorded by the OMPS instrument on the Suomio NPP satellite. Courtesy of NASA Goddard Space Flight Center. |
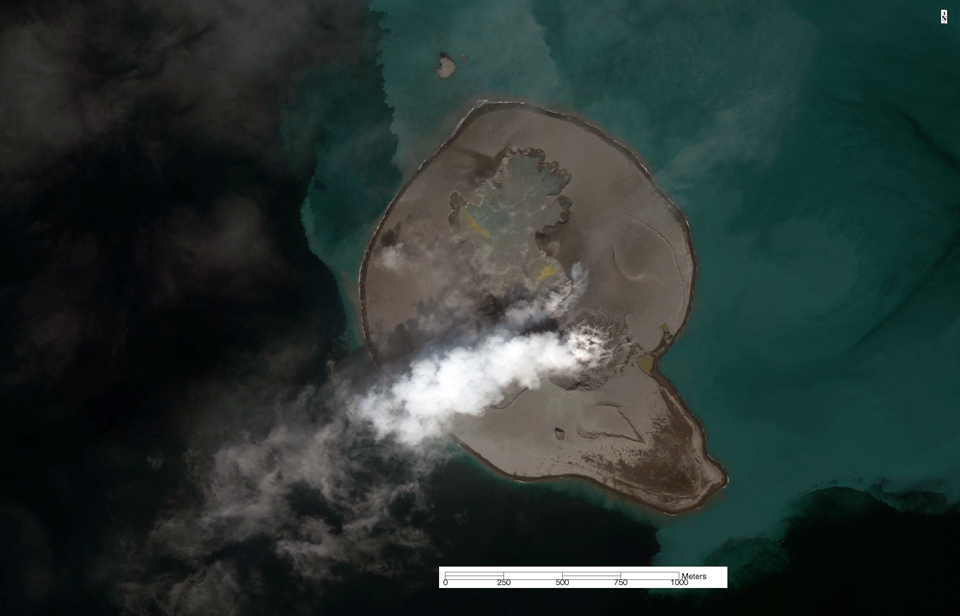 |
Figure 18. Worldview true-color satellite image of Bogoslof acquired on 8 August 2017, one day after a 3-hour-long explosive eruption. Ashfall deposits have expanded the island towards the N as the result of the eruption and formed an enclosed crater lake. At the time of this satellite overpass, the level of the crater lake was below sea level. Previous events such as these (that formed a shallow crater lake) formed a deep crater that was subsequently filled by an influx of ocean water. Vigorous steaming was apparent from the likely site of the initial explosive event in mid-December 2016. Sediment coming from erosion of the island is seen offshore surrounding most of the island. A comparison with figure 16, above, shows the extent of new material added on 7 August. Data provided under the Digital Globe NextView License. Courtesy of AVO. |
Several short-duration seismic and infrasound signals were detected at the stations on nearby islands on 9 August 2017. Weakly elevated surface temperatures and a minor steam plume were observed in satellite images. Two short pulses of tremor were seen in seismic data on 14 August, one lasting five minutes and the other lasting three minutes. Seismicity returned to background levels following the pulses and remained quiet until a series of small earthquakes the next morning. Seismicity again returned to background levels by the following afternoon, 16 August, and remained quiet through the rest of that week. Photographs taken during an overflight on 15 August indicated that the vent region, which had dried out during the 7 August eruption, had refilled with water (figure 19).
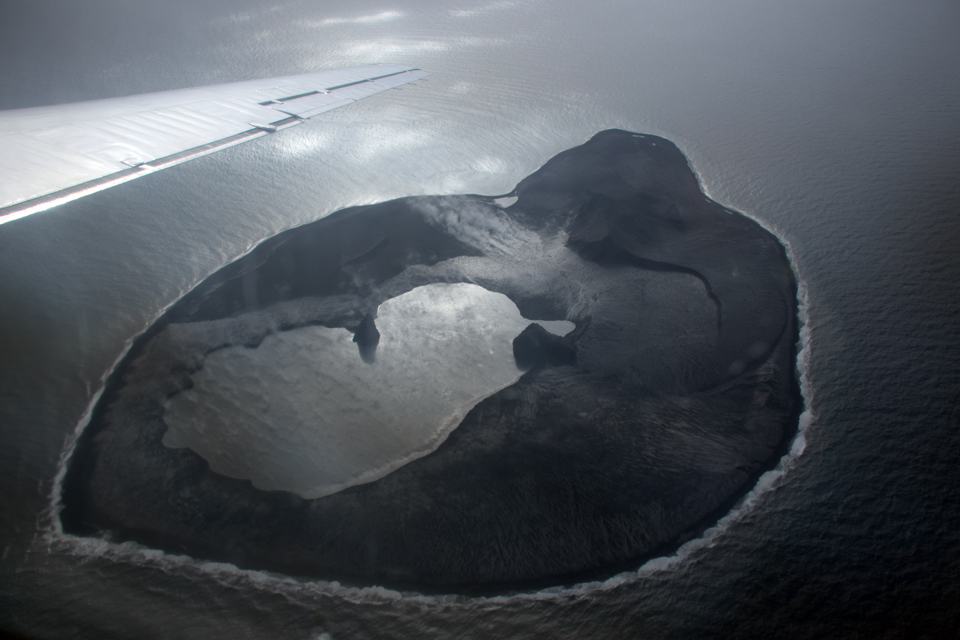 |
Figure 19. An overflight of Bogoslof on 15 August 2017 showed the increase in area of the crater lake after the eruption of 7 August (see figure 18). View is to the SE. Courtesy of AVO. |
Unrest continued during mid-August 2017, and available data suggested that a lava dome had formed within the intra-island lake just W of the 1992 lava dome. The new dome was first observed on 18 August, and during 20-22 August grew to about 160 m in diameter. Two small explosions were detected in infrasound data at 0410 AKDT on 22 August. These explosions did not produce any volcanic plumes recognizable in satellite data. Elevated surface temperatures were observed on 24 August along with a steam plume extending S about 17 km from the island. Satellite images showed elevated surface temperatures and a robust steam plume the next day drifting 70 km SE. A photo from a nearby low-altitude airplane on 26 August, taken shortly before the next explosion, confirmed the intense steam plume (figure 20) likely caused by the interaction of the new dome with seawater. Two MODVOLC thermal alerts were issued on 25 August, the first two since January 2017, and the last two for the year.
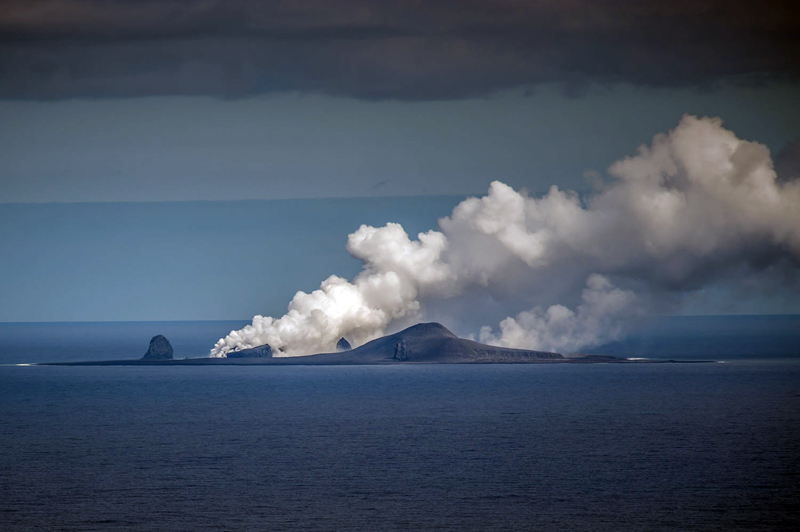 |
Figure 20. Bogoslof volcano with a vigorous steam plume likely caused by interaction of the new, hot lava dome with seawater. Photo by Dave Withrow (NOAA/Fisheries), taken at about 1300 AKDT on 26 August aboard a NOAA twin otter (N56RF) aircraft while surveying harbor seals west of Dutch Harbor. They were 13 nautical miles (24 km) from Bogoslof when photo was taken looking E with a 400 mm lens. Courtesy of AVO. |
An explosive eruption at 1629 AKDT on 26 August 2017 lasted for about four minutes and produced a cloud that was observed in satellite images drifting SE over southern Unalaska Island. Cloud-top temperatures seen in satellite data indicated that it rose as high as 7.3 km altitude. The Anchorage VAAC reported the plume at 8.2 km altitude several hours later. The eruption was observed in seismic, infrasound, and satellite data, and one lightning stroke was detected. Elevated surface temperatures persisted, suggesting to AVO scientists that the lava dome was possibly still present within the crater lake. Three short-duration eruptive events occurred during 27-28 August. On 27 August at 1508 AKDT a brief explosive event lasting about two minutes produced a volcanic cloud that reached about 7.9 km altitude and drifted SE. Another explosive eruption occurred at 0323 AKDT on 28 August and lasted about 25 minutes. Satellite imagery showed only a very small eruption cloud drifting ESE that dissipated quickly. The third event occurred at 1117 AKDT that morning and produced a small ash cloud that likely reached 9 km altitude before dissipating over the North Pacific Ocean. Modeling of ash fallout from the cloud indicated trace to minor ash fall over the Southern Bering Sea in the area just S of the volcano.
Elevated surface temperatures were noted in satellite data on 29 August, along with a steam plume drifting SSE, suggesting to AVO the presence of lava at the surface. An explosive eruption began the next morning at 0405 AKDT and continued intermittently for almost two hours. It produced an ash cloud that reached to about 6 km altitude and drifted SSE, dissipating over the southern Bering Sea and North Pacific Ocean area. A vapor plume extended about 65 km SSE later that day.
AVO reported on 8 September 2017 that available data suggested that the most recent lava dome, first observed on 18 August, was removed by the explosive eruptions of 27-30 August. In addition, a narrow isthmus of new land extended across the crater, bisecting it and creating two lakes. Elevated surface temperatures were recorded in a satellite images on 11, 14, 17, 19, and 23 September. Discolored water was visible in satellite images on 17 September and may have represented outflow from the crater. Elevated surface temperatures continued to be observed in satellite data during periods of clear weather into the first two weeks of October, and again briefly at the beginning of November. Several areas of steam emissions were visible in satellite imagery on 9 October (figure 21).
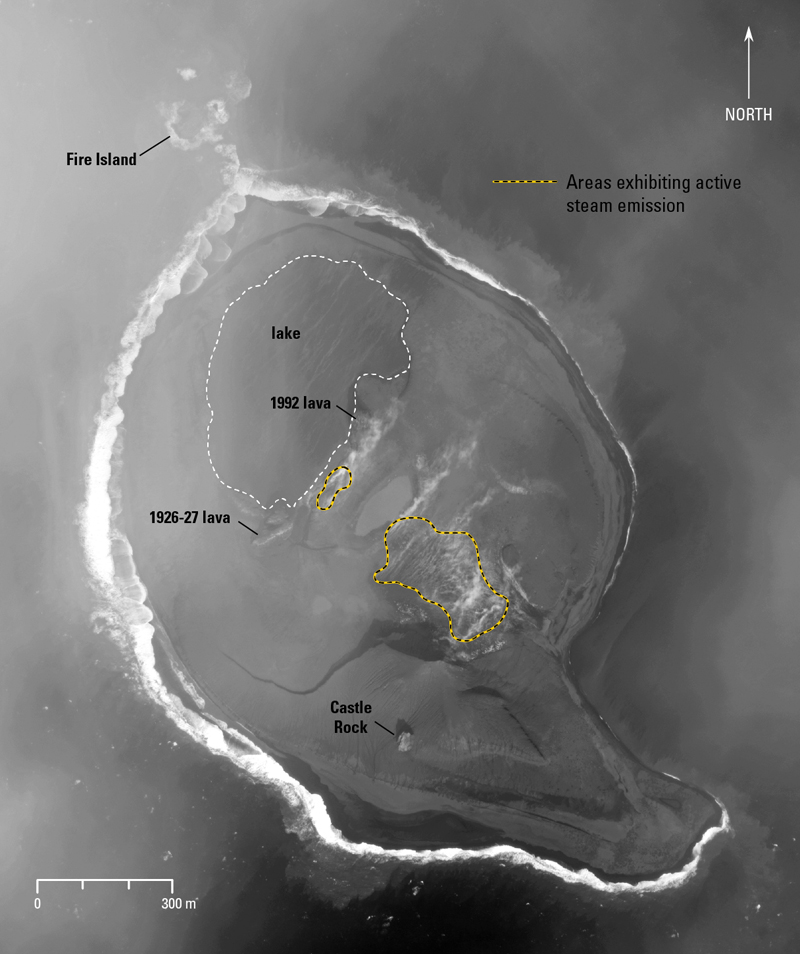 |
Figure 21. Worldview-3 satellite image of Bogoslof Island acquired on 9 October 2017. The areas that exhibited active steam emission are highlighted with yellow and black dashed lines. Image data acquired with the Digital Globe NextView License. Courtesy of AVO. |
A clear, high-resolution satellite image taken on 2 November showed continued steaming of the ground on the S side of the smaller crater lake. Weakly elevated surface temperatures consistent with a hot crater lake were last observed in clear nighttime satellite images on 10 November 2017. Imagery from 20 November showed warm regions in the crater lagoon and at the site of the steaming that had persisted for several months (see figure 21). AVO scientists noted that this was consistent with a slowly cooling, post-eruptive system, and was likely responsible for the occasional observation of slightly elevated surface temperatures in satellite data. The MIROVA graph of thermal anomalies supported the slow cooling trend observed by AVO after the last explosions on 30 August 2017 (figure 22).
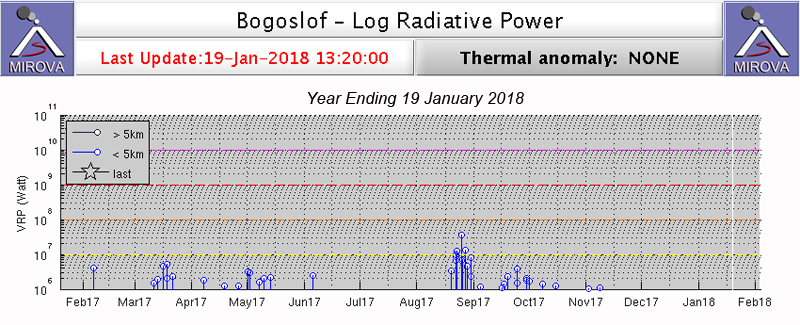 |
Figure 22. The last series of explosive events recorded at Bogoslof during 26-30 August 2017 coincided with the last significant thermal anomalies on the MIROVA graph (infrared MODIS data) that covers the year ending on 19 January 2018. Gradual tapering of thermal anomalies is consistent with AVO satellite observations of a cooling trend during September through early November. Courtesy of MIROVA. |
More than sixty explosive events occurred between 20 December 2016 and 30 August 2017. The most energetic of these sent water-rich, volcanic ash clouds to altitudes exceeding 10.7 km. The resulting dispersed volcanic clouds impacted local and international aviation operations over portions of the North Pacific and Alaska. Although most of the volcanic ash fell into the ocean, trace amounts were twice deposited on the community of Unalaska and the Port of Dutch Harbor. The 2016-17 eruption greatly changed the morphology of Bogoslof Island. At its greatest extent, the area of the island increased to about three times its pre-eruption size. Nearly all of the new material on the island is unconsolidated pyroclastic fall and flow (surge) deposits. The deposits are highly susceptible to wave erosion and additional changes in the configuration of the island are likely. A satellite image from 3 December 2017 shows significant erosion of the island with the vent lagoon opened to the ocean on the north shore of the island (figure 23).
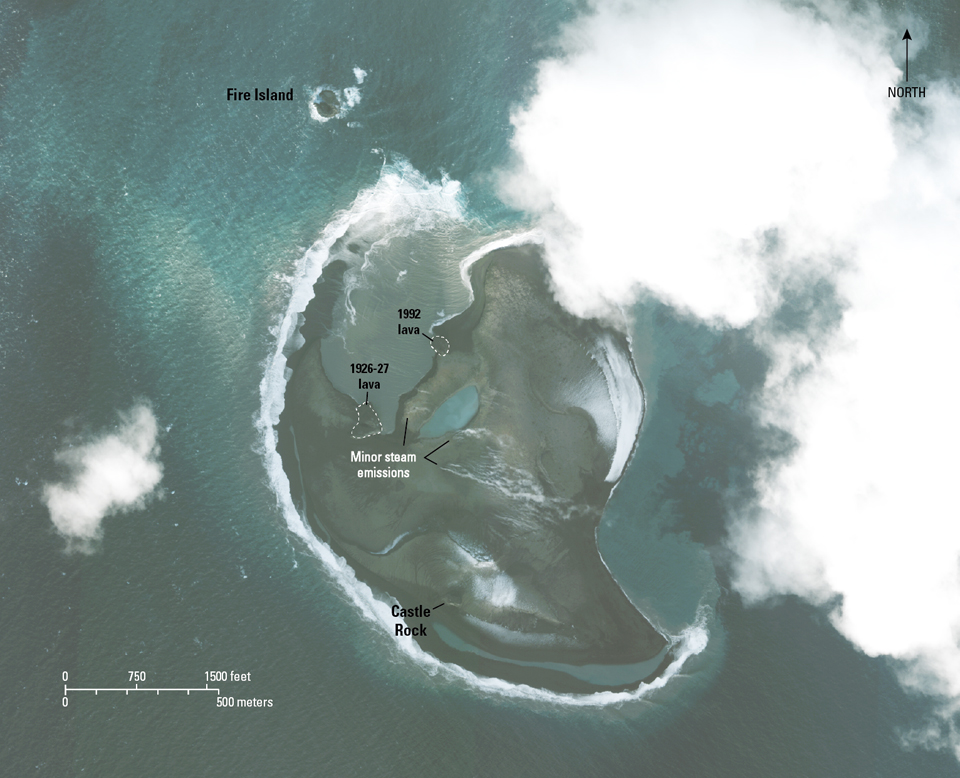 |
Figure 23. Worldview-3 satellite image of Bogoslof Island on 3 December 2017. Erosion of the island by waves had removed substantial material, and no new eruptive material had been added to the island since the end of August 2017. The approximate area of the island in this image was 1.3 square kilometers. Image data acquired with the Digital Globe NextView License. Courtesy of AVO. |
Geological Summary. Bogoslof is the emergent summit of a submarine volcano that lies 40 km N of the main Aleutian arc. It rises 1,500 m above the Bering Sea floor. Repeated construction and destruction of lava domes at different locations during historical time has greatly modified the appearance of this "Jack-in-the-Box" volcano and has introduced a confusing nomenclature applied during frequent visits by exploring expeditions. The present triangular-shaped, 0.75 x 2 km island consists of remnants of lava domes emplaced from 1796 to 1992. Castle Rock (Old Bogoslof) is a steep-sided pinnacle that is a remnant of a spine from the 1796 eruption. The small Fire Island (New Bogoslof), about 600 m NW of Bogoslof Island, is a remnant of a lava dome formed in 1883.
Information Contacts: Alaska Volcano Observatory (AVO), a cooperative program of a) U.S. Geological Survey, 4200 University Drive, Anchorage, AK 99508-4667 USA (URL: http://www.avo.alaska.edu/ ), b) Geophysical Institute, University of Alaska, PO Box 757320, Fairbanks, AK 99775-7320, USA, and c) Alaska Division of Geological & Geophysical Surveys, 794 University Ave., Suite 200, Fairbanks, AK 99709, USA (URL: http://www.dggs.alaska.gov/); Anchorage Volcanic Ash Advisory Center (VAAC), Alaska Aviation Weather Unit, NWS NOAA US Dept of Commerce, 6930 Sand Lake Road, Anchorage, AK 99502-1845(URL: http://vaac.arh.noaa.gov/); MIROVA (Middle InfraRed Observation of Volcanic Activity), a collaborative project between the Universities of Turin and Florence (Italy) supported by the Centre for Volcanic Risk of the Italian Civil Protection Department (URL: http://www.mirovaweb.it/); Hawai'i Institute of Geophysics and Planetology (HIGP), MODVOLC Thermal Alerts System, School of Ocean and Earth Science and Technology (SOEST), Univ. of Hawai'i, 2525 Correa Road, Honolulu, HI 96822, USA (URL: http://modis.higp.hawaii.edu/); NASA Goddard Space Flight Center (NASA/GSFC), Global Sulfur Dioxide Monitoring Page, Atmospheric Chemistry and Dynamics Laboratory, 8800 Greenbelt Road, Goddard, Maryland, USA (URL: https://so2.gsfc.nasa.gov/).