Report on Mayon (Philippines) — April 2018

Bulletin of the Global Volcanism Network, vol. 43, no. 4 (April 2018)
Managing Editor: Edward Venzke.
Edited by A. Elizabeth Crafford.
Mayon (Philippines) Explosion on 13 January 2018 begins new eruptive episode; 5-km-high ash plume on 22 January
Please cite this report as:
Global Volcanism Program, 2018. Report on Mayon (Philippines) (Crafford, A.E., and Venzke, E., eds.). Bulletin of the Global Volcanism Network, 43:4. Smithsonian Institution. https://doi.org/10.5479/si.GVP.BGVN201804-273030
Mayon
Philippines
13.257°N, 123.685°E; summit elev. 2462 m
All times are local (unless otherwise noted)
Steep-sloped and symmetrical Mayon has recorded historical eruptions back to 1616 that range from Strombolian fountaining to basaltic and andesitic flows, as well as large ash plumes, and devastating pyroclastic flows and lahars. A lava dome that grew during August-October 2014 resulted in rockfalls, pyroclastic flows, and lava flows from the summit crater that led to evacuations in nearby communities (BGVN 41:03). Activity declined during November and December 2014 and remained low throughout 2015. By February 2016 the Alert Level was reduced to 0 (on a 0-5 scale) by the Philippine Institute of Volcanology and Seismology (PHIVOLCS) which monitors the volcano. A seismic swarm in August 2016, and the beginning of a new eruption in January 2018 are covered in this report with information provided primarily by PHIVOLCS.
After a brief seismic swarm in August 2016, Mayon remained quiet until a phreatic explosion on 13 January 2018 sent an ash plume 2,500 m above the summit and scattered ash over numerous nearby communities. The growth of a new lava dome sent lava flows down the flanks and ash plumes multiple kilometers above the summit during subsequent weeks. Lava fountaining produced incandescence at the summit for many weeks. Lava collapse events from the flow fronts sent pyroclastic density currents (PDC's) down multiple ravines during January and February 2018. Lava fountaining activity became nearly continuous at the beginning of February but began to taper off by mid-month. Flows had reached as far as 4.5 km down ravines, and lava-collapse generated pyroclastic density currents reached 5 km from the summit crater. The pyroclastic activity continued through February from the gravity-driven collapsing flow fronts even though fountaining and lava effusion had decreased. Brief periods of fountaining and gravity-driven lava flow were noted throughout March 2018, but activity had essentially ceased by month's end.
Activity during 2016-2017. Very low seismicity of 0-2 volcanic earthquakes per day was typical for January and early February 2016; the largest number recorded was 12 on 9 January. On 12 February 2016, PHIVOLCS noted that seismicity had remained at baseline levels of 0-2 earthquakes per day for the previous six months, indicating that rock fracturing associated with magmatic activity had diminished. Ground deformation information suggested a return to pre-2014 eruption positions, and low levels of SO2 flux had been consistent since November 2015. They reduced the Alert Level to 0.
Increasing SO2 flux above 1,000 tons/day beginning in July 2016 was accompanied by ground deformation measurements suggesting renewed inflation. A brief swarm of 146 earthquakes was recorded by the Mayon Volcano Observatory's seismic network from 3-6 August; they were located 10 km away on the SE flank. This change led PHIVOLCS to raise the Alert Level back to 1 on 8 September 2016. Seismicity and SO2 levels remained very low through the end of 2016, but GPS data suggested continued inflation. Slight inflation was recorded throughout 2017. Rare days of small seismic swarms of more than 10 earthquakes occurred during 2017, but otherwise seismicity and SO2 flux values remained within background levels.
Activity during January 2018. A sudden phreatic eruption at 1621 local time on 13 January 2018 sent a gray steam-and-ash plume 2,500 m above the summit that drifted SW. The activity lasted for a little under two hours. Traces of ash fell on the Barangays of Anoling (4 km SW), Sua (6 km SW), Quirangay (9 km SW), Tumpa (9 km SW), Ilawod (10 km SW), and Salugan (8 km SW) in the city of Camalig and in the Barangays of Tandarora (26 km WSW), Maninila (8 km SW), and Travesia (10 km SW) in the municipality of Guinobatan. Incandescence at the summit crater was first observed a few hours later. As a result, PHIVOLCS raised the Alert Level from 1 to 2 early the next day.
Two more phreatic explosions occurred the following morning (14 January) at 0849 and 1143 that each produced ash plumes, but they were largely obscured by summit clouds. Minor amounts of ash were reported in Camalig. By the evening, PHIVOLCS had raised the Alert Level again to 3 after three explosions, 158 rockfall events, and the observation of bright incandescence at the summit crater. By 2000 on 14 January they noted the growth of a new lava dome and the beginnings of a lava flow towards the southern flank.
Two lava collapse events on the morning on 15 January each lasted 5-10 minutes. They originated from the lava flow front and produced rockfall and small-volume pyroclastic density currents. Ash plumes drifted SW and rained ash on Travesia, Muladbucad Grande, Maninila, Masarawag, Poblacion, Iraya, Ilawod, Calzada, Inamnan Grande, Inamnan Pequeno, Maguiron, Quitago and Mauraro in the municipality of Guinobatan and on the Baranguays of Cabangan, Anoling, Sua, Tumpa, Quirangay, Gapo, and Sumlang, and Baranguays 1 to 7 in the municipality of Camalig. A degassing event at 1107 produced a grayish to dirty white ash column that rose to a maximum of height of approximately 1,000 m above the summit before drifting WSW.
Lava effusion continued from the summit during 16-21 January 2018 with flows down the Mi-isi and Bonga gullies and occasional short-duration lava fountaining. Tens of daily lava collapse events accompanied the growth of the flow in the Mi-isi gully which had reached about 3 km from the summit by 18 January. Debris from the growing summit dome also descended the Matanag and Buyuan Gullies. Pyroclastic density currents descended the Mi-isi, Matanag, and Buyuan Gullies. Ash plumes rose up to 2 km and drifted SW from the summit crater and caused ashfall in Camalig, Guinobatan, and Polangui (figures 26-28).
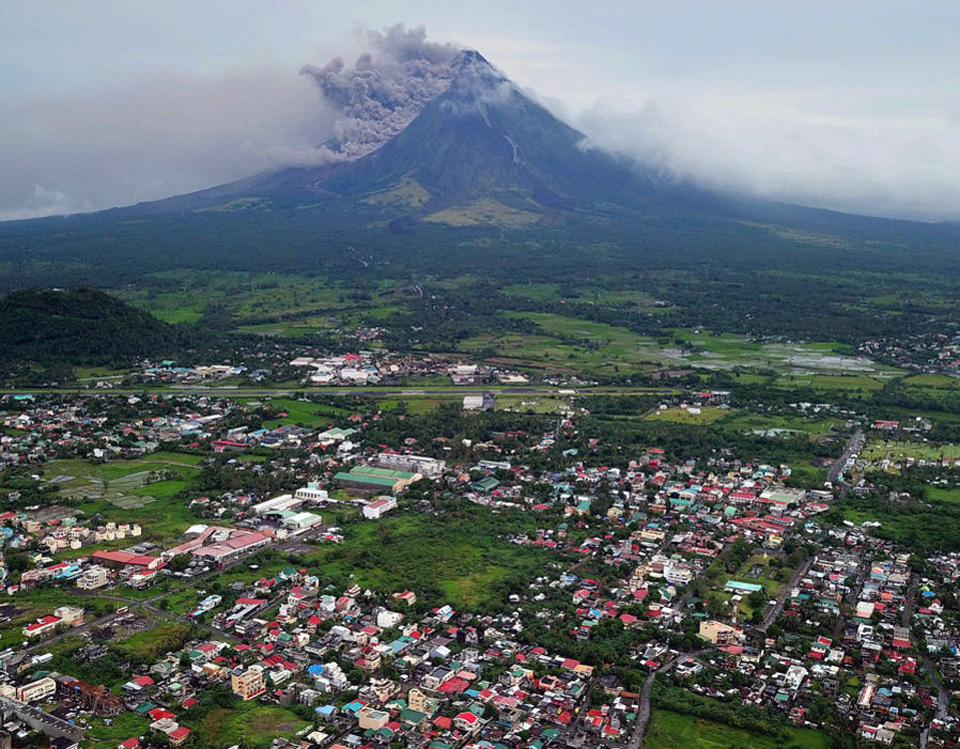 |
Figure 26. Mayon emitted ash and steam along with pyroclastic density currents that flowed down the SW flank on 16 January 2018. View is looking N from S of the airport in Lagazpi City, Philippines, about 12 km S. Courtesy of The Express, photo from European Pressphoto Agency. |
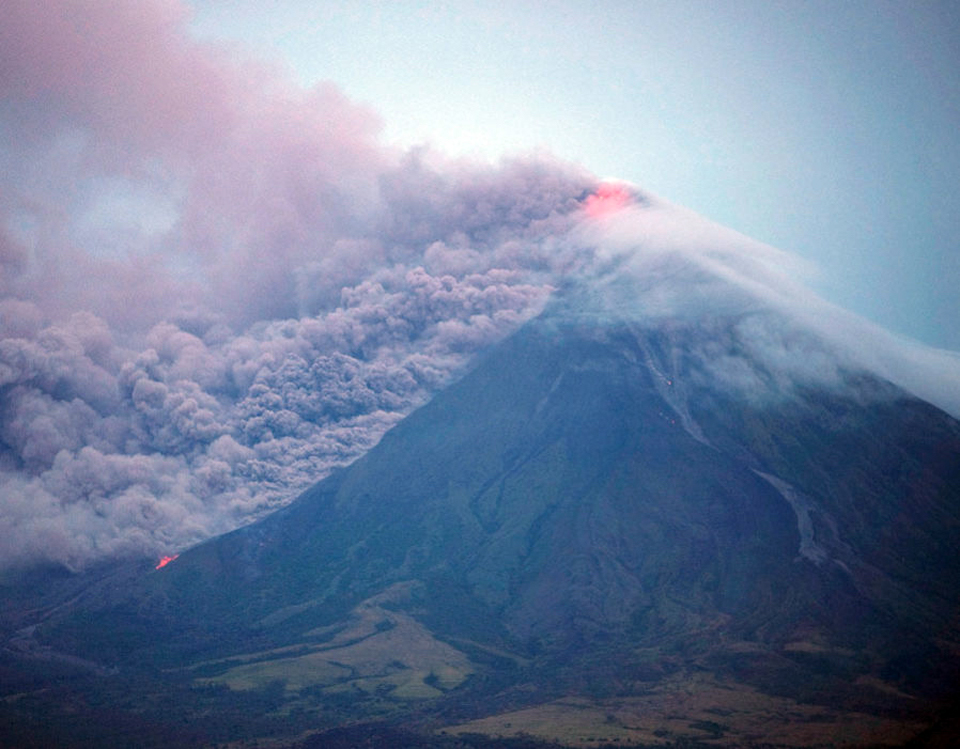 |
Figure 27. Pyroclastic density currents (PDC's) descended the W flank of Mayon on 16 January 2018. Incandescence at the base of the PDC was also visible. Lava was fountaining at the summit and incandescent blocks were rolling down the Mi-isi drainage on the S flank. Image taken near Legazpi city, 12 km S. Courtesy of The Express, photo from European Pressphoto Agency. |
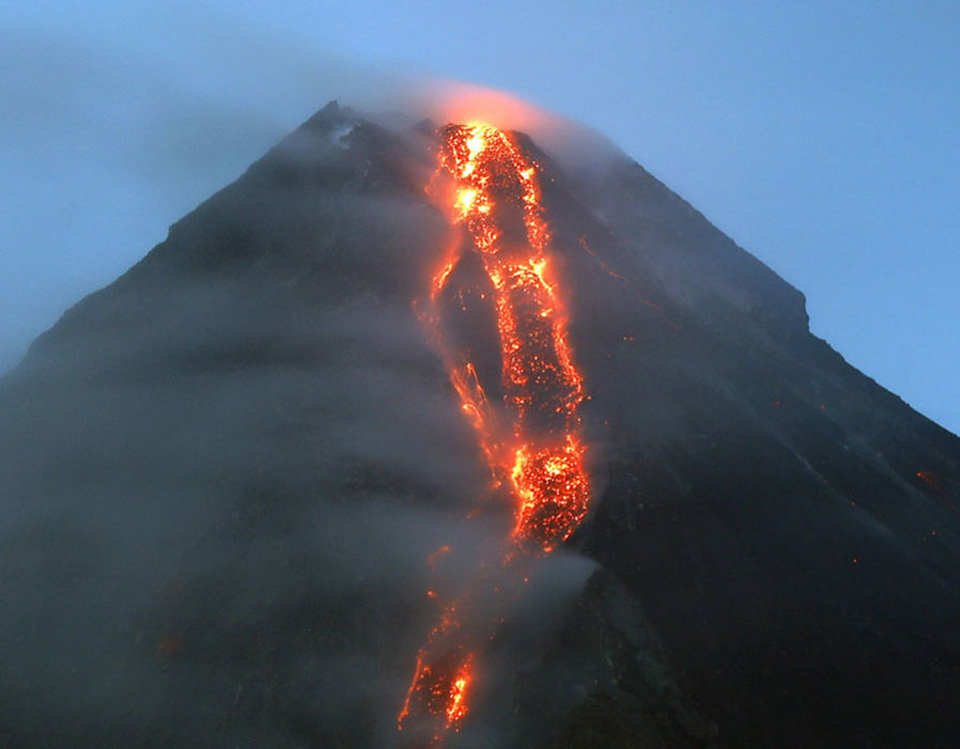 |
Figure 28. Lava flows at Mayon descended the Mi-isi drainage on the S flank and were visible from Legazpi city on 17 January 2018. Courtesy of The Express, photo from European Pressphoto Agency. |
Activity increased on 22 January 2018 with lava fountains at the summit reaching 200-500 m high, the lava flow into the Mi-isi drainage extending beyond 3 km, and two new flows in the Bonga gully and upper Buyuan watershed. A dense 5-km-tall ash plume erupted at 1243 during a phreatomagmatic event that lasted for 8 minutes (figure 29). It generated pyroclastic density currents in several drainages within 4 km of the summit vent including Mi-isi, Bonga, Buyuan, Basud, San Andres, Buang, Anoling and other minor drainages. Ash was blown W and fell on the municipalities of Guinobatan, Camalig, Oas, Polangui and Iriga City. Five additional episodes of lava fountaining to 700 m occurred overnight that fed the Mi-isi and Bonga gully flows, and generated ash plumes to 2.5 and 3 km above the summit. This increase in activity led PHIVOLCS to raise the Alert Level to 4. By the following day, more than 50,000 people had evacuated to emergency shelters and civil aviation authorities temporarily closed airports in the cities of Legazpi and Naga.
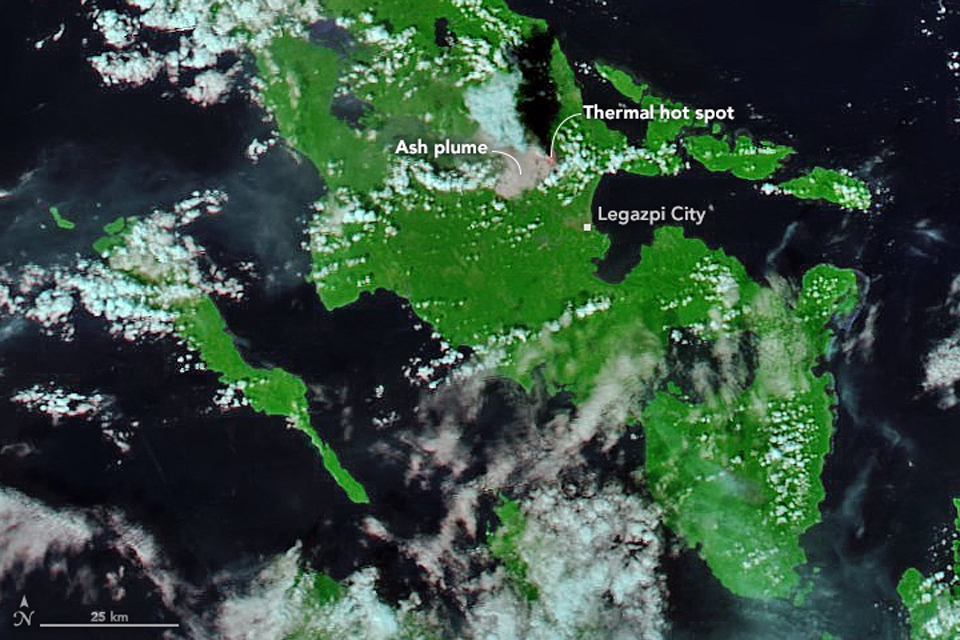 |
Figure 29. The Moderate Resolution Imaging Spectroradiometer (MODIS) on NASA's Aqua satellite acquired this image of the area around Mayon in the Philippines on 22 January 2018. The image combines natural-color data with thermal infrared bands (7-2-1). The substantial ash plume from the explosion that day rose to 10.9 km altitude and drifted NW and W, and the emerging lava dome appeared as a thermal hotspot at the summit. Courtesy of NASA Earth Observatory. |
Numerous episodes of intense lava fountains during the nights of 23-26 January each lasted from a few minutes to more than an hour. They generated 150-600 m high fountains and continued to feed the flows in the Mi-isa and Bonga gullies. Ash plumes also rose from 0.5-5 km above the crater. The Mi-isa gully flow remained at 3 km from the summit, and the Buyuan flow had reached 1 km by 24 January. Pyroclastic density currents in the Mi-isi, Lidong/Basud, and Buyuan drainages were also observed. The PDCs in the Buyuan drainage traveled more than 5 km from the summit crater (figures 30-33).
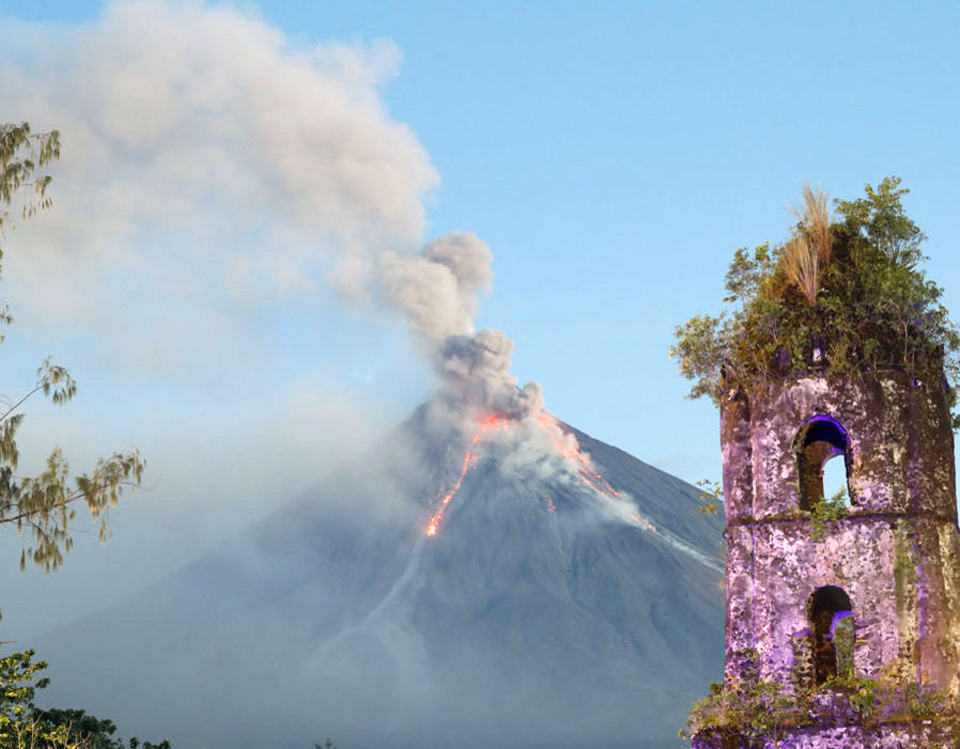 |
Figure 30. Ash and steam plumes rose from the summit crater of Mayon while lava flows descended drainages on the S flank as seen from the town of Daraga, 10 km S, on 23 January 2018. Courtesy of The Express, photo from European Pressphoto Agency. |
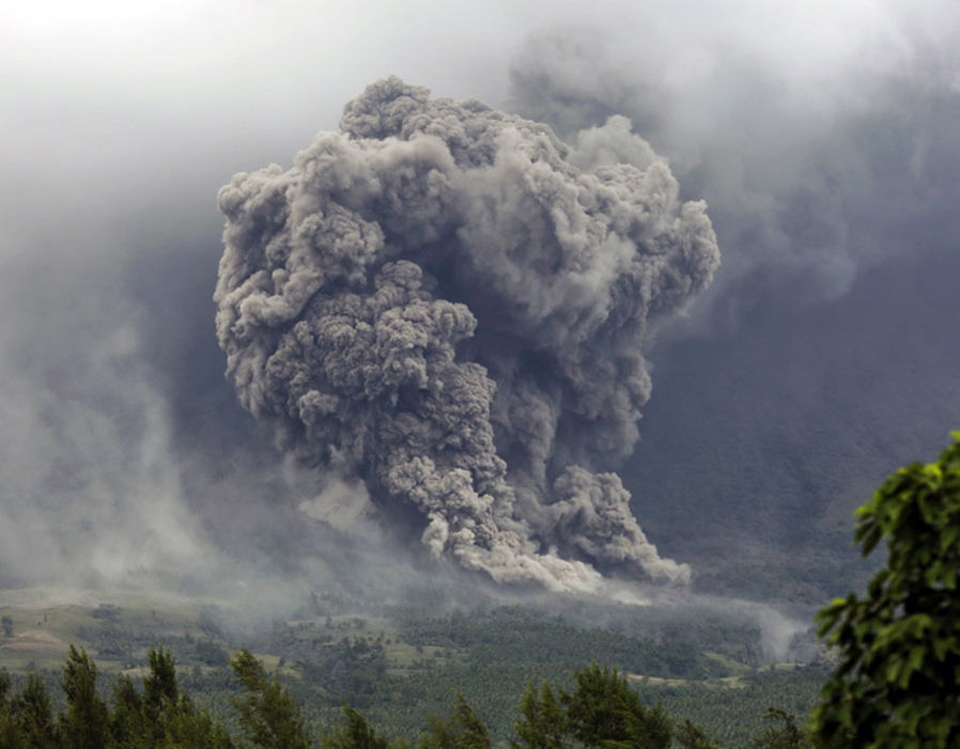 |
Figure 31. An ash plume rises, likely from a pyroclastic density current, in a drainage on the SE flank of Mayon, a few kilometers N of the town of Daraga on 23 January 2018. Courtesy of The Express, photo from European Pressphoto Agency. |
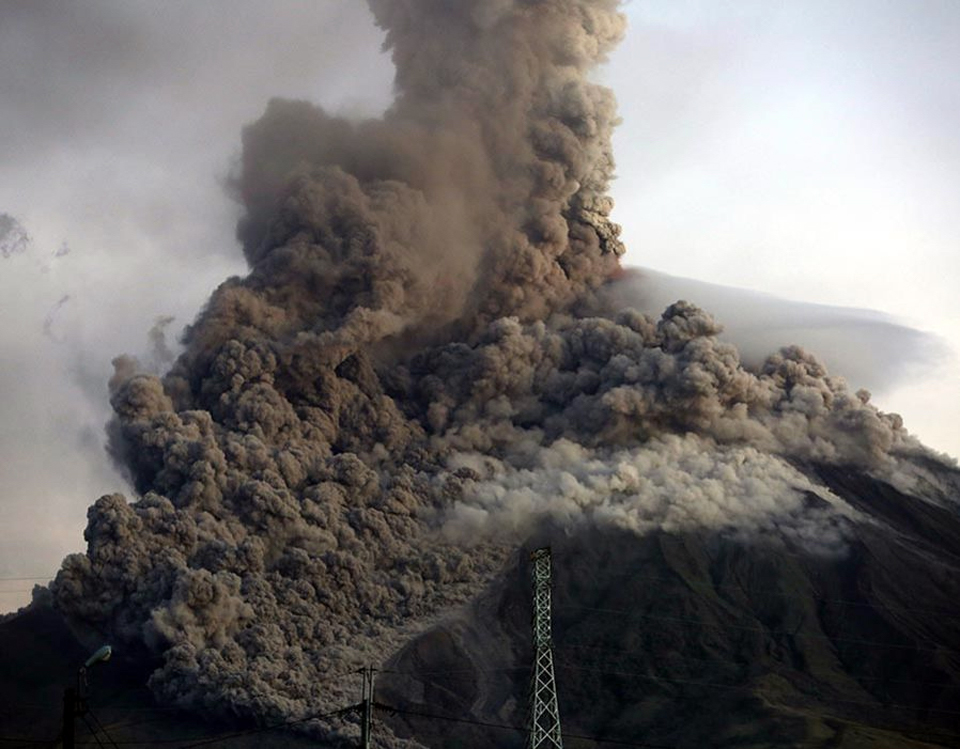 |
Figure 32. Ash and pyroclastic density currents emerged from the summit of Mayon on 24 January 2018, sending ashfall to nearby communities and filling drainages with pyroclastic debris. Image taken from Daraga, 10 km S. Courtesy of The Express, photo from European Pressphoto Agency. |
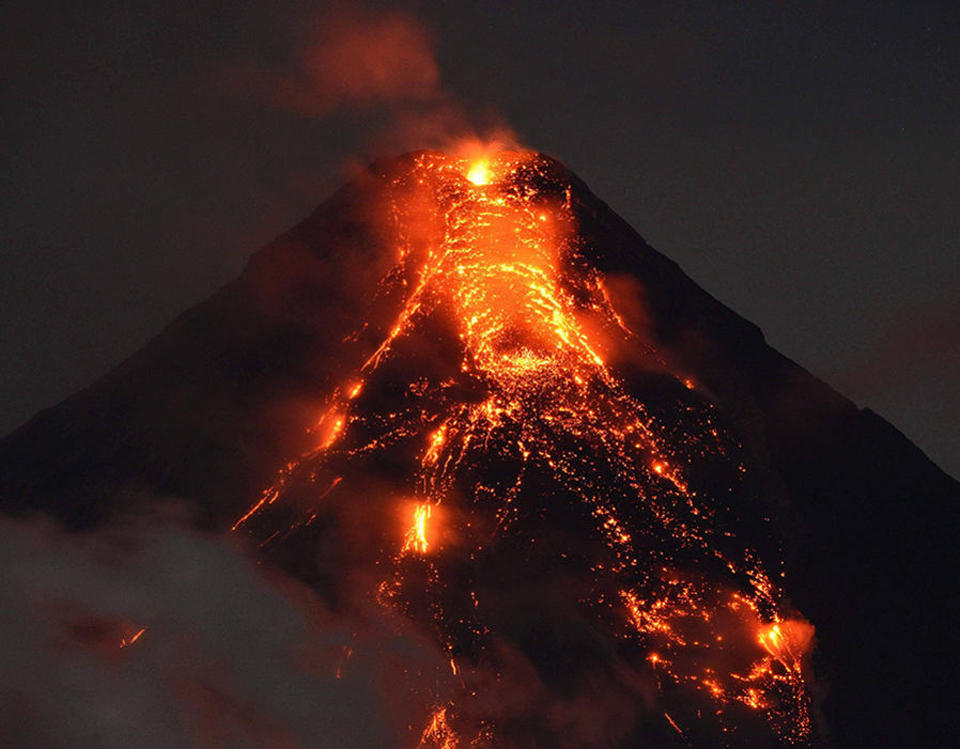 |
Figure 33. Lava flows were very active on the S flank of Mayon, visible from about 12 km SSE in Legazpi on 25 January 2018. Courtesy of The Express, AFP/Getty Images. |
By the evening of 26 January 2018, the lava fountaining episodes had transitioned into aseismic lava effusion, feeding incandescent flows into the Bonga and Mi-isi gullies on the S flank, and advancing the flow in the Bonga significantly downslope to 1.8 km. Fewer fountaining episodes continued during 27-28 January. Heavy rainfall during 28-29 January remobilized deposits from pyroclastic density currents and generated sediment-laden stream flows in several channels (figure 34) and channel-confined lahars on the Binaan Channel.
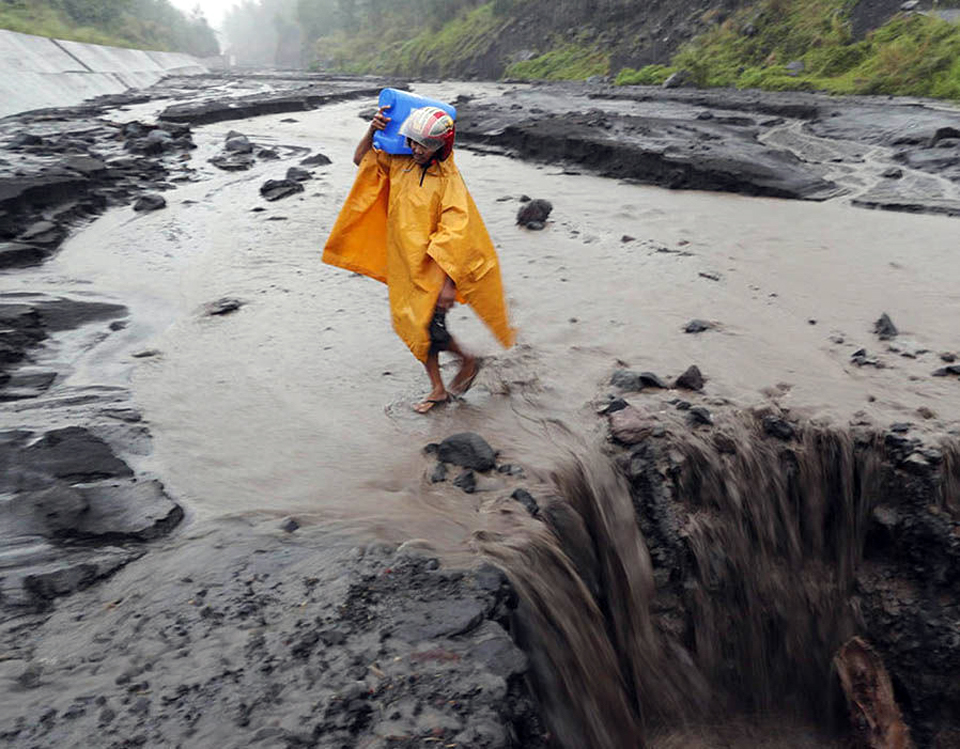 |
Figure 34. Sediment-laden streams posed hazards to residents of Camalig (11 km SW) at Mayon on 28 January 2018 after heavy rains and numerous PDC's had filled the drainages with debris. Courtesy of The Express, photo from European Pressphoto Agency. |
A significant increase in lava effusion and fountaining at the summit during the evening of 29 January 2018 fed PDCs into the Mi-isi and Bonga Gullies, and resulted in significant ashfall in Camalig and Guinobatan to the SW. Intermittent lava fountaining to 200 m, flow-front collapses that generated PDC events, low-level ash emissions, and slow lava effusion from the summit crater continued during 30 January-4 February (figures 35 and 36). The Mi-isi and Basud lava flows had advanced to 3.2 and 3.6 km, respectively, from the summit crater by 1 February, and the Bonga-Buyuan flow had advanced 4.3 km by 3 February.
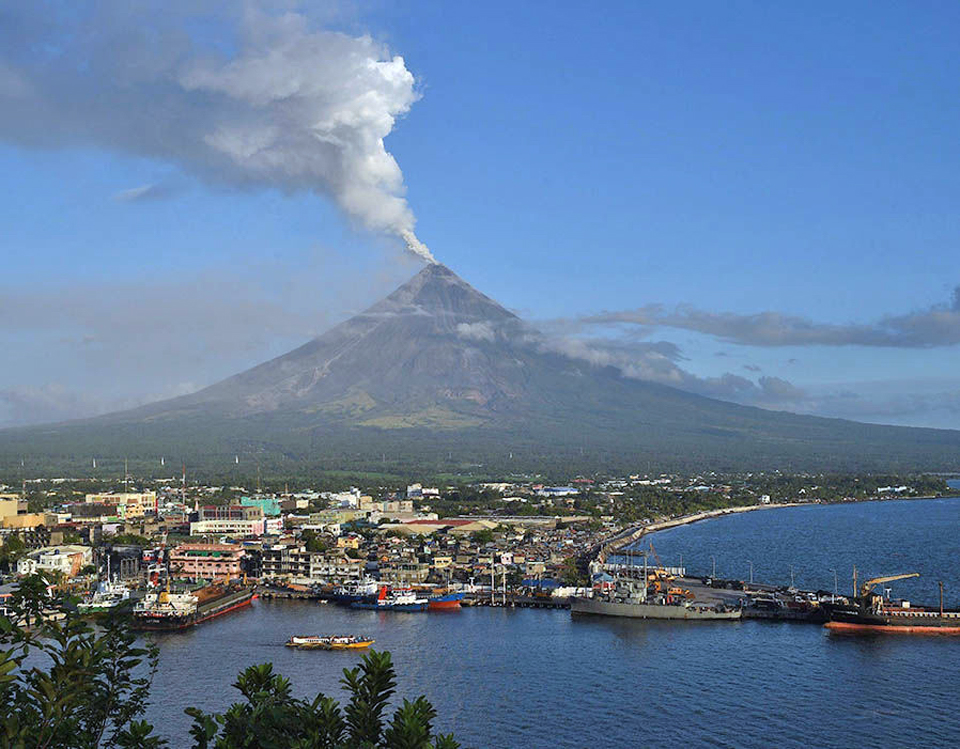 |
Figure 35. Steam-and-ash plumes rose steadily above Mayon on 31 January 2018. Image taken at the port in Legazpi City, about 15 km S. Courtesy of The Express, Getty Images. |
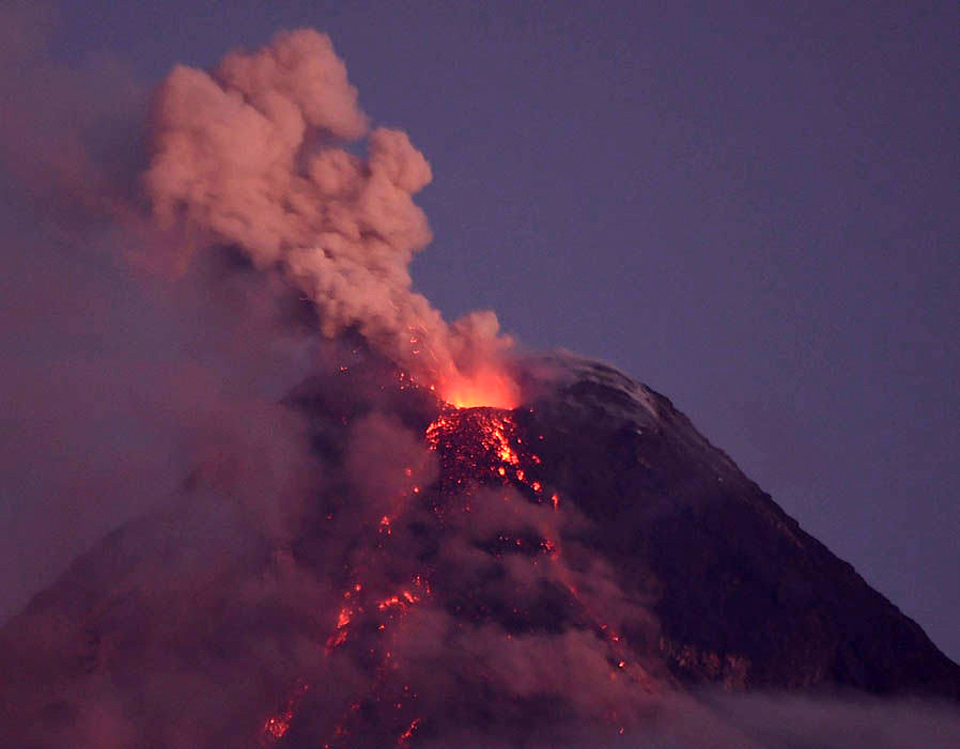 |
Figure 36. Lava effusion at the summit of Mayon had decreased from a week earlier (see figure 33) by 31 January 2018. Courtesy of The Express, Getty Images. |
Activity during February-March 2018. Lava fountaining reached 550 m above the summit crater on 5 February and increased to near-continuous activity the next day. Lava flows and incandescent rockfalls were observed throughout the night in the Mi-isi and Bonga-Buyuan channels. High volumes of incandescent lava flows advanced to 3.2, 4.5, and approximately 3.0 km down the Mi-isi, Bonga-Buyuan and Basud channels. Pyroclastic density currents from the collapsing flow fronts reached 4.6, 4.4, and 4.2 km from the summit crater in the same drainages during 7 February. Near-continuous fountaining accompanied by steam plumes that rose up to 800 m continued through 10 February.
Lava fountaining became sporadic and weak beginning on 11 February. Heavy rainfall during 13 February generated channel-confined lahars in the Anoling channel. By 14 February, lava flows remained at 3.3 km, 4.5 km, and 900 m down the Mi-isi, Bonga and Basud gullies, and PDCs had deposited material to distances of 4.6, 4.5, and 4.2 km in the same drainages. Intermittent lava fountaining continued through 22 February. The fountains generally rose 100-600 m above the summit and were often audible more than 10 km from the summit.
Quieter lava effusion with fewer fountaining events was more typical behavior beginning on 23 February. Numerous episodes of lava-collapse pyroclastic density currents were visually observed on the Mi-isi, Basud, and Bonga-Buyuan Gullies within 2-4 kilometers of the summit crater during the second half of February. Deflation of the lower slopes that began on 20 February was recorded by electronic tiltmeter, consistent with the transition to seismically quieter lava effusion at the summit crater. However, the overall electronic tiltmeter and the continuous GPS data indicated that the volcano was still inflated relative to October and November 2017 levels.
Weak fountaining, lava effusion, and degassing were noted during 25-28 February. The sporadic fountains generated plumes that rose 800 m, and weak effusion continued to feed the flows in the drainages. Gravity-driven lava flow movement and degassing with ash plumes rising 600 m above the summit were the primary activity at Mayon on 1 March, although occasional lava fountaining events were still observed. Based on the decrease in activity at the summit, the decrease in seismicity, continued deflation, and significantly lower SO2 emissions, PHIVOLCS lowered the Alert Level to 3 on 6 March 2018.
Brief periods of weak fountaining and lava flows were observed during 7-24 March. The fountaining generated dark gray ash plumes that rose 100-300 m above the summit crater before drifting SW, and were sometimes audible more than 10 km from the summit crater. At night, lava flows continued moving downslope within 3.3, 4.5, and 1.9 km of the crater in the Mi-isi, Bonga, and Basud gullies. Steam plumes rose as high as 2.5 km above the summit before drifting SW on 7 March. Intermittent bluish steam-laden plumes rose to 700 m before drifting SW on 14 March. A slight inflation of the lower flanks beginning on 11 March 2018 was recorded by electronic tiltmeters through at least 22 March. Overall deformation data indicated that the edifice was still inflated relative to pre-eruption baselines.
Beginning around 24 March 2018, the primary activity consisted of intermittent lava collapse events in the Mi-isi gully located between 4-5 km from the summit and steam-laden plumes that drifted SW from the summit. Lava flow effusion at the crater was last detected on 18 March. Ground deformation since 20 February 2018 recorded deflation despite short-term episodes of inflation of its lower and middle slopes, and incandescence at the summit had diminished from intense to faint. Lava flows had begun to stabilize, producing fewer rockfalls and infrequent pyroclastic density currents, the last of which was observed on 27 March 2018. This continued decrease in activity led PHIVOLCS to lower the Alert Level to 2 on 29 March 2018.
VAAC, SO2, and MIROVA information. The Tokyo VAAC reported the first ash emission from Mayon on 13 January 2018 as a plume that rose to 5.2 km altitude and drifted SW. Many subsequent ash emissions were obscured by meteoric clouds and were only occasionally observed in satellite imagery. The ash plume from the large explosion on 22 January was observed in satellite imagery at 10.9 km altitude drifting NW. Numerous daily VAAC reports were issued through February; they were intermittent in March, ending on 23 March 2018. Plumes generally were reported at 5.2-7.6 km altitudes. Small sulfur dioxide plumes were captured by the OMI and OMPS satellite instruments on several days between 22 and 31 January 2018 (figure 37).
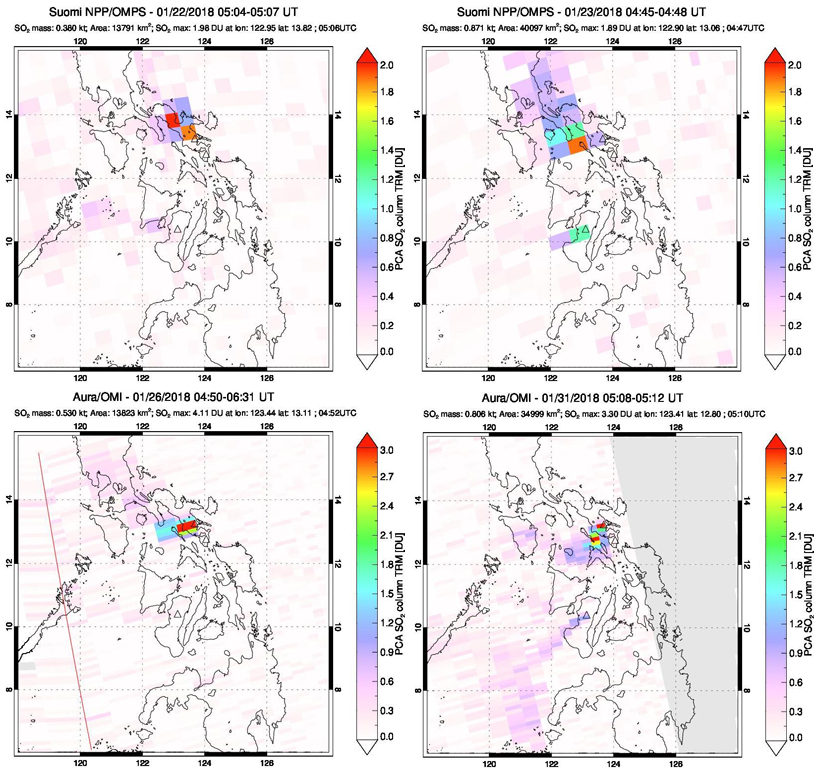 |
Figure 37. SO2 anomalies from Mayon were captured by the OMPS and OMI instruments on the SUOMI and AURA satellites during January 2018. Upper left: 22 January 2018; upper right: 23 January 2018; lower left: 26 January 2018; lower right: 31 January 2018. Courtesy of NASA Goddard Space Flight Center. |
The MIROVA project thermal anomaly graph of log radiative power clearly captured the onset of activity at Mayon in mid-January 2018 (figure 38). Thermal activity increased through early February and then slowly decreased through mid-March 2018 when lava effusion ended.
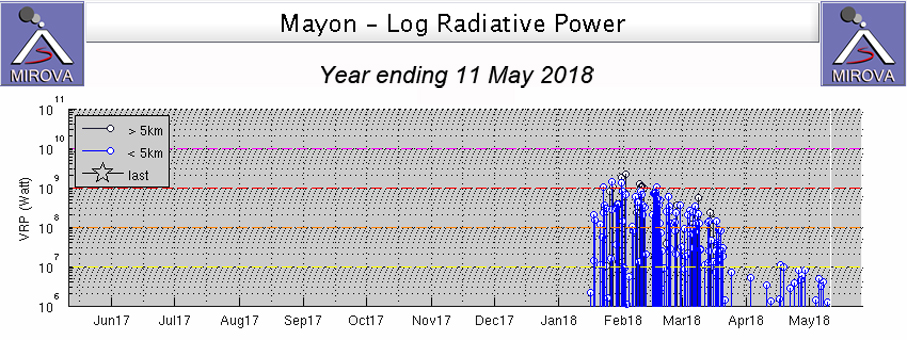 |
Figure 38. The sudden onset of thermal activity at Mayon is apparent in this MIROVA project graph of log radiative power for the year ending on 11 May 2018. The data is based on the satellite-based MODIS infrared thermal imagery. Thermal activity peaked at the end of January and dropped off gradually through mid-March 2018; it then decreased abruptly after that. Courtesy of MIROVA. |
Geological Summary. Symmetrical Mayon, which rises above the Albay Gulf NW of Legazpi City, is the most active volcano of the Philippines. The steep upper slopes are capped by a small summit crater. Recorded eruptions since 1616 CE range from Strombolian to basaltic Plinian, with cyclical activity beginning with basaltic eruptions, followed by longer periods of andesitic lava flows. Eruptions occur predominately from the central conduit and have also produced lava flows that travel far down the flanks. Pyroclastic density currents and mudflows have commonly swept down many of the approximately 40 ravines that radiate from the summit and have often damaged populated lowland areas. A violent eruption in 1814 killed more than 1,200 people and devastated several towns.
Information Contacts: Philippine Institute of Volcanology and Seismology (PHIVOLCS), Department of Science and Technology, University of the Philippines Campus, Diliman, Quezon City, Philippines (URL: http://www.phivolcs.dost.gov.ph/); Tokyo Volcanic Ash Advisory Center (VAAC), 1-3-4 Otemachi, Chiyoda-ku, Tokyo, Japan (URL: http://ds.data.jma.go.jp/svd/vaac/data/); MIROVA (Middle InfraRed Observation of Volcanic Activity), a collaborative project between the Universities of Turin and Florence (Italy) supported by the Centre for Volcanic Risk of the Italian Civil Protection Department (URL: http://www.mirovaweb.it/); NASA Earth Observatory, EOS Project Science Office, NASA Goddard Space Flight Center, Goddard, Maryland, USA (URL: http://earthobservatory.nasa.gov/); NASA Goddard Space Flight Center (NASA/GSFC), Global Sulfur Dioxide Monitoring Page, Atmospheric Chemistry and Dynamics Laboratory, 8800 Greenbelt Road, Goddard, Maryland, USA (URL: https://so2.gsfc.nasa.gov/); The Express (URL: https://www.express.co.uk); European Pressphoto Agency (EPA) (URL: http://www.epa.eu/); Getty Images (URL: https://www.gettyimages.com/); Agence France Presse (AFP) (URL: https://www.afp.com/).