Report on Sierra Negra (Ecuador) — September 2018
Bulletin of the Global Volcanism Network, vol. 43, no. 9 (September 2018)
Managing Editor: Edward Venzke.
Edited by A. Elizabeth Crafford.
Sierra Negra (Ecuador) Fissure opens on NNE caldera rim 26 June 2018, NW-flank lava flows reach the sea
Please cite this report as:
Global Volcanism Program, 2018. Report on Sierra Negra (Ecuador) (Crafford, A.E., and Venzke, E., eds.). Bulletin of the Global Volcanism Network, 43:9. Smithsonian Institution. https://doi.org/10.5479/si.GVP.BGVN201809-353050
Sierra Negra
Ecuador
0.83°S, 91.17°W; summit elev. 1124 m
All times are local (unless otherwise noted)
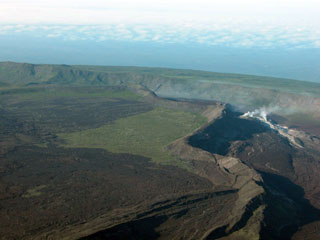
Sierra Negra shield volcano on the Galápagos Island of Isabela has erupted six times since 1948, most recently in 2005. The eruptions of 2005, 1979, 1963, and 1953 were located in the area known as 'Volcán Chico' near the NNE rim of the summit caldera, which extends about 9 km E-W and 7 km N-S (figure 12). The lava flows generated in these eruptions were directed mainly towards the N and NE flanks of Sierra Negra, in some cases reaching Elizabeth Bay to the N and in others filling the interior of the caldera (figure 13). A new effusive eruption that occurred from 26 June through August 2018 is covered in this report with information provided primarily by Instituto Geofísico, Escuela Politécnica Nacional (IG-EPN). Additional information comes from the Washington Volcanic Ash Advisory Center (VAAC), and several sources of satellite information.
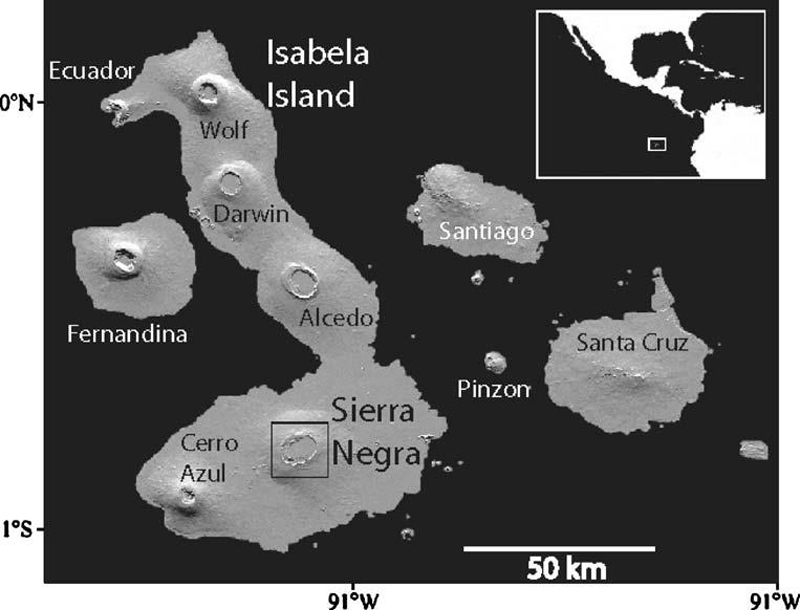 |
Figure 12. Sierra Negra is located on the southern part of Isabela Island in the Galápagos National Park, Ecuador. Courtesy of IG (Informe Especial Nº 2, Volcán Sierra Negra- Islas Galápagos: Descripción del estado de agitación interna y posibles escenarios eruptivos, 12 January 2018). |
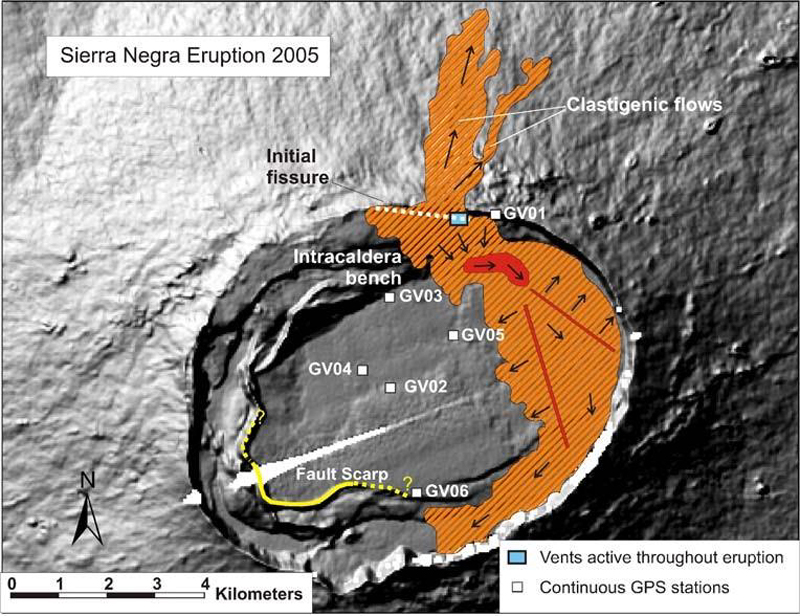 |
Figure 13. The Sierra Negra caldera with the locations of GPS stations and the fissures, vents, and flows from the 2005 eruption. From Geist et al. (2005), courtesy of IG (Informe Especial Nº 2, Volcán Sierra Negra- Islas Galápagos: Descripción del estado de agitación interna y posibles escenarios eruptivos, 12 January 2018). |
Beginning in 2017, the Geophysical Institute of the National Polytechnic School (IGEPN) installed a surveillance network of six broadband seismic stations for the Galápagos volcanoes. One station is located on the NE edge of the Sierra Negra caldera and another on the SE flank. After 12 years of little activity, an increase in seismicity beneath and around the caldera became evident by July 2017 (figure 14). On 19 October 2017 (local time) the seismic monitors detected a 16-km-deep M 3.8 earthquake with an epicenter on the NE border of the caldera in the vicinity of Volcán Chico. Four additional similar earthquakes occurred within the next hour. Another earthquake of similar size occurred on 22 October; between 15 and 16 November, three earthquakes with M 3.0 or greater were recorded. The frequency of seismic activity increased significantly in December 2017, with over 550 events recorded during the first three weeks of December 2017; at least three had magnitudes greater than 3. GPS receivers showed uplift of the caldera floor of 80 cm between 2013 and 2017. InSAR interferometry data indicated substantial inflation of the caldera floor of about 70 cm between December 2016 and late November 2017, reaching a level higher than that which preceded the eruption of 2005 (figure 15).
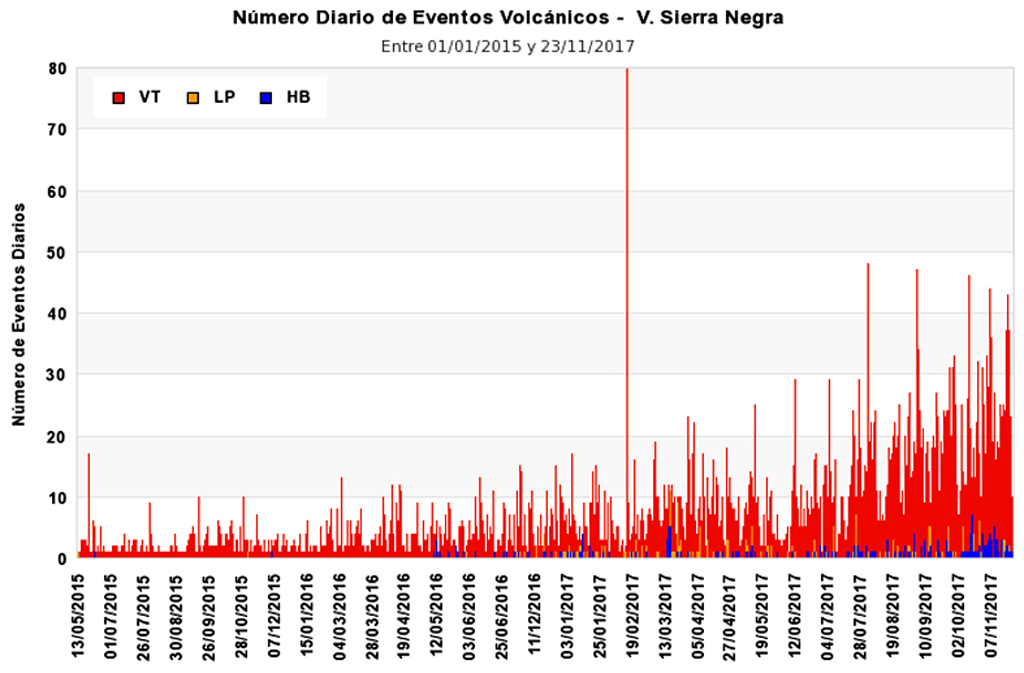 |
Figure 14. The number of daily seismic events at Sierra Negra between 13 May 2015 and 23 November 2017 show a distinct increase in activity by July 2017. The colors represent different types of earthquakes; red is VT or volcanotectonic, orange is LP or Long Period, and blue is HB or Hybrid. Courtesy of IG (Informe Especial Sierra Negra N.- 2, Actividad reciente del volcán Sierra Negra – Isla Isabela, 23 November 2017). |
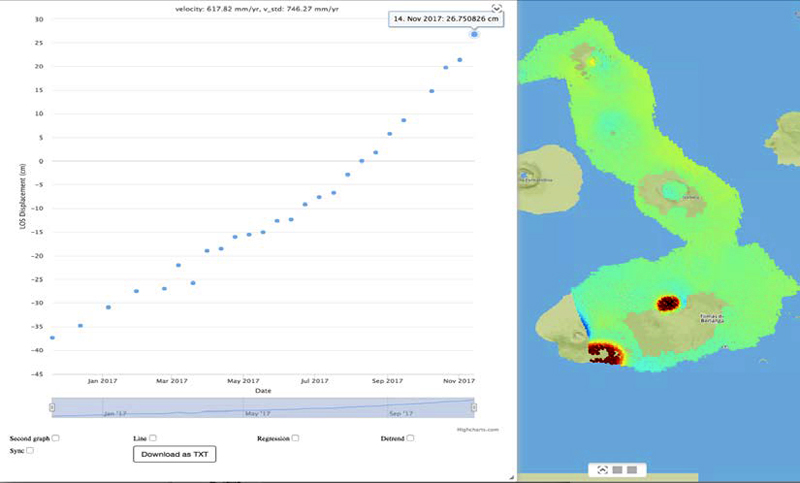 |
Figure 15. Inflation of the caldera floor at Sierra Negra between December 2016 and November 2017 exceeded 70 cm. The left graph shows the displacement plotted in centimeters versus time, and the right image is the spatial deformation from the InSAR data showing inflation at the caldera (center) and on the SW coast of Isla Isabela. Figures courtesy of Falk Amelung (RSMAS) and IG (Informe Especial Sierra Negra N.- 2, Actividad reciente del volcán Sierra Negra – Isla Isabela, 23 November 2017). |
By early January 2018, inflation over the preceding 12 months was close to 1 m, with a total inflation exceeding that prior to the 2005 eruption. Seismic activity, focused on two fracture zones trending NE-SW across the summit caldera, continued to increase until 26 June 2018 when a fissure opened near Volcán Chico on the NNE caldera rim. Over the next 24 hours four fissures opened on the N rim and the NW flank. Three of the fissures were active only for this period, but the fourth, on the NW flank about 7 km below the caldera rim, continued to effuse lava for all of July and most of August 2018. Lava flows reached the sea in early July. Several pulses of increased effusive activity corresponded with increased seismic, thermal, and gas-emission activity recorded by both ground-based and satellite instrumentation. By the last week of August active flows were no longer observed, although the cooling flows continued to emit thermal signals for several weeks.
Activity during January-early June 2018. Elevated seismicity continued into 2018 with a M 3.8 event recorded on 6 January 2018 that was felt by tourists, guides, and Galápagos National Park officials. Tens of additional smaller events continued throughout the month, reaching more than 100 seismic events per day a few times; the earthquakes were located below the caldera at a depth of less than 8 km. A M 4.1 event on 10 January was located at a depth of 7 km. By 12 January, the total inflation of the caldera since the beginning of 2017 was 98 cm (figure 16).
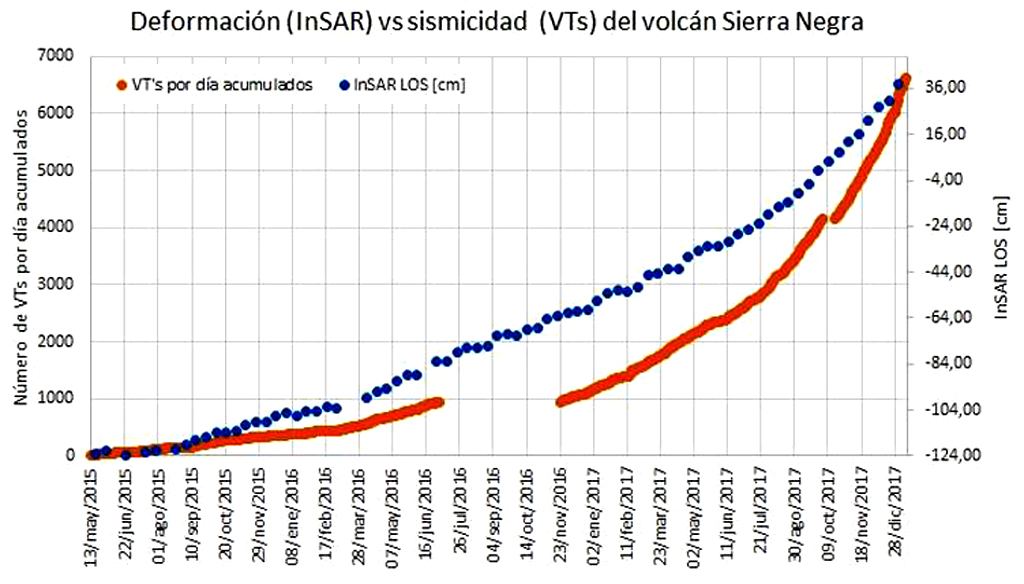 |
Figure 16. Seismicity and deformation at Sierra Negra between 13 May 2015 and 28 December 2017. The orange line represents the cumulative VT earthquakes, and the blue points record the inflation in cm of the floor accumulated since the beginning of 2015. A change in slope of both curves is evident at the end of 2017 indicating the rate of increase of inflation and seismicity. Courtesy of IG (Informe Especial Nº 2, Volcán Sierra Negra- Islas Galápagos: Descripción del estado de agitación interna y posibles escenarios eruptivos, 12 January 2018). |
IG reported 14 seismic events with magnitudes ranging from 3.0-4.6 between 1 January and 19 March 2018. A M 4.4 event on 18 January was located less than 1 km below the surface with an epicenter on the S rim of the caldera. A M 4.1 event on 27 February was also located less than 1 km below the surface. A M 4.6 event on 14 March was the largest to date at Sierra Negra and was located only 0.3 km below the surface. Measurements of CO2, SO2, and H2S made at the Azufral fumarole field (figure 17) on the W rim of the caldera in early February did not have values significantly different compared to May 2014 and September 2017. With the continued increase in frequency and magnitude of shallow seismic activity, IG noted the increased risk of renewed eruptive activity, and noted that most of the active flows of the last 1,000 years were located on the N flank (figure 18).
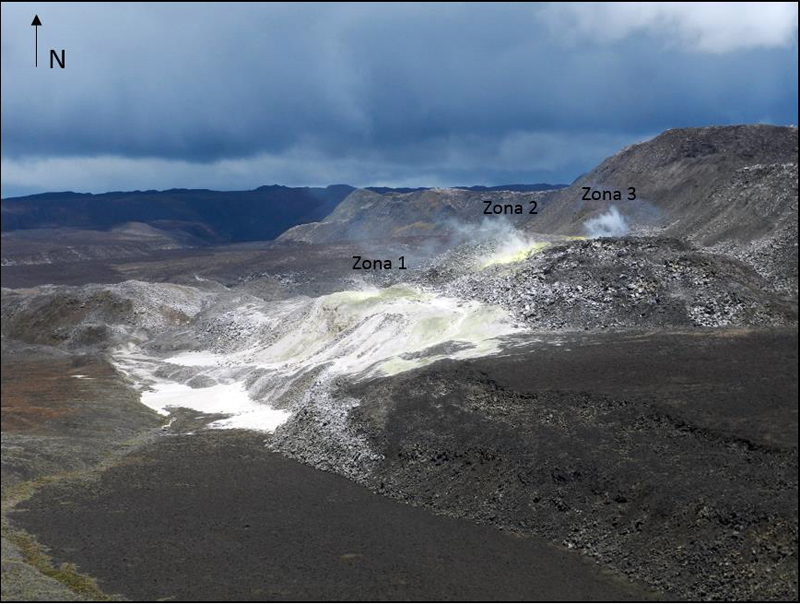 |
Figure 17. A fumarole field near Azufral on the W rim of the Sierra Negra caldera on 6 February 2018 remained unchanged after several months of increased seismicity in the area. Photo by M. Almeida, courtesy of IG-EPN (Informe Especial del Volcán Sierra Negra (Islas Galápagos) -2018 - Nº 3, Actualizado del estado de agitación interna y posibles escenarios eruptivos, 19 March 2018). |
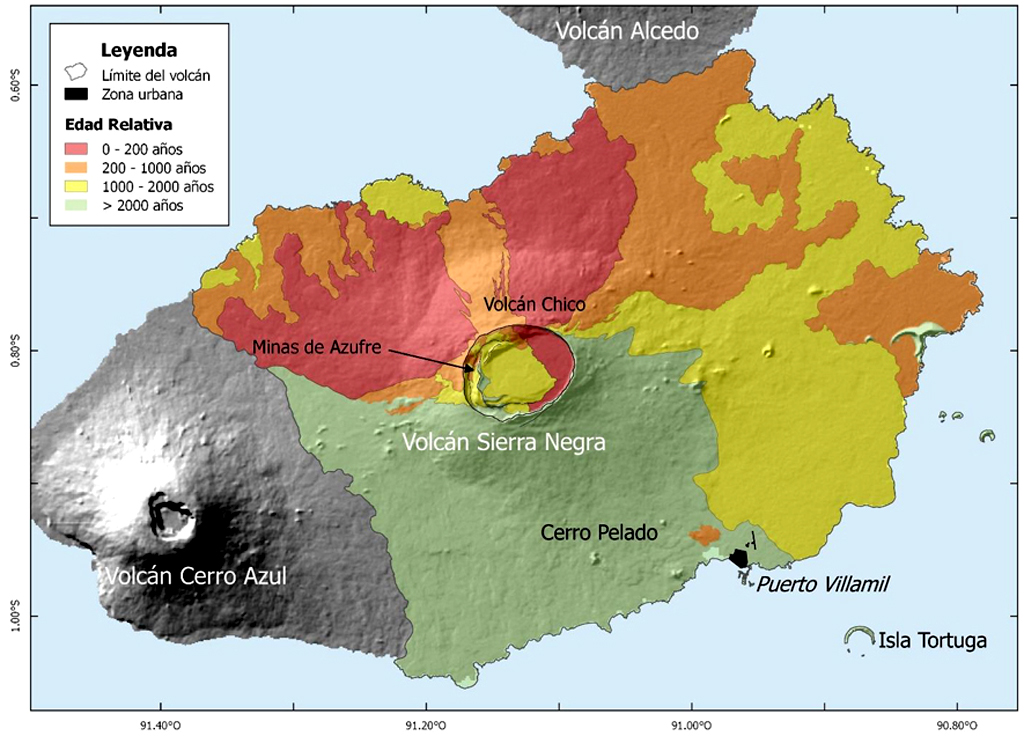 |
Figure 18. Simplified geologic map of Sierra Negra with lava flows colored as a function of relative age (modified from Reynolds et al., 1995), courtesy of IG (Informe Especial del Volcán Sierra Negra (Islas Galápagos) -2018 - Nº 3, Actualizado del estado de agitación interna y posibles escenarios eruptivos, 19 March 2018). |
Increases in seismicity continued into early June. IG noted that on 25 May 2018, 104 seismic events were recorded, the largest number in a single day since 2015. A M 4.8 event on 8 June was accompanied by over 40 other smaller earthquakes. The earthquake epicenters were mainly located on the edges of the crater in two NE-SW trending lineaments; the first covered the N and W edges of the crater and the second trended from the NE edge to the S edge. Deformation data indicated the largest displacements were at the caldera's center, compared with lower levels of deformation outside of the caldera.
Eruption of 26 June-late August 2018. IG reported an increase in seismicity and a M 4.2 earthquake on 22 June 2018. A larger M 5.3 earthquake was detected at 0315 on 26 June, 5.3 km below the caldera. The event was felt strongly on the upper flanks and in Puerto Villamil (23 km SE). About 8 hours later, at 1117, an earthquake swarm characterized by events located at 3-5 km depth was recorded. A M 4.2 earthquake took place at 1338 and was followed by increasing amplitudes of seismic and infrasound signals. Parque Nacional Galápagos staff then reported noises described as bellows coming from the Volcán Chico fissure vent, which, coupled with the seismicity and infrasound data, suggested the start of an eruption. About 20 minutes later IG described a thermal anomaly identified in satellite images in the N area of the caldera near Volcán Chico and Park staff observed lava flowing towards the crater's interior as well as towards the N flank in the direction of Elizabeth Bay (figure 19).
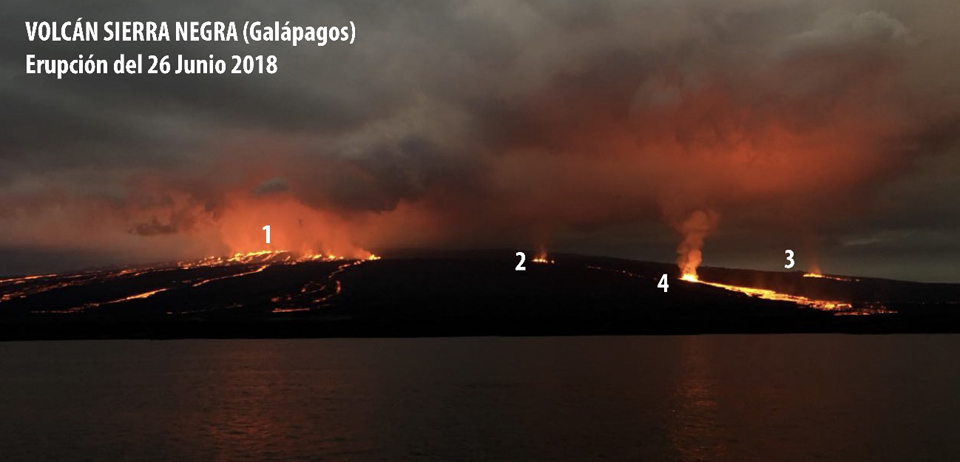 |
Figure 19. Lava flows descended from the N flank of Sierra Negra to Elizabeth Bay on 26 June 2018 from four distinct fissure vents (numbered). Fissure 1 was located near Volcan Chico on the caldera rim, and fissures 2, 3, and 4 were located on the N flank. Details of the fissures are discussed later in the report. Video of the flow was captured by Nature Galápagos. Photo courtesy of AFP and BBC News, annotated and reprinted by IG (Informe Especial N° 16 – 2018, Volcán Sierra Negra, Islas Galápagos, Actualización de la Actividad Eruptiva, Quito, 23 de Julio del 2018). |
The Washington VAAC reported an ash plume visible in satellite imagery late on 26 June at 10.6 km altitude drifting SW. By the following morning, a plume of ash mixed with SO2 was drifting W at 8.2 km altitude. IG reported a new ash emission late on 27 June drifting NW at 6.1 km altitude. A substantial SO2 plume emerged on 27 June and was recorded by the OMI and OMPS satellite-based instruments drifting SW that day and the next (figure 20). The MODVOLC thermal alert system confirmed the beginning of the eruption with over 100 alert pixels recorded on 27 June and over 50 the following day. The MIROVA system recorded an abrupt, very high thermal signal beginning on 26 June (figure 21). Seismic and acoustic data indicated a gradual decrease of activity after the initial outburst, but effusive lava flows continued on 27 June.
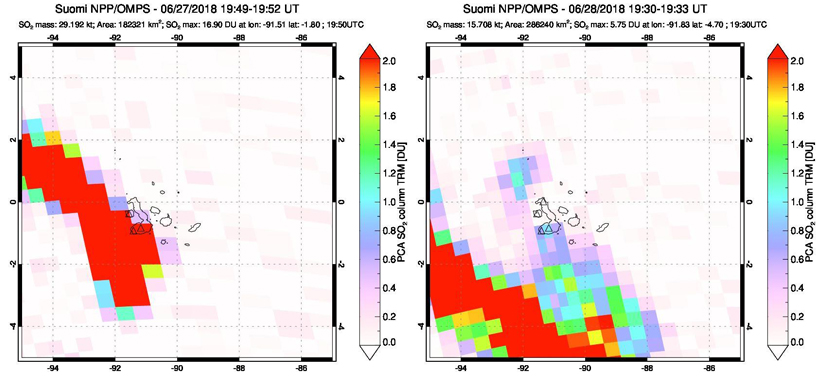 |
Figure 20. A large plume of SO2 was emitted from Sierra Negra on 27 June 2018 at the beginning of the latest eruptive episode. It drifted SW the following day, as seen in these images captured by the OMPS instrument on the Suomi NPP satellite. Courtesy of NASA Goddard Space Flight Center. |
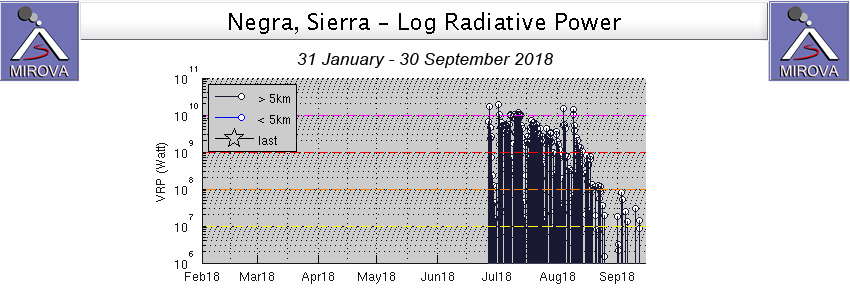 |
Figure 21. The MIROVA project graph of thermal energy at Sierra Negra from 31 January 2018 through September 2108 shows the start of the lava flows on 27 June 2018 (UTC). Pulses of high thermal energy continued through late August when flow activity ceased; cooling of the flows continued into September 2018. Courtesy of MIROVA. |
During 27 and 28 June, IG scientists were able to make a site visit to capture thermal, photographic, and physical evidence of the new lava flows (figure 22). A composite thermal image showed the extent of flows that traveled down the N flank as well as into the caldera (figure 23). A temperature of 580°C was measured near the eruptive fissure, and the surface temperatures averaged about 60°C, although some flows were measured as high as 200°C. The temperature inside a fracture on a lava flow was measured at 975°C (figure 24). Pelée hair and "spatter" bombs were visible around the eruptive fissures.
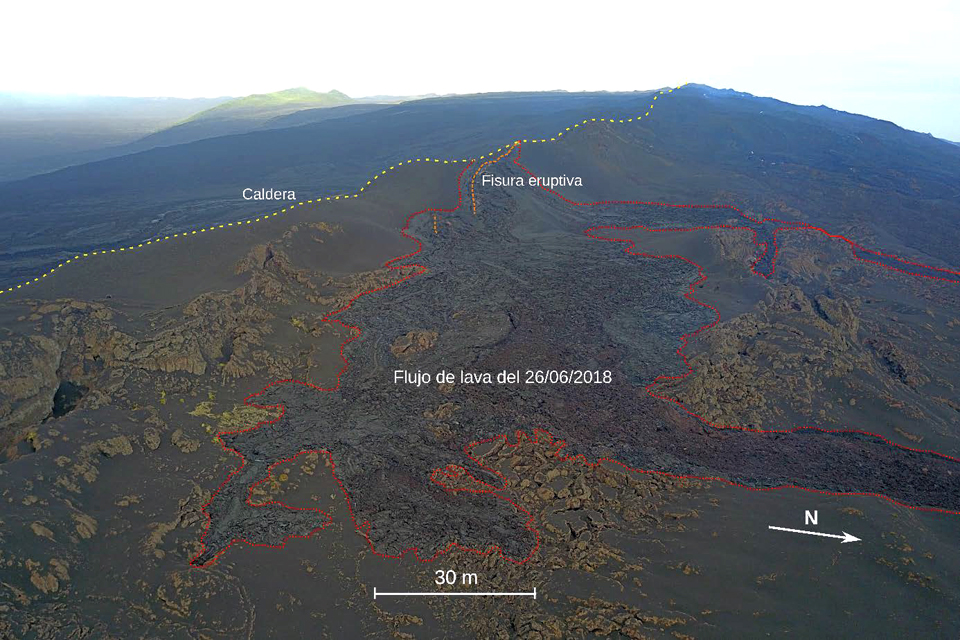 |
Figure 22. The lava flows of 26 June 2018 at Sierra Negra emerged from a fissure on the N flank of the caldera rim and other fissures on the N flank and flowed N. N is to the right. Photo by Benjamin Bernard, courtesy of IG (Volcán Sierra Negra, Informe de campo 27-28 junio2018, Termografía, Cartografía, y muestreo de los nuevos flujos de lava, sector de Volcán Chico). |
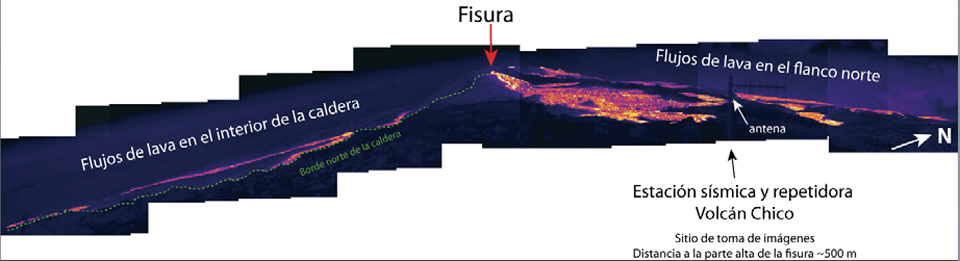 |
Figure 23. Composite thermal images of the new lava flows at Sierra Negra taken on 27 June 2018 reveal the flows that emerged from the Volcán Chico fissure zone; most flows traveled N down the flank, a few (on the left) traveled down into the caldera. Images by Silvia Vallejo, courtesy of IGEPN (Volcán Sierra Negra, Informe de campo 27-28 junio2018, Termografía, Cartografía, y muestreo de los nuevos flujos de lava, sector de Volcán Chico). |
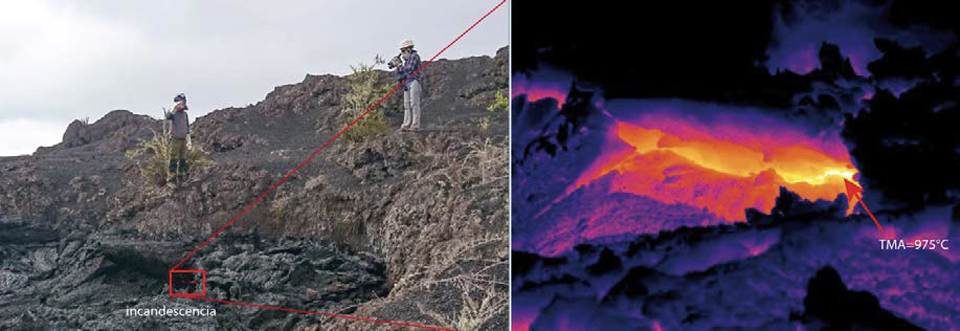 |
Figure 24. The temperature of incandescent lava within a fresh flow at Sierra Negra was measured at 975°C on 27 June 2018. Left image by Francisco Vásconez; thermal image by Silvia Vallejo, courtesy of IGEPN (Volcán Sierra Negra, Informe de campo 27-28 junio2018, Termografía, Cartografía, y muestreo de los nuevos flujos de lava, sector de Volcán Chico). |
Pahoehoe and aa flows along with lava tunnels were visible in drone images. The visible fissures were slightly arcuate and aligned in a general ENE direction, similar to the fissures of 1979 and 2005 in the vicinity of Volcán Chico. The largest flow was more than 150 m long; they reached up to 130 m wide in the flat areas, but only between 25 and 35 m wide where they were channeled on the steeper slope. In the flatter areas they had characteristics of pahoehoe with a smooth surface, a sometimes rounded texture and lava tunnels (figure 25), while in the channelized areas with a steeper slope they had a rougher surface and were characterized as aa (figure 26). The flows averaged 0.5-1 m thick and in several places the lava filled fissures or previous depressions. The samples of pahoehoe that were collected were all aphanitic with no crystals, strongly iridescent, and vesiculated with fluid textures that indicated a high gas content and low viscosity.
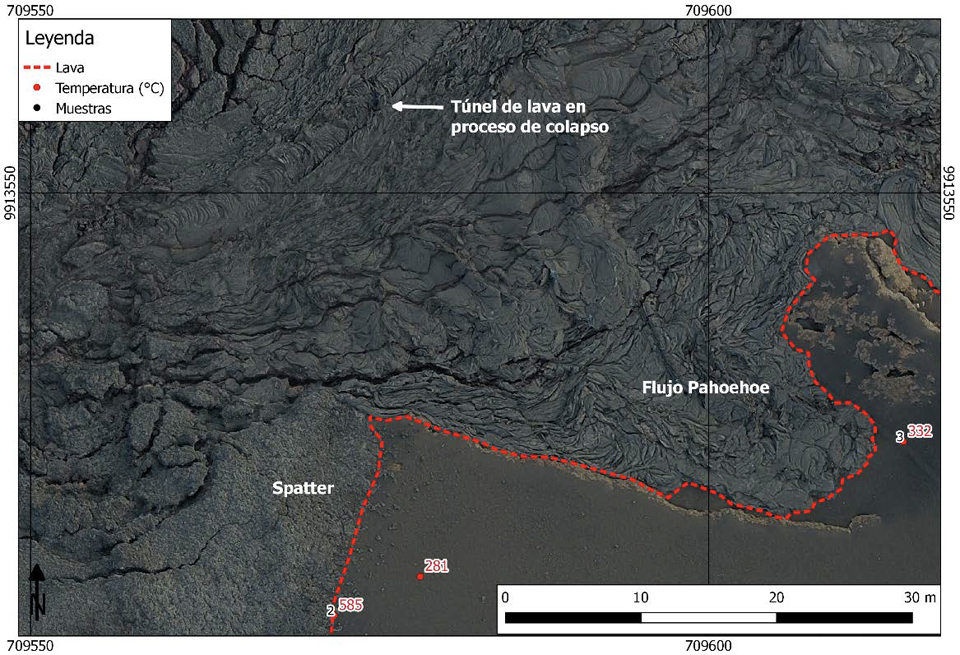 |
Figure 25. Pahoehoe flows, spatter, and a collapsing lava tunnel were visible near fissure 1 (above 'Spatter') at Sierra Negra when imaged by a drone during a field visit on 27-28 June 2018 shortly after the new eruptive episode began. This image covers the area near the top center of the image in figure 22 close to the fissure. Photos were taken by a drone flying 60 m above the flows by Benjamin Bernard, courtesy IGEPN (Volcán Sierra Negra, Informe de campo 27-28 junio2018, Termografía, Cartografía, y muestreo de los nuevos flujos de lava, sector de Volcán Chico). |
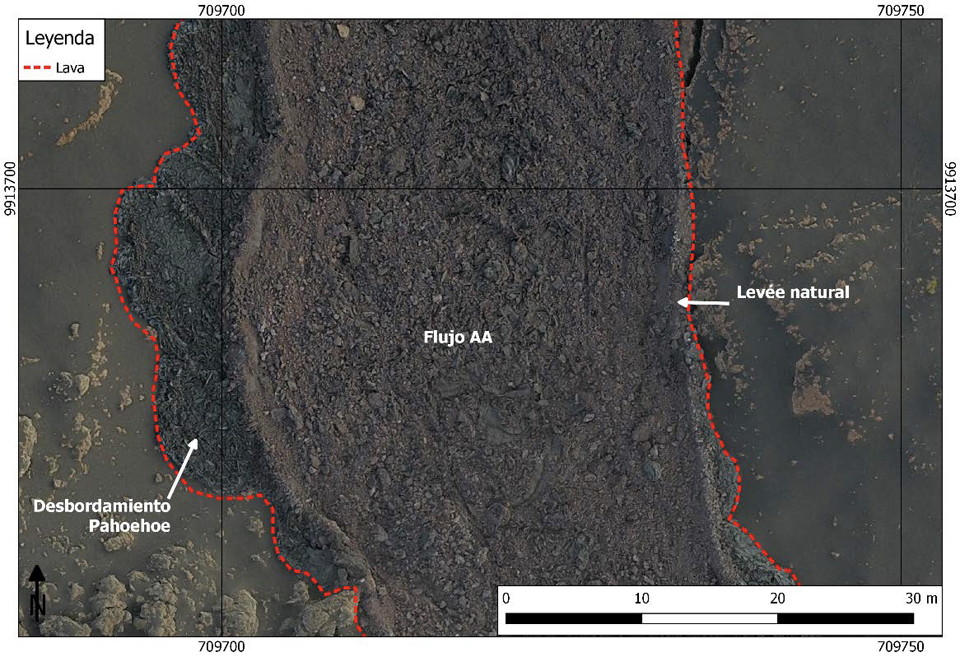 |
Figure 26. Aa flows formed as lava traveled down the steeper parts of the N flank of Sierra Negra on 26 June 2018, seen in this drone image taken during a field visit on 27-28 June. This image general location can be seen in the bottom right area in figure 22. Photos were taken by a drone flying 60 m above the flows by Benjamin Bernard, courtesy IGEPN (Volcán Sierra Negra, Informe de campo 27-28 junio2018, Termografía, Cartografía, y muestreo de los nuevos flujos de lava, sector de Volcán Chico). |
A small seismic event followed by several hours of tremor was recorded at 1552 on 1 July; a short while later National Park staff observed active lava flows on the NW flank. On 4 July, IG reported a M 5.2 earthquake that was 5 km deep; it was followed by 68 smaller seismic events. On 7 July seismic tremor activity indicating another pulse of magmatic activity was recorded by a station on the NE edge of the caldera at 1700. At the same time, satellite data showed an increase in the intensity of the thermal anomaly on the NW flank; Parque Nacional Galápagos staff confirmed strong visible incandescence in an area near the beach. Tremor activity continued on 8 July, although the amplitude gradually decreased.
The Washington VAAC reported an ash plume visible in satellite imagery on 2 July at 6.1 km altitude drifting SW. Later in the day a concentrated plume interpreted to be primarily steam and gas extended about 260 km SW. On 8 July ash could be seen moving both W and SW in satellite imagery at 2.7-3.0 km altitude. Later that day ash was visible extending about 115 km SW from the summit and other gases extended 370 km W. That evening the ash plume extended about 190 km SW at 3.7 km altitude. Gas-and-ash plumes were observed continuously drifting SW for the next three days (9-11 July) at 3.7 km altitude to a distance of about 80 km. On 13 July, two areas of ash and gas were seen in satellite imagery moving 25 km NW from the summit and up to 45 km SW at altitudes of 3.9 and 2.4 km respectively. A low-level ash plume on 16 July extended 30 km SW from the summit at 2.4 km altitude; incandescence was also visible in the webcam. The next day ash and gas emissions extended about 120 km SW at a similar altitude. Ongoing steam, gas, and ash emissions were seen in satellite imagery and in the webcam extending 110 km NW from the summit on 19 July at 3.4 km altitude. The Washington VAAC reported an ash plume on 30 July that rose to 3.4 km altitude and drifted SW. Strong SO2 emissions were recorded by both the OMPS and OMI satellite instruments throughout July 2018 (figure 27).
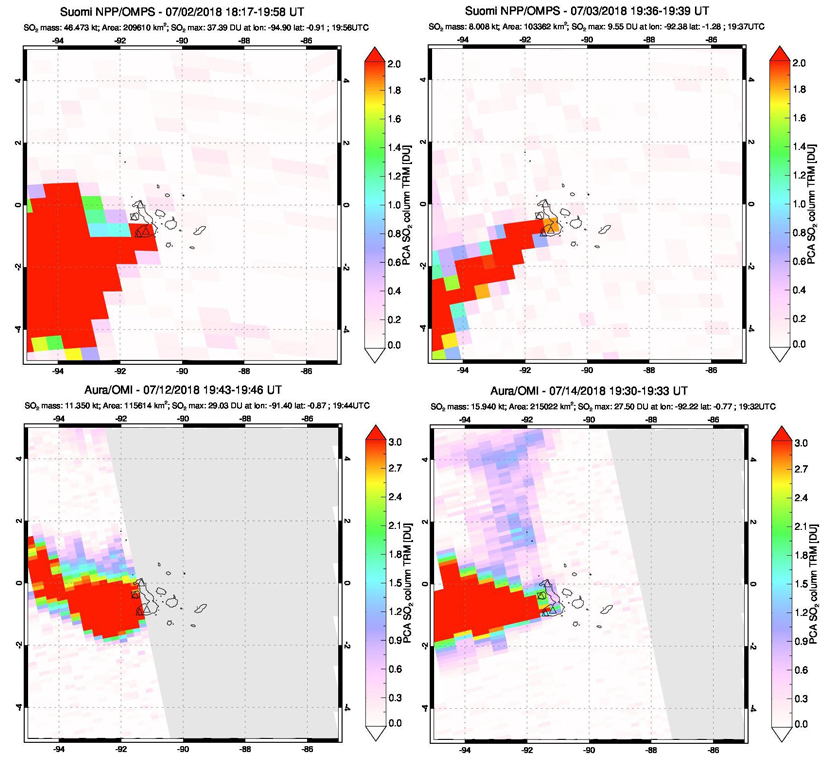 |
Figure 27. SO2 plumes from Sierra Negra exceeded 2 Dobson Units (DU) nearly every day during July 2018. Data gathered by the OMPS satellite instrument showed a large plume drifting SW on 2 July (top left), and a more narrow stream of SO2 drifting SW on 3 July (top right). The OMI satellite instrument captured large W-drifting plumes on 12 (bottom left) and 14 (bottom right) July. Courtesy of NASA Goddard Space Flight Center. |
In a report issued by IGEPN covering activity through 23 July 2018, they noted that at least four fissures had initially opened on 26 June at the start of the eruption (see numbers in figure 19 at the beginning of this report, and figure 31 at the end). Fissure 1, the longest at 4 km, was located at the edge of the caldera in the area of Volcán Chico; lava flows from this fissure traveled 7 km down the flanks, and over 1 km within the interior of the caldera. NW-flank fissures 2, 3, and 4 were much smaller (about 250 m long). Fissures 1-3 were active only until 27 June; fissure 4 continued to be active throughout July. Lava from this fissure reached the ocean on 6 July.
Gas and possible volcanic ash extended 35 km SW of the summit on 4 August at 1.5 km altitude; this was the last report of an ash plume by the Washington VAAC for the eruption. Daily reports from IGEPN indicated that nightly incandescence from advancing flows continued into August. Occasional low-level steam and gas plumes were also visible. Pulses of lava effusion on 4 and 9 August were accompanied by major episodes of seismic tremor activity and substantial SO2 plumes (figure 28). On 15 August satellite images showed lava from fissure 4 continuing to enter the ocean. The area where the lavas entered the sea were far from any human population or agricultural activities and only accessible by boats.
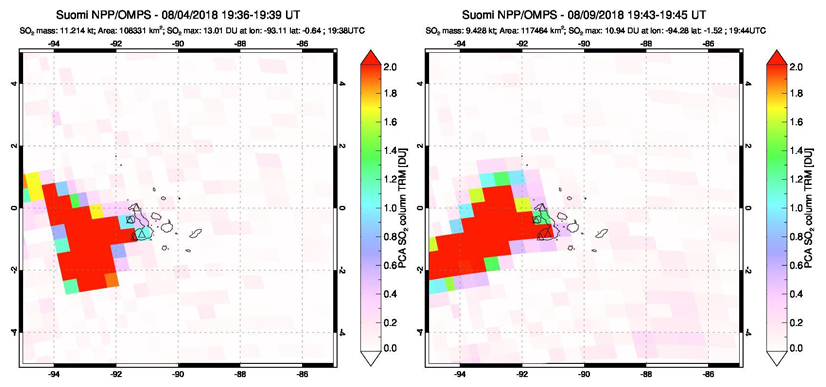 |
Figure 28. At Sierra Negra, large SO2 plumes were recorded by the OMPS instrument on the Suomi NPP satellite at the same time that an increase in seismic activity and effusion were noted on both 4 (left) and 9 (right) August 2018. Courtesy of NASA Goddard Space Flight Center. |
Throughout the ongoing eruption, pulses of thermal activity detected by MODIS infrared satellite sensors correlated with increases in seismic activity and observed flow activity. The MIROVA plot showed a high level of heat flow from the onset of the eruption on 26 June gradually decreasing in intensity through mid-August (figure 21). This was followed by a significant drop in heat flow and gradual cooling thereafter. After the initial fissure activity near the crater rim on 26-27 June, all subsequent activity was concentrated farther down the N flank at fissure 4 and is reflected in the number of pixels concentrated in that area of the MODVOLC plot of thermal alerts from June-September 2018 (figure 29).
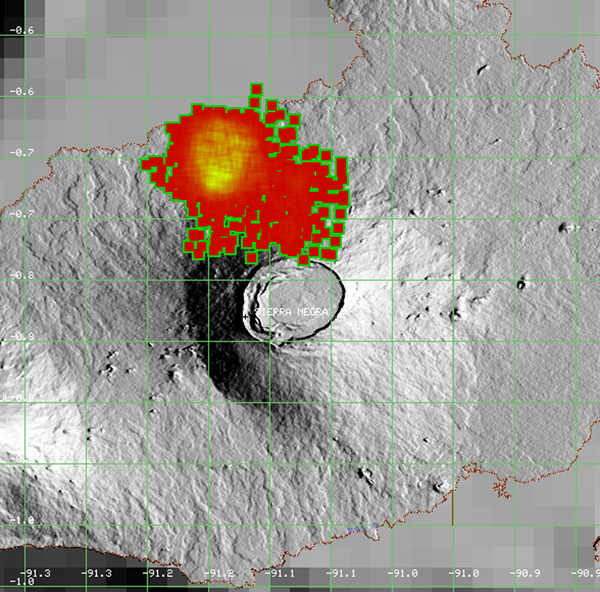 |
Figure 29. MODVOLC thermal alert locations corresponded to the locations of the observed flow activity at Sierra Negra, showing the sustained thermal activity from the mid-flank fissure 4 that lasted from late June through mid-September 2018. Courtesy of HIGP - MODVOLC Thermal Alerts System . |
The number of seismic events recorded during the eruptive episode had increased between 26 June and 30 July 2018 to an average of 265 per day. The peak was recorded on 29 June with 940 earthquakes. Between 31 July and 23 August, the average number was 121 per day, still higher than the level of 38 per day prior to the beginning of the eruption on 26 June. IG reported a continuous decline in activity during the last two weeks of August 2018. After the initial burst of effusive activity during 26-27 June, five additional pulses of increased thermal, seismic, and gas-emission activity were observed in multiple sources of data on 1-2, 7-8, and 31 July, and 4 and 9 August (figure 30).
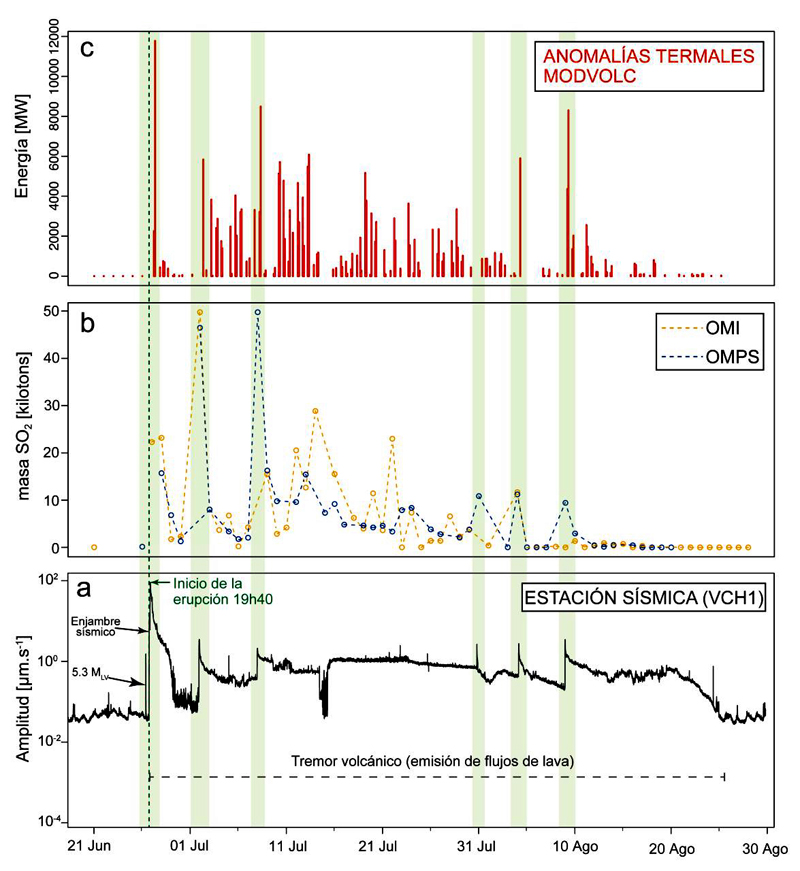 |
Figure 30. Multiple parameters of data from the eruption of Sierra Negra from 21 June to 30 August 2018. The dashed green line marks the start of the eruption, while the pale green vertical bars indicate the different eruptive pulses recorded throughout the eruption. a) Seismic energy data (RSAM) recorded by station VCH1, in a window between 1-8 Hz (location shown in figure 31); b) Time series of degassing of SO2 recorded by the OMI and OMPS satellites instruments; c) thermal anomalies recorded by MODVOLC. Courtesy of IGEPN (Informe Especial N°18 – 2018, Volcán Sierra Negra, Islas Galápagos, "Terminación de episodio ruptive actual", Quito, 31 de Agosto del 2018), also published in Vasconez et al (2018). |
In a summary report on 31 August 2018, IG reported that the eruption was divided into two main phases. The first and most energetic phase lasted one day (26 June) and was characterized by the opening of five fissures (table 2) located on the rim and N and NW flanks, and creation of lava flows that traveled as far as 7 km from the vents (figure 31). Lava was only active from all five fissures during the first day of the eruption, covering an area greater than 17 km2. During the rest of the eruption from 27 June-23 August, about 13 km2 of lava was produced from fissure 4, with lava reaching the sea on 6 July and expanding the coastline by 1.5 km2. Detailed descriptions of the fissures provided by IGEPN are given in the following section. By 25 August the lava flows covered an area of 30.6 square kilometers. Activity continued to decline the last week of August with decreased seismicity, gas emission, and no surficial activity visible.
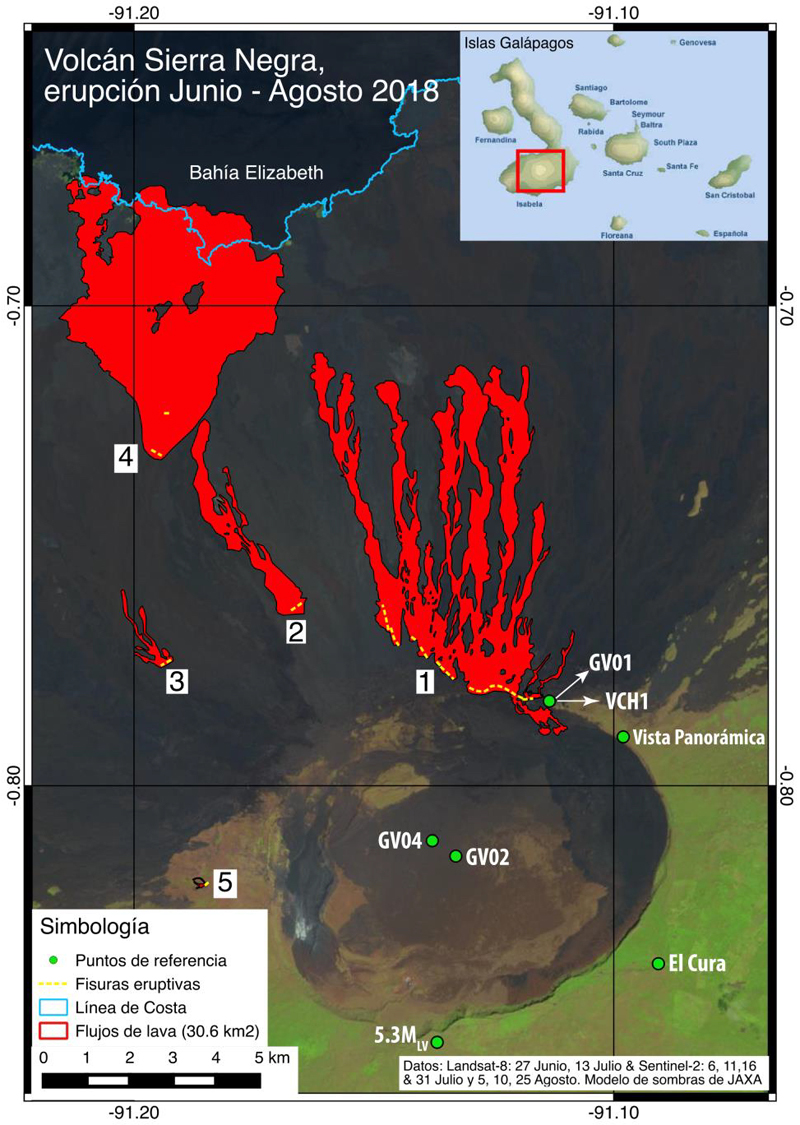 |
Figure 31. Map of the 26 June-August 2018 eruption of Sierra Negra volcano. The eruptive fissures are numbers and shown in yellow and described in detail in the next section. The coastline with Elizabeth Bay is shown in blue, and the lava flows appear in red. The green points include GPS and seismic stations, the epicenter of the earthquake of 5.3 MLV on 26 June, El Cura (control station of the Galápagos National Park) and the panoramic vista visited by tourists. Courtesy of IGEPN (Informe Especial N°18 – 2018, Volcán Sierra Negra, Islas Galápagos, "Terminación de episodio ruptive actual", Quito, 31 de Agosto del 2018), also published in Vasconez et al (2018). |
Table 2. Descriptions of the five fissures active during the June-August 2018 eruption of Sierra Negra (see figure 31 for locations). Courtesy of IGEPN (Informe Especial N°18 – 2018, Volcán Sierra Negra, Islas Galápagos, "Terminación de episodio ruptive actual", Quito, 31 de Agosto del 2018)
| Feature | Location | Description |
| Fissure 1 | Edge of the caldera in the Volcán Chico area, trending WNW, tangential to the edge of the caldera. | Four kilometers in length with lava flows that moved toward both the interior of the caldera and down the flank from the beginning of the eruption until 27 June, covering an area of 14.6 km2. The flows deposited outside the crater traveled 7 km downhill, without reaching the sea, while those inside it reached a maximum distance of 1.1 km. |
| Fissure 2 | NW of the caldera about 3 km below its edge of the caldera at an elevation of 700 m. | Approximately 250 m long and produced 4-km-long lava flows from the beginning of the eruption until 27 June, covering an area of 2.2 km2; its lava did not reach the sea. |
| Fissure 3 | WNW of the caldera about 4 km below its edge at an elevation of 550 m. | Approximately 250 m long and active from the beginning of the eruption until 27 June, emitting lava flows that covered an area of about 0.4 km2. The lava flows had a length of about 2 km and did not reach the sea. |
| Fissure 4 | NW flank at an elevation of 100 m between 7 and 8 km below the rim of the caldera. | Continuously emitting lava flows throughout the eruption. It was located on the On 6 July the lava flows from this fissure reached the ocean and modified the coastline of Isla Isabela by 1.5 km2. By 25 August when active flow ceased, its lavas had covered an area of approximately 13.3 km2. |
| Fissure 5 | Western flank at an elevation of 840 m, 1.5 km downhill from the inner edge of the caldera. | Length of 170 m and covered 0.026 km2. |
References: Davidge L, Ebinger C, Ruiz M, Tepp G, Amelung F, Geist D, Cote D, Anzieta J, 2017, Seismicity patterns during a period of inflation at Sierra Negra volcano, Galápagos Ocean Island Chain. Earth and Planetary Science Letters. 462. DOI: 10.1016/j.epsl.2016.12.021.
Geist D, Naumann T R, Standish J J, Kurz M D, Harpp K S, White W M , Fornari D, 2005, Wolf Volcano, Galapagos Archipelago: Melting and magmatic evolution at the margins of a mantle plume. Journal of Petrology 46:2197-2224.
Vasconez F, Ramón P, Hernandez S, Hidalgo S, Bernard B, Ruiz M, Alvarado A., La Femina P, Ruiz G, 2018, The different characteristics of the recent eruptions of Fernandina and Sierra Negra volcanoes (Galápagos, Ecuador), Volcanica 1(2): 127-133. DOI: 10.30909/vol.01.02.127133.
Geological Summary. The broad shield volcano of Sierra Negra at the southern end of Isabela Island contains a shallow 7 x 10.5 km caldera that is the largest in the Galápagos Islands. Flank vents abound, including cinder cones and spatter cones concentrated along an ENE-trending rift system and tuff cones along the coast and forming offshore islands. Although it is the largest of the five major Isabela volcanoes, it has the flattest slopes, averaging less than 5° and diminishing to 2° near the coast. A sinuous 14-km-long, N-S-trending ridge occupies the west part of the caldera floor, which lies only about 100 m below its rim. The Volcán de Azufre fumarolic area lies within a graben between this ridge and the west caldera wall. Lava flows from a major eruption in 1979 extend all the way to the north coast from circumferential fissure vents on the upper northern flank.
Information Contacts: Instituto Geofísico (IG), Escuela Politécnica Nacional, Casilla 17-01-2759, Quito, Ecuador (URL: http://www.igepn.edu.ec ); Washington Volcanic Ash Advisory Center (VAAC), Satellite Analysis Branch (SAB), NOAA/NESDIS OSPO, NOAA Science Center Room 401, 5200 Auth Rd, Camp Springs, MD 20746, USA (URL: www.ospo.noaa.gov/Products/atmosphere/vaac, archive at: http://www.ssd.noaa.gov/VAAC/archive.html); MIROVA (Middle InfraRed Observation of Volcanic Activity), a collaborative project between the Universities of Turin and Florence (Italy) supported by the Centre for Volcanic Risk of the Italian Civil Protection Department (URL: http://www.mirovaweb.it/); Hawai'i Institute of Geophysics and Planetology (HIGP) - MODVOLC Thermal Alerts System, School of Ocean and Earth Science and Technology (SOEST), Univ. of Hawai'i, 2525 Correa Road, Honolulu, HI 96822, USA (URL: http://modis.higp.hawaii.edu/); NASA Goddard Space Flight Center (NASA/GSFC), Global Sulfur Dioxide Monitoring Page, Atmospheric Chemistry and Dynamics Laboratory, 8800 Greenbelt Road, Goddard, Maryland, USA (URL: https://so2.gsfc.nasa.gov/); Nature Galápagos (Twitter: @natureGalápagos, https://twitter.com/natureGalápagos).