Report on Manam (Papua New Guinea) — February 2019
Bulletin of the Global Volcanism Network, vol. 44, no. 2 (February 2019)
Managing Editor: Edward Venzke.
Edited by A. Elizabeth Crafford.
Manam (Papua New Guinea) Ash plumes reaching 15 km altitude in August and December 2018
Please cite this report as:
Global Volcanism Program, 2019. Report on Manam (Papua New Guinea) (Crafford, A.E., and Venzke, E., eds.). Bulletin of the Global Volcanism Network, 44:2. Smithsonian Institution. https://doi.org/10.5479/si.GVP.BGVN201902-251020
Manam
Papua New Guinea
4.08°S, 145.037°E; summit elev. 1807 m
All times are local (unless otherwise noted)
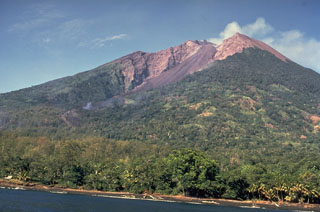
Manam is a basaltic-andesitic stratovolcano that lies 13 km off the northern coast of mainland Papua New Guinea; it has a 400-year history of recorded evidence for recurring low-level ash plumes, occasional Strombolian activity, lava flows, pyroclastic avalanches, and large ash plumes. Activity during 2017 included a strong surge in thermal anomalies beginning in mid-February that lasted through mid-June; low levels of intermittent thermal activity continued for the rest of the year (BGVN 43:03). Activity during 2018, discussed below, included two ash explosions that rose higher than 15 km altitude, in August and December, resulting in significant ashfall and evacuations of several villages. Information about Manam is primarily provided by Papua New Guinea's Rabaul Volcano Observatory (RVO), part of the Department of Mineral Policy and Geohazards Management (DMPGM). This information is supplemented with aviation alerts from the Darwin Volcanic Ash Advisory Center (VAAC). MODIS thermal anomaly satellite data is recorded by the University of Hawai'i's MODVOLC thermal alert recording system, and the Italian MIROVA project; sulfur dioxide monitoring is done by instruments on satellites managed by NASA's Goddard Space Flight Center. Satellite imagery provided by the Sentinel Hub Playground is also a valuable resource for information about this remote location.
Satellite imagery confirmed thermal activity in December 2017, February-April 2018, and June-December 2018. Explosive activity with ash plumes was reported in June, August-October, and December 2018. Ash plumes from explosions in late August and early December rose to over 15 km altitude and caused heavy ashfall on the island. Lava flows were reported in late August, late September to early October, and December; a pyroclastic flow on the NE flank occurred during the late August explosive episode. MODVOLC thermal alerts were issued during the same periods when lava flows were reported on the NE flank. The MIROVA Log Radiative Power graph for 2018 showed intermittent pulses of thermal activity throughout the year; levels of increased activity were apparent in late December 2017-early January 2018, mid-May, August, late September-early October, and early December 2018 (figure 42). Many of these thermal events could be confirmed with either satellite or ground-based information.
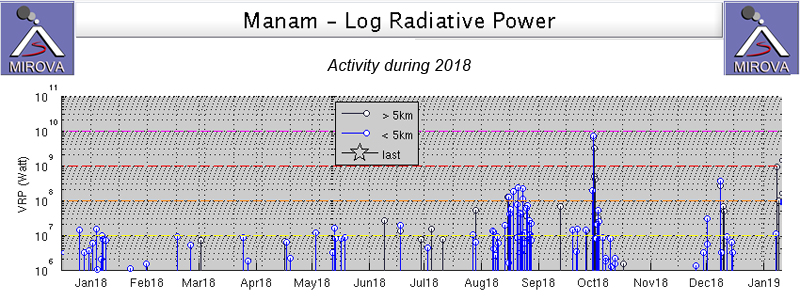 |
Figure 42. The MIROVA Log Radiative Power graph for Manam during 2018 showed intermittent pulses of thermal activity throughout the year, many of which could be confirmed with satellite imagery or ground observations. Levels of increased activity were apparent in late December 2017-early January 2018, mid-May, August, late September to early October, and the first half of December 2018. Courtesy of MIROVA. |
Activity during December 2017-July 2018. Both Sentinel-2 satellite imagery, and MIROVA data thermal evidence, indicated continued thermal activity at both of Manam's summit craters (Main and Southern) during December 2017-April 2018. Satellite imagery on 11, 26, and 31 December showed two thermal hotspots on each date, with a gas plume drifting E on 26 December 2017. One strong thermal anomaly was visible in satellite imagery on 19 February 2018 along with a SE-drifting gas plume (figure 43). A single anomaly was visible through atmospheric clouds on 1 March 2017 with a thin gas plume drifting NNE. On 10 April two hotspots were clearly visible, the one at Southern Crater was larger than the one at Main Crater, both with ESE drifting gas plumes. Though there was diffuse atmospheric cloud cover on 15 April, both anomalies were visible with SW-drifting gas plumes. On 25 April clouds covered the likely thermal anomalies, but a dense gas plume drifted N from the summit (figure 44).
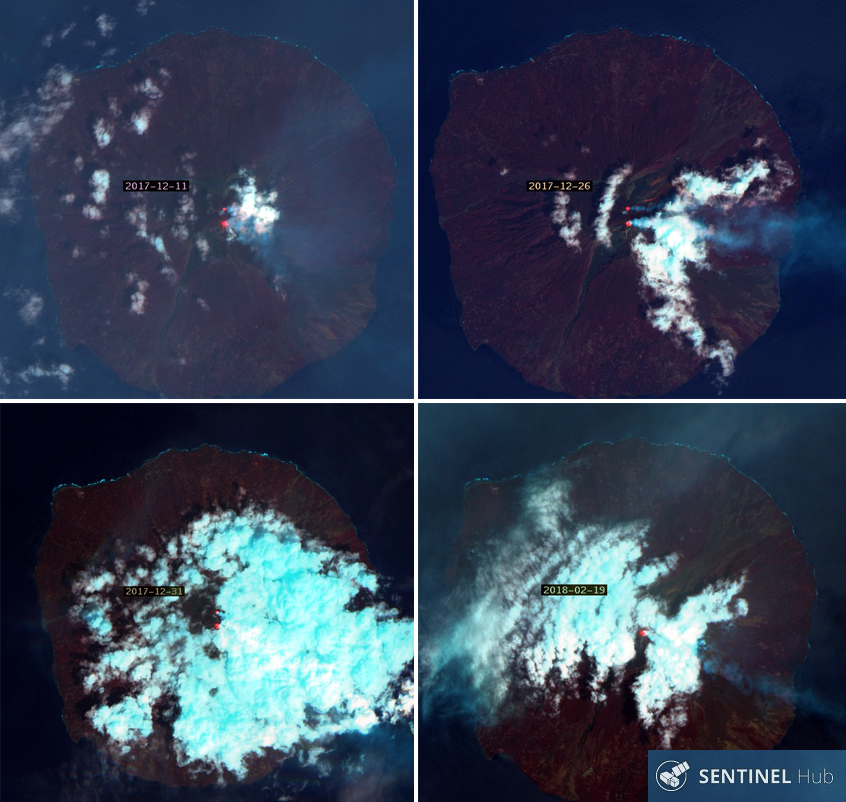 |
Figure 43. Sentinel-2 images (bands 12, 14, 2) of Manam on 11, 26, and 31 December 2017 and 19 February 2018 all showed evidence of either one or two thermal anomalies at the summit craters and gas plumes drifting in multiple directions. Courtesy of Sentinel Hub Playground. |
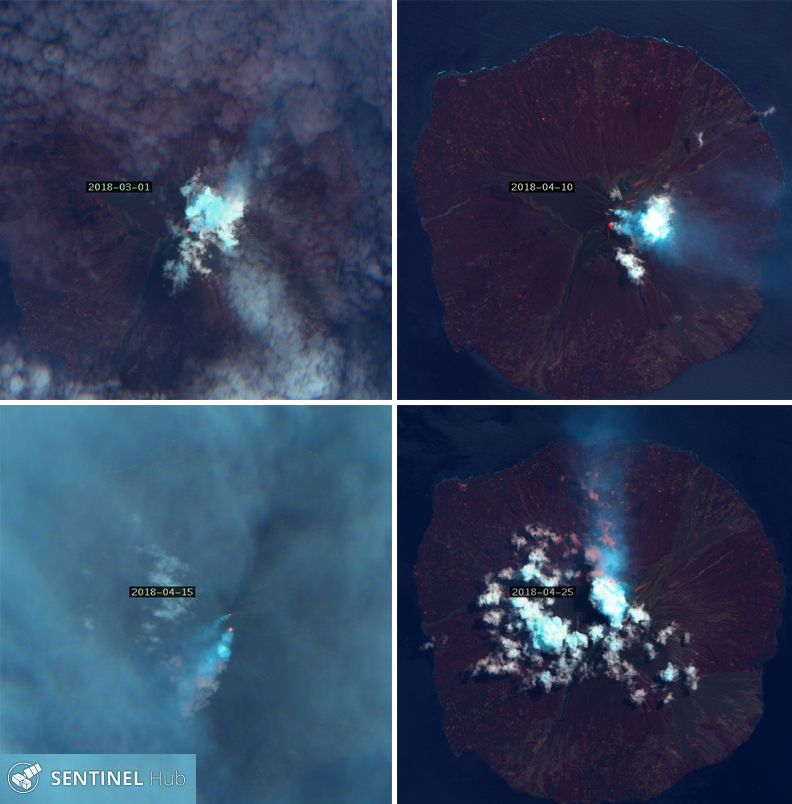 |
Figure 44. Thermal anomalies and/or gas plumes were visible at Manam's Main and Southern Craters on 1 March and 10, 15, and 25 April 2018 in Sentinel-2 imagery (bands 12, 14, 2), confirming continued activity at the volcano. Courtesy of Sentinel Hub Playground. |
Although no satellite images confirmed thermal activity in May 2018, several anomalies were recorded by the MIROVA project (figure 42). Sentinel-2 imagery on 9 June confirmed two hotspots at the summit with Southern Crater's signal larger than the weak Main Crater signal; the first VAAC report of 2018 was issued on 10 June based on a pilot report of ash at 1.8 km altitude, but it did not appear in satellite imagery. Two thermal anomalies were both more clearly visible on 29 July, with NNE drifting gas plumes (figure 45).
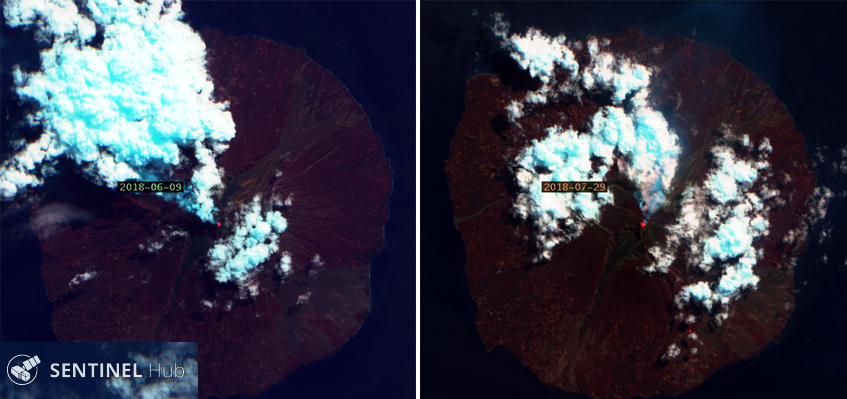 |
Figure 45. Two thermal anomalies with steam and gas plumes were visible in Sentinel-2 imagery (bands 12,4, 2) at the summit of Manam on 9 June and 29 July 2018. Courtesy of Sentinel Hub Playground. |
Activity during August 2018. Thermal activity began increasing in early August 2018, as seen in the MIROVA data, but satellite imagery also indicated a growing hotspot at Main Crater on 13 August. The thermal source appeared to be some type of incandescent flow on the upper NE flank that was visible in 23 August imagery along with the second anomaly at Southern Crater (figure 46).
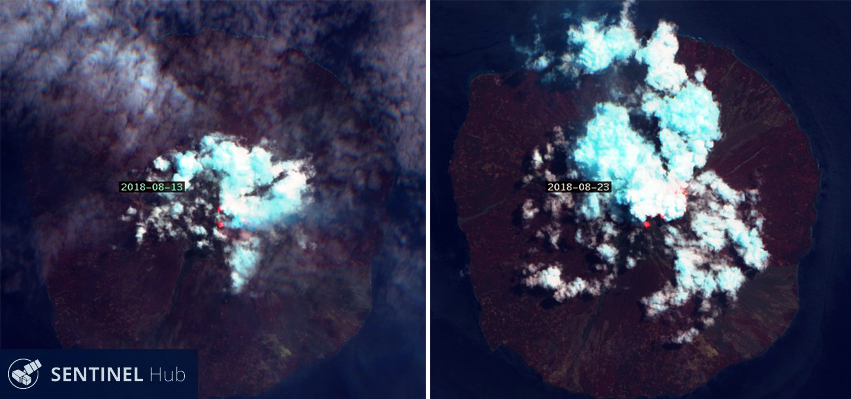 |
Figure 46. Growing hotspots were visible at the summit of Manam in Sentinel-2 imagery (bands 12,4, 2) on 13 August 2018 compared with the June and July imagery (figure 45). By 23 August a much larger thermal anomaly was visible beneath cloud cover originating from Main Crater. Courtesy of Sentinel Hub Playground. |
The Rabaul Volcano Observatory (RVO) issued an information bulletin early on 25 August indicating a new eruption from Main Crater (figure 47). Residents on the island reported increased activity around 0500 local time. The Darwin VAAC also issued a report a few hours later (24 August 2019 UTC) where they increased the Aviation Color code to Red, and indicated a high-impact eruption with an ash plume visible in satellite imagery that rose to 15.2 km altitude and drifted WSW after initially moving N (figure 48). Reports received at RVO indicated that ash, scoria, and mud fell in areas between the communities of Dangale on the NNE and Jogari on the SW part of the island. They also indicated that the most affected areas were Baliau and Kuluguma where wet, heavy, ashfall broke tree branches and reduced visibility (figure 49). A lava flow was observed in the NE valley slowly moving downhill, and there was evidence of a pyroclastic flow that reached the ocean in the same valley (figure 50).
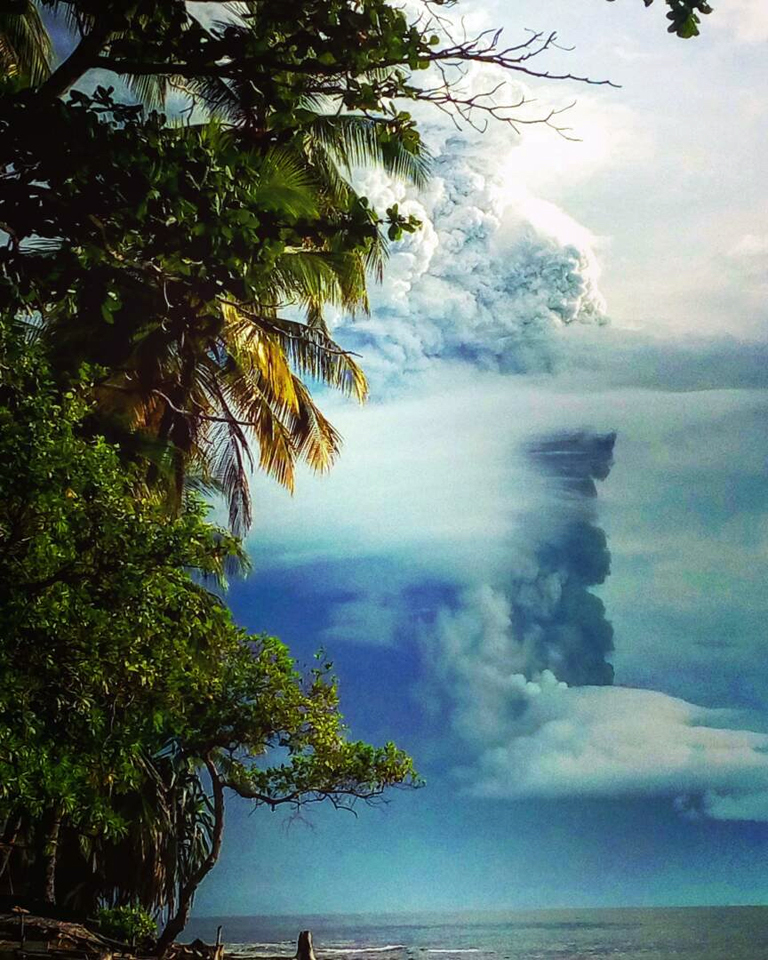 |
Figure 47. A large explosion at Manam on 25 August 2018 (local time) produced an ash plume that rose to over 15 km altitude. Islanders reported that ash and other debris from the eruption was so thick that sunlight was totally blocked for hours. Photo taken from the New Guinea mainland by members of the Police force. Courtesy of Scott Waide. |
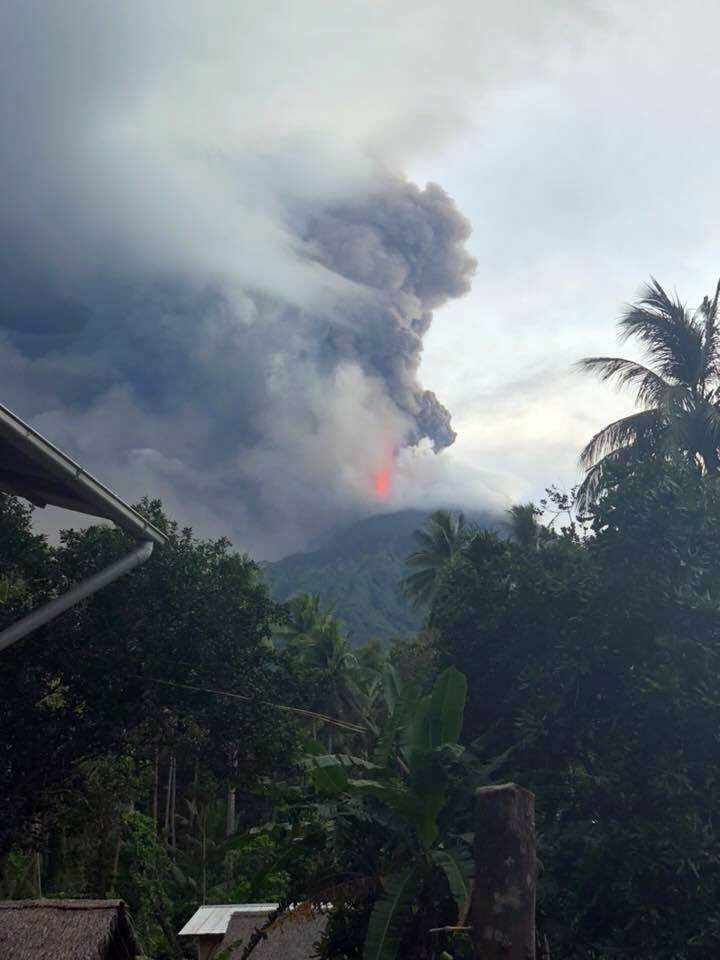 |
Figure 48. A substantial ash plume from an explosion at Manam on 25 August 2018 (local time) rose to 15.2 km altitude and drifted WSW for about five hours. Photo by Sean Richards, courtesy of Scott Waide. |
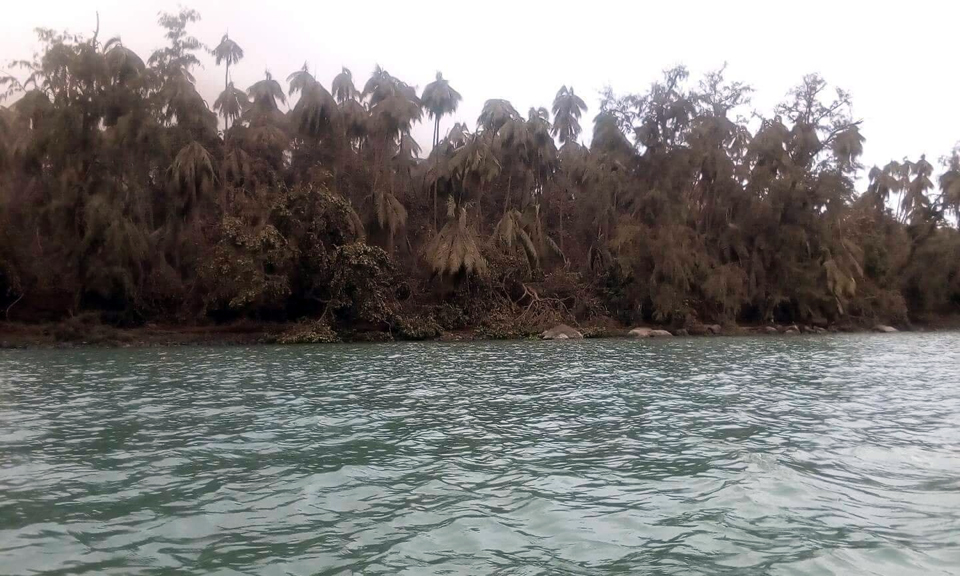 |
Figure 49. Vegetation on Manam was covered and damaged by heavy, wet, ash after an explosion on 25 August 2018. Photo by Anisah Isimel, courtesy of Scott Waide. |
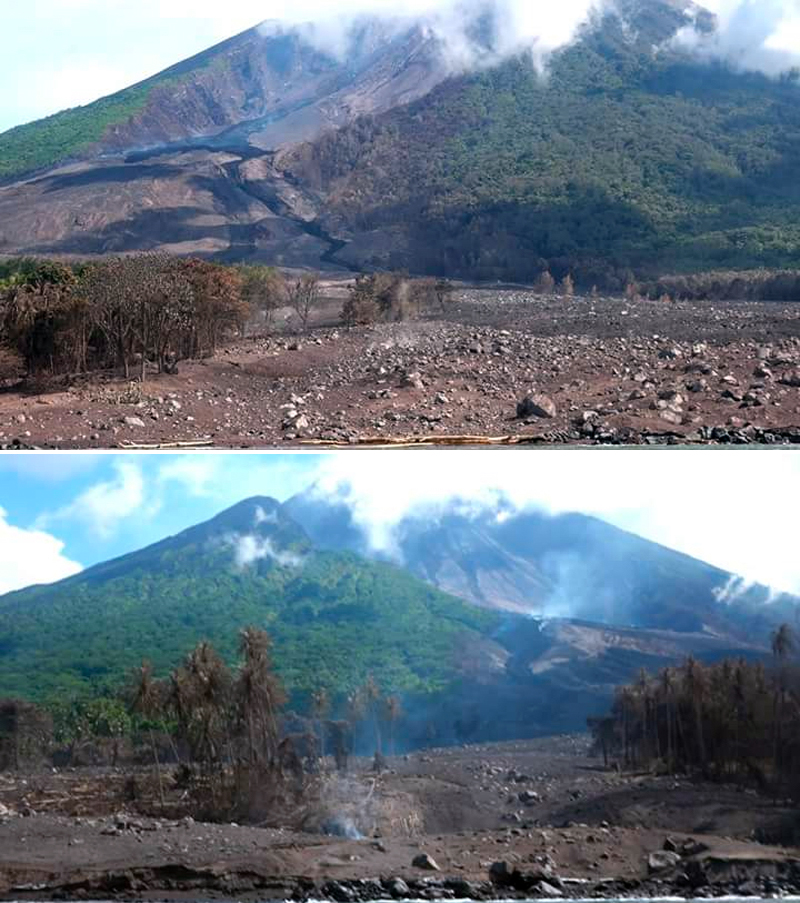 |
Figure 50. A fresh lava flow was visible in the major drainage on the NE flank at Manam a few days after a large explosion on 25 August 2018. Pyroclastic flows scorched trees and left behind debris. Posted online on 28 August 2018 by journalist Scott Waide from an article by journalist Martha Louis, EMTV. |
The eruption ceased around 1030 local time and was followed by dense steam plumes rising from the summit. RVO reported the following day that six houses in Boakure village on the NE side of the island were buried by debris from the pyroclastic flow. The occupants of the houses had escaped earlier to nearby Abaria village and no casualties were reported. The OMI instrument on NASA's Aura satellite captured a significant SO2 plume drifting WSW a few hours after reports of the 25 August eruption (figure 51). The Darwin VAAC reported a possible ash eruption on 28 August that was drifting WNW at 3.4 km altitude for a brief period before dissipating. According to RVO, several mudflows were reported in areas between the NW and SW parts of the island after the 25 August 2018 eruption, triggered by the heavy rainfall that followed.
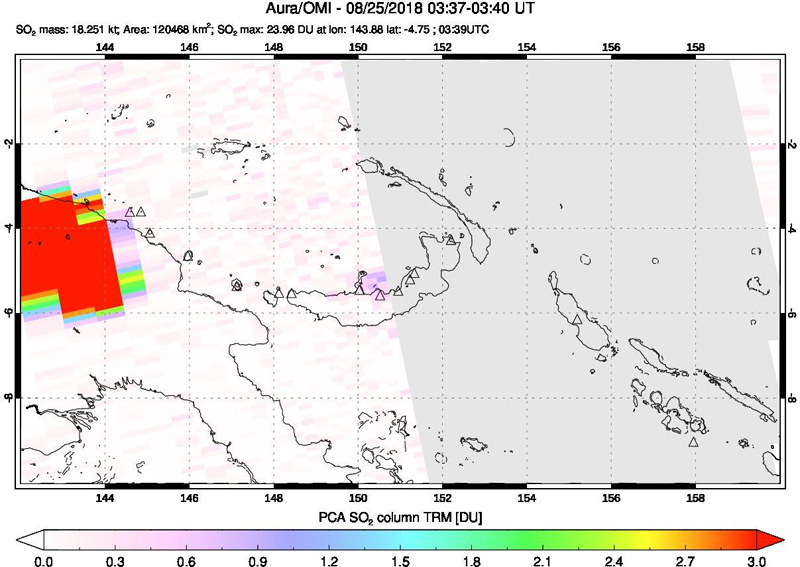 |
Figure 51. The OMI instrument on NASA's Aura satellite captured a significant SO2 plume drifting WSW from Manam a few hours after reports of the 25 August 2018 eruption. Courtesy of NASA Goddard Space Flight Center. |
Activity during September-November 2018. Satellite evidence during September 2018 confirmed the ongoing activity at the summit where a thermal anomaly was visible at Southern Crater on 7 September. On 12 September a gas plume drifted NW from the thermal anomaly at Southern crater while an incandescent lava flow was visible on the NE flank below Main Crater. (figure 52). RVO reported increased activity at Southern Crater during 20-24 September that included variable amounts of steam and gray to brown ash plumes. The Darwin VAAC reported a short-lived ash plume visible in satellite imagery on 23 September that rose to 8.5 km altitude and drifted NW. A small ash emission seen in visible imagery on 25 September rose to 2.4 km altitude and extended SE briefly before dissipating. Although partially obscured by clouds, the lava flow was still visible on the upper NE flank on 27 September (figure 52).
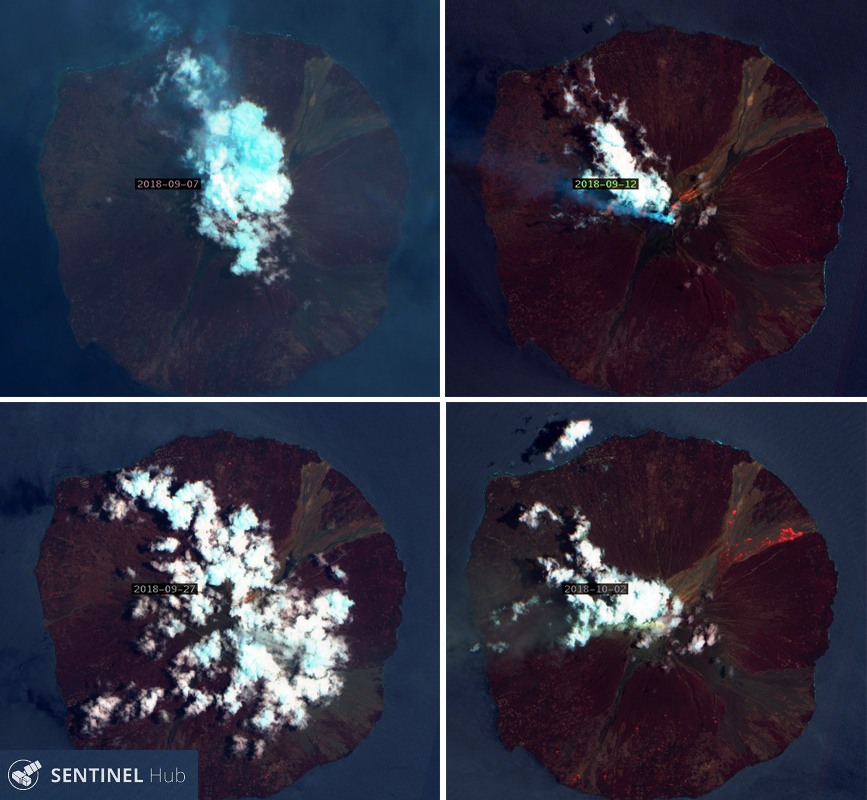 |
Figure 52. Satellite evidence (Sentinel-2, bands 12, 4, 2) during September 2018 at Manam confirmed the ongoing activity at the summit where a thermal anomaly was visible at Southern Crater on 7 September. On 12 September a gas plume drifted NW from Southern Crater while an incandescent flow traveled down the NE flank from Main Crater. Although partially obscured by clouds, the flow was still visible on the upper NE flank on 27 September. A nearly clear satellite image on 2 October showed incandescent lava reaching almost to the ocean in two lobes on the NE flank of the island. Courtesy of Sentinel Hub playground. |
Continuous ash emissions from a new explosion were first reported based on satellite imagery by the Darwin VAAC on 30 September (UTC) at 4.3 km altitude extending SW, and also at 3.0 km altitude drifting W. The emissions at 4.3 km altitude dissipated the following day, but lower level emissions continued at 2.1 km altitude drifting NW through 3 October. On 1 October residents reported hearing continuous loud roaring, rumbling, and banging noises, and reports from Tabele on the SW side of the island indicated very bright incandescence at the summit area. The incandescence was also visible from the Bogia Government Station on the mainland. Small amounts of fine ash and scoria were reported at Jogari and surrounding villages to the N on 1 October. Field observations on 1 October confirmed the presence of a two-lobed lava flow into the NE valley. The smaller lobe traveled towards Kolang village on the N side of the valley and the larger lobe went to the S towards Boakure village. Both flows stopped before reaching inhabited areas. A nearly clear satellite image on 2 October showed the incandescent lava reaching almost to the ocean in the two lobes on the NE flank of the island (figure 52). An SO2 plume drifting SW from Manam was captured by the OMI instrument on the Aura satellite on 1 October 2018 (figure 53).
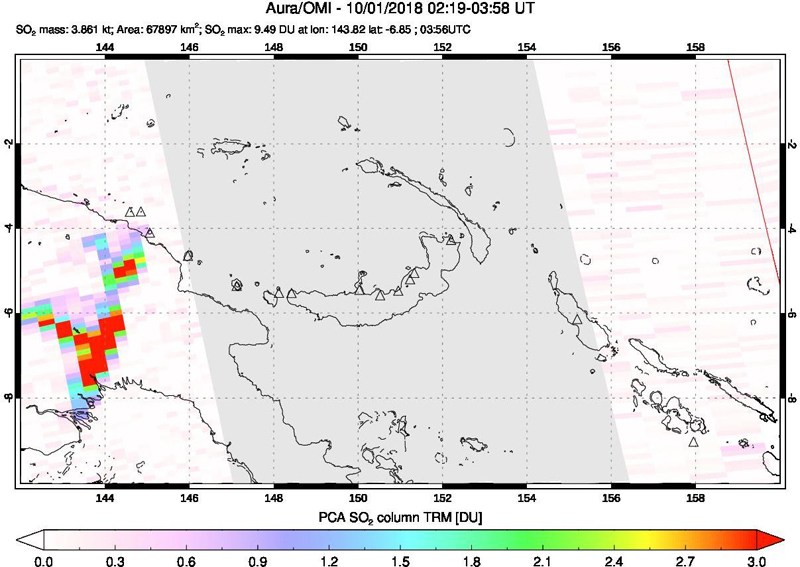 |
Figure 53. The OMI instrument on NASA's Aura satellite captured an SO2 plume drifting SW from Manam on 1 October 2018. Courtesy of NASA Goddard Space Flight Center. |
RVO reported that during 2-12 October Southern Crater produced variable amounts of brown, gray-brown and dark gray ash clouds that rose between a few hundred meters and a kilometer above the summit craters before drifting NW. The Darwin VAAC reported an ash emission to 10.4 km altitude on 5 October that extended 25 km W before dissipating within a few hours. Continuous emissions to 2.4 km altitude extending WNW began a few hours later and were intermittently visible in satellite imagery through 12 October. Incandescent lava was visible in satellite imagery on the NE flank on 12 October (figure 54). Activity decreased significantly during the rest of October and most of November 2018, with no ground reports, VAAC reports, or satellite imagery indicating thermal activity; only the MIROVA data showed low-level thermal anomalies (figure 42). A satellite image on 26 November 2018 indicated that thermal activity continued at one of the summit craters (figure 54).
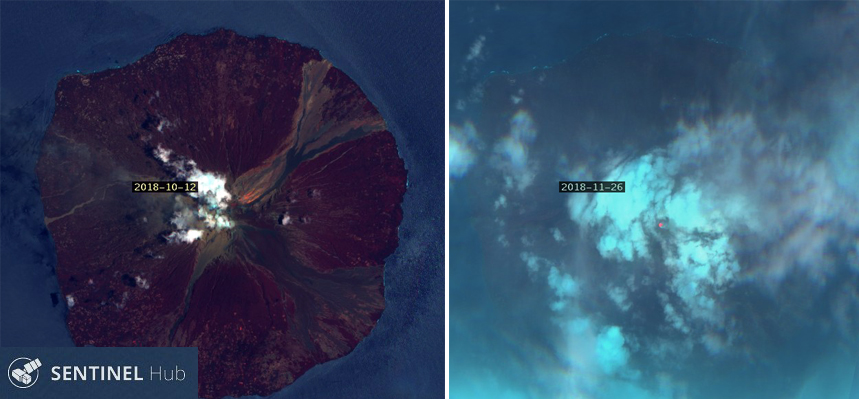 |
Figure 54. Incandescent lava was visible on the NE flank of Manam on 12 October 2018 in this Sentinel-2 satellite image (bands 12, 4, 2). A single hotspot appeared through meteoric clouds on 26 November. Courtesy of Sentinel Hub Playground. |
Activity during December 2018. The Darwin VAAC reported a minor ash emission on 6 December 2018 that rose to 5.2 km altitude and drifted SE for a few hours before dissipating. A much larger ash emission on 8 December was clearly observed in satellite imagery and reported by a pilot, as well as by ground and ocean-based observers. It was initially reported at 12.2 km altitude but rose to 15.2 km a few hours later, drifting E for about 10 hours before dissipating (figure 55). This was followed later in the day by an ongoing ash emission at 8.2 km altitude that drifted E before dissipating on 9 December. According to the UNHCR news organization Relief Web, the eruption started around 1300 local time on 8 December and lasted until about 1000 on 9 December. Based on reports from the ground, the eruption affected the NE part of the island. In particular, a lava flow affected Bokure (Bokuri) and Kolang (NE Manam). Communities in both localities were evacuated. The Loop PNG reported that RVO noted that the flow stopped before reaching Bokure. Ash and scoria fall was described as being moderate in downwind areas, including Warisi village on the SE side of the island. An SO2 plume was also identified by satellite instruments. Hotspots were visible from both craters on 11 December and from one of the craters on 16 December (figure 56).
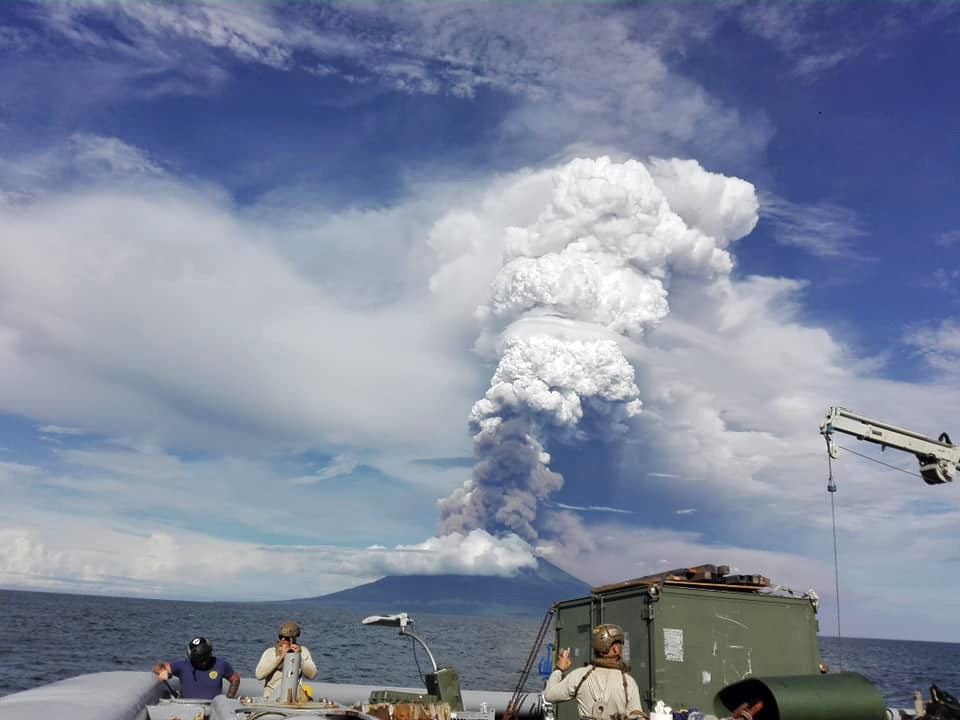 |
Figure 55. This image of an eruption at Manam on 8 December 2018 (local time) was likely taken from a Papua New Guinea government ship, and made available via Jhay Mawengu of the Royal Papua New Guinea Constabulary. |
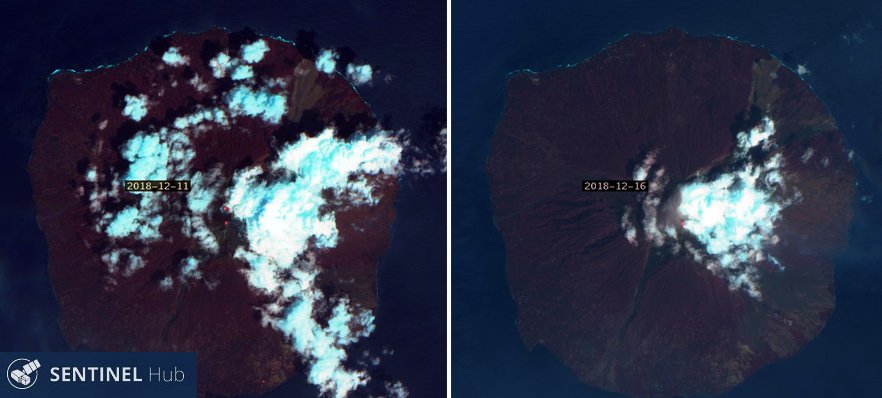 |
Figure 56. Sentinel-2 satellite images indicated thermal activity continuing as hotspots at the summit of Manam on 11 and 16 December 2018. Courtesy of Sentinel Hub Playground. |
Geological Summary. The 10-km-wide island of Manam, lying 13 km off the northern coast of mainland Papua New Guinea, is one of the country's most active volcanoes. Four large radial valleys extend from the unvegetated summit of the conical basaltic-andesitic stratovolcano to its lower flanks. These valleys channel lava flows and pyroclastic avalanches that have sometimes reached the coast. Five small satellitic centers are located near the island's shoreline on the northern, southern, and western sides. Two summit craters are present; both are active, although most observed eruptions have originated from the southern crater, concentrating eruptive products during much of the past century into the SE valley. Frequent eruptions, typically of mild-to-moderate scale, have been recorded since 1616. Occasional larger eruptions have produced pyroclastic flows and lava flows that reached flat-lying coastal areas and entered the sea, sometimes impacting populated areas.
Information Contacts: Rabaul Volcano Observatory (RVO), Geohazards Management Division, Department of Mineral Policy and Geohazards Management (DMPGM), PO Box 3386, Kokopo, East New Britain Province, Papua New Guinea; Hawai'i Institute of Geophysics and Planetology (HIGP) - MODVOLC Thermal Alerts System, School of Ocean and Earth Science and Technology (SOEST), Univ. of Hawai'i, 2525 Correa Road, Honolulu, HI 96822, USA (URL: http://modis.higp.hawaii.edu/); MIROVA (Middle InfraRed Observation of Volcanic Activity), a collaborative project between the Universities of Turin and Florence (Italy) supported by the Centre for Volcanic Risk of the Italian Civil Protection Department (URL: http://www.mirovaweb.it/); Sentinel Hub Playground (URL: https://www.sentinel-hub.com/explore/sentinel-playground); NASA Goddard Space Flight Center (NASA/GSFC), Global Sulfur Dioxide Monitoring Page, Atmospheric Chemistry and Dynamics Laboratory, 8800 Greenbelt Road, Goddard, Maryland, USA (URL: https://SO2.gsfc.nasa.gov/); Scott Waide (URL: https://mylandmycountry.wordpress.com/2018/08/, Twitter: @Scott_Waide); Jhay Mawengu, Royal Papua New Guinea Constabulary (URL: https://www.facebook.com/mawengu.jeremy.7); Relief Web, United Nations Office for the Coordination of Humanitarian Affairs, Resident Coordinator's Office, 380 Madison Avenue, 7th floor, New York, NY 10017-2528, USA (URL: https://reliefweb.int/); LOOP Pacific (URL: http://www.looppng.com/).