Report on Asosan (Japan) — January 2020
Bulletin of the Global Volcanism Network, vol. 45, no. 1 (January 2020)
Managing Editor: Edward Venzke.
Edited by Janine B. Krippner.
Asosan (Japan) Intermittent ash plumes and elevated SO2 emissions continue during July-December 2019
Please cite this report as:
Global Volcanism Program, 2020. Report on Asosan (Japan) (Krippner, J.B., and Venzke, E., eds.). Bulletin of the Global Volcanism Network, 45:1. Smithsonian Institution. https://doi.org/10.5479/si.GVP.BGVN202001-282110
Asosan
Japan
32.8849°N, 131.085°E; summit elev. 1592 m
All times are local (unless otherwise noted)
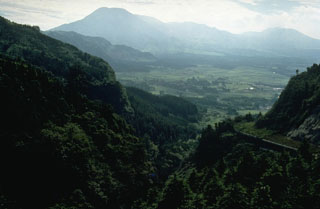
The large Asosan caldera reaches around 23 km long in the N-S direction and contains a complex of 17 cones, of which Nakadake is the most active (figure 58). A recent increase in activity prompted an alert level increase from 1 to 2 on 14 April 2019. The Nakadake crater is the site of current activity (figure 59) and contains several smaller craters, with the No. 1 crater being the main source of activity during July-December 2019. The activity during this period is summarized here based on reports by the Japan Meteorological Agency and satellite data.
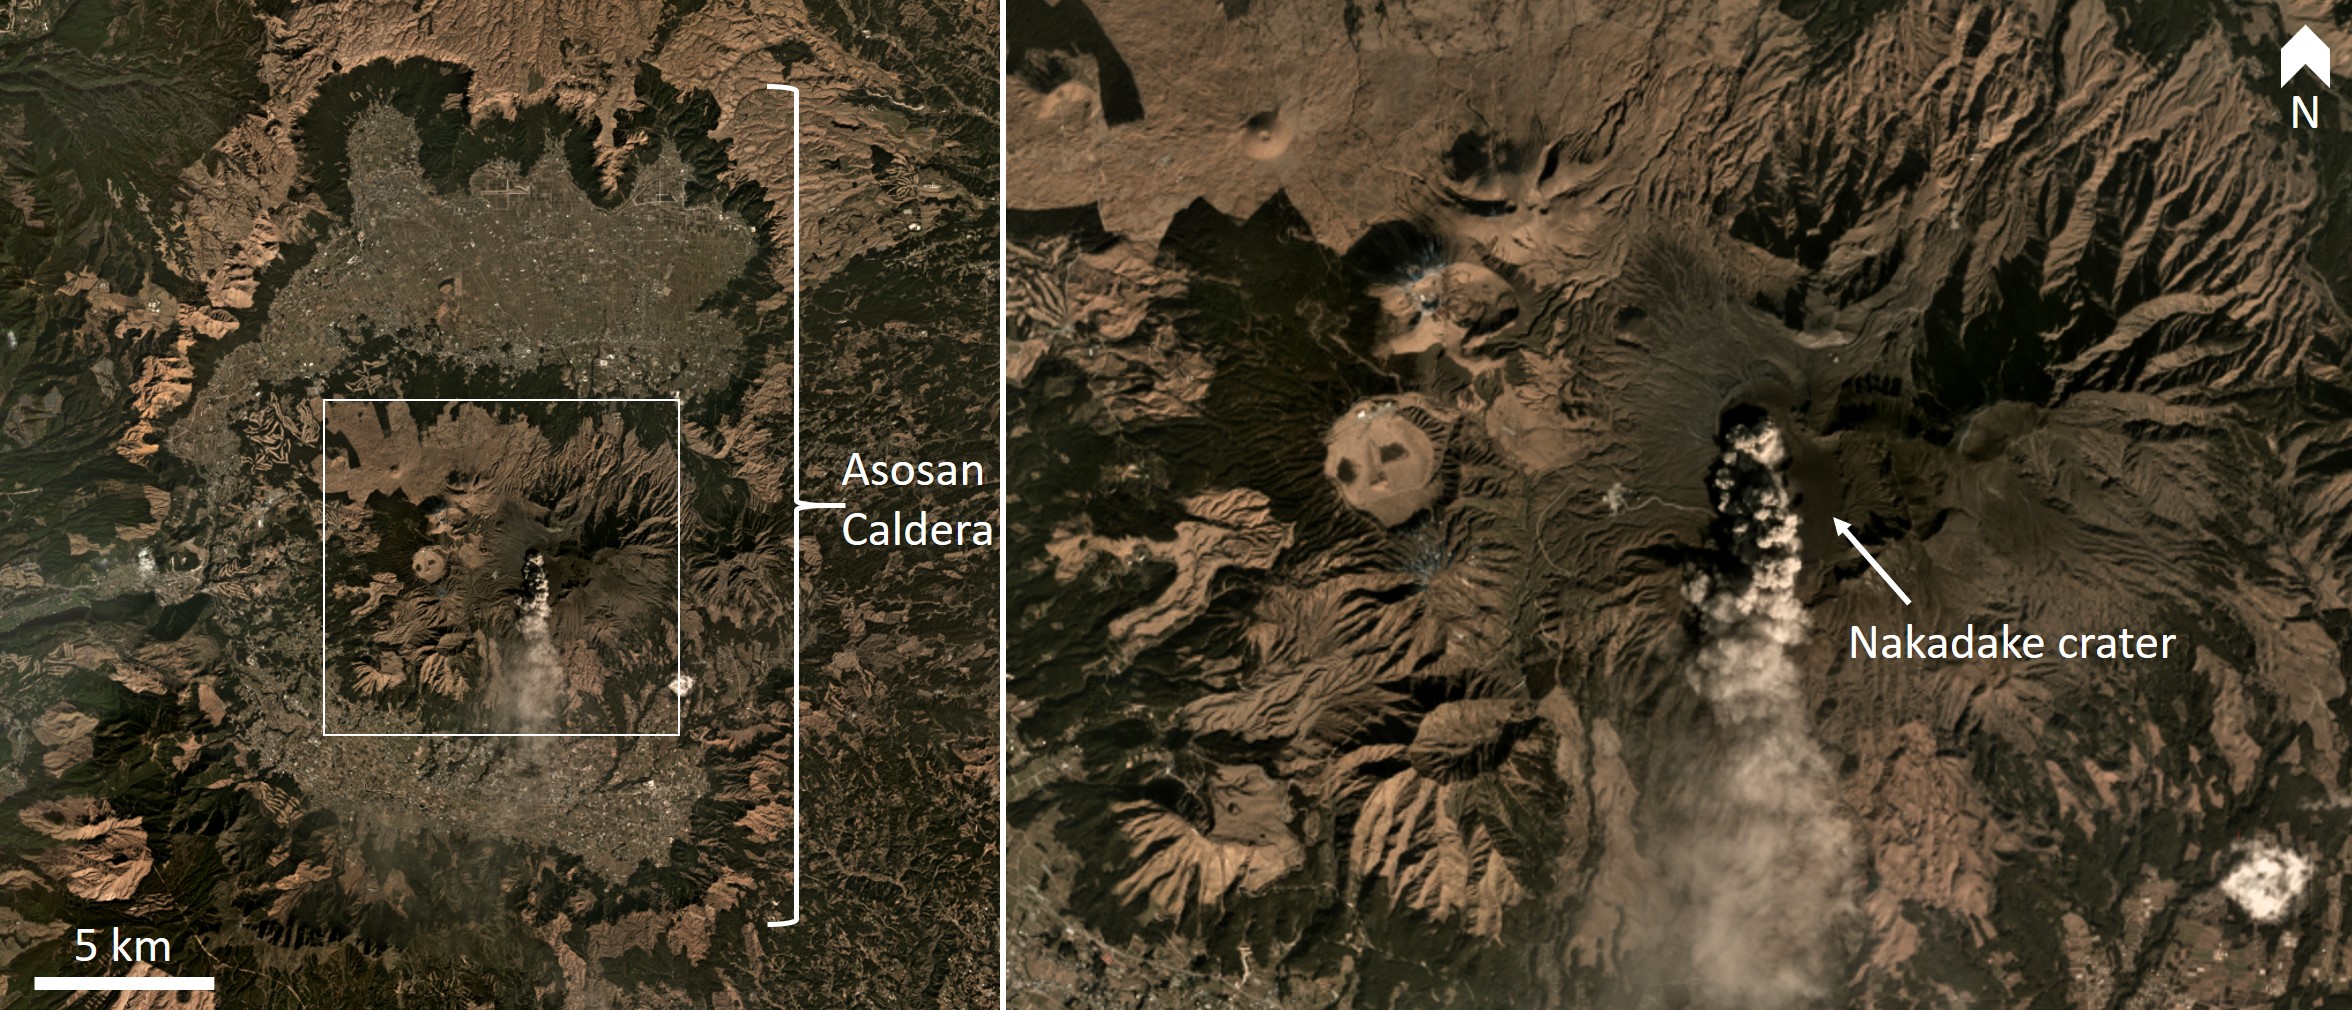 |
Figure 58. Asosan is a group of cones and craters within a larger caldera system. January 2010 Monthly Mosaic images copyright Planet Labs 2019. |
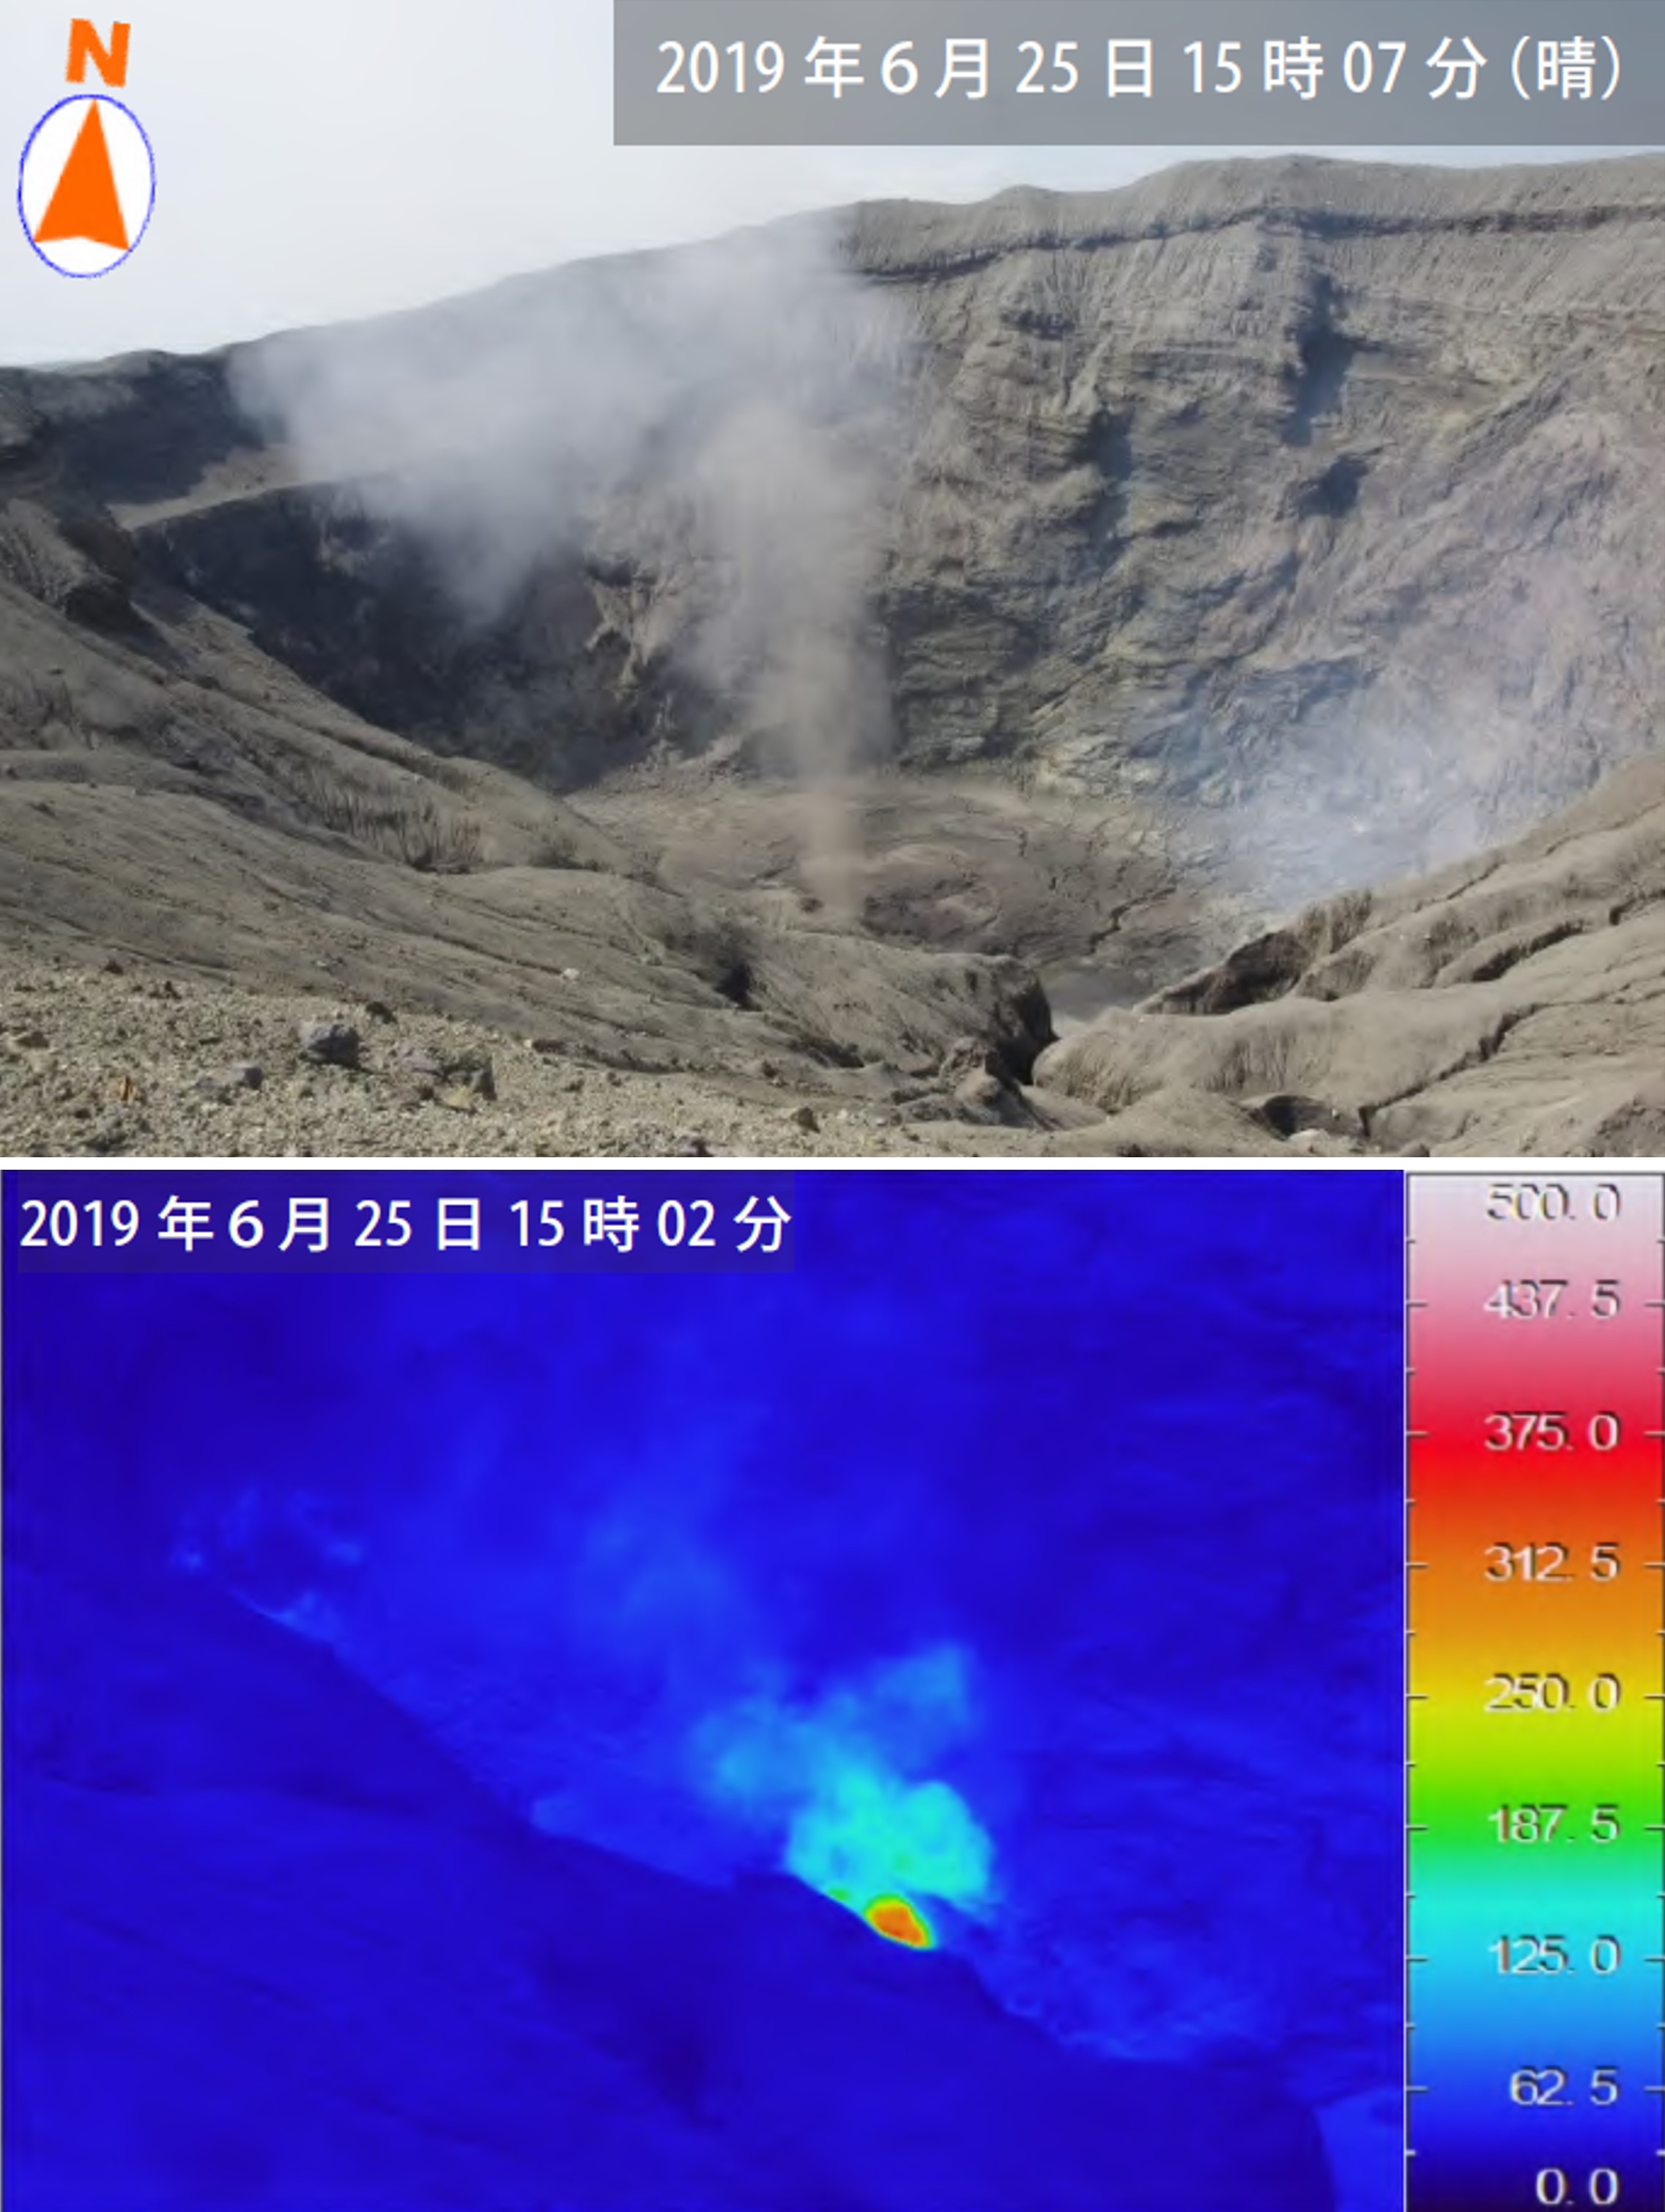 |
Figure 59. Hot gas emissions from the Nakadake No. 1 crater on 25 June 2019 reached around 340°C. Courtesy of the Japan Meteorological Agency (July 2019 monthly report). |
Small explosions were observed at the No. 1 vent on the 4, 5, 9, 13-16, and 26 July. There was an increase in thermal energy detected near the vent leading to a larger event on the 26th (figures 60 and 61), which produced an ash plume up to 1.6 km above the crater rim and continuing from 0757 to around 1300 with a lower plume height of 400 m after 0900. Light ashfall was reported downwind. Elevated activity was noted during 28-29 July, and an ash plume was seen in webcam footage on the 30th. Incandescence was visible in light-sensitive cameras during 4-17 and after the 26th. A field survey on 5 July measured 1,300 tons of sulfur dioxide (SO2) per day. This had increased to 2,300 tons per day by the 12th, 2,500 on the 24th, and 2,400 by the 25th. A sulfur dioxide plume was detected in Sentinel-5P/TROPOMI satellite data acquired on 28 July (figure 62).
 |
Figure 60. Thermal images taken at Asosan on 26 July 2019 show the increasing temperature of emissions leading to an explosion. Courtesy of the Japan Meteorological Agency (July 2019 monthly report). |
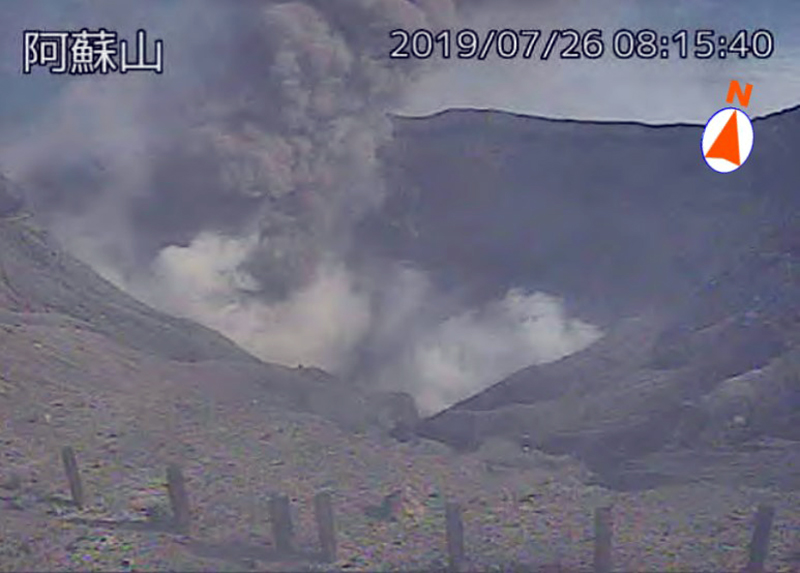 |
Figure 61. An eruption from the Nakadake crater at Asosan on 26 July 2019. Courtesy of the Japan Meteorological Agency (July 2019 monthly report). |
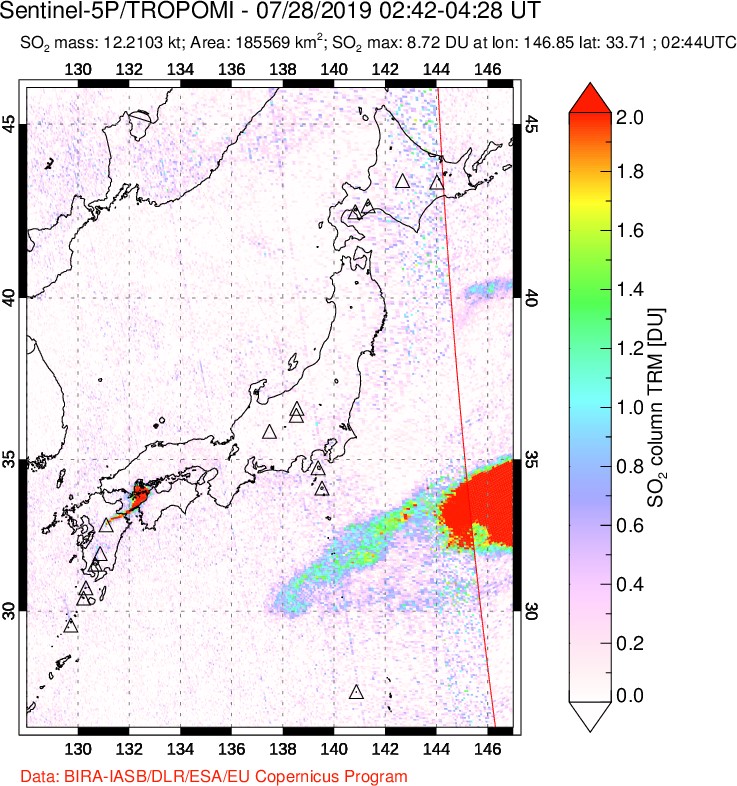 |
Figure 62. A sulfur dioxide plume was detected from Asosan (to the left) on 28 July 2019. The larger plume (red) to the right is not believed to be associated with volcanism in this area. NASA Sentinel-5P/TROPOMI satellite image courtesy of the NASA Goddard Space Flight Center. |
The increased eruptive activity that began on 5 July continued to 16 August. There were 24 eruptions recorded throughout the month, with eruptions occurring on 18-23, 25, and 29-31 August. An ash plume at 2100 on 4 August reached 1.5 km above the crater rim. Detected SO2 increased to extremely high levels from late July to early August with 5,200 tons per day recorded on 9 August, but which then reduced to 2,000 tons per day. Ashfall occurred out to around 7 km NW on the 10th (figure 63). Activity continued to increase at the Nakadake No. 1 crater, producing incandescence. High-temperature gas plumes were detected at the No. 2 crater.
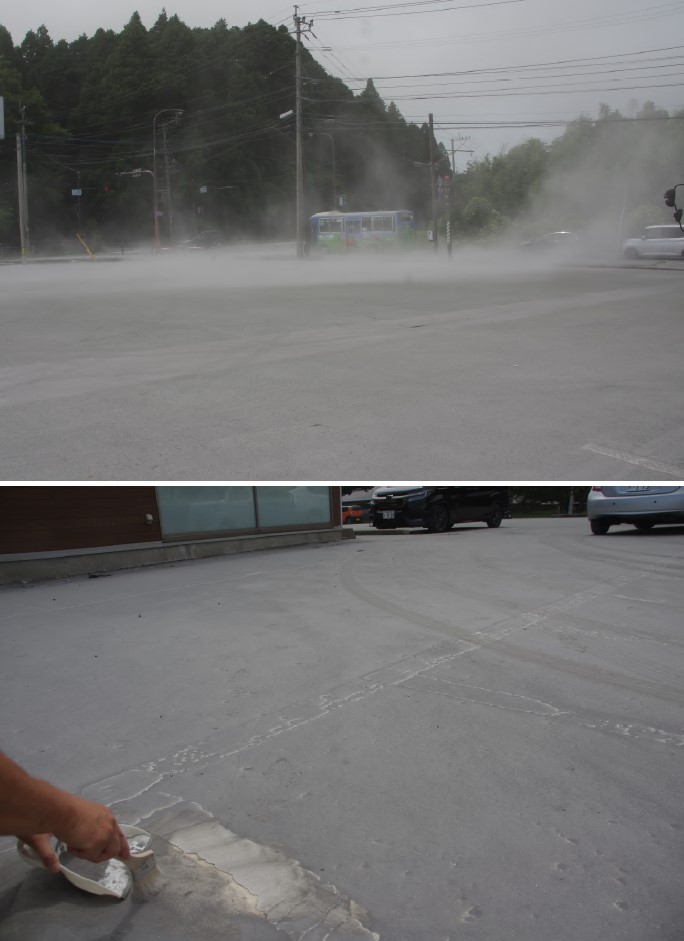 |
Figure 63. Ashfall from Asosan on 10 August 2019 near Otohime, Aso city, which is about 7 km NW of the Nakadake No. 1 crater that produced the ash plume. The ashfall was thick enough that the white line in the parking lot was mostly obscured (lower photo). Courtesy of the Japan Meteorological Agency (August 2019 monthly report). |
Thermal activity continued to increase, and incandescence was observed at the No. 1 crater throughout September. There were 24 eruptions recorded throughout August. Light ashfall occurred out to around 8 km NE on the 3rd and ash plumes reached 1.6 km above the crater rim during 10-13, and again during 25-30 (figures 64 and 65). During the later dates ashfall was reported to the NE and NW. The SO2 levels were back down to 1,600 tons per day by 11 September and increased to 2,600 tons per day by the 26th.
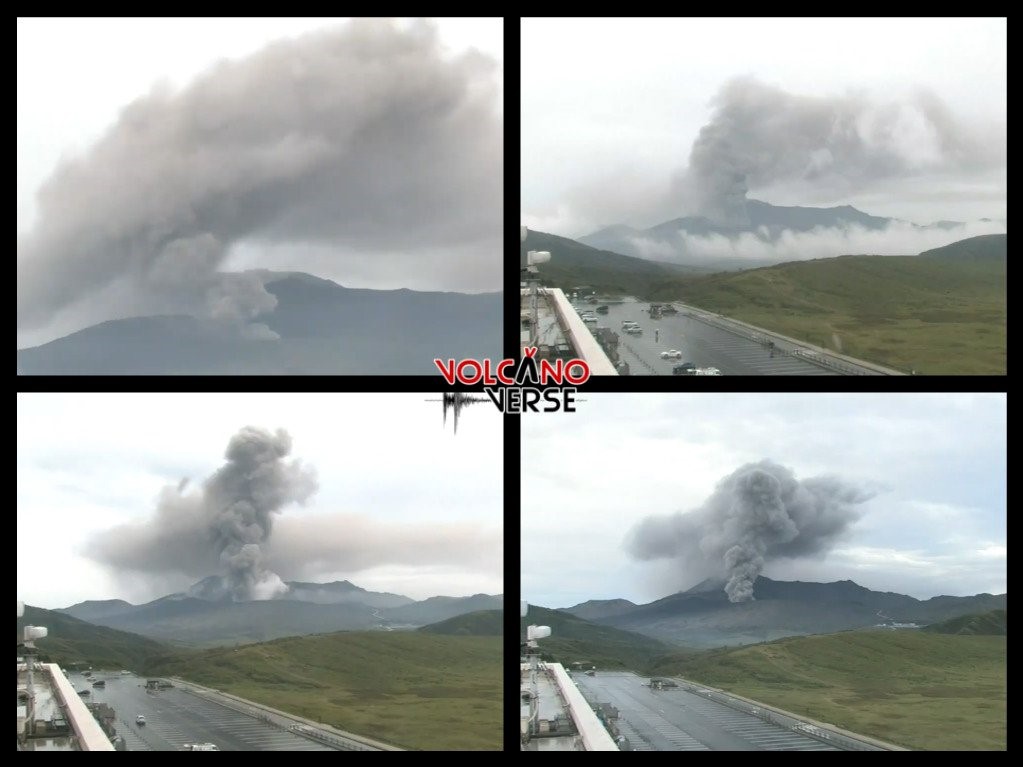 |
Figure 64. Ash plumes at Asosan on 29 September 2019. Courtesy of Volcanoverse. |
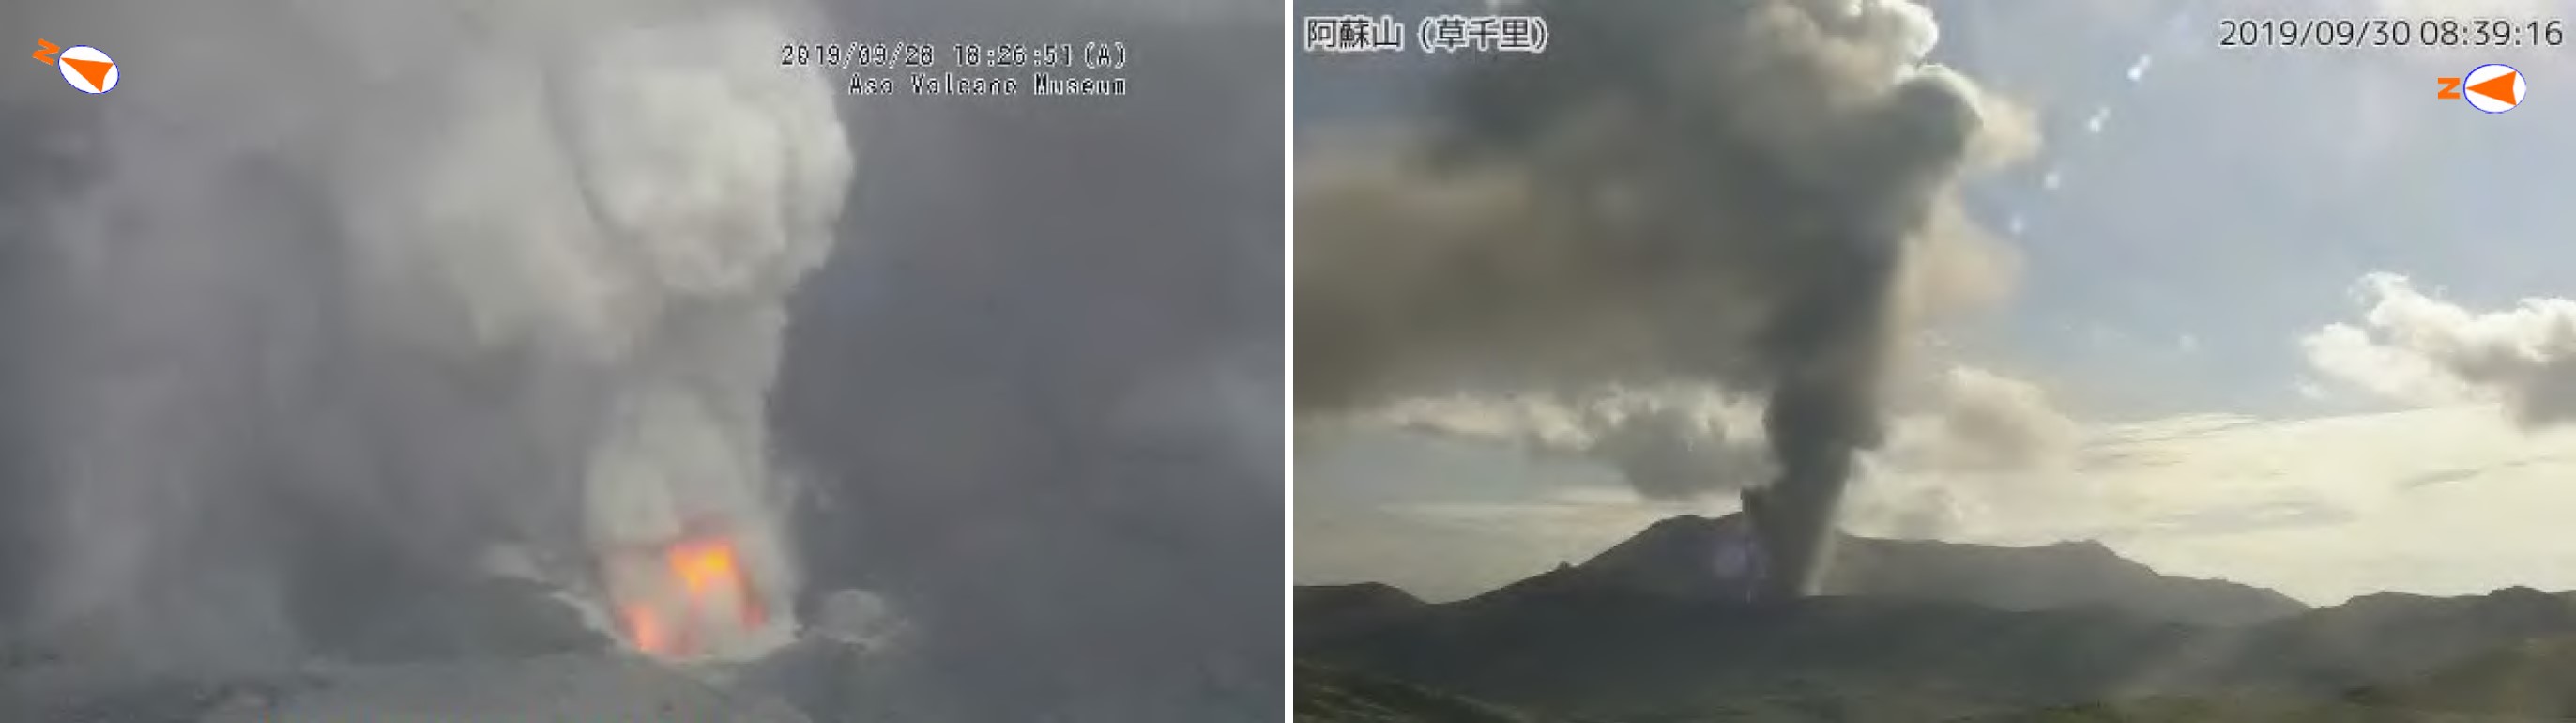 |
Figure 65. Activity at Asosan in late September 2019. Left: incandescence and a gas plume at the Nakadake No. 1 crater on the 28th. Right: an eruption produced an ash plume at 0839 on the 30th. Aso Volcano Museum surveillance camera image (left) and Kusasenri surveillance camera image (right) courtesy of the Japan Meteorological Agency (September 2019 monthly report). |
Similar elevated activity continued through October with ash plumes reaching 1.3 km above the crater and periodic ashfall reported at the Kumamoto Regional Meteorological Observatory, and out to 4 km S to SW on the 19th and 29th. Temperatures up to 580°C were recorded at the No. 1 crater on 23 October and incandescence was occasionally visible at night through the month (figure 66). Gas surveys detected 2,800 tons per day of SO2 on 7 October, which had increased to 4,000 tons per day by the 11th.
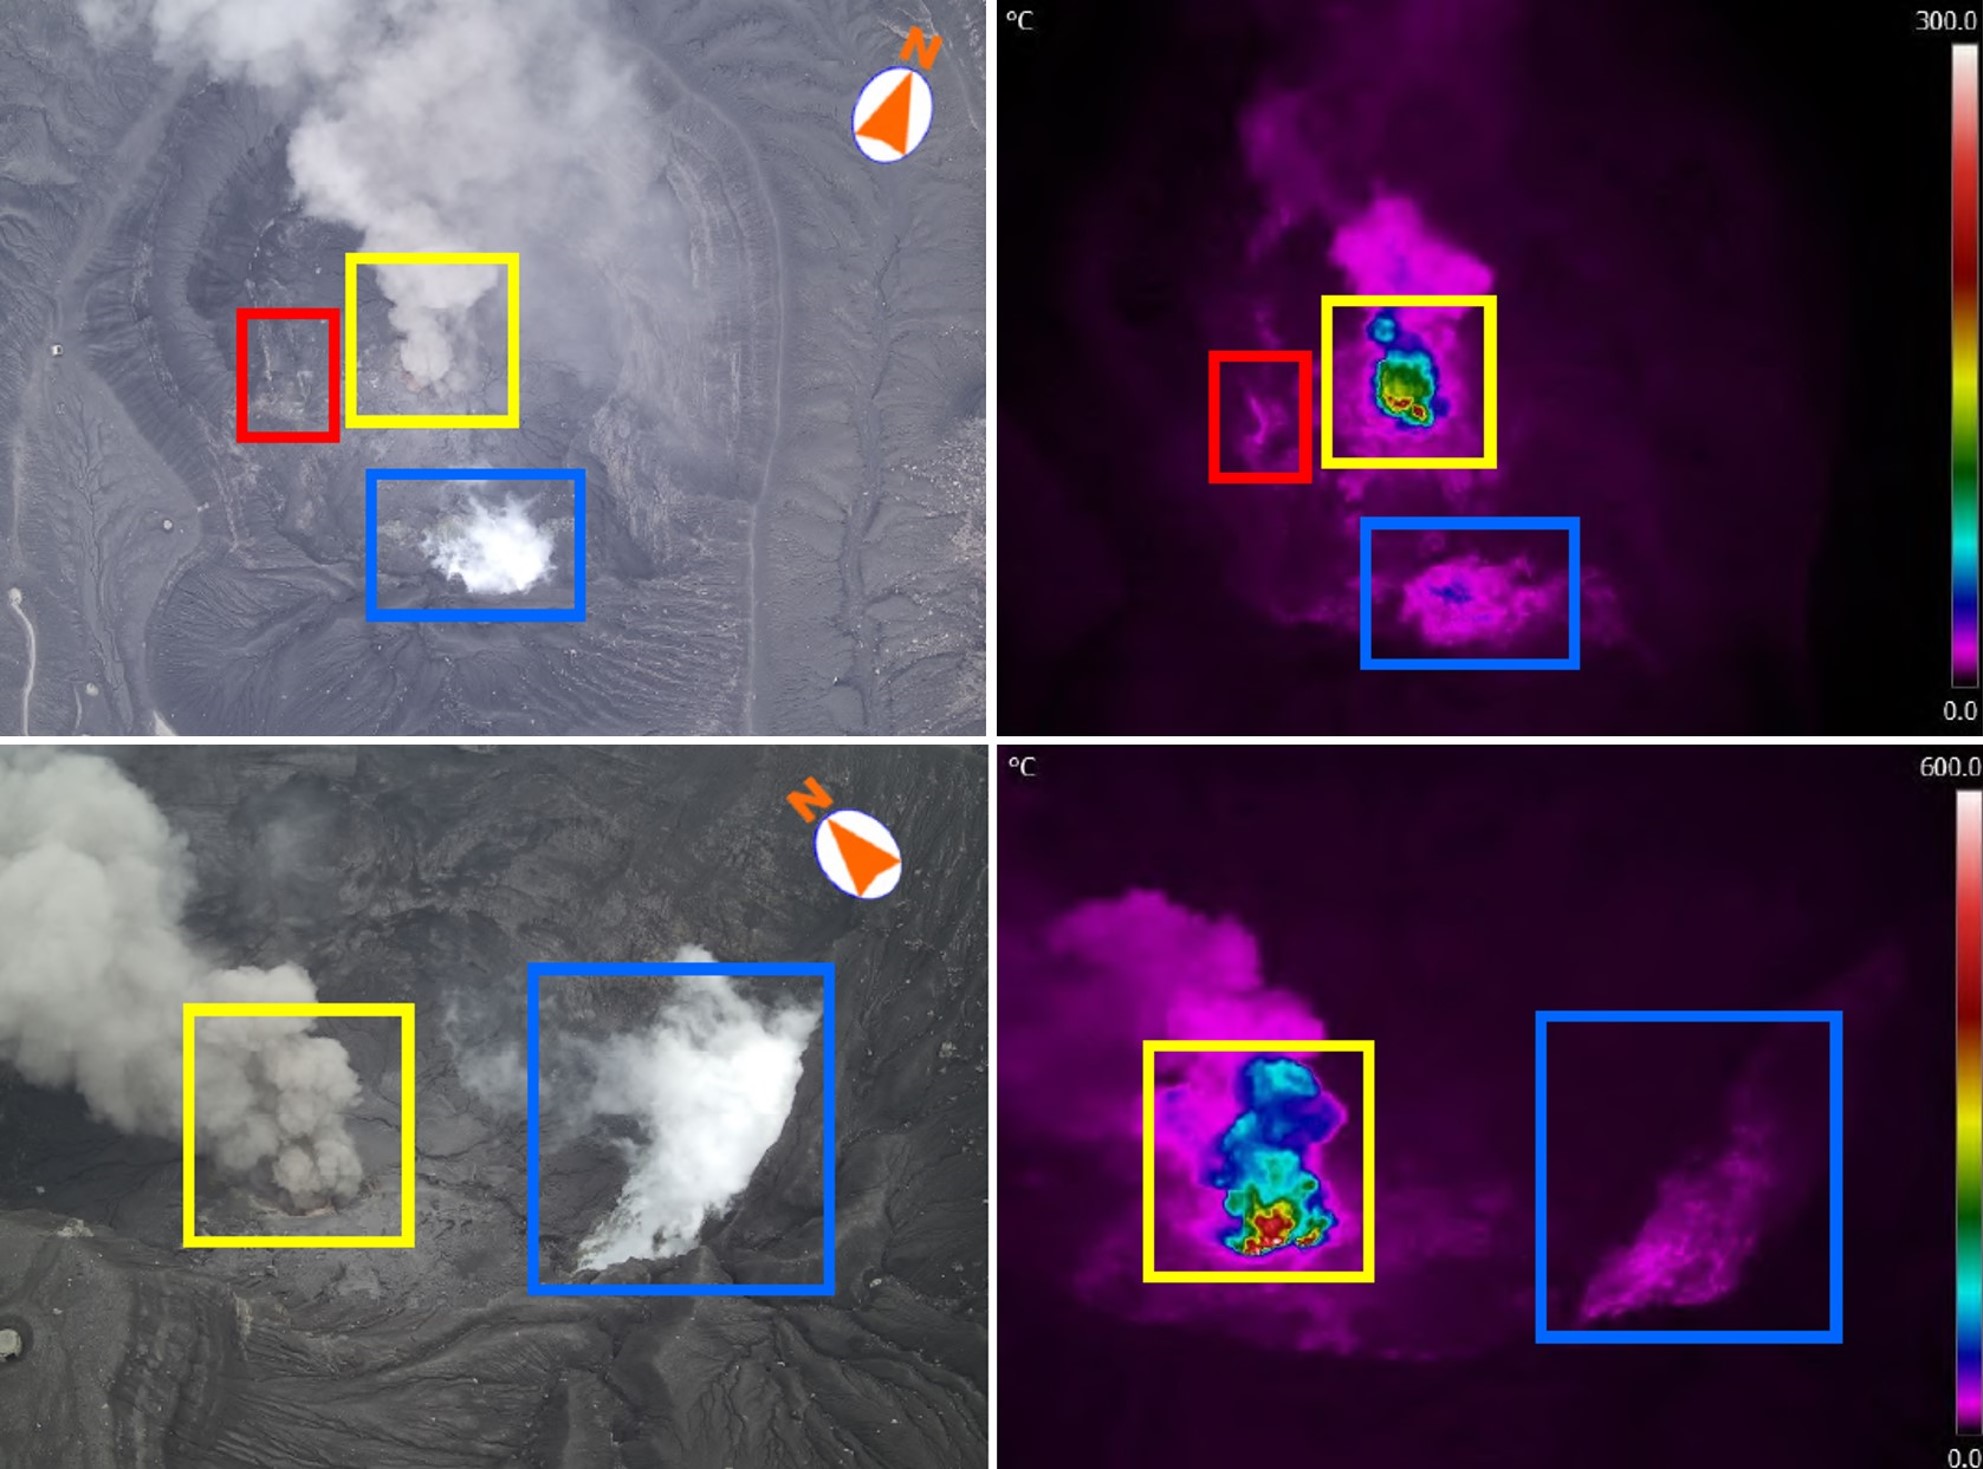 |
Figure 66. Drone images of the Asosan Nakadake crater area on 23 October 2019. The colored boxes show the same vents and the photographs on the left correlate to the thermal images on the right. The yellow box is around the No. 1 crater, with temperature measurements reaching 580°C. The emissions in the red box reached 50°C, and up to 100°C on the southwest crater wall (blue box). Courtesy of the Japan Meteorological Agency (October 2019 monthly report). |
Ash plume emission continued through November (figure 67 and 68). Plumes reached 1.5 to 2.4 km above sea level during 13-18 November and ashfall occurred downwind, with a maximum of 1.4 km above the crater rim for the month. Ashfall was reported near Aso City Hall on the 27th. Incandescence was observed until 6 November. During the first half of October sulfur dioxide emissions were slightly lower than the previous month, with measurements detecting under 3,000 tons per day. In the second half of the month emissions increased to 2,000 to 6,300 tons per day. This was accompanied by an increase in volcanic tremor.
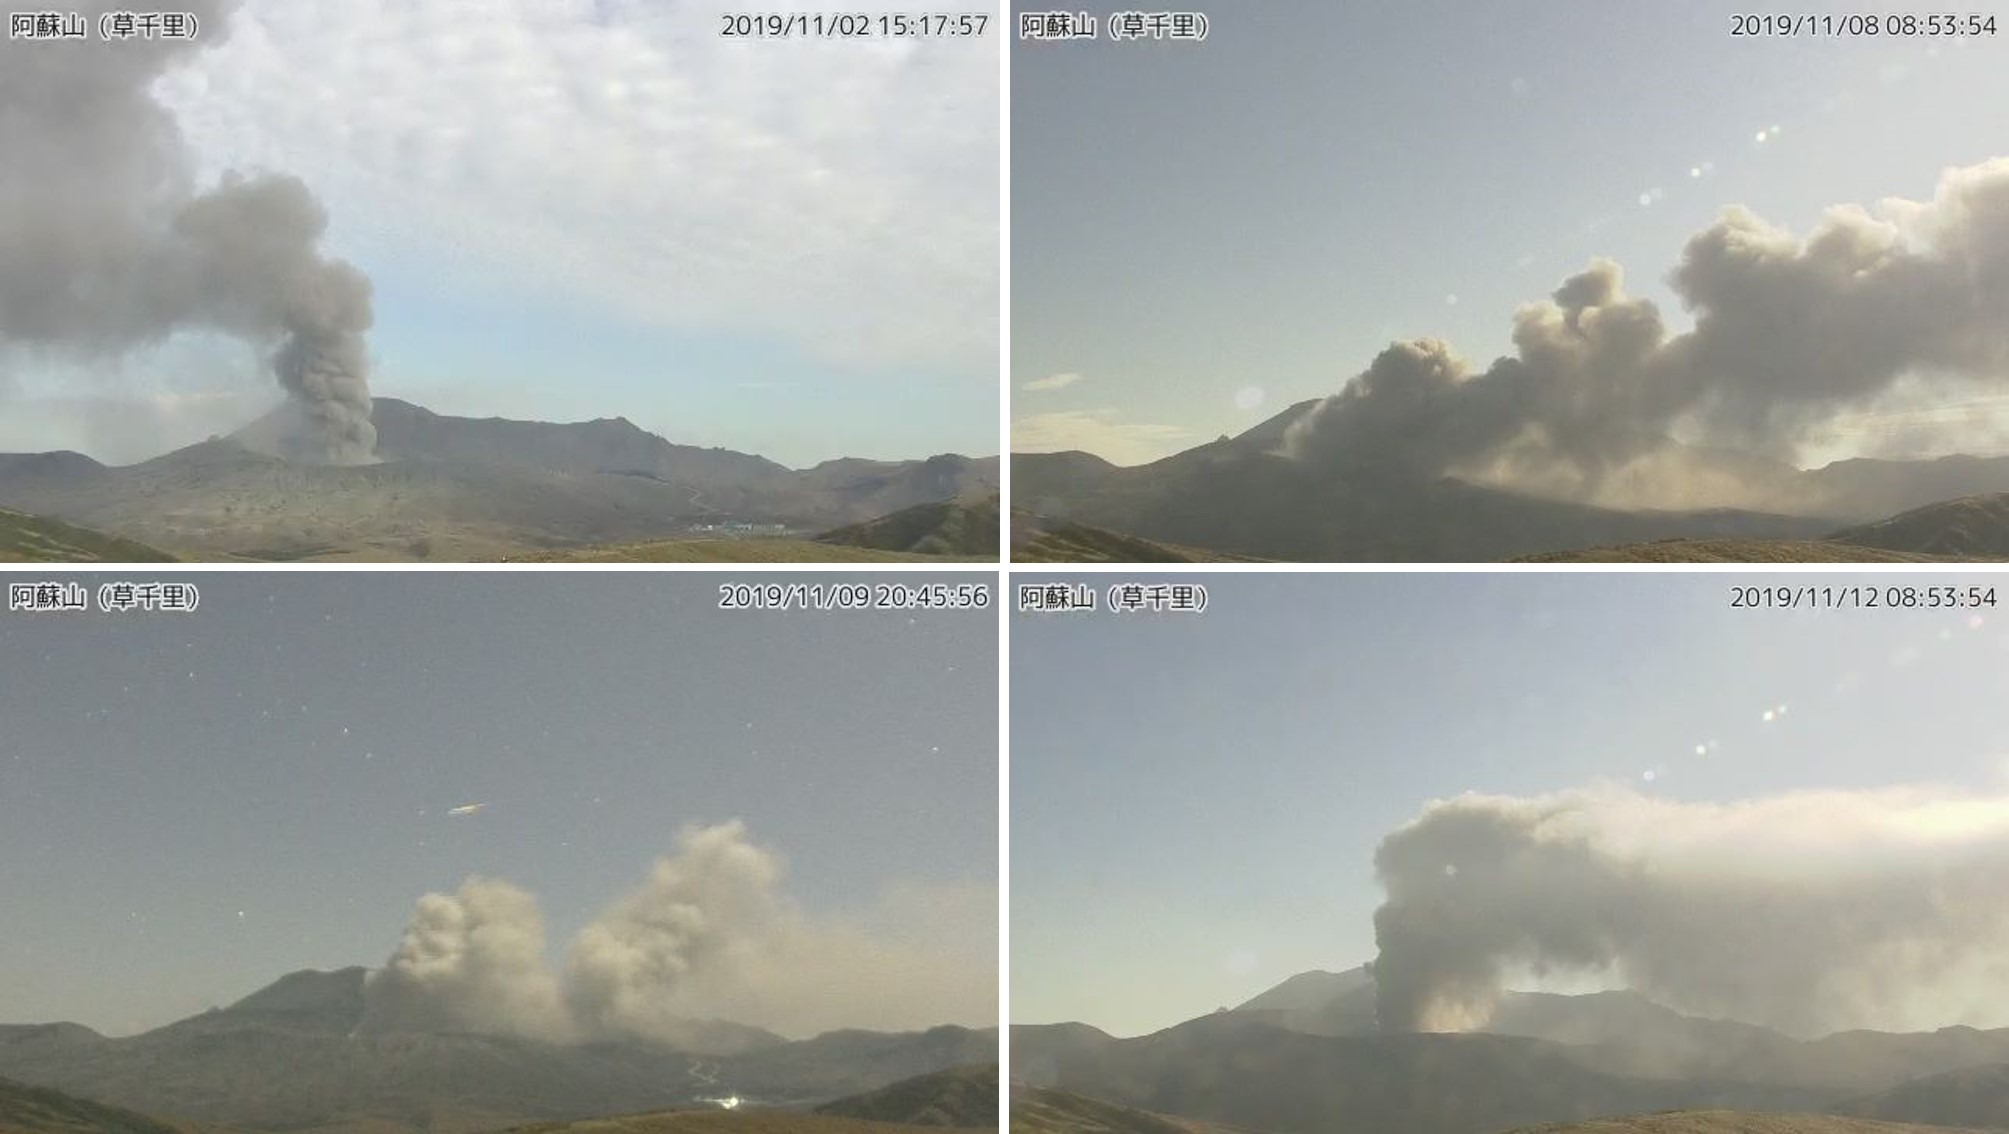 |
Figure 67. Examples of ash plumes at Asosan on 2, 8, 9, and 11 November 2019. The plume on 2 November reached 1.3 km above the crater rim. Kusasenri surveillance camera images courtesy of the Japan Meteorological Agency. |
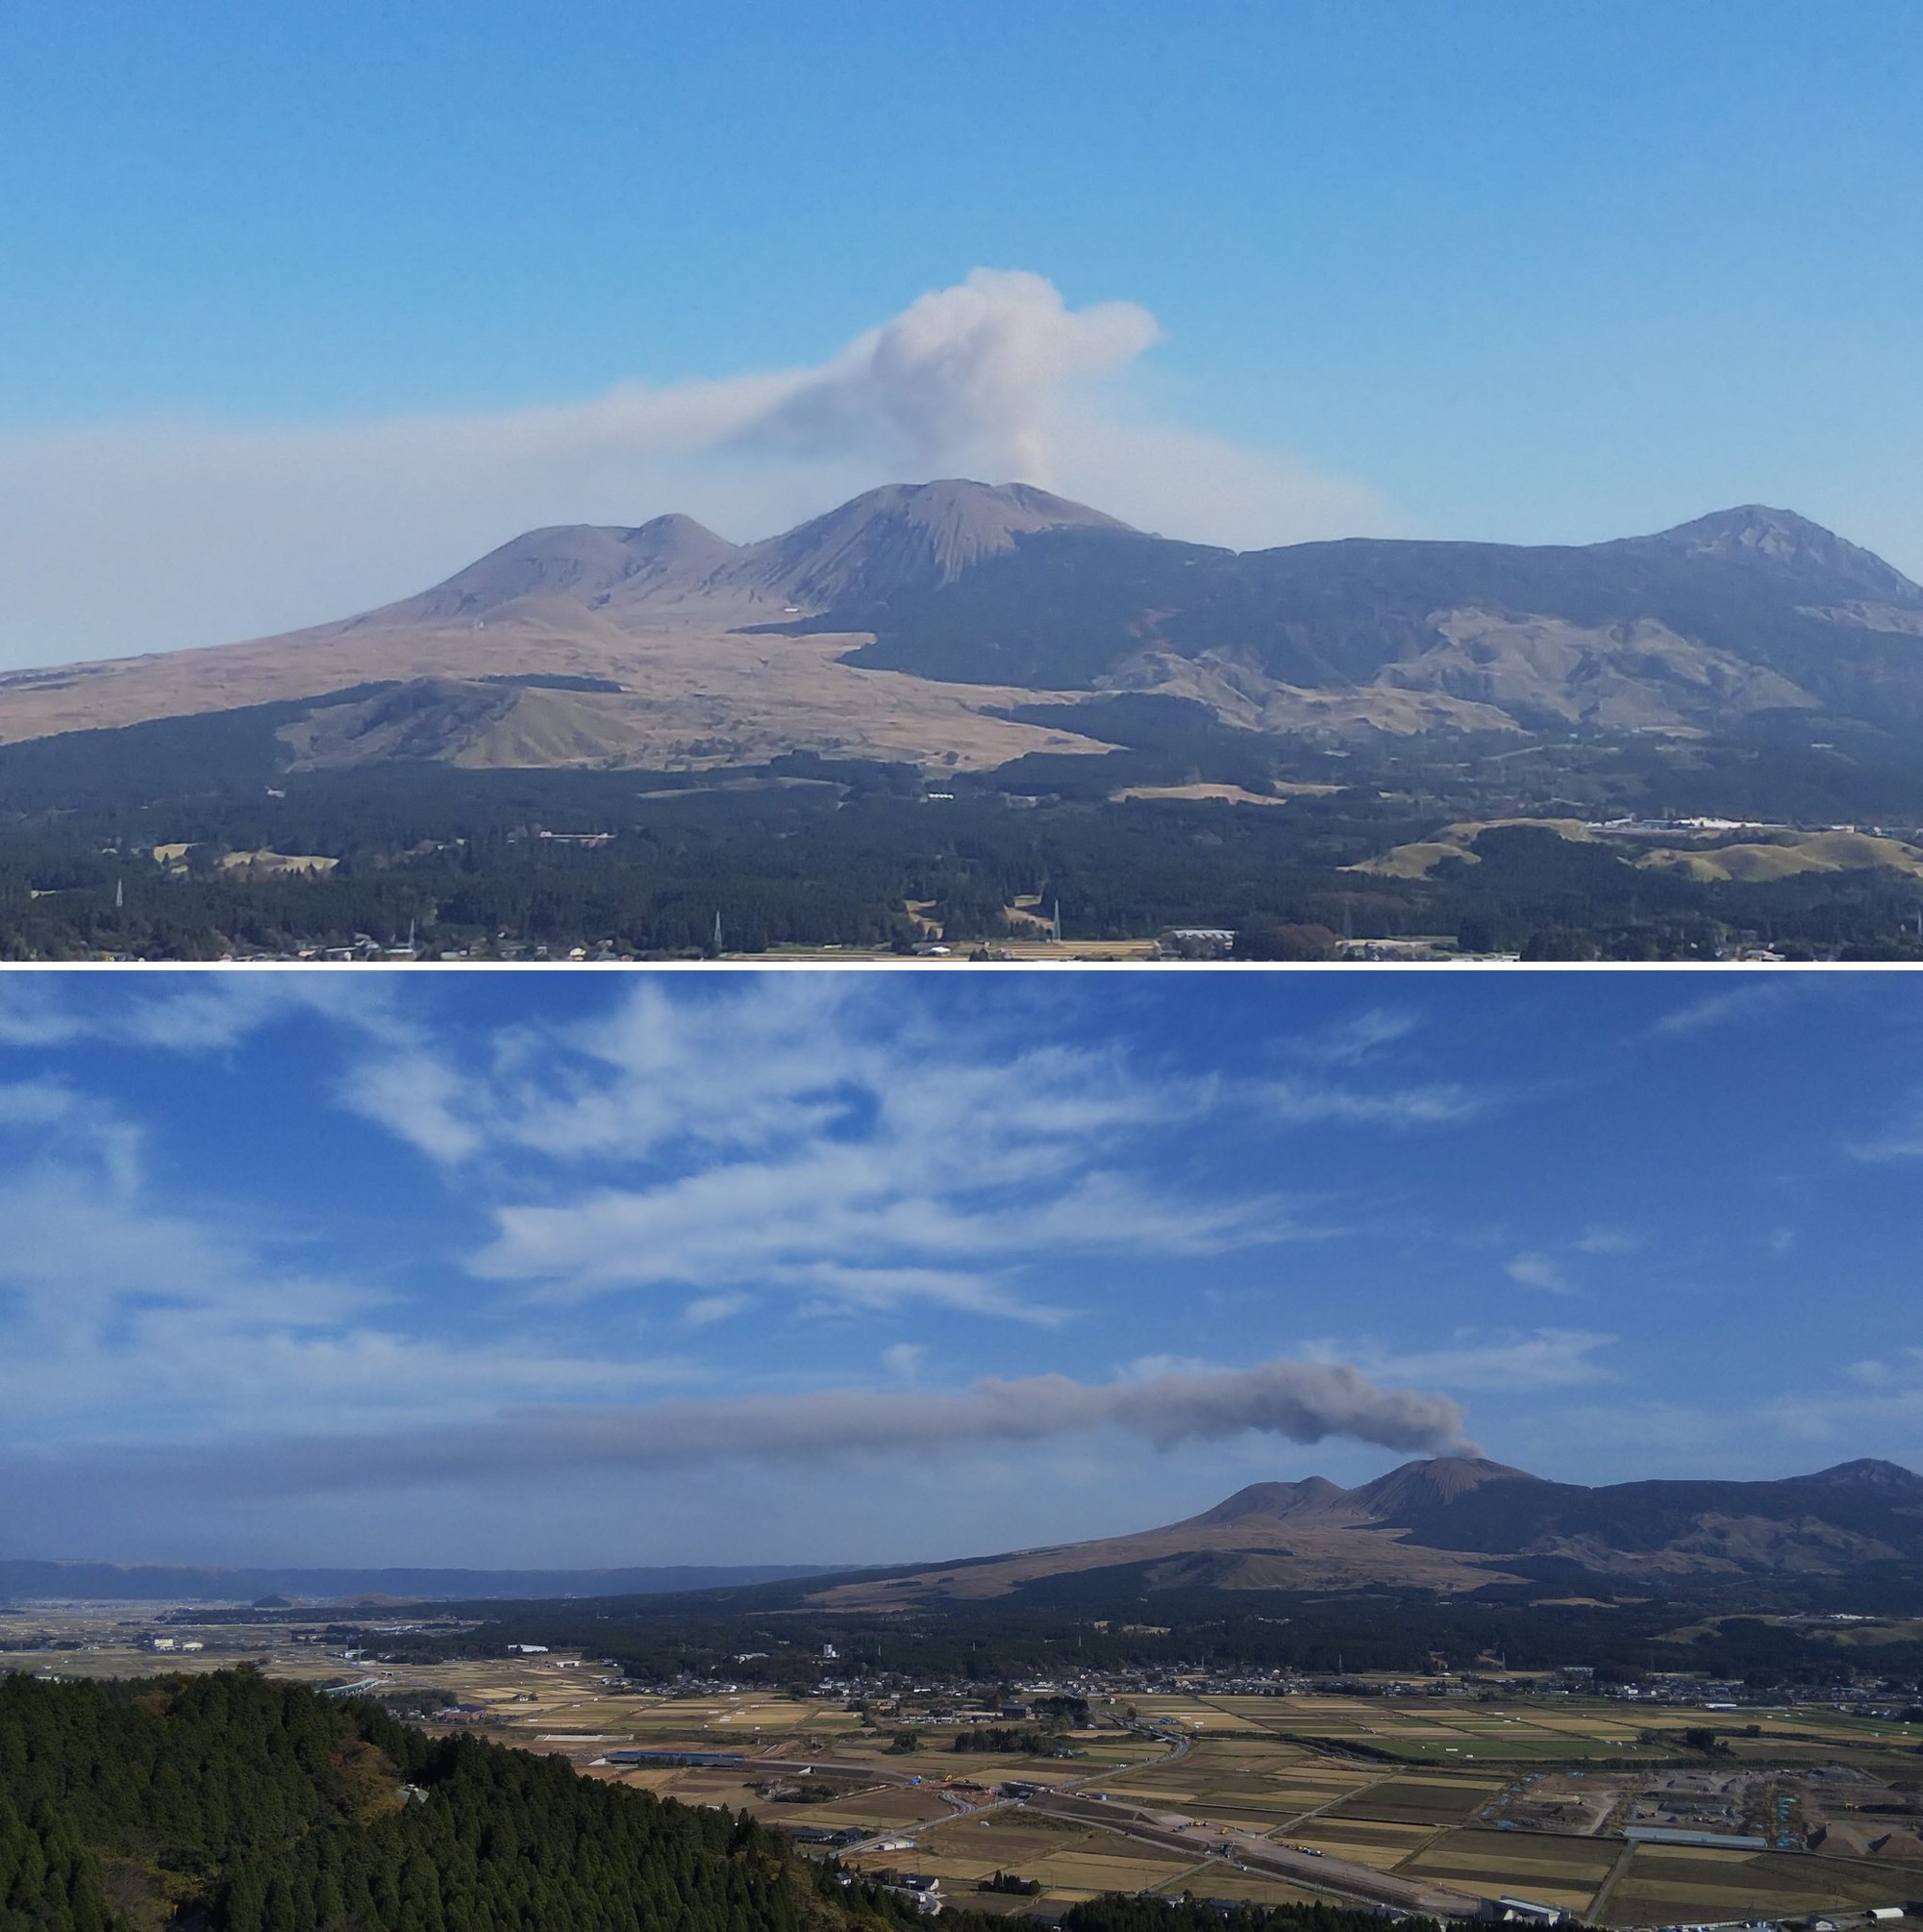 |
Figure 68. Ash emissions from the Nakadake crater at Asosan on 15 and 17 November 2019. The continuous ash emission is weak and is being dispersed by the wind. Copyright Mizumoto, used with permission. |
Throughout December activity remained elevated with ash plumes reaching 1.1 km above the Nakadake No. 1 crater and producing ashfall. The maximum gas plume height was 1.8 km above the crater. A total of 23 eruptions were recorded, and incandescence at the crater was observed through the month. Sulfur dioxide emissions continued to increase with 5,800 tons per day recorded on the 27th, and 7,400 tons per day recorded on the 31st.
Overall, eruptive activity has continued intermittently since 26 July and SO2 emissions have increased through the year. Incandescence was seen at the crater since 2 October and this is consistent with an increase in thermal energy detected by the MIROVA algorithm around that time (figure 69).
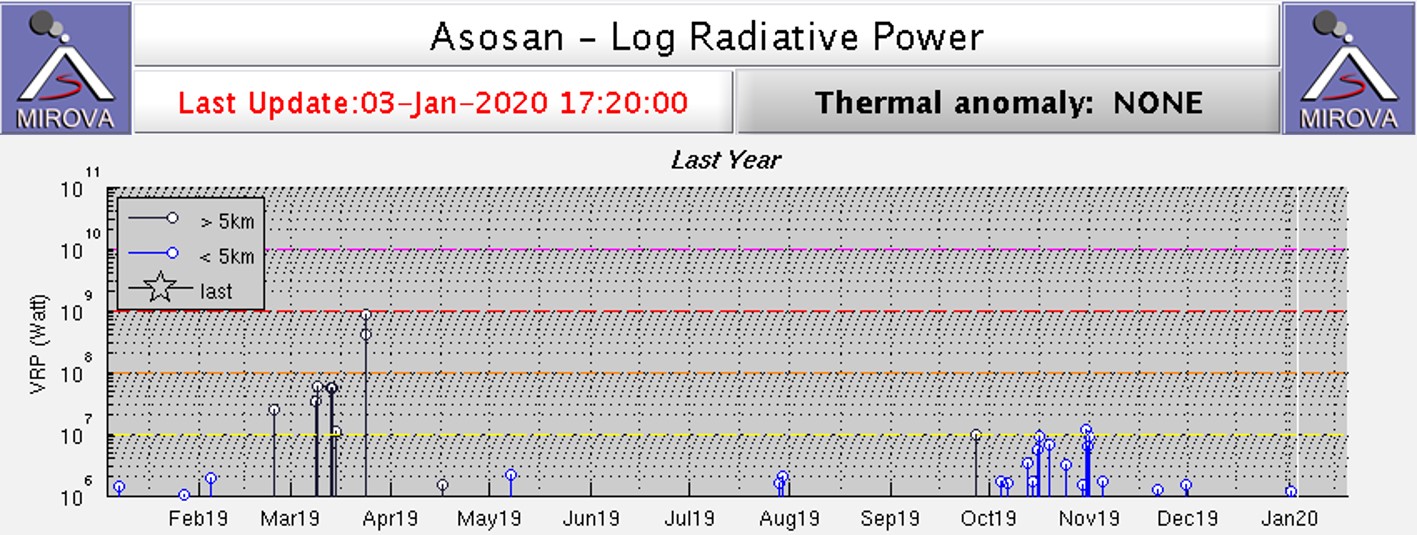 |
Figure 69. Thermal anomalies were low through 2019 with a notable increase around October to November. Log radiative power plot courtesy of MIROVA. |
Geological Summary. The 24-km-wide Asosan caldera was formed during four major explosive eruptions from 300,000 to 90,000 years ago. These produced voluminous pyroclastic flows that covered much of Kyushu. The last of these, the Aso-4 eruption, produced more than 600 km3 of airfall tephra and pyroclastic-flow deposits. A group of 17 central cones was constructed in the middle of the caldera, one of which, Nakadake, is one of Japan's most active volcanoes. It was the location of Japan's first documented historical eruption in 553 CE. The Nakadake complex has remained active throughout the Holocene. Several other cones have been active during the Holocene, including the Kometsuka scoria cone as recently as about 210 CE. Historical eruptions have largely consisted of basaltic to basaltic andesite ash emission with periodic strombolian and phreatomagmatic activity. The summit crater of Nakadake is accessible by toll road and cable car, and is one of Kyushu's most popular tourist destinations.
Information Contacts: Japan Meteorological Agency (JMA), 1-3-4 Otemachi, Chiyoda-ku, Tokyo 100-8122, Japan (URL: http://www.jma.go.jp/jma/indexe.html); Global Sulfur Dioxide Monitoring Page, Atmospheric Chemistry and Dynamics Laboratory, NASA Goddard Space Flight Center (NASA/GSFC), 8800 Greenbelt Road, Goddard, Maryland, USA (URL: https://so2.gsfc.nasa.gov/); MIROVA (Middle InfraRed Observation of Volcanic Activity), a collaborative project between the Universities of Turin and Florence (Italy) supported by the Centre for Volcanic Risk of the Italian Civil Protection Department (URL: http://www.mirovaweb.it/); Planet Labs, Inc. (URL: https://www.planet.com/); Mizumoto, Kumamoto, Kyushu, Japan (Twitter: https://twitter.com/hepomodeler); Volcanoverse (URL: https://www.youtube.com/channel/UCi3T_esus8Sr9I-3W5teVQQ).