Report on Manam (Papua New Guinea) — May 2020
Bulletin of the Global Volcanism Network, vol. 45, no. 5 (May 2020)
Managing Editor: Edward Venzke.
Edited by A. Elizabeth Crafford.
Manam (Papua New Guinea) Minor explosive activity, continued thermal activity, and SO2 emissions, October 2019-March 2020.
Please cite this report as:
Global Volcanism Program, 2020. Report on Manam (Papua New Guinea) (Crafford, A.E., and Venzke, E., eds.). Bulletin of the Global Volcanism Network, 45:5. Smithsonian Institution. https://doi.org/10.5479/si.GVP.BGVN202005-251020
Manam
Papua New Guinea
4.08°S, 145.037°E; summit elev. 1807 m
All times are local (unless otherwise noted)
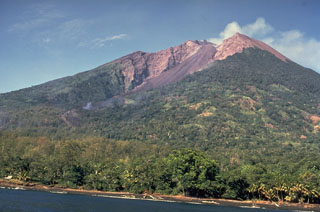
Manam is a basaltic-andesitic stratovolcano that lies 13 km off the northern coast of mainland Papua New Guinea; it has a 400-year history of recorded evidence for recurring low-level ash plumes, occasional Strombolian activity, lava flows, pyroclastic avalanches, and large ash plumes from Main and South, the two active summit craters. The current eruption, ongoing since June 2014, produced multiple large explosive eruptions during January-September 2019, including two 15-km-high ash plumes in January, repeated SO2 plumes each month, and another 15.2 km-high ash plume in June that resulted in ashfall and evacuations of several thousand people (BGVN 44:10).
This report covers continued activity during October 2019 through March 2020. Information about Manam is primarily provided by Papua New Guinea's Rabaul Volcano Observatory (RVO), part of the Department of Mineral Policy and Geohazards Management (DMPGM). This information is supplemented with aviation alerts from the Darwin Volcanic Ash Advisory Center (VAAC). MODIS thermal anomaly satellite data is recorded by the University of Hawai'i's MODVOLC thermal alert recording system, and the Italian MIROVA project; sulfur dioxide monitoring is done by instruments on satellites managed by NASA's Goddard Space Flight Center. Satellite imagery provided by the Sentinel Hub Playground is also a valuable resource for information about this remote location.
A few modest explosions with ash emissions were reported in early October and early November 2019, and then not again until late March 2020. Although there was little explosive activity during the period, thermal anomalies were recorded intermittently, with low to moderate activity almost every month, as seen in the MODIS data from MIROVA (figure 71) and also in satellite imagery. Sulfur dioxide emissions persisted throughout the period producing emissions greater than 2.0 Dobson Units that were recorded in satellite data 3-13 days each month.
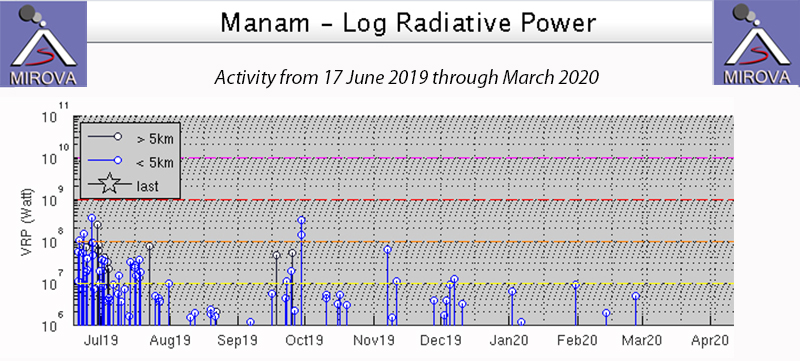 |
Figure 71. MIROVA thermal anomaly data for Manam from 17 June 2019 through March 2020 indicate continued low and moderate level thermal activity each month from August 2019 through February 2020, after a period of increased activity in June and early July 2019. Courtesy of MIROVA. |
The Darwin VAAC reported an ash plume in visible satellite imagery moving NW at 3.1 km altitude on 2 October 2019. Weak ash emissions were observed drifting N for the next two days along with an IR anomaly at the summit. RVO reported incandescence at night during the first week of October. Visitors to the summit on 18 October 2019 recorded steam and fumarolic activity at both of the summit craters (figure 72) and recent avalanche debris on the steep slopes (figure 73).
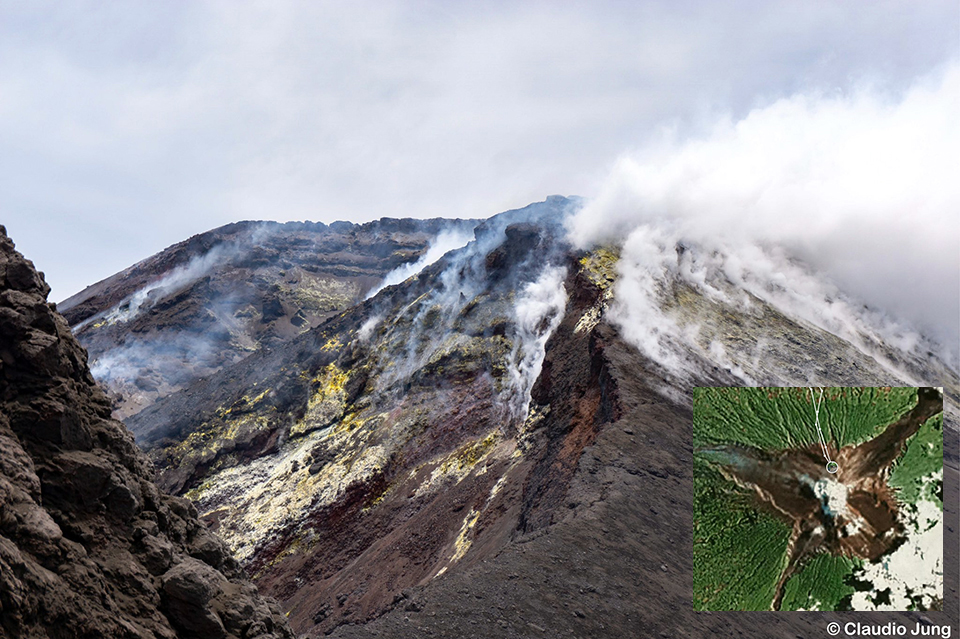 |
Figure 72. Steam and fumarolic activity rose from Main crater at Manam on 18 October 2019 in this view to the south from a ridge north of the crater. Google Earth inset of summit shows location of photograph. Courtesy of Vulkanologische Gesellschaft and Claudio Jung, used with permission. |
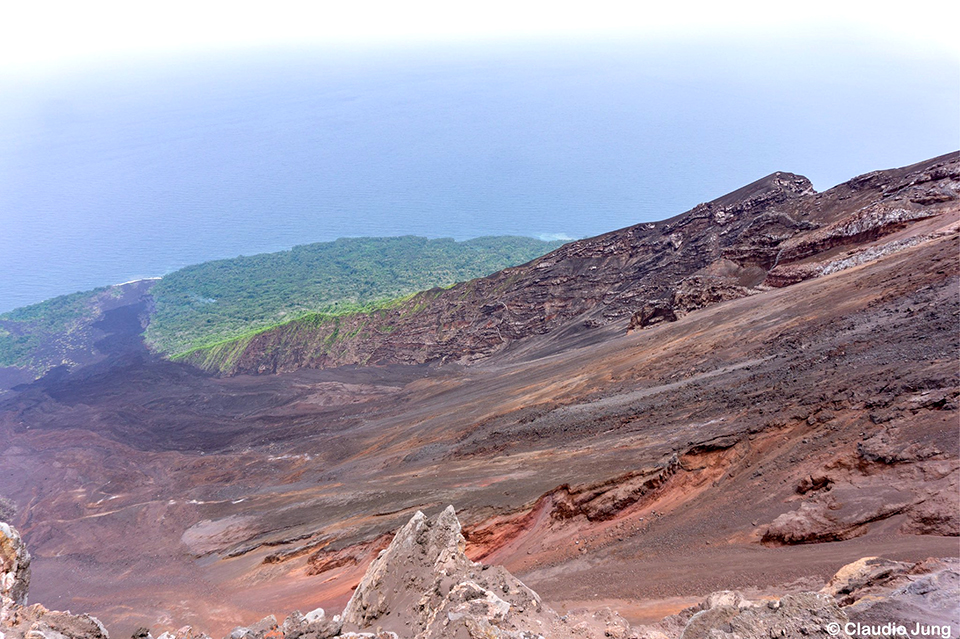 |
Figure 73. Volcanic debris covered an avalanche chute on the NE flank of Manam when visited by hikers on 18 October 2019. Courtesy of Vulkanologische Gesellschaft and Claudio Jung, used with permission. |
On 2 November, a single large explosion at 1330 local time produced a thick, dark ash plume that rose about 1,000 m above the summit and drifted NW. A shockwave from the explosion was felt at the Bogia Government station located 40 km SE on the mainland about 1 minute later. RVO reported an increase in seismicity on 6 November about 90 minutes before the start of a new eruption from the Main Crater which occurred between 1600 and 1630; it produced light to dark gray ash clouds that rose about 1,000 m above the summit and drifted NW. Incandescent ejecta was visible at the start of the explosion and continued with intermittent strong pulses after dark, reaching peak intensity around 1900. Activity ended by 2200 that evening. The Darwin VAAC reported a discrete emission observed in satellite imagery on 8 November that rose to 4.6 km altitude and drifted WNW, although ground observers confirmed that no eruption took place; emissions were only steam and gas. There were no further reports of explosive activity until the Darwin VAAC reported an ash emission in visible satellite imagery on 20 March 2020 that rose to 3.1 km altitude and drifted E for a few hours before dissipating.
Although explosive activity was minimal during the period, SO2 emissions, and evidence for continued thermal activity were recorded by satellite instruments each month. The TROPOMI instrument on the Sentinel-5P satellite captured evidence each month of SO2 emissions exceeding two Dobson Units (figure 74). The most SO2 activity occurred during October 2019, with 13 days of signatures over 2.0 DU. There were six days of elevated SO2 each month in November and December, and five days in January 2020. During February and March, activity was less, with smaller SO2 plumes recording more than 2.0 DU on three days each month. Sentinel-2 satellite imagery recorded thermal anomalies at least once from one or both of the summit craters each month between October 2019 and March 2020 (figure 75).
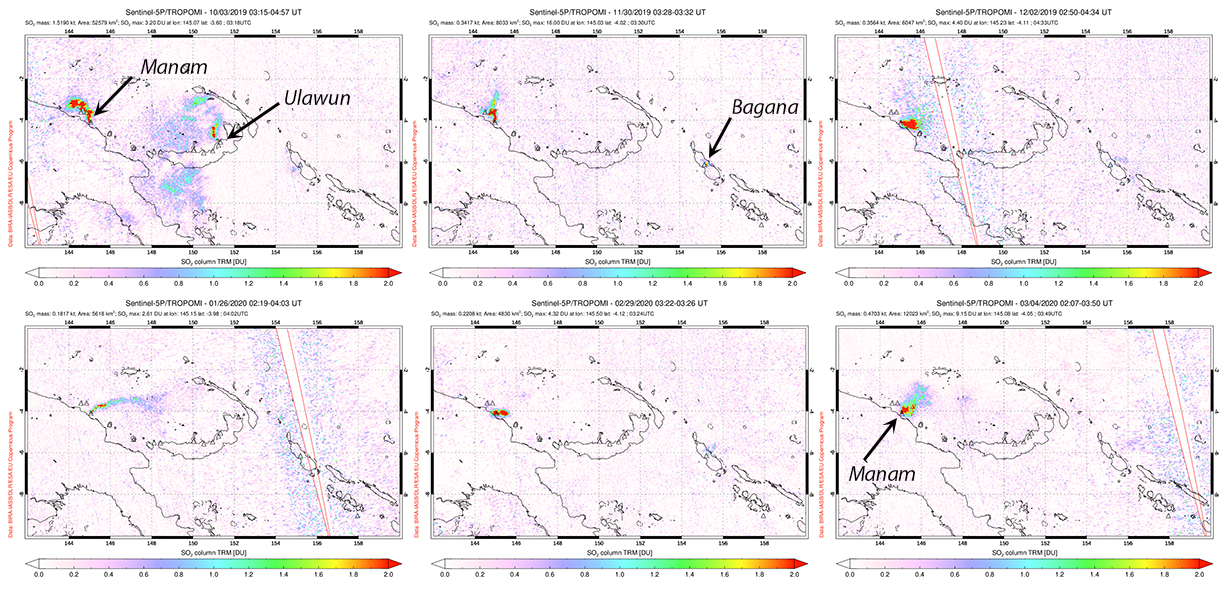 |
Figure 74. SO2 emissions at Manam exceeded 2 Dobson Units multiple days each month between October 2019 and March 2020. On 3 October 2019 (top left) emissions were also measured from Ulawun located 700 km E on New Britain island. On 30 November 2019 (top middle), in addition to a plume drifting N from Manam, a small SO2 plume was detected at Bagana on Bougainville Island, 1150 km E. The plume from Manam on 2 December 2019 drifted ESE (top right). On 26 January 2020 the plume drifted over 300 km E (bottom left). The plumes measured on 29 February and 4 March 2020 (bottom middle and right) only drifted a few tens of kilometers before dissipating. Courtesy of NASA Global Sulfur Dioxide Monitoring Page. |
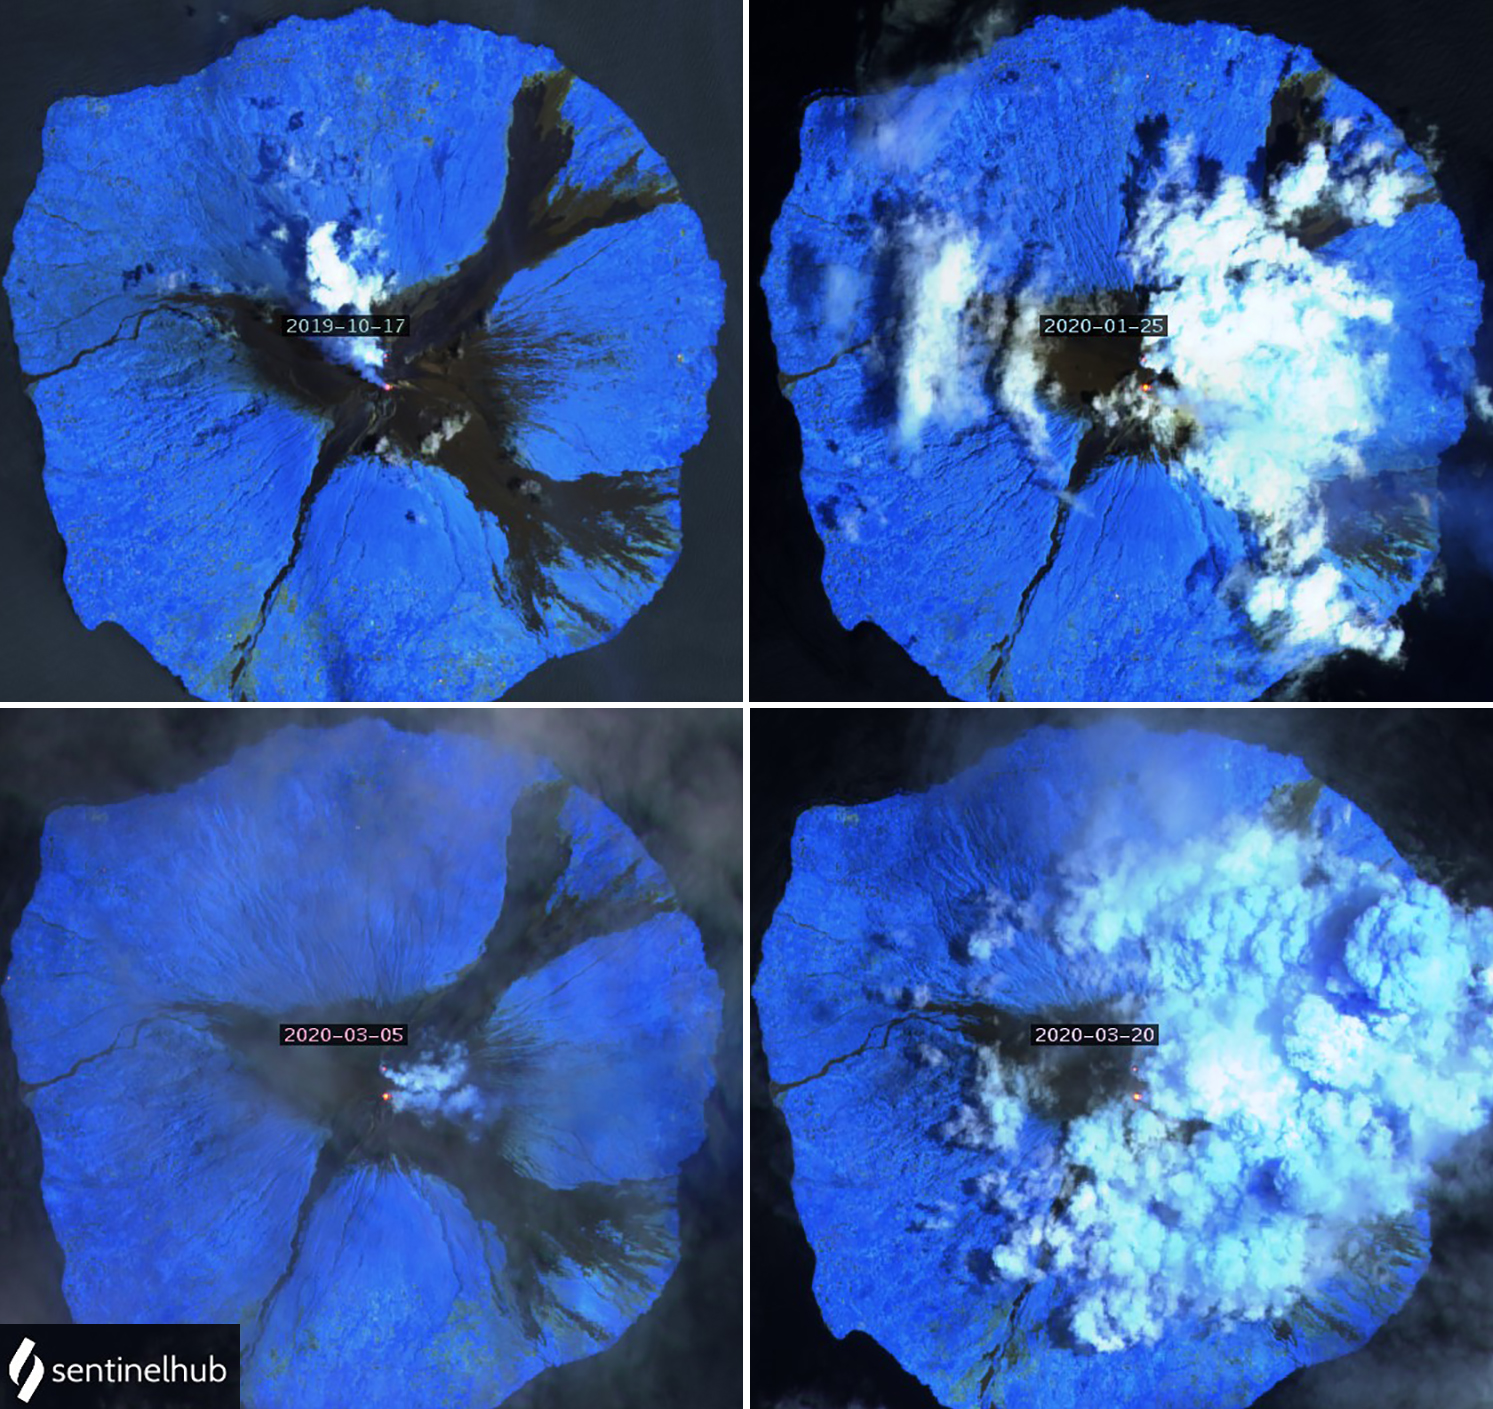 |
Figure 75. Sentinel-2 satellite imagery with Atmospheric penetration rendering (bands 12, 11, and 8a) showed thermal anomalies at one or both of Manam’s summit craters each month during October 2019-March 2020. On 17 October 2019 (top left) a bright anomaly and weak gas plume drifted NW from South crater, while a dense steam plume and weak anomaly were present at Main crater. On 25 January 2020 (top right) the gas and steam from the two craters were drifting E; the weaker Main crater thermal anomaly is just visible at the edge of the clouds. A clear image on 5 March 2020 (bottom left) shows weak plumes and distinct thermal anomalies from both craters; on 20 March (bottom right) the anomalies are still visible through dense cloud cover that may include steam from the crater vents as well. Courtesy of Sentinel Hub Playground. |
Geological Summary. The 10-km-wide island of Manam, lying 13 km off the northern coast of mainland Papua New Guinea, is one of the country's most active volcanoes. Four large radial valleys extend from the unvegetated summit of the conical basaltic-andesitic stratovolcano to its lower flanks. These valleys channel lava flows and pyroclastic avalanches that have sometimes reached the coast. Five small satellitic centers are located near the island's shoreline on the northern, southern, and western sides. Two summit craters are present; both are active, although most observed eruptions have originated from the southern crater, concentrating eruptive products during much of the past century into the SE valley. Frequent eruptions, typically of mild-to-moderate scale, have been recorded since 1616. Occasional larger eruptions have produced pyroclastic flows and lava flows that reached flat-lying coastal areas and entered the sea, sometimes impacting populated areas.
Information Contacts: Rabaul Volcano Observatory (RVO), Geohazards Management Division, Department of Mineral Policy and Geohazards Management (DMPGM), PO Box 3386, Kokopo, East New Britain Province, Papua New Guinea; Darwin Volcanic Ash Advisory Centre (VAAC), Bureau of Meteorology, Northern Territory Regional Office, PO Box 40050, Casuarina, NT 0811, Australia (URL: http://www.bom.gov.au/info/vaac/); MIROVA (Middle InfraRed Observation of Volcanic Activity), a collaborative project between the Universities of Turin and Florence (Italy) supported by the Centre for Volcanic Risk of the Italian Civil Protection Department (URL: http://www.mirovaweb.it/); Global Sulfur Dioxide Monitoring Page, Atmospheric Chemistry and Dynamics Laboratory, NASA Goddard Space Flight Center (NASA/GSFC), 8800 Greenbelt Road, Goddard, Maryland, USA (URL: https://so2.gsfc.nasa.gov/); Sentinel Hub Playground (URL: https://www.sentinel-hub.com/explore/sentinel-playground); Vulkanologische Gesellschaft (URL: https://twitter.com/vulkanologen/status/1194228532219727874, https://twitter.com/vulkanologen/status/1193788836679225344); Claudio Jung, (URL: https://www.facebook.com/claudio.jung.1/posts/10220075272173895, https://www.instagram.com/jung.claudio/).