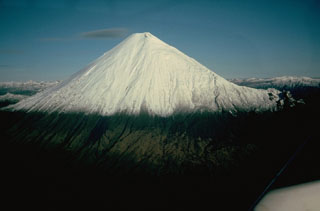
Sangay
Ecuador
2.005°S, 78.341°W; summit elev. 5286 m
All times are local (unless otherwise noted)
Sangay is one of the most active volcanoes in Ecuador with the current eruptive period continuing since 26 March 2019. Activity at the summit crater has been frequent since August 1934, with short quiet periods between events. Recent activity has included frequent ash plumes, lava flows, pyroclastic flows, and lahars. This report summarizes activity during July through December 2020, based on reports by Ecuador's Instituto Geofísico, Escuela Politécnica Nacional (IG-EPN), ash advisories issued by the Washington Volcanic Ash Advisory Center (VAAC), webcam images taken by Servicio Integrado de Seguridad ECU911, and various satellite data.
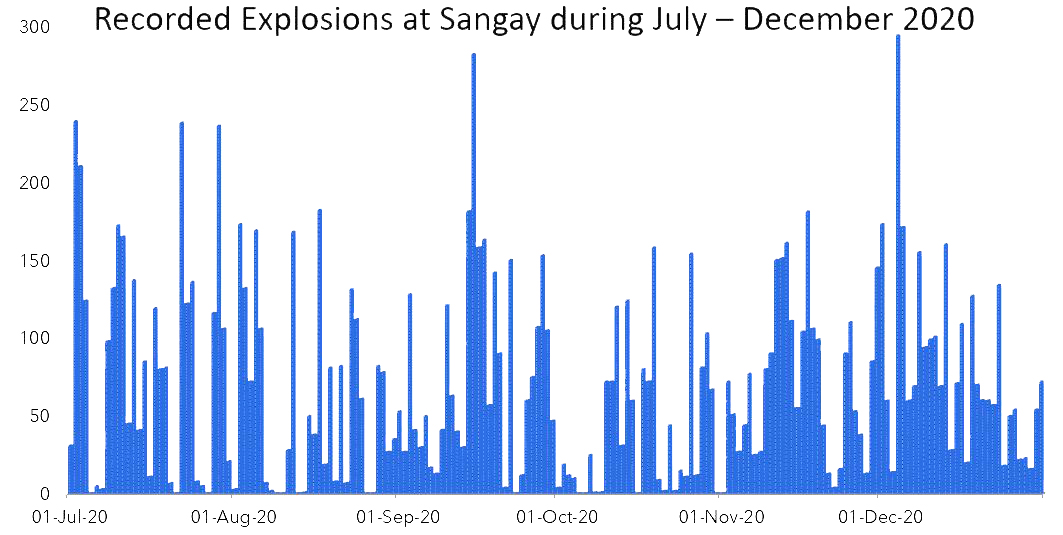
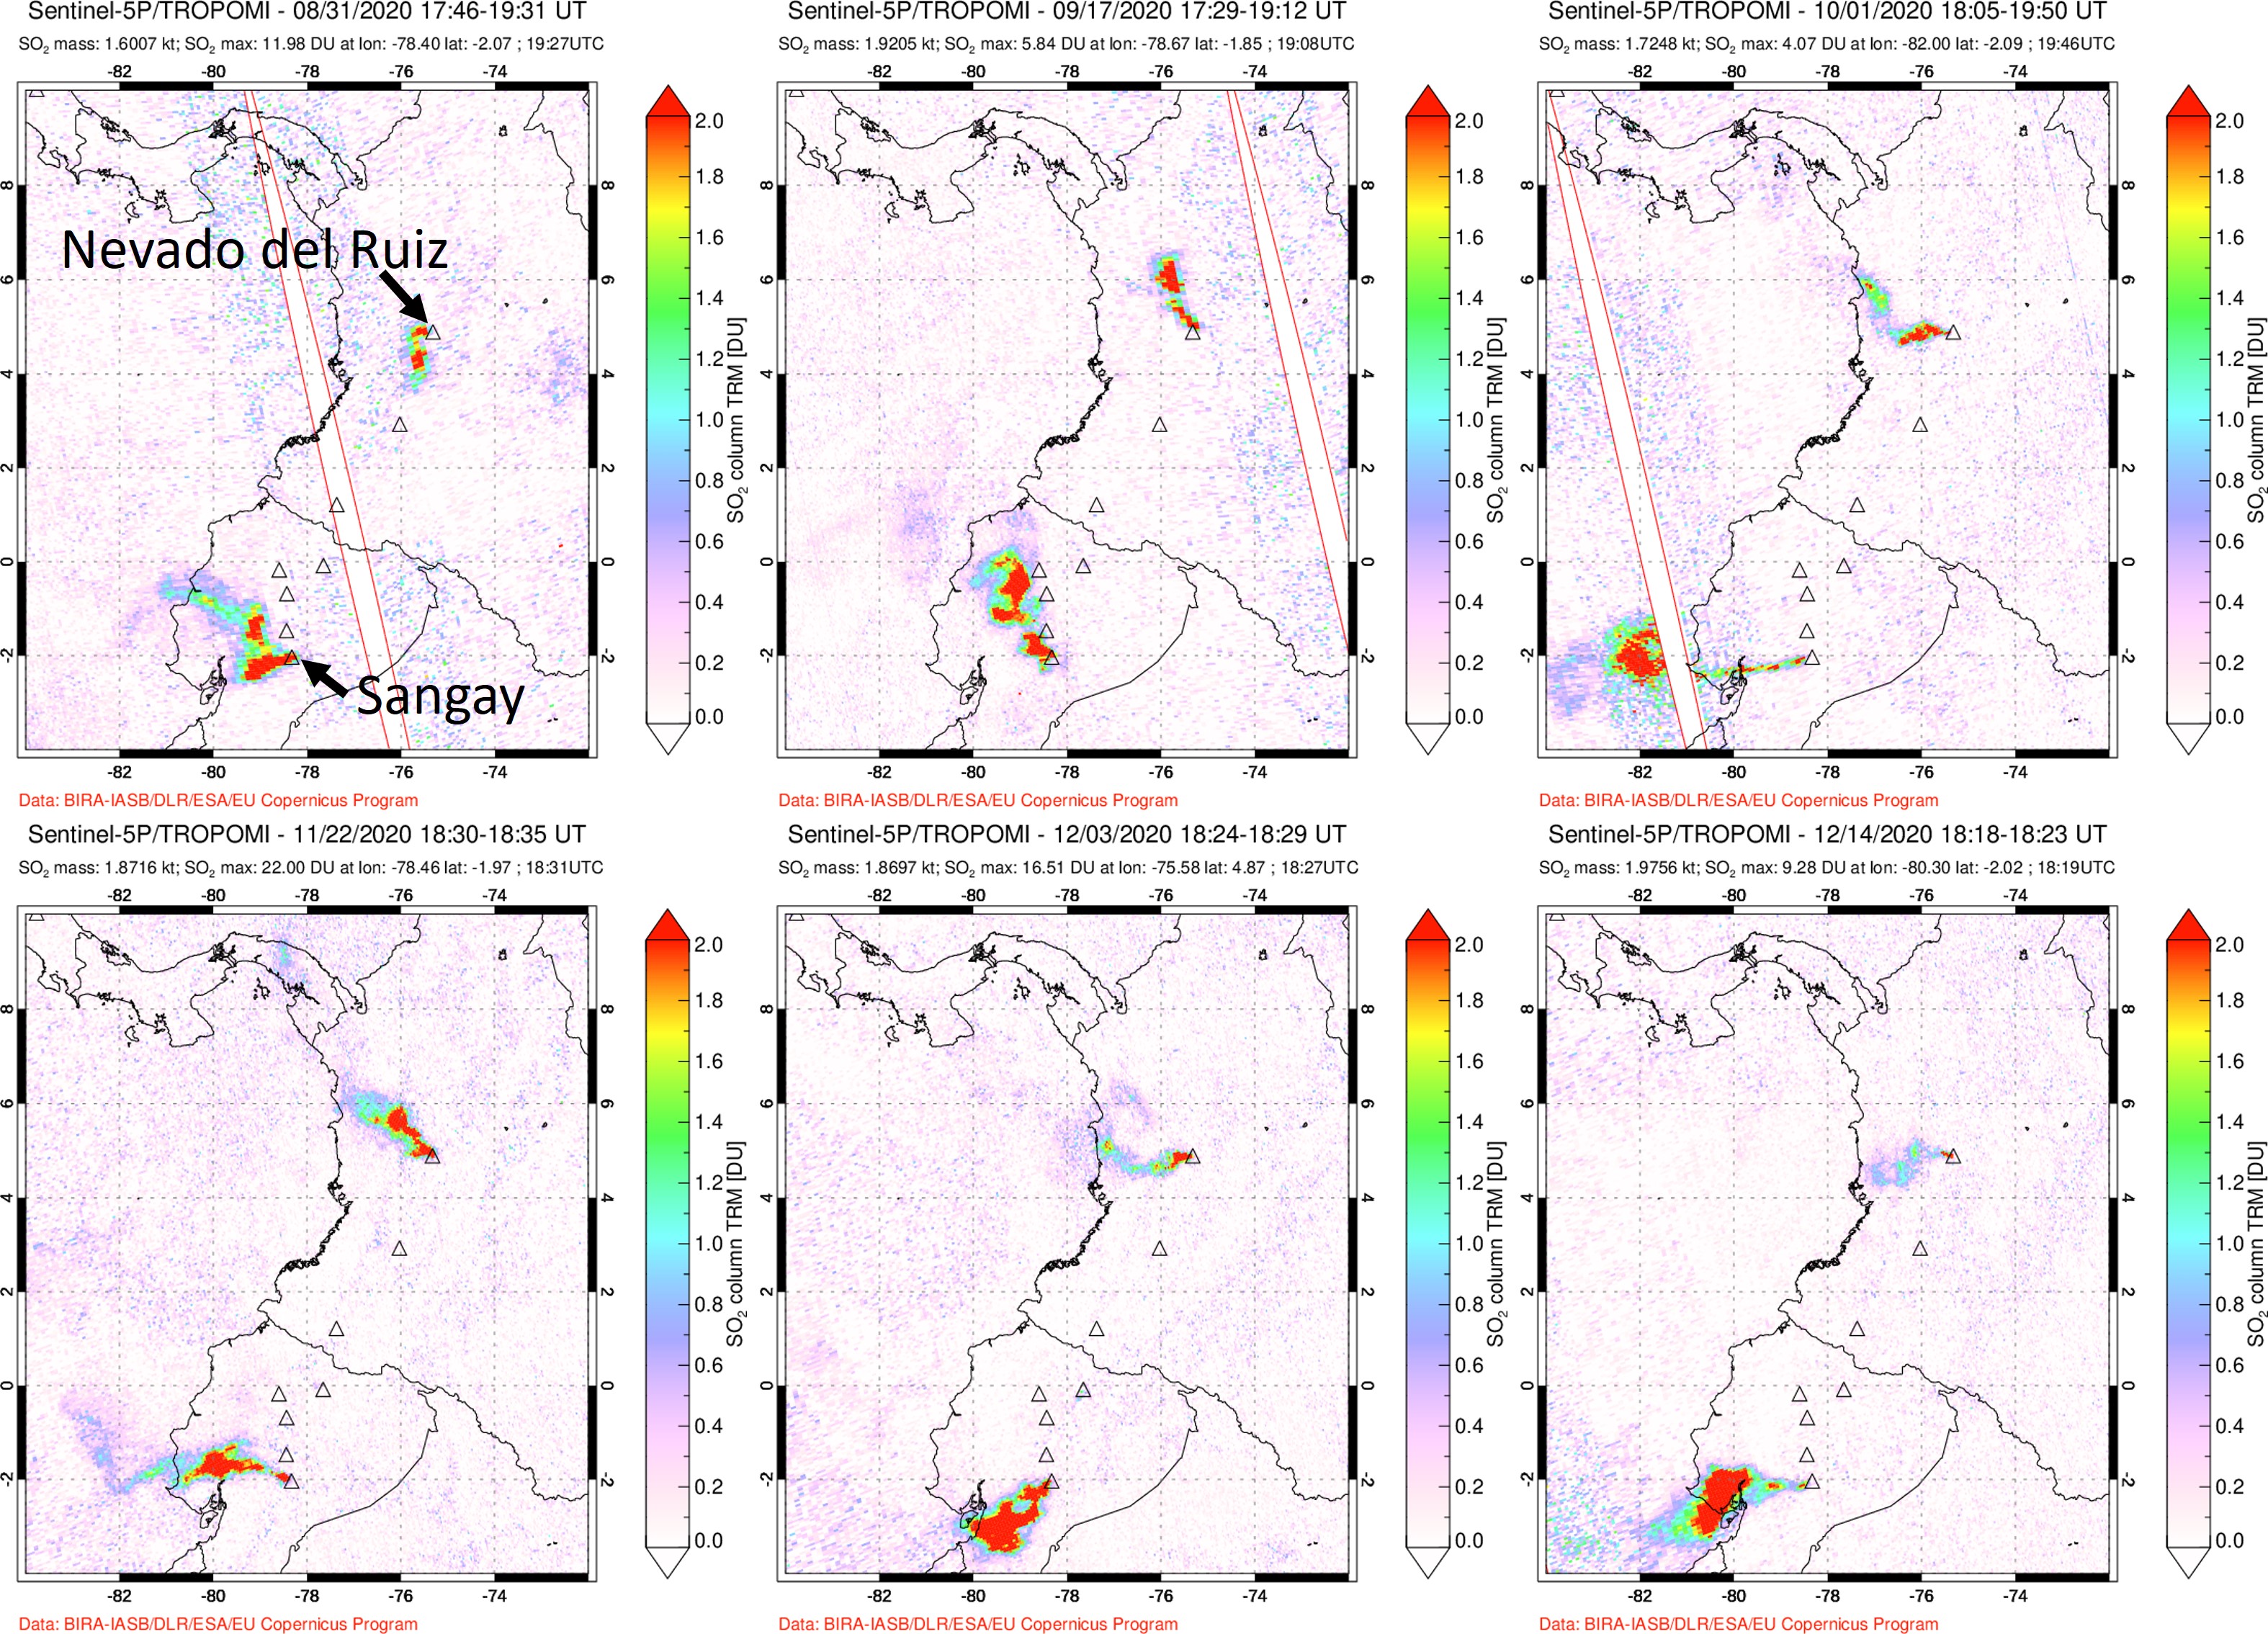
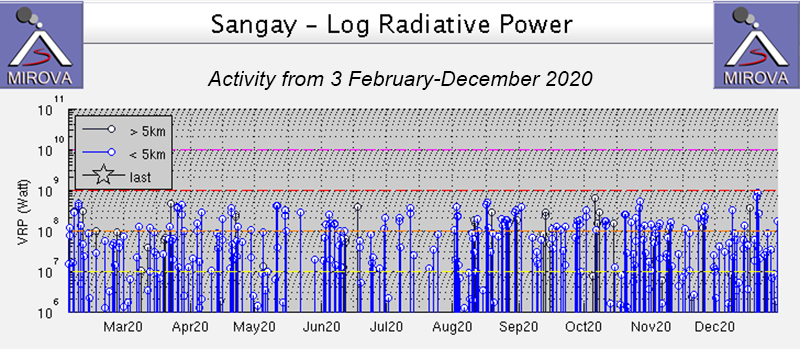
Overall activity remained elevated during the report period. Recorded explosions were variable during July through December, ranging from no explosions to 294 reported on 4 December (figure 80), and dispersing mostly to the W and SW. SO2 was frequently detected using satellite data (figure 81) and was reported several times to be emitting between about 770 and 2,850 tons/day. Elevated temperatures at the crater and down the SE flank were frequently observed in satellite data (figure 82), and less frequently by visual observation of incandescence. Seismic monitoring detected lahars associated with rainfall events remobilizing deposits emplaced on the flanks throughout this period.
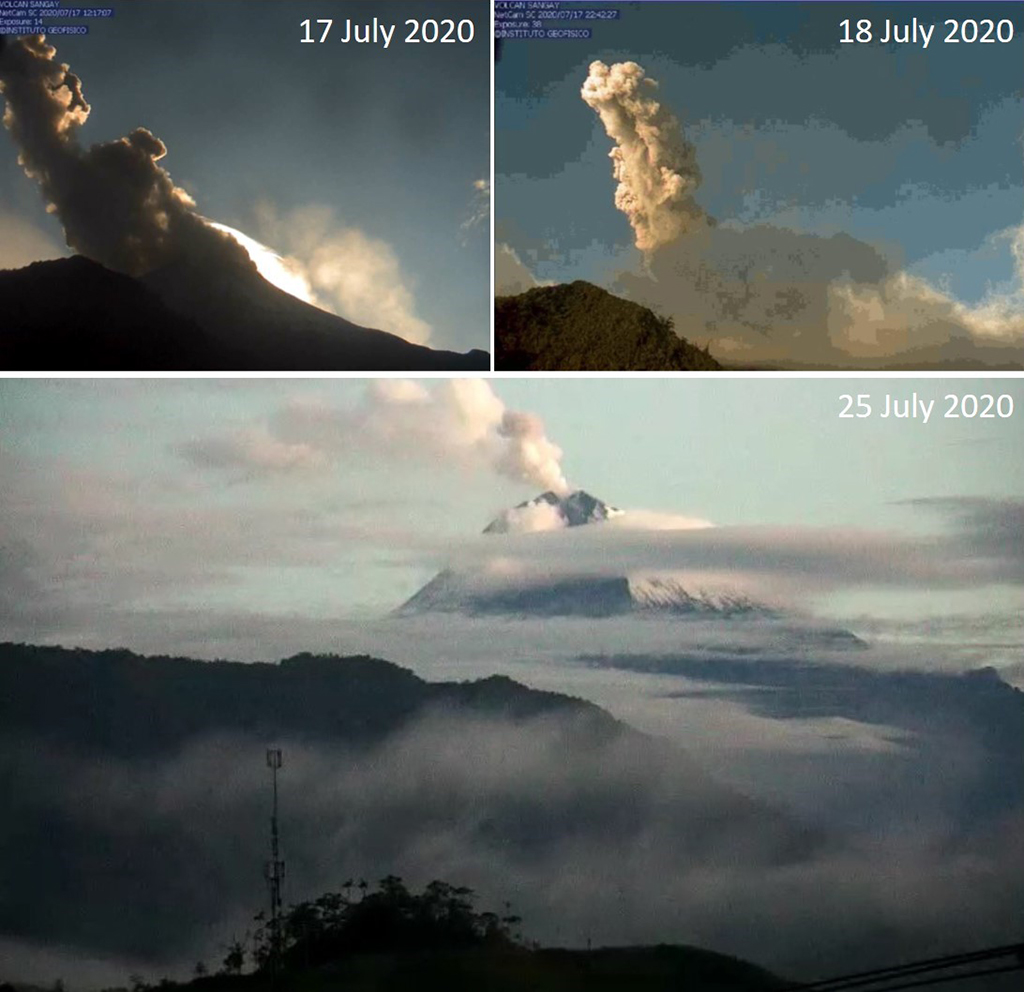
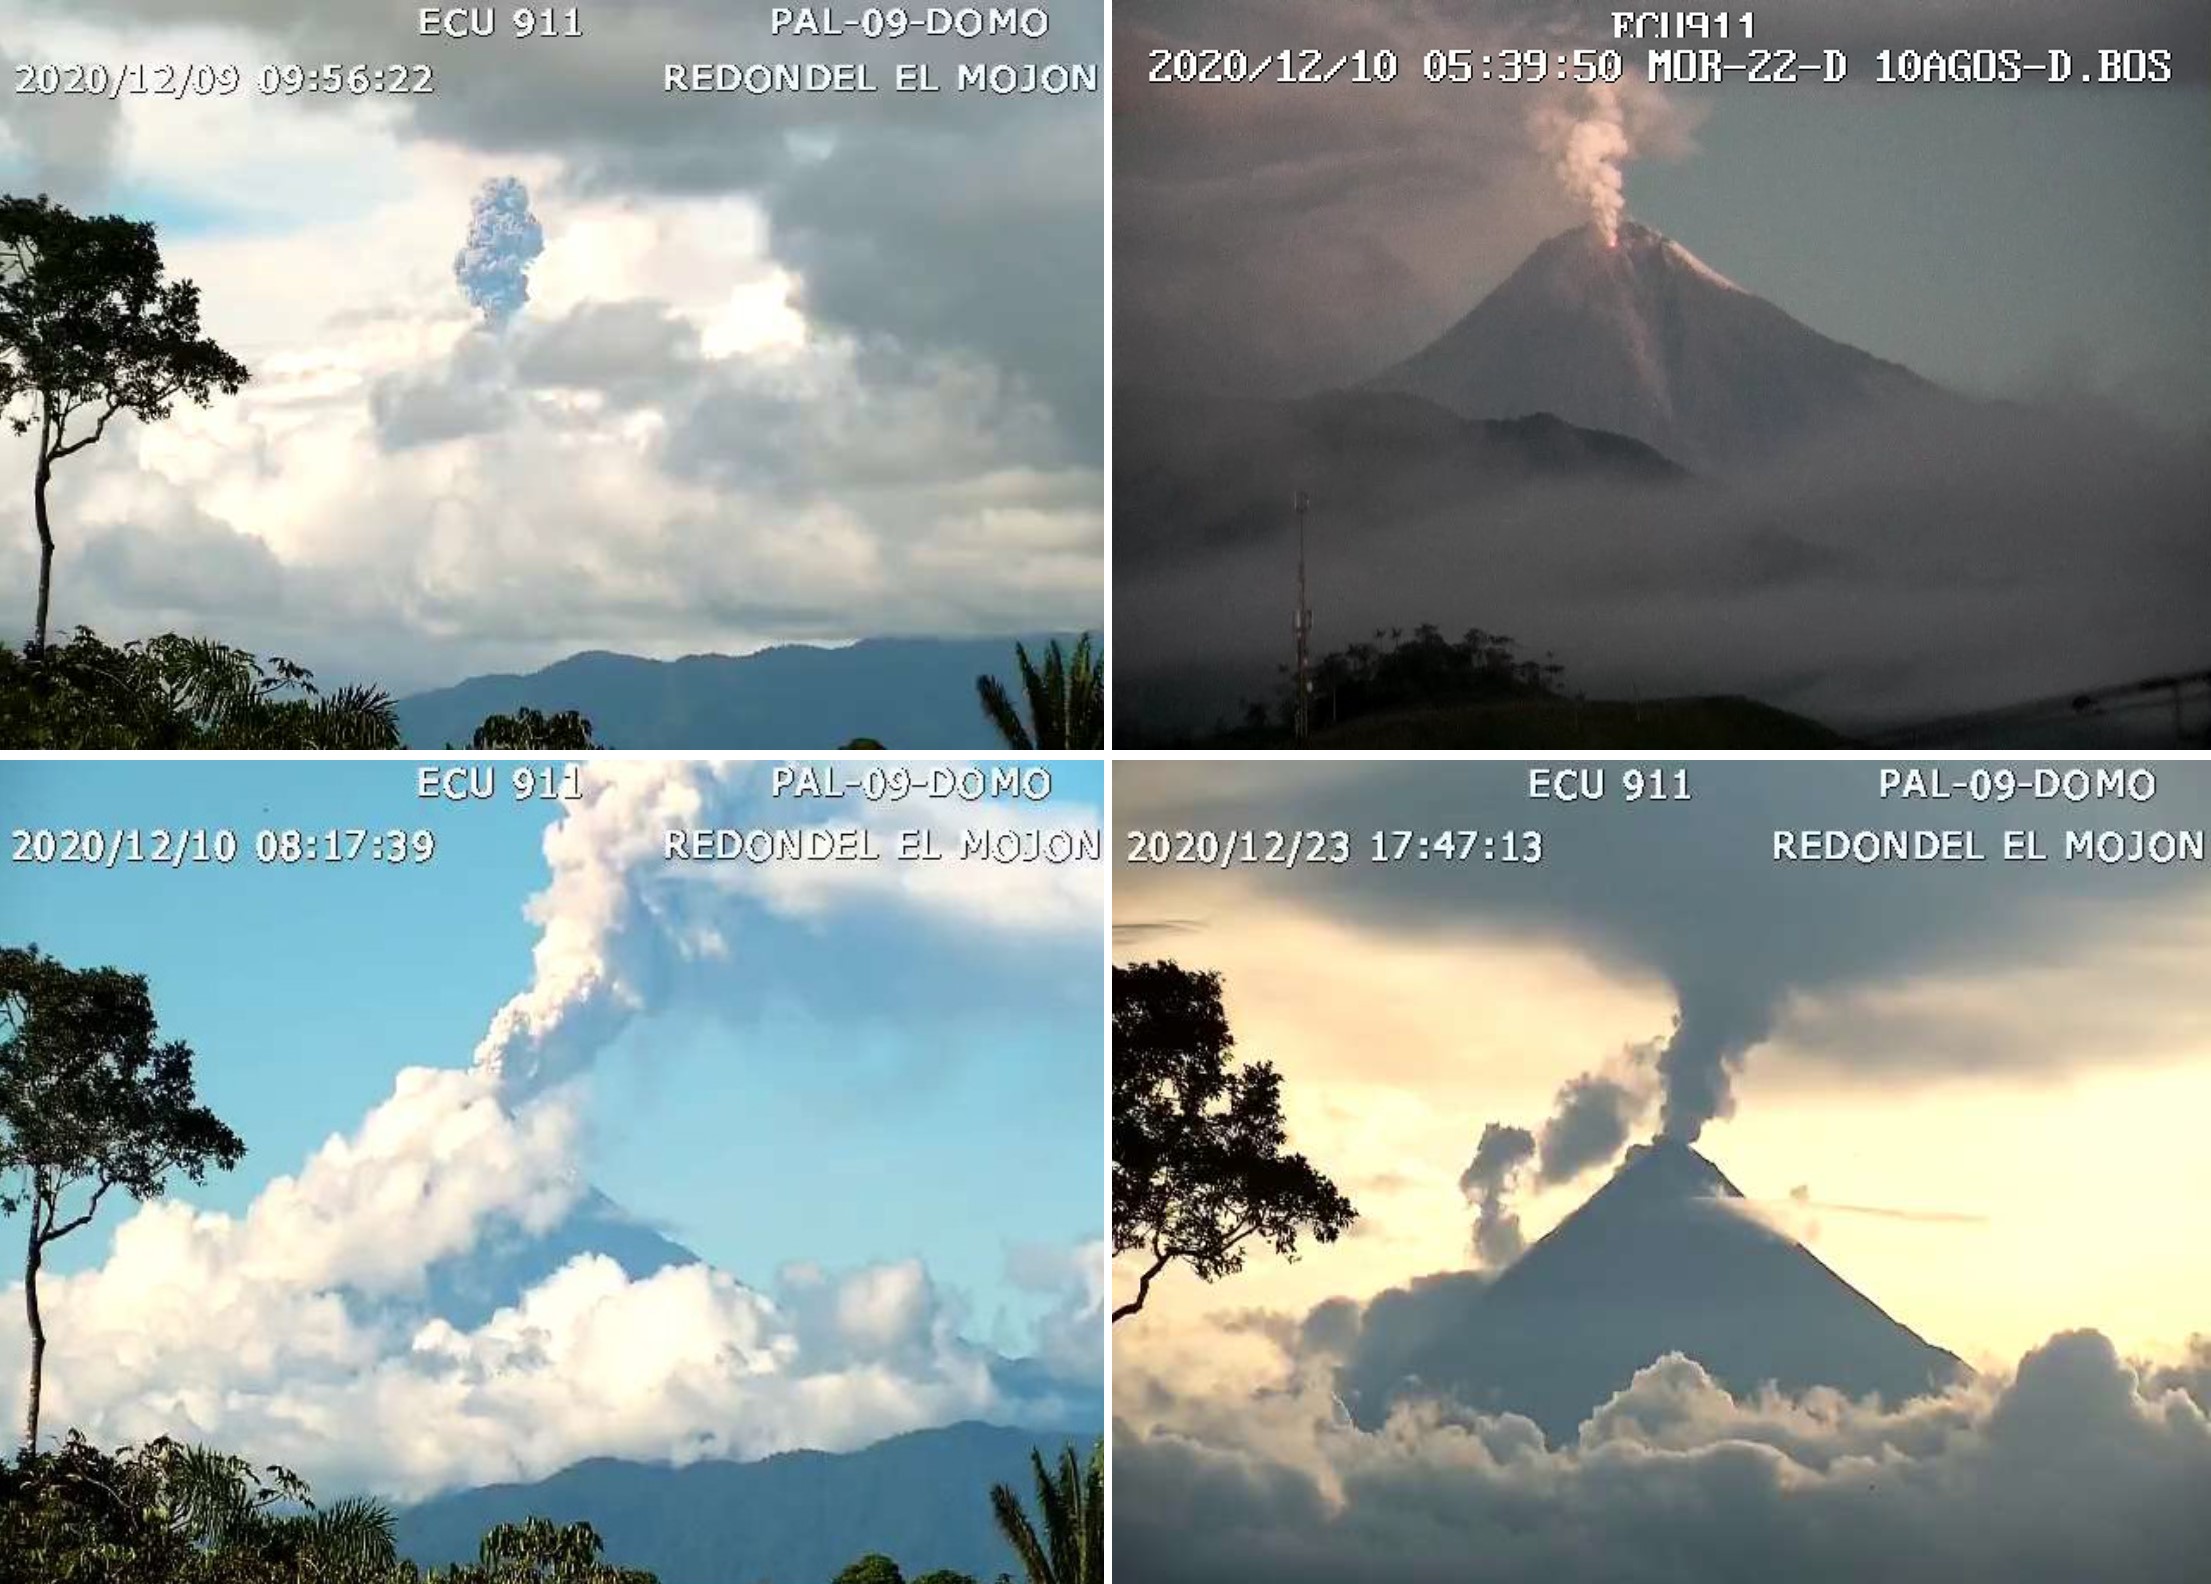
Activity during July-August 2020. During July activity continued with frequent ash and gas emission recorded through observations when clouds weren’t obstructing the view of the summit, and Washington VAAC alerts. There were between one and five VAAC alerts issued most days, with ash plumes reaching 570 to 1,770 m above the crater and dispersing mostly W and SE, and NW on two days (figure 83). Lahar seismic signals were recorded on the 1st, 7th, three on the 13th, and one on the 19th.
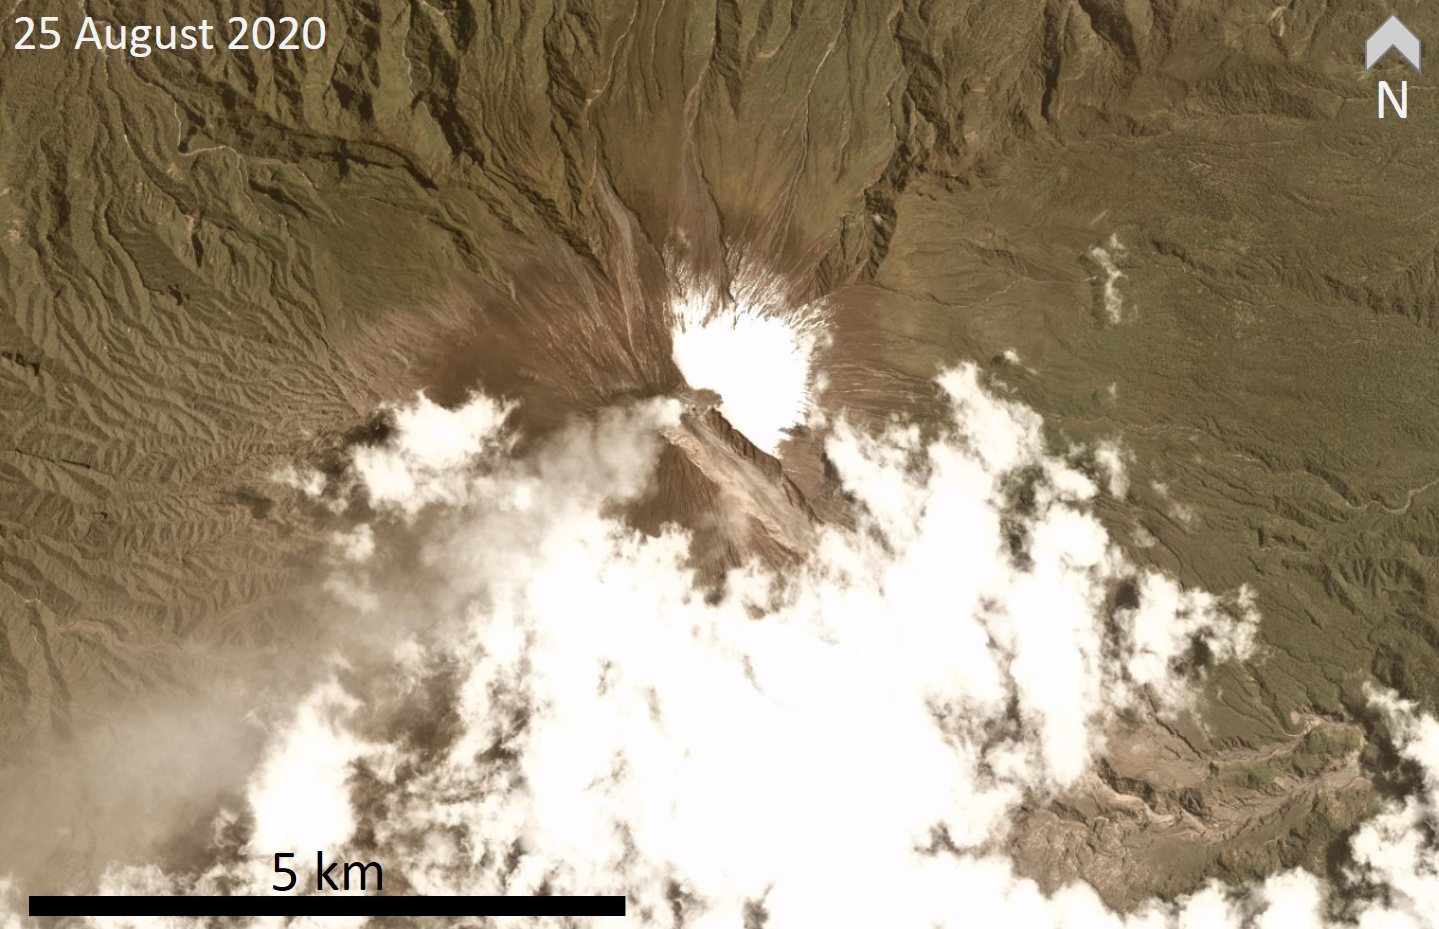
During August there were between one and five VAAC alerts issued most days, with ash plumes reaching 600 to 2,070 m above the crater and predominantly dispersing W, SW, and occasionally to the NE, S, and SE (figure 84). There were reports of ashfall in the Alausí sector on the 24th. Using seismic data analysis, lahar signals were identified after rainfall on 1, 7, 11-14, and 21 August. A lava flow was seen moving down the eastern flank on the night of the 15th, resulting in a high number of thermal alerts. A pyroclastic flow was reported descending the SE flank at 0631 on the 27th (figure 85).
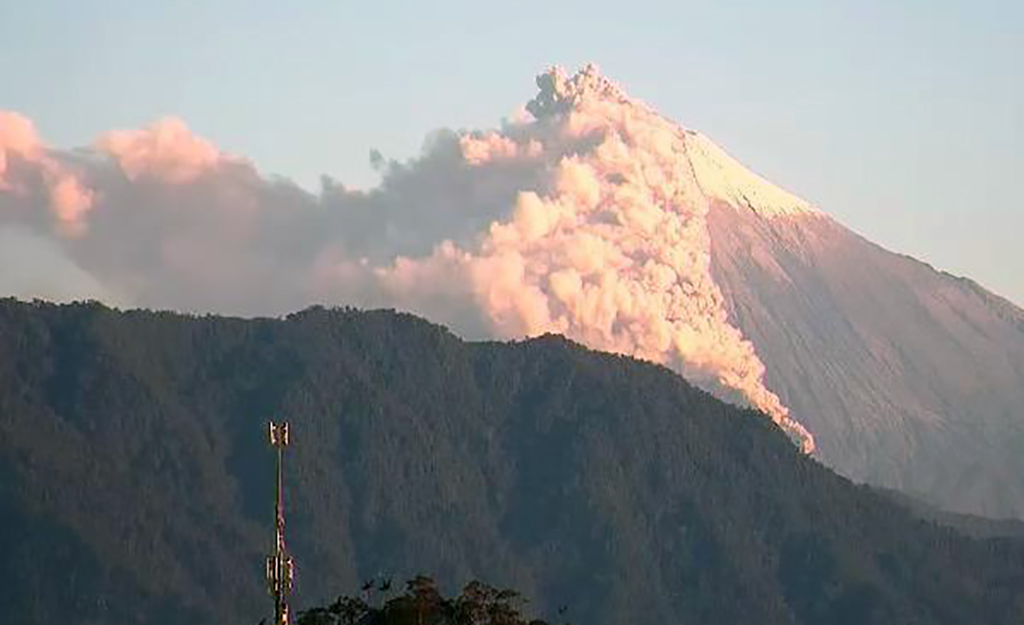
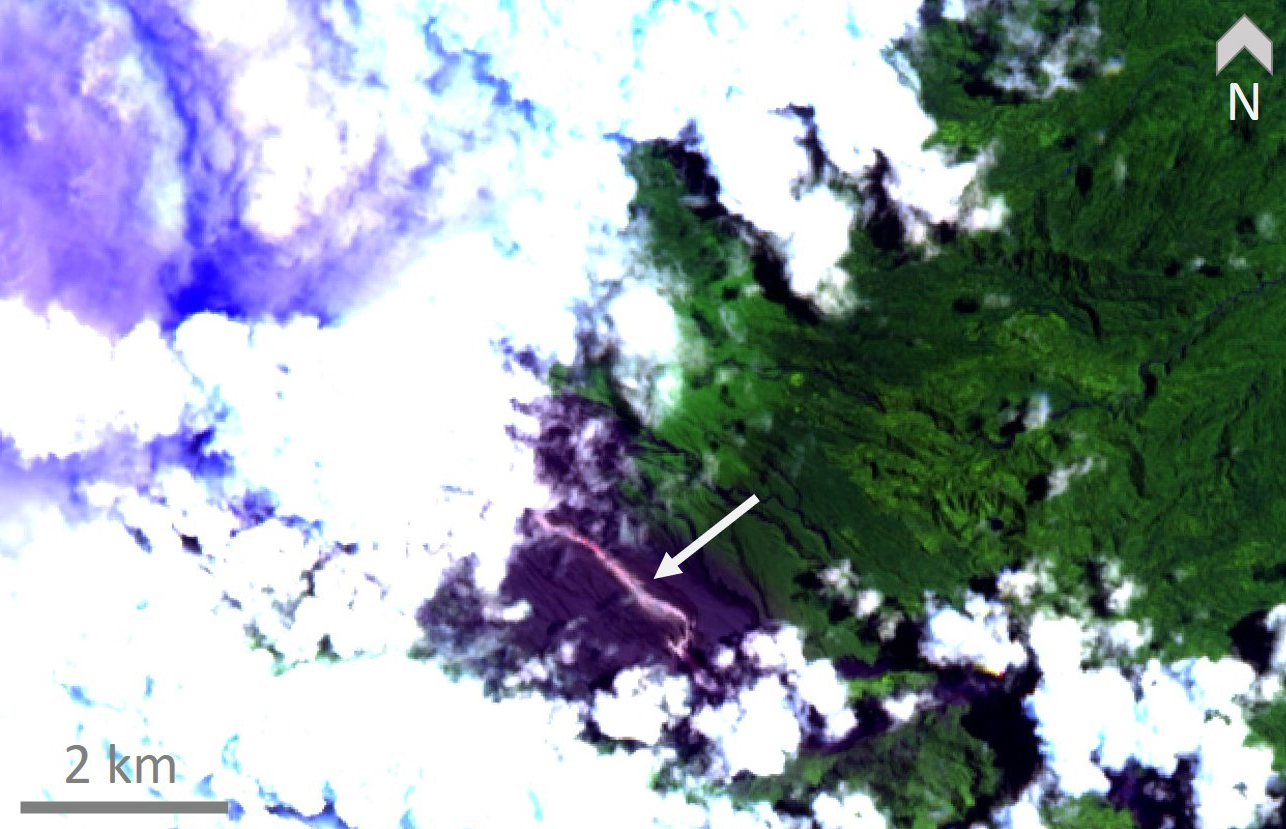
Activity during September-October 2020. Elevated activity continued through September with two significant increases on the 20th and 22nd (more information on these events below). Other than these two events, VAAC reports of ash plumes varied between 1 and 5 issued most days, with plume heights reaching between 600 and 1,500 m above the crater. Dominant ash dispersal directions were W, with some plumes traveling SE, S, SE, NE, and NW. Lahar seismic signals were recorded after rainfall on 1, 2, 5, 8-10, 21, 24, 25, 27, and 30 September. Pyroclastic flows were reported on the 19th (figure 86), and incandescent material was seen descending the SE ravine on the 29th. There was a significant increase in thermal alerts reported throughout the month compared to the July-August period, and Sentinel-2 thermal satellite images showed a lava flow down the SE flank (figure 87).
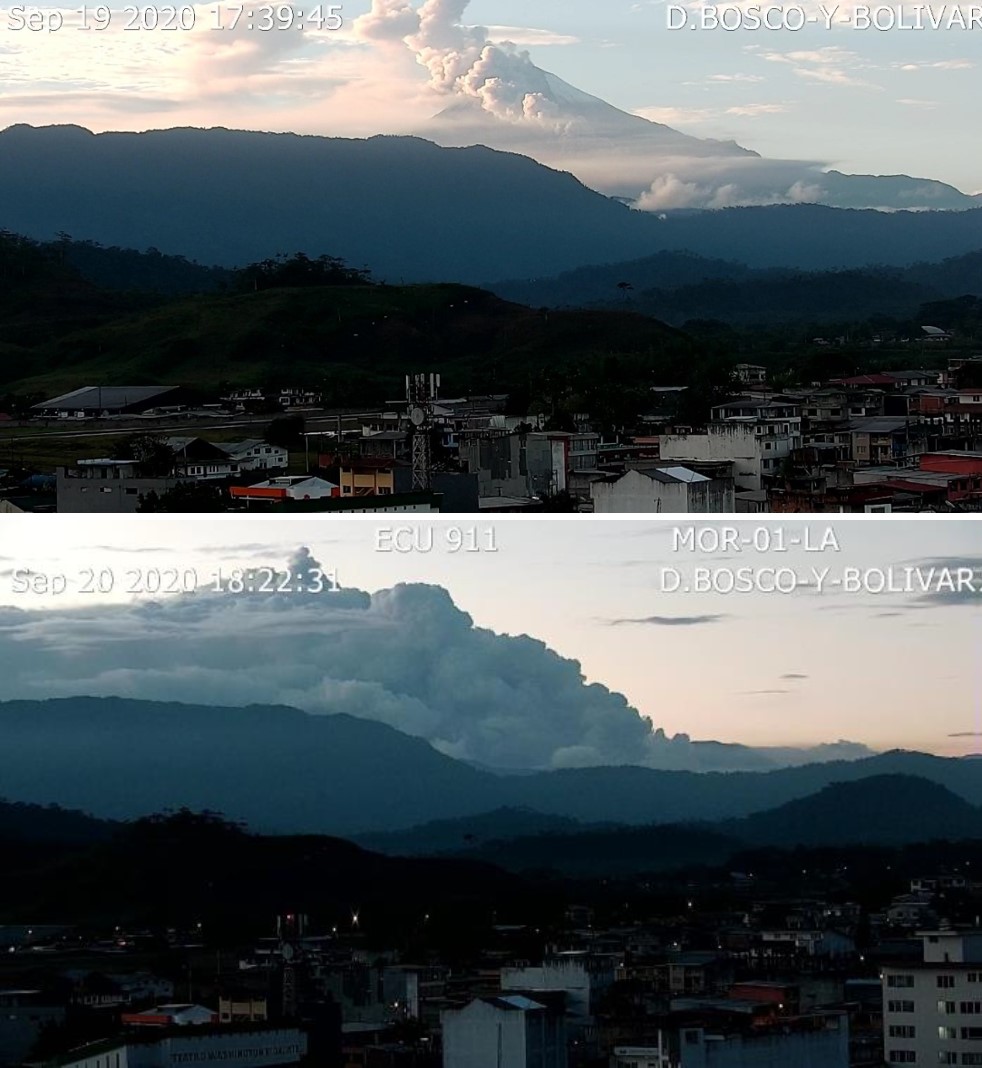
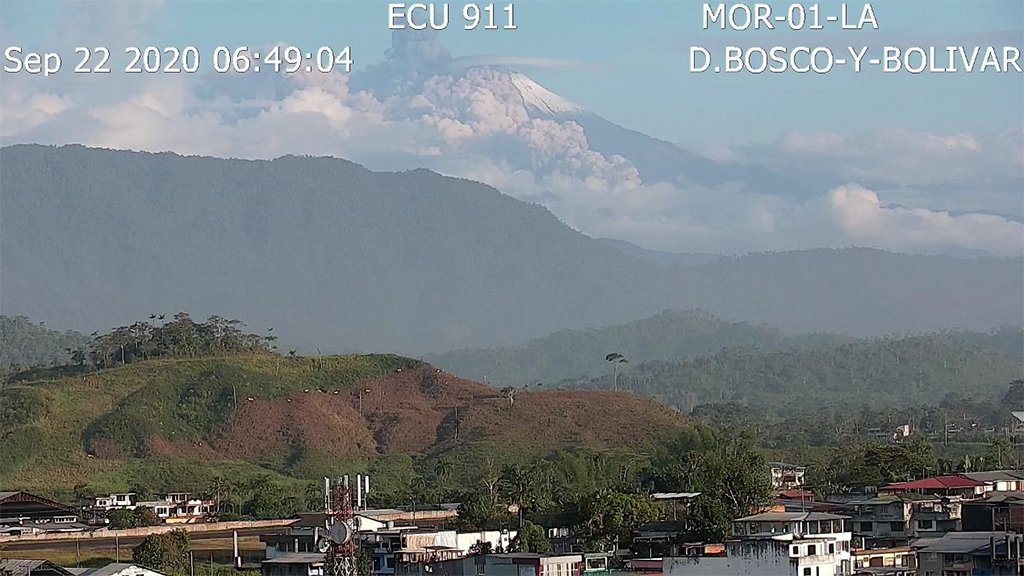
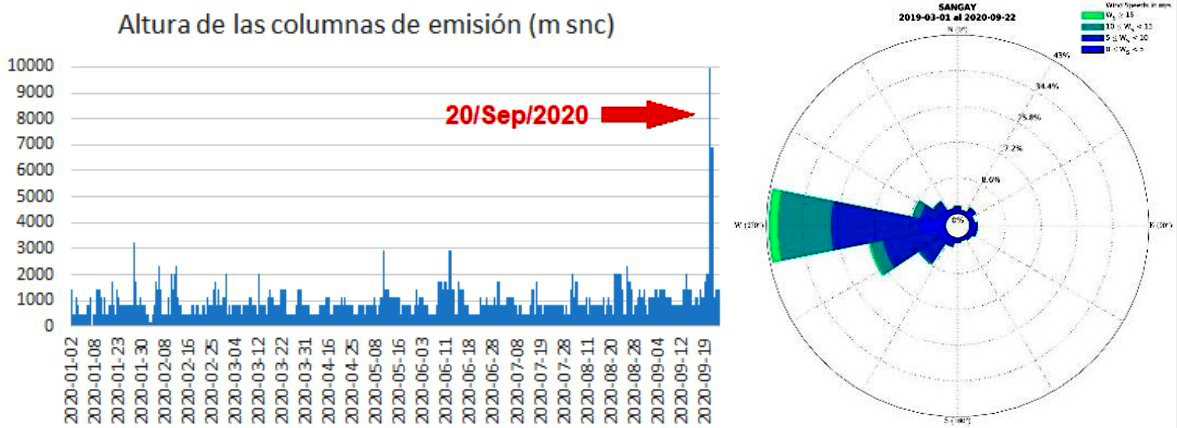
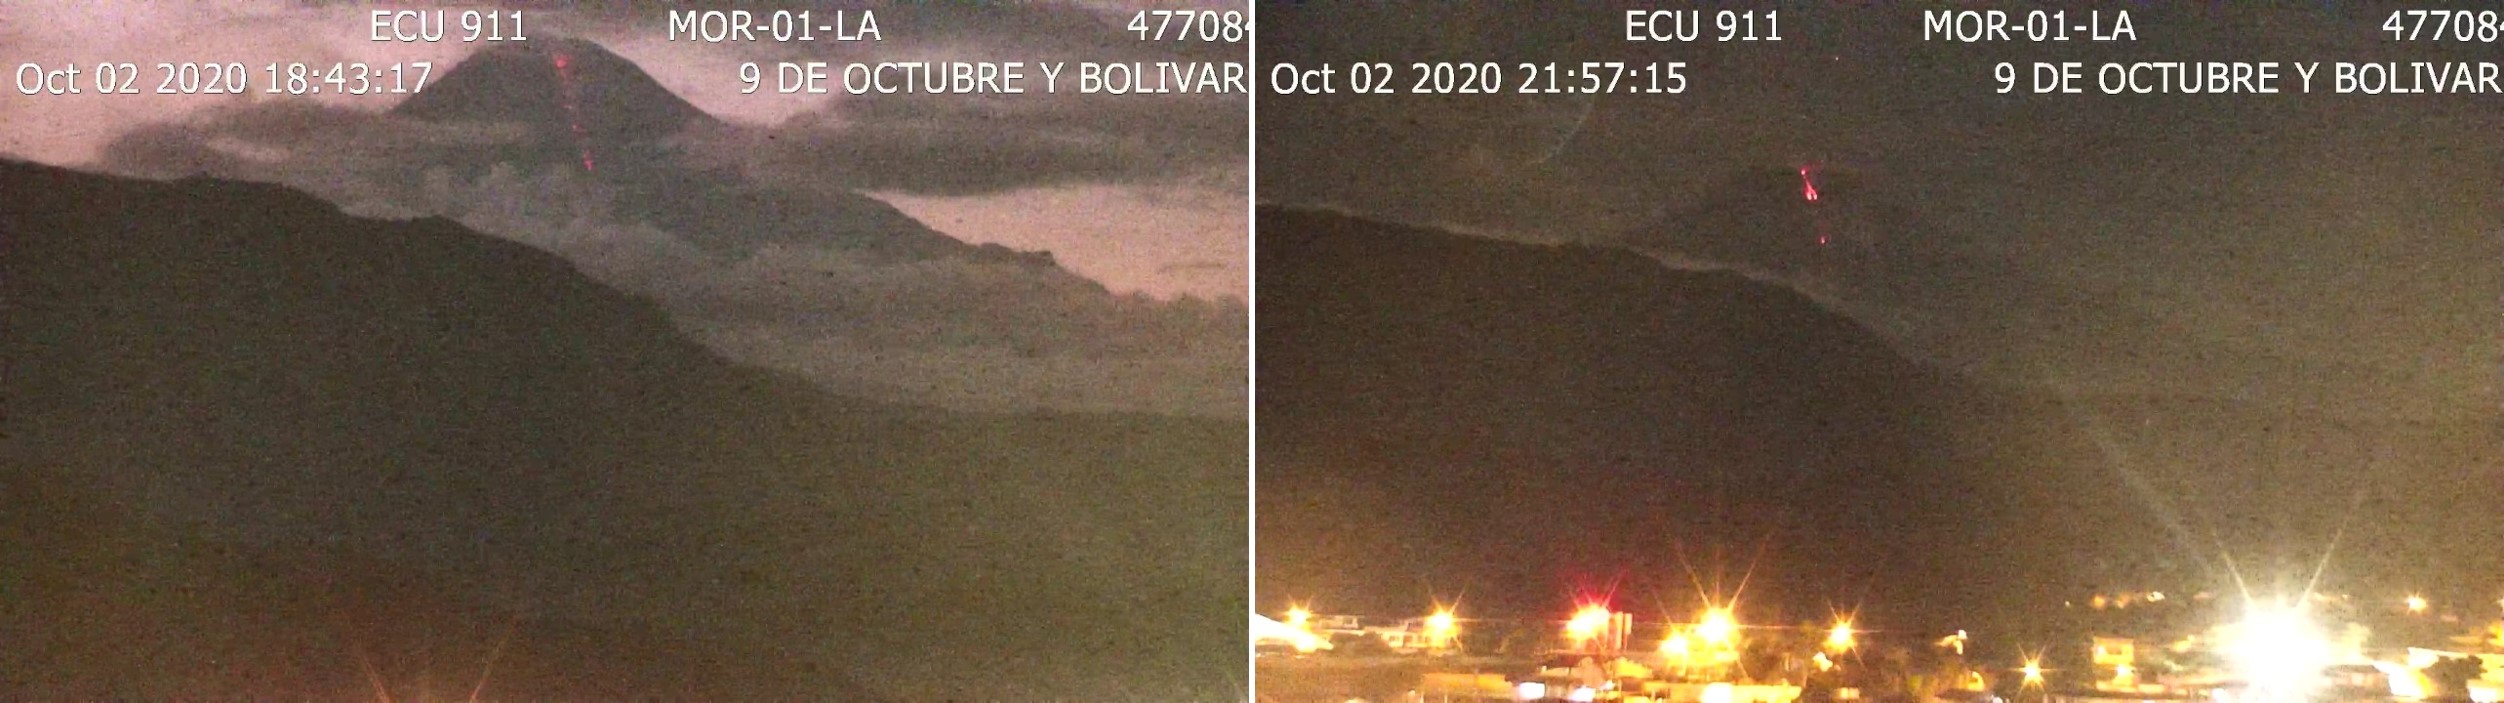
Starting at 0420 on the morning of 20 September there was an increase in explosions and emissions recorded through seismicity, much more energetic than the activity of previous months. At 0440 satellite images show an ash plume with an estimated height of around 7 km above the crater. The top part of the plume dispersed to the E and the rest of the plume went W. Pyroclastic flows were observed descending the SE flank around 1822 (figure 88). Ash from remobilization of deposits was reported on the 21st in the Bolívar, Chimborazo, Los Ríos, Guayas and Santa Elena provinces. Ash and gas emission continued, with plumes reaching up to 1 km above the crater. There were seven VAAC reports as well as thermal alerts issued during the day.
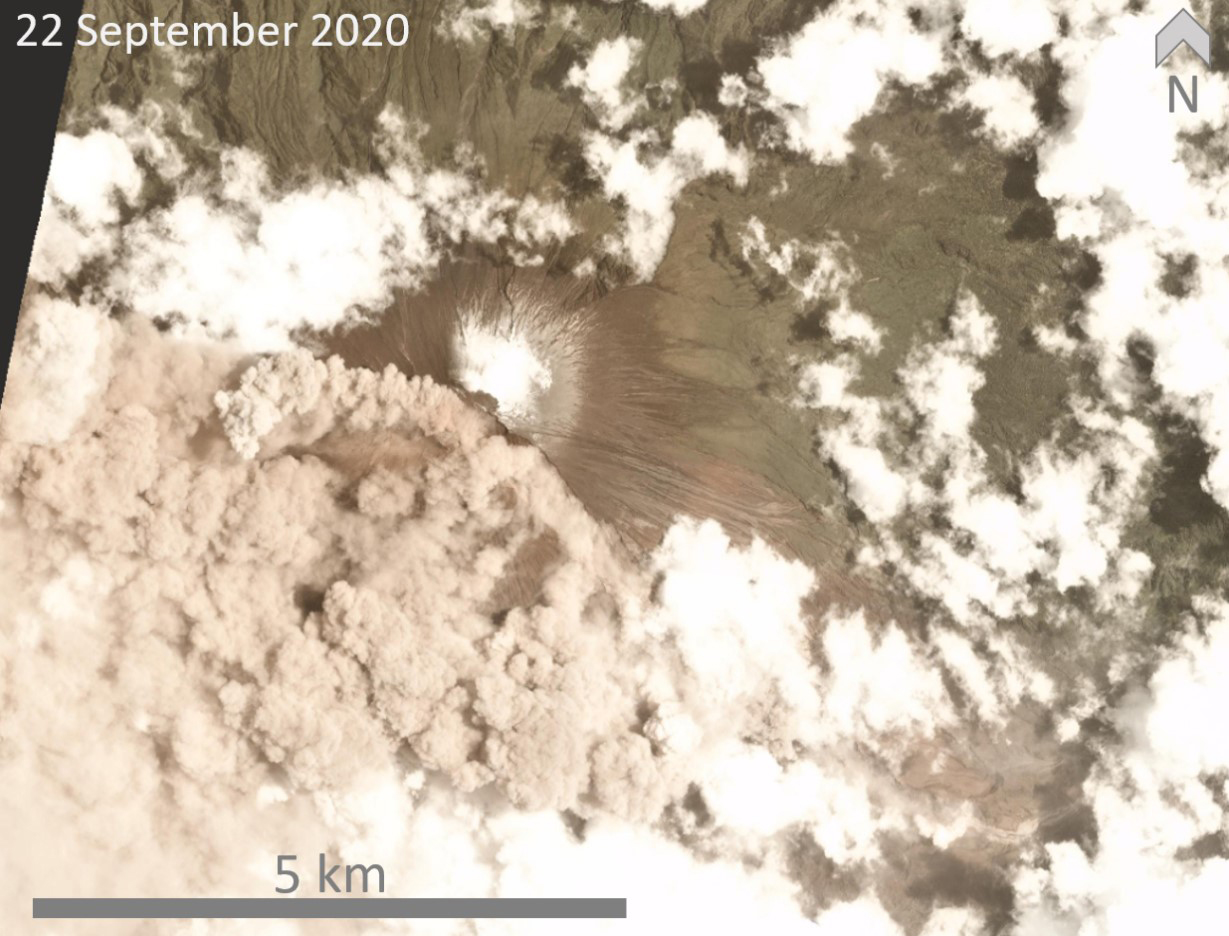
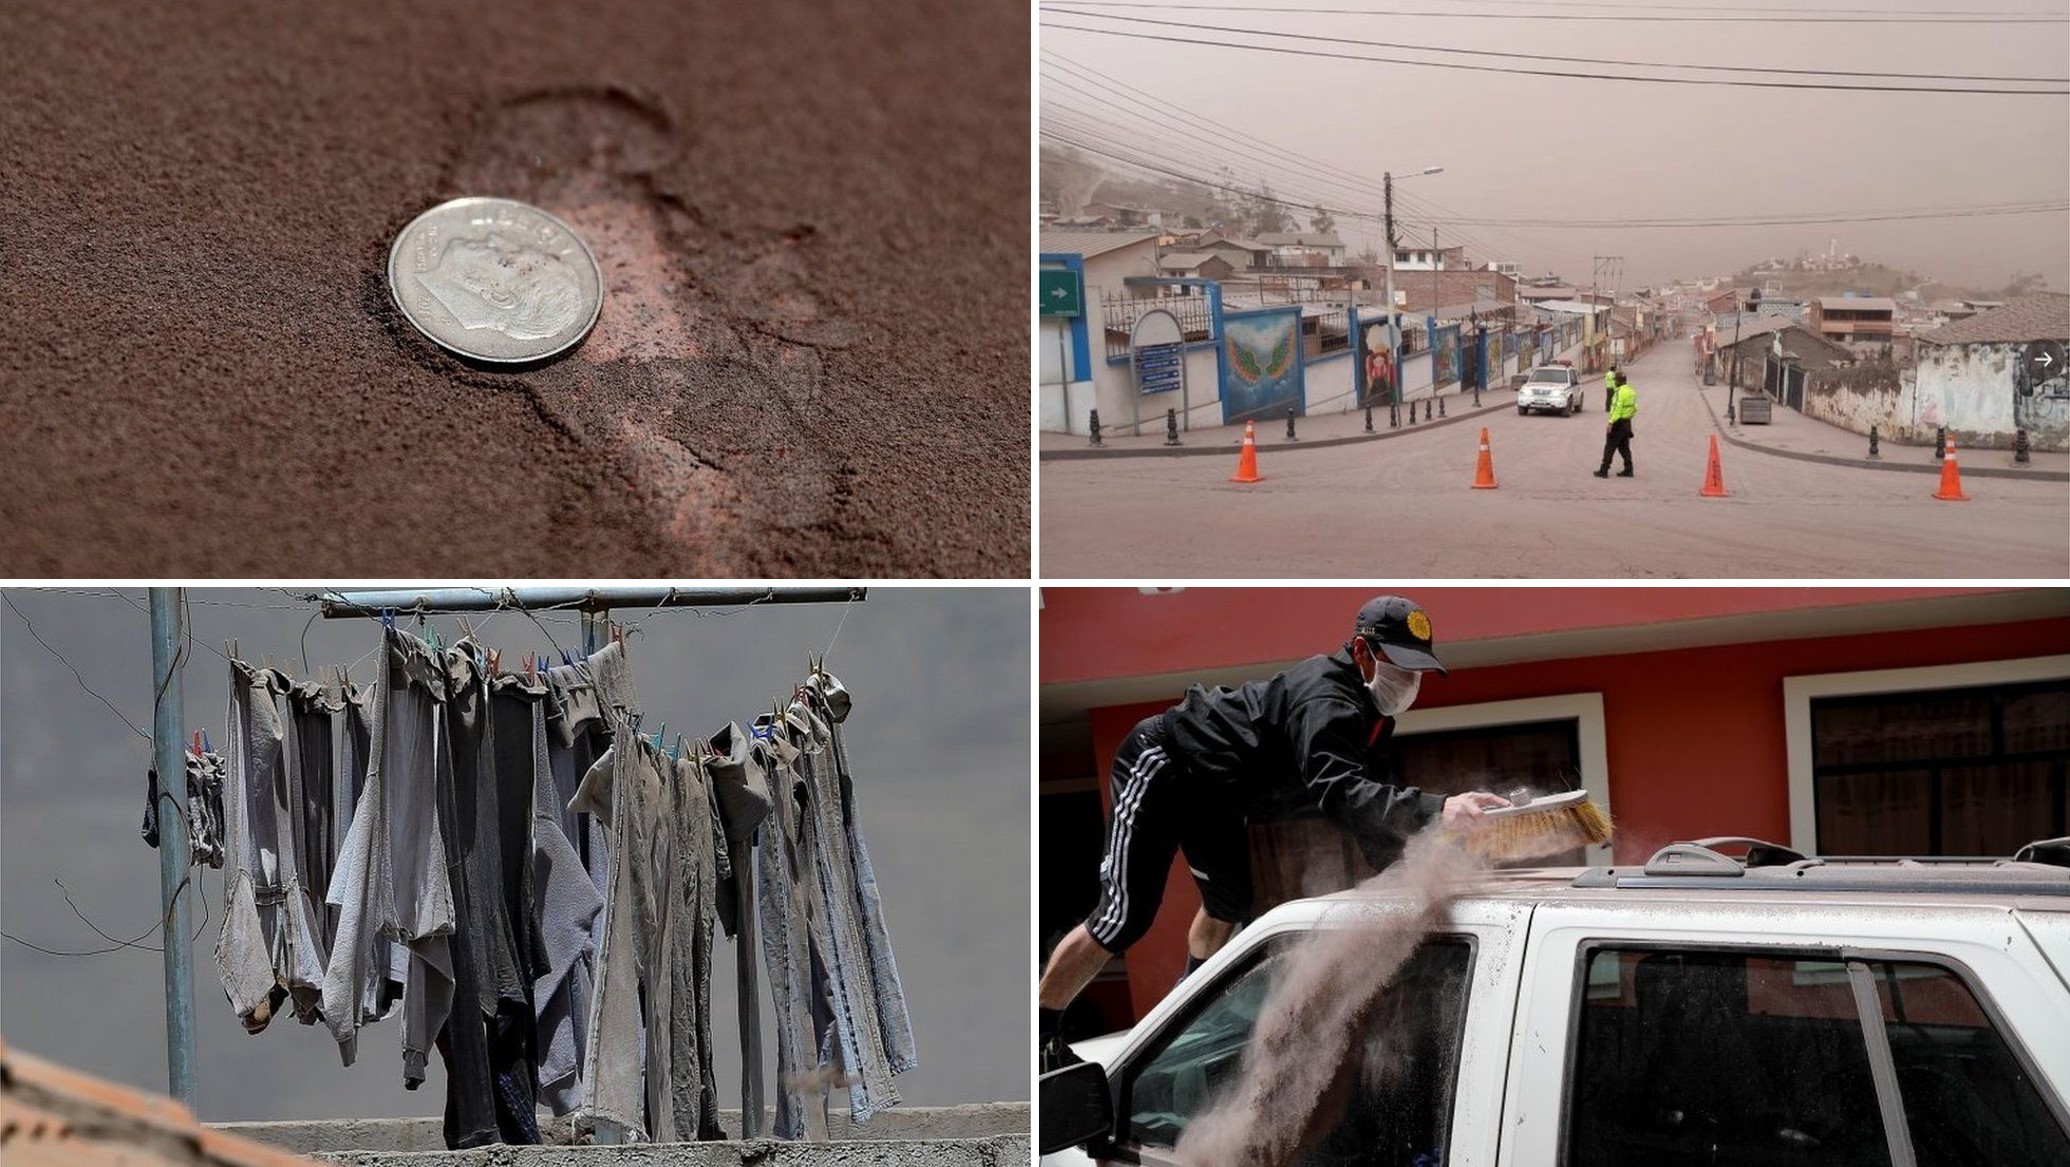
Ash plumes observed on 22 September reached around 1 km above the crater and dispersed W to NW. Pyroclastic flows were seen descending the SE flank (figure 89) also producing an ash plume. A BBC article reported the government saying 800 km2 of farmland had experienced ashfall, with Chimborazo and Bolívar being the worst affected areas (figure 90). Locals described the sky going dark, and the Guayaquil airport was temporarily closed. Ash plume heights during the 20-22 were the highest for the year so far (figure 91). Ash emission continued throughout the rest of the month with another increase in explosions on the 27th, producing observed ash plume heights reaching 1.5 km above the crater. Ashfall was reported in San Nicolas in the Chimborazo Province in the afternoon of the 30th.
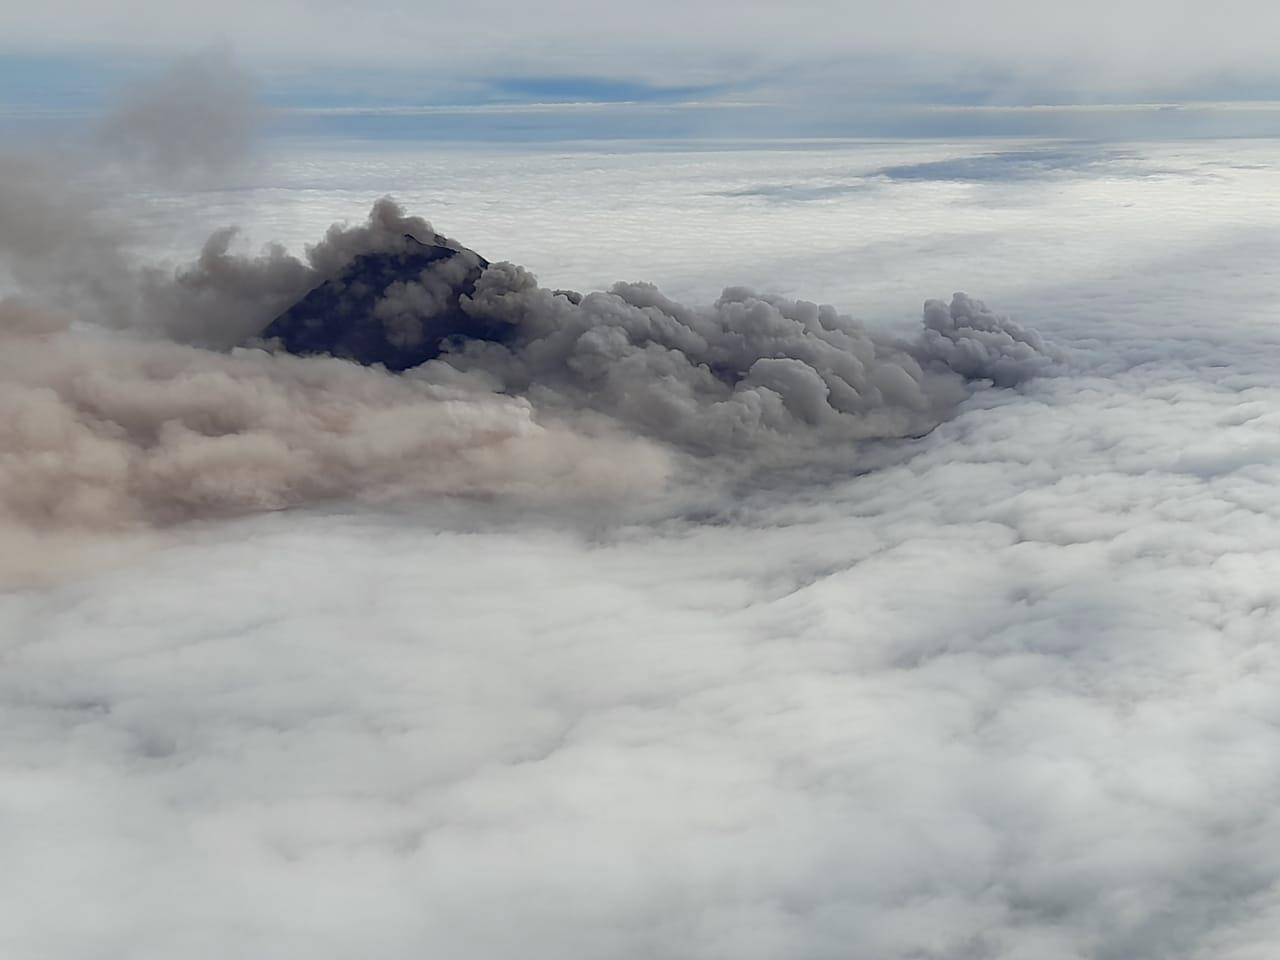
Thermal alerts increased again through October, with a lava flow and/or incandescent material descending the SE flank sighted throughout the month (figure 92). Pyroclastic flows were seen traveling down the SE flank during an observation flight on the 6th (figure 93). Seismicity indicative of lahars was reported on 1, 12, 17, 19, 21, 23, 24, and 28 October associated with rainfall remobilizing deposits. The Washington VAAC released one to five ash advisories most days, noting plume heights of 570-3,000 m above the crater; prevailing winds dispersed most plumes to the W, with some plumes drifting NW, N, E to SE, and SW. Ashfall was reported in Alausí (Chimborazo Province) on the 1st and in Chunchi canton on the 10th. SO2 was recorded towards the end of the month using satellite data, varying between about 770 and 2,850 tons on the 24th, 27th, and 29th.
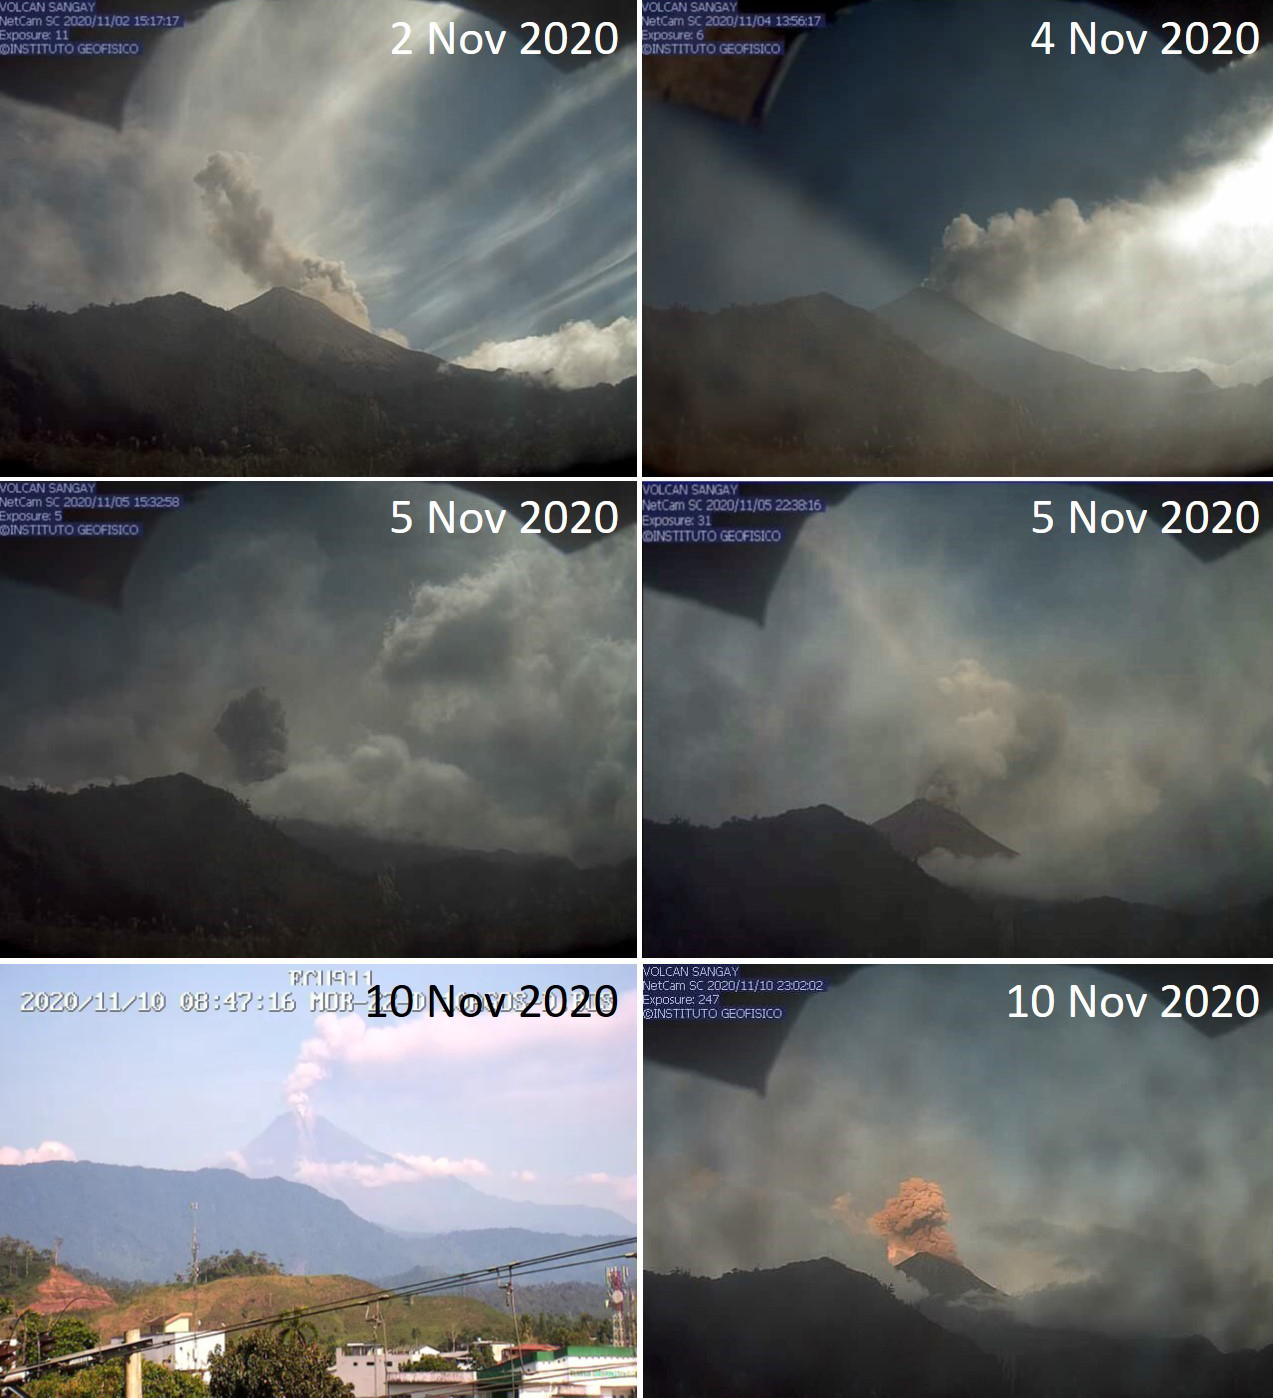
Activity during November-December 2020. Frequent ash emission continued through November with between one and five Washington VAAC advisories issued most days (figure 94). Reported ash and gas plume heights varied between 570 and 2,700 m above the crater, with winds dispersing plumes in all directions. Thermal anomalies were detected most days, and incandescent material from explosions was seen on the 26th. Seismicity indicating lahars was registered on nine days between 15 and 30 November, associated with rainfall events.
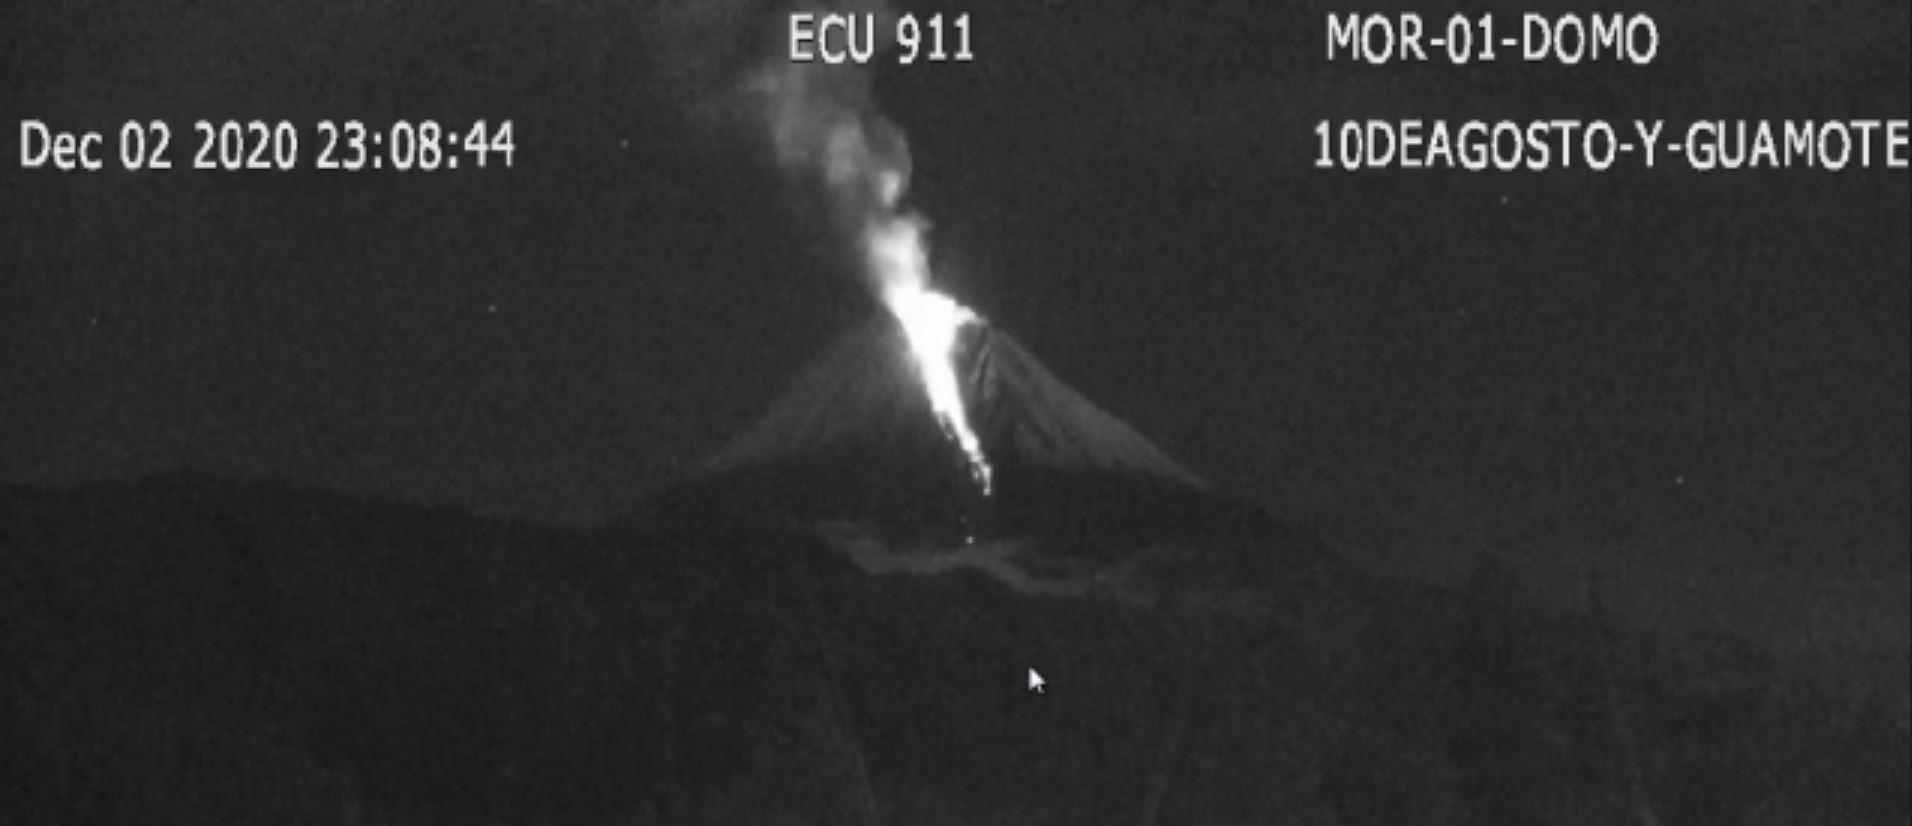
Lahar signals associated with rain events continued to be detected on ten out of the first 18 days of November. Ash emissions continued through December with one to five VAAC alerts issued most days. Ash plume heights varied from 600 to 1,400 m above the crater, with the prevailing wind direction dispersing most plumes W and SW (figure 95). Thermal anomalies were frequently detected and incandescent material was observed down the SE flank on the 3rd, 14th, and 30th, interpreted as a lava flow and hot material rolling down the flank. A webcam image showed a pyroclastic flow traveling down the SE flank on the 2nd (figure 96). Ashfall was reported on the 10th in Capzol, Palmira, and Cebadas parishes, and in the Chunchi and Guamote cantons.
Geological Summary. The isolated Sangay volcano, located east of the Andean crest, is the southernmost of Ecuador's volcanoes and its most active. The steep-sided, glacier-covered, dominantly andesitic volcano grew within the open calderas of two previous edifices which were destroyed by collapse to the east, producing large debris avalanches that reached the Amazonian lowlands. The modern edifice dates back to at least 14,000 years ago. It towers above the tropical jungle on the east side; on the other sides flat plains of ash have been eroded by heavy rains into steep-walled canyons up to 600 m deep. The earliest report of an eruption was in 1628. Almost continuous eruptions were reported from 1728 until 1916, and again from 1934 to the present. The almost constant activity has caused frequent changes to the morphology of the summit crater complex.
Information Contacts: Instituto Geofísico (IG-EPN), Escuela Politécnica Nacional, Casilla 17-01-2759, Quito, Ecuador (URL: http://www.igepn.edu.ec); ECU911, Servicio Integrado de Seguridad ECU911, Calle Julio Endara s / n. Itchimbía Park Sector Quito – Ecuador. (URL: https://www.ecu911.gob.ec/; Twitter URL: https://twitter.com/Ecu911Macas/); Hawai'i Institute of Geophysics and Planetology (HIGP) - MODVOLC Thermal Alerts System, School of Ocean and Earth Science and Technology (SOEST), Univ. of Hawai'i, 2525 Correa Road, Honolulu, HI 96822, USA (URL: http://modis.higp.hawaii.edu/); Global Sulfur Dioxide Monitoring Page, Atmospheric Chemistry and Dynamics Laboratory, NASA Goddard Space Flight Center (NASA/GSFC), 8800 Greenbelt Road, Goddard, Maryland, USA (URL: https://so2.gsfc.nasa.gov/); MIROVA (Middle InfraRed Observation of Volcanic Activity), a collaborative project between the Universities of Turin and Florence (Italy) supported by the Centre for Volcanic Risk of the Italian Civil Protection Department (URL: http://www.mirovaweb.it/); Planet Labs, Inc. (URL: https://www.planet.com/); Sentinel Hub Playground (URL: https://www.sentinel-hub.com/explore/sentinel-playground); BBC News “In pictures: Ash covers Ecuador farming land” Published 22 September 2020 (URL: https://www.bbc.com/news/world-latin-america-54247797).