Report on Semeru (Indonesia) — April 2021
Bulletin of the Global Volcanism Network, vol. 46, no. 4 (April 2021)
Managing Editor: Edward Venzke.
Edited by Kadie L. Bennis.
Semeru (Indonesia) Pyroclastic flows, incandescent avalanches, and frequent ash plumes September 2020-February 2021
Please cite this report as:
Global Volcanism Program, 2021. Report on Semeru (Indonesia) (Bennis, K.L., and Venzke, E., eds.). Bulletin of the Global Volcanism Network, 46:4. Smithsonian Institution. https://doi.org/10.5479/si.GVP.BGVN202104-263300
Semeru
Indonesia
8.108°S, 112.922°E; summit elev. 3657 m
All times are local (unless otherwise noted)
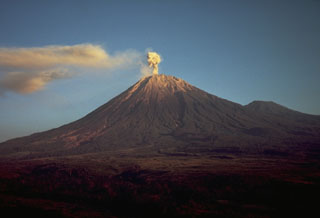
Semeru, located in East Java, Indonesia, contains the active Jonggring-Seloko vent at the Mahameru summit. The current eruptive period began in 2014 and recently has been characterized by ash plumes, pyroclastic flows, incandescent avalanches, and thermal activity. This report covers similar activity consisting of multiple pyroclastic flows, frequent ash plumes, and incandescent avalanches of material during September 2020 through February 2021 using daily and VONA reports from the Pusat Vulkanologi dan Mitigasi Bencana Geologi (PVMBG, also known as Indonesian Center for Volcanology and Geological Hazard Mitigation, CVGHM), the Darwin Volcanic Ash Advisory Centre (VAAC), and various satellite data.
The Darwin VAAC reported intermittent ash plumes during the reporting period that rose between 2.4 and 6.1 km altitude, the latter of which occurred during 1-2 and 5-6 December based on HIMAWARI-8 satellite imagery. Activity during September through late November was dominantly characterized by white-to-gray ash plumes; during 19-20 November crater incandescence was visible and 11 incandescent avalanches of material were reported, traveling 500-1,500 m down the Kembar and Kobokan drainages on the S flank. Crater incandescence continued to be observed through the rest of the month, accompanied by intermittent avalanches of material and ash plumes. On 28 November pyroclastic flows were detected and descended the SE flank, which continued frequently through early February 2021. Explosions, pyroclastic flows, crater incandescence, incandescent avalanches of material, and some lahars were frequently reported during December through early February 2021.
During September intermittent white-and-gray ash plumes rose 200-700 m above the crater and drifted dominantly S and SW, accompanied by occasional thermal anomalies that were visible in satellite images according to PVMBG, VONA advisories, and ground observers. Similar activity continued in October with white-and-gray ash plumes rising 200-1,000 m above the crater and drifting in different directions; the higher plumes were during 16-17 October. On 19 October intermittent rock avalanches were detected.
Gray-and-white ash plumes were recorded rising 100-500 m above the crater, drifting in multiple directions during a majority of November, based on daily reports from PVMBG. During 19-21 November nighttime crater incandescence was accompanied by 11 incandescent avalanches of material that traveled 500-1,500 m down the SE-flank Kembar and Kobokan drainages (figure 45). On 22 November six incandescent avalanches of material extended 100-300 m down the Kembar and Kobokan drainages. During 23-24 November two eruptive events generated gray ash plumes that rose 100-200 m above the crater and drifted SW. On 28 November there was a significant increase in the number of rock avalanches; pyroclastic flows that originated from the ends of the avalanches moved down the SE flank. An accompanying ash plume rose to 4.9 km altitude and drifted SW. As a result, roughly 1,298 people living in five villages and two sub-districts in the Lumajang Regency were affected. Small sulfur dioxide plumes accompanied the more intense eruptive events and were detected in the Sentinel 5P/TROPOMI instrument during late November, late December, and early January (figure 46).
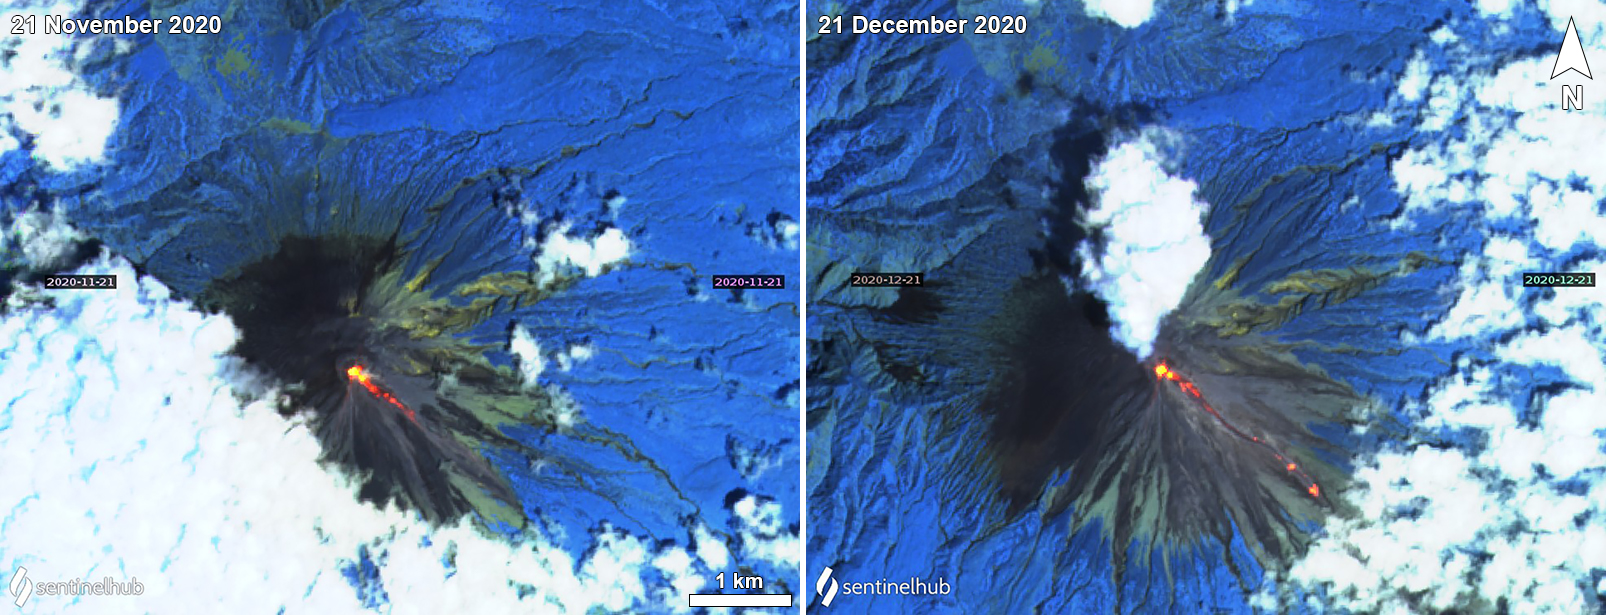 |
Figure 45. Sentinel-2 thermal satellite images of Semeru on 21 November (left) and 21 December (right) 2020 showing incandescent avalanches of material descending the SE flank. A white gas-and-steam plume accompanies the avalanche on 21 December. Intermittent incandescent avalanches were observed throughout the reporting period on clear weather days. Sentinel-2 satellite images with “Atmospheric penetration” (bands 12, 11, 8A) rendering. Courtesy of Sentinel Hub Playground. |
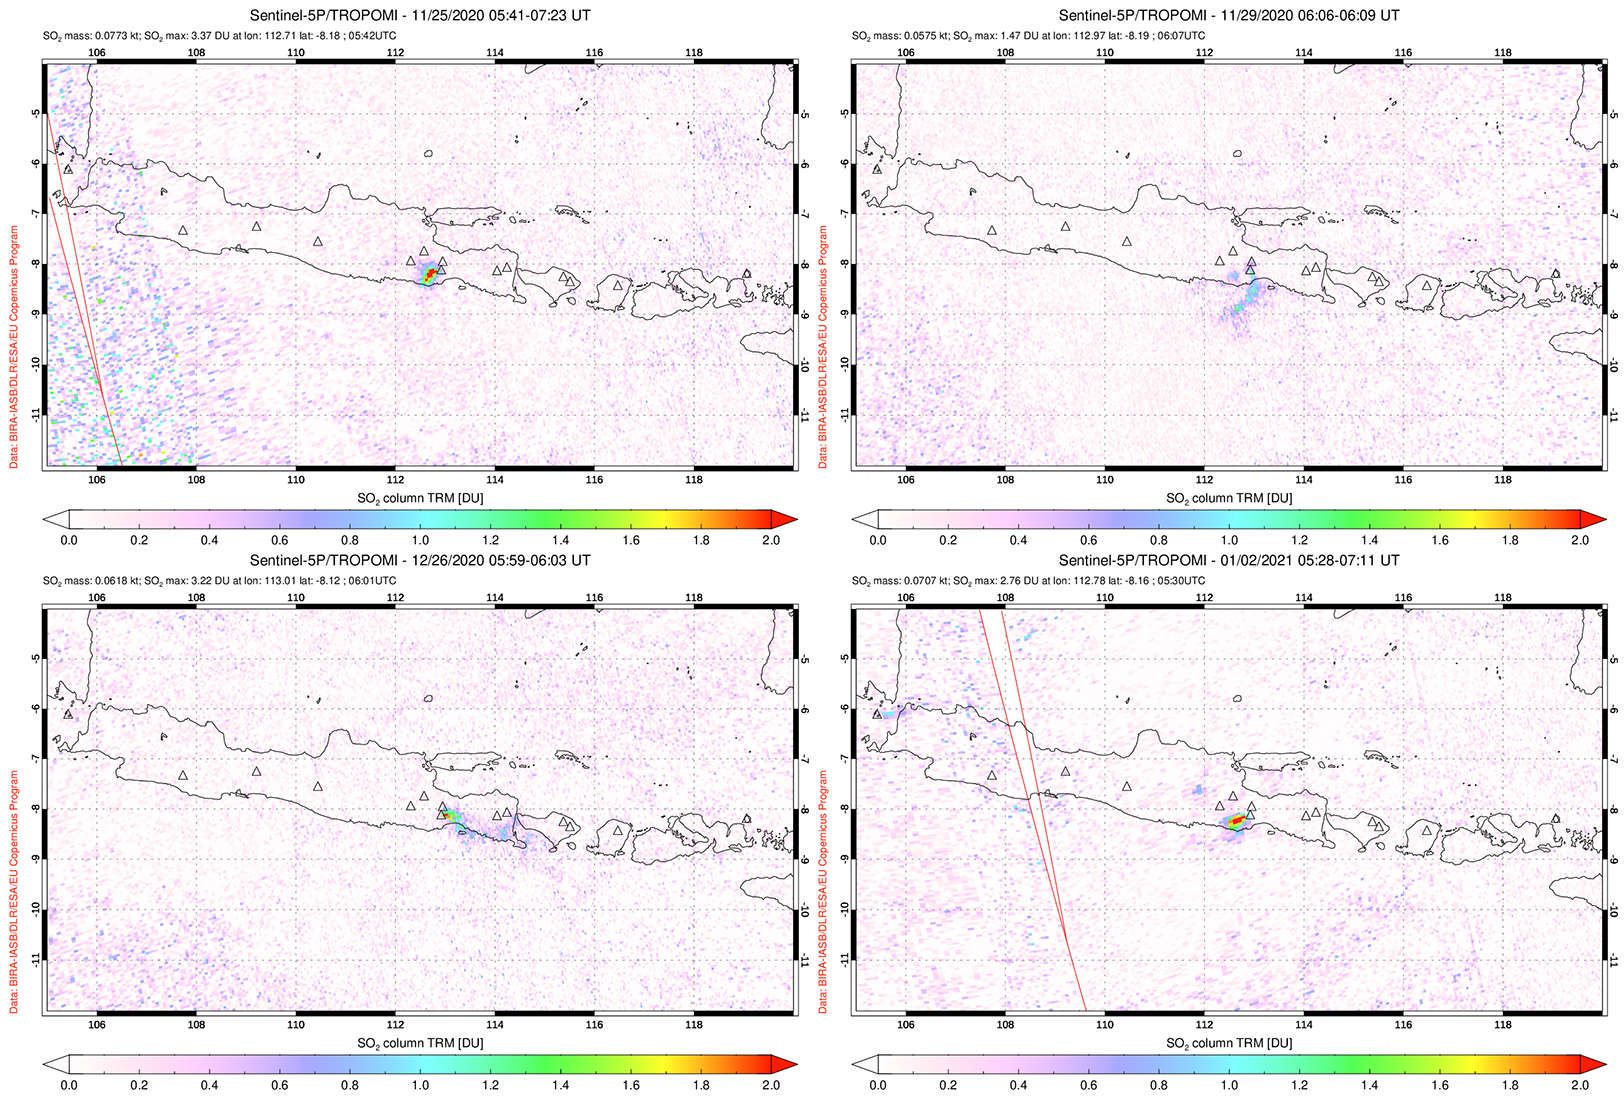 |
Figure 46. Small SO2 plumes from Semeru were detected by the Sentinel 5P/TROPOMI instrument on 25 (top left) and 29 (top right) November, 26 December (bottom left) 2020, and 2 January (bottom right) 2021. The plumes drifted SW on 25 and 29 November and 2 January, and E on 26 December. Courtesy of NASA Global Sulfur Dioxide Monitoring Page. |
Activity continued to increase in December; on 1 December at 0123 pyroclastic flows from the summit lava dome traveled 2-11 km down the Kobokan drainage on the SE flank. According to a VONA issued by PVMBG a resulting ash plume rose 2 km above the crater. Deposits from the pyroclastic flows were as thick as 15 m, destroying some machinery and impacting livestock, agricultural fields, and businesses (figures 47 and 48). BNPB reported that as many as 550 residents had evacuated, though some returned to their homes; one person was reported missing. On 2 December a pyroclastic flow extended 2.5 km down the Kobokan drainage and an accompanying ash plume rose 2.4 km above the crater that drifted E and NE. Ashfall was visible around the summit crater. During 1-9 December near daily avalanches of material, some of which were incandescent, were recorded by the seismic network and traveled 200-2,500 m down the Kobokan drainage on the SE flank (figures 49 and 50). Within that period eruptive events and rockfalls over 5-6 December generated pyroclastic flows that extended 2.5 km down the Kobokan drainage; associated ash plumes rose to 6.1 km altitude that drifted E and NE. During 5-9, 15, and 19-31 December incandescent material was ejected 50-100 m above the crater. Explosions were recorded by the seismic network during 10-12 December but could not be visually confirmed due to weather conditions. On 13 December a pyroclastic flow that originated from the end of an avalanche traveled 1.5 km down the Kembar drainage on the S flank and reached a maximum distance of 3.5 km from the crater. The next day a pyroclastic flow traveled 3.5 km down the Kobokan drainage; rock avalanches traveled 300-1,500 m down both the Kembar and Kobokan drainages during 14-15 December.
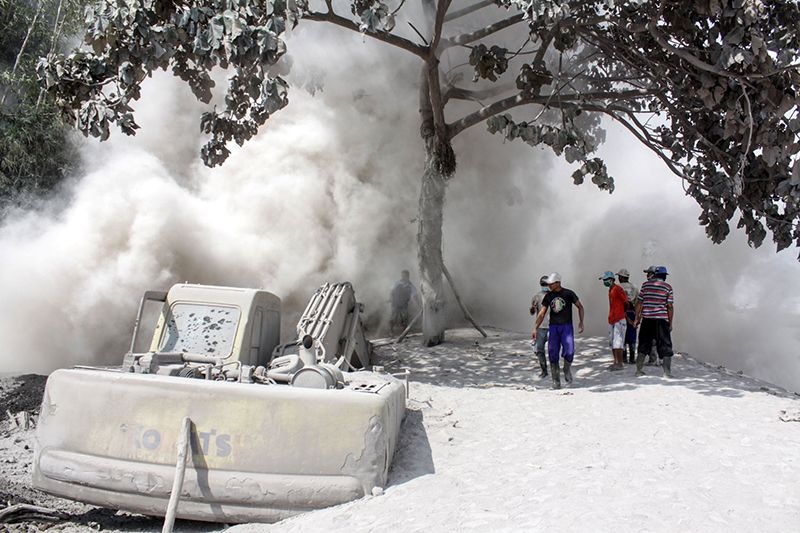 |
Figure 47. Photo of ash deposits on 2 December 2020 in Lumajang, Indonesia, due to the eruptive events at Semeru. Some deposits damaged machinery, agricultural fields, and affected livestock. Photo by Antara Foto/Umarul Faruq; courtesy of Reuters. |
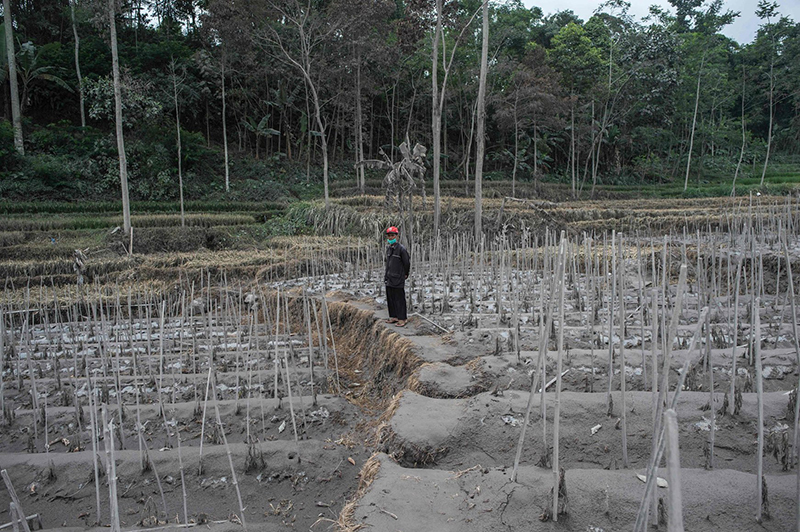 |
Figure 48. Photo of ash deposits on agricultural land in Lumajang, Indonesia, due to the eruptive events at Semeru in early December 2020. Courtesy of AFP. |
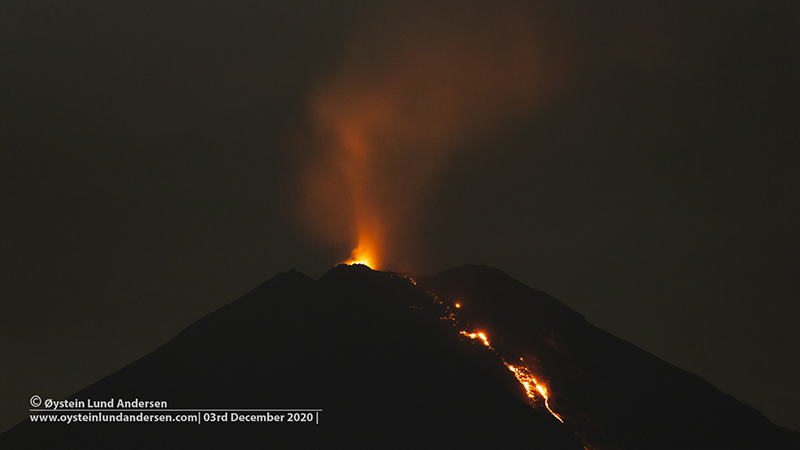 |
Figure 49. Photo of summit crater incandescence and an incandescent avalanche of material descending Semeru at night on 3 December 2020. Copyrighted photo courtesy of Øystein Lund Andersen, used with permission. |
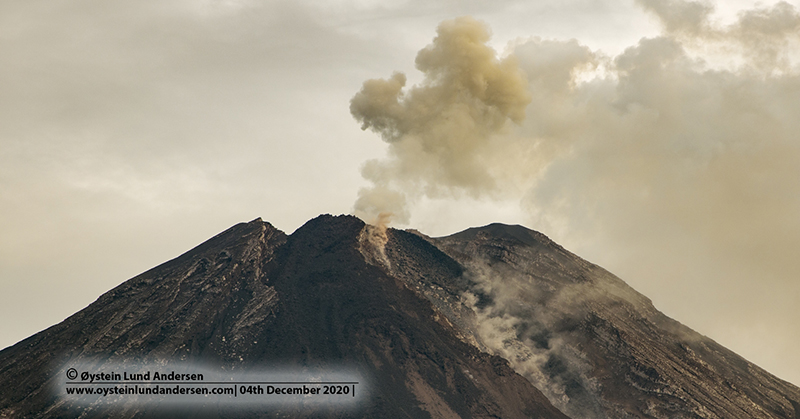 |
Figure 50. Photo of a rockfall event and a resulting ash plume at Semeru on 4 December 2020. Copyrighted photo courtesy of Øystein Lund Andersen, used with permission. |
On 23, 30, and 31 December pyroclastic flows were reported descending 3.5 km down the Kobokan drainage on the SE flank. During 23-25 December incandescent avalanches of material traveled 100-300 m down the Kobokan drainage. On 30 December observers at the Gunungsawur Observatory (12 km SE) recorded heavy rain that resulted in multiple lahars (figure 51). At 0939 the post’s seismic station detected a lahar in the Kobokan drainage on the SE flank. Another lahar down the SE flank at 0950 was followed by a large volume of water. At 1111 the seismic station detected a lahar and an accompanying pyroclastic flow that traveled 3.5 km down the Kobokan drainage; by 1130 the lahar had damaged bamboo stalls in Sumberwuluh Village (15 km SE).
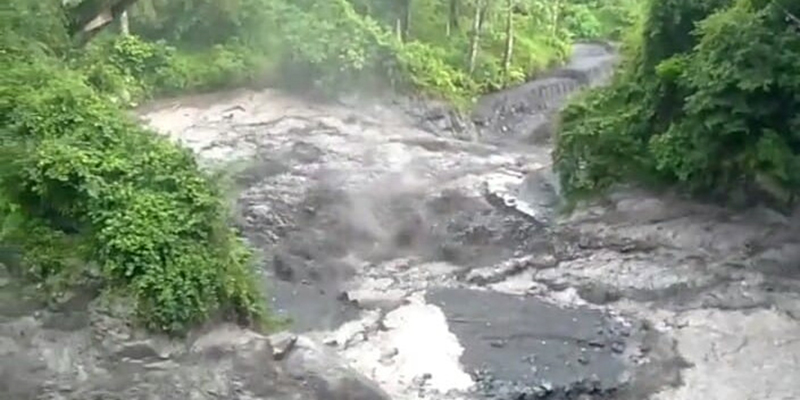 |
Figure 51. Photo of a lahar down the Kobokan drainage on the SE flank of Semeru at 0939 on 30 December 2020. A pyroclastic flow was also observed traveling 3.5 km down the Curah Kobokan River drainage. Courtesy of BNPB. |
Increased volcanism continued in January 2021; on 1 January a pyroclastic flow was recorded at 1451. Incandescent avalanches were reported during 1-5 and 15 January that traveled 200-1,000 m down the Kobokan drainage, reaching a maximum distance of 1,250 m from the crater. At night incandescent material was ejected 50 m above the crater during 1-6 January. White-and-gray plumes rose 200-300 m above the crater and drifted N. On 16 January incandescent avalanches were detected at 1724 and extended as far as 1 km down the Kobokan drainage; a pyroclastic flow traveled 4-4.5 km down the same drainage during that day. A large ash plume was observed along the length of the pyroclastic flow, rising 2 km above the crater and drifted NE and N (figures 52 and 53). As a result, ashfall was reported in areas to the N. Incandescent material was ejected 30 m above the crater and incandescent avalanches of material descended 100-200 m down the Kobokan drainage (figure 54).
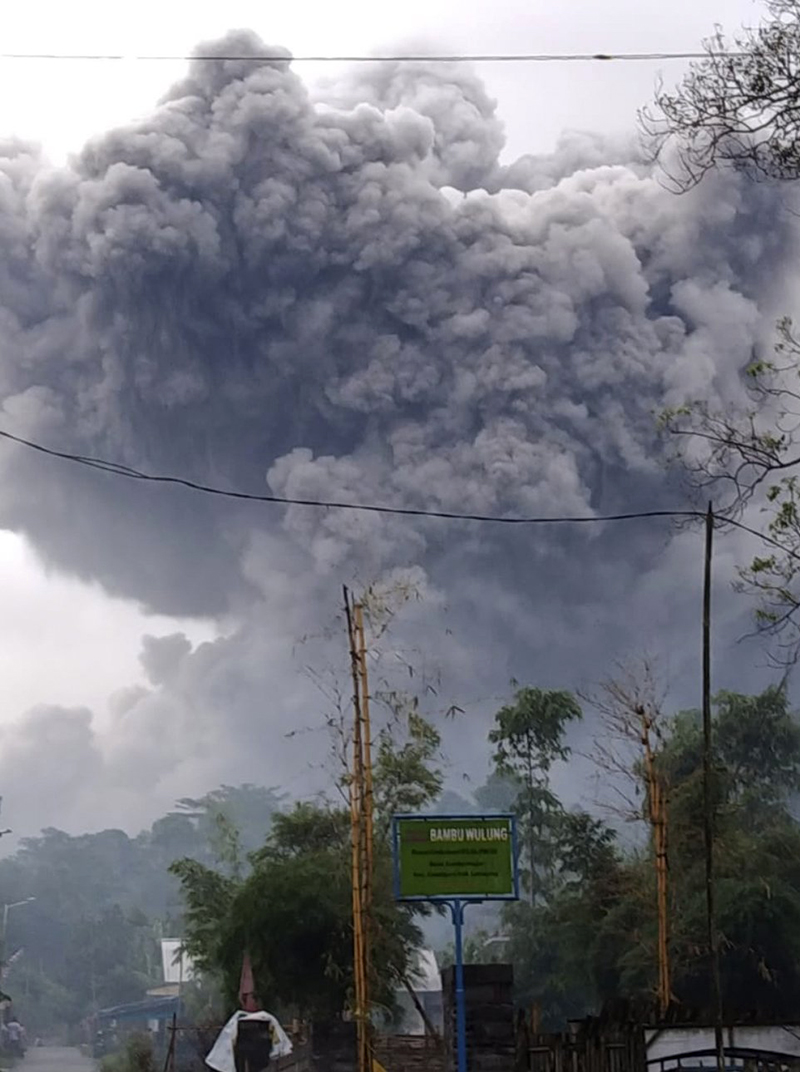 |
Figure 52. Photo of a dense gray ash plume rising up to 2 km above the summit crater at Semeru on 16 January 2021. Courtesy of BNPB. |
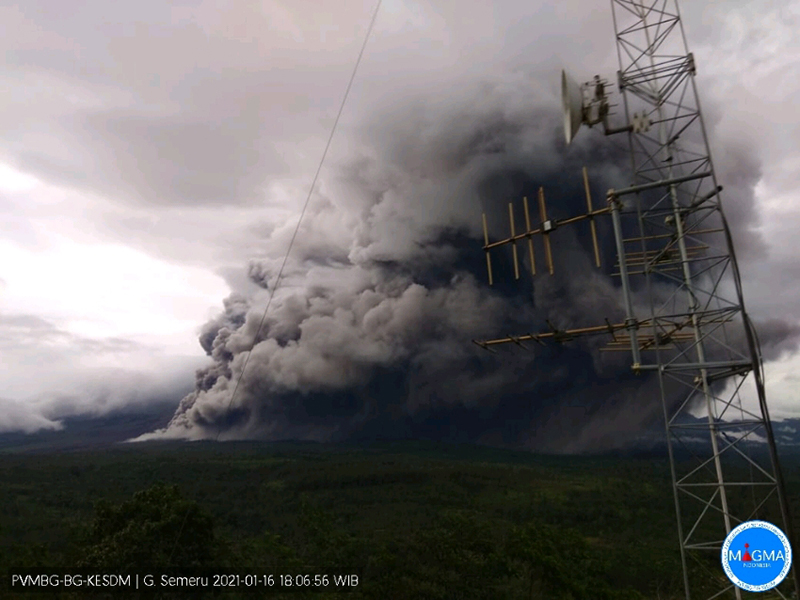 |
Figure 53. Webcam image of dense gray ash clouds due to a pyroclastic flow from Semeru drifting up to 4 km to the SE and S on 16 January 2020. Courtesy of MAGMA Indonesia. |
 |
Figure 54. Photo of an incandescent avalanche of material descending the SE flank at Semeru on 17 January 2021. Incandescence and a gray ash plume are also visible in the summit crater. Photo by Agus Harianto; courtesy of AFP/Getty Images. |
Gray-and-white plumes continued to be observed during 18-26 January rising 200-500 m above the crater and drifting generally N. Daily incandescent avalanches of material from the Jonggring-Seloko vent during 19-26 January extended 200-1,000 m down the SE flank, accompanied by frequent incandescent ejecta up to 50 m above the crater that continued to be reported through 28 January (figure 55). On 2 February a pyroclastic flow from the end of an incandescent avalanche traveled 2 km down the Kobokan drainage. Activity decreased after the pyroclastic flow on 2 February. White-and-gray ash plumes were reported during 17-18 and 24-25 February, rising 100-500 m above the crater and drifting N, NE, E, and SE.
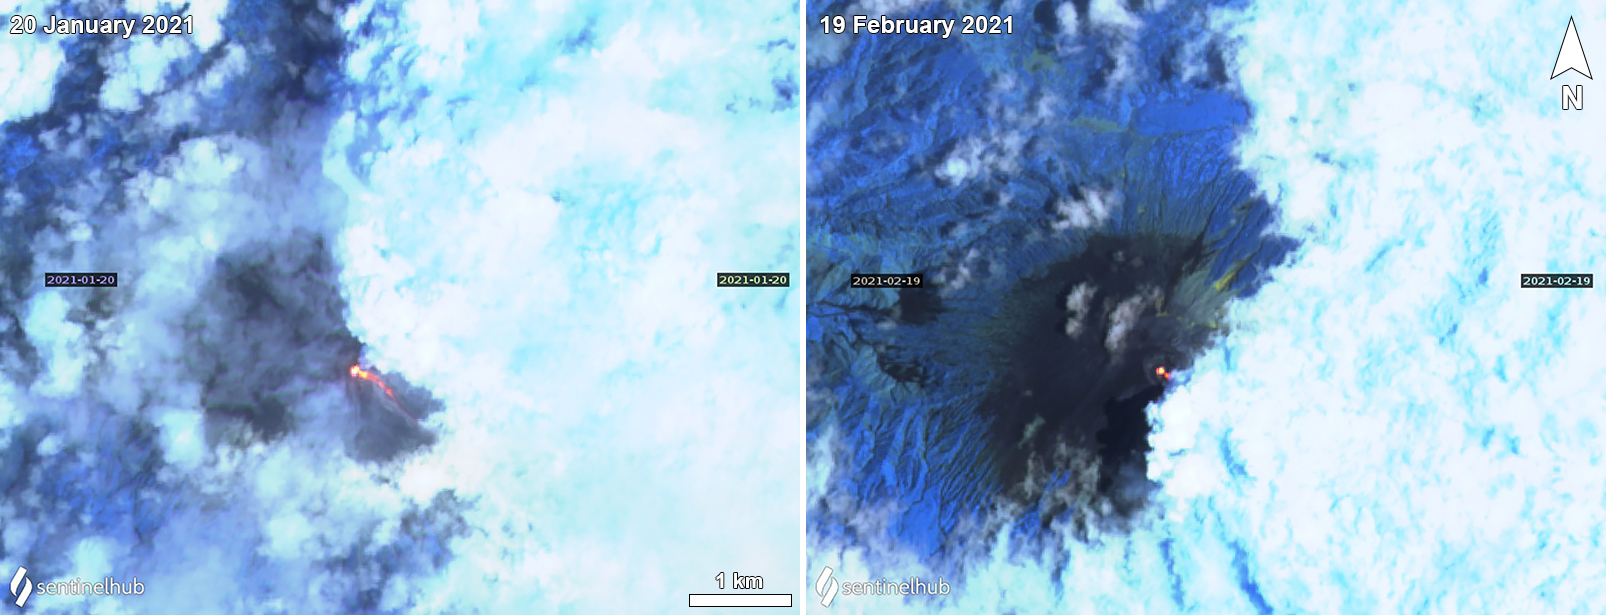 |
Figure 55. Sentinel-2 thermal satellite images showing an incandescent summit crater at Semeru on 20 January (left) and 19 February (right) 2021. On 20 January a faint incandescent avalanche of material was visible traveling down the SE flank. Clouds prevented a clear view of the SE flank on 19 February 2021. Sentinel-2 satellite images with “Atmospheric penetration” (bands 12, 11, 8A) rendering. Courtesy of Sentinel Hub Playground. |
Sentinel-2 thermal satellite imagery shows this thermal activity originating from the summit crater on clear weather days throughout the reporting period. Summit crater incandescence was visible intermittently on 2, 7, 12, 17, and 27 September, and 2, 7, 17, and 22 October; on 17 and 22 October faint incandescence on the SE flank was visible, possibly representing a small avalanche of hot material. On 16 and 21 November the thermal anomaly increased in strength and was accompanied by an incandescent avalanche down the SE flank (figure 45). Further SE-flank Incandescent avalanches of varying lengths were seen on 11, 16, 21, and 31 December. The avalanche on 21 December was accompanied by a white gas-and-steam plume (figure 45). Though clouds prevented a clear view of the various avalanches during January and February, thermal activity was still visible in the summit crater, with a small incandescent avalanche traveling down the SE flank on 20 January (figure 55). Crater incandescence continued through late February.
MIROVA (Middle InfraRed Observation of Volcanic Activity) analysis of MODIS satellite data showed intermittent low-power thermal anomalies during September through mid-November (figure 56). A pulse in thermal activity was detected from mid-November through early December with more frequent and moderate-power anomalies, coincident with more eruptive events. In late December another period of stronger thermal activity began that continued through early February 2021. During February the frequency of the anomalies decreased and were variable in power. The MODVOLC algorithm detected thermal anomalies on 11 different days: 24 October; 18, 19, 21, and 23 November; 23, 25, and 28 December 2020; 10 and 24 January; and 13 February 2021. The elevated thermal activity in December is also reflected in the MODVOLC algorithm on 23 December with a high hotspot count of six.
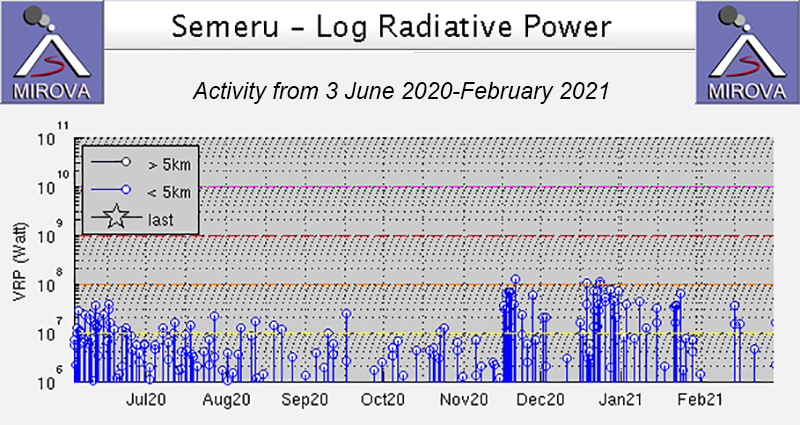 |
Figure 56. Thermal anomalies at Semeru during September through mid-November 2020 were of variable low intensities and occurred intermittently. In mid-November thermal anomalies increased in frequency and power, a period that continued through early December. In late December another pulse of thermal activity was recorded which continued through early February 2021. During February the thermal anomalies decreased in frequency but were variable in power. Courtesy of MIROVA. |
Geological Summary. Semeru, the highest volcano on Java, and one of its most active, lies at the southern end of a volcanic massif extending north to the Tengger caldera. The steep-sided volcano, also referred to as Mahameru (Great Mountain), rises above coastal plains to the south. Gunung Semeru was constructed south of the overlapping Ajek-ajek and Jambangan calderas. A line of lake-filled maars was constructed along a N-S trend cutting through the summit, and cinder cones and lava domes occupy the eastern and NE flanks. Summit topography is complicated by the shifting of craters from NW to SE. Frequent 19th and 20th century eruptions were dominated by small-to-moderate explosions from the summit crater, with occasional lava flows and larger explosive eruptions accompanied by pyroclastic flows that have reached the lower flanks of the volcano.
Information Contacts: Pusat Vulkanologi dan Mitigasi Bencana Geologi (PVMBG, also known as Indonesian Center for Volcanology and Geological Hazard Mitigation, CVGHM), Jalan Diponegoro 57, Bandung 40122, Indonesia (URL: http://www.vsi.esdm.go.id/); Badan Nasional Penanggulangan Bencana (BNPB), National Disaster Management Agency, Graha BNPB - Jl. Scout Kav.38, East Jakarta 13120, Indonesia (URL: http://www.bnpb.go.id/); MAGMA Indonesia, Kementerian Energi dan Sumber Daya Mineral (URL: https://magma.esdm.go.id/v1); Darwin Volcanic Ash Advisory Centre (VAAC), Bureau of Meteorology, Northern Territory Regional Office, PO Box 40050, Casuarina, NT 0811, Australia (URL: http://www.bom.gov.au/info/vaac/); MIROVA (Middle InfraRed Observation of Volcanic Activity), a collaborative project between the Universities of Turin and Florence (Italy) supported by the Centre for Volcanic Risk of the Italian Civil Protection Department (URL: http://www.mirovaweb.it/); Hawai'i Institute of Geophysics and Planetology (HIGP) - MODVOLC Thermal Alerts System, School of Ocean and Earth Science and Technology (SOEST), Univ. of Hawai'i, 2525 Correa Road, Honolulu, HI 96822, USA (URL: http://modis.higp.hawaii.edu/); NASA Global Sulfur Dioxide Monitoring Page, Atmospheric Chemistry and Dynamics Laboratory, NASA Goddard Space Flight Center (NASA/GSFC), 8800 Greenbelt Road, Goddard, Maryland, USA (URL: https://so2.gsfc.nasa.gov/); Sentinel Hub Playground (URL: https://www.sentinel-hub.com/explore/sentinel-playground); Øystein Lund Andersen (Twitter: @OysteinLAnderse, https://twitter.com/OysteinLAnderse, URL: http://www.oysteinlundandersen.com); Agence France-Presse (URL: http://www.afp.com/); Reuters (http://www.reuters.com/).