Report on Soufriere St. Vincent (Saint Vincent and the Grenadines) — May 2021
Bulletin of the Global Volcanism Network, vol. 46, no. 5 (May 2021)
Managing Editor: Edward Venzke.
Edited by Kadie L. Bennis.
Soufriere St. Vincent (Saint Vincent and the Grenadines) Intermittent explosions, ash plumes, seismicity, and a growing lava dome during March-April 2021
Please cite this report as:
Global Volcanism Program, 2021. Report on Soufriere St. Vincent (Saint Vincent and the Grenadines) (Bennis, K.L., and Venzke, E., eds.). Bulletin of the Global Volcanism Network, 46:5. Smithsonian Institution. https://doi.org/10.5479/si.GVP.BGVN202105-360150
Soufriere St. Vincent
Saint Vincent and the Grenadines
13.33°N, 61.18°W; summit elev. 1220 m
All times are local (unless otherwise noted)
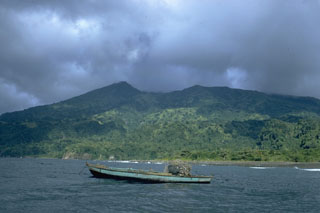
Soufrière St. Vincent (also referred to as “La Soufrière”) is the northernmost stratovolcano on St. Vincent Island in the southern part of the Lesser Antilles. The NE rim of the 1.6-km-wide summit crater is cut by a crater (500 m wide and 60 m deep) that formed in 1812. Recorded eruptions date back to 1718, with notable eruptions occurring in 1812, 1902, and 1979. An eruption that began on 27 December 2020 was characterized by increased seismicity, the growth of a new lava dome on the SW edge of the main crater, crater incandescence, and gas-and-steam emissions (BGVN 46:03). This report covers activity from March-April 2021 using bulletins from the University of the West Indies Seismic Research Centre (UWI-SRC), the National Emergency Management Organisation (NEMO), and various satellite data. Soufrière St. Vincent is monitored by the SRC assisted by the Soufrière Monitoring Unit (SMU) from the Ministry of Agriculture in Kingstown.
As of 2004, the monitoring network had consisted of five seismic stations, eight GPS stations, and several dry tilt sites. Seismic data are transmitted from field sites to the Belmont Observatory (9 km SSW), which is operated by the SMU. On 1 March a new seismic station installed at the National Parks Interpretation Center at Bamboo Range on the E side of the volcano became operational. Additionally, a new GPS monitoring station was placed in Fancy. Two more GPS stations were installed at Jacob’s Well and Table Rock on 19 March.
Activity during March 2021. The lava dome in the main crater continued to grow during March, expanding to the N, NW, S, and SE. Gas emissions persisted in the summit area from the top of the dome and along the contact area between the pre-existing 1979 dome and the 2020-21 dome, damaging vegetation on the SW side of the volcano. A team visited the dome on 19 and 23 March to make observations, take measurements, and maintain monitoring equipment. On 19 March the dome was 105 m tall, 921 m long, and 243 m wide, with an estimated volume of 13.13 million cubic meters, based on drone surveys (figure 18). Compared to the previous drone survey on 12 February, the dome had grown roughly 6.3 million cubic meters. On 23 March at 1030 the seismic network recorded a swarm of small low-frequency events that lasted about 45 minutes, possibly associated with magma movement beneath the dome. Starting at 1653 the network also detected volcano-tectonic (VT) earthquakes, some of which had been felt in communities, including Fancy, Owia, and Sandy Bay. By 26 March the period of elevated VT earthquakes had ended; only small, low-frequency events associated with lava dome growth were recorded.
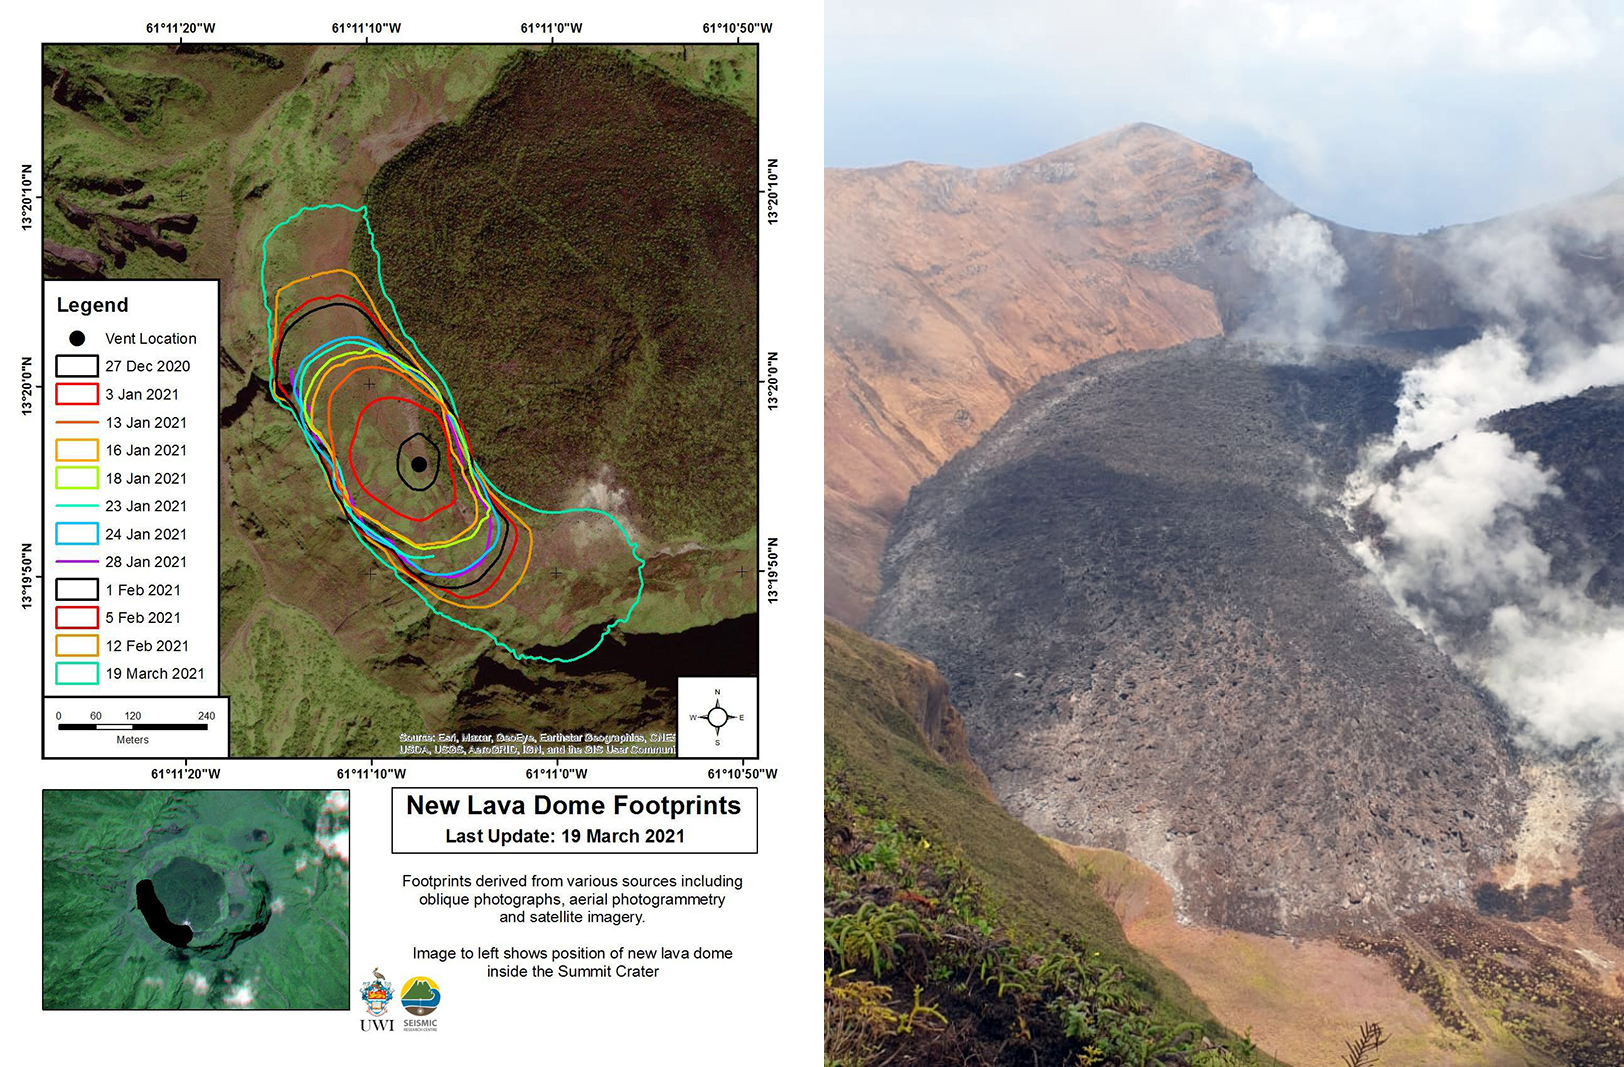 |
Figure 18. Map (left) showing the growth of the new lava dome at Soufrière St. Vincent from 27 December 2020 to 19 March 2021. The dome is located on the SW edge of the crater rim and WSW of the 1979 lava dome that is covered in vegetation. Photo (right) of the laterally growing lava dome (dark mass at left) taken on 19 March 2021. White gas-and-steam emissions are visible along the contact area with the 1979 dome (right), as well as damaged vegetation. Courtesy of SMU, UWI-SRC, and NEMO SVG. |
Activity during April 2021. The lava dome continued to grow to the N and S during April, accompanied by small earthquakes and gas-and-steam emissions rising both from the top of the dome and along the contact with the pre-existing 1979 dome. A new swarm of VT earthquakes was detected on 5 April at 0638, the number and magnitude continued to increase until 0830, after which they stabilized. These earthquakes were more intense and averaged 50/hour; the 23-25 March swarm averaged 1.5/hour. The largest event was registered as a Mw 3.5 at 0920 and was felt by local residents. At 1400 the rate of the earthquakes started to decline and then significantly dropped at 1600, though small VT events continued through 1800. Small earthquakes associated with dome growth were recorded on 7 April.
On 8 April UWI-SRC reported an increase in the volume of white gas-and-steam emissions rising from the summit crater and at 0300 scientists at the Belmont Observatory reported episodes of tremor that indicated the movement of magma and fluids near the surface. Subsequent tremor episodes at 0530, 0800, 1015, and 1300 showed increasing magnitude. Five long-period (LP) earthquakes and two brief swarms of VT events were detected between the tremor episodes; ash venting was also observed during the last episode. Sulfur dioxide emissions were also identified in satellite data. Visual observations from the Belmont Observatory during the early evening showed that the dome height had increased significantly during the day, and incandescent material over the vent area was visible in webcam images (figure 19). As a result, the Volcanic Alert Level (VAL) was raised to Red (the highest level on a four-color scale) at 1830 and the Prime Minister issued an evacuation order for communities in the Red Zone at the N end of the island, affecting 16,000-20,000 people.
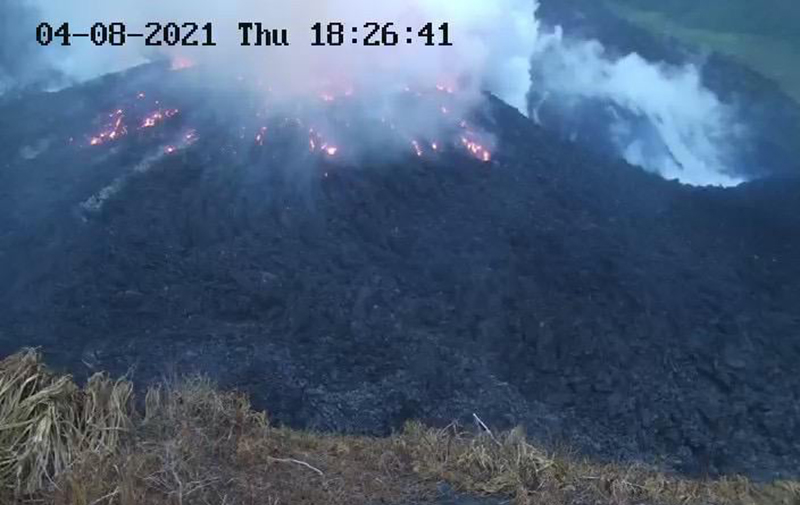 |
Figure 19. Webcam image of incandescent material in the summit crater of Soufrière St. Vincent on 8 April 2021, accompanied by white gas-and-steam emissions. Courtesy of UWI-SRC. |
On 9 April at 0840 scientists at the Belmont Observatory reported an explosion that generated an ash plume up to 8 km altitude that drifted mainly ENE (figure 20). Ash was deposited across the island, affecting communities including Chateaubelair, Petite Bordel, the Belmont Observatory, and areas at the S end of the island; it also forced the Argyle International Airport (20 km S) to close (figure 21). NEMO stated that evacuations in the Orange and Red Zones were affected by significant ashfall and poor visibility, but by the evening most residents had been evacuated. Seismicity increased at 1130, including an earthquake swarm lasting until 1440, though tremor continued to be reported. A second explosion at 1445 produced a vigorous ash plume that initially rose to 4 km altitude with lightning visible in the plume (figure 22). Successive explosions and ash pulses fed the plume for hours, rising to 16 km altitude. A third explosive series began at 1835 (figure 23). Ash venting continued through the night and into 10 April. Periods of banded tremor associated with explosive activity and stronger pulses of ash emissions to higher altitudes began at 0330 on 10 April, lasting for periods of 20-30 minutes with 1-3 hour gaps. The resulting ash plumes rose to 10.6-16 km altitude throughout the day. The Washington VAAC stated that ash plumes during 9-10 April had drifted as far as 1,200 km ESE and about 3,000 km ENE. The Grantley Adams International Airport (GAIA) in Barbados also closed.
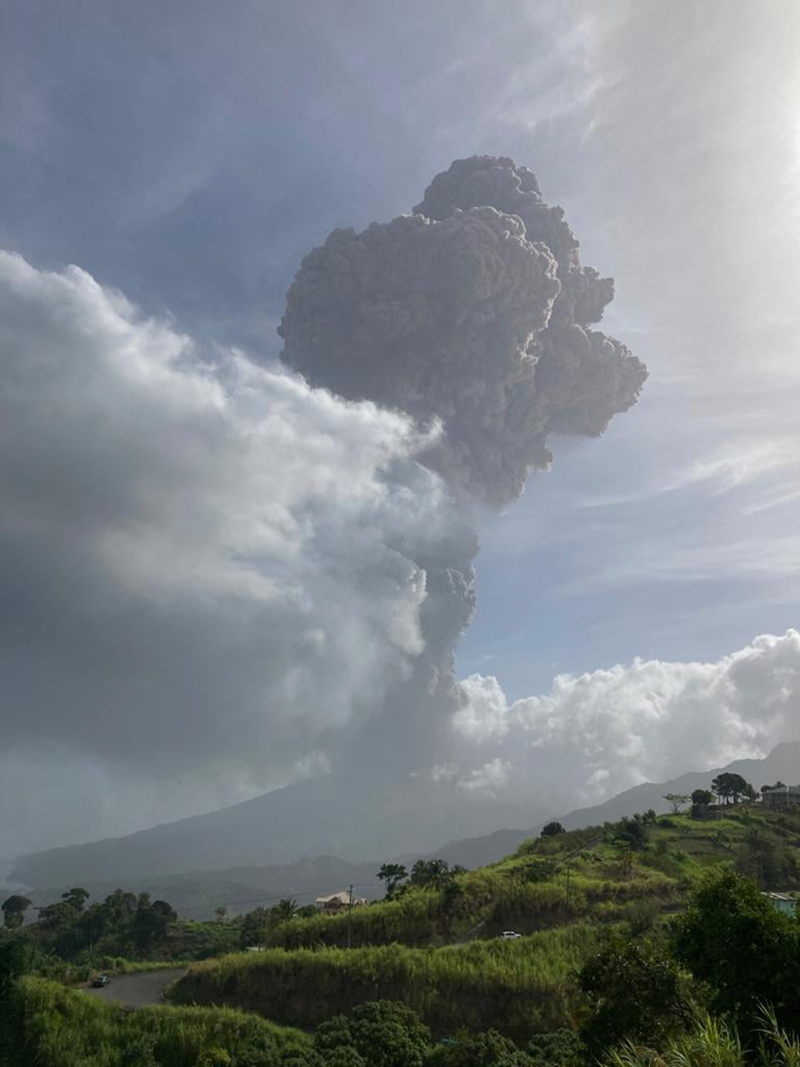 |
Figure 20. Photo of the first ash plume from Soufrière St. Vincent on 9 April 2021 that rose to 8 km altitude and drifted ENE at 0840. Courtesy of UWI-SRC. |
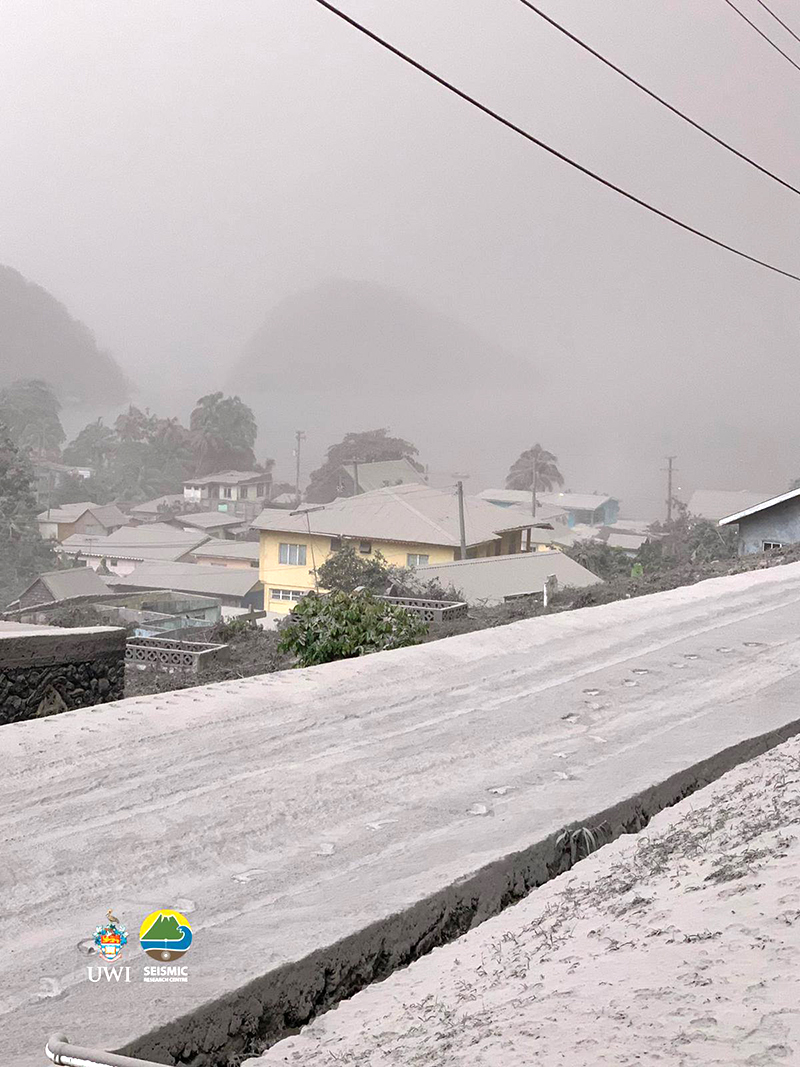 |
Figure 21. Photo showing ashfall in Chateaubelair during the eruption of Soufrière St. Vincent on 9 April 2021. Courtesy of Thomas Christopher, MVO, UWI-SRC. |
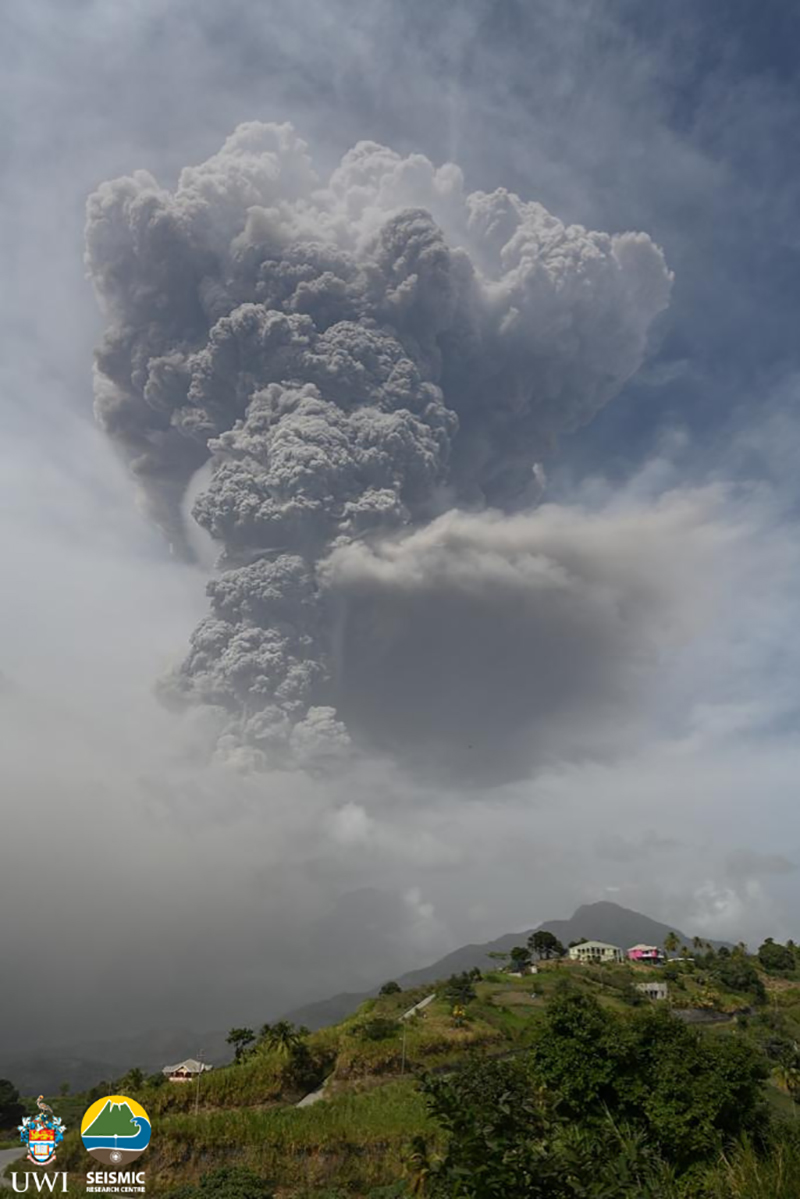 |
Figure 22. Photo of the second ash plume from Soufrière St. Vincent on 9 April 2021 that rose to 4 km altitude at 1445. Courtesy of UWI-SRC. |
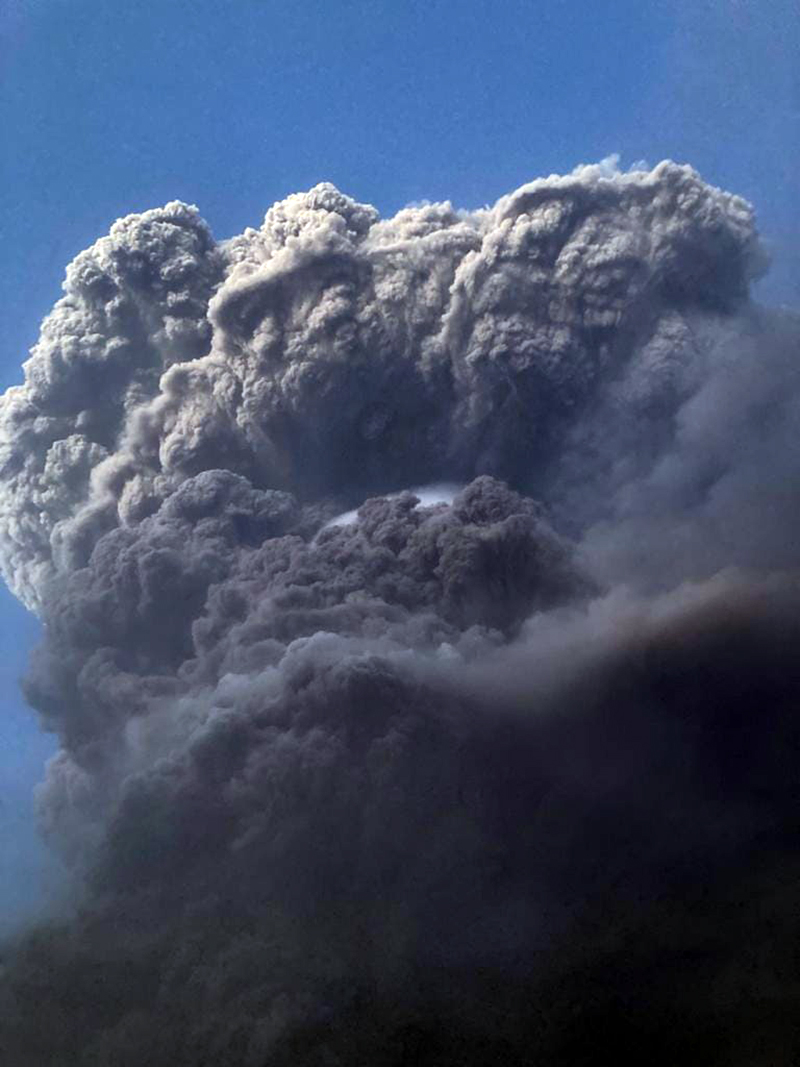 |
Figure 23. Photo of the third explosive eruption and its resulting ash plume from Soufrière St. Vincent on 9 April 2021 at 1835. Photo has been color corrected. Courtesy of UWI-SRC. |
Ashfall continued to be widespread on 10 April; deposit thickness varied from less than 1 mm in Colonaire (12.5 km SSE) to 10-15 mm in Rabacca (7.4 km SSE). Analysis of satellite imagery by UWI-SRC indicated that the explosions that began on 9 April destroyed the pre-existing 1979 and 2020-21 lava domes and created a crater 800 m in diameter. During the night of 10-11 April tremor lasting up to 20 minutes continued at intervals of 1.5-3 hours, associated with periods of explosions and ash emissions. Ashfall was observed in most areas of the St. Vincent Island, as well as on neighboring islands of the Grenadines (SSW), Barbados (165 km E), and Saint Lucia (50 km NNE). Explosions early on 11 April were followed by widespread power and water outages on the island, as reported by NEMO, and some houses had collapsed due to significant ashfall (figure 24). Around midday, the time between episodes of high-amplitude tremor lengthened from 1.5-4 hours to 5-8 hours, which continued to coincide with explosions and ash emissions. Small VT earthquakes were recorded around 1800. The VAAC reported that ash plumes rose to 12.2-16 km altitude throughout the day and continued to drift long distances to the ENE, E, and SE. On 12 April at 0415 a large explosion produced an ash plume that rose to 12.8 km altitude. The plume collapsed, generating pyroclastic flows that descended several valleys on S and W flanks, reaching the coast at Morne Ronde (4.3 km W), Larikai (3.5 km WNW), and Trois Loupes Bay (3.5 km NW) (figure 25). Extensive damage to vegetation was noted along the W coast, extending from Larikai Bay to Turner Bay. High-amplitude tremor episodes had stopped, but two low-amplitude and one high-amplitude episodes were recorded during 0600-1700. Explosivity or notable ash venting coincided with the episodes.
 |
Figure 24. Photo of collapsed structures due to the thick ash deposits from the explosions in early April 2021 at Soufrière St. Vincent. Courtesy of UWI-SRC. |
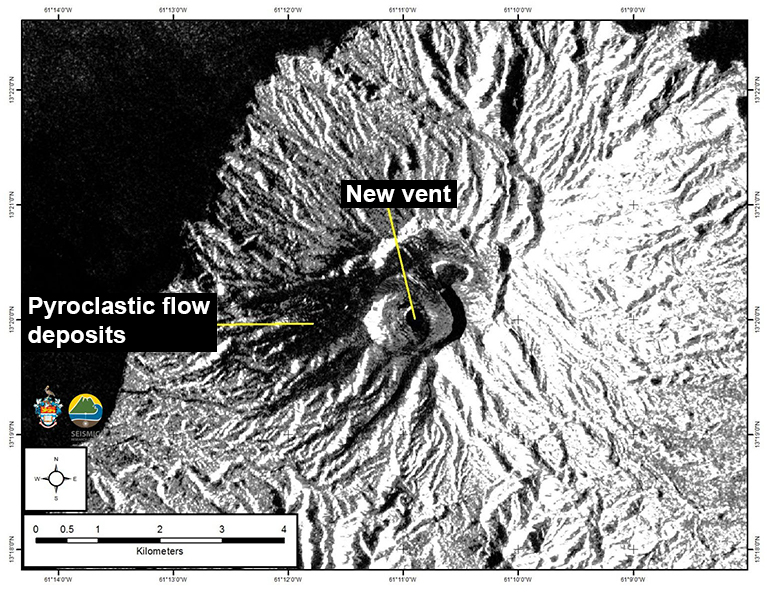 |
Figure 25. Image of Soufrière St. Vincent taken from the Sentinel-1 satellite on 11 April 2021 showing the changes of the summit crater with a possible smaller vent in the new crater. The darker black areas to the W of the summit are pyroclastic flow deposits from earlier explosive events. Courtesy of Adam Stinton, MVO, UWI-SRC. |
A series of Vulcanian explosions that began at 0630 on 13 April, and lasted about 30 minutes, was accompanied by large seismic tremors followed by more than three hours of smaller continuous tremors (figure 26). The VAAC stated that a dense ash plume rose to 11 km altitude and drifted E, SE, N, and NE (figure 27). Resulting pyroclastic flows traveled about 6 km WSW. Observations made during the afternoon indicated that pyroclastic flows had reached the ocean in every valley extending from Larikai to Wallibou, a length of about 5 km. The Washington VAAC reported a new ash emission rising to 7.6 km altitude at 1850 that was associated with a thermal anomaly. Another explosion at 2030 pulsed for more than 40 minutes and produced pyroclastic flows that traveled toward the Rabacca River on the E coast of the island. Lahar deposits were reported in the Sandy Bay area. Another large explosion was detected at 2300, according to UWI-SRC. The Montserrat Volcano Observatory stated that a sulfur odor and minor ashfall from Soufrière St. Vincent was observed on their island (390 km NNW).
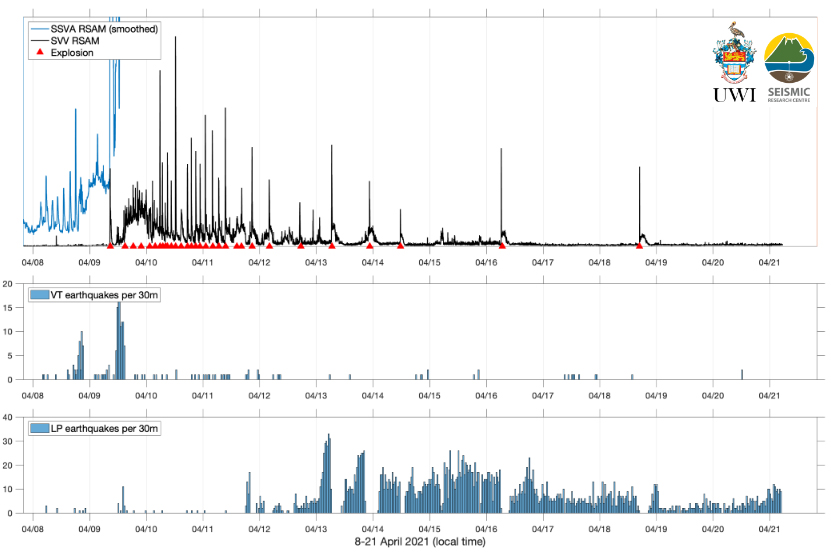 |
Figure 26. Plot summarizing the seismic data at Soufrière St. Vincent during 8-21 April 2021. The top panel shows the Real-Time Seismic Amplitude Measurement (RSAM) data from seismic stations SSVA and SVV. The SSVA data shows the banded tremor that started on 8 April and the continuous tremor prior to the first explosion. The red triangles represent the time of explosions, based on satellite imagery that was analyzed by scientists at the University of East Anglia. Data transmission from SSVA stopped when it was likely destroyed by an explosion. The SVV data shows the high-amplitude tremor generated during a series of explosions. The bottom two panels show the number of volcano-tectonic (VT) and long-period (LP) earthquakes detected by the seismic network. The number and intensity of LP earthquakes have increased since late 11 April. Courtesy of Roderick Stewart, MVO, UWI-SRC. |
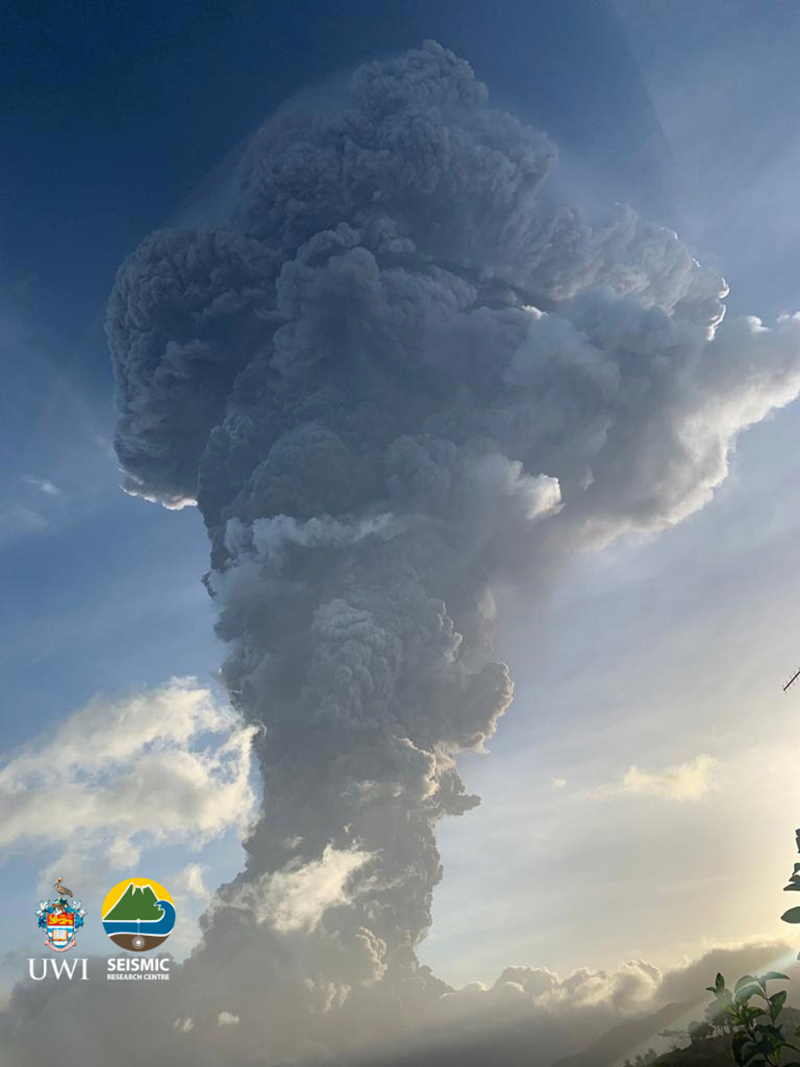 |
Figure 27. Photo of a strong ash plume rising above Soufrière St. Vincent on 13 April 2021. Courtesy of Thomas Christopher, MVO, UWI-SRC. |
During 14 April seismicity continued to be characterized by episodes of tremor about 13-15 hours apart, separated by swarms of small LP earthquakes. At 1135 a band of seismic tremor, associated with an explosion, was recorded, though the emissions were gas-rich and less energetic. Another episode of tremor began at 0230 on 15 April, as well as increased ash venting. The seismic network recorded a near-constant swarm of LP and hybrid earthquakes throughout the day with three brief episodes of low-level tremor each lasting less than 30 minutes. Tremor starting at 2100 lasted about 40 minutes and may have been associated with a minor increase in venting. Sulfur dioxide emissions were successfully measured by ground-based instruments; scientists on a Coast Guard boat along the W coast recorded 809 tons/day.
Periods of tremor and near-constant LP and hybrid earthquake swarms continued on 16 April. One tremor episode on 16 April at 0615 that lasted about three minutes was accompanied by an explosion, followed by more than two hours of low-level tremor. The resulting ash plumes rose to 8 km altitude and drifted W. Sulfur dioxide measurements showed an average of 460 tons/day; some SO2 plumes were reported to have reached India.
Satellite images showed a series of changes to the newly formed crater in the SW part of the crater (figure 28). Updated measurements were taken of the new crater, by 17 April according to an Institut de Physique du Globe de Paris scientist. It was approximately 900 m N to S, 750 m E to W, and at least 100 m deep, based on RADAR data (figure 29). Several vents were identified or inferred by emissions points of gas-and-steam and ash plumes. During 17 and 18 April the average SO2 flux was 232 and 391 tons/day, respectively.
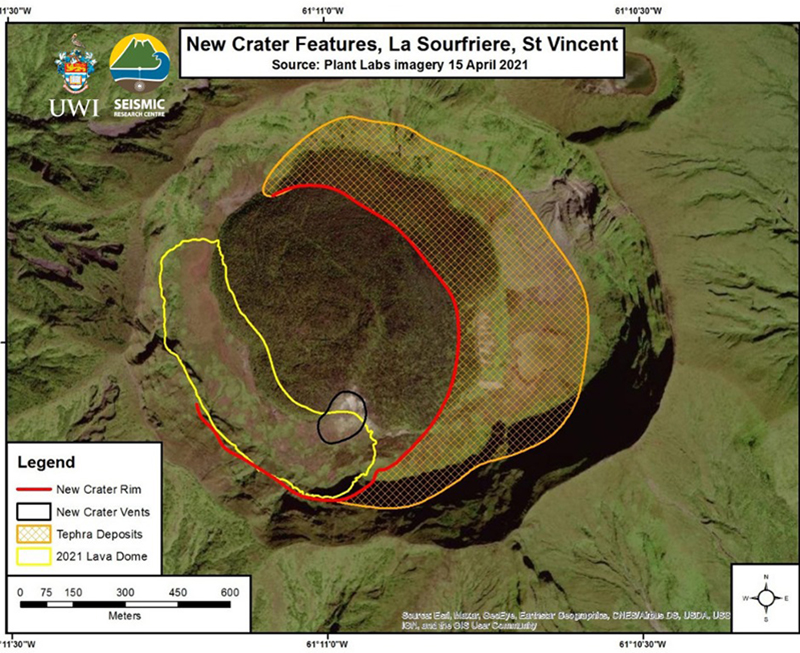 |
Figure 28. New crater features were visible at the Soufrière St. Vincent summit in a 15 April 2021 satellite image from Planet Labs. Continued explosions created a new crater (red line) in the SW part of the larger summit crater that was approximately 900 m N-S, at least 750 m E-W, and 100 m deep. The orange patterned section represents tephra deposits. The yellow line outlines the 2020-21 lava dome. Several vents were established, based on gas-and-steam and ash plumes; only one could be seen clearly (black outline). Courtesy of UWI-SRC. |
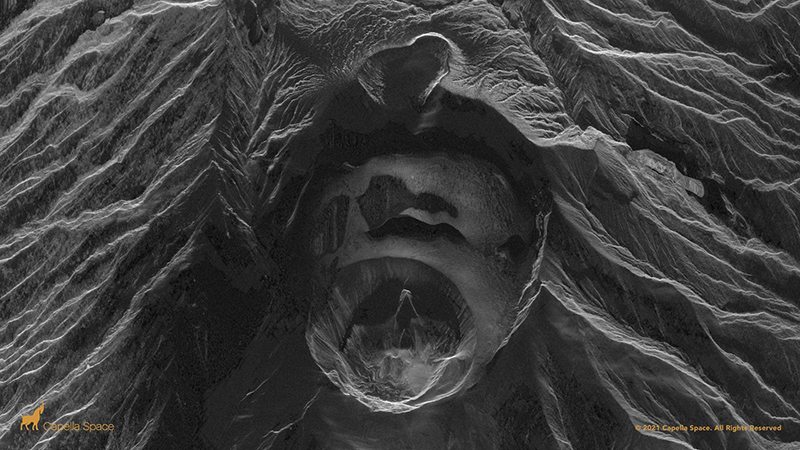 |
Figure 29. Satellite radar image from Capella Space acquired on 14 April 2021 showed the changes of the Soufrière St. Vincent summit crater following numerous explosions. The large depression in the middle of the image used to contain the 1979 and 2020-21 lava domes; explosions that began on 9 April destroyed both, leaving a smaller crater about 800 m in diameter. The base of the crater is distorted due to the presence of ash in the atmosphere and the ongoing eruption. North in the image is to the upper left corner. Courtesy of Adam Stinton, MVO, UWI-SRC. |
A period of tremor at 1649 on 18 April was accompanied by an explosion that sent an ash plume to 8 km altitude and drifted S and SW (figure 30). This was the 30th distinct explosion since the explosive phase began. The period of tremor lasted until about 2100 and was followed by ongoing small VT, LP, and hybrid earthquakes. The rate of these events decreased by 0100 on 19 April. A single rockfall event was detected at 0139, possibly due to the growing lava dome, though there was no visual confirmation. Few, but intermittent, rockfall events, VT earthquakes, and an increasing number of small LP and hybrid earthquakes were detected through 21 April (see figure 26). The seismic station at Bamboo Range recorded a lahar on 20 April at 0400 which lasted about 30 minutes and may have descended a SE-flank valley. SO2 measurements taken near the W coast showed an average flux of 350 tons/day. NEMO reported that 12,775 people were displaced by 19 April, with 6,208 people in 85 public shelters and 6,567 people (1,800 families) in private shelters.
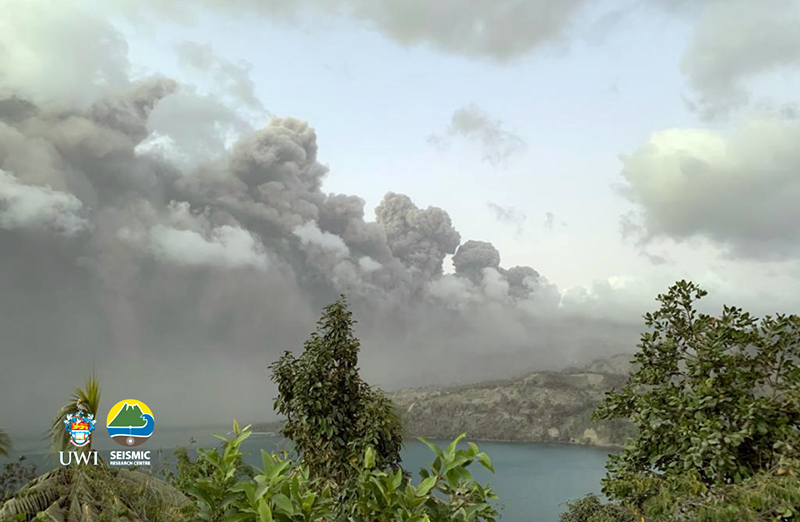 |
Figure 30. Photo of ash plumes rising above Soufrière St. Vincent and drifted S and SW on 18 April 2021. Photo has been color corrected. Courtesy of Thomas Christopher, MVO, UWI-SRC. |
On 22 April at 1108 explosions generated an ash plume that rose to 8 km altitude and drifted mainly N over the ocean (figure 31). A high-level seismic tremor was also detected at 1109 that lasted for 20 minutes. During the initial stages of the explosion a pyroclastic flow was observed traveling down the W flank, reaching an average speed of 33 km/hour. Around 2100 the seismic network recorded multiple lahars, though their location could not be determined. According to data from NEMO, 13,154 people had been displaced by 21 April, with 6,208 people in 85 public shelters and 6,790 people (1,618 families) in private shelters.
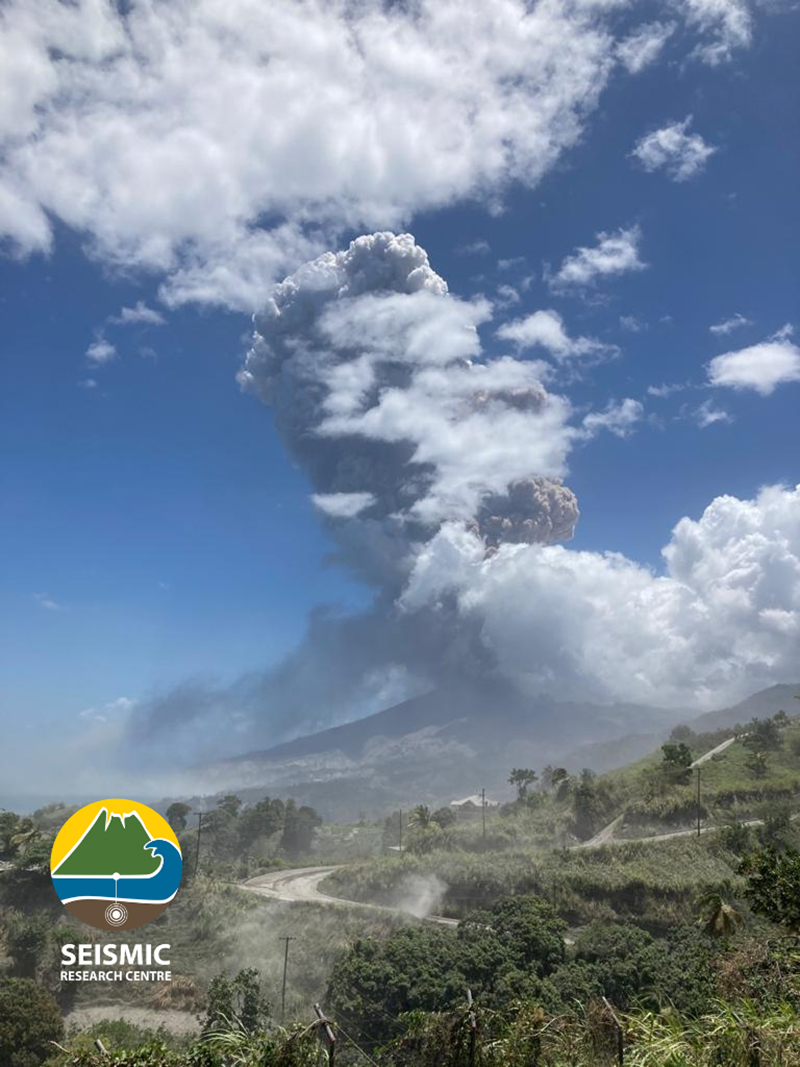 |
Figure 31. Photo of an ash plume rising to 8 km altitude above Soufrière St. Vincent at 1108 on 22 April 2021. Courtesy of Richard Robertson, UWI-SRC. |
Seismicity dropped to low levels after the explosion on 22 April and remained low through 27 April; only a few VT, LP, and hybrid earthquakes were recorded. The average SO2 flux was 992 tons/day on 23 April, again recorded from the W coast. Satellite radar imagery acquired on 24 April indicated possible growth at the lava dome following the explosions on 18 and 22 April. During an overflight on 26 April scientists observed white gas-and-steam emissions from several locations along the crater floor, though visibility was poor. No lava dome was visible, but a possible spine-like protrusion was seen through the clouds. Lahars in the Red and Orange zones were recorded by the seismic network at 0900 and 1000 on 27 April, during and after rainfall. Multiple lahars continued to be recorded by the seismic network within all drainages during 28-30 April due to heavy rainfall (figure 32). Trees brought down by lahars reached the ocean, where the floating logs created a hazard for small boats along the coastline. SO2 measurements taken from a boat on the W coast yielded a flux of 1,036 tons/day. On 6 May the Volcanic Alert Level was lowered to Orange (the second highest on a four-color scale) because no explosions had been recorded since 22 April and the number of volcanic earthquakes had decreased significantly.
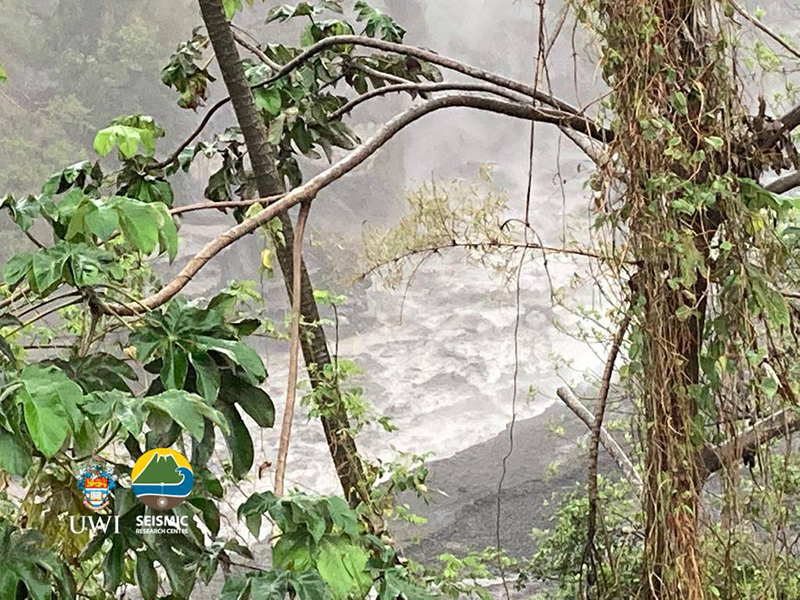 |
Figure 32. Photo of lahars in the Wallibou River near Soufrière St. Vincent on the morning of 29 April 2021 due to heavy rainfall. Courtesy of UWI-SRC. |
Additional satellite data. Daily satellite-based sulfur dioxide measurements were notable beginning on 9 April. The initial explosion at 0840 showed relatively minor SO2 emissions, though as the day progressed stronger plumes drifted E over the Atlantic Ocean (figure 33). As strong explosive activity continued at Soufrière St. Vincent, strong SO2 plumes exceeding 2 Dobson Units (DUs) were detected during 9-14 April, moving generally E, based on data from the TROPOMI instrument on the Sentinel-5P satellite.
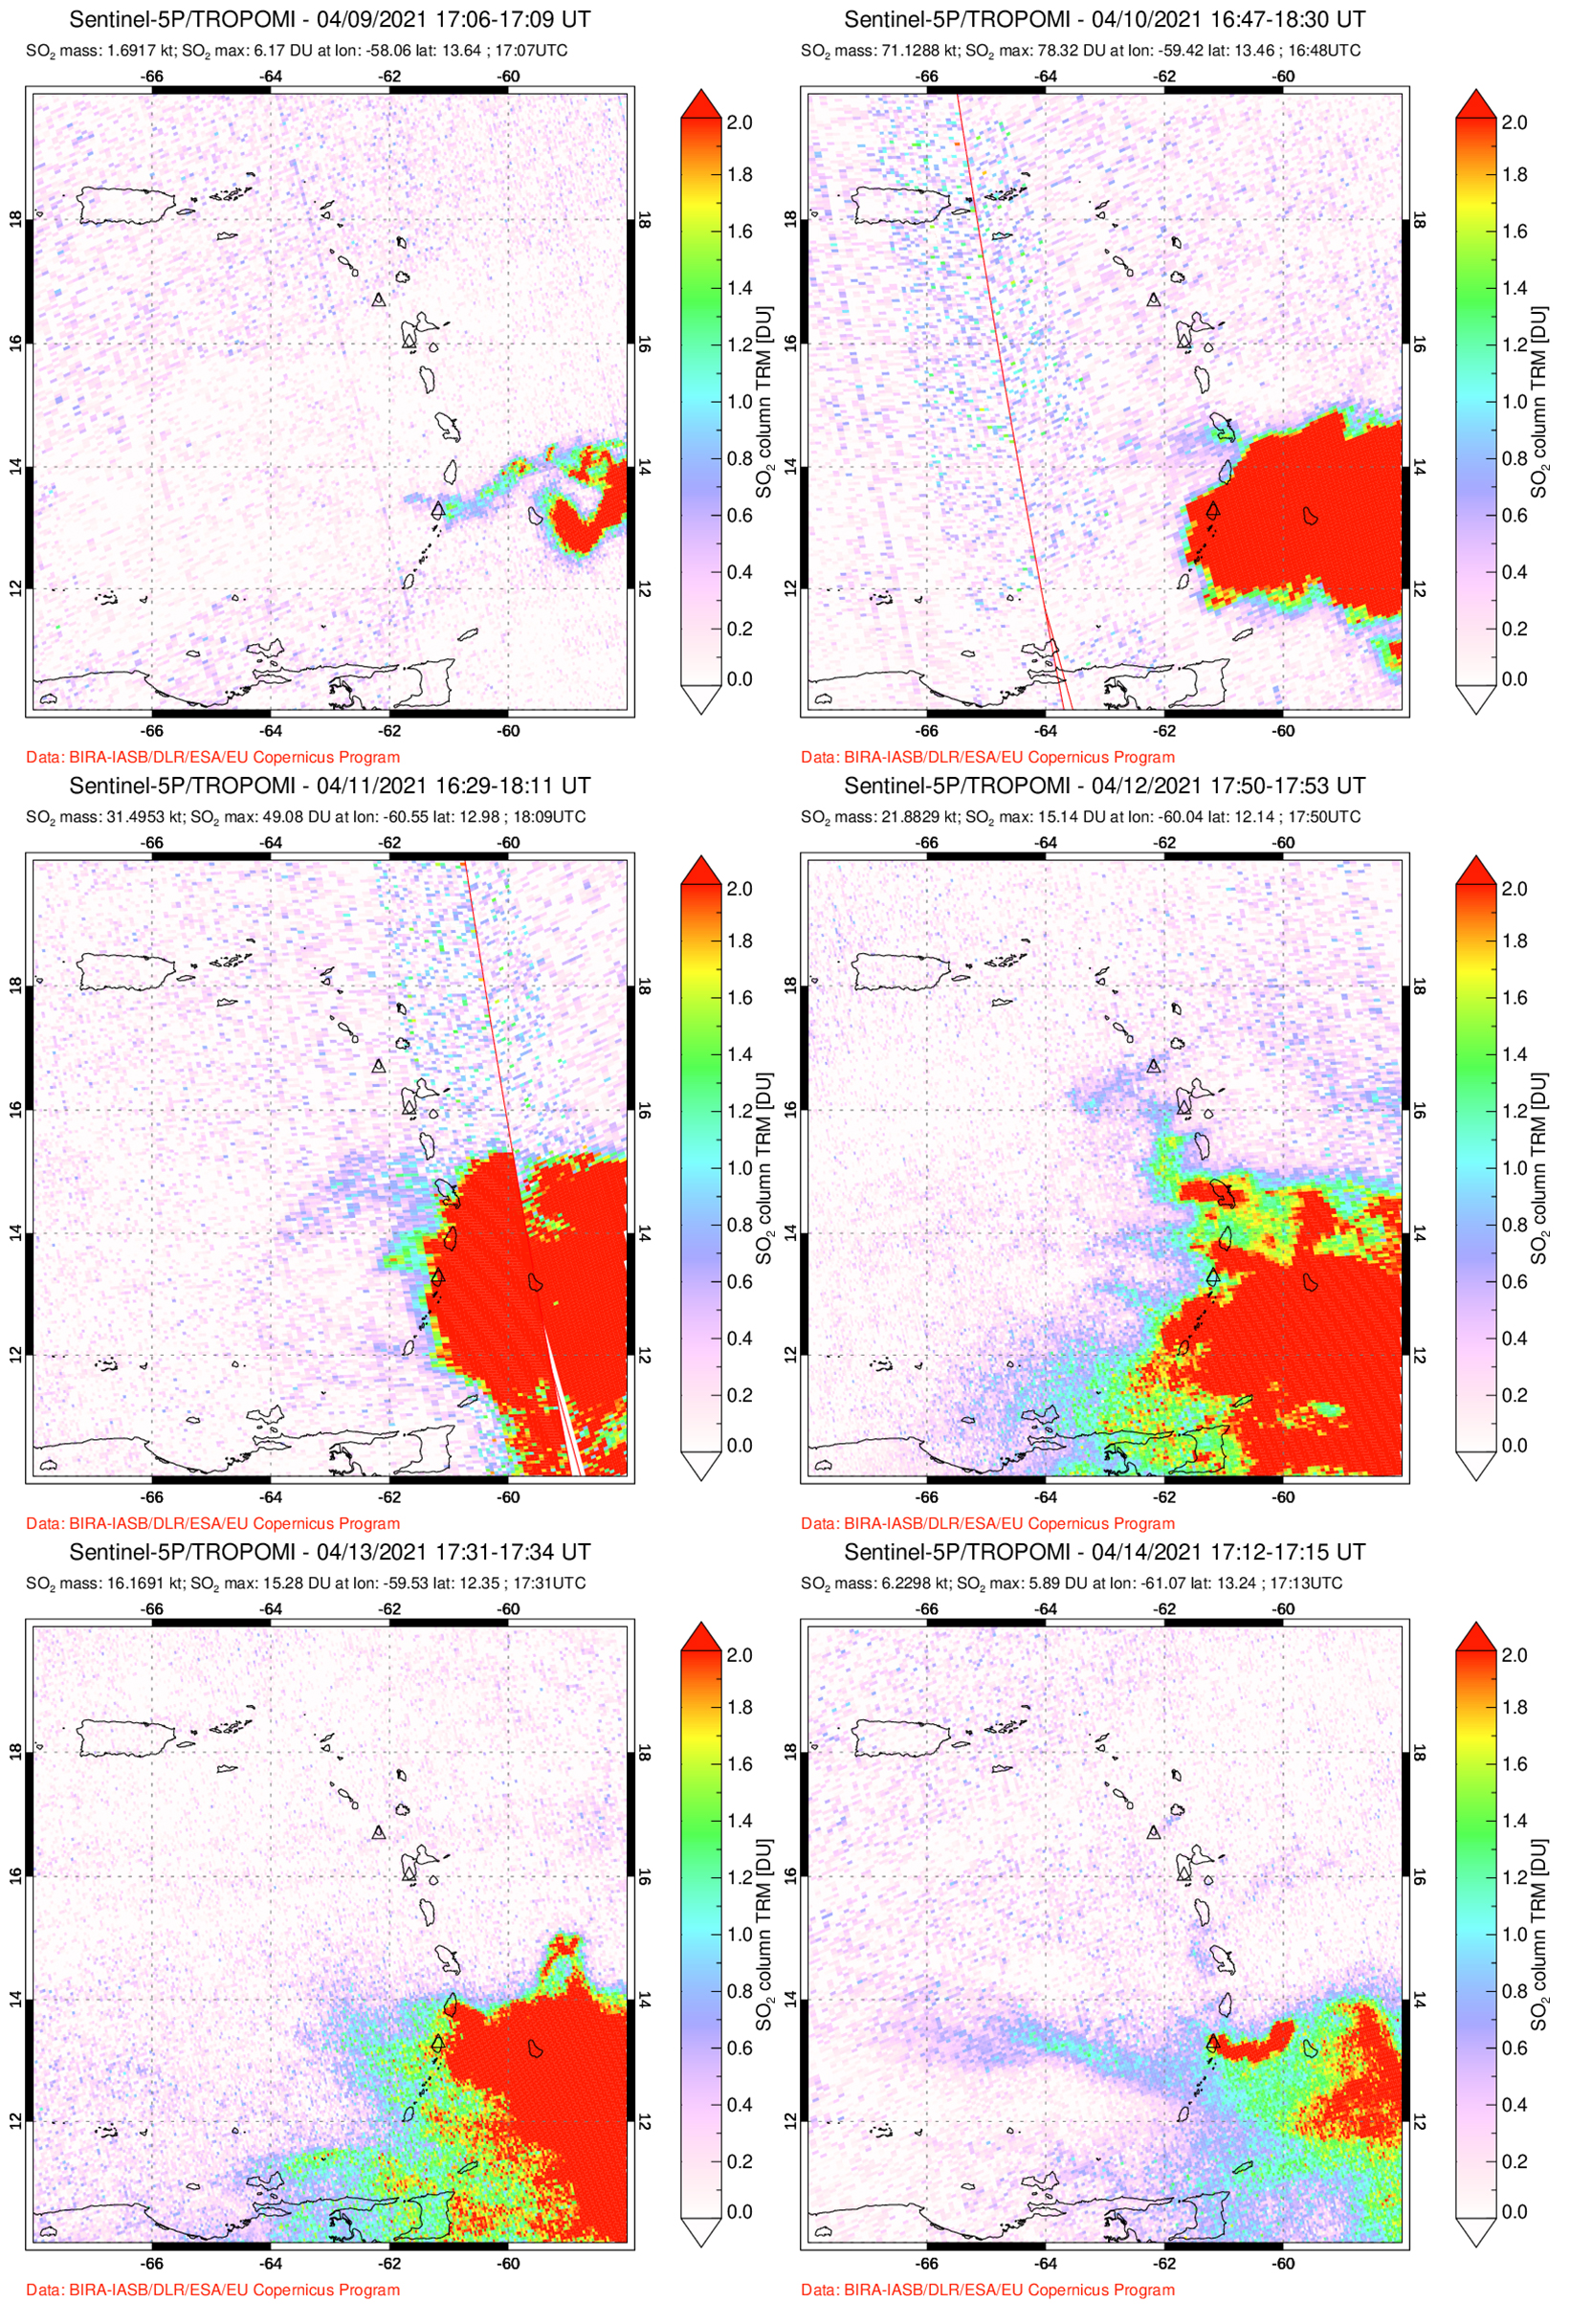 |
Figure 33. Strong and distinct SO2 plumes from Soufrière St. Vincent were detected by the TROPOMI instrument on the Sentinel-5P satellite during 9-14 April 2021 on days with strong explosive activity and ash venting. The plumes generally drifted E over the Atlantic Ocean. Courtesy of NASA Global Sulfur Dioxide Monitoring Page. |
MIROVA (Middle InfraRed Observation of Volcanic Activity) analysis of MODIS satellite data detected a single thermal anomaly during mid-March 2021, followed by a brief break in activity (figure 34). Thermal activity resumed in April, occurring in three distinct clusters of moderate-power anomalies throughout the month. Two thermal hotspots were detected using the MODVOLC thermal algorithm on 24 April. Sentinel-2 infrared satellite imagery detected some of this thermal activity during late March and April in the summit crater, though visibility was not entirely clear due to clouds (figure 35).
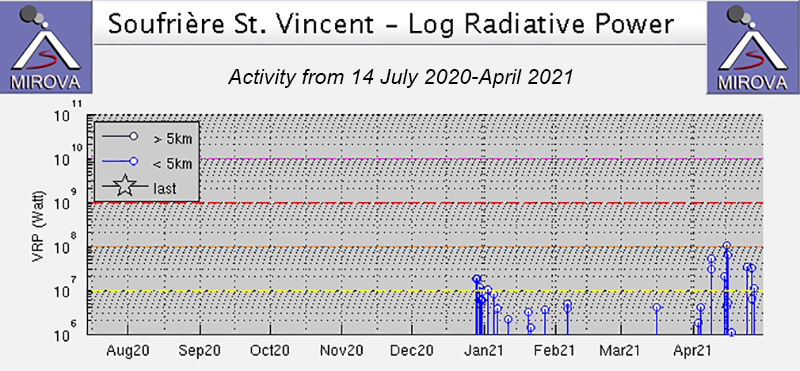 |
Figure 34. A single thermal anomaly at Soufrière St. Vincent was detected during mid-March 2021. Thermal activity resumed in early April, occurring in three distinct clusters of moderate-power anomalies, as reflected in the MIROVA data (Log Radiative Power). Courtesy of MIROVA. |
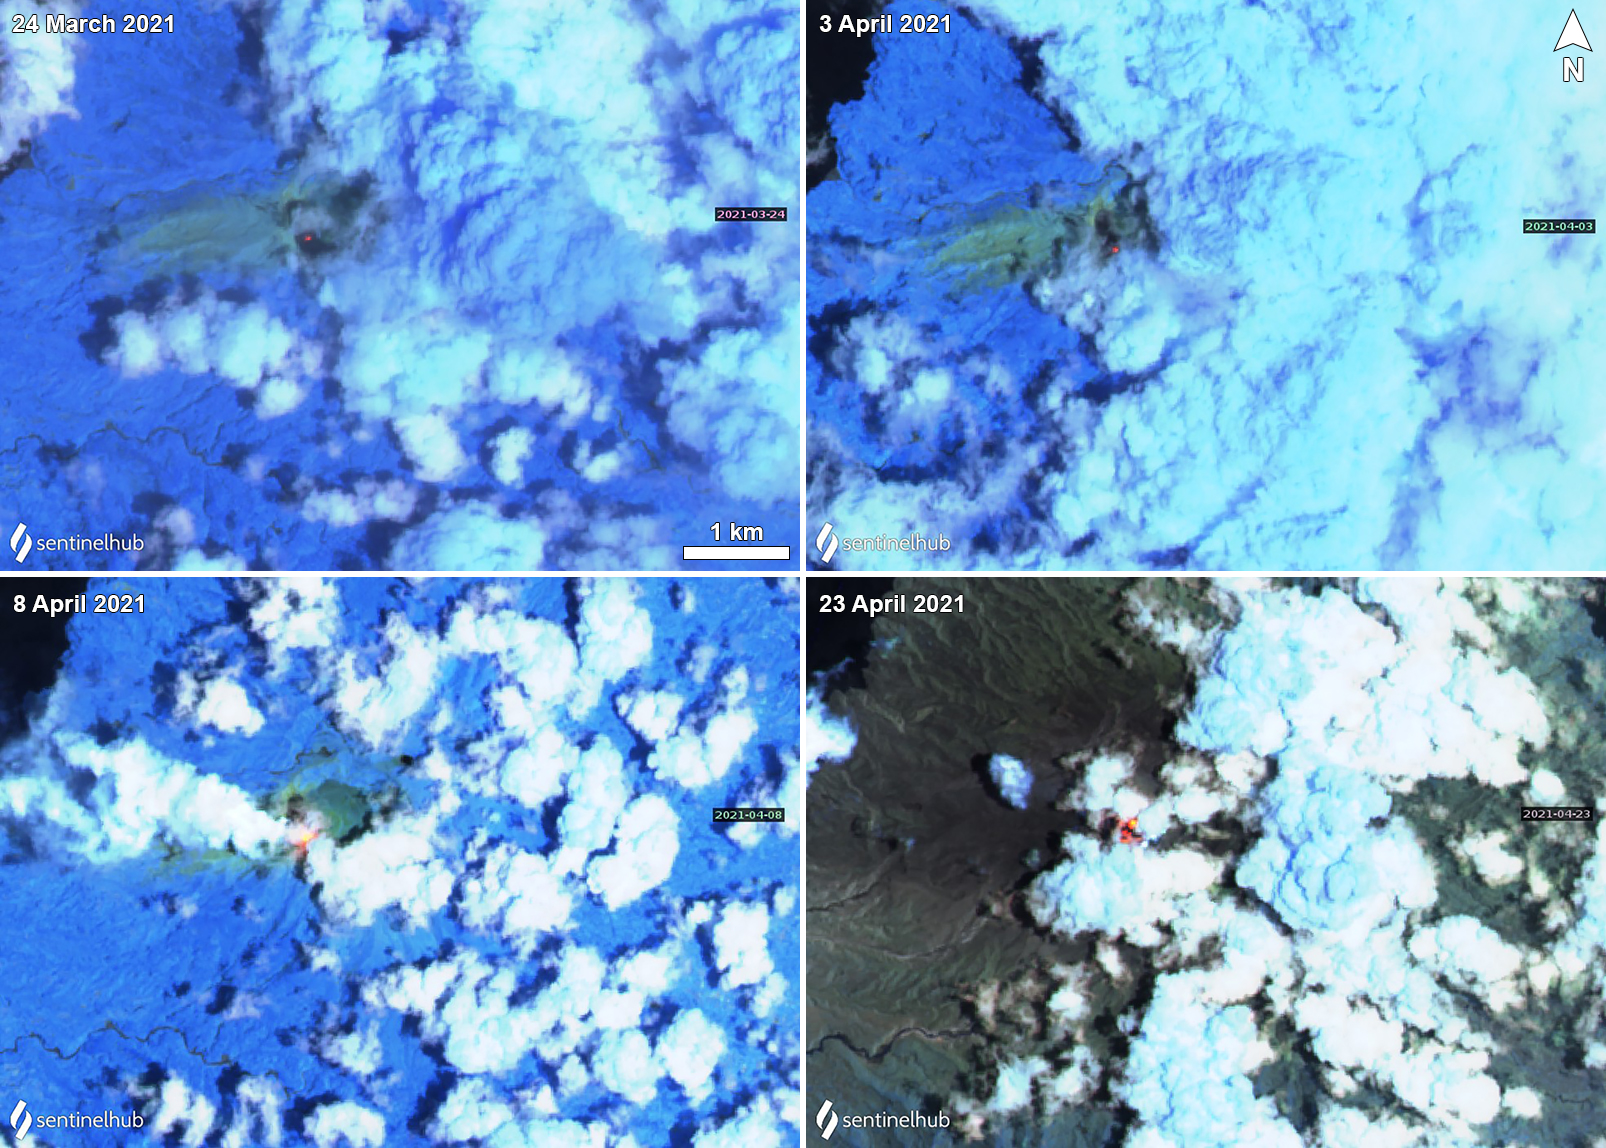 |
Figure 35. Sentinel-2 infrared satellite imagery showing a faint thermal anomaly (orange) in the summit crater of Soufrière St. Vincent on 24 March (top left), 3 April (top right), 8 April (bottom left), and 23 April (bottom right) 2021, though clouds covered most of the crater. Images using “Atmospheric penetration” rendering (bands 12, 11, 8a). Courtesy of Sentinel Hub Playground. |
Geological Summary. Soufrière St. Vincent is the northernmost and youngest volcano on St. Vincent Island. The NE rim of the 1.6-km wide summit crater is cut by a crater formed in 1812. The crater itself lies on the SW margin of a larger 2.2-km-wide caldera, which is breached widely to the SW as a result of slope failure. Frequent explosive eruptions after about 4,300 years ago produced pyroclastic deposits of the Yellow Tephra Formation, which cover much of the island. The first historical eruption took place in 1718; it and the 1812 eruption produced major explosions. Much of the northern end of the island was devastated by a major eruption in 1902 that coincided with the catastrophic Mont Pelée eruption on Martinique. A lava dome was emplaced in the summit crater in 1971 during a strictly effusive eruption, forming an island within a lake that filled the crater. A series of explosive eruptions in 1979 destroyed the 1971 dome and ejected the lake; a new dome was then built.
Information Contacts: University of the West Indies Seismic Research Centre (UWI-SRC), University of the West Indies, St. Augustine, Trinidad & Tobago, West Indies (URL: http://www.uwiseismic.com/); National Emergency Management Organisation (NEMO), Government of Saint Vincent and the Grenadines, Biseé, PO. Box 1517, Castries, Saint Lucia, West Indies (URL: http://nemo.gov.lc/); Washington Volcanic Ash Advisory Center (VAAC), Satellite Analysis Branch (SAB), NOAA/NESDIS OSPO, NOAA Science Center Room 401, 5200 Auth Rd, Camp Springs, MD 20746, USA (URL: www.ospo.noaa.gov/Products/atmosphere/vaac, archive at: http://www.ssd.noaa.gov/VAAC/archive.html); Hawai'i Institute of Geophysics and Planetology (HIGP) - MODVOLC Thermal Alerts System, School of Ocean and Earth Science and Technology (SOEST), Univ. of Hawai'i, 2525 Correa Road, Honolulu, HI 96822, USA (URL: http://modis.higp.hawaii.edu/); NASA Global Sulfur Dioxide Monitoring Page, Atmospheric Chemistry and Dynamics Laboratory, NASA Goddard Space Flight Center (NASA/GSFC), 8800 Greenbelt Road, Goddard, Maryland, USA (URL: https://so2.gsfc.nasa.gov/); MIROVA (Middle InfraRed Observation of Volcanic Activity), a collaborative project between the Universities of Turin and Florence (Italy) supported by the Centre for Volcanic Risk of the Italian Civil Protection Department (URL: http://www.mirovaweb.it/); Sentinel Hub Playground (URL: https://www.sentinel-hub.com/explore/sentinel-playground); Jenni Barclay, University of East Anglia, Norwich Research Park, Norwich, Norfolk, NR4 7TJ, UK (URL: https://research-portal.uea.ac.uk/en/persons/jenni-barclay); Ian Renfrew, University of East Anglia, Norwich Research Park, Norwich, Norfolk, NR4 7TJ, UK (URL: https://research-portal.uea.ac.uk/en/persons/ian-renfrew).