UWI Seismic Research Centre and National Emergency Management Organisation (NEMO) lowered the Alert Level for Soufrière St. Vincent to Green (the lowest level on a four-color scale) on 16 March, noting that seismic and fumarolic activity were at or below background levels recorded prior to the 2020-2021 eruption. The La Soufriere trail remained closed due to the uneven and dangerous terrain. The public was reminded about lahar hazards during heavy rains.
Sources: University of the West Indies Seismic Research Centre (UWI-SRC), National Emergency Management Organisation (NEMO), Government of Saint Vincent and the Grenadines
Intermittent explosions, ash plumes, seismicity, and a growing lava dome during March-April 2021
Soufrière St. Vincent (also referred to as “La Soufrière”) is the northernmost stratovolcano on St. Vincent Island in the southern part of the Lesser Antilles. The NE rim of the 1.6-km-wide summit crater is cut by a crater (500 m wide and 60 m deep) that formed in 1812. Recorded eruptions date back to 1718, with notable eruptions occurring in 1812, 1902, and 1979. An eruption that began on 27 December 2020 was characterized by increased seismicity, the growth of a new lava dome on the SW edge of the main crater, crater incandescence, and gas-and-steam emissions (BGVN 46:03). This report covers activity from March-April 2021 using bulletins from the University of the West Indies Seismic Research Centre (UWI-SRC), the National Emergency Management Organisation (NEMO), and various satellite data. Soufrière St. Vincent is monitored by the SRC assisted by the Soufrière Monitoring Unit (SMU) from the Ministry of Agriculture in Kingstown.
As of 2004, the monitoring network had consisted of five seismic stations, eight GPS stations, and several dry tilt sites. Seismic data are transmitted from field sites to the Belmont Observatory (9 km SSW), which is operated by the SMU. On 1 March a new seismic station installed at the National Parks Interpretation Center at Bamboo Range on the E side of the volcano became operational. Additionally, a new GPS monitoring station was placed in Fancy. Two more GPS stations were installed at Jacob’s Well and Table Rock on 19 March.
Activity during March 2021. The lava dome in the main crater continued to grow during March, expanding to the N, NW, S, and SE. Gas emissions persisted in the summit area from the top of the dome and along the contact area between the pre-existing 1979 dome and the 2020-21 dome, damaging vegetation on the SW side of the volcano. A team visited the dome on 19 and 23 March to make observations, take measurements, and maintain monitoring equipment. On 19 March the dome was 105 m tall, 921 m long, and 243 m wide, with an estimated volume of 13.13 million cubic meters, based on drone surveys (figure 18). Compared to the previous drone survey on 12 February, the dome had grown roughly 6.3 million cubic meters. On 23 March at 1030 the seismic network recorded a swarm of small low-frequency events that lasted about 45 minutes, possibly associated with magma movement beneath the dome. Starting at 1653 the network also detected volcano-tectonic (VT) earthquakes, some of which had been felt in communities, including Fancy, Owia, and Sandy Bay. By 26 March the period of elevated VT earthquakes had ended; only small, low-frequency events associated with lava dome growth were recorded.
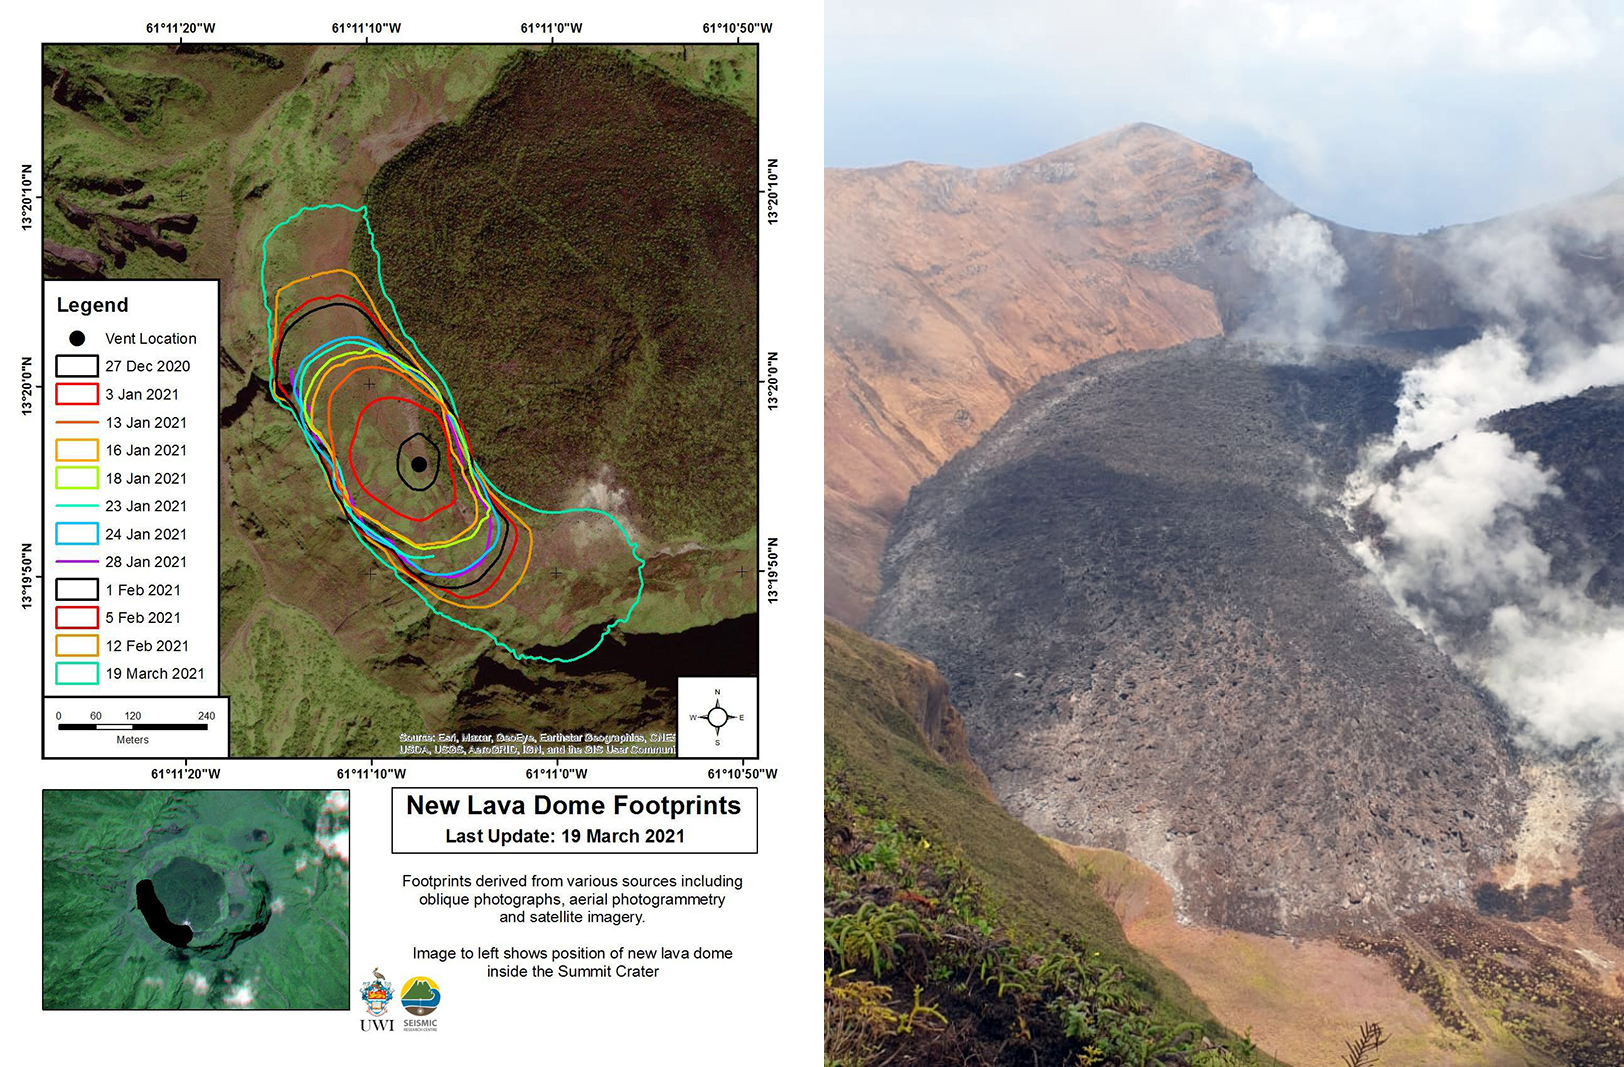 |
Figure 18. Map (left) showing the growth of the new lava dome at Soufrière St. Vincent from 27 December 2020 to 19 March 2021. The dome is located on the SW edge of the crater rim and WSW of the 1979 lava dome that is covered in vegetation. Photo (right) of the laterally growing lava dome (dark mass at left) taken on 19 March 2021. White gas-and-steam emissions are visible along the contact area with the 1979 dome (right), as well as damaged vegetation. Courtesy of SMU, UWI-SRC, and NEMO SVG. |
Activity during April 2021. The lava dome continued to grow to the N and S during April, accompanied by small earthquakes and gas-and-steam emissions rising both from the top of the dome and along the contact with the pre-existing 1979 dome. A new swarm of VT earthquakes was detected on 5 April at 0638, the number and magnitude continued to increase until 0830, after which they stabilized. These earthquakes were more intense and averaged 50/hour; the 23-25 March swarm averaged 1.5/hour. The largest event was registered as a Mw 3.5 at 0920 and was felt by local residents. At 1400 the rate of the earthquakes started to decline and then significantly dropped at 1600, though small VT events continued through 1800. Small earthquakes associated with dome growth were recorded on 7 April.
On 8 April UWI-SRC reported an increase in the volume of white gas-and-steam emissions rising from the summit crater and at 0300 scientists at the Belmont Observatory reported episodes of tremor that indicated the movement of magma and fluids near the surface. Subsequent tremor episodes at 0530, 0800, 1015, and 1300 showed increasing magnitude. Five long-period (LP) earthquakes and two brief swarms of VT events were detected between the tremor episodes; ash venting was also observed during the last episode. Sulfur dioxide emissions were also identified in satellite data. Visual observations from the Belmont Observatory during the early evening showed that the dome height had increased significantly during the day, and incandescent material over the vent area was visible in webcam images (figure 19). As a result, the Volcanic Alert Level (VAL) was raised to Red (the highest level on a four-color scale) at 1830 and the Prime Minister issued an evacuation order for communities in the Red Zone at the N end of the island, affecting 16,000-20,000 people.
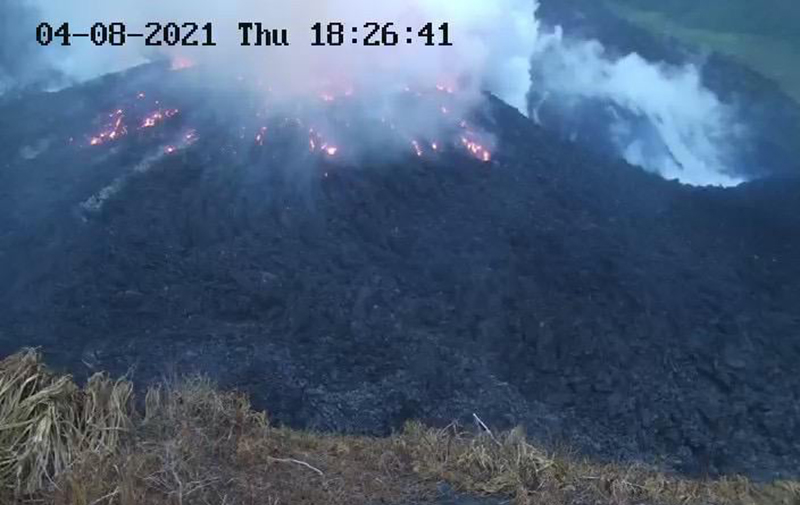 |
Figure 19. Webcam image of incandescent material in the summit crater of Soufrière St. Vincent on 8 April 2021, accompanied by white gas-and-steam emissions. Courtesy of UWI-SRC. |
On 9 April at 0840 scientists at the Belmont Observatory reported an explosion that generated an ash plume up to 8 km altitude that drifted mainly ENE (figure 20). Ash was deposited across the island, affecting communities including Chateaubelair, Petite Bordel, the Belmont Observatory, and areas at the S end of the island; it also forced the Argyle International Airport (20 km S) to close (figure 21). NEMO stated that evacuations in the Orange and Red Zones were affected by significant ashfall and poor visibility, but by the evening most residents had been evacuated. Seismicity increased at 1130, including an earthquake swarm lasting until 1440, though tremor continued to be reported. A second explosion at 1445 produced a vigorous ash plume that initially rose to 4 km altitude with lightning visible in the plume (figure 22). Successive explosions and ash pulses fed the plume for hours, rising to 16 km altitude. A third explosive series began at 1835 (figure 23). Ash venting continued through the night and into 10 April. Periods of banded tremor associated with explosive activity and stronger pulses of ash emissions to higher altitudes began at 0330 on 10 April, lasting for periods of 20-30 minutes with 1-3 hour gaps. The resulting ash plumes rose to 10.6-16 km altitude throughout the day. The Washington VAAC stated that ash plumes during 9-10 April had drifted as far as 1,200 km ESE and about 3,000 km ENE. The Grantley Adams International Airport (GAIA) in Barbados also closed.
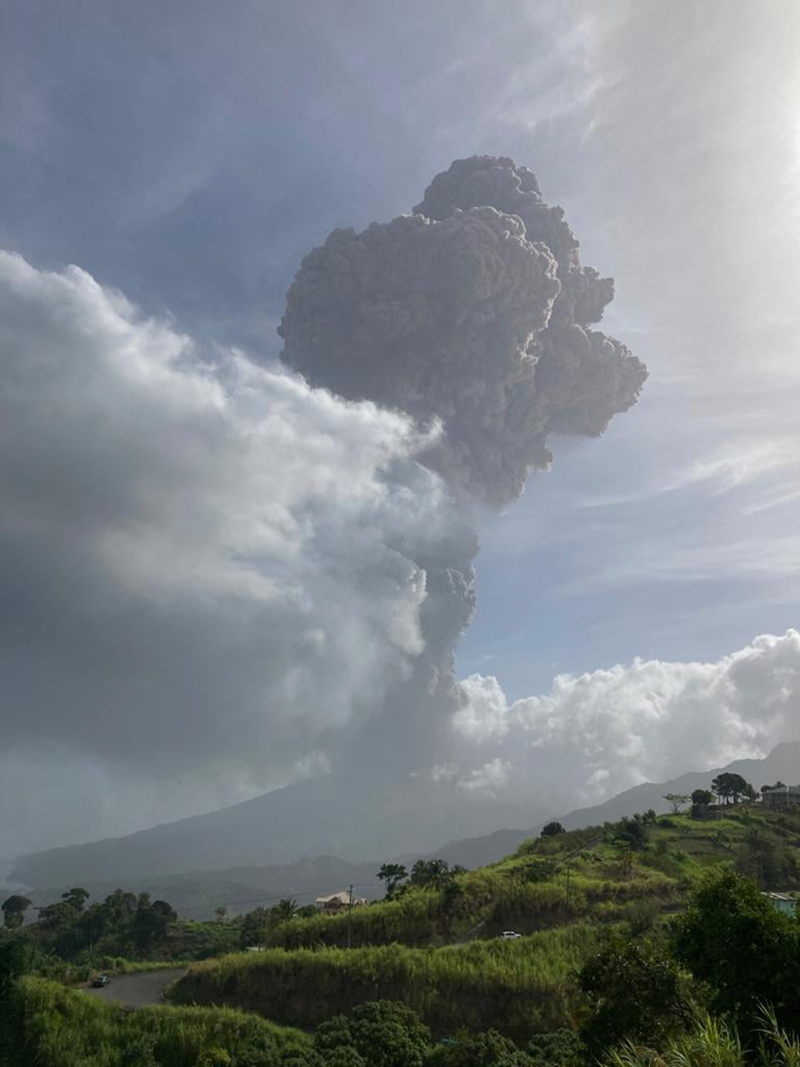 |
Figure 20. Photo of the first ash plume from Soufrière St. Vincent on 9 April 2021 that rose to 8 km altitude and drifted ENE at 0840. Courtesy of UWI-SRC. |
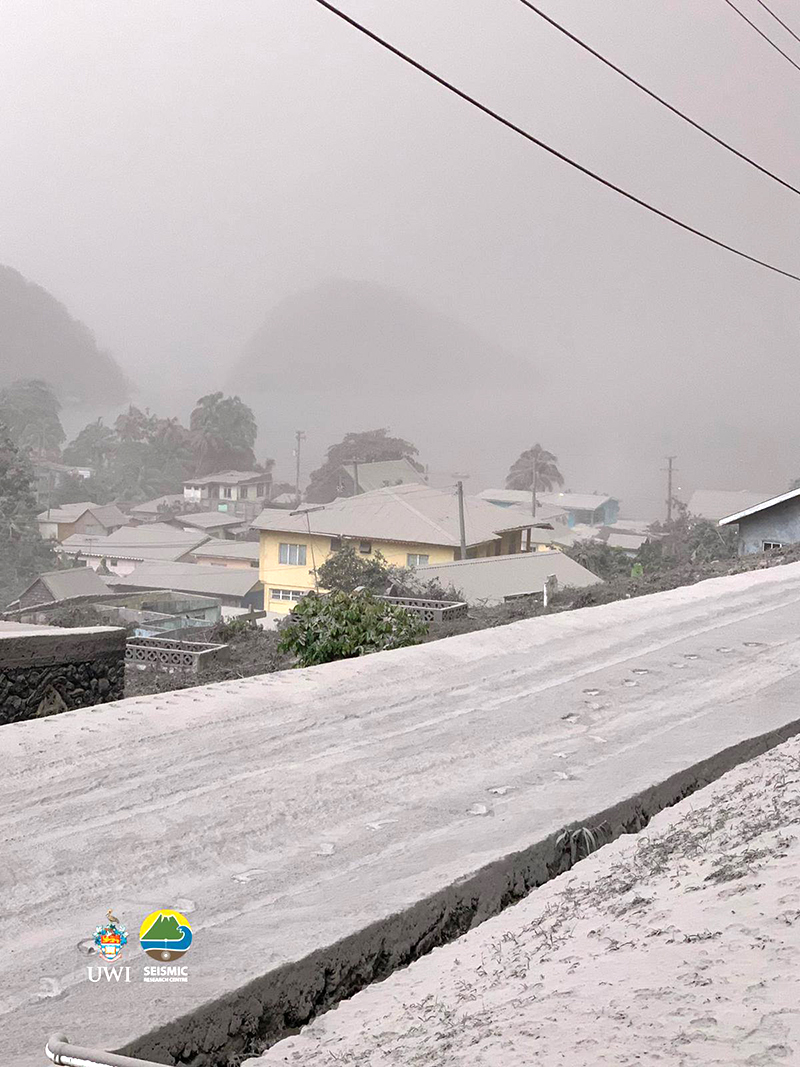 |
Figure 21. Photo showing ashfall in Chateaubelair during the eruption of Soufrière St. Vincent on 9 April 2021. Courtesy of Thomas Christopher, MVO, UWI-SRC. |
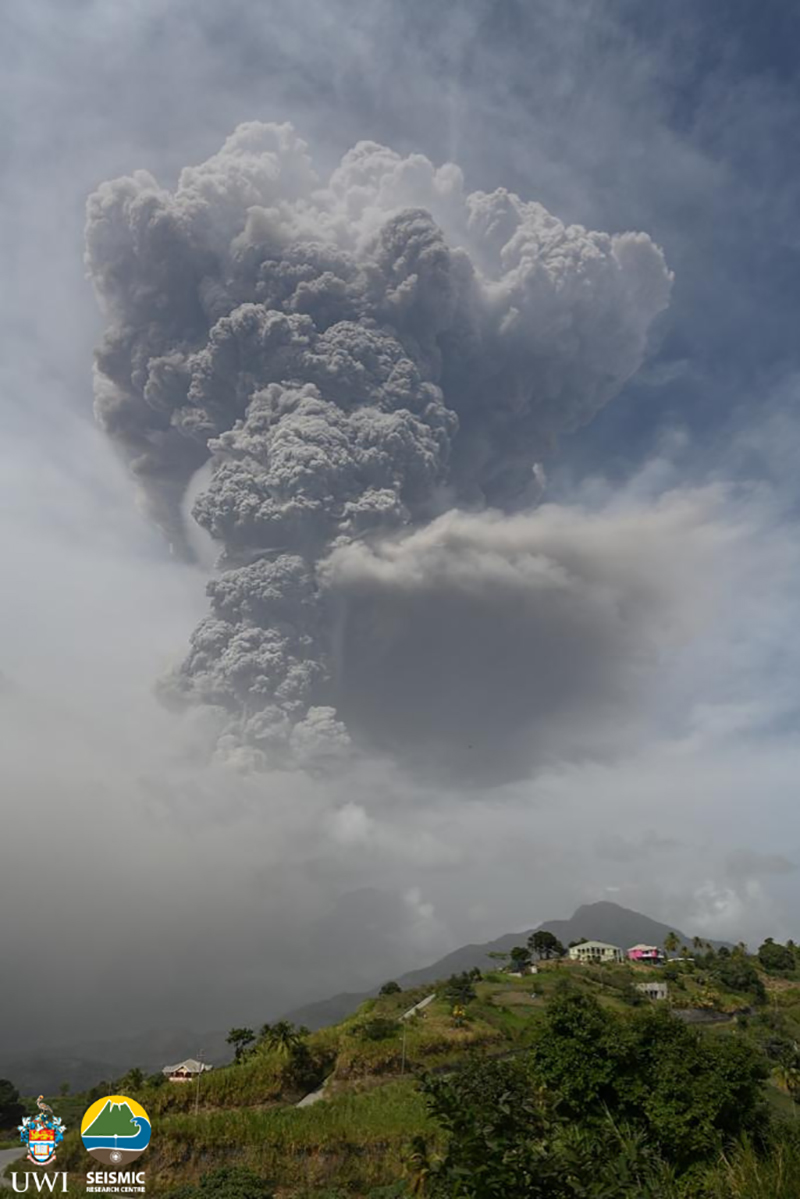 |
Figure 22. Photo of the second ash plume from Soufrière St. Vincent on 9 April 2021 that rose to 4 km altitude at 1445. Courtesy of UWI-SRC. |
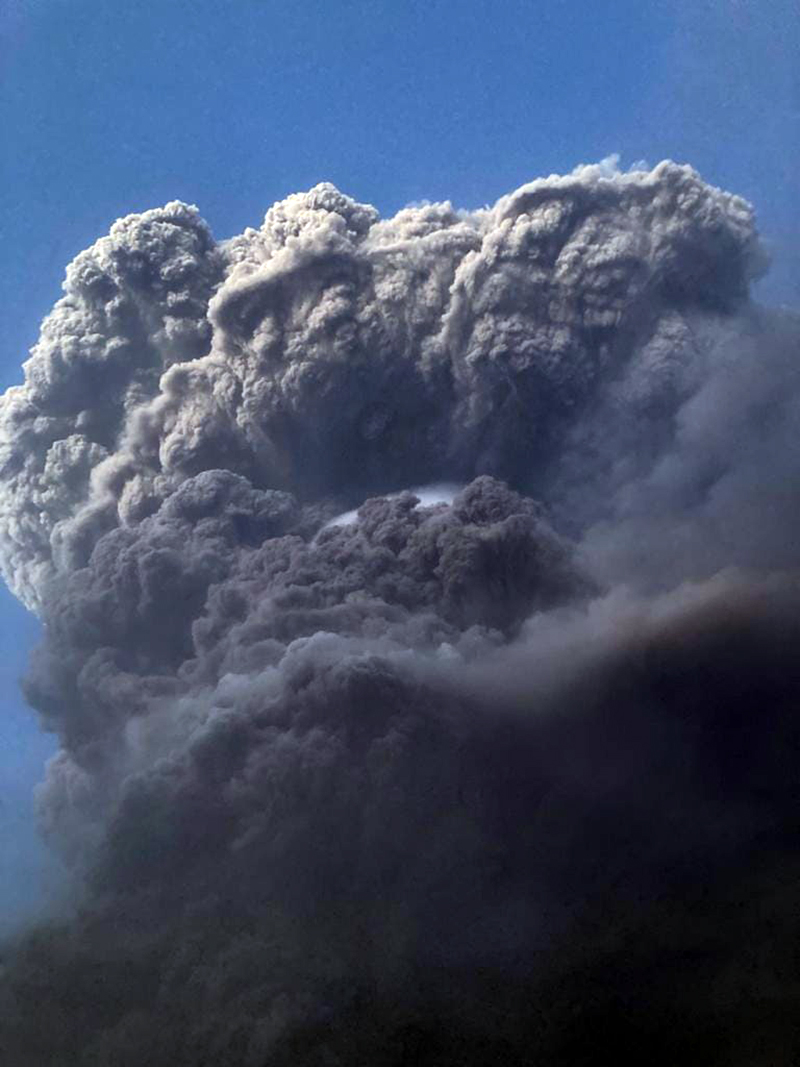 |
Figure 23. Photo of the third explosive eruption and its resulting ash plume from Soufrière St. Vincent on 9 April 2021 at 1835. Photo has been color corrected. Courtesy of UWI-SRC. |
Ashfall continued to be widespread on 10 April; deposit thickness varied from less than 1 mm in Colonaire (12.5 km SSE) to 10-15 mm in Rabacca (7.4 km SSE). Analysis of satellite imagery by UWI-SRC indicated that the explosions that began on 9 April destroyed the pre-existing 1979 and 2020-21 lava domes and created a crater 800 m in diameter. During the night of 10-11 April tremor lasting up to 20 minutes continued at intervals of 1.5-3 hours, associated with periods of explosions and ash emissions. Ashfall was observed in most areas of the St. Vincent Island, as well as on neighboring islands of the Grenadines (SSW), Barbados (165 km E), and Saint Lucia (50 km NNE). Explosions early on 11 April were followed by widespread power and water outages on the island, as reported by NEMO, and some houses had collapsed due to significant ashfall (figure 24). Around midday, the time between episodes of high-amplitude tremor lengthened from 1.5-4 hours to 5-8 hours, which continued to coincide with explosions and ash emissions. Small VT earthquakes were recorded around 1800. The VAAC reported that ash plumes rose to 12.2-16 km altitude throughout the day and continued to drift long distances to the ENE, E, and SE. On 12 April at 0415 a large explosion produced an ash plume that rose to 12.8 km altitude. The plume collapsed, generating pyroclastic flows that descended several valleys on S and W flanks, reaching the coast at Morne Ronde (4.3 km W), Larikai (3.5 km WNW), and Trois Loupes Bay (3.5 km NW) (figure 25). Extensive damage to vegetation was noted along the W coast, extending from Larikai Bay to Turner Bay. High-amplitude tremor episodes had stopped, but two low-amplitude and one high-amplitude episodes were recorded during 0600-1700. Explosivity or notable ash venting coincided with the episodes.
 |
Figure 24. Photo of collapsed structures due to the thick ash deposits from the explosions in early April 2021 at Soufrière St. Vincent. Courtesy of UWI-SRC. |
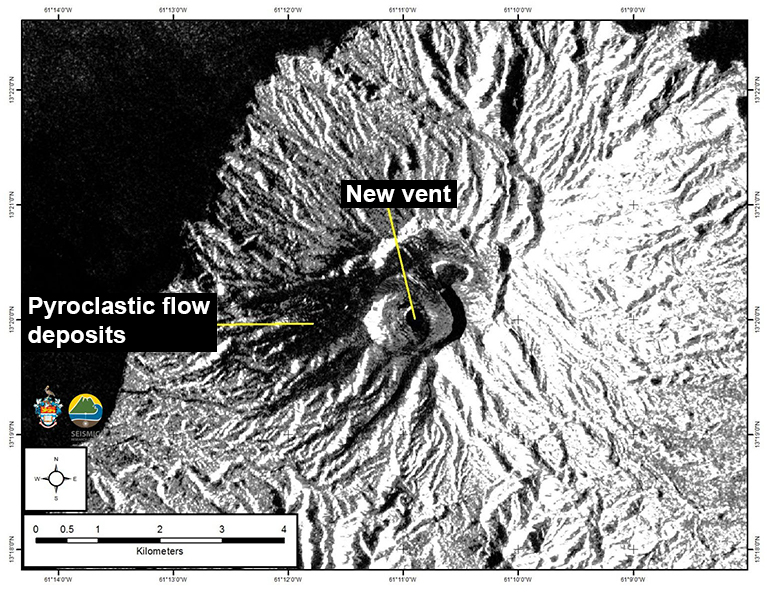 |
Figure 25. Image of Soufrière St. Vincent taken from the Sentinel-1 satellite on 11 April 2021 showing the changes of the summit crater with a possible smaller vent in the new crater. The darker black areas to the W of the summit are pyroclastic flow deposits from earlier explosive events. Courtesy of Adam Stinton, MVO, UWI-SRC. |
A series of Vulcanian explosions that began at 0630 on 13 April, and lasted about 30 minutes, was accompanied by large seismic tremors followed by more than three hours of smaller continuous tremors (figure 26). The VAAC stated that a dense ash plume rose to 11 km altitude and drifted E, SE, N, and NE (figure 27). Resulting pyroclastic flows traveled about 6 km WSW. Observations made during the afternoon indicated that pyroclastic flows had reached the ocean in every valley extending from Larikai to Wallibou, a length of about 5 km. The Washington VAAC reported a new ash emission rising to 7.6 km altitude at 1850 that was associated with a thermal anomaly. Another explosion at 2030 pulsed for more than 40 minutes and produced pyroclastic flows that traveled toward the Rabacca River on the E coast of the island. Lahar deposits were reported in the Sandy Bay area. Another large explosion was detected at 2300, according to UWI-SRC. The Montserrat Volcano Observatory stated that a sulfur odor and minor ashfall from Soufrière St. Vincent was observed on their island (390 km NNW).
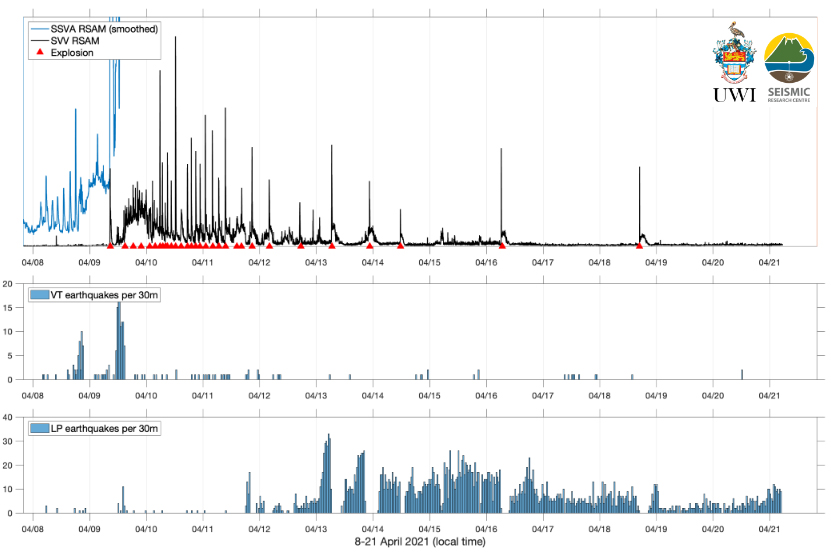 |
Figure 26. Plot summarizing the seismic data at Soufrière St. Vincent during 8-21 April 2021. The top panel shows the Real-Time Seismic Amplitude Measurement (RSAM) data from seismic stations SSVA and SVV. The SSVA data shows the banded tremor that started on 8 April and the continuous tremor prior to the first explosion. The red triangles represent the time of explosions, based on satellite imagery that was analyzed by scientists at the University of East Anglia. Data transmission from SSVA stopped when it was likely destroyed by an explosion. The SVV data shows the high-amplitude tremor generated during a series of explosions. The bottom two panels show the number of volcano-tectonic (VT) and long-period (LP) earthquakes detected by the seismic network. The number and intensity of LP earthquakes have increased since late 11 April. Courtesy of Roderick Stewart, MVO, UWI-SRC. |
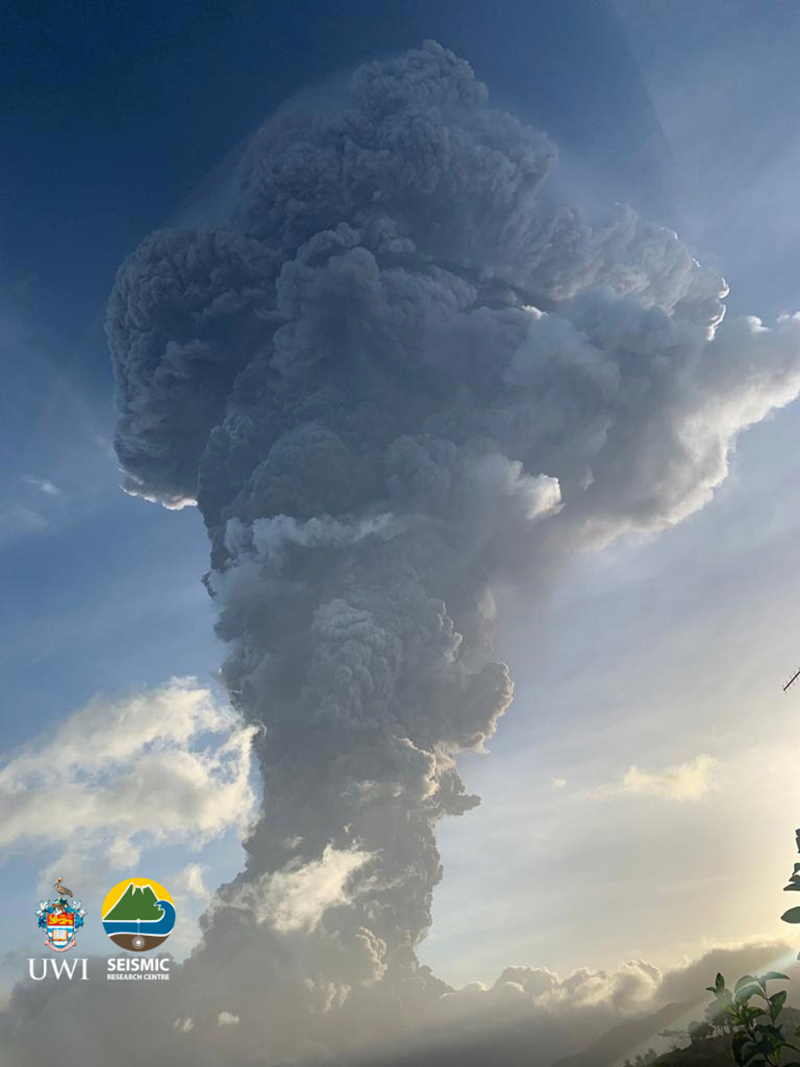 |
Figure 27. Photo of a strong ash plume rising above Soufrière St. Vincent on 13 April 2021. Courtesy of Thomas Christopher, MVO, UWI-SRC. |
During 14 April seismicity continued to be characterized by episodes of tremor about 13-15 hours apart, separated by swarms of small LP earthquakes. At 1135 a band of seismic tremor, associated with an explosion, was recorded, though the emissions were gas-rich and less energetic. Another episode of tremor began at 0230 on 15 April, as well as increased ash venting. The seismic network recorded a near-constant swarm of LP and hybrid earthquakes throughout the day with three brief episodes of low-level tremor each lasting less than 30 minutes. Tremor starting at 2100 lasted about 40 minutes and may have been associated with a minor increase in venting. Sulfur dioxide emissions were successfully measured by ground-based instruments; scientists on a Coast Guard boat along the W coast recorded 809 tons/day.
Periods of tremor and near-constant LP and hybrid earthquake swarms continued on 16 April. One tremor episode on 16 April at 0615 that lasted about three minutes was accompanied by an explosion, followed by more than two hours of low-level tremor. The resulting ash plumes rose to 8 km altitude and drifted W. Sulfur dioxide measurements showed an average of 460 tons/day; some SO2 plumes were reported to have reached India.
Satellite images showed a series of changes to the newly formed crater in the SW part of the crater (figure 28). Updated measurements were taken of the new crater, by 17 April according to an Institut de Physique du Globe de Paris scientist. It was approximately 900 m N to S, 750 m E to W, and at least 100 m deep, based on RADAR data (figure 29). Several vents were identified or inferred by emissions points of gas-and-steam and ash plumes. During 17 and 18 April the average SO2 flux was 232 and 391 tons/day, respectively.
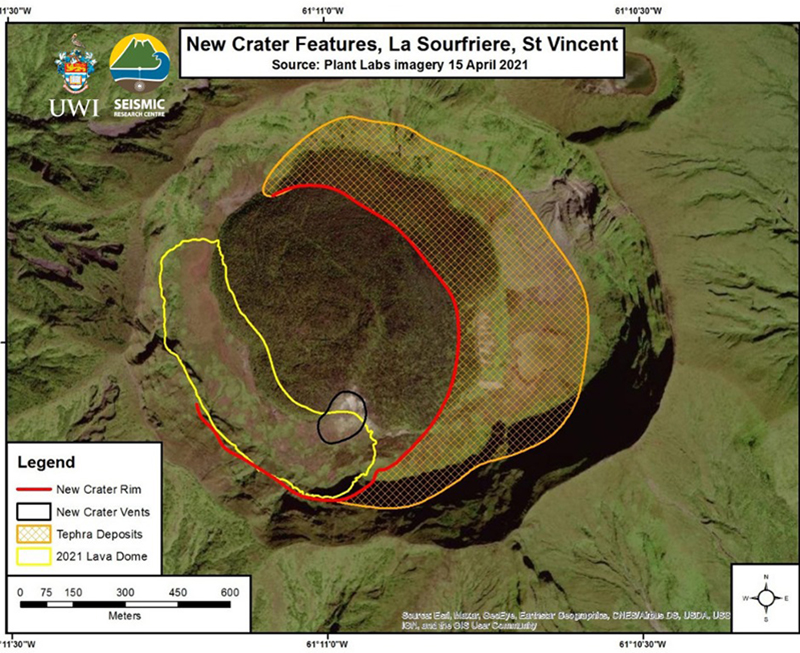 |
Figure 28. New crater features were visible at the Soufrière St. Vincent summit in a 15 April 2021 satellite image from Planet Labs. Continued explosions created a new crater (red line) in the SW part of the larger summit crater that was approximately 900 m N-S, at least 750 m E-W, and 100 m deep. The orange patterned section represents tephra deposits. The yellow line outlines the 2020-21 lava dome. Several vents were established, based on gas-and-steam and ash plumes; only one could be seen clearly (black outline). Courtesy of UWI-SRC. |
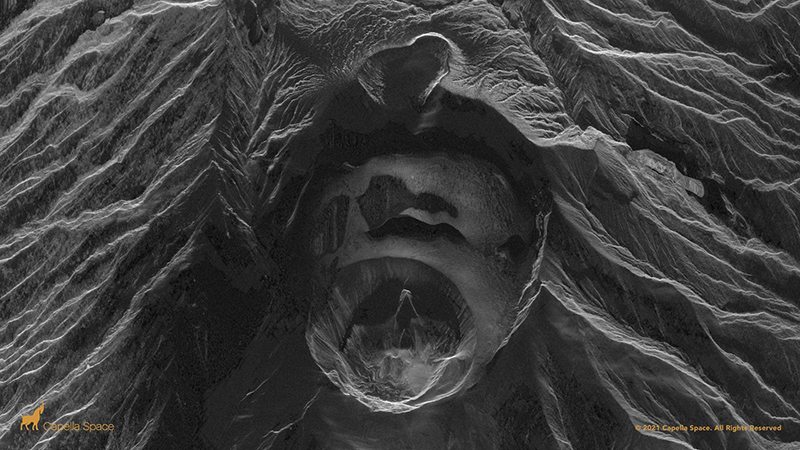 |
Figure 29. Satellite radar image from Capella Space acquired on 14 April 2021 showed the changes of the Soufrière St. Vincent summit crater following numerous explosions. The large depression in the middle of the image used to contain the 1979 and 2020-21 lava domes; explosions that began on 9 April destroyed both, leaving a smaller crater about 800 m in diameter. The base of the crater is distorted due to the presence of ash in the atmosphere and the ongoing eruption. North in the image is to the upper left corner. Courtesy of Adam Stinton, MVO, UWI-SRC. |
A period of tremor at 1649 on 18 April was accompanied by an explosion that sent an ash plume to 8 km altitude and drifted S and SW (figure 30). This was the 30th distinct explosion since the explosive phase began. The period of tremor lasted until about 2100 and was followed by ongoing small VT, LP, and hybrid earthquakes. The rate of these events decreased by 0100 on 19 April. A single rockfall event was detected at 0139, possibly due to the growing lava dome, though there was no visual confirmation. Few, but intermittent, rockfall events, VT earthquakes, and an increasing number of small LP and hybrid earthquakes were detected through 21 April (see figure 26). The seismic station at Bamboo Range recorded a lahar on 20 April at 0400 which lasted about 30 minutes and may have descended a SE-flank valley. SO2 measurements taken near the W coast showed an average flux of 350 tons/day. NEMO reported that 12,775 people were displaced by 19 April, with 6,208 people in 85 public shelters and 6,567 people (1,800 families) in private shelters.
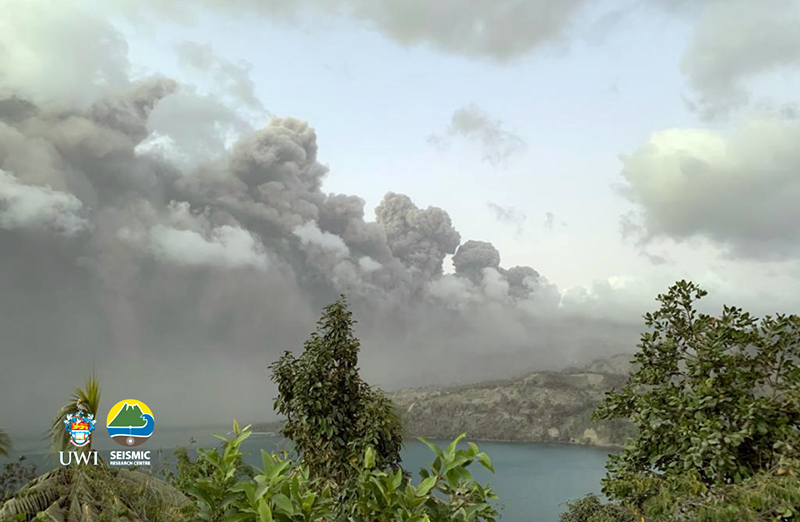 |
Figure 30. Photo of ash plumes rising above Soufrière St. Vincent and drifted S and SW on 18 April 2021. Photo has been color corrected. Courtesy of Thomas Christopher, MVO, UWI-SRC. |
On 22 April at 1108 explosions generated an ash plume that rose to 8 km altitude and drifted mainly N over the ocean (figure 31). A high-level seismic tremor was also detected at 1109 that lasted for 20 minutes. During the initial stages of the explosion a pyroclastic flow was observed traveling down the W flank, reaching an average speed of 33 km/hour. Around 2100 the seismic network recorded multiple lahars, though their location could not be determined. According to data from NEMO, 13,154 people had been displaced by 21 April, with 6,208 people in 85 public shelters and 6,790 people (1,618 families) in private shelters.
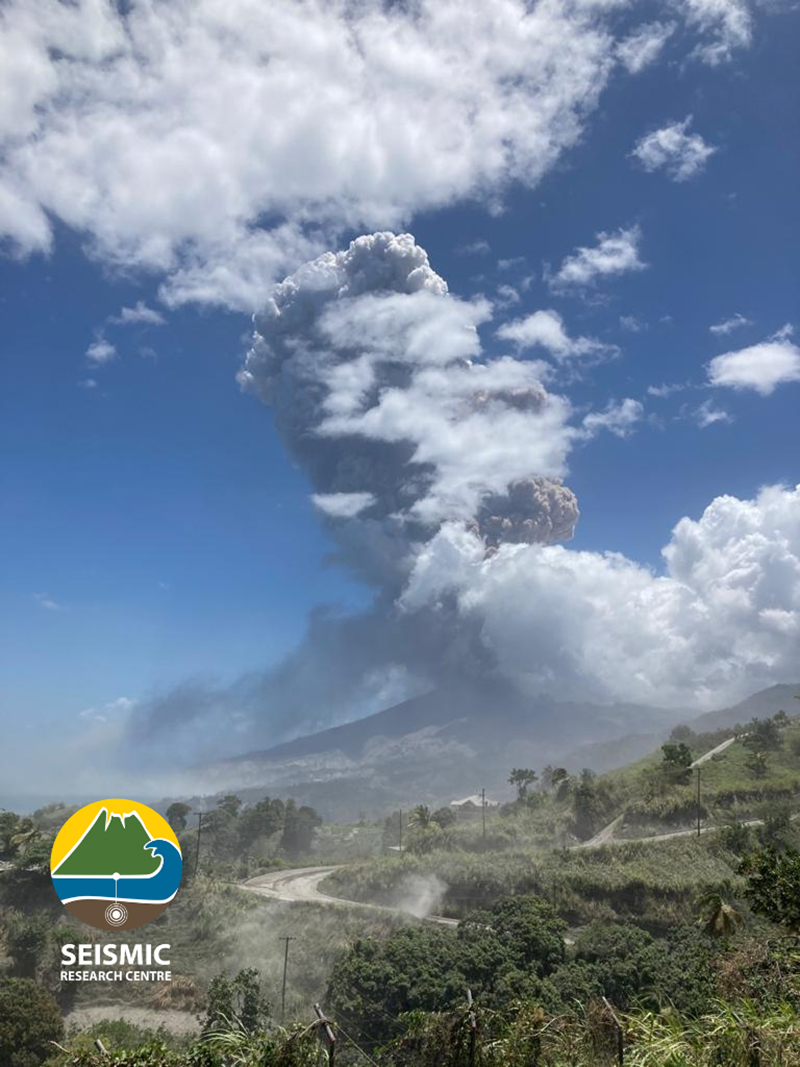 |
Figure 31. Photo of an ash plume rising to 8 km altitude above Soufrière St. Vincent at 1108 on 22 April 2021. Courtesy of Richard Robertson, UWI-SRC. |
Seismicity dropped to low levels after the explosion on 22 April and remained low through 27 April; only a few VT, LP, and hybrid earthquakes were recorded. The average SO2 flux was 992 tons/day on 23 April, again recorded from the W coast. Satellite radar imagery acquired on 24 April indicated possible growth at the lava dome following the explosions on 18 and 22 April. During an overflight on 26 April scientists observed white gas-and-steam emissions from several locations along the crater floor, though visibility was poor. No lava dome was visible, but a possible spine-like protrusion was seen through the clouds. Lahars in the Red and Orange zones were recorded by the seismic network at 0900 and 1000 on 27 April, during and after rainfall. Multiple lahars continued to be recorded by the seismic network within all drainages during 28-30 April due to heavy rainfall (figure 32). Trees brought down by lahars reached the ocean, where the floating logs created a hazard for small boats along the coastline. SO2 measurements taken from a boat on the W coast yielded a flux of 1,036 tons/day. On 6 May the Volcanic Alert Level was lowered to Orange (the second highest on a four-color scale) because no explosions had been recorded since 22 April and the number of volcanic earthquakes had decreased significantly.
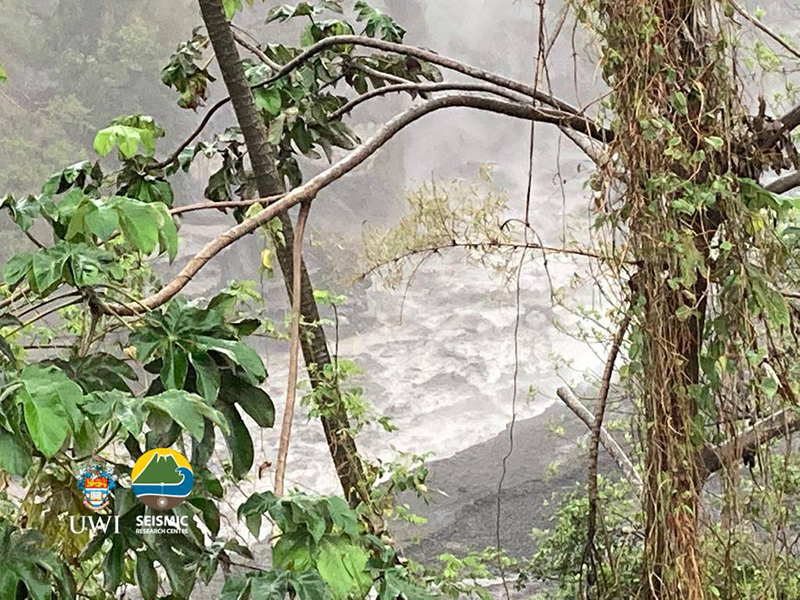 |
Figure 32. Photo of lahars in the Wallibou River near Soufrière St. Vincent on the morning of 29 April 2021 due to heavy rainfall. Courtesy of UWI-SRC. |
Additional satellite data. Daily satellite-based sulfur dioxide measurements were notable beginning on 9 April. The initial explosion at 0840 showed relatively minor SO2 emissions, though as the day progressed stronger plumes drifted E over the Atlantic Ocean (figure 33). As strong explosive activity continued at Soufrière St. Vincent, strong SO2 plumes exceeding 2 Dobson Units (DUs) were detected during 9-14 April, moving generally E, based on data from the TROPOMI instrument on the Sentinel-5P satellite.
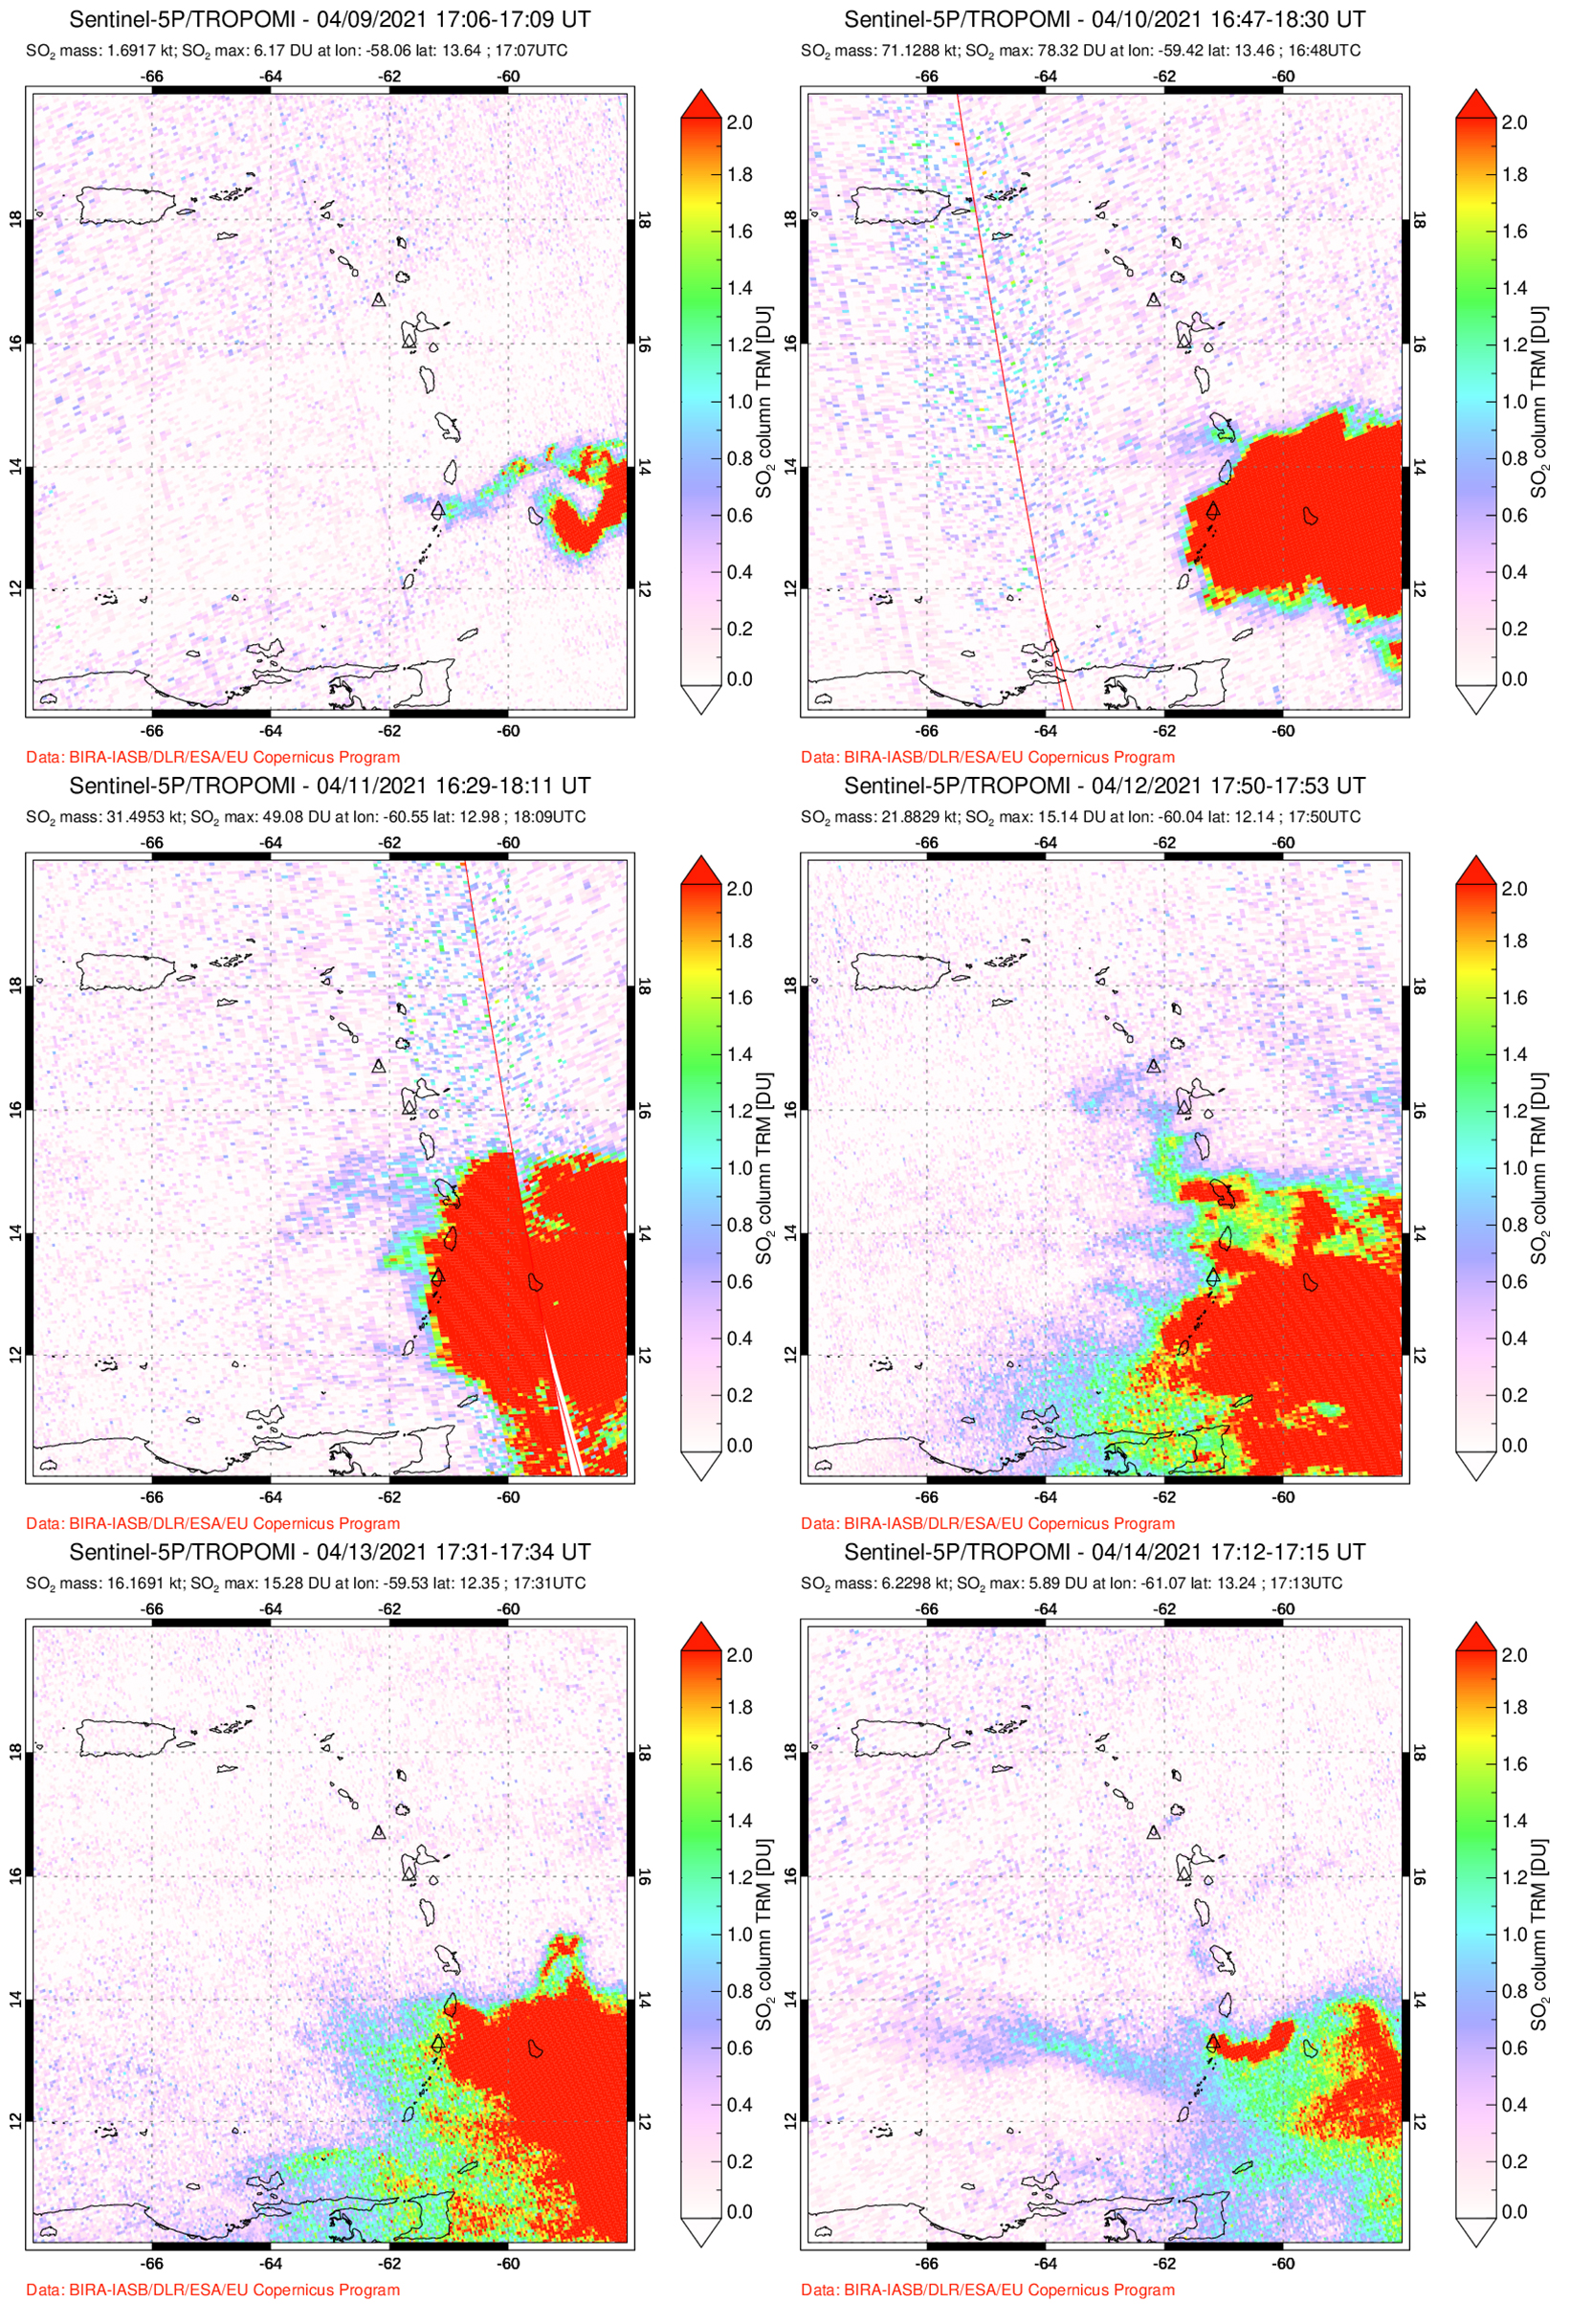 |
Figure 33. Strong and distinct SO2 plumes from Soufrière St. Vincent were detected by the TROPOMI instrument on the Sentinel-5P satellite during 9-14 April 2021 on days with strong explosive activity and ash venting. The plumes generally drifted E over the Atlantic Ocean. Courtesy of NASA Global Sulfur Dioxide Monitoring Page. |
MIROVA (Middle InfraRed Observation of Volcanic Activity) analysis of MODIS satellite data detected a single thermal anomaly during mid-March 2021, followed by a brief break in activity (figure 34). Thermal activity resumed in April, occurring in three distinct clusters of moderate-power anomalies throughout the month. Two thermal hotspots were detected using the MODVOLC thermal algorithm on 24 April. Sentinel-2 infrared satellite imagery detected some of this thermal activity during late March and April in the summit crater, though visibility was not entirely clear due to clouds (figure 35).
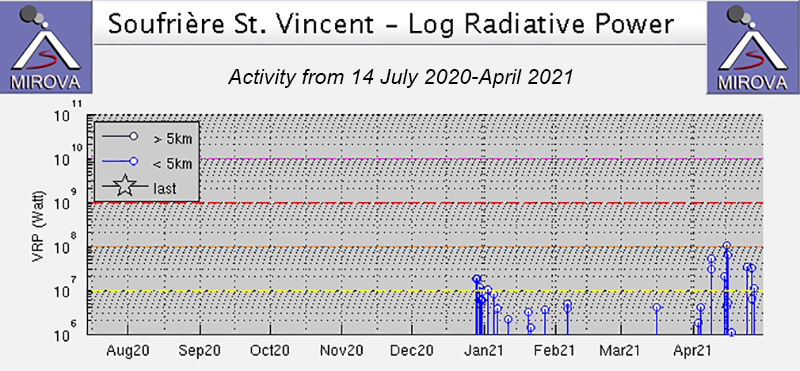 |
Figure 34. A single thermal anomaly at Soufrière St. Vincent was detected during mid-March 2021. Thermal activity resumed in early April, occurring in three distinct clusters of moderate-power anomalies, as reflected in the MIROVA data (Log Radiative Power). Courtesy of MIROVA. |
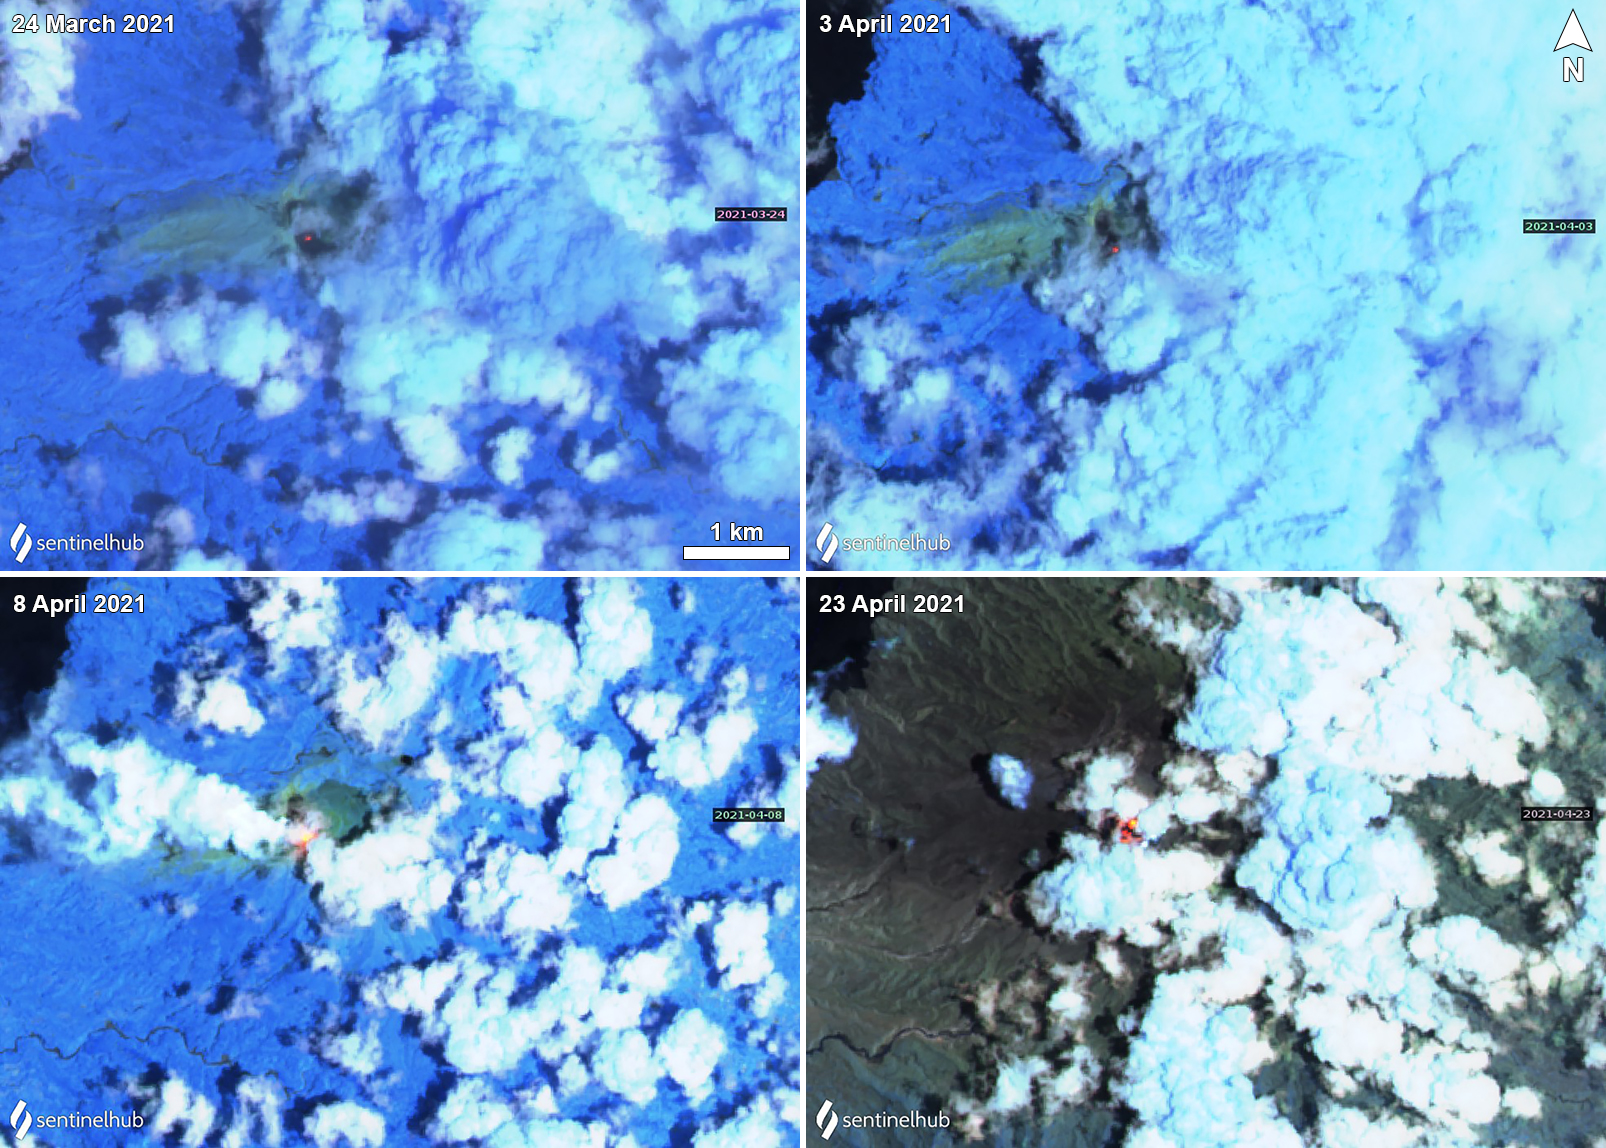 |
Figure 35. Sentinel-2 infrared satellite imagery showing a faint thermal anomaly (orange) in the summit crater of Soufrière St. Vincent on 24 March (top left), 3 April (top right), 8 April (bottom left), and 23 April (bottom right) 2021, though clouds covered most of the crater. Images using “Atmospheric penetration” rendering (bands 12, 11, 8a). Courtesy of Sentinel Hub Playground. |
Information Contacts: University of the West Indies Seismic Research Centre (UWI-SRC), University of the West Indies, St. Augustine, Trinidad & Tobago, West Indies (URL: http://www.uwiseismic.com/); National Emergency Management Organisation (NEMO), Government of Saint Vincent and the Grenadines, Biseé, PO. Box 1517, Castries, Saint Lucia, West Indies (URL: http://nemo.gov.lc/); Washington Volcanic Ash Advisory Center (VAAC), Satellite Analysis Branch (SAB), NOAA/NESDIS OSPO, NOAA Science Center Room 401, 5200 Auth Rd, Camp Springs, MD 20746, USA (URL: www.ospo.noaa.gov/Products/atmosphere/vaac, archive at: http://www.ssd.noaa.gov/VAAC/archive.html); Hawai'i Institute of Geophysics and Planetology (HIGP) - MODVOLC Thermal Alerts System, School of Ocean and Earth Science and Technology (SOEST), Univ. of Hawai'i, 2525 Correa Road, Honolulu, HI 96822, USA (URL: http://modis.higp.hawaii.edu/); NASA Global Sulfur Dioxide Monitoring Page, Atmospheric Chemistry and Dynamics Laboratory, NASA Goddard Space Flight Center (NASA/GSFC), 8800 Greenbelt Road, Goddard, Maryland, USA (URL: https://so2.gsfc.nasa.gov/); MIROVA (Middle InfraRed Observation of Volcanic Activity), a collaborative project between the Universities of Turin and Florence (Italy) supported by the Centre for Volcanic Risk of the Italian Civil Protection Department (URL: http://www.mirovaweb.it/); Sentinel Hub Playground (URL: https://www.sentinel-hub.com/explore/sentinel-playground); Jenni Barclay, University of East Anglia, Norwich Research Park, Norwich, Norfolk, NR4 7TJ, UK (URL: https://research-portal.uea.ac.uk/en/persons/jenni-barclay); Ian Renfrew, University of East Anglia, Norwich Research Park, Norwich, Norfolk, NR4 7TJ, UK (URL: https://research-portal.uea.ac.uk/en/persons/ian-renfrew).
2022: March
2021: January
| February
| March
| April
| May
| June
| July
| September
2020: December
2005: February
UWI Seismic Research Centre and National Emergency Management Organisation (NEMO) lowered the Alert Level for Soufrière St. Vincent to Green (the lowest level on a four-color scale) on 16 March, noting that seismic and fumarolic activity were at or below background levels recorded prior to the 2020-2021 eruption. The La Soufriere trail remained closed due to the uneven and dangerous terrain. The public was reminded about lahar hazards during heavy rains.
Sources: University of the West Indies Seismic Research Centre (UWI-SRC); National Emergency Management Organisation (NEMO), Government of Saint Vincent and the Grenadines
National Emergency Management Organisation (NEMO) reported that activity at Soufrière St. Vincent had been low over the previous few months. On 15 September the Alert Level was lowered to Yellow and remaining evacuees were allowed to return home.
Source: National Emergency Management Organisation (NEMO), Government of Saint Vincent and the Grenadines
On 27 July the University of the West Indies Seismic Research Centre (UWI-SRC) reported that seismicity at Soufrière St. Vincent (often simply referred to as “La Soufriere”) had remained low since the last episode of ash venting on 22 April. A few small daily earthquakes were recorded. Steam-and-gas plumes rose from some areas inside the crater and thermal anomalies persisted. The Alert Level remained at Orange.
Source: University of the West Indies Seismic Research Centre (UWI-SRC)
University of the West Indies Seismic Research Centre (UWI-SRC) reported that seismicity at Soufrière St. Vincent (often simply referred to as “La Soufriere”) had remained low since the last episode of ash venting on 22 April. Some daily earthquakes were recorded during 7-15 June. Steam-and-gas plumes rose from a few areas inside the crater and thermal anomalies persisted. The crater was observed and photographed during 11-12 June; observers saw no signs of lava domes. The Alert Level remained at Orange.
Source: University of the West Indies Seismic Research Centre (UWI-SRC)
University of the West Indies Seismic Research Centre (UWI-SRC) and National Emergency Management Organisation (NEMO) reported that seismicity at Soufrière St. Vincent (often simply referred to as “La Soufriere”) remained low during 17-24 May, with a few long-period and volcano-tectonic earthquakes occasionally recorded. Persistent steaming from the crater was visible on days when weather permitted views, and thermal anomalies continued to be identified in satellite data. Sulfur dioxide emissions were 461 tons per day on 20 May. NEMO noted that the total number of displaced people was 22,759 on 15 May though the number continued to fluctuate as people arrived at shelters while others returned home or changed locations. The Alert Level remained at Orange.
Sources: University of the West Indies Seismic Research Centre (UWI-SRC); National Emergency Management Organisation (NEMO), Government of Saint Vincent and the Grenadines
On 6 May government authorities lowered the Alert Level to Orange for Soufrière St. Vincent (often simply referred to as “La Soufriere”) based on recommendations from University of the West Indies Seismic Research Centre (UWI-SRC). The public was allowed to return to their homes in the Yellow and Orange zones, though access to the Red Zone remained restricted. UWI-SRC noted that over the previous few days continuing lahars had mobilized boulders 5 m in diameter and were steamy in areas where they contacted hot deposits. A small lahar signal was recorded at 0740 on 7 May. Sulfur dioxide emissions were measured from a boat near the W coast, yielding a flux of 208 tons per day on 9 May. Seismicity remained low through 11 May with only a few long-period earthquakes recorded by the seismic network.
Sources: University of the West Indies Seismic Research Centre (UWI-SRC); National Emergency Management Organisation (NEMO), Government of Saint Vincent and the Grenadines
University of the West Indies Seismic Research Centre (UWI-SRC) reported that seismicity at Soufrière St. Vincent (often simply referred to as “La Soufriere”) remained low during 28 April-4 May, with a few long-period, hybrid, and volcano-tectonic earthquakes recorded daily. Multiple significant lahars were generated by rainfall during 28-29 April. Lahars likely descended all valleys in the Red and Orange zones, and some were hot and visibly steaming. Trees brought down by lahars were swept to the sea; floating logs created hazardous conditions for small boats along the coastline. UWI-SRC and the National Emergency Management Organisation (NEMO) both warned the public to stay away from drainages and areas prone to flooding, and noted that lahars have caused notable erosion and damage to drainages and parts of the coastline. Smaller lahars were recorded during the mornings of 30 April and 1 May. Multiple lahars were detected in likely all the volcano’s drainages for a period of about six hours on 3 May, with the most intense lahars occurring during 1100-1200. Sulfur dioxide emissions were measured from a boat near the W coast, yielding a flux of 1,036 tons per day. Photos showed people in Sandy Bay shoveling off ash from rooftops on 4 May. The volcano Alert Level remained at Red.
Sources: University of the West Indies Seismic Research Centre (UWI-SRC); National Emergency Management Organisation (NEMO), Government of Saint Vincent and the Grenadines
University of the West Indies Seismic Research Centre (UWI-SRC) reported that eruptive activity at Soufrière St. Vincent (often simply referred to as “La Soufriere”) was relatively low during 21-27 April with the exception of one explosive period. During 20-21 April seismicity was characterized by a few rockfalls and volcano-tectonic (VT) earthquakes, and an increasing number of small long-period (LP) and hybrid earthquakes. Sulfur dioxide emissions were again measured from a boat near the W coast, revealing a flux of 350 tons per day. At around 1108 on 22 April explosions produced an ash plume that rose as high as 8 km (26,200 ft) a.s.l. and drifted mainly N over the sea. High-level seismic tremor began at 1109 and lasted for about 20 minutes. Pyroclastic flows were generated early in the eruption and traveled down the W flank, reaching the sea within five minutes. Lahar signals were recorded later that day at about 2100. According to National Emergency Management Organisation (NEMO) the total number of displaced people was 13,154 by 21 April, with 6,208 people in 85 public shelters and 6,790 people (1,618 families) in private shelters. There were no casualties caused by the eruption. In a 22 April press release the Argyle International Airport announced that the ash cleanup was ongoing and that the Cargo Terminal was scheduled to open the next day.
Seismicity dropped to low levels after the explosive event and remained at low levels through 27 April; only a few LP, hybrid and VT earthquakes were recorded. On 23 April the sulfur dioxide flux was 992 tons per day, recorded again from the W coast. A diffuse steam plume rose from the crater on 24 April. Satellite data most recently from 24 April, and seismic data suggested likely cycles of crater dome growth and destruction. During an overflight on 26 April scientists observed white steam plumes rising from several locations on the crater floor, though visibility was poor. No lava dome was visible, but a possible spine-like protrusion was seen through the clouds. Seismic signals indicating lahars were again recorded. Lahars in the Red and Orange zones were recorded by the seismic network at 0900 and 1000 on 27 April, during and after rainfall. The volcano Alert Level remained at Red.
Sources: University of the West Indies Seismic Research Centre (UWI-SRC); National Emergency Management Organisation (NEMO), Government of Saint Vincent and the Grenadines; Advanced geospatial Data Management Platform (ADAM); Argyle International Airport Inc.
University of the West Indies Seismic Research Centre (UWI-SRC) and National Emergency Management Organisation (NEMO) reported that the explosive eruption at Soufrière St. Vincent (often simply referred to as “La Soufriere”) continued during 14-20 April, though at a decreasing frequency. Explosions and pyroclastic flows were reported on 13 April, as well as lahars in the Sandy Bay area. During 14 April seismicity continued to be characterized by episodes of tremor, about 13-15 hours apart, separated by swarms of small, long-period (LP) earthquakes. An episode of tremor that began at 1135 was associated with increased explosive activity, though the emissions were gas rich and less energetic than previous events. Another episode of tremor began at 0230 on 15 April along with increased venting. Almost constant swarms of long-period and hybrid events were recorded through the day, punctuated by three brief episodes (less than 30 minutes) of low-level tremor. An episode of tremor began at 2100 and lasted 40 minutes, and was possibly associated with a minor increase in venting. For the first time sulfur dioxide emissions were successfully measured by ground-based instruments; scientists recorded 809 tons per day from a Coast Guard boat along the W coast.
Periods of tremor and near-constant swarms of LP and hybrid events were recorded on 16 April.
An explosion at 0615 on 16 April generated an ash plume that rose about 8 km (26,200 ft) a.s.l. and drifted W. A three-minute period of high-level tremor started at the same time and was flowed by over two hours of lower-level tremor. Sulfur dioxide emissions were again measured from the W coast, yielding a flux of 460 tons per day. The rate of LP and hybrid events dropped significantly at 2000. Sulfur dioxide plumes reached India.
Occasional satellite images of the summit showed a series of changes to the new crater, centered in the SW part of the summit crater. By 17 April an Institut de Physique du Globe de Paris scientist reported that the crater was about 900 m N to S, at least 750 m E to W, and about 100 m deep based on RADAR data. Several vents were either visible or inferred from points of emissions. Sulfur dioxide emissions were 232 and 391 tons per day on 17 and 18 April, respectively. A period of high tremor began at 1649 on 18 April. An explosion produced an ash plume that rose to 8 km (26,200 ft) a.s.l. and drifted S and SW. This explosion occurred 52 hours after the last one and was the 30th since the explosive phase started. The period of tremor lasted until about 2100 and was followed by ongoing small LP and hybrid events. The rates of those events dropped again, at around 0100 on 19 April. One rockfall was detected by the seismic network at 0139, and two were noted the next day. At 0400 on 20 April a lahar was detected by the seismic network and lasted for 30 minutes; it possibly traveled down the SE flank.
During 15-19 April NEMO reported details about the people that have evacuated. The total number of displaced people was 12,775 by 19 April, with 6,208 people in 85 public shelters and 6,567 people (1,800 families) in private shelters. There were no casualties caused by the eruption.
Sources: University of the West Indies Seismic Research Centre (UWI-SRC); National Emergency Management Organisation (NEMO), Government of Saint Vincent and the Grenadines; Advanced geospatial Data Management Platform (ADAM)
University of the West Indies Seismic Research Centre (UWI-SRC) and National Emergency Management Organisation (NEMO) reported that the effusive eruption at Soufrière St. Vincent (often simply referred to as “La Soufriere”) became explosive on 9 April after a period of increased seismicity, gas emission, and rapid dome growth. Earthquake swarms were recorded during 22-25 March and 5 April, signifying a change in the eruption pattern. Small earthquakes associated with dome growth were recorded on 7 April. Episodes of tremor indicating movement of magma and fluids close to the surface began at 0300 on 8 April and were again recorded at 0530, 0800, 1015, and 1300, slowly increasing in magnitude. Five long-period earthquakes and two brief swarms of VT events occurred in between the tremor episodes; ash venting occurred with the last episode. Sulfur dioxide emissions were identified in satellite data, and clouds of steam and gas were visible from the Belmont Observatory. Later that evening, incandescent material over the vent area was visible in webcam images, and views from the observatory indicated that the dome had grown significantly. The Alert Level was raised to Red at around 1830, and the Prime Minister issued an evacuation order for the Red Zone at the N part of the island, affecting 16,000-20,000 people.
An explosive eruption began at 0840 on 9 April when an ash plume rose to 8 km (27,900 ft) a.s.l. and drifted mainly ENE. Ash fell across the island, affecting communities including Chateaubelair and Petite Bordel, the observatory, Belmont and surrounding areas at the S end of the island, and forcing the closure of the Argyle International Airport (20 km S). NEMO stated that evacuations in the Orange and Red zones were impeded by significant ashfall and poor visibility, but by the evening most residents had been evacuated. A second period of vigorous ash venting began at 1445 and initially rose about 4 km (13,100 ft) a.s.l. Lightning was visible in the rising plume. Successive explosions and ash pulses fed the plume for hours and it rose to 16 km (52,000 ft) a.s.l. A third explosive series began at 1835. Ash venting occurred through the night, causing ashfall across St. Vincent and reaching Barbados, about 165 km E, significantly impacting residents on that island.
Periods of banded tremor began at 0330 on 10 April, lasting for periods of 20-30 minutes with 1-3-hour gaps. The tremor episodes were associated with explosive activity and stronger pulses of ash emissions to higher altitudes; ash plumes rose to 10.6-16 km (35,000-52,000 ft) a.s.l. throughout the day. The Washington VAAC stated that ash plumes during 9-10 April had drifted as far as 1,200 km ESE and about 3,000 km ENE. The Grantley Adams International Airport (GAIA) in Barbados also closed.
Ashfall continued to be widespread on 10 April; deposit thickness varied from less than 1 mm in Colonaire (~12.5 km SSE) to 10-15 mm in Rabacca (~7.4 km SSE). Scientists reported darkness at the observatory at 1617; video showed intense and continuous ashfall. Satellite data confirmed that explosions had excavated the 2020-2021 lava dome and parts of the 1979 dome, leaving a large crater.
Overnight during 10-11 April ash again fell island-wide, and also in the Grenadines (to the SSW), Barbados, and Saint Lucia (50 km NNE). Explosions early on 11 April were followed by widespread power and water outages on the island as reported by NEMO, and some houses had collapsed under the significant ashfall. Beginning around midday the periods between episodes of high-amplitude tremor lengthened from 1.5-4 hours to 5-8 hours. The VAAC reported that through the day ash plumes rose 12.2-16 km (40,000-52,000 ft) a.s.l. and continued to drift long distances to the ENE, E, and SE.
A large explosion at 0415 on 12 April produced an ash plume that rose to 12.8 km (42,000 ft) a.s.l. Pyroclastic flows descended several valleys on the S and W flanks, reaching the coast at Morne Ronde (4.3 km W), Larikai (3.5 km WNW), and Trois Loupes Bay (3.5 km NW). Damage to vegetation was extensive along the W coast, stretching from Larikai Bay to Turner Bay. The pattern of seismicity again changed; high-amplitude tremor episodes ceased, but two low-amplitude and one high-amplitude episode were recorded during 0600-1700. Explosivity or notable ash venting coincided with the episodes; the spacing between explosive events increased.
A series of Vulcanian explosions began at 0630 on 13 April and lasted about 30 minutes. The VAAC stated that a dense ash plume rose to 11 km (35,000 ft) a.s.l. and drifted E and SE, as well as N and NE. Pyroclastic flows traveled about 6 km WSW, reached the ocean at Wallibou Bay, and extended past the coastline over the sea. Scientists observed the western coastline later in the day and noted that pyroclastic flows had descended all valleys from Larikai (W) to Wallibou, a stretch about 5 km long. Lahar deposits were observed in the Sandy Bay area. The VAAC noted that at 1850 a new ash emission rose to 7.6 km (25,000 ft) a.s.l. and was associated with a thermal anomaly. UWI-SRC stated that a large explosion was recorded around 2300. Pyroclastic flows overnight were channeled to the E into the Rabacca River drainage. The Montserrat Volcano Observatory stated that a sulfur odor and minor ashfall from Soufrière St. Vincent was observed on their island (390 km NNW).
Daily satellite-based measurements of SO2 were notable beginning on 9 April. Though the initial explosion at 0840 showed relatively minor SO2 emissions, stronger, continuous ash and SO2 emissions began later on 9 April (at 1445) and continued into the next day, transitioning into discrete explosive events that continued a least through 14 April. Satellite data showed about 0.4 teragrams (Tg) of SO2 in the plume on 10 April, with some stratospheric injection. Simon Carn noted that this makes the La Soufriere eruption the largest tropical SO2 emission since the 2011 Nabro eruption, and the largest in the Caribbean since satellite measurements began in 1979. The SO2 plume initially fanned out to the NE, E, and SE across the Atlantic Ocean. Measurements during 11-13 April showed similar results of 0.4-0.6 Tg SO2 depending on altitude. The eastern edge of the gas plume reached about 4,700 km to the W coast of Africa by 12 April, and another 2,000 km inland to Mali and Niger on 13 April.
Sources: Capella Space; Nation News; Caribbean Handbook on Risk Information Management; University of the West Indies Seismic Research Centre (UWI-SRC); National Emergency Management Organisation (NEMO), Government of Saint Vincent and the Grenadines; Simon Carn; Reuters; UN News Centre; Montserrat Volcano Observatory (MVO); ReliefWeb
University of the West Indies Seismic Research Centre (UWI-SRC) and National Emergency Management Organisation (NEMO) reported that the lava dome in Soufrière St. Vincent’s main crater continued to slowly grow during 31 March-6 April, expanding to the N and S. Gas-and-steam continued to rise from the top of the dome, as well as along the contact with the pre-existing 1979 dome. A swarm of volcano-tectonic (VT) earthquakes began at 0638 on 5 April. The number and frequency of the VTs increased until about 0830 and then stabilized. The rate declined at around 1400 and then significantly dropped at 1600, though small VT events continued to be detected through 1800. The events were located at depths of 6 km, slightly deeper than the swarm events recorded during 22-25 March, located at revised depths of 3-5 km. Several reports of felt events came from nearby communities, including Fancy and Chateaubelair. The largest event, a M 3.5, was recorded at 0920 and felt by local residents. The swarm was more intense than the previous one, with an average rate of about 50 earthquakes per hour compared with 1.5 per hour during 22-25 March. The Alert Level remained at Orange (the second highest level on a four-color scale).
Sources: University of the West Indies Seismic Research Centre (UWI-SRC); National Emergency Management Organisation (NEMO), Government of Saint Vincent and the Grenadines
University of the West Indies Seismic Research Centre (UWI-SRC) and National Emergency Management Organisation (NEMO) reported that the lava dome in Soufrière St. Vincent’s main crater continued to slowly grow during 23-27 March, expanding to the N and S. Gas-and-steam continued to rise from the top of the dome, as well as along the contact with the pre-existing 1979 dome. On 23 March at 1030 the monitoring network recorded a swarm of small low-frequency seismic events that lasted about 45 minutes, which was likely associated with magma movement beneath the dome. Starting at 1653 the monitoring network also began to detect volcano-tectonic (VT) earthquakes, some of which have been felt by nearby communities, including Fancy, Owia, and Sandy Bay. On 26 March the period of elevated VT earthquakes stopped; only small, low frequency events associated with the growth of the lava dome were recorded. The Alert Level remained at Orange (the second highest level on a four-color scale).
Sources: University of the West Indies Seismic Research Centre (UWI-SRC); National Emergency Management Organisation (NEMO), Government of Saint Vincent and the Grenadines
University of the West Indies Seismic Research Centre (UWI-SRC) and National Emergency Management Organisation (NEMO) reported that the lava dome in Soufrière St. Vincent’s main crater continued to slowly grow during 17-23 March, expanding to the N and S. A team visited the dome on 19 and 23 March to make observations, take measurements, and maintain monitoring equipment. Gas-and-steam continued to rise from the top of the dome as well as along the contact between the old and new domes. As of 19 March the dome was 105 m tall, 921 m long, 243 m wide, and had an estimated volume of 13.13 million cubic meters. The Alert Level remained at Orange (the second highest level on a four-color scale).
Sources: University of the West Indies Seismic Research Centre (UWI-SRC); National Emergency Management Organisation (NEMO), Government of Saint Vincent and the Grenadines
University of the West Indies Seismic Research Centre (UWI-SRC) and National Emergency Management Organisation (NEMO) reported that the lava dome in Soufrière St. Vincent’s main crater continued to slowly grow during 2-8 March. The SE part of the dome was in line with the pre-existing fumarolic area on the 1979 dome. Gas plumes continued to damage vegetation in the summit area as well as on the SW flank. The Alert Level remained at Orange (the second highest level on a four-color scale).
Sources: University of the West Indies Seismic Research Centre (UWI-SRC); National Emergency Management Organisation (NEMO), Government of Saint Vincent and the Grenadines
University of the West Indies Seismic Research Centre (UWI-SRC) and National Emergency Management Organisation (NEMO) reported that the lava dome in Soufrière St. Vincent’s main crater continued to grow during 24 February-2 March. The rate of growth was variable, though overall slow. Gas emissions continued to damage vegetation in the summit area as well as on the SW flank. The monitoring teams replaced a camera and continue to improve the seismic and GPS networks. The Alert Level remained at Orange (the second highest level on a four-color scale).
Sources: University of the West Indies Seismic Research Centre (UWI-SRC); National Emergency Management Organisation (NEMO), Government of Saint Vincent and the Grenadines
University of the West Indies Seismic Research Centre (UWI-SRC) and National Emergency Management Organisation (NEMO) reported that the lava dome in Soufrière St. Vincent’s main crater continued to grow during 10-16 February. Gas-and-steam continued to rise from the top of the dome as well as along the contact of the old and new domes. The dome also grew taller and spread laterally to the NW and SE. By 12 February the it was 90 m tall, 618 m long, 232 m wide, and had an estimated volume of 6.83 million cubic meters. Four additional seismometers were installed, strengthening the seismic network. NEMO reminded the public to avoid the volcano and that descending into the crater remained extremely dangerous. The Alert Level remained at Orange (the second highest level on a four-color scale).
Sources: University of the West Indies Seismic Research Centre (UWI-SRC); National Emergency Management Organisation (NEMO), Government of Saint Vincent and the Grenadines
University of the West Indies Seismic Research Centre (UWI-SRC) and National Emergency Management Organisation (NEMO) reported that the lava dome in Soufrière St. Vincent’s main crater continued to grow during 1-9 February. Gas data analysis conducted during a field visit showed that sulfur dioxide emissions were first detected on 1 February, suggesting that ground water was drying up and no longer interacting with the gas species. The dome had an estimated volume of 5.93 million cubic meters. Scientists observed damaged vegetation, likely caused by fire, on the NW part of the crater (just N of the dome). A report on 6 February stated that the dome continued to spread laterally N and S, with N as the dominant growth direction. Gas-and-steam continued to rise from the top of the dome as well as along the contact of the old and new domes. Scientists visited the Wallibou Hot Spring area on 7 February after a report of anomalously higher temperatures and gas odors; they collected water samples and took temperatures measurements for later analysis. Initial findings suggested the presence of hydrogen sulfide in that area and temperatures that had increased around 5-6 degrees; the lead scientist noted that based on their findings there was no increased risk associated with the hot springs. NEMO reminded the public to avoid the volcano and that descending into the crater remained extremely dangerous. The Alert Level remained at Orange (the second highest level on a four-color scale).
Sources: University of the West Indies Seismic Research Centre (UWI-SRC); National Emergency Management Organisation (NEMO), Government of Saint Vincent and the Grenadines
University of the West Indies Seismic Research Centre (UWI-SRC) and National Emergency Management Organisation (NEMO) reported that the lava dome in Soufrière St. Vincent’s main crater was an estimated 428 m long, 217 m wide, 80 m high, and had a volume of 4.45 million cubic meters by 27 January. The dome continued to grow during 27 January-2 February. During a field visit on 1 February scientists observed that gas-and-steam continued to rise from the top of the dome as well as along the contact of the old and new domes. Gas-and-steam plumes were often visible from Belmont Observatory. The Alert Level remained at Orange (the second highest level on a four-color scale).
Sources: University of the West Indies Seismic Research Centre (UWI-SRC); National Emergency Management Organisation (NEMO), Government of Saint Vincent and the Grenadines
University of the West Indies Seismic Research Centre (UWI-SRC) and National Emergency Management Organisation (NEMO) reported that the lava dome in Soufrière St. Vincent’s main crater continued to grow during 20-26 January. Gas-and-steam plumes were often visible from Belmont Observatory, on Richmond Peak, about 6 km SSW of the crater. Another seismic station and a webcam became operational, and additional instrumentation was prepped. Weather conditions sometimes prevented visual observations of the crater, though observations on 22 and 25 January confirmed that the previously-identified area of burnt vegetation had expanded, including towards the top of the E crater rim. During a monitoring visit on 24 January scientists took video and still photos of the dome and installed both a camera and an EDM reflector on the S crater wall. The Alert Level remained at Orange (the second highest level on a four-color scale).
Sources: University of the West Indies Seismic Research Centre (UWI-SRC); National Emergency Management Organisation (NEMO), Government of Saint Vincent and the Grenadines
University of the West Indies Seismic Research Centre (UWI-SRC) and National Emergency Management Organisation (NEMO) reported that the lava dome in Soufrière St. Vincent’s main crater continued to grow during 13-19 January.
Observations on 14 January revealed that the dome was growing taller as well as expanding to the E and W. During an overflight on 15 January scientists saw extensive vegetation damage on the E, S, and W inner crater walls; damage previously noted along the upper part of the SW crater rim had expanded downslope. The dome dimensions were estimated to be 340 m long, 160 m wide, and 90 m high.
Scientists visited the dome on 16 January and collected rock samples from the W part of the dome. They recorded temperatures around 590 degrees Celsius from the expanding dome front. Gas emissions were most notable from a small circular depression at the top of the dome. At night during 15-17 January residents to the W saw incandescence emanating from the crater, a phenomenon likely to be more frequent as the dome grows higher. Gas emissions were visible in the afternoon of 17 January rising from the top of the dome as well as from areas of contact between the new and old domes. An area of burnt vegetation extended from the dome along the W part of the crater floor.
By the end of the week both new seismic and continuous GPS monitoring stations had been installed and were transmitting data, bring the total number of dedicated seismic stations to five. The Alert Level remained at Orange (the second highest level on a four-color scale).
Sources: University of the West Indies Seismic Research Centre (UWI-SRC); National Emergency Management Organisation (NEMO), Government of Saint Vincent and the Grenadines
University of the West Indies Seismic Research Centre (UWI-SRC) and National Emergency Management Organisation (NEMO) reported that the lava dome in Soufrière St. Vincent’s main crater that first formed on 27 December continued to grow during 6-12 January. Observations were made during a field visit on 5 January, during a helicopter overflight on 6 January, and based on 9 January drone video. During that time the dome grew and expanded to the W, produced small, hot rockfalls, had a blocky appearance, and continued to emit gasses and steam. Gas-and-steam plumes were also visible from Belmont Observatory. The Alert Level remained at Orange (the second highest level on a four-color scale).
Sources: University of the West Indies Seismic Research Centre (UWI-SRC); National Emergency Management Organisation (NEMO), Government of Saint Vincent and the Grenadines
The Seismic Research Centre at the University of the West Indies (UWI-SRC) and National Emergency Management Organisation (NEMO) of St. Vincent and the Grenadines reported that during an overflight at 1600 on 31 December scientists confirmed that the new lava dome on the WSW edge of Soufrière St. Vincent’s 1979 lava dome continued to grow. Steam from the dome was visible from Belmont Observatory through 4 January. The Alert Level remained at Orange (the second highest level on a four-color scale).
Sources: University of the West Indies Seismic Research Centre (UWI-SRC); National Emergency Management Organisation (NEMO), Government of Saint Vincent and the Grenadines
A new effusive eruption had built a lava dome in the summit crater of Soufrière St. Vincent when observed on 29 December by personnel from the National Emergency Management Organisation (NEMO), St. Vincent and the Grenadines, and the Alert Level was raised to Orange (the second highest level on a four-color scale). The observers noted that the small black-colored dome had grown on the WSW edge of the 1979 lava dome. The University of the West Indies Seismic Research Centre (UWI-SRC) stated in a press briefing that seismicity at the volcano began to increase in early November and changes in the water lake and fumarolic area were noted on 16 December. A persistent thermal anomaly had been identified in satellite data over the previous couple of days, which is what prompted the NEMO field visit.
Sources: University of the West Indies Seismic Research Centre (UWI-SRC); National Emergency Management Organisation (NEMO), Government of Saint Vincent and the Grenadines; Searchlight
According to a news article, residents of the island of St.Vincent reported smelling sulfur in towns as far S as Kingstown. This sparked fears among the population that volcanic activity had increased at Soufriere St. Vincent. Staff from the Soufriere Monitoring Unit of the Seismic Research Unit visited the volcano and reported that there was no increase in volcanic activity according to monitoring-station data and observations. The increased scent of sulfur in towns was attributed to a southward shift in wind direction towards the towns, rather than the usual E direction. Accordingly, the Alert Level remained low at Soufriere St. Vincent.
Source: Caribbean Net News
Reports are organized chronologically and indexed below by Month/Year (Publication Volume:Number), and include a one-line summary. Click on the index link or scroll down to read the reports.
Eruption causes growth of island in crater lake
Card 1313 (08 November 1971) Steam and sulfurous smells from crater lake
"Disturbed conditions" have been noted from the air in the crater of . . . Soufrière in St. Vincent. Rising steam and a strong sulfurous smell have been reported coming from the water in the crater lake . . . . The condition was first noted by a pilot who flew over Soufrière on 31 October. His report was confirmed 1 November by a government official who flew over the crater in a small plane."
William C. Buell IV (Washington, D.C.) reports that Soufrière is a "very dangerous" volcano and that the heat level has recently risen from 20 to 84°C, a very significant change.
Card 1319 (23 November 1971) Eruption confirmed; island appears in crater lake
An island 100 m in diameter and 2 m high appeared in the lake center on 20 November. This island consists of angular blocks 1-10 m across and appears to be the top of a lava dome standing 200 m above the former lake floor. The water level is rising faster again with a 38-cm increase in the last 48 hours, but the temperature at the lake edge remains steady at 82°C. A 10-second series of explosions like thunder was heard on 20 November within the crater but the source was not seen because of hot vapor concealing most of the lake. No clear volcanic earthquakes have been recorded, although a seismograph 6 km SW of the summit has recently recorded indeterminate signals of 10-60 second duration. More seismographs are being installed and close watch continues.
Information Contacts:
Card 1313 (08 November 1971) John F. Tomblin, Seismic Research Unit, University of the West Indies, St. Augustine, Trinidad; Bridgetown Radio, Barbados.
Card 1319 (23 November 1971) John F. Tomblin, Seismic Research Unit, University of the West Indies, St. Augustine, Trinidad.
Dome growth continues; lava compositions
Card 1321 (01 December 1971) Lava dome growth in crater lake continues
"The islands which appeared on 20 November have grown in height and in numbers and they have coalesced to form a continuous land mass in the southeastern part of the lake. This land mass is 50-feet in height at the highest point as of 28 November, and the area covered by this larger island is over 100 m in diameter. This island is composed largely of three E-W trending ridges of a black massive rock. In addition, a number of pinnacles and small islands are sticking out of the water NW of this larger island. The lake temperature remains between 79-80°C at the margin of the lake. The lake level has been dropping; it dropped a couple of feet in the last three days.
"I have a report that there has been some leakage or seepage at the flank of the cone of the crater lake waters. The crater lake waters have found an outlet through the flank of the cone and are seeping out. This may account for some of the drop in water level. Earthquakes have been recorded on our seismograms for the last five days, between 10 and 18 events per day. These are not felt; they are instrumental, that is, recorded. There are four seismometers on St. Vincent now; one on the rim of the crater, two on the crater flank, one in Kingstown. There is one tiltmeter site being set up on the eastern flank of the volcano.
"There have been no volcanic explosions, or any emission of steam or gases, and all that has happened since 31 October is the extrusion of a very viscous dome-forming lava onto the floor of the crater. This lava dome is gradually emerging above the water level, higher and higher at approximately 4-6 feet per day. It seems to rise as a continuous mass and there are no disturbances of any sort except for the minor tremors which we have started to record."
Card 1330 (15 December 1971) Eruption continues during 8-13 December with dome growth
The eruption continues as before with emission of lava into the crater. The level of the water in the crater lake has dropped 3.1 m since 3 November. This drop can be accounted for entirely by evaporation and there is no evidence of leakage through the crater wall. The lava island in the crater lake was visited on 13 December by Haraldur Sigurdsson and Peter Baker in a dinghy and it was found that the water temperature increased from 74°C at the lake margin to 90°C at a distance of 10 m from the island. Water in contact with the island was boiling vigorously. The island is 30 m high above lake level and is approximately 600 m in length along its longest axis NW-SE. The rate of rise of the island has slowed down, and the major growth is now lateral by very slow extension of blocky lava lobes and ridges radiating from the central region. Five kilograms of rocks were collected from the southern end of the island. These are samples of plagioclase-phyric dark gray basaltic andesite with sparse phenocrysts of olivine and pyroxene.
In the period from 8 to 14 December only three events have been positively identified as local earthquakes. In addition, 40-60 minor seismic events are being reported every 24 hours by high-gain seismographs close to the crater rim. These events have a fairly constant frequency of 2.5 Hz and are propagated outward from the crater at a surface velocity of 2-3 km/s. Visual observations and timing of events and processes on the island have permitted correlation of some of the larger tremors with rockfall and lava creep.
Card 1336 (29 December 1971) Lava compositions; report of activity during 16-21 December
Information gained since our last report gives grounds for optimism with regards to events in the Soufrière and we consider that the probability of a violent eruption is decreasing. A chemical analysis of the lava collected on 13 December is now available and supports our former identification of a basaltic andesite, with a silica content of 55.3% and an overall composition virtually identical to the numerous basaltic andesite lavas of the Soufrière, which are the products of a quiet outpouring of lava from the crater. No local earthquakes have been recorded by tremors associated with rockfalls on the island continue to occur. The lack of significant seismic activity supports our interpretation of the present events as a relatively quiet eruption of a gas-poor lava.
Observations. Table 1 summarizes observations at the crater.
Table 1. Summary of Soufriere St. Vincent crater observations, 15-31 December 1971. Courtesy of the Seismic Research Unit.
| Date | Height of rocks (above 3 Nov datum) | Water temp. at lake edge | Water level (rel. 3 Nov datum) |
| 15 Dec 1971 | 93 feet | 72°C | -13 ft. 3 in. |
| 16 Dec 1971 | 96 feet | 71°C | -13 ft. 10 in. |
| 17 Dec 1971 | 97 feet | 69°C | -15 ft. 0 in. |
| 18 Dec 1971 | 97 feet | 69°C | -16 ft. 9 in. |
| 20 Dec 1971 | 99 feet | 69°C | -19 ft. 6 in. |
| 21 Dec 1971 | 102 feet | 69.5°C | -20 ft. 9 in. |
| 23 Dec 1971 | 109 feet | 69.5°C | -23 ft. 3 in. |
| 24 Dec 1971 | 109 feet | 70.0°C | -24 ft. 2 in. |
| 25 Dec 1971 | 110 feet | 70.5°C | -25 ft. 6 in. |
| 26 Dec 1971 | 110 feet | 70.5°C | -26 ft. 6 in. |
| 27 Dec 1971 | 110 feet | 69.0°C | -27 ft. 3 in. |
| 28 Dec 1971 | not measured | 66.0°C | -28 ft. 0 in. |
| 29 Dec 1971 | 115 feet | 66.0°C | -29 ft. 5 in. |
| 31 Dec 1971 | 118 feet | 64.0°C | -31 ft. 6 in. |
The island has now reached a height of 120 feet above water level and continues to grow in area as new lava spreads laterally in the lake. The main areas of growth are the radial ridges to the N and SE. New observations of the process of growth indicate that the sequence of events is as follows: hot molten lava is extruded below water level at the base of the ridges and, as this lava comes into contact with the lake water, minor steam explosions are generated. Some of these explosions breach the surface of the lake near the island as areas of boiling water, and are followed by the spread of a red-brown stain which probably consists of stirred-up sediments from the lake bottom. Many of these minor explosions dislodge rocks from the island which have been made unstable by general ridge expansion. These minor explosions accompanied by rockfalls are the most likely source of the numerous minor tremors which are recorded by the seismographs close to the summit.
Water temperature at the observation point on the S edge of the lake has dropped from 74°C to a nearly constant value of 69°C. This may be a local phenomenon, due to relatively small output of lava into the southern part of the lake in the last few days, and we believe that other inaccessible regions of the lake are hotter. The drop in lake level has accelerated slightly in this period and is now approximately 1 foot 6 inches every 24 hours. Sigurdsson and Baker went boating on the crater lake on 21 December and carried out a series of bathymetric soundings along a profile from the S shoreline towards the island (table 2). Unfortunately, this survey had to be abandoned due to unfavorable conditions on the lake. The distance from the S shore of the crater lake to the island is approximately 12 m.
Table 2. Summary of depth and temperature measurements in the Soufriere St. Vincent crater lake, 21 December 1971. Courtesy of the Seismic Research Unit.
| Distance from south shore (fathoms) | Depth (fathoms) | Temp (°C) |
| 5 | 4 | 69 |
| 13 | 14 | 71 |
| 18 | 20 | 72 |
| 23 | 25 | 72 |
| 28 | 26 | 71 |
| 33 | 28 | 71 |
| 38 | 33 | 71 |
| 43 | 31 | 75 |
The survey indicates a maximum depth of 33 fathoms in this profile, at a distance of 38 fathoms from the S shore. Closer to the island the water depth starts decreasing at a rapid rate. Rumors of warm water in the stream S of Windsor Forest village were checked by ground observations on 17 December and found to be untrue. This stream is at a temperature of 25°C and the Falls of Baleine at 23°C. Five seismograph stations continue to operate on a 24-hour basis but three of these stations are within 2 km of the crater. These three stations continue to record the tremors discussed above, and attributed to growth processes in the lava island. No sub-surface earthquakes have been recorded in this period nor have any earthquakes been reported felt.
Composition of the lava. A chemical analysis of the rock samples collected from the island on 13 December is now at hand and the following table is an average of three determinations.
Table 3. Chemical analysis of Soufriere St. Vincent samples from the island in the crater lake collected on 13 December 1971. Data is the average of three determinations; analysis was done by the U.S. Geological Survey. Courtesy of the Seismic Research Unit.
| Oxide | Weight % |
| SiO2 | 55.30 |
| Al2O3 | 18.50 |
| Fe2O3 | 2.30 |
| FeO | 6.20 |
| MgO | 4.00 |
| CaO | 8.40 |
| Na2O | 3.40 |
| K2O | 0.64 |
| H2O+ | 0.35 |
| H2O- | 0.01 |
| TiO2 | 1.00 |
| P2O5 | 0.17 |
| MnO | 0.20 |
| CO2 | 0.02 |
The composition of the lava is that of a basaltic andesite, virtually identical with older Soufrière lavas such as those at Warbishy River, in the cliffs around the Larikai River, Morne Ronde Point, Campobello Bay, and the numerous lava flows which form the cliffs surrounding the Soufrière crater. The new lava is significantly more basaltic, i.e., lower in silica (55.3%) than the products of the most violent phases of the 1902 eruption, which were more andesitic in composition, with silica content of 56-58%.
Interpretation. In volcanic eruptions in general the most silica-rich products appear first, when the risk of violent eruptions and explosive activity is greatest. Products of later stages of an eruption have a lower silica content and are less explosive. We therefore expect that as the present eruption proceeds, lavas with progressively lower silica content will be erupted. All evidence therefore leads us to the conclusion that the likelihood of explosive activity is very small at this time and will become progressively smaller. Were the Soufrière eruption to enter an explosive phase, this would be preceded by major changes in seismic activity and other observable phenomena for at least one or two days.
Information Contacts:
Card 1321 (01 December 1971) Haraldur Sigurdsson, Seismic Research Unit, University of the West Indies.
Card 1330 (15 December 1971) Haraldur Sigurdsson and J.P. Shepherd, Seismic Research Unit, University of the West Indies.
Card 1336 (29 December 1971) Haraldur Sigurdsson and J.P. Shepherd, Seismic Research Unit, University of the West Indies.
Island now 145 feet above water level; lake temperature drops
Card 1341 (11 January 1972) Island now 145 feet above water level; lake temperature drops
Table 1 summarizes daily measurements [during 23-31 December] at the Soufrière. The island is now 145 feet in height above water level, but its growth has decelerated in the last few days. The cooling of the lake to 66°C is an indication that at present very little hot lava is in contact with the water. The lake level has dropped about one foot per day in the last six days. Minor rockfalls continue to take place off the edges of the lava mass, but these are less frequent than in the past weeks as is also indicated by a slight decrease in the number of tremors recorded by the summit seismograph stations. Most of the evidence tends to suggest that there is a slight new lava being extruded at a slower rate into the crater, but whether this decrease in activity is temporary or not is too early to comment on at this stage.
Information Contacts: Haraldur Sigurdsson and J.P. Shepherd, Seismic Research Unit, University of the West Indies.
Island growth continues; historical comparisons
Card 1350 (03 February 1972) Analyses of volcanic products
J. Tomblin reports the following. "In Card 1336 it was stated by Sigurdsson and Shepherd that 'the new hot lava is significantly more basaltic, i.e., lower in silica (55.3%) than the products of the most violent phases of the 1902 eruption, which were more andesitic in composition, with silica content of 56-58%.' These statements are incorrect. Table 4 contains mean values for all available wet chemical analyses of Soufrière rocks, summarized from UWI Seismic Research Special Publication No. 15 (Tomblin, 1968).
Table 4. Mean values for all available wet chemical analyses of Soufrière St. Vincent rocks, summarized from UWI Seismic Research Special Publication No. 15 (Tomblin, 1968). Courtesy of John Tomblin, UWI.
| Sample Source | No. of Analyses | Mean SiO2% |
| Pyroclast flows May 1902 | 4 | 53.1 |
| Ashfall in Barbados (100 miles E) 7-8 May 1902 | 2 | 52.2 |
| Ashfall on SS Coya (275 miles SE) 8 May 1902 | 2 | 57.7 |
| Scoria fall on crater rim March 1903 | 1 | 50.1 |
| Ashfall in Barbados 22 March 1903 | 1 | 50.5 |
| All Pleistocene-Recent pyroclasts deposited in St. Vincent | 14 | 53.2 |
| All Pleistocene-Recent lava flows | 28 | 53.4 |
"From the above it is clear that there is no significant difference in silica content between lava flow and pyroclastic material erupted from the Soufrière Volcano. This writer concludes that the explosiveness of Soufrière magmas is a function of gas, not silica content, there being no direct relationship between these two components. The only noteworthy features of the above figures are that 1) aeolian differentiation of the 7-8 May 1902 ash appears to have been negligible at 100 miles but considerable at the 275-mile range; and 2) pyroclasts erupted at the end of the 1902-03 eruption were about 2% lower in silica than at the beginning of this eruption."
Card 1358 (23 February 1972) Crater observations 12-16 February; island growth continues
Table 5 is a list of observations made at the crater.
Table 5. Summary of Soufriere St. Vincent daily crater observations, 12 February-18 April 1972. Courtesy of the Seismic Research Unit.
| Date | Island height (relative to 3 Nov) | Water temp. at lake edge | Water level (relative to 3 Nov) | No. of crater tremors |
| 12 Feb 1972 | -- | -- | -- | 11 |
| 13 Feb 1972 | 198 ft 10 in | 58.5°C | 66 ft 6 in | 5 |
| 14 Feb 1972 | -- | -- | -- | (12) |
| 15 Feb 1972 | 205 ft 6 in | 58.0°C | 67 ft 8 in | -- |
| 16 Feb 1972 | -- | -- | -- | 11 |
| 17 Feb 1972 | -- | -- | -- | 7 |
| 18 Feb 1972 | 207 ft 6 in | 56.5°C | -69 ft 6 in | 6 |
| 19 Feb 1972 | -- | -- | -- | 12 |
| 20 Feb 1972 | 212 ft 6 in | 57.5°C | -70 ft 5 in | 21 |
| 21 Feb 1972 | 213 ft 6 in | 59.0°C | -71 ft 1 in | 15 |
| 22 Feb 1972 | -- | -- | -- | 13 |
| 23 Feb 1972 | 216 ft 0 in | 57.0°C | -73 ft 1 in | 15 |
| 24 Feb 1972 | -- | -- | -- | (24) |
| 25 Feb 1972 | 219 ft 0 in | 59.0°C | -74 ft 3 in | (10) |
| 26 Feb 1972 | -- | -- | -- | 11 |
| 27 Feb 1972 | 220 ft 2 in | 53.5°C | -75 ft 5 in | 8 |
| 28 Feb 1972 | -- | -- | -- | 21 |
| 29 Feb 1972 | -- | 55.0°C | -76 ft 8 in | (18) |
| 01 Mar 1972 | 223 ft 8 in | 56.0°C | -76 ft 10 in | -- |
| 02 Mar 1972 | -- | -- | -- | -- |
| 03 Mar 1972 | -- | -- | -- | 2 |
| 04 Mar 1972 | 225 ft 0 in | 56.0°C | -78 ft 0 in | 6 |
| 05 Mar 1972 | -- | -- | -- | 11 |
| 06 Mar 1972 | 226 ft 8 in | 55.0°C | -79 ft 6 in | 2 |
| 07 Mar 1972 | -- | -- | -- | 2 |
| 08 Mar 1972 | 230 ft 0 in | 51.0°C | -81 ft 5 in | 0 |
| 09 Mar 1972 | -- | 54.0°C | -- | 0 |
| 10 Mar 1972 | -- | 57.0°C | -83 ft 0 in | 0 |
| 11 Mar 1972 | -- | -- | -- | 0 |
| 12 Mar 1972 | 233 ft 0 in | 55.0°C | -85 ft 0 in | 0 |
| 13 Mar 1972 | -- | -- | -- | 0 |
| 14 Mar 1972 | 224 ft 6 in | -- | -83 ft 4 in | 0 |
| 15 Mar 1972 | -- | -- | -- | 0 |
| 16 Mar 1972 | 225 ft 0 in | 52.0°C | -84 ft 0 in | 1 |
| 17 Mar 1972 | -- | -- | -- | 2 |
| 18 Mar 1972 | -- | -- | -- | 0 |
| 19 Mar 1972 | -- | -- | -- | 6 |
| 20 Mar 1972 | 226 ft 0 in | 53.0°C | -85 ft 6 in | 1 |
| 21 Mar 1972 | -- | -- | -- | 0 |
| 22 Mar 1972 226 ft 0 in | 53.5°C | -86 ft 0 in | 1 | |
| 23 Mar 1972 | -- | -- | -- | 1 |
| 24 Mar 1972 | 226 ft 0 in | -- | -86 ft 6 in | 1 |
| 25 Mar 1972 | -- | -- | -- | 0 |
| 26 Mar 1972 | 226 ft 0 in | 50.0°C | -87 ft 0 in | 2 |
| 27 Mar 1972 | -- | -- | -- | 1 |
| 28 Mar 1972 | -- | -- | -- | 0 |
| 29 Mar 1972 | 226 ft 0 in | 50.0°C | -88 ft 0 in | 0 |
| 30 Mar 1972 | -- | 49.0°C | -- | 1 |
| 31 Mar 1972 | 226 ft 0 in | 48.5°C | -89 ft 0 in | 1 |
| 01 Apr 1972 | -- | -- | -- | 1 |
| 02 Apr 1972 | -- | -- | -- | 0 |
| 03 Apr 1972 | 226 ft 0 in | 45.5°C | -89 ft 6 in | 0 |
| 04 Apr 1972 | -- | -- | -- | 0 |
| 05 Apr 1972 | -- | 47.5°C | -- | 0 |
| 06 Apr 1972 | 226 ft 0 in | 46.5°C | 90 ft 0 in | 0 |
| 07 Apr 1972 | -- | -- | -- | 0 |
| 08 Apr 1972 | 226 ft 0 in | 47.5°C | 91 ft 0 in | 0 |
| 09 Apr 1972 | -- | -- | -- | 0 |
| 10 Apr 1972 | -- | -- | -- | 3 |
| 11 Apr 1972 | -- | -- | -- | 1 |
| 12 Apr 1972 | 226 ft 0 in | 47.0°C | 92 ft 0 in | 0 |
| 13 Apr 1972 | 226 ft 0 in | 47.0°C | 92 ft 6 in | 0 |
| 14 Apr 1972 | -- | -- | -- | 0 |
| 15 Apr 1972 | -- | -- | -- | 0 |
| 16 Apr 1972 | -- | -- | -- | 0 |
| 17 Apr 1972 | -- | -- | -- | 0 |
| 18 Apr 1972 | 226 ft 0 in | -- | -- | 0 |
The increase in the rate of growth of the island which occurred on 9 February is continuing at present. The current rate of increase is 3 ft/day as compared with a rate of increase of 1 ft/day prior to 9 February, representing a 200% increase in the growth rate. While the N of the island continues to rise, the S end shows little or no increase in height. This indicates that the activity has now shifted almost entirely to the N end of the lava island. Another survey of the island is planned and would probably be carried out within the next two weeks, in order to determine the rate of increase in area of the island. The water temperature has maintained a level of about 58°C for the past week, while the water level continues to decrease at the rate of 6 in/day. Tremors in the vicinity of the crater continue to be recorded, at a rate of about 10/day for the past week. There was a temporary failure of all three seismograph stations in the vicinity of the Soufrière, between 14-15 February. However, the summit and Rabacca station are back in operation, and repairs are continuing on the Wallibou station.
Card 1359 (29 February 1972) Comparison of current eruption with historical activity
The current eruption is a mild one and involves the growth of a volcanic dome. It is completely different in character from the three earlier historic eruptions of the Soufrière, all of which were violently explosive throughout. It is, however, similar to the second half of the two large historic eruptions of Mt. Pelée, Martinique, in 1902-05 and 1929-32. In each of these eruptions there was an initial, highly explosive phase which lasted several months, and this was followed by a second phase in which fresh lava welled up quietly into the crater to build a dome. In both Martinique eruptions, dome growth continued for more than two years. Comparable periods of between six months and three years have been reported for dome building at volcanoes in other parts of the world. Thus the present eruption in St. Vincent is likely to continue for one year and could possibly continue for two. This conclusion is supported by the constancy of the rate of lava emission (~0.5 x 10⁶ m3/day) from the beginning of November 1971 to the present, and by the small total volume so far erupted (80 x 106 m3) in comparison with the total fresh lava produced in 1902-03 (2,600 x 106 m3).
The likelihood of dangerously explosive activity during the present eruption is now remote. In at least 95% of historic eruptions at similar volcanoes where there has been any explosive activity, this has begun within the first two months of the onset of eruption. The Soufrière has now been in eruption for over four months and has comfortably exceeded this initial period of high uncertainty. At the present rate of lava emission, the summit of the new dome should reach the level of the lowest parts of the crater rim by May 1972, and the crater will be almost completely filled by early 1973. The viscosity of the new lava is high so that even if the dome grows to the point at which its flanks overlap the present crater rim, it is unlikely that molten lava will escape down the mountainside.
Information Contacts:
Card 1350 (03 February 1972) John F. Tomblin, Seismic Research Unit, University of the West Indies.
Card 1358 (23 February 1972) W. Aspinall and H.J. Almorales, Seismic Research Unit, University of the West Indies.
Card 1359 (29 February 1972) John F. Tomblin, Seismic Research Unit, University of the West Indies.
Dome survey shows expansion; growth rate slows in March
Card 1364 (07 March 1972) Crater observations, 17-28 February
Observations made at the crater [are included in Table 5].
Activity at the crater has continued along the lines established three months ago. The height of the lava dome has increased by an average of about 1.5 ft/day and the lake water has continued to drop at a mean of 9 in/day. The water temperature at the lake edge, which remained constant between 56-60°C during the previous four weeks, dropped to a new low of 53.5°C on February 27.
An excursion by rowboat was made on 27 February by R. Arculus and K. Willis, geology research students from the University of Durham, England. Conditions were very unfavorable, with high winds, poor visibility, and frequent rockfalls from the flanks of the dome which are now relatively steep. Consequently, it was impossible to carry out a complete sounding survey. The maximum water depth recorded was 99.5 ft, at a point approximately halfway between the island and the lake edge. This depth is 48.5 ft less than the maximum obtained during the previous sounding survey on 27 January, and confirms that the lava dome is still expanding horizontally across the former lake floor.
Measurements have been made on near-vertical air photos of the crater taken on 11 February and kindly placed at our disposal by Mrs. M. Barnard. These indicate that the dome is approximately circular in plan at water level with dimensions on 11 February of 590 m (1,970 ft) from N to S, and 540 m (1,800 ft) from E to W.
On 28 February, a re-triangulation by theodolite was carried out by R. Waters of the Directorate of Overseas Surveys. This showed that the dome had expanded to 640 m (2,130 ft) in N-S diameter at water level and 590 m (1,970 ft) from E to W. This represents an increase in both horizontal dimensions at water level by 50 m in the last 17 days. Approximately 7 m of this increase is apparent and not real, i.e., due to the drop in water level between 11-27 February. The true amount of horizontal expansion of the dome is therefore 44 m.
The W half of the dome is now 10-20 feet higher than the E half, and the two halves are still separated by a N-S valley. The N part of this valley is the most actively steaming area of the dome. The dome summit was 295 ft. above current lake level on 27 February.
The only local seismic activity consists of small tremors which continue to originate close to the crater. Between 10-20 such events are currently occurring per day. There have been no deeper or larger earthquakes of the kind which we would expect to see prior to a major increase in the scale of the eruption. On the other hand, the shallow tremors have decreased to about one-quarter of their rate of occurrence in early December, without any decline having taken place in the rate of injection of new lava into the dome.
All available evidence indicates that the eruption will neither end nor become violent in the early future. The risk of a dangerous eruption is now remote and will continue to decrease with time. However, so long as this continues, the present monitoring system should be maintained.
Card 1366 (20 March 1972) Crater observations, 29 February-12 March
The eruption continues as before. The rate of rise of the rocks has decreased slightly to about one foot per day but the rate at which the water level is dropping is still about nine inches per day. The water temperature shows a downward trend and reached a new low of 51°C on 8 March, but this was followed by rise to 57°C by 10 March. The most noticeable feature of this period has been the very small number of crater tremors, and no tremors have been recorded since 7 March. There is still no sign of deeper seismic activity. Rockfalls continue to be frequent.
No comprehensive survey of the island has been carried out during this period but from visual observation the general shape is still as previously described.
Card 1370 (28 March 1972) Activity and growth rate slow in March
It is evident from the data of the past three weeks that activity in the Soufriere crater is very slight. The rise of the island mass slowed down on 1 March and in the period 1-22 March the total increase in island height has been 2 feet 4 inches or only 1.3 inches/day on the average. On 22 March the western summit of the island was the highest point, 226 feet. The northern peak was at 216 feet and the eastern summit at 201 feet. Water level is dropping at a slower rate than before 7 March, when the daily drop was 9 inches on the average. The present rate of drop in water level is 4 inches per day, but the lake has finally reached its pre-eruption level, 85 feet below 3 November datum. When the lake was at its highest level on November 20th, it was thus some 92.5 feet above the normal pre-eruption level. Seismic activity is low, and limited to one crater tremor per day on the average.
Sigurdsson and Almorales carried out a bottom survey of the crater lake on 2 March (table 6) along a profile from the south point of the island to the near shore (282 feet). The maximum depth in this area is 111 feet. Surface water temperature near the southern shore of the island is 62°C. A boat trip was made around the island and water temperature recorded at different points in the lake. Maximum temperature of 81°C was recorded in bubbling hot springs on the northern shore of the lava mass, but minimum temperature of 49°C was encountered in center of the wide bay east of the island.
Table 6. Depth soundings in the southern part of the Soufriere St. Vincent crater lake, 2 March 1972. Courtesy of the Seismic Research Unit.
| Distance from island (feet) | Depth (feet) | Surface Temperature °C |
| 0 | -- | 62 |
| 30 | 24 | 56 |
| 60 | 42 | 59 |
| 90 | 66 | 57 |
| 120 | 93 | 58 |
| 150 | 100 | 57 |
| 180 | 111 | 57 |
| 210 | 93 | 54 |
| 240 | 84 | 53 |
| 270 | 33 | 52.5 |
| 282 | -- | 52.5 |
Information Contacts:
Card 1364 (07 March 1972) John F. Tomblin, Seismic Research Unit, University of the West Indies.
Card 1366 (20 March 1972) J.B. Shepherd, Seismic Research Unit, University of the West Indies.
Card 1370 (28 March 1972) H.J. Almorales and H. Sigurdsson, Seismic Research Unit, University of the West Indies.
Lava island stopped growth on 20 March; eruption over
Card 1380 (17 April 1972) Lava island stopped growth on 20 March; eruption over
Since 20 March the island in the middle of the crater lake has maintained a maximum height of 226 feet on he western summit. The greatest heights on the eastern and northern summits are 196 and 211 feet, respectively. These two heights which are now considered reliable are not in agreement with the heights quoted in the previous report when the measuring poles were interfered with by other parties. Loose rocks continue to crumble off the slopes, thus narrowing the peaks and forming more lateral spread towards the base of the island.
The temperature of the water at the crater edge has been decreasing by 0.5°C/day on the average since 22-31 March and an increased drop of 3° was detected three days after. The water level is now dropping at the rate of 3.5 inches per day leaving on the slopes of the crater a thin scum of muddy substance which on hardening becomes flaky and is eventually washed back into the lake by the rain.
The number of crater tremors have gradually declined to one about every two days. These tremors are of shallow depths, very low magnitude and can only be detected by the summit station. This decline in seismic activity is probably due to the island not growing or the absence of new lava emitting from the crater.
On 11 April 1972, H. Sigurdsson reported that "the Soufriere eruption has now ceased. Height of the lava island has remained constant at 226 feet above 3 November datum since 20 March, or some 316 feet above present water level. Crater tremors were of the order one a day since 7 March, but none have been recorded since 1 April."
Information Contacts: H. Sigurdsson, Seismic Research Unit, University of the West Indies.
Water temperature and level decrease
Card 1388 (02 May 1972) Crater situation unchanged in over a month
The situation in the crater remains the same as it has been for more than a month. The island height is unchanging; loose material on the island is being washed into the lake by the rains, revealing the structure of the lave mass. Water continues to evaporate from the lake thereby reducing the lake level fractionally; the color of the water is now clearer and more translucent indicating that the sediments disturbed by the initial eruptive activity are resettling. The number of crater tremors is practically zero. The phase of lava emission appears to have come to a halt, but crater observations will continue.
Card 1394 (22 May 1972) Water temperature and level decrease
"There has been no further increase in the height of the island of lava since 20 March, indicating that no more lava has been introduced into the crater lake. The highest point on the island is still 226 feet relative to the 3 November datum.
The water temperature continues to decrease with minor fluctuations. The temperature was 46°C on 7 May and 41°C on 11 May. The water level is decreasing at an average rate of 1.5 inches/day, as evaporation over the crater lake continues. The water level was 94 ft on 23 April, 95 ft 6 inches on 7 May and 96 ft on 11 May.
The frequency of crater tremors continued on a greatly diminished scale and only six tremors were recorded during the past three weeks.
The situation at the crater has maintained the current pattern over the past seven weeks. Observations at the crater will continue until a state of normalcy has been established."
Information Contacts:
Card 1388 (02 May 1972) J.B. Shepherd and W.P. Aspinall, Seismic Research Unit, University of the West Indies.
Card 1394 (22 May 1972) H.J. Almorales, Seismic Research Unit, University of the West Indies.
Water temperatures and level stabilize
Card 1400 (09 June 1972) Water temperatures and level stabilize
During the period 13-26 May 1972, the situation at the crater continued along the lines stated in the last report. The highest point on the island maintained its height of 226 feet relative to the 3 November datum. This point is now 324.5 feet above the present water level.
The water temperature varied between 40-41°C. The temperature was 40°C on 15 May, 41°C on 18 May, 40°C on 22 May, and 41°C on 25 May.
The water level continued to decrease, but at a slightly higher average rate, from 1.5 inches/day to 2.0 inches/day. The water level was -97 feet on 15 May, -98 feet on 22 May, and -98.5 feet on 25 May, and is now 13.5 feet below the original level of the lake.
The occurrence of crater tremors was practically zero, with one tremor recorded during the last two weeks.
Work on the construction of a tiltmeter station at Orange Hill is now completed. The installation of instruments, initial adjustments, and readings to establish reference levels is scheduled for the next two weeks.
Information Contacts: H.J. Almorales, Seismic Research Unit, University of the West Indies.
Major explosive eruption; 17,000 evacuated
A series of powerful explosions from Soufrière produced large ash clouds and several pyroclastic avalanches, forcing the evacuation of more than 17,000 persons from the N end of St. Vincent. This eruption is particularly noteworthy because of the wide variety of observations made by various scientific teams (from land, low-flying aircraft, a high-altitude research plane, and from satellites). When these data are analyzed and integrated, the geophysical community can look forward to an unusually well-documented account of an episode of explosive island-arc volcanism.
The first pre-eruption seismic event, telemetered to the Seismic Research Unit of the University of the West Indies by seismometers 3 and 9 km from Soufrière's summit, was a strong local earthquake at 1106 on 12 April, within 1 hour of the fortnightly earth tide maximum (calculated by F.J. Mauk). Seismic activity gradually increased through the day, and by 1900 about 15 clearly identifiable earthquakes, apparently B-type, were occurring per hour. Continuous harmonic tremor began to build an hour later, and within 2 hours was saturating the seismometers.
A team of volcanologists and seismologists from the Seismic Research Unit arrived on St. Vincent 13 April, and were later joined by researchers from several other institutions. The first explosive activity was observed at dawn (about 0500) on 13 April. Subsequent explosive events were reported at 1115, 1700, and 2050 on the 13th, 0300 and 1200 on 14 April, 1705 on 17 April, 0635 on 22 April, and 2355 on 25 April. Analysis of infrared imagery from NOAA's SMS-1 weather satellite indicates that most of these high eruption clouds were fed briefly (less than 1/2 hour) by the volcano. The largest of the clouds, from the 17 April explosion, reached an estimated height of 18 km and ultimately grew to a diameter of 140 km. The noon explosion on 14 April produced a 100 km-diameter cloud, and two explosions on 13 April also produced sizeable clouds, 60-km-diameter at 1700 and 40 km at 2050. The first two explosion clouds on 13 April were smaller, and the explosion reported at 0300 on 14 April produced no infrared signature. Most of the explosions occurred close to diurnal earth tide maxima, and the 17 April explosion also fell on the fortnightly earth tide minimum (calculations from F.J. Mauk).
A NASA P-3 Electra aircraft, equipped with lidar, a 10-stage quartz-crystal microbalance, and an NO2 remote-sensing instrument, flew through the periphery of the 17 April cloud minutes after it was ejected. Ash was collected and photographs were taken. The next evening, the NASA aircraft's lidar detected significant quantities of ejecta in the stratosphere, in patches 0.5-3 km thick with a base altitude of about 18.7 km. Scientists at NCAR, Kyushu University, and other institutions, will search at higher latitudes for stratospheric aerosols from this event.
Hot pyroclastic avalanches have accompanied at least three of the explosions. The largest avalanche flowed down the Larikai River valley (figure 1) at noon on 14 April and continued beyond the mouth of the river (3 km W of the crater) several kilometers out to sea. Its deposit at the coast was 1.5 m thick, ~300 m wide, and contained scoria blocks up to 60 cm in diameter. The surface temperatureof this deposit was well in excess of 100°C when it was inspected 28 hours after emplacement. A hot avalanche from one of the earlier explosions traveled 2.5 km SE from the summit, down the Rabacca Valley, and the 17 April explosion produced numerous hot avalanches that moved down several valleys on the flanks of the cone.
 |
Figure 1. Sketch map of Soufrière and the N portion of St. Vincent, based on the map in the Catalog of Active Volcanoes of the World. Arrows show routes taken by pyroclastic avalanches, which traveled down valleys on Soufrière's flanks during at least three of the explosions in April 1979. Lengths are approximately proportional to distances traveled by the hot avalanches. Arrows labeled 1 and R indicate avalanches in the Larikai and Rabacca valleys. The lake and island (a lava dome extruded during the 1971 eruption) shown in Soufrière's summit crater were both destroyed during the present eruption. Rocks older than the Soufrière edifice are shown by a stippled pattern. |
Ashfalls from most of the explosions were limited to a few centimeters in the N portion of St. Vincent, and small amounts on Barbados, ~150 km E. However, during the 22 April eruption (figure 2) abnormal winds dropped 4 mm of ash on Kingstown (the capital of St. Vincent), on the S end of the island.
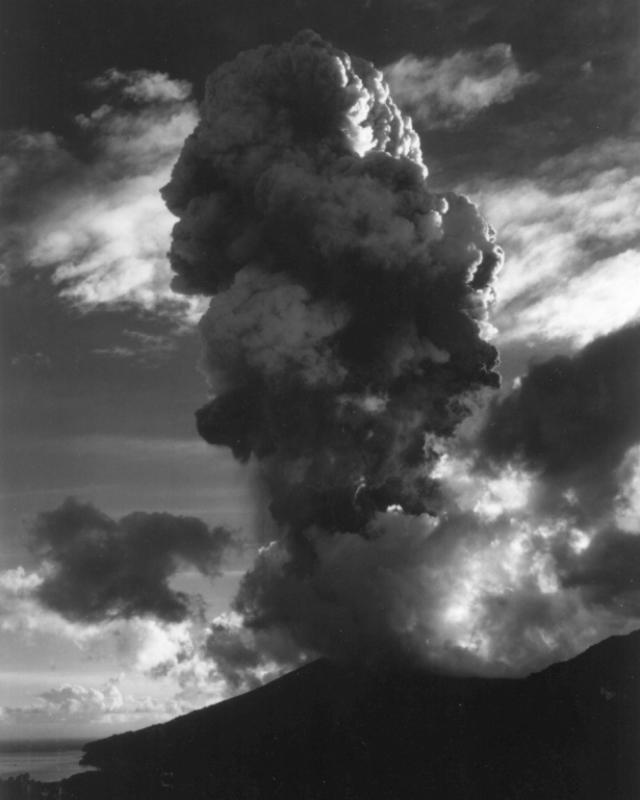 |
Figure 2. Photograph taken shortly after the onset of the 22 April 1979 explosion of Soufriere of St. Vincent. Height of the eruption cloud is estimated to be ~6 km. Photo taken by R. Fiske. |
The character of the seismic activity varied considerably during the eruption. Harmonic tremor continued to saturate the instruments from 2200 on 12 April through 1600 on 14 April. Beginning at about 0900 on the 15th, a decline in tremor amplitude made it possible to identify more than 100 individual events per hour at the station 9 km from the summit. The number of individual events declined irregularly through the morning of 16 April. At about 2000 on the 16th, the seismicity changed entirely to rock fracture events, which continued until the explosion of 17 April. After this explosion, the seismicity consisted primarily of 30-50 small explosion events per hour, which could be correlated with the ejection of steam puffs that sometimes contained a little ash. Most of the later explosions were preceded by brief periods (up to 3 hours) of seismic quiet. Seismicity ended almost completely at about 0300 on 29 April. With the exception of a 20-minute period of tremor during the night of 29-30 April, the volcano has remained seismically quiet through early 3 May.
. . . . The amount of tephra produced by the current eruption is about two orders of magnitude less than in 1902. . . .
Information Contacts: J. Tomblin, W. Aspinall, K. Rowley, and J. Shepherd, UWI; A. Kreuger and R. LaPorte, NOAA; M. McCormick, NASA LaRC; F. Mauk, Univ. of Michigan; R. Fiske, SI.
Explosions and seismicity end; new lava dome in summit crater
A new phase of activity from Soufrière began in late April. At 0300 on 29 April, the seismicity that had accompanied the eruption since 12 April ended almost completely, and there have been virtually no local earthquakes since then. Katia Krafft climbed to the crater rim on 3 May and observed a small new lava dome growing in the base of the crater, the same area that had been occupied by the center of the now-destroyed 1971 dome. A sample of the new dome collected by John Tomblin in mid-May was described in hand specimen as a basaltic andesite, similar to the 1971 dome.
By the end of May, the new dome had grown to ~500 m in diameter and 60 m in height. The dome's growth rate was difficult to estimate, but was probably <0.5 x 10⁶ m3/day in late May. Virtually all of the recent expansion of the relatively fluid dome has been lateral rather than vertical.
A few small explosions have taken place from the dome, but none were large enough to project material above the rim (about 300 m above the crater floor). Fumarolic activity from the top of the dome was moderately strong during the early stages of its growth, but had stopped by 20 May. In late May, fuming was still fairly vigorous around the dome, on the floor of the crater. A team from Guadeloupe's volcanological observatory measured a temperature of 239°C from the fumaroles in late May, and collected samples from the dome.
The April explosions deposited a total of about 30 cm of ash on the zone within 1 km of the crater rim. Large numbers of massive dense remnants of the 1971 dome and scoria blocks up to 60 cm in diameter were also found in this zone.
H.H. Lamb's preliminary estimate of Dust Veil Index (Lamb, 1970) for this eruption is from 3 to 9, probably nearer to 3. The Dust Veil Index for the 1902 eruption of Soufrière was calculated at 300; the Krakatau 1883 eruption = 1,000.
Much of the crater floor is presently mantled with rubble. The new dome had spread over the remnants of the old crater lake by about 20 May, but a new lake had begun to form at the beginning of June because of the onset of the rainy season.
Most of the more than 17,000 evacuees were allowed to return to their homes on 14 May, including residents of the two largest towns near the volcano, Georgetown and Chateaubelair. Restrictions remain in effect for the 4,000 persons who live in the zone devastated by the 1902 eruption, N of the Rabacca and Wallibou Rivers.
Reference. Lamb, H.H., 1970, Volcanic dust in the atmosphere: Philosophical Transactions of the Royal Society of London, series A, v. 266, no. 1178, p. 425-533.
Information Contacts: W. Aspinall, K. Rowley, J. Shepherd, and J. Tomblin, UWI; K. Krafft, Cernay, France; H. Lamb, Univ. of East Anglia.
Aseismic lava extrusion persists; heavy rains generate large secondary mudflows
A period of summit crater lava extrusion, accompanied by little or no seismicity, began in late April and was continuing at the end of June.
Richard Fiske and Haraldur Sigurdsson descended into Soufrière's crater on 18 June. Lava extrusion continued from the same vent that produced the 1971 dome and the 1979 explosions. Blocky lava had flowed to the N wall of the crater, reaching maximum dimensions of 725 m across and 110 m high according to their tape and compass survey. The small number of flow front rock avalanches observed during their 4-hour stay may indicate a rate of extrusion substantially lower than in late April. Heavy steaming in the crater limited visibility.
Since the recent beginning of the rainy season, large quantities of tephra have been eroded from Soufrière's flanks. Major mud flows that traveled down the larger valleys (mostly on the W side of the volcano) carved deep, narrow canyons, dramatically exposing pre-1979 valley fill deposits. The mudflows disrupted road crossings in the Rabacca Valley (E flank) but otherwise did little property damage. Revegetation of the areas devastated by the 1979 eruption had begun by mid-June.
The zone of destruction from the 1902 eruption (N of the Wallibou and Rabacca Rivers) remains partially evacuated. Some of the several thousand evacuees work in the area during the day, but most leave at night.
Information Contacts: R. Fiske, SI; H. Sigurdsson, Univ. of Rhode Island.
Lava extrusion continues
Lava extrusion at Soufrière continued through July. Between surveys on 2 July and 4 August, the lava had expanded 30-50 m horizontally (except on the N side where it had reached the crater wall, 4:6) and about 6 m vertically, to a mean diameter of 820 m and a mean height of 85 m. Assuming 45° sides, its volume was 36.5 x 10⁶ m3 on 4 August, having increased an average of 0.36 x 10⁶ m3/day in July (similar to the June rate).
During the August survey, some pulsing steam emission took place, mostly at the S edge of the lava, but no explosions were observed. The summit seismic station recorded 50-200 small earthquakes per day during July, but none of these were detected by instruments on the flanks.
Information Contacts: J. Tomblin, UWI.
Lava extrusion slows
Lava extrusion continued through August. However the extrusion rate has decreased during the past 3 months, as shown in table 7. The mean diameter of the lava extrusion increased from 820 m on 4 August to 832 m on 21 August, but the highest point has remained at 130 m above the crater floor since 11 August, after 13 m of vertical growth from 10 July to 11 August.
Table 7. Rate of lava extrusion in the summit crater of Soufrière St. Vincent, 25 May-25 October 1979, calculated by John Tomblin.
| Date | Daily Volume Increase (x 106 m3) |
| 25 May-02 Jul 1979 | 0.30 |
| 02 Jul-04 Aug 1979 | 0.24 |
| 04 Aug-21 Aug 1979 | 0.17 |
| 21 Aug-23 Sep 1979 | 0.06 |
| 23 Sep-02 Oct 1979 | 0.10 |
| 02 Oct-25 Oct 1979 | 0.01 |
Between 50 and 200 very small local earthquakes continued to be recorded daily by the summit seismic station, but very few were detected by seismometers on the flanks.
When the summit was not obscured by clouds, gentle but continuous steam emission was visible. Steam frequently rose slightly above the crater rim. Water was sometimes present in the crater, especially after heavy rains, but the volume of water remained small and water depths did not exceed ~1 m.
Information Contacts: J. Tomblin, UWI.
Lava extrusion continues
Extrusion of lava into Soufrière's summit crater continued through September. However, the rate of extrusion continued to decrease; the late August-late September rate was an order of magnitude less than peak values observed in mid-May.
Between 21 August and 23 September, the mean diameter of the lava body grew from 832 m to 840 m, covering about 60% of the crater floor, and its maximum height increased 1 m to 131 m. Its volume was calculated at 37.6 x 10⁶ m3.
Small seismic events continued to be recorded by the summit seismograph. There has been no significant change in seismicity since a several-day increase in the number of events in late June and early July.
Information Contacts: J. Tomblin, UWI.
Lava extrusion virtually stopped
By late October, extrusion of lava into Soufrière's central crater had virtually stopped. The October extrusion rate was an order of magnitude less than that of late September and two orders of magnitude less than the May rate.
The mean diameter of the lava extrusion increased by only 1.5 m between 2 and 25 October, to 870 m, and the maximum height remained ~130 m. Vigorous steaming from the lava was continuing in late October, but the number of small local earthquakes recorded by the summit seismograph had declined markedly since early October.
Information Contacts: J. Tomblin, UWI.
Lava extrusion stopped
No lava has been extruded into Soufrière's central crater since the survey of 25 October. However, monitoring of the volcano by the Seismic Research Unit, University of the West Indies, continues. Data from four seismometers are telemetered continuously to Trinidad, and scientists visit the volcano every weekend.
Further References. Fiske, R., and Sigurdsson, H. (eds)., 1982, Soufrière Volcano, St. Vincent: Observations of its 1979 eruption from the ground, aircraft, and satellites: Science, v. 216, no. 4550, p. 1105-1126 (11 papers).
Shepherd, J.B., Aspinall, W.P., Rowley, K.C., and others, 1979, The eruption of Soufrière Volcano, St. Vincent April-June 1979: Nature, v. 282, p. 24-28.
Shepherd, J.B., and Sigurdsson, H., 1982, Mechanism of the 1979 Explosive Eruption of Soufrière Volcano, St. Vincent: JVGR, v. 13, p. 119-130.
Sparks, R.S.J., and Wilson, L., 1982, Explosive volcanic eruptions - V. Observations of plume dynamics during the Soufrière eruption, St. Vincent: Geophysical Journal of the Royal Astronomical Society, v. 69, p. 551-570.
Information Contacts: J. Tomblin, UWI.
Anomalous winds spread sulfurous odors, causing unwarranted fears
Widespread sulfurous odors and haze during mid-February 2005 on the island of St. Vincent and as far as the Grenadines (50-75 km S) led some people to conclude that the smells reflected increased output of volcanic gases from the Soufrière volcano, St. Vincent, a possible harbinger of an eruption. Sulfurous odors are common on the volcano's W flank, but less frequent on other parts of the island. Scientists determined that typical winds diminish the sulfurous odors over much of the island, and the onset of the odors resulted from changes in wind patterns rather than increased gas output or other demonstrable changes.
The Seismic Research Unit (SRU) collaborates with a small local unit called the Soufrière Monitoring Unit (which operates from the Ministry of Agriculture in Kingstown). The following report on the subject comes from SRU's Richard Robertson.
"During the night of 16 February and most of the day of 17 February there were widespread reports of sulfurous smells throughout southern St. Vincent and as far as the Grenadines. The day of the 17th was hazy; people put these two things together and came up with the conclusion that the volcano was acting up. The sulfur smell is unusual since the wind direction is such that most of the smell from the fumaroles at the summit of the volcano gets blown out to sea and is usually only smelt by a few residents on the eastern flank of the volcano.
"[SRU] . . . worked with Ms. Aisha Samuels, the head of the local volcano monitoring unit, to first investigate the report and later to quell fears that the volcano was doing anything unusual. We determined very early on that nothing serious was happening, since we have seismic stations both on the volcano and throughout the island [figure 3], none of which had recorded any increased seismicity. Further, we had just completed a GPS campaign on the island during January 2005, which revealed nothing unusual. It also involved two days of measurements on the summit of the volcano during which scientists were in very close proximity to the vent from which future eruptions will [likely] originate.
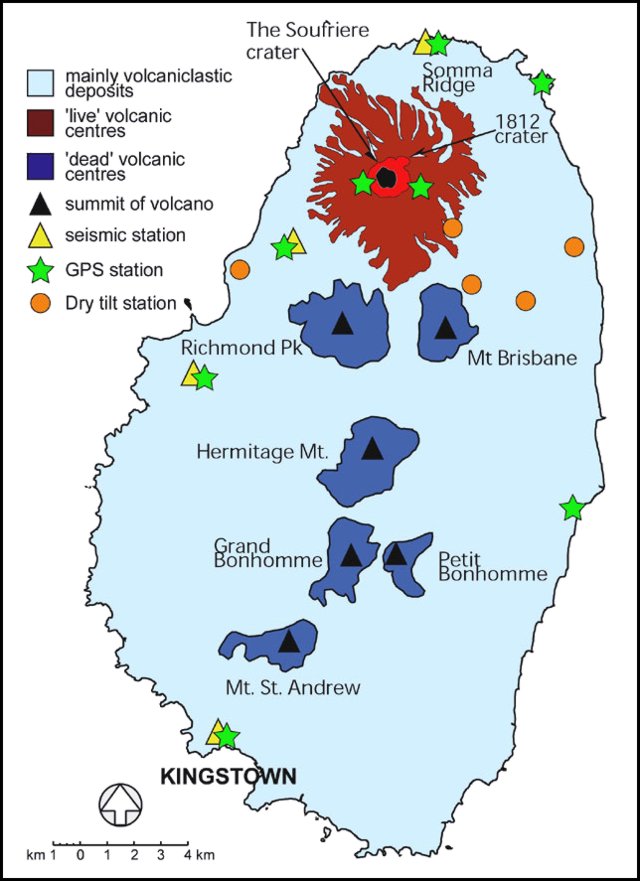 |
Figure 3. A sketch map showing the island of St. Vincent, including Soufrière volcano, other volcanic centers, geographic features, and Seismic Research Unit monitoring instrumentation (as of February 2004). January 2005 discussion of the instrumentation noted that it then included five seismic stations, eight GPS stations, and several dry-tilt sites. Courtesy of SRU. |
"We quickly determined that the reported 'activity' was due to an unusual southerly wind combined with the phenomena of Sahara dust which is common around this time of the year in St. Vincent and which results in very hazy conditions. However, to completely rule out the possibility of anything unusual happening in the crater that may not have been possibly detected by our various measurements, we advised the local Unit that they should visit the crater summit the next day (18 February)."
That visit found nothing out of the ordinary. Accordingly, SRU did not think it necessary to update their website since it was so insignificant—"'a 10 day wonder' as they say in the West Indies, or a 'pseudo-crisis.'" Such reports are common for St. Vincent and the entire region.
Information Contacts: Richard Robertson, Seismic Research Unit, The University of the West Indies, St. Augustine, Trinidad (URL: http://www.uwiseismic.com/); Aisha Samuel, Soufriere Monitoring Unit, Ministry of Agriculture, St. Vincent.
New lava dome on the SW edge of the main crater in December 2020
Soufrière St. Vincent is the northernmost stratovolcano on St. Vincent Island in the southern part of the Lesser Antilles. The NE rim of the 1.6-km-wide summit crater is cut by a crater (500 m wide and 60 m depth) that formed in 1812. Recorded eruptions date back to 1718, with notable eruptions occurring in 1812, 1902, and 1979. The eruption of 1979 was characterized by ashfall, pyroclastic flows, and lahars, in addition to a series of Vulcanian explosions during 13-26 April 1979 that destroyed the lava dome in the summit crater, which had formed during a 1971 effusive eruption (SEAN 04:04). As a result, more than 20,000 people were evacuated. Beginning around 3 May 1979 another lava dome began to form in the main crater (SEAN 04:05; Shepherd et al., 1979) that continued to grow until the end of October 1979, expanding to 850 m in diameter and 120 m high (SEAN 04:11; Cole et al., 2019).
No further eruptive activity took place until December 2020, when a new lava dome began to grow SW of the pre-existing 1979 lava dome, accompanied by increased seismicity, crater incandescence, and gas-and-steam emissions. This report reviews information through February 2021 using bulletins from the University of the West Indies Seismic Research Centre (UWI-SRC), the National Emergency Management Organisation (NEMO), and various satellite data. Soufrière St. Vincent is monitored by the SRC assisted by the Soufrière Monitoring Unit (SMU) from the Ministry of Agriculture in Kingstown. As of 2004, the monitoring network had consisted of five seismic stations, eight GPS stations, and several dry tilt sites. Seismic data are transmitted from field sites to the Belmont Observatory (9 km SSW), which is operated by the SMU (figure 4). On 1 January 2021 a new seismic station was installed at Georgetown, on 10 January one was installed in Owia, followed on 15 January by another on the upper S flank, station SSVA at the summit on 18 January, and in Fancy on 21 January. In February 2021 the USGS-USAID (US Geological Survey-US Agency for International Development), through the Volcano Disaster Assistance Program (VDAP), donated equipment to build four more seismic stations.
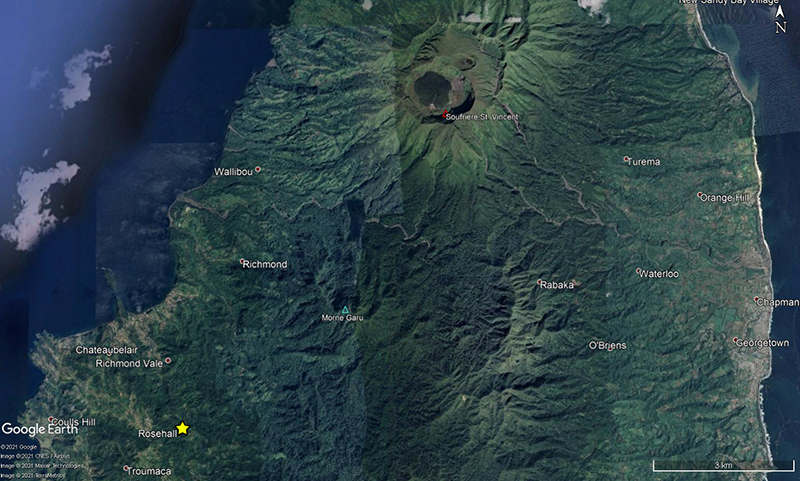 |
Figure 4. Location map of the Belmont Observatory (yellow star) located in Rosehall, St. Vincent, 9 km SSW from the Soufrière St. Vincent summit crater (red triangle). Base map satellite imagery courtesy of Google Earth. |
A spike in seismicity was recorded during June-July 2019 (figure 5), though no cause was reported. The number of events sharply declined after July but continued intermittently through November 2020. Seismicity began to increase in early November through 23 December 2020, which included 126 earthquakes described as volcano-tectonic events and rockfall signals that were captured on one reliable seismic station (SVB) located 9 km from the volcano. The maximum daily count was 11 events on 16 November. After 23 December a total of eight events were detected before seismicity briefly subsided.
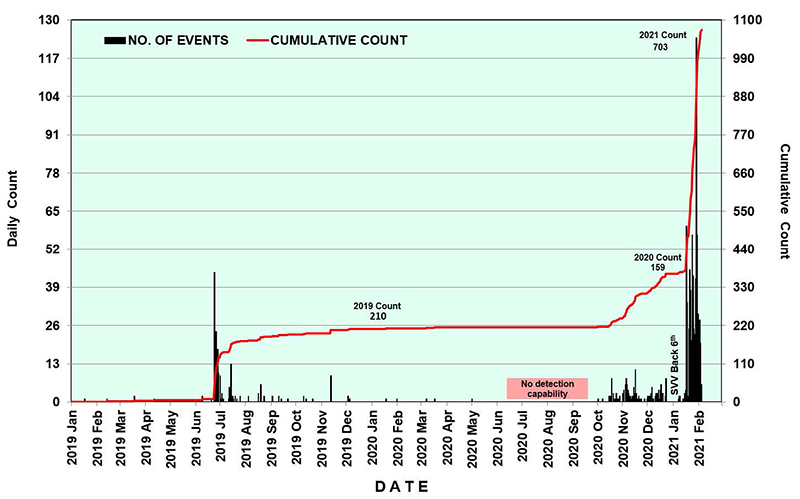 |
Figure 5. Daily count of volcanic earthquakes recorded at Soufrière St. Vincent during 1 January 2019 through February 2021. Increased seismicity was detected during June-July 2019 and mid-October 2020 through February 2021. An installation of station SVV on 6 January 2021 at Wallibou is annotated on this graph. Data courtesy of UWI-SRC. |
Activity during December 2020. Staff members of the Soufrière Monitoring Unit (SMU) made visual observations of the crater on 16 December and reported minor changes in fumarolic activity and a small lake on the E side of the crater floor. On 27 December UWI-SRC and NEMO reported that an effusive eruption had begun, which was characterized by a new lava dome in the main crater on the SW perimeter of the 1979 dome (figures 6 and 7). A thermal hotspot in the crater was also detected that day using satellite data by NASA FIRMS. As a result, the Volcanic Alert Level (VAL) was raised to Orange (the second highest level on a four-color scale) on 29 December (figure 8). The Volcano Ready Communities Project, a collaboration between NEMO SVG and UWI Seismic Research Centre, distributed their volcano hazard map for the surrounding communities, in preparation for a potential evacuation (figure 9).
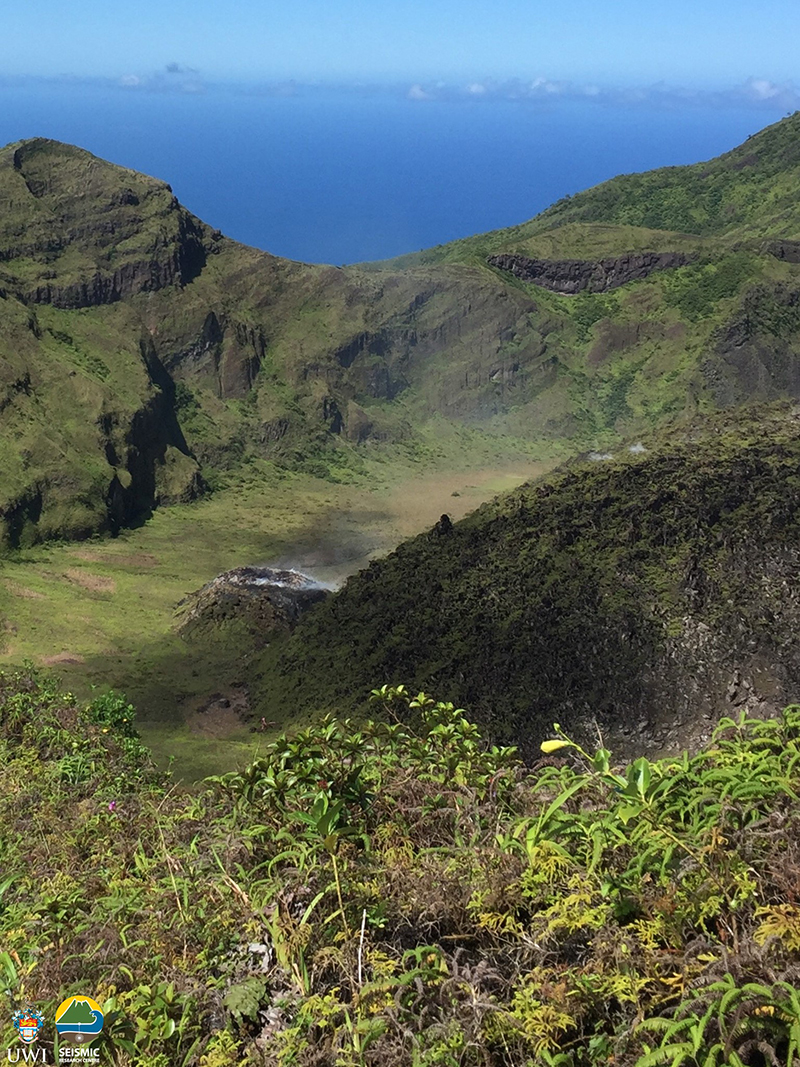 |
Figure 6. Photo of the first documented observation of the new lava dome at Soufrière St. Vincent on 27 December 2020 taken from the E side of the summit. Courtesy of Melanie Grant, IG, UWI-SRC. |
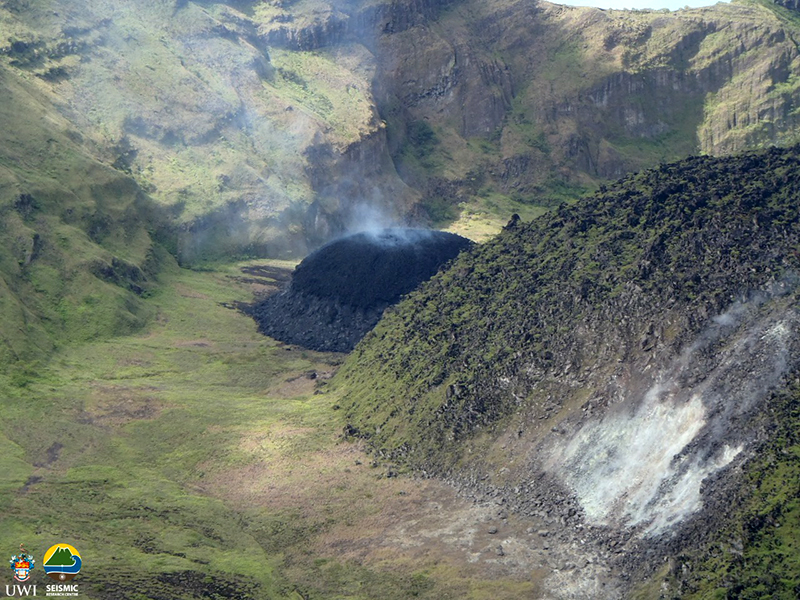 |
Figure 7. Photo of an early observation of the new lava dome at Soufrière St. Vincent on 29 December 2020 growing WSW of the 1979 lava dome on the SW edge of the summit crater, accompanied by gas-and-steam emissions. The dome was estimated to be 60 m high on 30 December. Courtesy of Kemron Alexander (color corrected), SMU, UWI-SRC. |
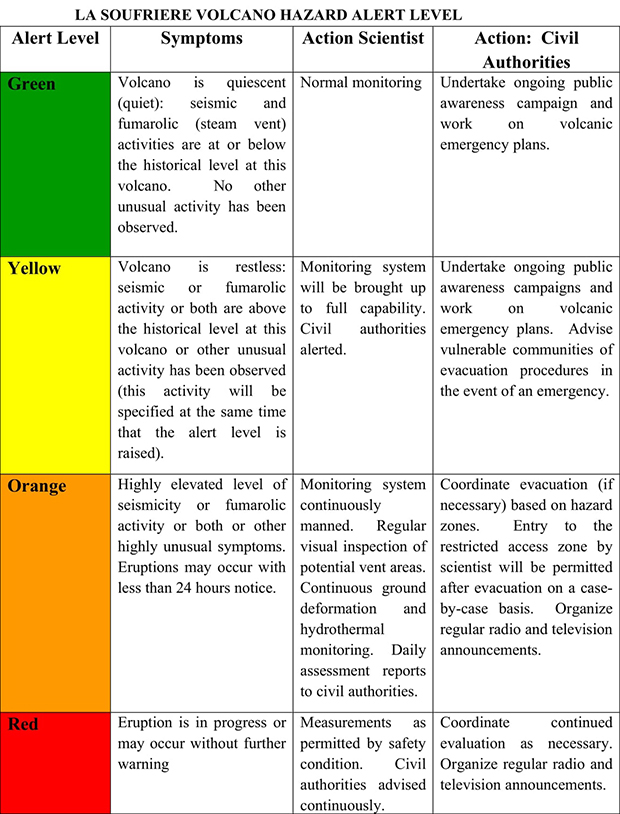 |
Figure 8. Volcanic Hazard Alert Level System for Soufriere St. Vincent. Courtesy of UWI-SRC. |
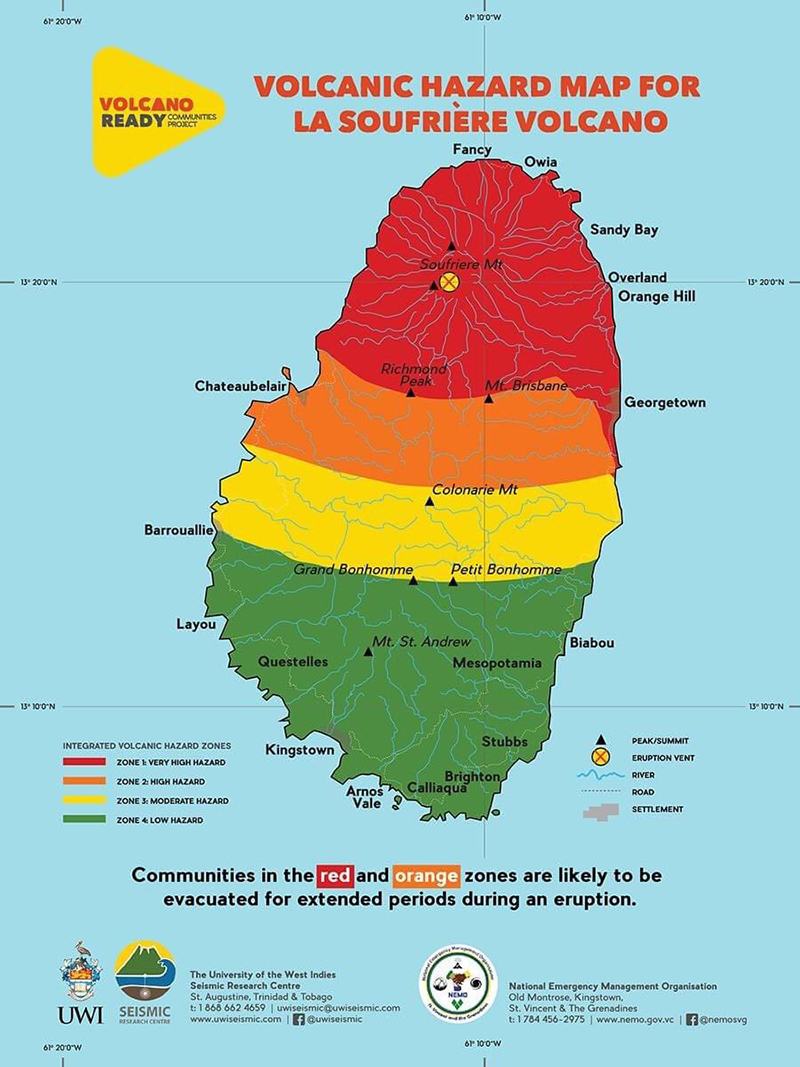 |
Figure 9. Volcanic hazard map for Soufrière St. Vincent, showing different areas that are likely to experience hazardous volcanic events which would require evacuations. The hazard map is divided into four zones: Zone 1 (Red), which is a very high hazard location; Zone 2 (Orange), which is a high hazard location; Zone 3 (Yellow), which is a moderate hazard location; and Zone 4 (Green), which is a low hazard location. This poster was created prior to the current eruption as part of the Volcano Ready Communities Project, a collaboration between NEMO SVG and UWI Seismic Research Centre. Courtesy of UWI-SRC and NEMO. |
Activity during January-February 2021. Observations made during a field visit on 5 January, during a helicopter overflight on 6 January, and based on 9 January drone video noted that the new dome was expanding to the W on the WSW edge of the 1979 lava dome and continued to gradually grow through February 2021 (figure 10). Growth of the 2020/21 lava dome produced small, hot rockfalls and gas-and-steam emissions that were visible from the Belmont Observatory. The gas emissions were most notable from a small depression at the top of the dome. Two seismic stations were installed on the flank of the volcano at Wallibou (SVV) and at the summit (SSVA) on 6 and 18 January, respectively.
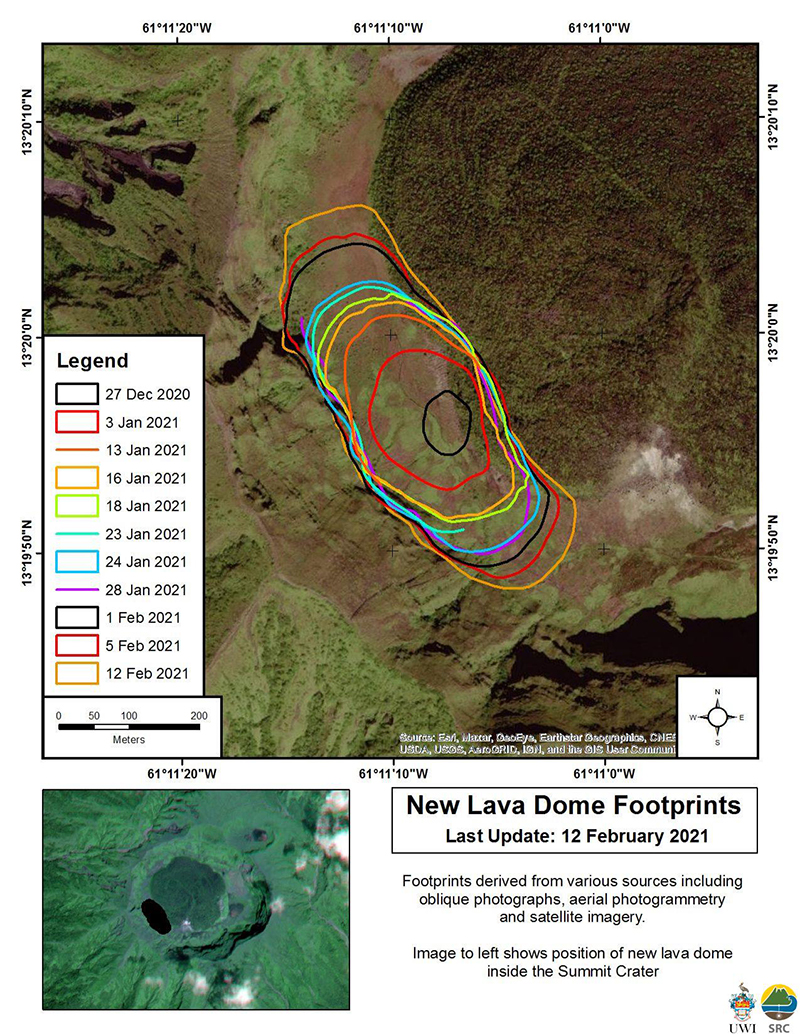 |
Figure 10. Map showing the growth of the new 2020/21 lava dome at Soufrière St. Vincent from 27 December 2020 to 12 February 2021. The dome is located on the SW edge of the crater rim and WSW of the 1979 lava dome that is covered in vegetation. Courtesy of UWI-SRC. |
Seismic stations recorded 573 events through 0730 on 30 January; this number continued to grow into February (up to 703 events by 0830 on 4 February) (figure 5). Observations on 14 January showed that the dome was growing taller and expanding to the E and W. An overflight on 15 January showed extensive vegetation damage on the E, S, and W inner crater walls; damage previously noted on the upper SW crater rim had expanded downslope (figure 11). Scientists visited on 16 January and recorded temperatures of 590°C at the dome surface (figure 12). During 15-17 January residents to the W of the volcano reported nighttime crater incandescence. Persistent gas-and-steam emissions were observed rising above the dome, as well as from the contact between the 2020/21 and 1979 domes during the rest of the month and through February.
 |
Figure 11. Oblique aerial view of the lava dome at Soufrière St. Vincent between the 1979 dome and the SW crater rim on 15 January 2021, accompanied by gas-and-steam emissions. On this day, the dome was 340 m long, 160 m wide, and 80 m high. Courtesy of Adam Stinton, MVO, UWI-SRC. |
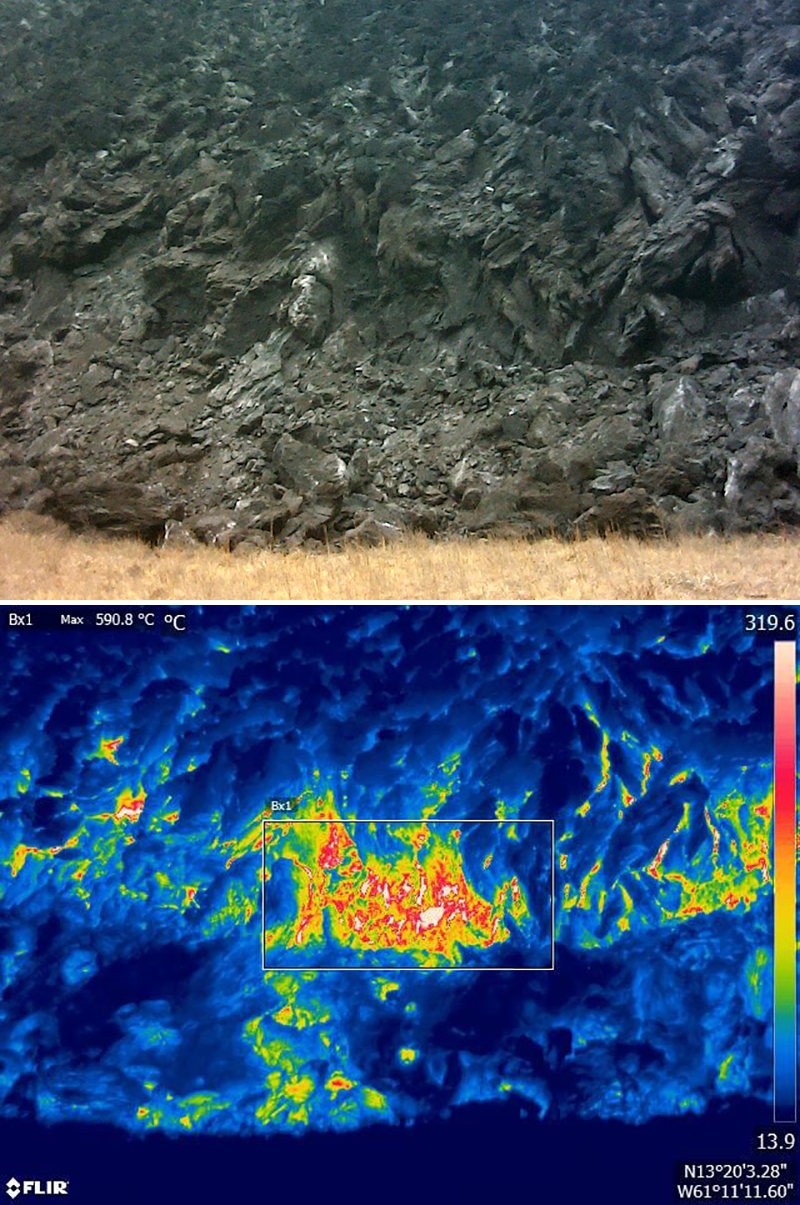 |
Figure 12. Thermal measurements were taken at the base of the freshly extruded lava dome at Soufrière St. Vincent on 16 January 2021. Top: Photo (color corrected) of the base of the new lava dome. Bottom: Thermal FLIR (Forward-Looking InfraRed) image of the base of the new lava dome showing a maximum temperature of 590.8°C. Courtesy of Adam Stinton, MVO, UWI-SRC. |
Sulfur dioxide emissions were first detected on 1 February using a Multi-Gas Instrument and a filter pack; the dome had reached an estimated volume of 5.93 million cubic meters. Vegetation on the NW part of the crater (N of the dome) was damaged, likely due to fire. The dome continued to expand laterally to the N and S, according to reports issued on 6 and 8 February. After that it grew about 15 m to the NW and SE, according to 11 and 15 February reports (figure 13). NEMO reported that the growth rate of the lava dome ranged from 1.9 to 2.13 m3/s (figure 14). Active gas-and-steam emissions originated dominantly at contact areas between the pre-existing 1979 dome and the 2020/21 dome, as well as at the top of the new dome.
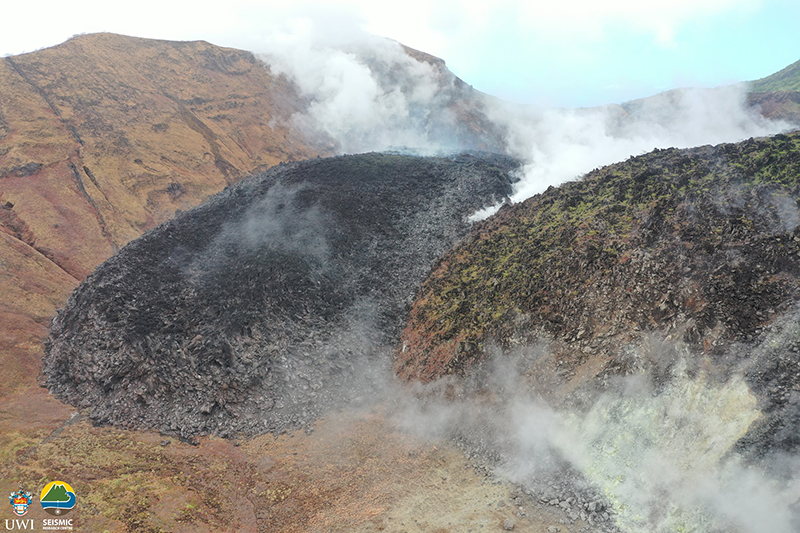 |
Figure 13. Photo of the 2020/21 lava dome (dark mass at left) at Soufrière St. Vincent on 12 February 2021 showing continuous gas-and-steam emissions and damaged vegetation on the 1979 lava dome (right). On this day, the dome was 618 m long, 232 m wide, 90 m high, and an estimated volume of 6.83 million cubic meters. Courtesy of Kemron Alexander, SMU, UWI-SRC. |
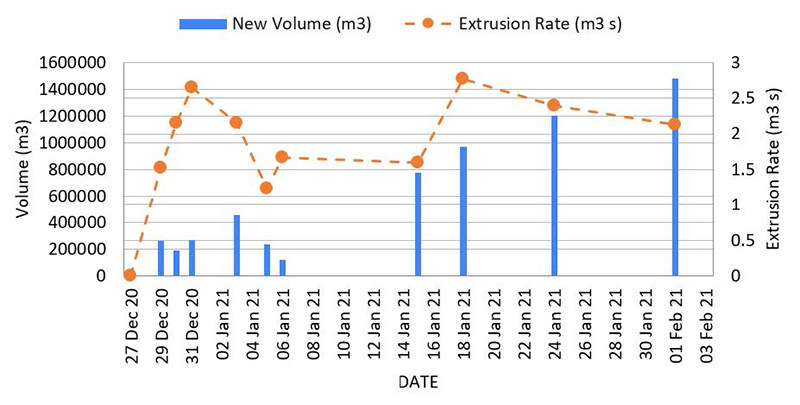 |
Figure 14. Estimated lava extrusion rates and added volume of material at Soufrière St. Vincent’s 2020/21 lava dome during 27 December 2020 through 3 February 2021. Calculations were based on UAV photography and photogrammetry. Data courtesy of UWI-SRC. |
Thermal satellite data. MIROVA (Middle InfraRed Observation of Volcanic Activity) analysis of MODIS satellite data shows the beginning of thermal activity in late December 2020 and continuing at a lower power into early February (figure 15). A single MODVOLC thermal alert was detected on 29 December. This activity marks the beginning of the effusive eruption and the formation of the new lava dome. Sentinel-2 thermal satellite imagery detected a thermal anomaly on the SW side of the main crater during clear weather days in January 2021, which represents the active 2020/21 lava dome (figure 16). Fresh, hot material is also visible surrounding the thermal anomaly, which demonstrates the growth of the lava dome over time.
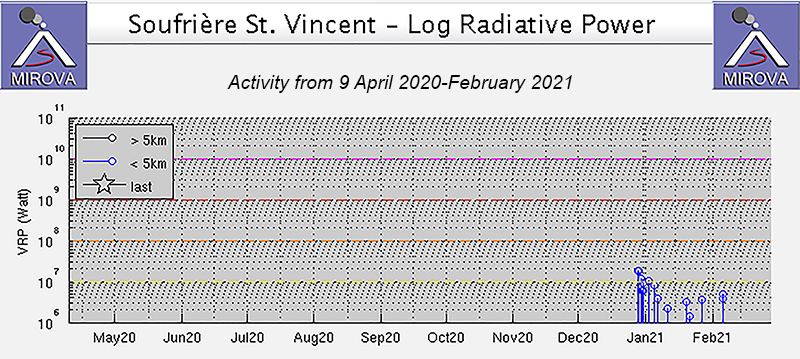 |
Figure 15. Thermal activity at Soufrière St. Vincent was detected beginning in late December 2020 and continued through early February 2021, as reflected in the MIROVA data (Log Radiative Power). The power of the thermal anomalies had slightly decreased after December. Courtesy of MIROVA. |
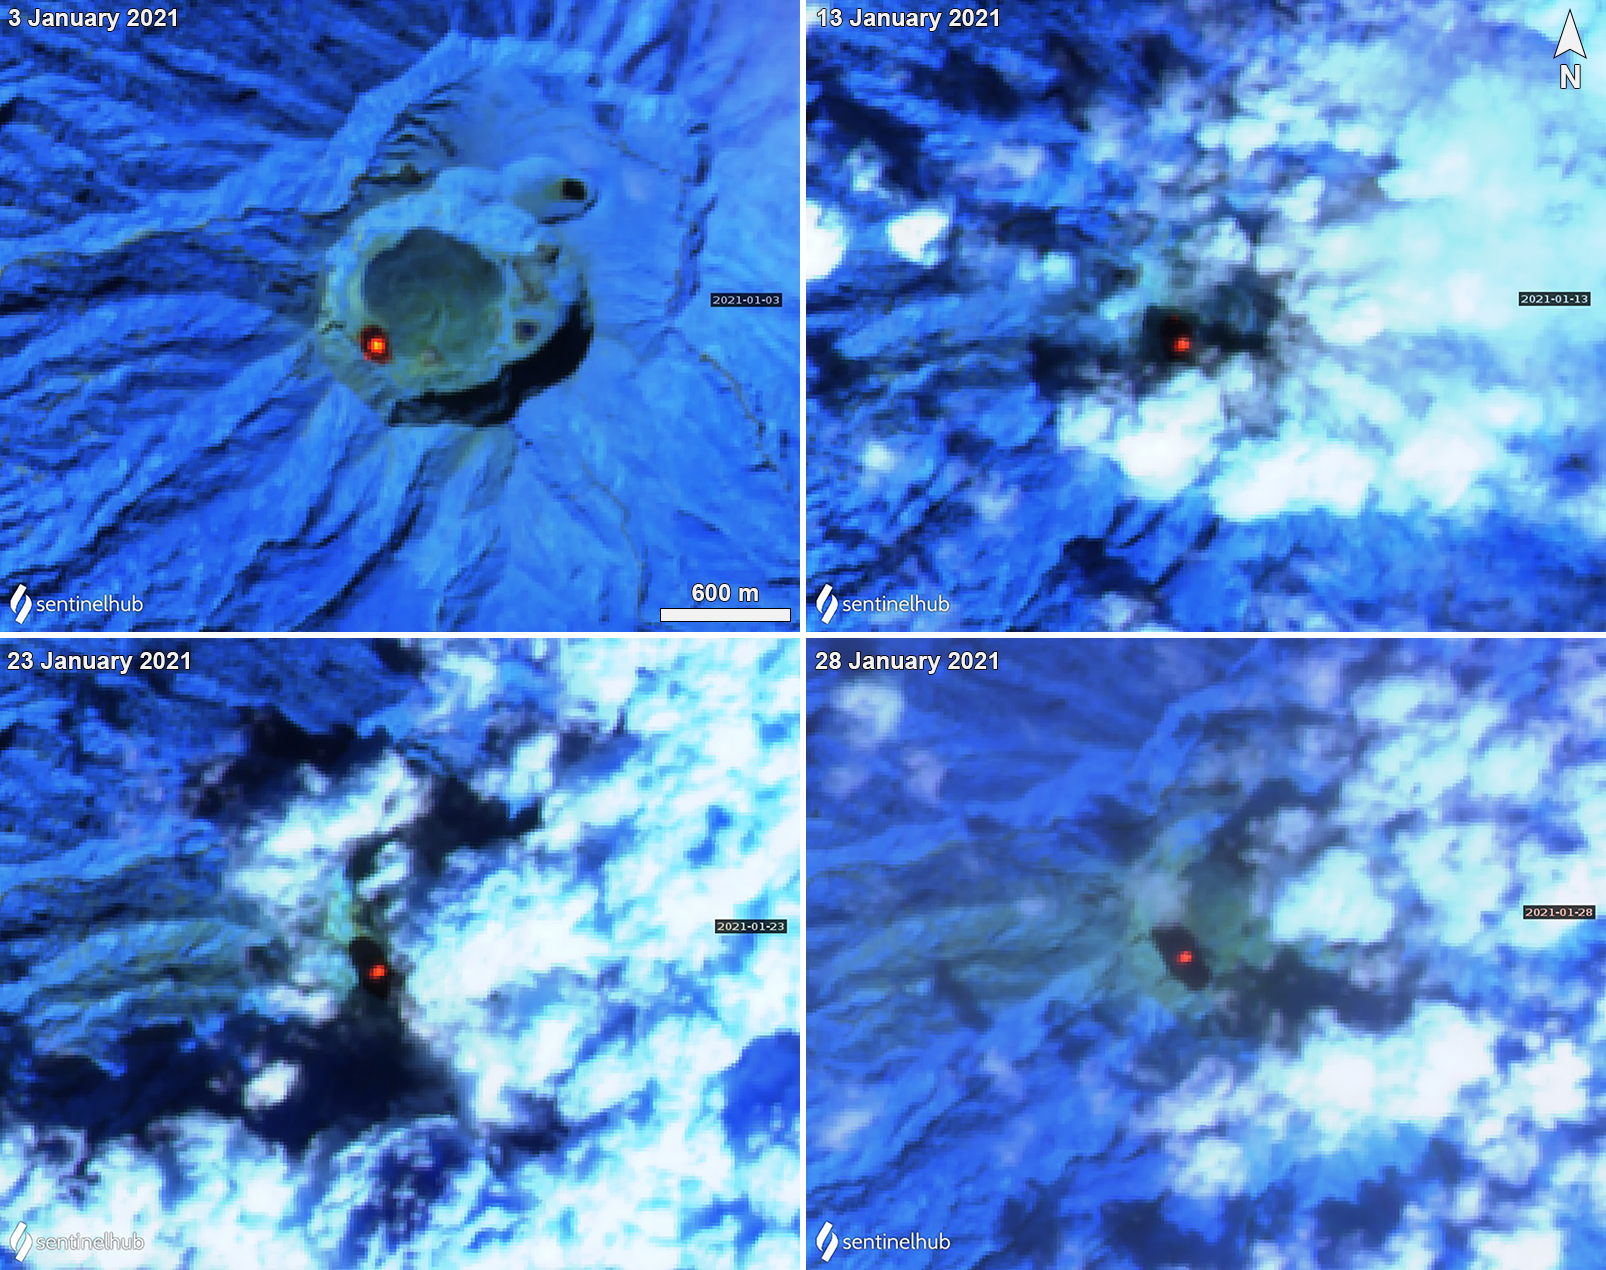 |
Figure 16. Sentinel-2 thermal satellite imagery showing a persistent thermal anomaly (bright yellow-orange) in Soufrière St. Vincent’s growing lava dome on the WSW edge of the main crater during 3 January through 28 January 2021. The dark black color is the freshly cooled material from the effusive activity, which also demonstrates the increasing size of the lava dome. Images using “Atmospheric penetration” rendering (bands 12, 11, 8a). Courtesy of Sentinel Hub Playground. |
Field work during mid-January 2021. SRC collected rock samples from the new lava dome and sent them to scientists from the University of East Anglia, University of Plymouth, and University of Oxford on 16 January 2021 as a collaborative project to analyze their composition and compare them with the composition of rocks erupted in 1902, 1971, and 1979. Analyses showed that the new 2020/21 lava dome was basaltic andesite, similar in composition to the earlier domes (figure 17).
 |
Figure 17. Backscattered electron image of a sample from the 2020/21 lava dome showing groundmass texture. Low-contrast dark gray crystals are feldspar microlites in glass (darkest gray). Some of the larger feldspar crystals have Ca-rich cores (paler gray). Clinopyroxenes also make up the groundmass (brighter gray) and some are breaking down to Fe-oxides (small oxides at edges of clinopyroxene bottom center and bottom right). In some areas dark glass is devitrifying (paler gray irregular shapes within dark gray glassy patches). Fe-Ti oxides are also common (bright white crystals). Total image width is about 0.3 mm. Image and description courtesy of Bridie Davies, UEA. |
References: Cole P D, Robertson R E A, Fedele L, Scarpati C, 2019. Explosive activity of the last 1000 years at La Soufrière, St Vincent, Lesser Antilles. J. Volcanol. Geotherm. Res., 371:86-100.
Shepherd, J. B., Aspinall, W. P., Rowley, K. C., Pereira, J., Sigurdsson, H., Fiske, R. S., Tomblin, J. F., 1979. The eruption of Soufrière volcano, St Vincent April–June 1979. Nature, 282 (5734), 24–28. doi:10.1038/282024a0.
Information Contacts: University of the West Indies Seismic Research Centre (UWI-SRC), University of the West Indies, St. Augustine, Trinidad & Tobago, West Indies (URL: http://www.uwiseismic.com/); National Emergency Management Organisation (NEMO), Government of Saint Vincent and the Grenadines, Biseé, PO. Box 1517, Castries, Saint Lucia, West Indies (URL: http://nemo.gov.lc/); MIROVA (Middle InfraRed Observation of Volcanic Activity), a collaborative project between the Universities of Turin and Florence (Italy) supported by the Centre for Volcanic Risk of the Italian Civil Protection Department (URL: http://www.mirovaweb.it/); Hawai'i Institute of Geophysics and Planetology (HIGP) - MODVOLC Thermal Alerts System, School of Ocean and Earth Science and Technology (SOEST), Univ. of Hawai'i, 2525 Correa Road, Honolulu, HI 96822, USA (URL: http://modis.higp.hawaii.edu/); Sentinel Hub Playground (URL: https://www.sentinel-hub.com/explore/sentinel-playground); Google Earth (URL: https://www.google.com/earth/); Bridie Davies, University of East Anglia, Norwich Research Park, Norwich, Norfolk, NR4 7TJ, UK (URL: https://people.uea.ac.uk/bridie_davies).
Intermittent explosions, ash plumes, seismicity, and a growing lava dome during March-April 2021
Soufrière St. Vincent (also referred to as “La Soufrière”) is the northernmost stratovolcano on St. Vincent Island in the southern part of the Lesser Antilles. The NE rim of the 1.6-km-wide summit crater is cut by a crater (500 m wide and 60 m deep) that formed in 1812. Recorded eruptions date back to 1718, with notable eruptions occurring in 1812, 1902, and 1979. An eruption that began on 27 December 2020 was characterized by increased seismicity, the growth of a new lava dome on the SW edge of the main crater, crater incandescence, and gas-and-steam emissions (BGVN 46:03). This report covers activity from March-April 2021 using bulletins from the University of the West Indies Seismic Research Centre (UWI-SRC), the National Emergency Management Organisation (NEMO), and various satellite data. Soufrière St. Vincent is monitored by the SRC assisted by the Soufrière Monitoring Unit (SMU) from the Ministry of Agriculture in Kingstown.
As of 2004, the monitoring network had consisted of five seismic stations, eight GPS stations, and several dry tilt sites. Seismic data are transmitted from field sites to the Belmont Observatory (9 km SSW), which is operated by the SMU. On 1 March a new seismic station installed at the National Parks Interpretation Center at Bamboo Range on the E side of the volcano became operational. Additionally, a new GPS monitoring station was placed in Fancy. Two more GPS stations were installed at Jacob’s Well and Table Rock on 19 March.
Activity during March 2021. The lava dome in the main crater continued to grow during March, expanding to the N, NW, S, and SE. Gas emissions persisted in the summit area from the top of the dome and along the contact area between the pre-existing 1979 dome and the 2020-21 dome, damaging vegetation on the SW side of the volcano. A team visited the dome on 19 and 23 March to make observations, take measurements, and maintain monitoring equipment. On 19 March the dome was 105 m tall, 921 m long, and 243 m wide, with an estimated volume of 13.13 million cubic meters, based on drone surveys (figure 18). Compared to the previous drone survey on 12 February, the dome had grown roughly 6.3 million cubic meters. On 23 March at 1030 the seismic network recorded a swarm of small low-frequency events that lasted about 45 minutes, possibly associated with magma movement beneath the dome. Starting at 1653 the network also detected volcano-tectonic (VT) earthquakes, some of which had been felt in communities, including Fancy, Owia, and Sandy Bay. By 26 March the period of elevated VT earthquakes had ended; only small, low-frequency events associated with lava dome growth were recorded.
|
Figure 18. Map (left) showing the growth of the new lava dome at Soufrière St. Vincent from 27 December 2020 to 19 March 2021. The dome is located on the SW edge of the crater rim and WSW of the 1979 lava dome that is covered in vegetation. Photo (right) of the laterally growing lava dome (dark mass at left) taken on 19 March 2021. White gas-and-steam emissions are visible along the contact area with the 1979 dome (right), as well as damaged vegetation. Courtesy of SMU, UWI-SRC, and NEMO SVG. |
Activity during April 2021. The lava dome continued to grow to the N and S during April, accompanied by small earthquakes and gas-and-steam emissions rising both from the top of the dome and along the contact with the pre-existing 1979 dome. A new swarm of VT earthquakes was detected on 5 April at 0638, the number and magnitude continued to increase until 0830, after which they stabilized. These earthquakes were more intense and averaged 50/hour; the 23-25 March swarm averaged 1.5/hour. The largest event was registered as a Mw 3.5 at 0920 and was felt by local residents. At 1400 the rate of the earthquakes started to decline and then significantly dropped at 1600, though small VT events continued through 1800. Small earthquakes associated with dome growth were recorded on 7 April.
On 8 April UWI-SRC reported an increase in the volume of white gas-and-steam emissions rising from the summit crater and at 0300 scientists at the Belmont Observatory reported episodes of tremor that indicated the movement of magma and fluids near the surface. Subsequent tremor episodes at 0530, 0800, 1015, and 1300 showed increasing magnitude. Five long-period (LP) earthquakes and two brief swarms of VT events were detected between the tremor episodes; ash venting was also observed during the last episode. Sulfur dioxide emissions were also identified in satellite data. Visual observations from the Belmont Observatory during the early evening showed that the dome height had increased significantly during the day, and incandescent material over the vent area was visible in webcam images (figure 19). As a result, the Volcanic Alert Level (VAL) was raised to Red (the highest level on a four-color scale) at 1830 and the Prime Minister issued an evacuation order for communities in the Red Zone at the N end of the island, affecting 16,000-20,000 people.
|
Figure 19. Webcam image of incandescent material in the summit crater of Soufrière St. Vincent on 8 April 2021, accompanied by white gas-and-steam emissions. Courtesy of UWI-SRC. |
On 9 April at 0840 scientists at the Belmont Observatory reported an explosion that generated an ash plume up to 8 km altitude that drifted mainly ENE (figure 20). Ash was deposited across the island, affecting communities including Chateaubelair, Petite Bordel, the Belmont Observatory, and areas at the S end of the island; it also forced the Argyle International Airport (20 km S) to close (figure 21). NEMO stated that evacuations in the Orange and Red Zones were affected by significant ashfall and poor visibility, but by the evening most residents had been evacuated. Seismicity increased at 1130, including an earthquake swarm lasting until 1440, though tremor continued to be reported. A second explosion at 1445 produced a vigorous ash plume that initially rose to 4 km altitude with lightning visible in the plume (figure 22). Successive explosions and ash pulses fed the plume for hours, rising to 16 km altitude. A third explosive series began at 1835 (figure 23). Ash venting continued through the night and into 10 April. Periods of banded tremor associated with explosive activity and stronger pulses of ash emissions to higher altitudes began at 0330 on 10 April, lasting for periods of 20-30 minutes with 1-3 hour gaps. The resulting ash plumes rose to 10.6-16 km altitude throughout the day. The Washington VAAC stated that ash plumes during 9-10 April had drifted as far as 1,200 km ESE and about 3,000 km ENE. The Grantley Adams International Airport (GAIA) in Barbados also closed.
|
Figure 20. Photo of the first ash plume from Soufrière St. Vincent on 9 April 2021 that rose to 8 km altitude and drifted ENE at 0840. Courtesy of UWI-SRC. |
|
Figure 21. Photo showing ashfall in Chateaubelair during the eruption of Soufrière St. Vincent on 9 April 2021. Courtesy of Thomas Christopher, MVO, UWI-SRC. |
|
Figure 22. Photo of the second ash plume from Soufrière St. Vincent on 9 April 2021 that rose to 4 km altitude at 1445. Courtesy of UWI-SRC. |
|
Figure 23. Photo of the third explosive eruption and its resulting ash plume from Soufrière St. Vincent on 9 April 2021 at 1835. Photo has been color corrected. Courtesy of UWI-SRC. |
Ashfall continued to be widespread on 10 April; deposit thickness varied from less than 1 mm in Colonaire (12.5 km SSE) to 10-15 mm in Rabacca (7.4 km SSE). Analysis of satellite imagery by UWI-SRC indicated that the explosions that began on 9 April destroyed the pre-existing 1979 and 2020-21 lava domes and created a crater 800 m in diameter. During the night of 10-11 April tremor lasting up to 20 minutes continued at intervals of 1.5-3 hours, associated with periods of explosions and ash emissions. Ashfall was observed in most areas of the St. Vincent Island, as well as on neighboring islands of the Grenadines (SSW), Barbados (165 km E), and Saint Lucia (50 km NNE). Explosions early on 11 April were followed by widespread power and water outages on the island, as reported by NEMO, and some houses had collapsed due to significant ashfall (figure 24). Around midday, the time between episodes of high-amplitude tremor lengthened from 1.5-4 hours to 5-8 hours, which continued to coincide with explosions and ash emissions. Small VT earthquakes were recorded around 1800. The VAAC reported that ash plumes rose to 12.2-16 km altitude throughout the day and continued to drift long distances to the ENE, E, and SE. On 12 April at 0415 a large explosion produced an ash plume that rose to 12.8 km altitude. The plume collapsed, generating pyroclastic flows that descended several valleys on S and W flanks, reaching the coast at Morne Ronde (4.3 km W), Larikai (3.5 km WNW), and Trois Loupes Bay (3.5 km NW) (figure 25). Extensive damage to vegetation was noted along the W coast, extending from Larikai Bay to Turner Bay. High-amplitude tremor episodes had stopped, but two low-amplitude and one high-amplitude episodes were recorded during 0600-1700. Explosivity or notable ash venting coincided with the episodes.
|
Figure 24. Photo of collapsed structures due to the thick ash deposits from the explosions in early April 2021 at Soufrière St. Vincent. Courtesy of UWI-SRC. |
|
Figure 25. Image of Soufrière St. Vincent taken from the Sentinel-1 satellite on 11 April 2021 showing the changes of the summit crater with a possible smaller vent in the new crater. The darker black areas to the W of the summit are pyroclastic flow deposits from earlier explosive events. Courtesy of Adam Stinton, MVO, UWI-SRC. |
A series of Vulcanian explosions that began at 0630 on 13 April, and lasted about 30 minutes, was accompanied by large seismic tremors followed by more than three hours of smaller continuous tremors (figure 26). The VAAC stated that a dense ash plume rose to 11 km altitude and drifted E, SE, N, and NE (figure 27). Resulting pyroclastic flows traveled about 6 km WSW. Observations made during the afternoon indicated that pyroclastic flows had reached the ocean in every valley extending from Larikai to Wallibou, a length of about 5 km. The Washington VAAC reported a new ash emission rising to 7.6 km altitude at 1850 that was associated with a thermal anomaly. Another explosion at 2030 pulsed for more than 40 minutes and produced pyroclastic flows that traveled toward the Rabacca River on the E coast of the island. Lahar deposits were reported in the Sandy Bay area. Another large explosion was detected at 2300, according to UWI-SRC. The Montserrat Volcano Observatory stated that a sulfur odor and minor ashfall from Soufrière St. Vincent was observed on their island (390 km NNW).
|
Figure 26. Plot summarizing the seismic data at Soufrière St. Vincent during 8-21 April 2021. The top panel shows the Real-Time Seismic Amplitude Measurement (RSAM) data from seismic stations SSVA and SVV. The SSVA data shows the banded tremor that started on 8 April and the continuous tremor prior to the first explosion. The red triangles represent the time of explosions, based on satellite imagery that was analyzed by scientists at the University of East Anglia. Data transmission from SSVA stopped when it was likely destroyed by an explosion. The SVV data shows the high-amplitude tremor generated during a series of explosions. The bottom two panels show the number of volcano-tectonic (VT) and long-period (LP) earthquakes detected by the seismic network. The number and intensity of LP earthquakes have increased since late 11 April. Courtesy of Roderick Stewart, MVO, UWI-SRC. |
|
Figure 27. Photo of a strong ash plume rising above Soufrière St. Vincent on 13 April 2021. Courtesy of Thomas Christopher, MVO, UWI-SRC. |
During 14 April seismicity continued to be characterized by episodes of tremor about 13-15 hours apart, separated by swarms of small LP earthquakes. At 1135 a band of seismic tremor, associated with an explosion, was recorded, though the emissions were gas-rich and less energetic. Another episode of tremor began at 0230 on 15 April, as well as increased ash venting. The seismic network recorded a near-constant swarm of LP and hybrid earthquakes throughout the day with three brief episodes of low-level tremor each lasting less than 30 minutes. Tremor starting at 2100 lasted about 40 minutes and may have been associated with a minor increase in venting. Sulfur dioxide emissions were successfully measured by ground-based instruments; scientists on a Coast Guard boat along the W coast recorded 809 tons/day.
Periods of tremor and near-constant LP and hybrid earthquake swarms continued on 16 April. One tremor episode on 16 April at 0615 that lasted about three minutes was accompanied by an explosion, followed by more than two hours of low-level tremor. The resulting ash plumes rose to 8 km altitude and drifted W. Sulfur dioxide measurements showed an average of 460 tons/day; some SO2 plumes were reported to have reached India.
Satellite images showed a series of changes to the newly formed crater in the SW part of the crater (figure 28). Updated measurements were taken of the new crater, by 17 April according to an Institut de Physique du Globe de Paris scientist. It was approximately 900 m N to S, 750 m E to W, and at least 100 m deep, based on RADAR data (figure 29). Several vents were identified or inferred by emissions points of gas-and-steam and ash plumes. During 17 and 18 April the average SO2 flux was 232 and 391 tons/day, respectively.
|
Figure 28. New crater features were visible at the Soufrière St. Vincent summit in a 15 April 2021 satellite image from Planet Labs. Continued explosions created a new crater (red line) in the SW part of the larger summit crater that was approximately 900 m N-S, at least 750 m E-W, and 100 m deep. The orange patterned section represents tephra deposits. The yellow line outlines the 2020-21 lava dome. Several vents were established, based on gas-and-steam and ash plumes; only one could be seen clearly (black outline). Courtesy of UWI-SRC. |
|
Figure 29. Satellite radar image from Capella Space acquired on 14 April 2021 showed the changes of the Soufrière St. Vincent summit crater following numerous explosions. The large depression in the middle of the image used to contain the 1979 and 2020-21 lava domes; explosions that began on 9 April destroyed both, leaving a smaller crater about 800 m in diameter. The base of the crater is distorted due to the presence of ash in the atmosphere and the ongoing eruption. North in the image is to the upper left corner. Courtesy of Adam Stinton, MVO, UWI-SRC. |
A period of tremor at 1649 on 18 April was accompanied by an explosion that sent an ash plume to 8 km altitude and drifted S and SW (figure 30). This was the 30th distinct explosion since the explosive phase began. The period of tremor lasted until about 2100 and was followed by ongoing small VT, LP, and hybrid earthquakes. The rate of these events decreased by 0100 on 19 April. A single rockfall event was detected at 0139, possibly due to the growing lava dome, though there was no visual confirmation. Few, but intermittent, rockfall events, VT earthquakes, and an increasing number of small LP and hybrid earthquakes were detected through 21 April (see figure 26). The seismic station at Bamboo Range recorded a lahar on 20 April at 0400 which lasted about 30 minutes and may have descended a SE-flank valley. SO2 measurements taken near the W coast showed an average flux of 350 tons/day. NEMO reported that 12,775 people were displaced by 19 April, with 6,208 people in 85 public shelters and 6,567 people (1,800 families) in private shelters.
|
Figure 30. Photo of ash plumes rising above Soufrière St. Vincent and drifted S and SW on 18 April 2021. Photo has been color corrected. Courtesy of Thomas Christopher, MVO, UWI-SRC. |
On 22 April at 1108 explosions generated an ash plume that rose to 8 km altitude and drifted mainly N over the ocean (figure 31). A high-level seismic tremor was also detected at 1109 that lasted for 20 minutes. During the initial stages of the explosion a pyroclastic flow was observed traveling down the W flank, reaching an average speed of 33 km/hour. Around 2100 the seismic network recorded multiple lahars, though their location could not be determined. According to data from NEMO, 13,154 people had been displaced by 21 April, with 6,208 people in 85 public shelters and 6,790 people (1,618 families) in private shelters.
|
Figure 31. Photo of an ash plume rising to 8 km altitude above Soufrière St. Vincent at 1108 on 22 April 2021. Courtesy of Richard Robertson, UWI-SRC. |
Seismicity dropped to low levels after the explosion on 22 April and remained low through 27 April; only a few VT, LP, and hybrid earthquakes were recorded. The average SO2 flux was 992 tons/day on 23 April, again recorded from the W coast. Satellite radar imagery acquired on 24 April indicated possible growth at the lava dome following the explosions on 18 and 22 April. During an overflight on 26 April scientists observed white gas-and-steam emissions from several locations along the crater floor, though visibility was poor. No lava dome was visible, but a possible spine-like protrusion was seen through the clouds. Lahars in the Red and Orange zones were recorded by the seismic network at 0900 and 1000 on 27 April, during and after rainfall. Multiple lahars continued to be recorded by the seismic network within all drainages during 28-30 April due to heavy rainfall (figure 32). Trees brought down by lahars reached the ocean, where the floating logs created a hazard for small boats along the coastline. SO2 measurements taken from a boat on the W coast yielded a flux of 1,036 tons/day. On 6 May the Volcanic Alert Level was lowered to Orange (the second highest on a four-color scale) because no explosions had been recorded since 22 April and the number of volcanic earthquakes had decreased significantly.
|
Figure 32. Photo of lahars in the Wallibou River near Soufrière St. Vincent on the morning of 29 April 2021 due to heavy rainfall. Courtesy of UWI-SRC. |
Additional satellite data. Daily satellite-based sulfur dioxide measurements were notable beginning on 9 April. The initial explosion at 0840 showed relatively minor SO2 emissions, though as the day progressed stronger plumes drifted E over the Atlantic Ocean (figure 33). As strong explosive activity continued at Soufrière St. Vincent, strong SO2 plumes exceeding 2 Dobson Units (DUs) were detected during 9-14 April, moving generally E, based on data from the TROPOMI instrument on the Sentinel-5P satellite.
|
Figure 33. Strong and distinct SO2 plumes from Soufrière St. Vincent were detected by the TROPOMI instrument on the Sentinel-5P satellite during 9-14 April 2021 on days with strong explosive activity and ash venting. The plumes generally drifted E over the Atlantic Ocean. Courtesy of NASA Global Sulfur Dioxide Monitoring Page. |
MIROVA (Middle InfraRed Observation of Volcanic Activity) analysis of MODIS satellite data detected a single thermal anomaly during mid-March 2021, followed by a brief break in activity (figure 34). Thermal activity resumed in April, occurring in three distinct clusters of moderate-power anomalies throughout the month. Two thermal hotspots were detected using the MODVOLC thermal algorithm on 24 April. Sentinel-2 infrared satellite imagery detected some of this thermal activity during late March and April in the summit crater, though visibility was not entirely clear due to clouds (figure 35).
|
Figure 34. A single thermal anomaly at Soufrière St. Vincent was detected during mid-March 2021. Thermal activity resumed in early April, occurring in three distinct clusters of moderate-power anomalies, as reflected in the MIROVA data (Log Radiative Power). Courtesy of MIROVA. |
|
Figure 35. Sentinel-2 infrared satellite imagery showing a faint thermal anomaly (orange) in the summit crater of Soufrière St. Vincent on 24 March (top left), 3 April (top right), 8 April (bottom left), and 23 April (bottom right) 2021, though clouds covered most of the crater. Images using “Atmospheric penetration” rendering (bands 12, 11, 8a). Courtesy of Sentinel Hub Playground. |
Information Contacts: University of the West Indies Seismic Research Centre (UWI-SRC), University of the West Indies, St. Augustine, Trinidad & Tobago, West Indies (URL: http://www.uwiseismic.com/); National Emergency Management Organisation (NEMO), Government of Saint Vincent and the Grenadines, Biseé, PO. Box 1517, Castries, Saint Lucia, West Indies (URL: http://nemo.gov.lc/); Washington Volcanic Ash Advisory Center (VAAC), Satellite Analysis Branch (SAB), NOAA/NESDIS OSPO, NOAA Science Center Room 401, 5200 Auth Rd, Camp Springs, MD 20746, USA (URL: www.ospo.noaa.gov/Products/atmosphere/vaac, archive at: http://www.ssd.noaa.gov/VAAC/archive.html); Hawai'i Institute of Geophysics and Planetology (HIGP) - MODVOLC Thermal Alerts System, School of Ocean and Earth Science and Technology (SOEST), Univ. of Hawai'i, 2525 Correa Road, Honolulu, HI 96822, USA (URL: http://modis.higp.hawaii.edu/); NASA Global Sulfur Dioxide Monitoring Page, Atmospheric Chemistry and Dynamics Laboratory, NASA Goddard Space Flight Center (NASA/GSFC), 8800 Greenbelt Road, Goddard, Maryland, USA (URL: https://so2.gsfc.nasa.gov/); MIROVA (Middle InfraRed Observation of Volcanic Activity), a collaborative project between the Universities of Turin and Florence (Italy) supported by the Centre for Volcanic Risk of the Italian Civil Protection Department (URL: http://www.mirovaweb.it/); Sentinel Hub Playground (URL: https://www.sentinel-hub.com/explore/sentinel-playground); Jenni Barclay, University of East Anglia, Norwich Research Park, Norwich, Norfolk, NR4 7TJ, UK (URL: https://research-portal.uea.ac.uk/en/persons/jenni-barclay); Ian Renfrew, University of East Anglia, Norwich Research Park, Norwich, Norfolk, NR4 7TJ, UK (URL: https://research-portal.uea.ac.uk/en/persons/ian-renfrew).
|
|
||||||||||||||||||||||||||
There is data available for 22 confirmed Holocene eruptive periods.
2020 Dec 27 - 2021 Apr 22 Confirmed Eruption (Explosive / Effusive) VEI: 4
| Episode 1 | Eruption (Explosive / Effusive) | |||||||||||||||
|---|---|---|---|---|---|---|---|---|---|---|---|---|---|---|---|
| 2020 Dec 27 - 2021 Apr 22 | Evidence from Observations: Reported | ||||||||||||||
|
List of 1 Events for Episode 1
|
|||||||||||||||
1979 Apr 13 - 1979 Oct 26 ± 5 days Confirmed Eruption (Explosive / Effusive) VEI: 3
| Episode 1 | Eruption (Explosive / Effusive) | ||||||||||||||||||||||||||||||||||||||||||||||||||||||||||||||||||||||||||||||||
|---|---|---|---|---|---|---|---|---|---|---|---|---|---|---|---|---|---|---|---|---|---|---|---|---|---|---|---|---|---|---|---|---|---|---|---|---|---|---|---|---|---|---|---|---|---|---|---|---|---|---|---|---|---|---|---|---|---|---|---|---|---|---|---|---|---|---|---|---|---|---|---|---|---|---|---|---|---|---|---|---|
| 1979 Apr 13 - 1979 Oct 26 ± 5 days | Evidence from Observations: Reported | |||||||||||||||||||||||||||||||||||||||||||||||||||||||||||||||||||||||||||||||
|
List of 14 Events for Episode 1
|
||||||||||||||||||||||||||||||||||||||||||||||||||||||||||||||||||||||||||||||||
1971 Oct 4 ± 6 days - 1972 Mar 20 Confirmed Eruption (Explosive / Effusive) VEI: 0
| Episode 1 | Eruption (Explosive / Effusive) | ||||||||||||||||||||||||||||||
|---|---|---|---|---|---|---|---|---|---|---|---|---|---|---|---|---|---|---|---|---|---|---|---|---|---|---|---|---|---|---|
| 1971 Oct 4 ± 6 days - 1972 Mar 20 | Evidence from Observations: Reported | |||||||||||||||||||||||||||||
|
List of 4 Events for Episode 1
|
||||||||||||||||||||||||||||||
1902 May 6 - 1903 Mar 30 Confirmed Eruption (Explosive / Effusive) VEI: 4 (?)
| Episode 1 | Eruption (Explosive / Effusive) | |||||||||||||||||||||||||||||||||||||||||||||||||||||||||||||||||||||||||||||||||||||
|---|---|---|---|---|---|---|---|---|---|---|---|---|---|---|---|---|---|---|---|---|---|---|---|---|---|---|---|---|---|---|---|---|---|---|---|---|---|---|---|---|---|---|---|---|---|---|---|---|---|---|---|---|---|---|---|---|---|---|---|---|---|---|---|---|---|---|---|---|---|---|---|---|---|---|---|---|---|---|---|---|---|---|---|---|---|
| 1902 May 6 - 1903 Mar 30 | Evidence from Observations: Reported | ||||||||||||||||||||||||||||||||||||||||||||||||||||||||||||||||||||||||||||||||||||
|
List of 15 Events for Episode 1
|
|||||||||||||||||||||||||||||||||||||||||||||||||||||||||||||||||||||||||||||||||||||
[ 1880 ] Uncertain Eruption
| Episode 1 | Eruption (Explosive / Effusive) | ||||||||||||||||||||
|---|---|---|---|---|---|---|---|---|---|---|---|---|---|---|---|---|---|---|---|---|
| 1880 - Unknown | Evidence from Unknown | |||||||||||||||||||
|
List of 2 Events for Episode 1
|
||||||||||||||||||||
1814 Jan 9 - 1814 Jan 9 Confirmed Eruption (Explosive / Effusive) VEI: 1 (?)
| Episode 1 | Eruption (Explosive / Effusive) | |||||||||||||||||||||||||||||||||||
|---|---|---|---|---|---|---|---|---|---|---|---|---|---|---|---|---|---|---|---|---|---|---|---|---|---|---|---|---|---|---|---|---|---|---|---|
| 1814 Jan 9 - 1814 Jan 9 | Evidence from Observations: Reported | ||||||||||||||||||||||||||||||||||
|
List of 5 Events for Episode 1
|
|||||||||||||||||||||||||||||||||||
1812 Apr 27 - 1812 Jun 9 (?) Confirmed Eruption (Explosive / Effusive) VEI: 4
| Episode 1 | Eruption (Explosive / Effusive) | Old summit crater & new NE rim crater | |||||||||||||||||||||||||||||||||||||||||||||||||||||||||||||||||||||
|---|---|---|---|---|---|---|---|---|---|---|---|---|---|---|---|---|---|---|---|---|---|---|---|---|---|---|---|---|---|---|---|---|---|---|---|---|---|---|---|---|---|---|---|---|---|---|---|---|---|---|---|---|---|---|---|---|---|---|---|---|---|---|---|---|---|---|---|---|---|---|
| 1812 Apr 27 - 1812 Jun 9 (?) | Evidence from Observations: Reported | |||||||||||||||||||||||||||||||||||||||||||||||||||||||||||||||||||||
|
List of 12 Events for Episode 1 at Old summit crater & new NE rim crater
|
||||||||||||||||||||||||||||||||||||||||||||||||||||||||||||||||||||||
1784 Mar (on or before) Confirmed Eruption (Explosive / Effusive) VEI: 0
| Episode 1 | Eruption (Explosive / Effusive) | |||||||||||||||||||||||||
|---|---|---|---|---|---|---|---|---|---|---|---|---|---|---|---|---|---|---|---|---|---|---|---|---|---|
| 1784 Mar (on or before) - Unknown | Evidence from Observations: Reported | ||||||||||||||||||||||||
|
List of 3 Events for Episode 1
|
|||||||||||||||||||||||||
1718 Mar 26 (?) - 1718 Mar 29 Confirmed Eruption (Explosive / Effusive) VEI: 3 (?)
| Episode 1 | Eruption (Explosive / Effusive) | |||||||||||||||||||||||||||||||||||||||||||||
|---|---|---|---|---|---|---|---|---|---|---|---|---|---|---|---|---|---|---|---|---|---|---|---|---|---|---|---|---|---|---|---|---|---|---|---|---|---|---|---|---|---|---|---|---|---|
| 1718 Mar 26 (?) - 1718 Mar 29 | Evidence from Observations: Reported | ||||||||||||||||||||||||||||||||||||||||||||
|
List of 7 Events for Episode 1
|
|||||||||||||||||||||||||||||||||||||||||||||
1640 ± 50 years Confirmed Eruption (Explosive / Effusive)
| Episode 1 | Eruption (Explosive / Effusive) | ||||||||||||||||||||||||||||||
|---|---|---|---|---|---|---|---|---|---|---|---|---|---|---|---|---|---|---|---|---|---|---|---|---|---|---|---|---|---|---|
| 1640 ± 50 years - Unknown | Evidence from Isotopic: 14C (uncalibrated) | |||||||||||||||||||||||||||||
|
List of 4 Events for Episode 1
|
||||||||||||||||||||||||||||||
1550 ± 50 years Confirmed Eruption (Explosive / Effusive)
| Episode 1 | Eruption (Explosive / Effusive) | ||||||||||||||||||||||||||||||
|---|---|---|---|---|---|---|---|---|---|---|---|---|---|---|---|---|---|---|---|---|---|---|---|---|---|---|---|---|---|---|
| 1550 ± 50 years - Unknown | Evidence from Isotopic: 14C (uncalibrated) | |||||||||||||||||||||||||||||
|
List of 4 Events for Episode 1
|
||||||||||||||||||||||||||||||
1480 ± 150 years Confirmed Eruption (Explosive / Effusive)
| Episode 1 | Eruption (Explosive / Effusive) | ||||||||||||||||||||||||||||||
|---|---|---|---|---|---|---|---|---|---|---|---|---|---|---|---|---|---|---|---|---|---|---|---|---|---|---|---|---|---|---|
| 1480 ± 150 years - Unknown | Evidence from Isotopic: 14C (uncalibrated) | |||||||||||||||||||||||||||||
|
List of 4 Events for Episode 1
|
||||||||||||||||||||||||||||||
1395 ± 75 years Confirmed Eruption (Explosive / Effusive)
| Episode 1 | Eruption (Explosive / Effusive) | ||||||||||||||||||||||||||||||
|---|---|---|---|---|---|---|---|---|---|---|---|---|---|---|---|---|---|---|---|---|---|---|---|---|---|---|---|---|---|---|
| 1395 ± 75 years - Unknown | Evidence from Isotopic: 14C (uncalibrated) | |||||||||||||||||||||||||||||
|
List of 4 Events for Episode 1
|
||||||||||||||||||||||||||||||
1325 ± 75 years Confirmed Eruption (Explosive / Effusive)
| Episode 1 | Eruption (Explosive / Effusive) | ||||||||||||||||||||||||||||||
|---|---|---|---|---|---|---|---|---|---|---|---|---|---|---|---|---|---|---|---|---|---|---|---|---|---|---|---|---|---|---|
| 1325 ± 75 years - Unknown | Evidence from Isotopic: 14C (uncalibrated) | |||||||||||||||||||||||||||||
|
List of 4 Events for Episode 1
|
||||||||||||||||||||||||||||||
0905 ± 75 years Confirmed Eruption (Explosive / Effusive)
| Episode 1 | Eruption (Explosive / Effusive) | ||||||||||||||||||||||||||||||
|---|---|---|---|---|---|---|---|---|---|---|---|---|---|---|---|---|---|---|---|---|---|---|---|---|---|---|---|---|---|---|
| 0905 ± 75 years - Unknown | Evidence from Isotopic: 14C (uncalibrated) | |||||||||||||||||||||||||||||
|
List of 4 Events for Episode 1
|
||||||||||||||||||||||||||||||
0530 BCE ± 75 years Confirmed Eruption (Explosive / Effusive)
| Episode 1 | Eruption (Explosive / Effusive) | ||||||||||||||||||||||||||||||
|---|---|---|---|---|---|---|---|---|---|---|---|---|---|---|---|---|---|---|---|---|---|---|---|---|---|---|---|---|---|---|
| 0530 BCE ± 75 years - Unknown | Evidence from Isotopic: 14C (uncalibrated) | |||||||||||||||||||||||||||||
|
List of 4 Events for Episode 1
|
||||||||||||||||||||||||||||||
0750 BCE ± 100 years Confirmed Eruption (Explosive / Effusive)
| Episode 1 | Eruption (Explosive / Effusive) | ||||||||||||||||||||||||||||||
|---|---|---|---|---|---|---|---|---|---|---|---|---|---|---|---|---|---|---|---|---|---|---|---|---|---|---|---|---|---|---|
| 0750 BCE ± 100 years - Unknown | Evidence from Isotopic: 14C (uncalibrated) | |||||||||||||||||||||||||||||
|
List of 4 Events for Episode 1
|
||||||||||||||||||||||||||||||
1600 BCE ± 75 years Confirmed Eruption (Explosive / Effusive)
| Episode 1 | Eruption (Explosive / Effusive) | ||||||||||||||||||||||||||||||
|---|---|---|---|---|---|---|---|---|---|---|---|---|---|---|---|---|---|---|---|---|---|---|---|---|---|---|---|---|---|---|
| 1600 BCE ± 75 years - Unknown | Evidence from Isotopic: 14C (uncalibrated) | |||||||||||||||||||||||||||||
|
List of 4 Events for Episode 1
|
||||||||||||||||||||||||||||||
2020 BCE ± 75 years Confirmed Eruption (Explosive / Effusive)
| Episode 1 | Eruption (Explosive / Effusive) | ||||||||||||||||||||||||||||||
|---|---|---|---|---|---|---|---|---|---|---|---|---|---|---|---|---|---|---|---|---|---|---|---|---|---|---|---|---|---|---|
| 2020 BCE ± 75 years - Unknown | Evidence from Isotopic: 14C (uncalibrated) | |||||||||||||||||||||||||||||
|
List of 4 Events for Episode 1
|
||||||||||||||||||||||||||||||
2135 BCE ± 50 years Confirmed Eruption (Explosive / Effusive)
| Episode 1 | Eruption (Explosive / Effusive) | |||||||||||||||||||||||||
|---|---|---|---|---|---|---|---|---|---|---|---|---|---|---|---|---|---|---|---|---|---|---|---|---|---|
| 2135 BCE ± 50 years - Unknown | Evidence from Isotopic: 14C (uncalibrated) | ||||||||||||||||||||||||
|
List of 3 Events for Episode 1
|
|||||||||||||||||||||||||
2200 BCE ± 150 years Confirmed Eruption (Explosive / Effusive)
| Episode 1 | Eruption (Explosive / Effusive) | ||||||||||||||||||||||||||||||
|---|---|---|---|---|---|---|---|---|---|---|---|---|---|---|---|---|---|---|---|---|---|---|---|---|---|---|---|---|---|---|
| 2200 BCE ± 150 years - Unknown | Evidence from Isotopic: 14C (uncalibrated) | |||||||||||||||||||||||||||||
|
List of 4 Events for Episode 1
|
||||||||||||||||||||||||||||||
2310 BCE ± 100 years Confirmed Eruption (Explosive / Effusive)
| Episode 1 | Eruption (Explosive / Effusive) | ||||||||||||||||||||||||||||||
|---|---|---|---|---|---|---|---|---|---|---|---|---|---|---|---|---|---|---|---|---|---|---|---|---|---|---|---|---|---|---|
| 2310 BCE ± 100 years - Unknown | Evidence from Isotopic: 14C (uncalibrated) | |||||||||||||||||||||||||||||
|
List of 4 Events for Episode 1
|
||||||||||||||||||||||||||||||
2380 BCE ± 100 years Confirmed Eruption (Explosive / Effusive)
| Episode 1 | Eruption (Explosive / Effusive) | ||||||||||||||||||||||||||||||||||||||||
|---|---|---|---|---|---|---|---|---|---|---|---|---|---|---|---|---|---|---|---|---|---|---|---|---|---|---|---|---|---|---|---|---|---|---|---|---|---|---|---|---|
| 2380 BCE ± 100 years - Unknown | Evidence from Isotopic: 14C (uncalibrated) | |||||||||||||||||||||||||||||||||||||||
|
List of 6 Events for Episode 1
|
||||||||||||||||||||||||||||||||||||||||
This compilation of synonyms and subsidiary features may not be comprehensive. Features are organized into four major categories: Cones, Craters, Domes, and Thermal Features. Synonyms of features appear indented below the primary name. In some cases additional feature type, elevation, or location details are provided.
Synonyms |
||||
| Garu, Morne | Garou, Morne | Soufrière Saint Vincent | ||||
Craters |
||||
| Feature Name | Feature Type | Elevation | Latitude | Longitude |
| New Crater, The | Crater | 13° 20' 0.00" N | 61° 11' 0.00" W | |
| Old Crater, The | Crater | 13° 20' 0.00" N | 61° 11' 0.00" W | |
| Somma Crater | Crater | 13° 21' 0.00" N | 61° 11' 0.00" W | |
 Soufrière volcano, seen here from the south, forms the northern end of the island of St. Vincent. Its broad, flat summit is formed by several generations of craters. The present-day, 1.6-km-wide crater, cut on its NE side by a smaller crater formed in 1812, has been the site of lava dome formation and explosive removal on several occasions since the first historical eruption in 1718. Pyroclastic flows from eruptions in 1812, 1902, and 1979 reached the coast.
 A powerful eruption column rises above Soufrière volcano on April 17, 1979. The height of the eruption column was estimated to be 19 km. The smooth-textured "skirt clouds" in the center of the photo were produced by condensation of subhorizontal layers of moist air that were carried up by the eruption column.
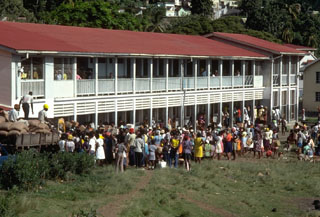 Evacuees from the 1979 eruption of Soufrière volcano pack a school building in Kingston, the capital of St. Vincent. About 15,000 people were evacuated from the northern end of the island. Most were allowed to return home on 14 May, although day-time-only access was permitted for 4000 people living within areas that had been affected by the 1902 eruption.
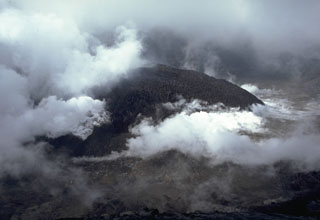 A steaming lava dome fills the floor of the summit crater of Soufrière volcano in June 1979. Both steam clouds from the degassing lava dome and atmospheric clouds are present in this photo. The dome began growing on May 3, after the cessation of explosive eruptions on April 25, and reached a height of 110 m by June 18. By the end of the eruption in October, the dome was 130-m high.
 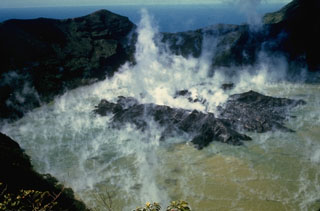 A growing lava dome rises above the surface of the steaming crater lake of Soufrière volcano in December 1971. The dome first breached the surface of the lake on November 20, after extrusion began sometime in late September or early October. Its height increased at an intial rate of 2-3 m/day before it stopped growing on March 20, 1972. Unlike other historical eruptions of Soufrière St. Vincent volcano, the 1971-72 eruption was non-explosive.
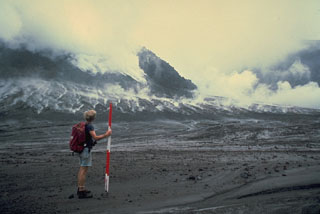 Volcanologist Haraldur Sigurdsson observes a growing lava dome in the summit crater of Soufrière volcano in November 1979 during a field expedition to conduct geodetic surveys of the dome. By the end of the eruption in October 1979 the dome reached a height of 130 m.
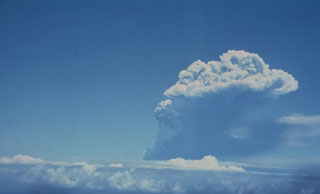 An eruption column at the right rises above atmospheric clouds on the afternoon of April 13, the first day of the 1979 eruption of Soufrière St. Vincent volcano. The ash column reached a height of 10 km. Several explosions took place on the 13th, two on the 14th, and single explosions occurred on the 17th, 22nd, and 25th. A pyroclastic flow on the 14th descended the west flank and traveled at least 10 km out to sea.
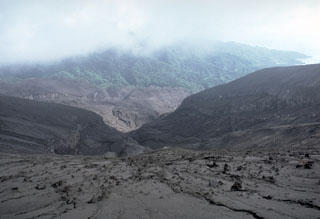 The barren area in the foreground that extends down valleys to the coast was swept by pyroclastic flows during the 1979 eruption of Soufrière volcano on St. Vincent. This photo was taken on June 1979 from the south crater rim, looking towards the west coast off the island at the right. Explosive eruptions April 13-25 were followed by lava dome growth from May to October.
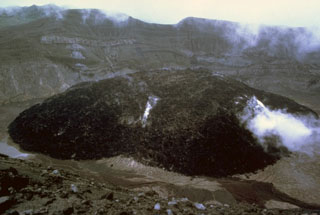 A lava dome 130 m high and more than 840 m wide filled much of the crater floor of Soufrière St. Vincent volcano during the 1979 eruption. Dome growth began in May, after a series of powerful explosive eruptions 13-15 April, and continued until October. Steam continued to rise from the dome in this 1983 photo from the SW crater rim.
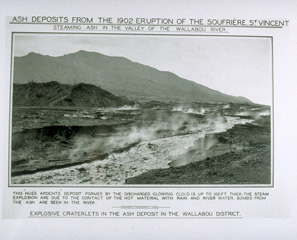 Steaming pyroclastic-flow deposits fill the floor of the Wallibou valley on the SW flank of Soufrière volcano following a powerful eruption on May 7, 1902. Pyroclastic flows reached the coast on all sides of the volcano during one of the largest eruptions in the West Indies in historical time. Pyroclastic flows during this eruption were even more extensive than those that occurred the following day from Mount Pelèe volcano in Martinique, but this eruption is less-well known because of the much greater loss of life at St. Pierre.
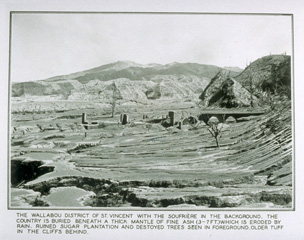 A powerful explosive eruption on 7 May 1902, the day before the much better known eruption of Pelèe on Martinique, devastated the northern part of St. Vincent. This view from the Wallibou valley with the summit of Soufrière volcano to the NE, shows the effect of pyroclastic flows that swept the flanks to the sea. he eruption killed 1565 people and caused extensive damage, including that to the sugar mill in the foreground. Intermittent explosive eruptions continued until March 1903.
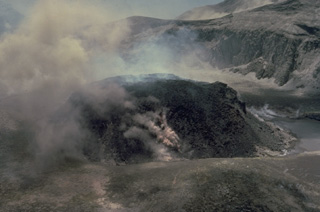 Steam rises from the margins of a growing lava dome in the summit crater of Soufrière volcano on May 7, 1979. This photo was taken from the SW crater rim 4 days after the beginning of dome growth. By June 18 the dome had reached a height of 110 m and was 750 m wide, covering much of the crater floor.
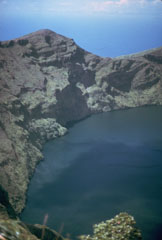 Prior to an eruption in 1971, the summit crater of Soufrière volcano was filled with a crater lake with a maximum depth of 180 m. Its floor was 560 m below the north crater rim. In 1971 a lava dome slowly and almost aseismically began growing on the crater floor. It first breached the surface on November 3 and eventually formed a large island that left only a narrow moat of lake water.
 Scientists from the University of West Indies and Smithsonian Institution make precision leveling measurements on the east flank of Soufrière volcano. The optical leveling instrument, under the umbrella for protection from the sun, is used to measure precise differences in elevation between fixed benchmarks. Elevations are read from a stadia rod (across the dry stream bed at the right) placed on top of the benchmark. Areas of stable bedrock flat enough to conduct measurements are difficult to find on heavily vegetated tropical volcanoes.
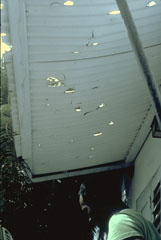 These holes in a wooden awning at the Orange Hill estate, were produced by ballistic ejecta from eruptions of Soufrière volcano. Orange Hill is located at the coast on the east flank of Soufrière St. Vincent, 7 km from the crater.
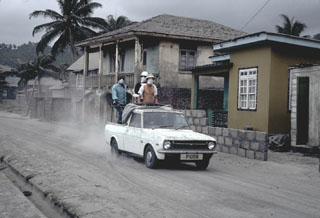 A truck filled with people evacuating the eruption of Soufrière volcano drives through the streets of the city of Georgetown, SE of the volcano, in April 1979. The riders are wearing masks because of ashfall. About 15,000 people were initially evacuated from the northern half of the island, which had been devastated by a previous eruption in 1902.
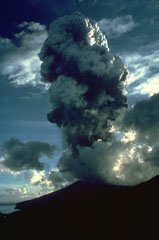 An eruption plume rises above the summit of Soufrière St. Vincent volcano on April 22, 1979. A series of powerful explosive eruptions beginning on April 13 ejected the crater lake and removed the summit lava dome. Pyroclastic flows occurred during several of the explosions and reached the west (lefthand) coast on April 14. Following the cessation of explosive activity on April 25, a lava dome began growing in the new crater on May 3. It eventually reached a height of 130 m and covered 840 m of the crater floor.
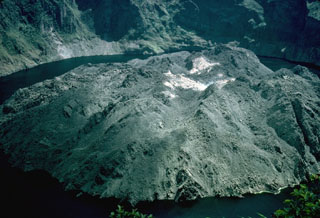 A blocky, andesitic lava dome erupted in 1971 filled much of the floor of the summit crater of Soufrière St. Vincent volcano. This 1977 photo shows the dome, which formed a 70-m-high island in the crater lake prior to its destruction during an explosive eruption in 1979. The 1971 eruption was unusual for Soufrière St. Vincent volcano in that it consisted of slow extrusion of lava that was not preceded by explosive eruptions.
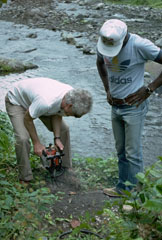 Volcanologists Richard Fiske and Keith Rowley drill a boulder on the east flank of Soufrière St. Vincent volcano to install benchmarks for deformation surveys. These surveys allow detection of inflation of the volcano that often occurs prior to eruptions.
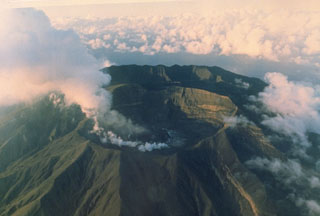 A steaming lava dome grows on the floor of the crater of Soufrière St. Vincent volcano in 1979. Powerful explosive eruptions that emptied the crater lake and removed the 1971 lava dome took place April 13-25. On May 3 a small lava dome appeared on the dry crater floor. By June 18 it had reached a height of 110 m and a width of 750 m. Diminishing dome growth took place until late October, by which time the dome was 130-m high. This photo was taken from the SW on May 15, during the early stages of dome growth.
 Soufrière St. Vincent volcano forms the northern end of the island of St. Vincent. The 1178-m-high stratovolcano, seen here from off the west coast, has a broad summit. The peak at the left, the volcano's high point, is the NW rim of a large crater created by a massive volcanic landslide. The present-day, 1.6-km-wide summit crater truncates a cone (forming the flat-topped area across the saddle to the right) that was constructed within the earlier crater. Several powerful explosive eruptions have occurred in historical time since 1718.
 The following 270 samples associated with this volcano can be found in the Smithsonian's NMNH Department of Mineral Sciences collections, and may be availble for research (contact the Rock and Ore Collections Manager). Catalog number links will open a window with more information.
| Catalog Number | Sample Description | Lava Source | Collection Date |
|---|---|---|---|
| NMNH 112569 | Basaltic Andesite | -- | -- |
| NMNH 112577 | Plagioclase-Hornblende | -- | -- |
| NMNH 112577-1 | Unidentified | -- | -- |
| NMNH 112577-2 | Unidentified | -- | -- |
| NMNH 112577-3 | Unidentified | -- | -- |
| NMNH 112577-4 | Unidentified | -- | -- |
| NMNH 112577-5 | Unidentified | -- | -- |
| NMNH 112577-6 | Unidentified | -- | -- |
| NMNH 112577-7 | Unidentified | -- | -- |
| NMNH 112577-8 | Unidentified | -- | -- |
| NMNH 112577-9 | Unidentified | -- | -- |
| NMNH 112638-1 | Unidentified | -- | -- |
| NMNH 112638-10 | Unidentified | -- | -- |
| NMNH 112638-100 | Unidentified | -- | -- |
| NMNH 112638-101 | Unidentified | -- | -- |
| NMNH 112638-102 | Unidentified | -- | -- |
| NMNH 112638-103 | Unidentified | -- | -- |
| NMNH 112638-104 | Unidentified | -- | -- |
| NMNH 112638-105 | Unidentified | -- | -- |
| NMNH 112638-106 | Unidentified | -- | -- |
| NMNH 112638-107 | Unidentified | -- | -- |
| NMNH 112638-108 | Unidentified | -- | -- |
| NMNH 112638-109 | Unidentified | -- | -- |
| NMNH 112638-11 | Unidentified | -- | -- |
| NMNH 112638-110 | Unidentified | -- | -- |
| NMNH 112638-111 | Unidentified | -- | -- |
| NMNH 112638-112 | Unidentified | -- | -- |
| NMNH 112638-113 | Unidentified | -- | -- |
| NMNH 112638-114 | Unidentified | -- | -- |
| NMNH 112638-115 | Unidentified | -- | -- |
| NMNH 112638-116 | Unidentified | -- | -- |
| NMNH 112638-117 | Unidentified | -- | -- |
| NMNH 112638-118 | Unidentified | -- | -- |
| NMNH 112638-119 | Unidentified | -- | -- |
| NMNH 112638-12 | Unidentified | -- | -- |
| NMNH 112638-120 | Unidentified | -- | -- |
| NMNH 112638-121 | Unidentified | -- | -- |
| NMNH 112638-122 | Unidentified | -- | -- |
| NMNH 112638-123 | Unidentified | -- | -- |
| NMNH 112638-124 | Unidentified | -- | -- |
| NMNH 112638-125 | Unidentified | -- | -- |
| NMNH 112638-126 | Unidentified | -- | -- |
| NMNH 112638-127 | Unidentified | -- | -- |
| NMNH 112638-128 | Unidentified | -- | -- |
| NMNH 112638-129 | Unidentified | -- | -- |
| NMNH 112638-13 | Unidentified | -- | -- |
| NMNH 112638-130 | Unidentified | -- | -- |
| NMNH 112638-131 | Unidentified | -- | -- |
| NMNH 112638-132 | Unidentified | -- | -- |
| NMNH 112638-133 | Unidentified | -- | -- |
| NMNH 112638-134 | Unidentified | -- | -- |
| NMNH 112638-135 | Unidentified | -- | -- |
| NMNH 112638-136 | Unidentified | -- | -- |
| NMNH 112638-137 | Unidentified | -- | -- |
| NMNH 112638-138 | Unidentified | -- | -- |
| NMNH 112638-139 | Unidentified | -- | -- |
| NMNH 112638-14 | Unidentified | -- | -- |
| NMNH 112638-140 | Unidentified | -- | -- |
| NMNH 112638-141 | Unidentified | -- | -- |
| NMNH 112638-142 | Unidentified | -- | -- |
| NMNH 112638-143 | Unidentified | -- | -- |
| NMNH 112638-144 | Unidentified | -- | -- |
| NMNH 112638-145 | Unidentified | -- | -- |
| NMNH 112638-15 | Unidentified | -- | -- |
| NMNH 112638-16 | Unidentified | -- | -- |
| NMNH 112638-17 | Unidentified | -- | -- |
| NMNH 112638-18 | Unidentified | -- | -- |
| NMNH 112638-19 | Unidentified | -- | -- |
| NMNH 112638-2 | Unidentified | -- | -- |
| NMNH 112638-20 | Unidentified | -- | -- |
| NMNH 112638-21 | Unidentified | -- | -- |
| NMNH 112638-22 | Unidentified | -- | -- |
| NMNH 112638-23 | Unidentified | -- | -- |
| NMNH 112638-24 | Unidentified | -- | -- |
| NMNH 112638-25 | Unidentified | -- | -- |
| NMNH 112638-26 | Unidentified | -- | -- |
| NMNH 112638-27 | Unidentified | -- | -- |
| NMNH 112638-28 | Unidentified | -- | -- |
| NMNH 112638-29 | Unidentified | -- | -- |
| NMNH 112638-3 | Unidentified | -- | -- |
| NMNH 112638-30 | Unidentified | -- | -- |
| NMNH 112638-31 | Unidentified | -- | -- |
| NMNH 112638-32 | Unidentified | -- | -- |
| NMNH 112638-33 | Unidentified | -- | -- |
| NMNH 112638-34 | Unidentified | -- | -- |
| NMNH 112638-35 | Unidentified | -- | -- |
| NMNH 112638-36 | Unidentified | -- | -- |
| NMNH 112638-37 | Unidentified | -- | -- |
| NMNH 112638-38 | Unidentified | -- | -- |
| NMNH 112638-39 | Unidentified | -- | -- |
| NMNH 112638-4 | Unidentified | -- | -- |
| NMNH 112638-40 | Unidentified | -- | -- |
| NMNH 112638-41 | Unidentified | -- | -- |
| NMNH 112638-42 | Unidentified | -- | -- |
| NMNH 112638-43 | Unidentified | -- | -- |
| NMNH 112638-44 | Unidentified | -- | -- |
| NMNH 112638-45 | Unidentified | -- | -- |
| NMNH 112638-46 | Unidentified | -- | -- |
| NMNH 112638-47 | Unidentified | -- | -- |
| NMNH 112638-48 | Unidentified | -- | -- |
| NMNH 112638-49 | Unidentified | -- | -- |
| NMNH 112638-5 | Unidentified | -- | -- |
| NMNH 112638-50 | Unidentified | -- | -- |
| NMNH 112638-51 | Unidentified | -- | -- |
| NMNH 112638-52 | Unidentified | -- | -- |
| NMNH 112638-53 | Unidentified | -- | -- |
| NMNH 112638-54 | Unidentified | -- | -- |
| NMNH 112638-55 | Unidentified | -- | -- |
| NMNH 112638-56 | Unidentified | -- | -- |
| NMNH 112638-57 | Unidentified | -- | -- |
| NMNH 112638-58 | Unidentified | -- | -- |
| NMNH 112638-59 | Unidentified | -- | -- |
| NMNH 112638-6 | Unidentified | -- | -- |
| NMNH 112638-60 | Unidentified | -- | -- |
| NMNH 112638-61 | Unidentified | -- | -- |
| NMNH 112638-62 | Unidentified | -- | -- |
| NMNH 112638-63 | Unidentified | -- | -- |
| NMNH 112638-64 | Unidentified | -- | -- |
| NMNH 112638-65 | Unidentified | -- | -- |
| NMNH 112638-66 | Unidentified | -- | -- |
| NMNH 112638-67 | Unidentified | -- | -- |
| NMNH 112638-68 | Unidentified | -- | -- |
| NMNH 112638-69 | Unidentified | -- | -- |
| NMNH 112638-7 | Unidentified | -- | -- |
| NMNH 112638-70 | Unidentified | -- | -- |
| NMNH 112638-71 | Unidentified | -- | -- |
| NMNH 112638-72 | Unidentified | -- | -- |
| NMNH 112638-73 | Unidentified | -- | -- |
| NMNH 112638-74 | Unidentified | -- | -- |
| NMNH 112638-75 | Unidentified | -- | -- |
| NMNH 112638-76 | Unidentified | -- | -- |
| NMNH 112638-77 | Unidentified | -- | -- |
| NMNH 112638-78 | Unidentified | -- | -- |
| NMNH 112638-79 | Unidentified | -- | -- |
| NMNH 112638-8 | Unidentified | -- | -- |
| NMNH 112638-80 | Unidentified | -- | -- |
| NMNH 112638-81 | Unidentified | -- | -- |
| NMNH 112638-82 | Unidentified | -- | -- |
| NMNH 112638-83 | Unidentified | -- | -- |
| NMNH 112638-84 | Unidentified | -- | -- |
| NMNH 112638-85 | Unidentified | -- | -- |
| NMNH 112638-86 | Unidentified | -- | -- |
| NMNH 112638-87 | Unidentified | -- | -- |
| NMNH 112638-88 | Unidentified | -- | -- |
| NMNH 112638-89 | Unidentified | -- | -- |
| NMNH 112638-9 | Unidentified | -- | -- |
| NMNH 112638-90 | Unidentified | -- | -- |
| NMNH 112638-91 | Unidentified | -- | -- |
| NMNH 112638-92 | Unidentified | -- | -- |
| NMNH 112638-93 | Unidentified | -- | -- |
| NMNH 112638-94 | Unidentified | -- | -- |
| NMNH 112638-95 | Unidentified | -- | -- |
| NMNH 112638-96 | Unidentified | -- | -- |
| NMNH 112638-97 | Unidentified | -- | -- |
| NMNH 112638-98 | Unidentified | -- | -- |
| NMNH 112638-99 | Unidentified | -- | -- |
| NMNH 112646-1 | Xenolith | -- | -- |
| NMNH 112646-10 | Unidentified | -- | -- |
| NMNH 112646-11 | Unidentified | -- | -- |
| NMNH 112646-12 | Unidentified | -- | -- |
| NMNH 112646-13 | Unidentified | -- | -- |
| NMNH 112646-14 | Unidentified | -- | -- |
| NMNH 112646-15 | Unidentified | -- | -- |
| NMNH 112646-16 | Unidentified | -- | -- |
| NMNH 112646-17 | Unidentified | -- | -- |
| NMNH 112646-18 | Unidentified | -- | -- |
| NMNH 112646-2 | Unidentified | -- | -- |
| NMNH 112646-3 | Unidentified | -- | -- |
| NMNH 112646-4 | Unidentified | -- | -- |
| NMNH 112646-5 | Unidentified | -- | -- |
| NMNH 112646-6 | Unidentified | -- | -- |
| NMNH 112646-7 | Unidentified | -- | -- |
| NMNH 112646-8 | Unidentified | -- | -- |
| NMNH 112646-9 | Unidentified | -- | -- |
| NMNH 112647-1 | Olivine Basalt | -- | -- |
| NMNH 112647-10 | Olivine Basalt | -- | -- |
| NMNH 112647-11 | Olivine Basalt | -- | -- |
| NMNH 112647-2 | Olivine Basalt | -- | -- |
| NMNH 112647-3 | Olivine Basalt | -- | -- |
| NMNH 112647-4 | Olivine Basalt | -- | -- |
| NMNH 112647-5 | Olivine Basalt | -- | -- |
| NMNH 112647-6 | Olivine Basalt | -- | -- |
| NMNH 112647-7 | Olivine Basalt | -- | -- |
| NMNH 112647-8 | Olivine Basalt | -- | -- |
| NMNH 112647-9 | Olivine Basalt | -- | -- |
| NMNH 112648-1 | Pottery Fragments | -- | -- |
| NMNH 112648-10 | Pottery Fragments | -- | -- |
| NMNH 112648-2 | Pottery Fragments | -- | -- |
| NMNH 112648-3 | Pottery Fragments | -- | -- |
| NMNH 112648-4 | Pottery Fragments | -- | -- |
| NMNH 112648-5 | Pottery Fragments | -- | -- |
| NMNH 112648-6 | Pottery Fragments | -- | -- |
| NMNH 112648-7 | Pottery Fragments | -- | -- |
| NMNH 112648-8 | Pottery Fragments | -- | -- |
| NMNH 112648-9 | Pottery Fragments | -- | -- |
| NMNH 112649 | Olivine Basalt | -- | -- |
| NMNH 112650-1 | Basalt | -- | -- |
| NMNH 112650-2 | Basalt | -- | -- |
| NMNH 112651 | Basalt | -- | -- |
| NMNH 112652-1 | Basaltic Tuff | -- | -- |
| NMNH 112652-10 | Basaltic Tuff | -- | -- |
| NMNH 112652-11 | Basaltic Tuff | -- | -- |
| NMNH 112652-12 | Basaltic Tuff | -- | -- |
| NMNH 112652-13 | Basaltic Tuff | -- | -- |
| NMNH 112652-2 | Basaltic Tuff | -- | -- |
| NMNH 112652-3 | Basaltic Tuff | -- | -- |
| NMNH 112652-4 | Basaltic Tuff | -- | -- |
| NMNH 112652-5 | Basaltic Tuff | -- | -- |
| NMNH 112652-6 | Basaltic Tuff | -- | -- |
| NMNH 112652-7 | Basaltic Tuff | -- | -- |
| NMNH 112652-8 | Basaltic Tuff | -- | -- |
| NMNH 112652-9 | Basaltic Tuff | -- | -- |
| NMNH 112653-1 | Basalt | -- | -- |
| NMNH 112653-10 | Basalt | -- | -- |
| NMNH 112653-11 | Basalt | -- | -- |
| NMNH 112653-12 | Basalt | -- | -- |
| NMNH 112653-13 | Basalt | -- | -- |
| NMNH 112653-14 | Basalt | -- | -- |
| NMNH 112653-15 | Basalt | -- | -- |
| NMNH 112653-16 | Basalt | -- | -- |
| NMNH 112653-17 | Basalt | -- | -- |
| NMNH 112653-18 | Basalt | -- | -- |
| NMNH 112653-19 | Basalt | -- | -- |
| NMNH 112653-2 | Basalt | -- | -- |
| NMNH 112653-20 | Basalt | -- | -- |
| NMNH 112653-21 | Basalt | -- | -- |
| NMNH 112653-22 | Basalt | -- | -- |
| NMNH 112653-23 | Basalt | -- | -- |
| NMNH 112653-3 | Basalt | -- | -- |
| NMNH 112653-4 | Basalt | -- | -- |
| NMNH 112653-5 | Basalt | -- | -- |
| NMNH 112653-6 | Basalt | -- | -- |
| NMNH 112653-7 | Basalt | -- | -- |
| NMNH 112653-8 | Basalt | -- | -- |
| NMNH 112653-9 | Basalt | -- | -- |
| NMNH 112654 | Basalt | -- | -- |
| NMNH 112655 | Basalt | -- | -- |
| NMNH 112656 | Basalt | -- | -- |
| NMNH 112657 | Basalt | -- | -- |
| NMNH 112658 | Basalt | -- | -- |
| NMNH 112659-1 | Basalt | -- | -- |
| NMNH 112659-2 | Basalt | -- | -- |
| NMNH 112659-3 | Basalt | -- | -- |
| NMNH 112659-4 | Basalt | -- | -- |
| NMNH 112659-5 | Basalt | -- | -- |
| NMNH 112659-6 | Basalt | -- | -- |
| NMNH 112659-7 | Basalt | -- | -- |
| NMNH 112659-8 | Basalt | -- | -- |
| NMNH 112660 | Basalt | -- | -- |
| NMNH 112661 | Black Sand | -- | -- |
| NMNH 112662 | Black Sand | -- | -- |
| NMNH 113060-1 | Block Plutonic Rock | -- | -- |
| NMNH 113060-10 | Block Plutonic Rock | -- | -- |
| NMNH 113060-2 | Block Plutonic Rock | -- | -- |
| NMNH 113060-3 | Block Plutonic Rock | -- | -- |
| NMNH 113060-4 | Block Plutonic Rock | -- | -- |
| NMNH 113060-5 | Block Plutonic Rock | -- | -- |
| NMNH 113060-6 | Block Plutonic Rock | -- | -- |
| NMNH 113060-7 | Block Plutonic Rock | -- | -- |
| NMNH 113060-8 | Block Plutonic Rock | -- | -- |
| NMNH 113060-9 | Unidentified | -- | -- |
| NMNH 115754-1 | Pumice | -- | -- |
| NMNH 115754-2 | Pumice | -- | -- |
| NMNH 116271-24 | Andesite | -- | -- |
| NMNH 147476-00 | Fassaite | -- | -- |
| NMNH 75431 | Volcanic Dust | -- | -- |
| NMNH 75432 | Volcanic Dust | -- | -- |
| NMNH 75997 | Andesite | -- | -- |
| NMNH 76971 | Volcanic Dust | -- | -- |
| NMNH 76972 | Volcanic Dust | -- | -- |
| Copernicus Browser | The Copernicus Browser replaced the Sentinel Hub Playground browser in 2023, to provide access to Earth observation archives from the Copernicus Data Space Ecosystem, the main distribution platform for data from the EU Copernicus missions. |
| MIROVA | Middle InfraRed Observation of Volcanic Activity (MIROVA) is a near real time volcanic hot-spot detection system based on the analysis of MODIS (Moderate Resolution Imaging Spectroradiometer) data. In particular, MIROVA uses the Middle InfraRed Radiation (MIR), measured over target volcanoes, in order to detect, locate and measure the heat radiation sourced from volcanic activity. |
| MODVOLC Thermal Alerts | Using infrared satellite Moderate Resolution Imaging Spectroradiometer (MODIS) data, scientists at the Hawai'i Institute of Geophysics and Planetology, University of Hawai'i, developed an automated system called MODVOLC to map thermal hot-spots in near real time. For each MODIS image, the algorithm automatically scans each 1 km pixel within it to check for high-temperature hot-spots. When one is found the date, time, location, and intensity are recorded. MODIS looks at every square km of the Earth every 48 hours, once during the day and once during the night, and the presence of two MODIS sensors in space allows at least four hot-spot observations every two days. Each day updated global maps are compiled to display the locations of all hot spots detected in the previous 24 hours. There is a drop-down list with volcano names which allow users to 'zoom-in' and examine the distribution of hot-spots at a variety of spatial scales. |
|
WOVOdat
Single Volcano View Temporal Evolution of Unrest Side by Side Volcanoes |
WOVOdat is a database of volcanic unrest; instrumentally and visually recorded changes in seismicity, ground deformation, gas emission, and other parameters from their normal baselines. It is sponsored by the World Organization of Volcano Observatories (WOVO) and presently hosted at the Earth Observatory of Singapore.
GVMID Data on Volcano Monitoring Infrastructure The Global Volcano Monitoring Infrastructure Database GVMID, is aimed at documenting and improving capabilities of volcano monitoring from the ground and space. GVMID should provide a snapshot and baseline view of the techniques and instrumentation that are in place at various volcanoes, which can be use by volcano observatories as reference to setup new monitoring system or improving networks at a specific volcano. These data will allow identification of what monitoring gaps exist, which can be then targeted by remote sensing infrastructure and future instrument deployments. |
| Volcanic Hazard Maps | The IAVCEI Commission on Volcanic Hazards and Risk has a Volcanic Hazard Maps database designed to serve as a resource for hazard mappers (or other interested parties) to explore how common issues in hazard map development have been addressed at different volcanoes, in different countries, for different hazards, and for different intended audiences. In addition to the comprehensive, searchable Volcanic Hazard Maps Database, this website contains information about diversity of volcanic hazard maps, illustrated using examples from the database. This site is for educational purposes related to volcanic hazard maps. Hazard maps found on this website should not be used for emergency purposes. For the most recent, official hazard map for a particular volcano, please seek out the proper institutional authorities on the matter. |
| IRIS seismic stations/networks | Incorporated Research Institutions for Seismology (IRIS) Data Services map showing the location of seismic stations from all available networks (permanent or temporary) within a radius of 0.18° (about 20 km at mid-latitudes) from the given location of Soufrière St. Vincent. Users can customize a variety of filters and options in the left panel. Note that if there are no stations are known the map will default to show the entire world with a "No data matched request" error notice. |
| UNAVCO GPS/GNSS stations | Geodetic Data Services map from UNAVCO showing the location of GPS/GNSS stations from all available networks (permanent or temporary) within a radius of 20 km from the given location of Soufrière St. Vincent. Users can customize the data search based on station or network names, location, and time window. Requires Adobe Flash Player. |
| DECADE Data | The DECADE portal, still in the developmental stage, serves as an example of the proposed interoperability between The Smithsonian Institution's Global Volcanism Program, the Mapping Gas Emissions (MaGa) Database, and the EarthChem Geochemical Portal. The Deep Earth Carbon Degassing (DECADE) initiative seeks to use new and established technologies to determine accurate global fluxes of volcanic CO2 to the atmosphere, but installing CO2 monitoring networks on 20 of the world's 150 most actively degassing volcanoes. The group uses related laboratory-based studies (direct gas sampling and analysis, melt inclusions) to provide new data for direct degassing of deep earth carbon to the atmosphere. |
| Large Eruptions of Soufrière St. Vincent | Information about large Quaternary eruptions (VEI >= 4) is cataloged in the Large Magnitude Explosive Volcanic Eruptions (LaMEVE) database of the Volcano Global Risk Identification and Analysis Project (VOGRIPA). |
| EarthChem | EarthChem develops and maintains databases, software, and services that support the preservation, discovery, access and analysis of geochemical data, and facilitate their integration with the broad array of other available earth science parameters. EarthChem is operated by a joint team of disciplinary scientists, data scientists, data managers and information technology developers who are part of the NSF-funded data facility Integrated Earth Data Applications (IEDA). IEDA is a collaborative effort of EarthChem and the Marine Geoscience Data System (MGDS). |

