Report on Fagradalsfjall (Iceland) — May 2021

Bulletin of the Global Volcanism Network, vol. 46, no. 5 (May 2021)
Managing Editor: Edward Venzke.
Edited by Kadie L. Bennis.
Fagradalsfjall (Iceland) New fissure eruption began in March 2021, producing fountains and lava flows
Please cite this report as:
Global Volcanism Program, 2021. Report on Fagradalsfjall (Iceland) (Bennis, K.L., and Venzke, E., eds.). Bulletin of the Global Volcanism Network, 46:5. Smithsonian Institution. https://doi.org/10.5479/si.GVP.BGVN202105-371032
Fagradalsfjall
Iceland
63.895°N, 22.258°W; summit elev. 250 m
All times are local (unless otherwise noted)
The Krýsuvík-Trölladyngja system, one of five volcanic systems along the Reykjanes Peninsula in Iceland, is characterized by a 50-km-long composite fissure swarm trending about N38°E. The system includes the shorter Fagradalsfjall and Krýsuvík fissure swarms; there is no clear sign of a central volcano. Seismicity in this area began on 24 February 2021 and continued to increase through March, causing some surface fractures. An orange glow observed on 19 March indicated the start of a fissure eruption near Fagradalsfjall in the Geldingadalur (also referred to as Geldingadalir) valley (figure 1). Several fissure vents opened along a NE-SW trend, accompanied by white gas-and-steam emissions, spatter, and lava fountains; flows began to fill Geldingadalur and eventually reached the Meradalir valley. This report covers activity through April 2021 and describes the beginning of the new eruption using information from the Icelandic Meteorological Office, the Institute of Earth Sciences, Icelandic National Broadcasting Service, the University of Iceland, and various satellite data.
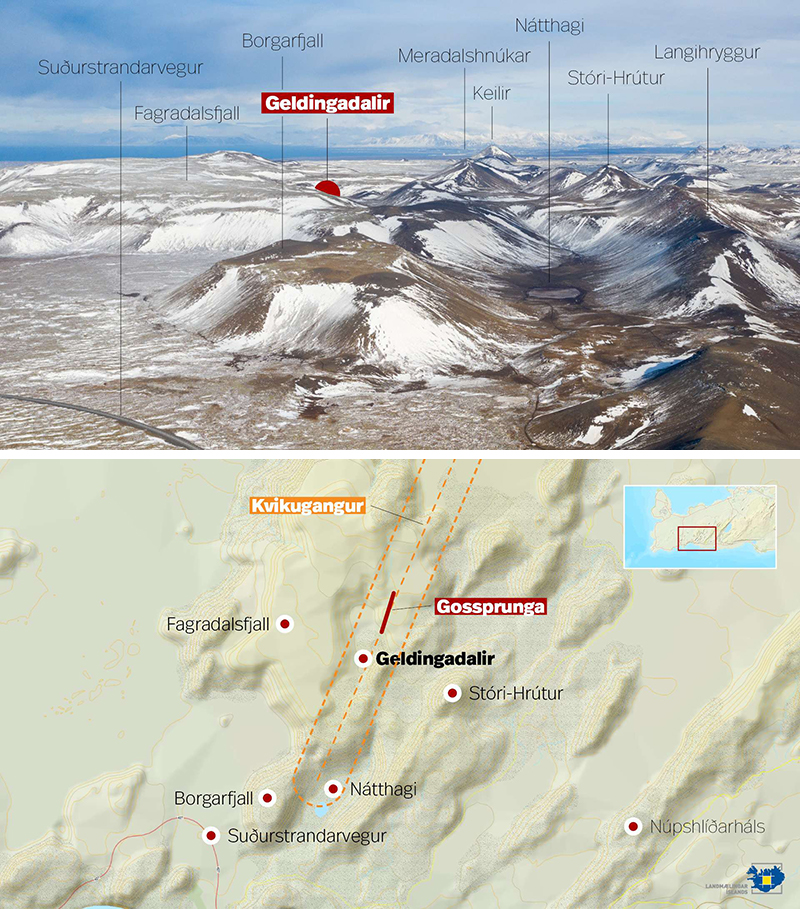 |
Figure 1. Photo (top) showing part of the Krýsuvík-Trölladyngja region on the Reykjanes Peninsula, looking NE from Suðurstrandavegur, highlighting the location of the Geldingadalur valley and posted on 20 March 2021. The Meradalir valley is located directly to the E of Geldingadalur. A map (bottom) shows the location of the initial fissure eruption (red line also marked Gossprunga) in the Geldingadalur valley, the dike intrusion is outlined in orange. The map was posted on 19 March 2021. Courtesy of RÚV and IMO. |
Seismicity during February 2021. On 24 February 2021 seismicity in the region increased notably; at 1005 an Mw 5.7 earthquake was detected 5 km W of Krýsuvík and at 1027 an Mw 4.2 was detected in Núpshlíðarháls (less than 1 km NW). More than 6,000 earthquakes were recorded through the end of the month after the Mw 5.7 event, two above Mw 5. The earthquakes were distributed over a 25-km-long section of a N-S striking fault, primarily between Keilir (a mountain to the W of Trölladyngja) and Fagradalsfjall (a volcanic system 1 km N of Nátthaga). Most of the earthquakes were located about 5 km deep at Fagradalsfjall and likely indicated magma movement. GPS data showed a 4 cm horizontal displacement near the epicenter of the Mw 5.7 event, and satellite data also indicated ground deformation. By 27 February, more than 7,200 earthquakes had been recorded since 24 February. These earthquakes seemed to have shifted to the SW corner of Fagradalsfjall.
Seismicity during 1-19 March 2021. Thousands of earthquakes continued to be detected through mid-March. On 3 March seismic stations recorded tremor starting around 1425 in an area 2 km SW of Keilir, which likely indicated magma was rising toward the surface. By 5 March more than 20,000 earthquakes had been recorded since 24 February. InSAR satellite images between 25 February and 3 March showed signs of a magmatic intrusion moving slowly SW along a fault between Fagradalsfjall and Keilir at depths of 2-6 km. Another 2,800 earthquakes were detected on the peninsula on 7 March, the largest of which was an Mw 5 at 0201 and by 10 March IMO reported that more than 34,000 earthquakes had been detected over the past two weeks, a few of which were in the Mw 5 range. The magmatic intrusion continued to move SW and was as shallow as 1-1.5 km beneath the surface. GPS, satellite, and seismic data indicated that the intrusion was 3-5 km long and had expanded S to Nátthaga, a valley just E of Borgarfjall and S of Fagradalsfjall. Ground fracturing was visible in the area above the intrusion. On 17 March about 1,400 earthquakes were detected on the Reykjanes peninsula. The number of earthquakes decreased to 400 on 18 March. At least 1,000 earthquakes were detected during 19 March.
Volcanism during March 2021. A small eruption in the W part of the Krýsuvík-Trölladyngja volcanic system began around 2045 on 19 March and was first visible in webcam images and confirmed by thermal satellite data (figure 2). An orange glow reflected from clouds on the horizon was visible from Reykjanesbær and Grindavík (10 km SW). The initial length of the fissure was 200 m (figure 3), which gradually grew to 700 m long, on a slope in the Geldingadalur valley about 4.7 km inland from the S coast of the peninsula. Small lava fountains rose as high as 100 m above the fissure and by 1110 on 20 March lava had covered an area less than 1 km2 and was approximately 500 m wide (figures 4 and 5). The rate of extrusion was an estimated 5 m3/s. Three cones formed, with the tallest and widest cone at the higher part of the fissure. Lava flows, mainly originating from the largest cone, spread out to the NW, W, E, and SW, and also flowed S. Spatter was ejected above the cones. Video captured by visitors showed that parts of the largest cone, measuring at least 30 m high, had collapsed and was being rebuilt.
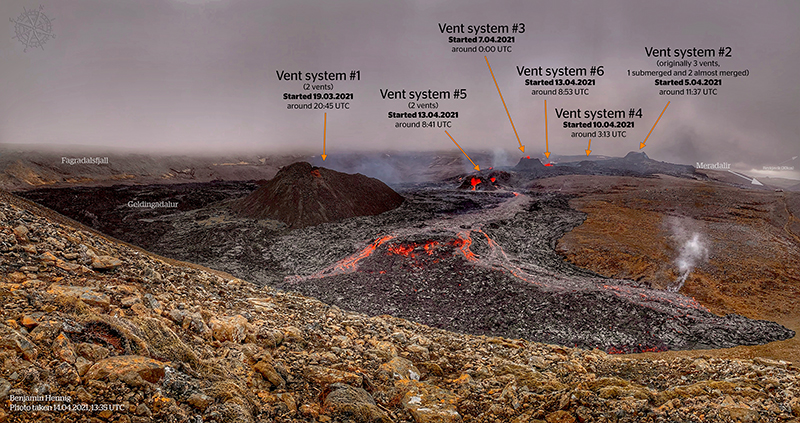 |
Figure 2. Annotated photo showing the location of the six fissure vents that opened on 19 March (fissure 1), 5 April (fissure 2), 7 April (fissure 3), 10 April (fissure 4), and 13 April (fissures 5 and 6) 2021 and the resulting lava flows from each. Lava flows from three original vents (marked as Vent 2) had intersected to one single, continuous field that traveled into the Meradalir valley (E of Geldingadalur) on 5 April. Photo updated on 14 April 2021; courtesy of Benjamin Hennig, University of Iceland. |
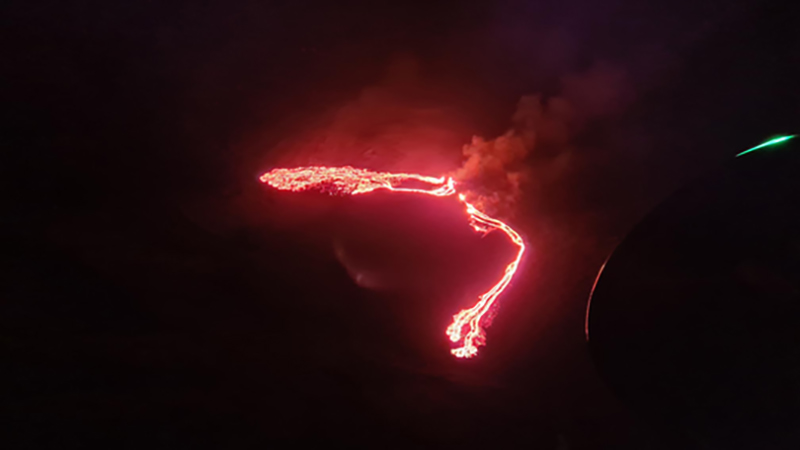 |
Figure 3. Photo at the start of the Krýsuvík-Trölladyngja eruption on 19 March 2021 showing incandescent lava flows traveling SSW and W and gas-and-steam emissions from the 200-m-long fissure in the Geldingadalur valley. The area covered by lava is roughly 500 m wide. Photo was taken from the Icelandic Coast Guard helicopter. Courtesy of IMO. |
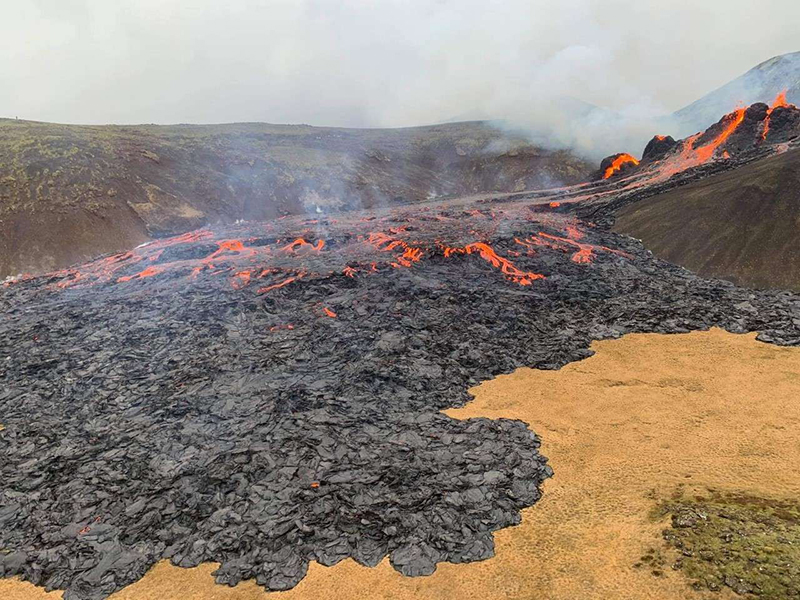 |
Figure 4. Photo of the eruption site in the Geldingadalur valley at Krýsuvík on the morning of 20 March 2021 showing the active lava flows and white gas-and-steam emissions. Courtesy of Gísli Berg, RÚV. |
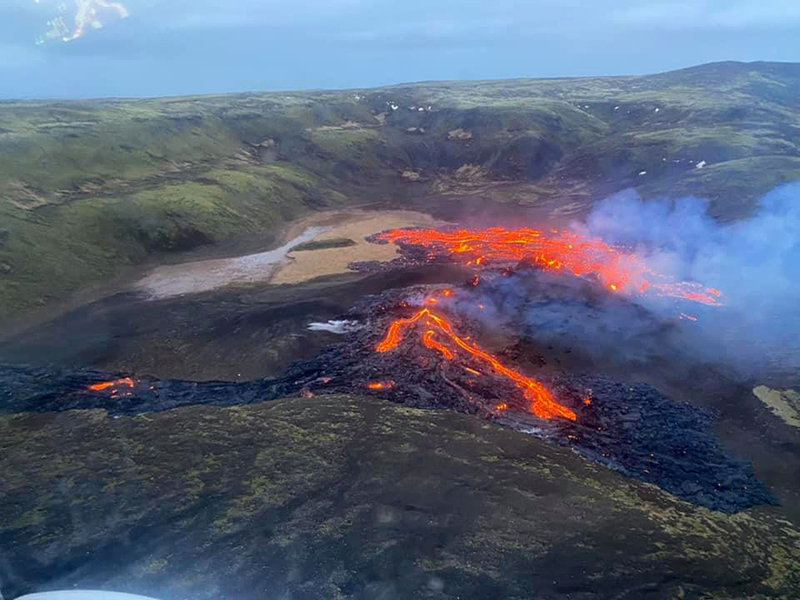 |
Figure 5. Aerial view of the eruption site in the Geldingadalur valley at Krýsuvík on the morning of 20 March 2021 during a surveillance overflight showing the active lava flows and gas-and-steam emissions. Courtesy of the Icelandic Coast Guard. |
On 21 March DOAS (Differential Optical Absorption Spectrometer) traverses showed that the SO2 flux was between 15-55 kg/s and a gas-and-steam plume had risen to 400-1,000 m altitude. Video data showed that on 21 March lava was flowing through where the rim of the cone had collapsed (figure 6). IMO noted that during the night of 22-23 March sulfur dioxide levels in Reykjavík had increased. A gas plume on 23 March rose to 1.3 km altitude during 0900-1000. Analysis of a Pléiades satellite image taken from 23 March showed a cone height of 20 m, a maximum lava thickness of 22 m, and an average lava thickness of 9.5 m. The total erupted volume was 1.8 million cubic meters, and the average rate of effusion was 5.7 m3/s since the start of the eruption. On 24 March a DOAS traverse recorded the SO2 flux as 18 kg/s while a gas plume had risen to 1 km altitude, based on calibrated images. During 25-26 March the latest Pléiades image acquisition (LMI) showed that the rate of extrusion was 5.8-7 m3/s, spreading dominantly to the W and S, though it remained in Geldingadalur (figure 7). Spatter was ejected above the main vent and resulted in the formation of a second spatter cone adjacent to the main cone. Small lava fountains rose above the two vents.
 |
Figure 6. Image from video showing the active lava flows filling the Geldingadalur valley at Krýsuvík at 1423 on 21 March 2021. In the background new lava flows breached the rim of the active cone (on the right side) causing a partial collapse. Courtesy of RÚV. |
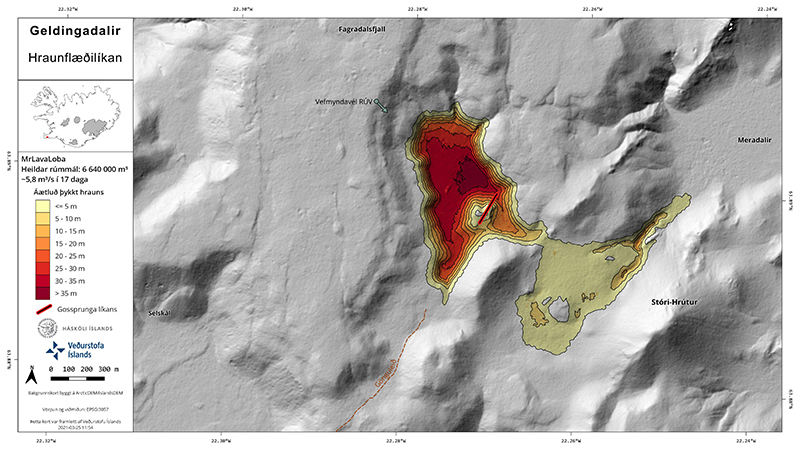 |
Figure 7. Initial map of the probable extent of the lava field in Geldingadalur at Krýsuvík 17 days after the start of the eruption. The effusion rate is about 5.8 m3/s. The colors represent the thickness of the lava flows from 5 m (light yellow) to 35 m (darkest red). The total volume of lava erupted according to this map is 6.6 million cubic meters. The red line represents the location of the fissure. The Geldingadalur valley is covered by the thickest lava flows (dark red) and the southern Meradalir valley is covered by the thinnest (light yellow). Created on 25 March 2021. Courtesy of IMO. |
According to the Institute of Earth Sciences, by 28 March activity was concentrated in two vents, referred to as the N and S vents. During the evening of 27-28 March a lava flow from the N vent continued to flow through a gap in the N crater wall, forming a broad river of lava that traveled W and then S toward the southernmost depression of Geldingadalur, near a hiking trail. The flow fed into a crusted-over tunnel in the N part of the valley, gradually extending N due to inflation. Little flow was observed in the S vent, but before midnight some lava began to effuse through a breach in the S rim. Spattering increased at the same time, and within 30 minutes the flow began to move S, splitting into E and W branches. The E stream soon stopped, but the W one continued to grow, almost merging with the flow from the N vent. Around 0100 a lateral outbreak to the W formed from the S vent and remained active through 0400. By 0430 a new flow from the S vent was moving roughly NW; within five minutes it had reached the N lava flow. Over the next few hours this flow built a well-confined channel that remained active into 28 March. Video data showed that on the morning of 28 March the N part of the largest cone along the fissure had collapsed. A DOAS transverse showed that the SO2 flux was 19 kg/s and the resulting plume drifted predominantly S; a gas-and-steam plume on 25 and 29 March rose to 1 km altitude. The total volume of erupted lava was 3-7 million cubic meters on 28 March. By 29 March the rate of extrusion had decreased slightly to 5.3 m3/s using the latest Pléiades image acquisition.
Activity during April 2021. Video and visitor photographs continued to show spattering, lava fountaining, and flows from both cones; the flows spread W and S in Geldingadalur. During 2 April the N vent had ejected some tephra to the E, forming a narrow deposit that covered part of the lava surface E of the vents and extending a few tens of meters up the slope, according to the Institute of Earth Sciences (figure 8). During the evening, the level of the lava pond at the N vent dropped by a few meters, though lava continued to feed into it (figure 9).
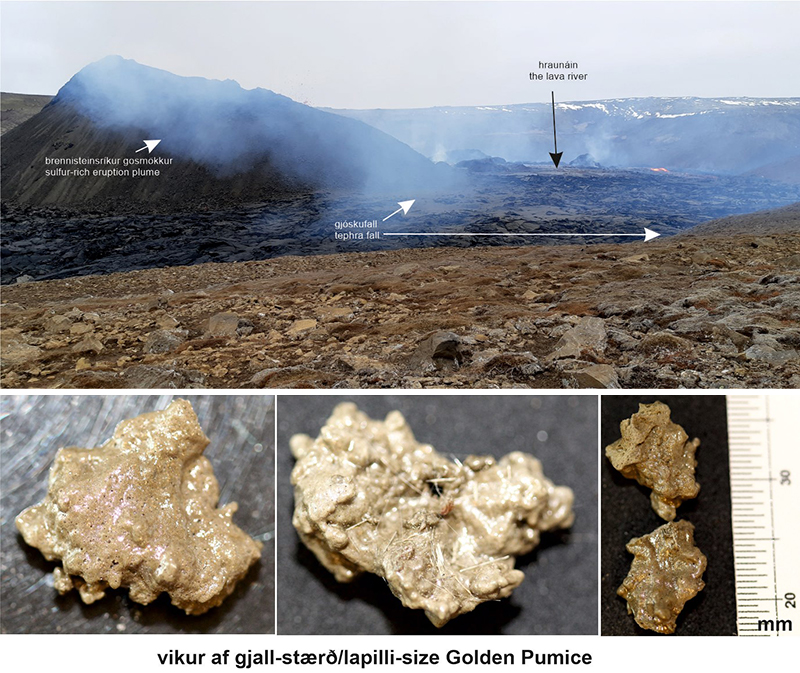 |
Figure 8. Photo of the eruption site at Krýsuvík with annotations (top photo) indicating the location of gas-and-steam emissions (left), a lava flow (back right), and tephra deposits E of the vent (center). Some of this tephra was composed of “golden pumice” (bottom photos) that scientists collected at the site. It also contains a significant amount of Pele’s hair, some of which measure up to 10 cm long. Photos courtesy of Ármann Höskuldsson and Thor Thordarson, University of Iceland. |
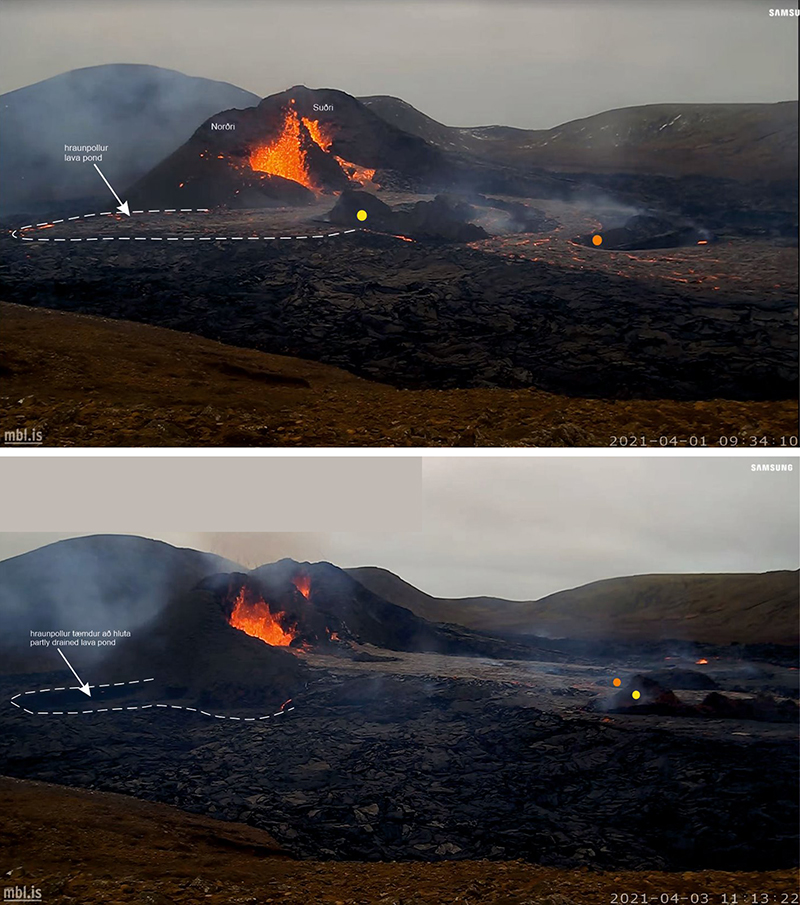 |
Figure 9. Comparison of webcam images showing the N (left) and S (right) vents at Krýsuvík taken on 1 (top) and 3 (bottom) April 2021. Spattering at both vents was accompanied by some gas-and-steam emissions. The white outline represents the rim of the lava pond, fed by the N vent. The S vent feeds a lava flow. The top image shows the outline of the lava pond before drainage, while the bottom image shows the changes in the pond after part of it had drained. Courtesy of the University of Iceland. |
Around 1137 on 15 April a new 100-200 m fissure (fissure two) opened in Geldingadalur about 1 km NE of the first eruptive vents (figure 2). Another fissure opened just W of the one that activated at 1137, though it was smaller; its lava flows were traveling into Meradalir (figure 10). During a helicopter overflight, scientists observed a gas plume rising above the new fissure, as well as a 15-m-thick lava flow traveling E into the Meradalir valley (figure 11). At midnight during 6-7 April a third fissure opened between the other two active vents and began to effuse lava at an average rate of 4-5 m3/s, with flows moving S into Geldingadalur and NE toward Meradalir; all three fissures were oriented NE-SW (figure 10). An overflight in the afternoon of 7 April reported that the resulting lava fields from the three fissures intersected with each other, creating a single continuous field (figure 2). A fourth fissure was reported around 0300 on 10 April between the two most recent fissures (from 5 and 7 April) that activated five days earlier, according to IMO (figures 2 and 10).
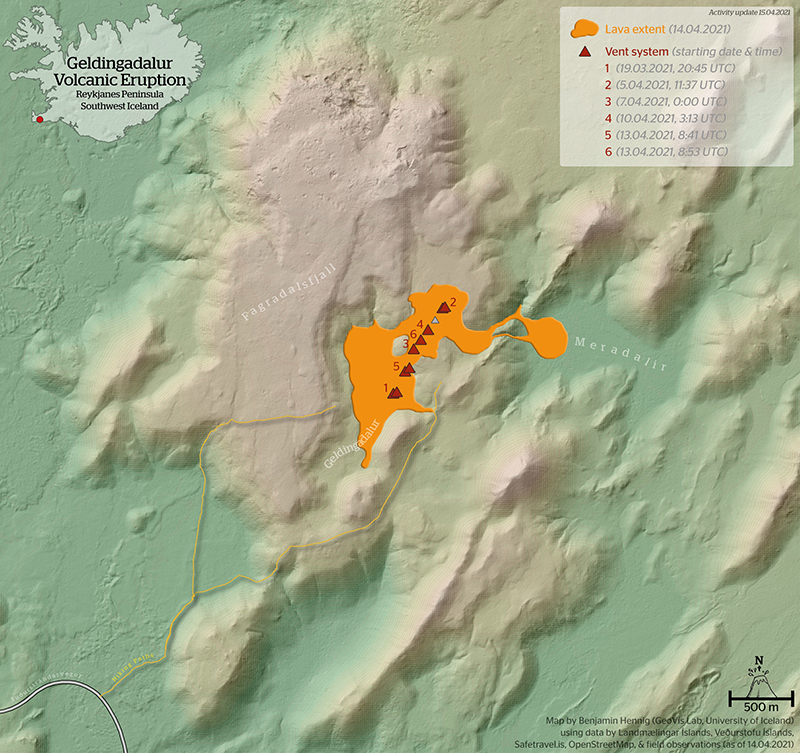 |
Figure 10. A map of the eruption area at Krýsuvík showing the location of the six active fissures (red triangles) and the direction of the lava flows (orange color) in the Geldingadalur and Meradalir valleys. Map was updated on 15 April 2021. Courtesy of Benjamin Hennig, University of Iceland. |
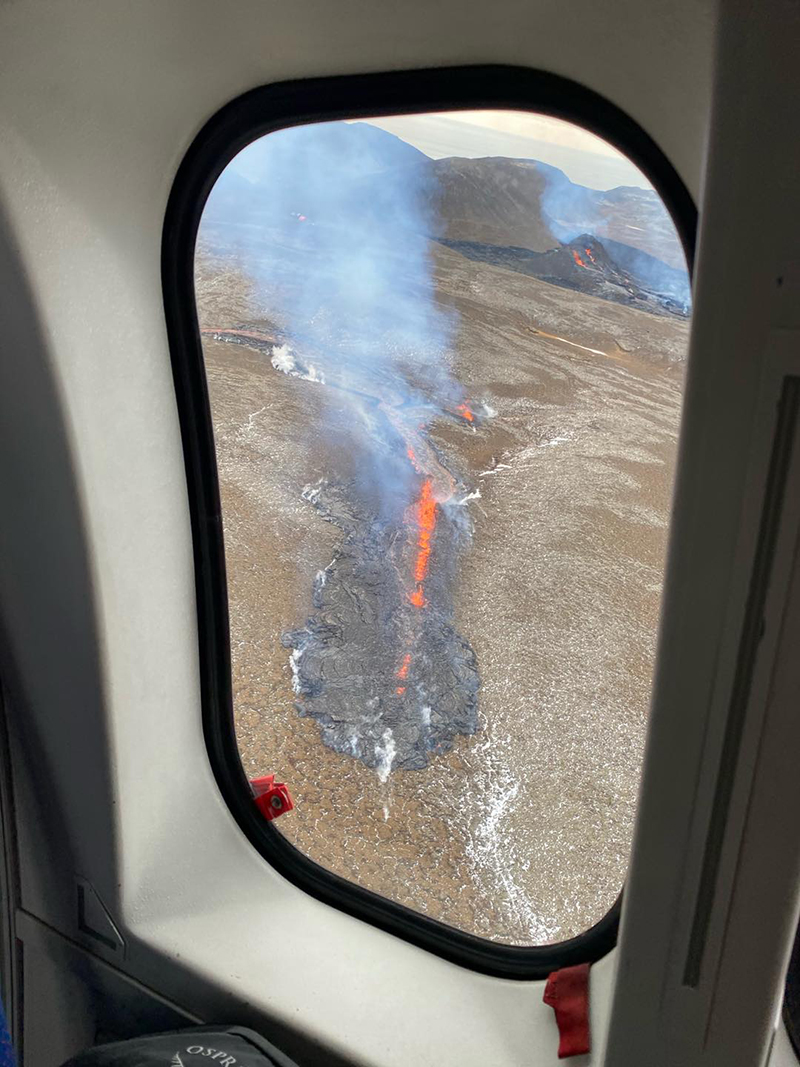 |
Figure 11. Photo of the new fissure that opened at Krýsuvík on 5 April 2021 taken during a helicopter overflight. The lava flow was accompanied by gas-and-steam emissions. Courtesy of the Icelandic Coast Guard. |
On 13 April at least two new fissures were detected by webcams on both sides of the 7 April fissure and on the E side of a lava branch that extended from the northernmost vents S into Geldingadalur. According to the University of Iceland, these two new vents opened between fissures three and four (figure 2). On 14 April one hiking trail was covered by lava. An update on 15 April noted that the greatest seismic activity was on the Reykjanes peninsula near Litla-Hrút (S of Keilir); minor deformation was observed in this area based on GPS and satellite data. Around 1500 on 17 April another small fissure opened on the lava field. The average effusion rate from all vents during 12-18 April was 8 m3/s, slightly higher than the previous measurements.
According to aerial photos of the first fissure vent showing 18-20 April, no active lava was visible. By 19 April the area of the lava flow field was 0.9 km2 with a total erupted volume of 14.4 million cubic meters. IMO generate several graphs to track the changes in the area of the lava flow field, the volume of erupted lava, and the rate of lava effusion through 23 April (figure 12). On 26 April at 2030 activity increased from fissure 5 at the southernmost vent that had been active since 13 April; lava fountains became more explosive and ejected material 40-50 high (figure 13). The lava effusion rate increased, and flows traveled S then E into the Meradalir valley. By 29 April activity at most cones had stopped but intensified at the fifth cone; lava fountains reached 250 m high. At 2031 a small surface breakout appeared near the top of the lava flow extending toward Meradalir. By 1 May the lava flows moving N in Meradalir had intersected flows that had previously descended into the valley from the fifth fissure (5 April).
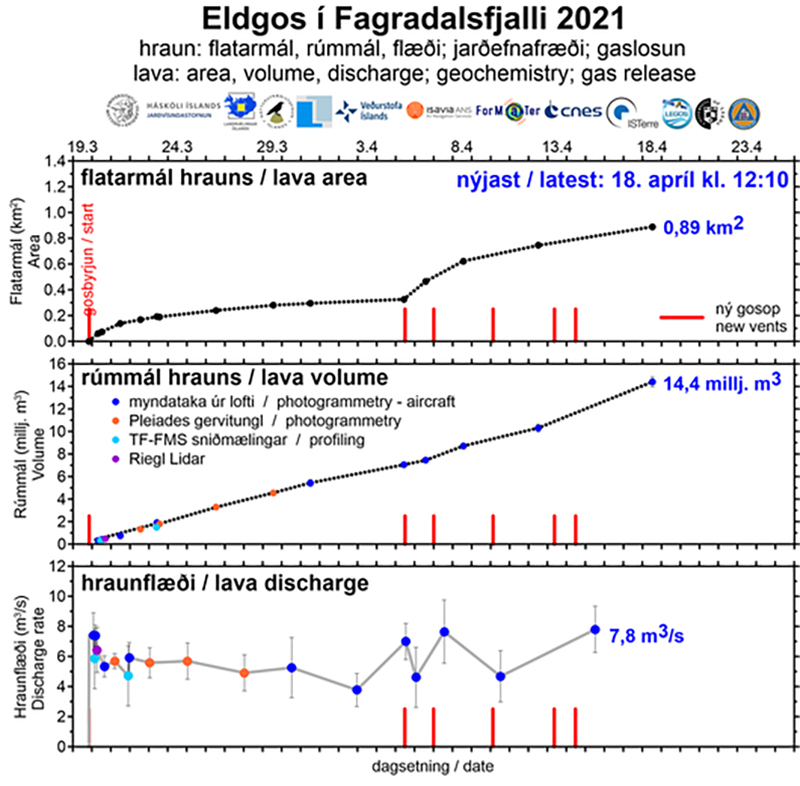 |
Figure 12. Graphs showing the evolution of the area (top), volume (middle) of lava, and rate of effusion (bottom) from 19 March through 23 April 2021 at Krýsuvík. By 18 April the area of lava was 0.89 km2, the volume of erupted lava was 14.4 million cubic meters, and the effusion rate was 7.8 m3/s. Courtesy of IMO. |
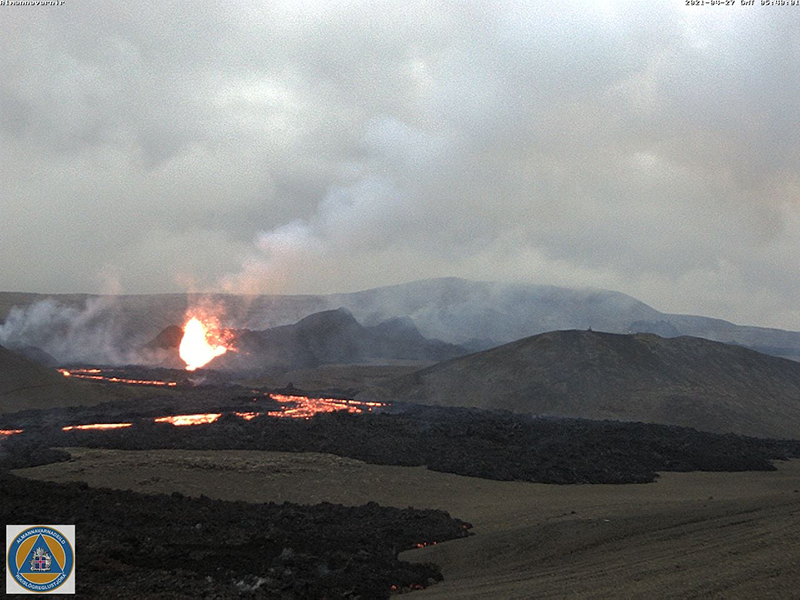 |
Figure 13. Webcam image of fissure 5 at Krýsuvík on 27 April 2021 showing spattering and lava fountains that rose 40-50 m high. Lava flows traveled SE toward the Meradalir valley. The image is taken from a viewpoint in the Meradalir valley. Courtesy of the University of Iceland. |
Satellite data. The NASA Global Sulfur Dioxide page, using data from the TROPOMI instrument on the Sentinel-5P satellite, showed persistent sulfur dioxide plumes during 25-27 and 30 April (figure 14). These plumes exceeded 2 DUs (Dobson Units) according to the satellite data. Beginning in mid-March, MIROVA detected strong and frequent thermal anomalies that continued through April due to the lava flows. On clear weather days, these thermal anomalies were visible in Sentinel-2 infrared satellite imagery (figure 15).
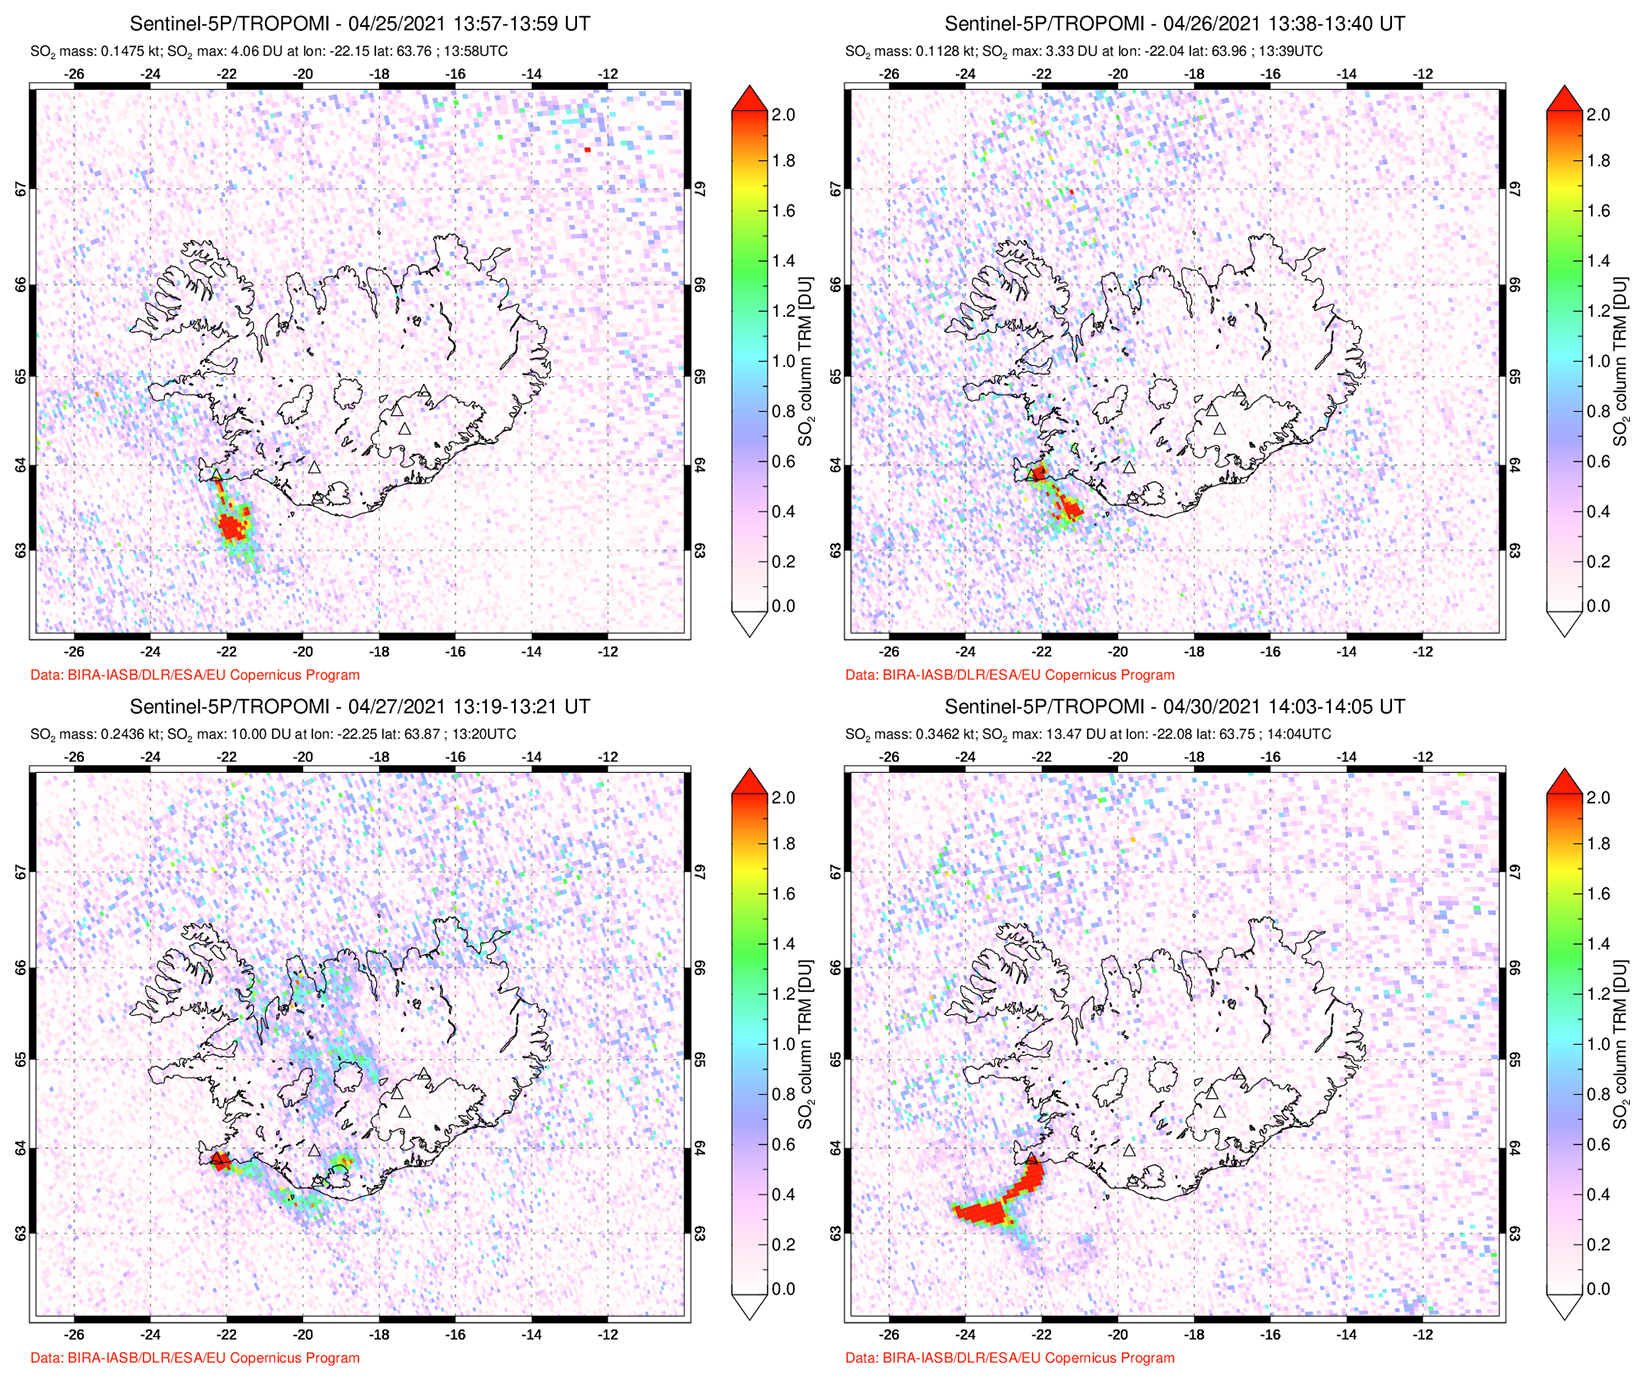 |
Figure 14. Near-continuous sulfur dioxide plumes were detected above Krýsuvík based on data from the TROPOMI instrument on the Sentinel-5P satellite for four days in April 2021. Plumes drifted SE on 25-26 April (top left and right) 2021, E on 27 April (bottom left), and SW on 30 April (bottom right). Courtesy of the NASA Global Sulfur Dioxide Monitoring Page. |
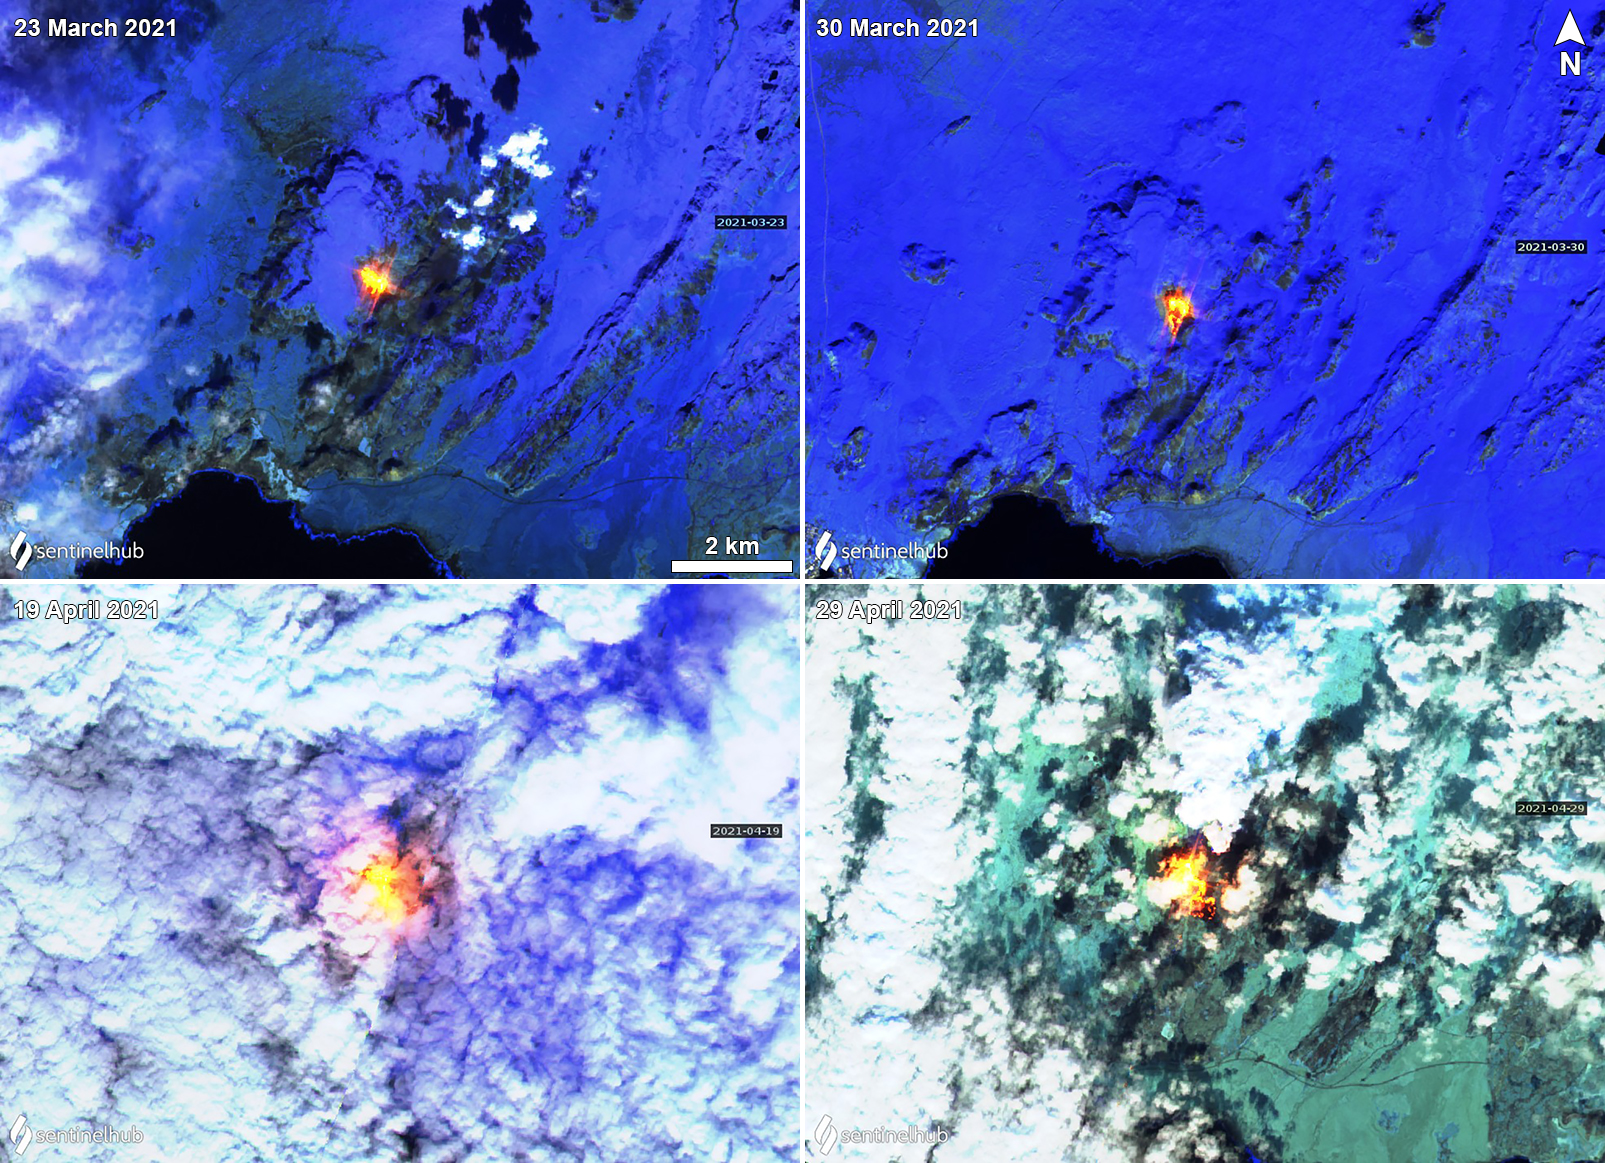 |
Figure 15. Sentinel-2 infrared satellite images show a strong thermal anomaly in the Krýsuvík-Trölladyngja volcanic system on 23 (top left) and 30 (top right) March and 19 (bottom left) and 29 (bottom right) April 2021. During 19 and 29 April, clouds obscured most of the field, but strong thermal activity was still visible. Sentinel-2 satellite images with “Atmospheric penetration” (bands 12, 11, 8A) rendering. Courtesy of Sentinel Hub Playground. |
Geological Summary. Although the Fagradalsfjall fissure swarm has previously been considered a split or secondary swarm of the Krýsuvík–Trölladyngja volcanic system, as of September 2022 Icelandic volcanologists managing the Catalogue of Icelandic Volcanoes made the decision to identify it as a distinct separate system. The recent eruptions and related reports have been reassigned here, and other content will be prepared and adjusted as appropriate.
Information Contacts: Icelandic Meteorological Office (IMO), Bústaðavegur 7-9 105 Reykjavík, Iceland (URL: http://en.vedur.is/); Institute of Earth Sciences, Sturlugata 7 101 Reykjavík, Iceland (URL: http://www.earthice.hi.is/); Icelandic National Broadcasting Service (RUV), Efstaleiti 1 150 Rekyjavík, Iceland (URL: http://www.ruv.is/); University of Iceland, Volcanology and Natural Hazard Group, Askja, Sturlugötu 7 101 Reykjavík, Iceland (URL: https://www.hi.is/); Icelandic Coast Guard, Skógarhlío 14 105 Reykjavík, Iceland (URL: www.lhg.is, https://www.facebook.com/Landhelgisgaeslan/); NASA Global Sulfur Dioxide Monitoring Page, Atmospheric Chemistry and Dynamics Laboratory, NASA Goddard Space Flight Center (NASA/GSFC), 8800 Greenbelt Road, Goddard, Maryland, USA (URL: https://so2.gsfc.nasa.gov/); Sentinel Hub Playground (URL: https://www.sentinel-hub.com/explore/sentinel-playground); Benjamin Hennig, University of Iceland, Sæmundargata 2 102 Reykjavík (URL: https://english.hi.is/staff/ben, https://geoviews.net/).