Wolf
Ecuador
0.02°N, 91.35°W; summit elev. 1710 m
All times are local (unless otherwise noted)
The first known observed eruption in the Galapagos occurred at Volcán Wolf on Isabela Island in August of 1797. Basaltic lava flows have occurred within the summit crater and on the flanks a few times each century since then. The most recent eruptions in 1982 (SEAN 07:08) and 2015 (BGVN 41:10) produced lava fountains and flows within the crater and on the flanks. A new eruption beginning on 7 January 2022 produced a large SO2 plume, a small amount of ash, and lava flows on the SE flank that lasted through April 2022. Details of the 2022 eruption are provided with information primarily from the Geophysical Institute of the National Polytechnic School (IG-EPN) in Quito, Ecuador. IG maintains a broadband seismic network and a DOAS (Differential Optical Absorption Spectrometer) SO2 monitoring station on the islands that transmits data to the mainland. The Washington Volcanic Ash Advisory Center (VAAC) is responsible for aviation warnings, and satellite data provide valuable remote thermal and SO2 information.
Summary of January-April 2022 eruption. The 6 January through 14 April 2022 eruption lasted longer than the eruptions in 1982 and 2015. The eruption began with a very large SO2 plume, a moderate-size ash plume, and multiple vents that produced lava flows. IG-EPN officials noted that the lava flows originated from an 8-km-long SE-flank radial fissure with at least five vents. The flows reached a maximum distance of about 18.5 km; they stopped 150-200 m from the coastline, covering an area of more than 30 km2.
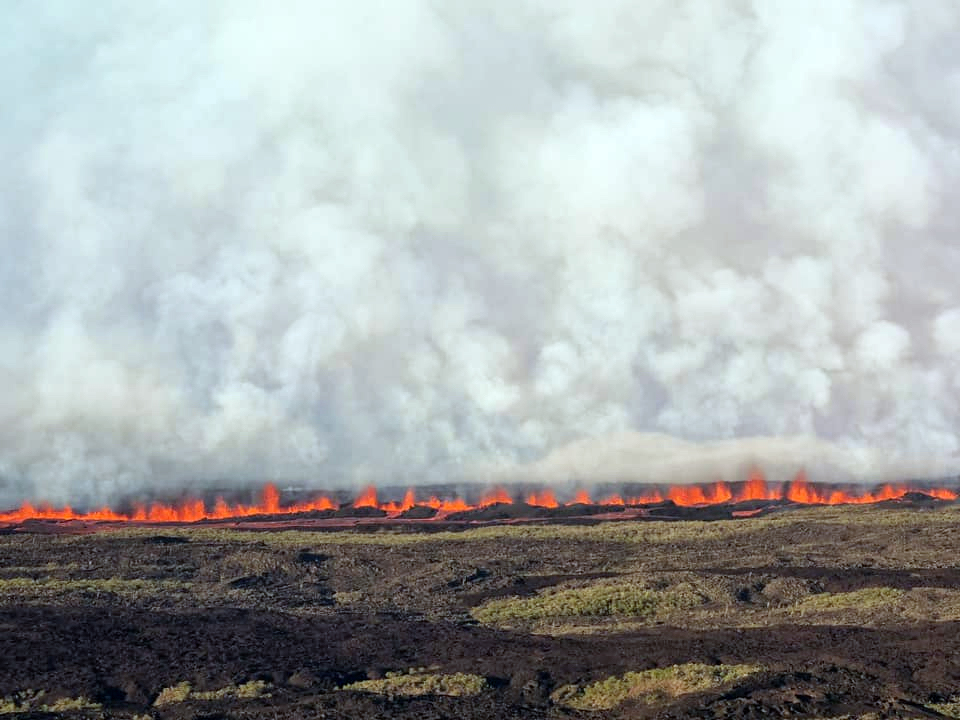
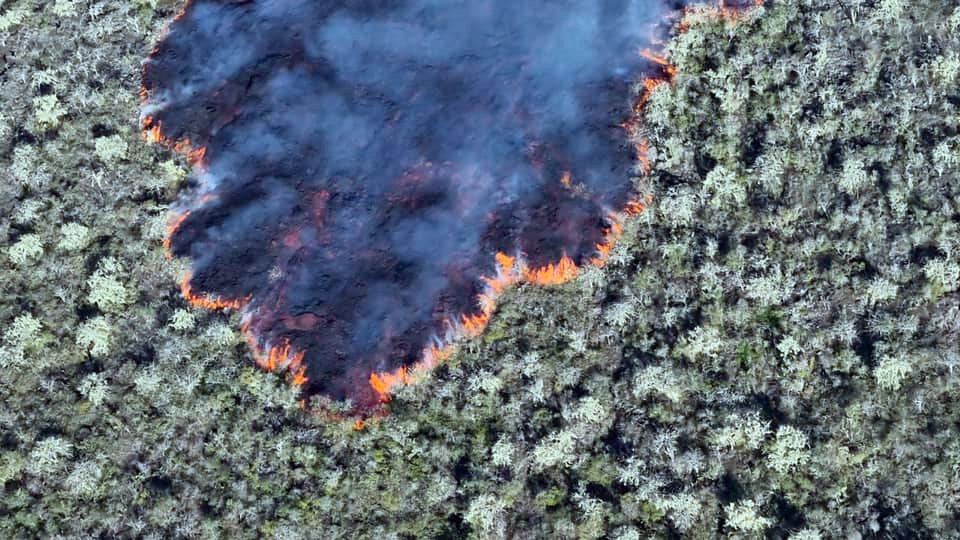
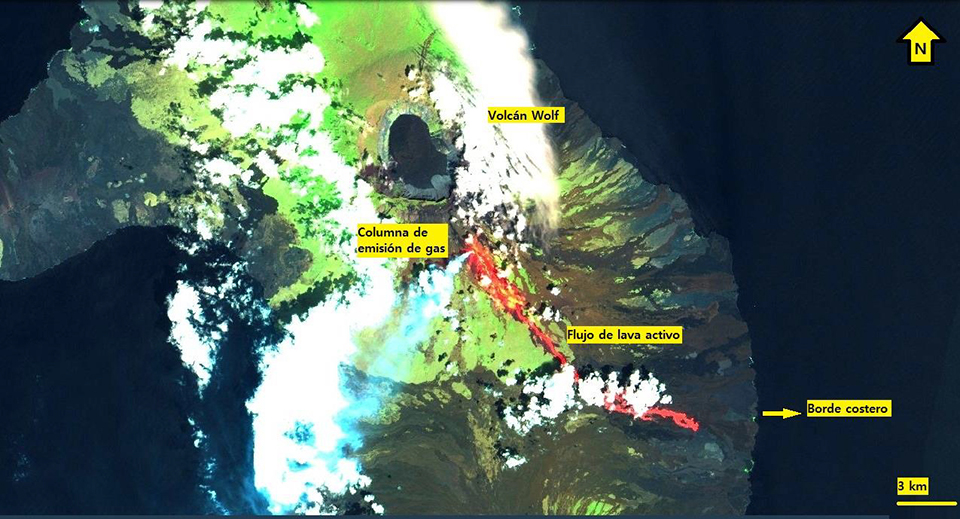
Description of January-April 2022 eruption. After seven years of no activity, a new eruption at Wolf was first reported shortly late on 6 January 2022, Galápagos time. Within the hour, a plume of gas and ash had reached 3.8 km altitude and drifted NE while a second plume drifted W at 1.9 km altitude. Lava flows were observed descending the SE flank. Seismicity had been detected at the FER1 station on Fernandina Island a few hours earlier that likely signaled the start of the eruption. Twenty-nine MODVOLC thermal alerts appeared on 7 January on the SE flank, confirming a significant thermal event from the lava flow. Rangers from Parque Nacional Galápagos reported that a fissure on the S flank was the source of the flow. They witnessed the flow descending the SE flank and burning vegetation (figures 12 and 13).
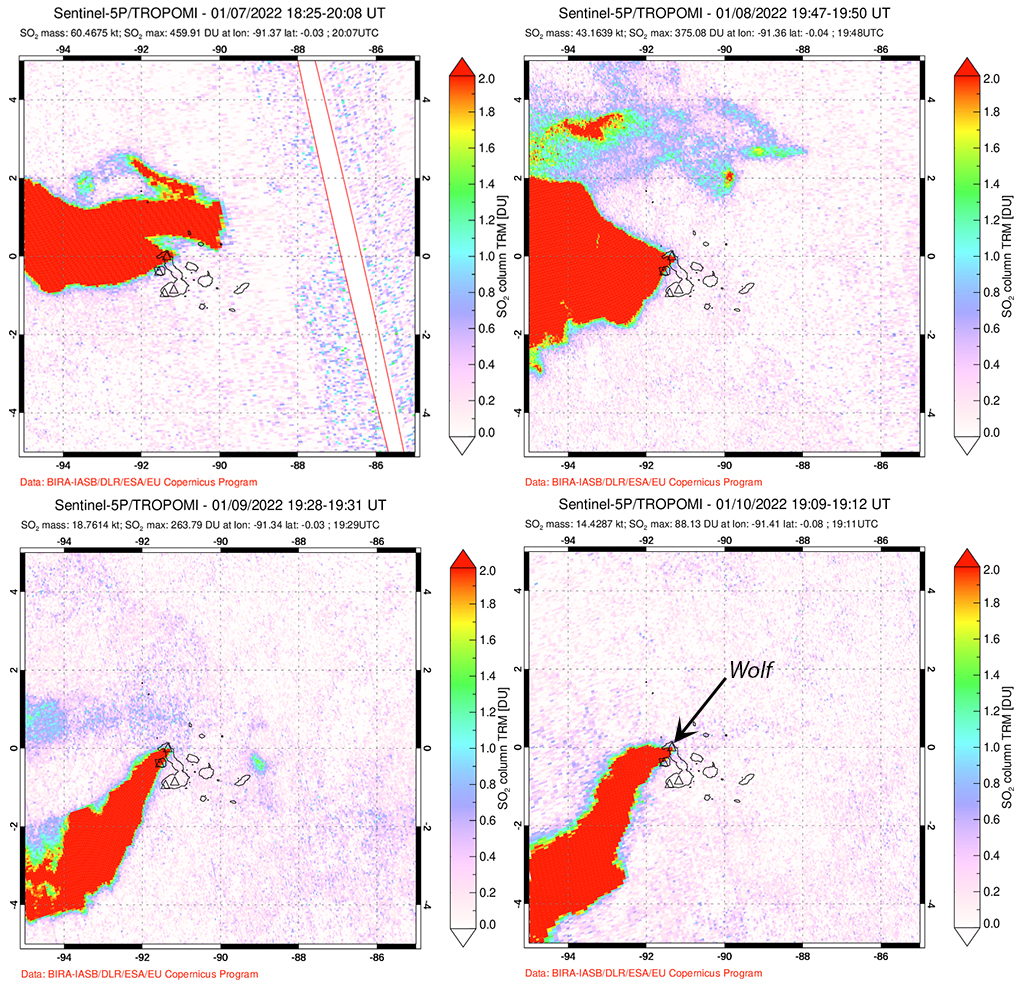
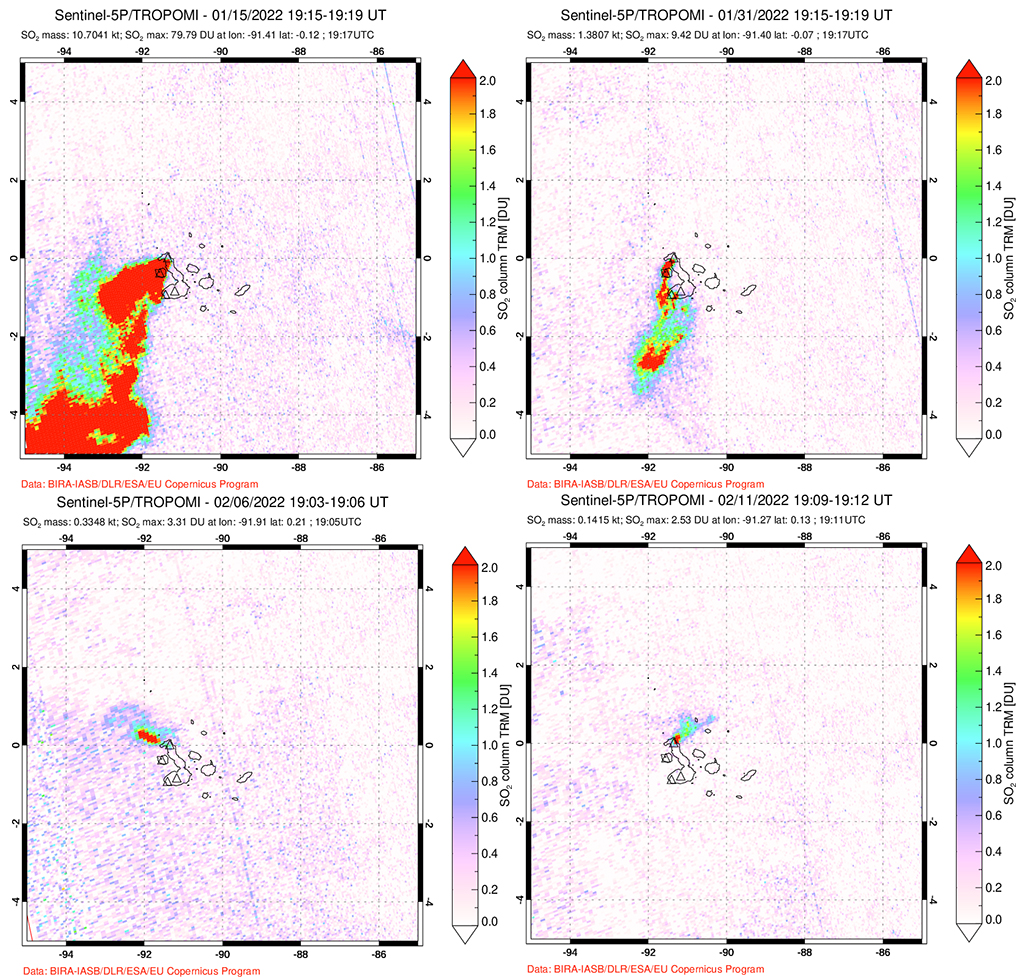
The Washington VAAC issued its first report of ash emissions on 7 January 2022; plumes initially rose to two altitudes: 3.7 km drifting W, and 5.6 km altitude drifting NE. Later the plumes dropped to 2.4 km drifting W and 4.6 km drifting NE. The plume drifting to the W extended over 80 km. The VAAC noted reports of a large SO2 plume later in the day reaching approximately 185 km W of the summit before dissipating. By the next day, they reported that emissions were primarily gas, drifting W at 1.3 km altitude. During 8-9 January gas emissions drifted SW at 700 m altitude. By 9 January, only an SO2 plume was reported moving SW from the summit, and no further ash advisories were issued. Sulfur dioxide degassing decreased substantially from 60 million tons measured on 7 January to 8 million tons measured on 12 January (figure 14).
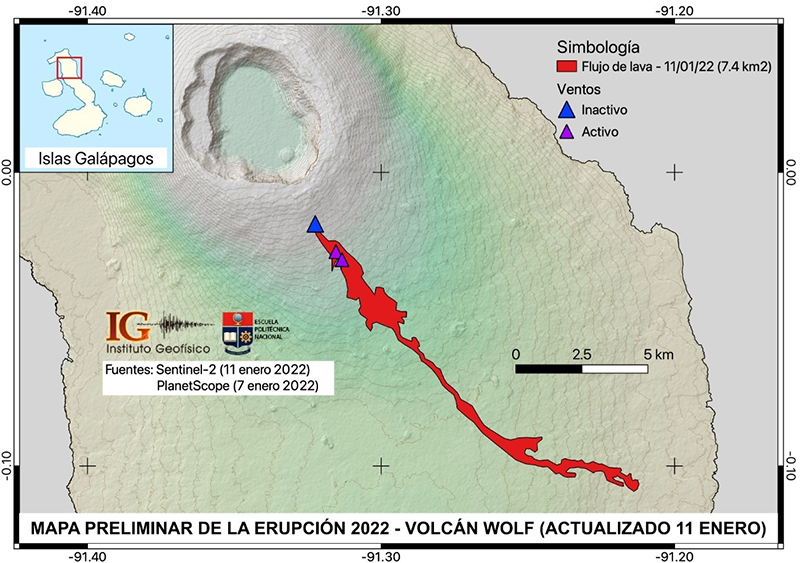
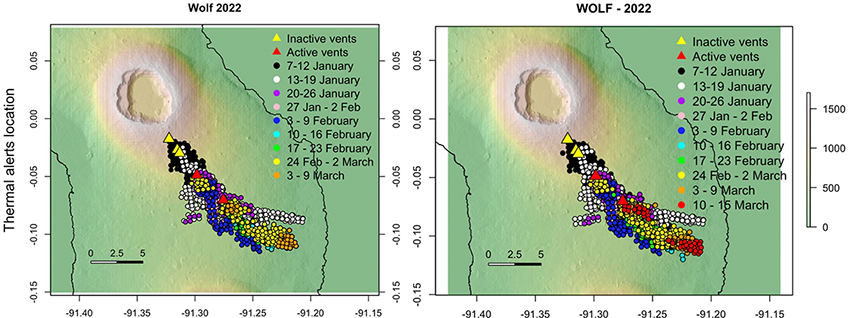
During a flyover on 11 January 2022, the Park Minister noted continuing volcanic activity, and that the flow had traveled about 15 km from its source on the SE flank. IG-EPN reported that the lava flow was emerging from at least three fissures. The initial fissure from 7 January was at 1,290 m elevation and the subsequent fissures were located at 1,090 m elevation. By 11 January the flow was about 3 km from the coast (figure 15). IG-EPN produced the first map of the 7.4 km2 flow on 12 January 2022 based on satellite data from 7 and 11 January (figure 16). The maximum length of the flow was estimated at 16.5 km from the initial vent, and 15 km from the two subsequent active fissures. The numbers of daily thermal alerts decreased steadily between 7 and 13 January, interpreted by IG-EPN as a decrease in the lava flow rate.
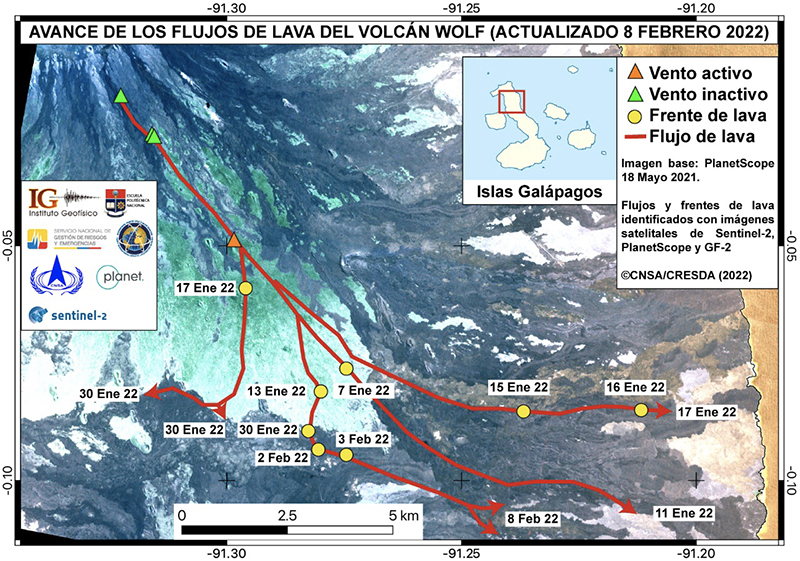
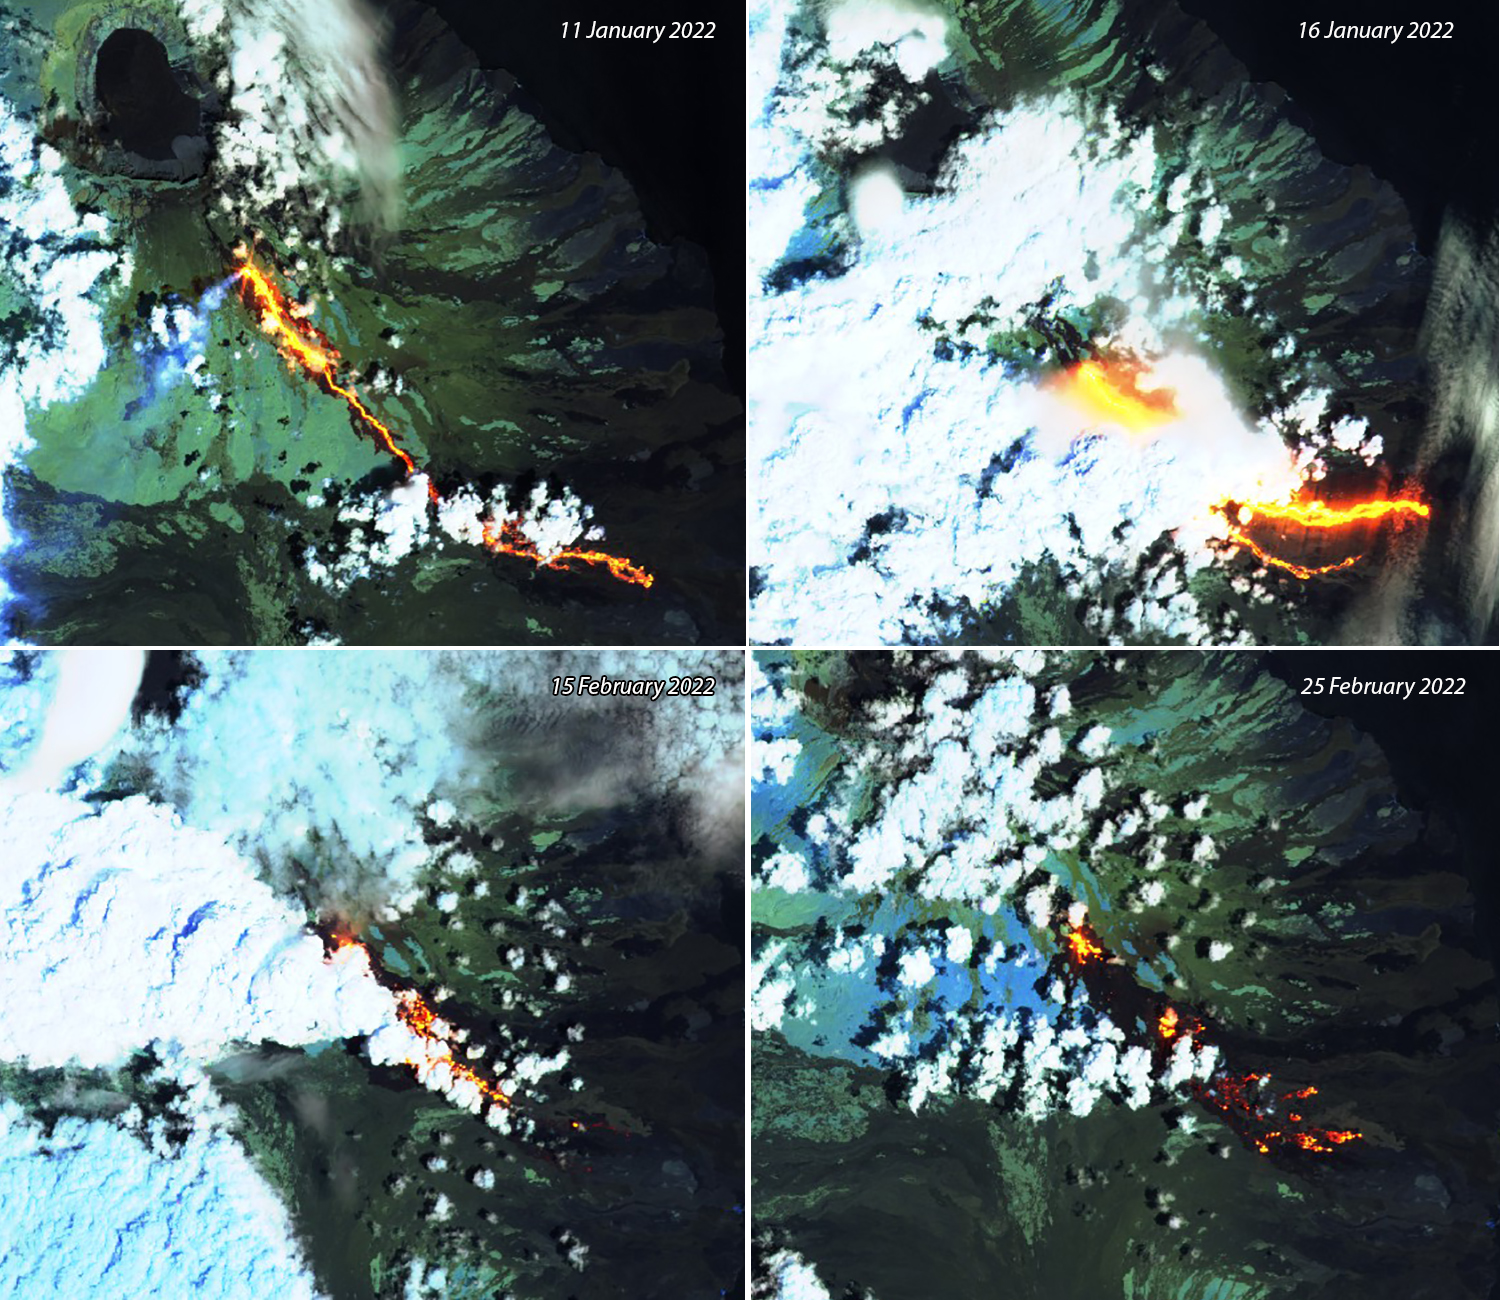
By 17 January the lava flow had advanced to slightly more than 2 km from the ocean. By early February the active vent was downslope from the original vents, and IG-EPN was able to map multiple flow fronts on the S and SE flanks (figure 17). Multiple near-daily MODVOLC thermal alerts continued throughout February, with pulses of lava flow activity producing tens of alerts on some days. The lava flows remained active on the SE flank, slowly advancing towards the coast; satellite imagery helped IG-EPN scientists to map the track of the lava flow (figure 18).
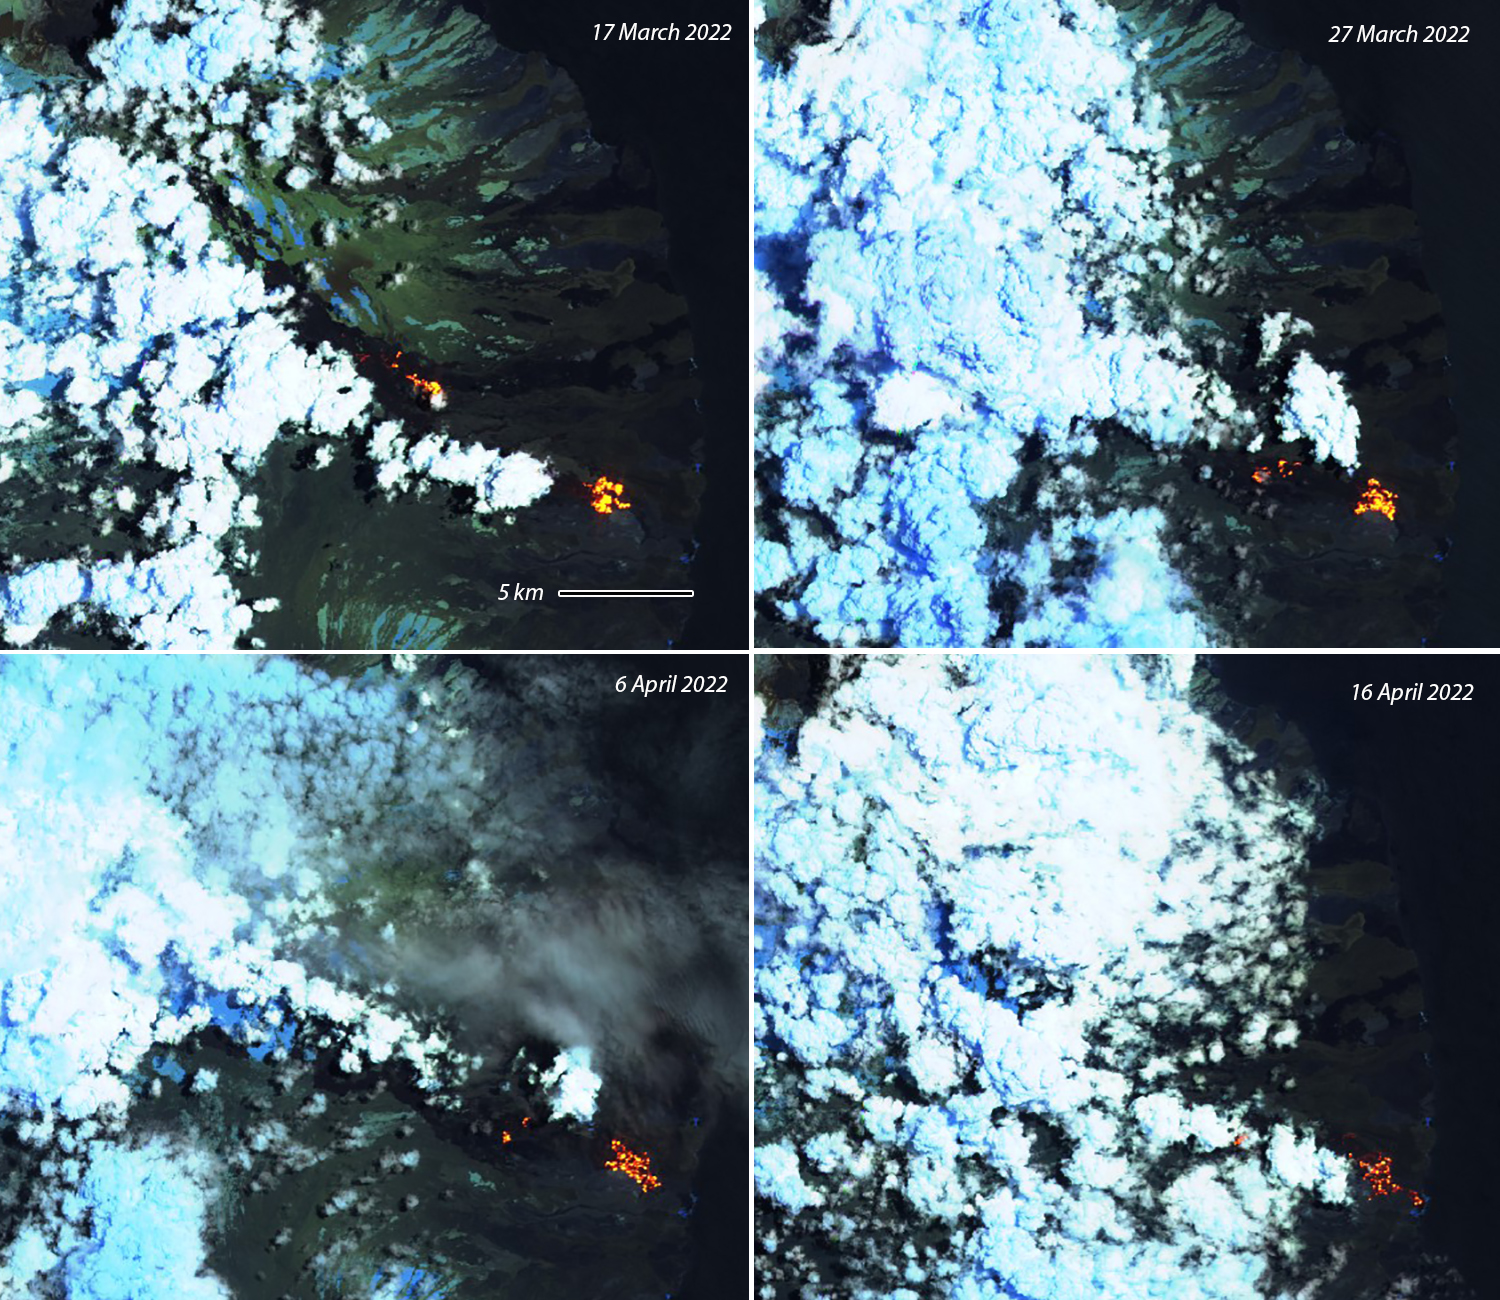
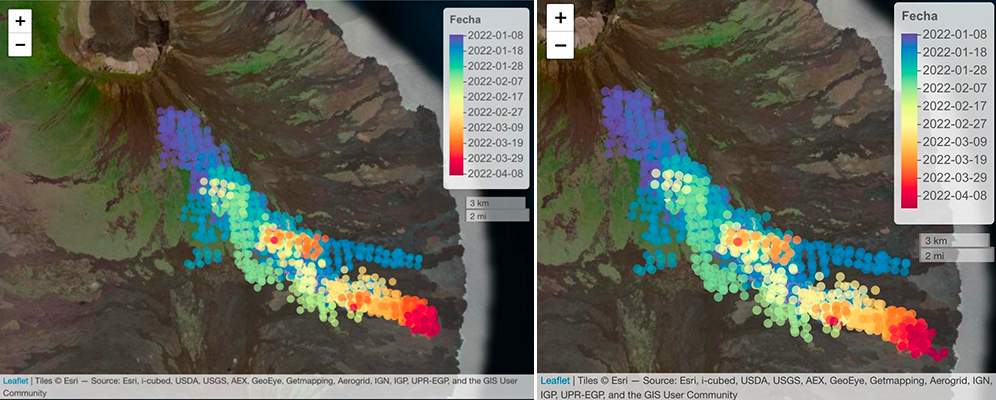
Lava flows remained active on the SE flank throughout March 2022; IG-EPN scientists used the location of the FIRMS thermal anomalies to map the active areas of the flow over time (figure 19). By the end of March, the number of daily thermal alerts had diminished significantly, suggesting a further decrease in the flow rate. Parque Nacional Galápagos personnel reported at the end of March that lava flow activity continued on the SE flank but had not reached the ocean. Multiple hot spots in satellite images suggested that lava was flowing through tubes that were visible to the park rangers patrolling the coast.
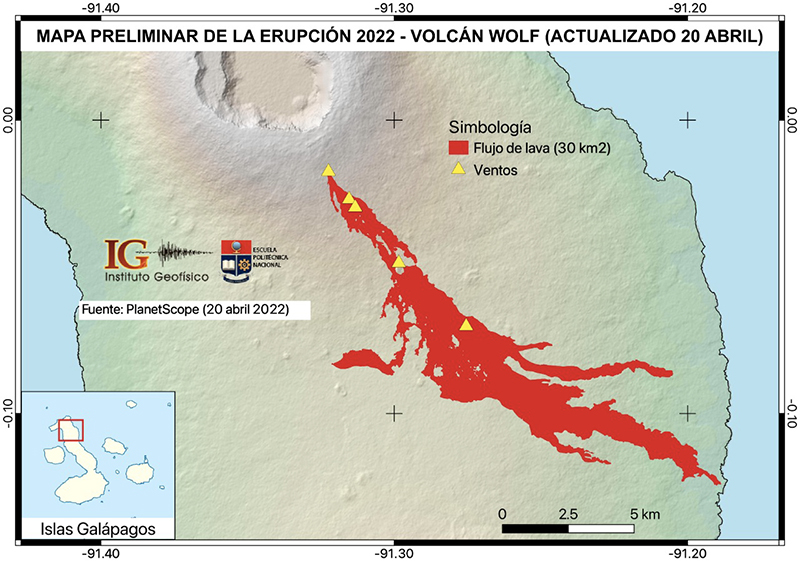
MODVOLC thermal alerts were issued on 13 days during April 2022, with the number of daily alerts significantly fewer than previous months since January. Thermal anomalies continued to be present in satellite imagery through 21 April, and then briefly on 29 and 30 April (figure 20). IG-EPN scientists plotted the advance of the flow as the location of thermal alerts on a satellite image base several times during April; no advance was detectible after 14 April (figure 21). No surface activity was observed after 21 April. An updated map of the lava flow was published on 20 April 2022 (figure 22). Single MODVOLC thermal alerts were issued on 3 and 7 May, and two alerts on 16 May were the last recorded for the eruption.
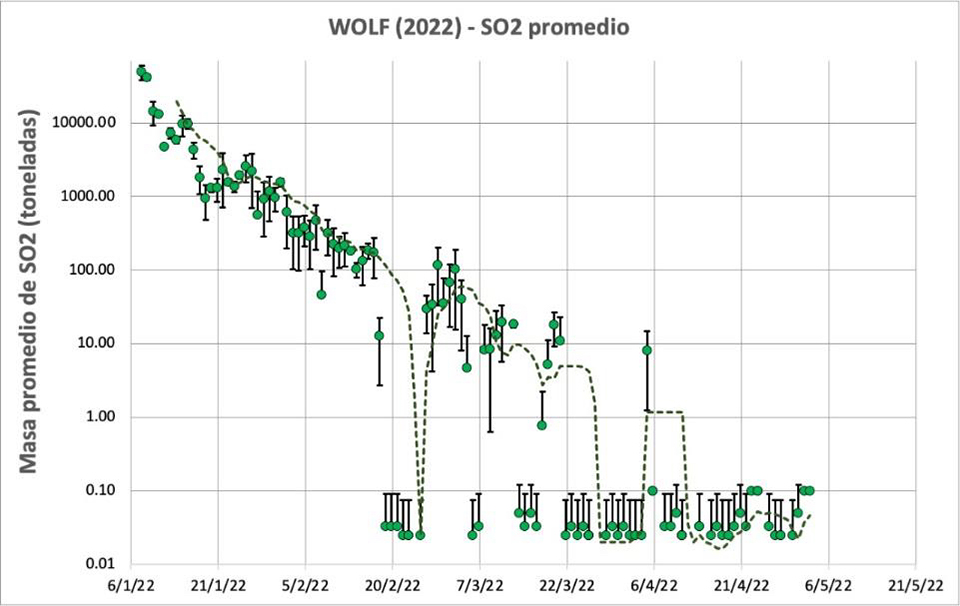
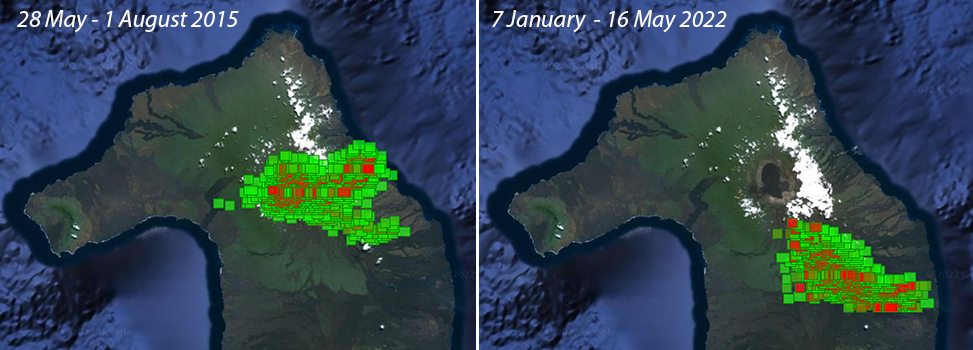
Eruption review using satellite data. Sulfur dioxide emissions that were initially as high as 60 kilotons, gradually tapered off during January and none were recorded in satellite data after early February (figure 23); they decreased steadily throughout the period and ended in early April (figure 24). Hundreds of thermal alerts from satellite data created rough maps of the 2015 and 2022 flow areas showing the difference in their relative locations. The 2015 flow started on the crater rim and flowed both into the crater and down the E flank and into the ocean, while the 2022 flow started about 1.5 km down the SE flank from the caldera rim and stopped a few hundred meters from the coastline (figure 25).
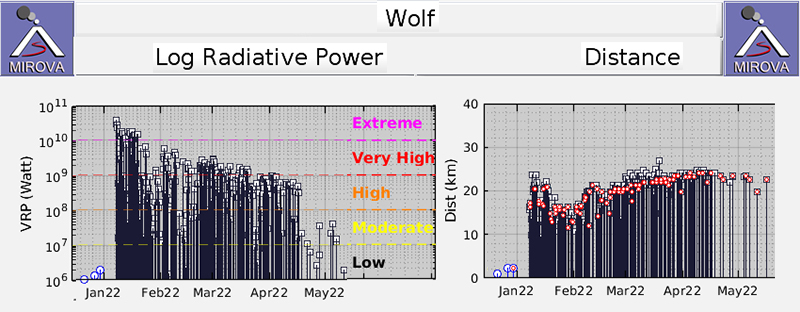
The MIROVA Log Radiative Power graph of MODIS data shows the onset of the eruption in early January 2022 with high levels of heat initially, followed by a period with more fluctuations, and then a period of gradual decrease through mid-April 2022 before dropping off quickly to low levels (figure 26). The MIROVA distance graph based on the central caldera location shows how the lava flow initially quickly extended 10 km beyond SE-flank vent location, was then restricted to higher on the flank, and then gradually moved farther away over time.
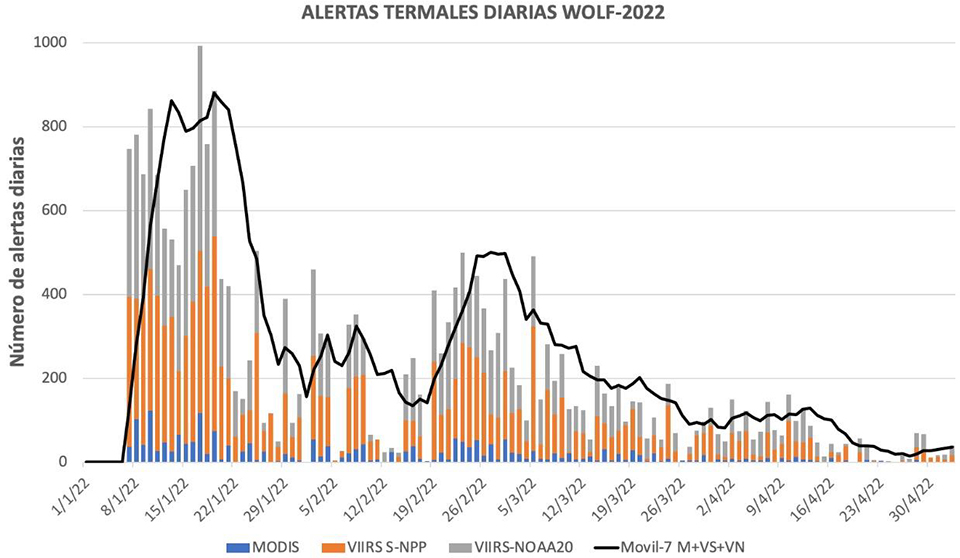
IG-EPN scientists plotted the hundreds of daily thermal alerts recorded by different satellite sensors such as MODIS (Moderate Resolution Imaging Spectroradiometer) and VIIRS (Visible Infrared Imaging Radiometer Suite), which are processed by different platforms (e.g., MIROVA , FIRMS, WORLDVIEW). The plot indicated a decreasing trend in thermal alerts, in both quantity and intensity from the beginning of the eruption in early January 2022 through the end of April (figure 27). This decrease reflected the decline in the rate of lava emission, as well as the progressive cooling of the lava flows.
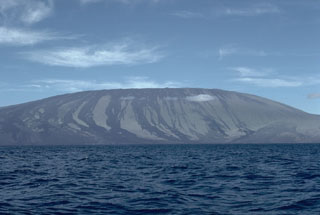
Geological Summary. Volcán Wolf, the highest volcano of the Galápagos Islands, straddles the equator at the north end of the archipelago's largest island, Isabela. The edifice has steeper slopes than most other Isabela volcanoes, reaching angles up to 35°. The summit caldera is 6 x 7 km across and 700 m deep. A prominent bench on the west side of the caldera rises 450 m above the caldera floor, much of which is covered by a lava flow erupted in 1982. Radial fissures concentrated along diffuse rift zones extend down the N, NW, and SE flanks, and submarine vents lie beyond the N and NW fissures. Similar unvegetated flows originating from a circumferential chain of spatter and scoria cones on the eastern caldera rim drape the forested flanks to the sea. The proportion of aa lava flows exceeds that of other Galápagos volcanoes. An eruption in in 1797 was the first observed and documented in the Galápagos Islands.
Information Contacts: Instituto Geofísico, Escuela Politécnica Nacional (IG-EPN), Casilla 17-01-2759, Quito, Ecuador (URL: http://www.igepn.edu.ec/); Parque Nacional Galápagos (URL: https://galapagos.gob.ec/noticias/, https://www.facebook.com/parquegalapagos/posts/290645263104217); Hawai'i Institute of Geophysics and Planetology (HIGP) - MODVOLC Thermal Alerts System, School of Ocean and Earth Science and Technology (SOEST), Univ. of Hawai'i, 2525 Correa Road, Honolulu, HI 96822, USA (URL: http://modis.higp.hawaii.edu/); MIROVA (Middle InfraRed Observation of Volcanic Activity), a collaborative project between the Universities of Turin and Florence (Italy) supported by the Centre for Volcanic Risk of the Italian Civil Protection Department (URL: http://www.mirovaweb.it/); Sentinel Hub Playground (URL: https://www.sentinel-hub.com/explore/sentinel-playground); NASA Global Sulfur Dioxide Monitoring Page, Atmospheric Chemistry and Dynamics Laboratory, NASA Goddard Space Flight Center (NASA/GSFC), 8800 Greenbelt Road, Goddard MD 20771, USA (URL: https://so2.gsfc.nasa.gov/); Washington Volcanic Ash Advisory Center (VAAC), Satellite Analysis Branch (SAB), NOAA/NESDIS OSPO, NOAA Science Center Room 401, 5200 Auth Rd, Camp Springs, MD 20746, USA (URL: www.ospo.noaa.gov/Products/atmosphere/vaac, archive at: http://www.ssd.noaa.gov/VAAC/archive.html).