Report on Mauna Loa (United States) — March 1984
Scientific Event Alert Network Bulletin, vol. 9, no. 3 (March 1984)
Managing Editor: Lindsay McClelland.
Mauna Loa (United States) Fissure eruption produces voluminous lava flows from NE rift vents; SO2-rich tropospheric plume reduces visibilities 7,000 km away
Please cite this report as:
Global Volcanism Program, 1984. Report on Mauna Loa (United States) (McClelland, L., ed.). Scientific Event Alert Network Bulletin, 9:3. Smithsonian Institution. https://doi.org/10.5479/si.GVP.SEAN198403-332020
Mauna Loa
United States
19.475°N, 155.608°W; summit elev. 4170 m
All times are local (unless otherwise noted)
The following (except for the plume data) is from HVO. Times noted below are preliminary and subject to slight revision after later analysis. "A long-expected flank eruption of Mauna Loa began on 25 March, and had ended by 14 April.
Background. "When summit seismic activity increased sharply in April 1974, Mauna Loa had not erupted since June 1950. Measurement of EDM lines across the summit caldera (Mokuaweoweo) in the summer of 1974 revealed significant extensions, monitoring capabilities were increased, and a forecast of renewed activity was issued (Koyanagi and others, 1975). The summit eruption of 5-6 July, 1975 lasted for less than 20 hours, and only about 30 x 106 m3 of lava were erupted. The eruption was identical to numerous other Mauna Loa summit eruptions that had been followed within 3 years by large flank eruptions. Given the historic record and continuing inflation, a forecast was made for renewed eruptive activity sometime before the summer of 1978 (Lockwood and others, 1976). The 1976 forecast was rescinded in 1977 but slow inflation continued and another forecast (based on an increase in the rate of geodetic change and seismic activity) was issued in 1983. This called attention to the increased probability of a Mauna Loa eruption within the next two years' (Decker and others, 1983), but see SEAN 08:05 in which the forecast was more specific: 'a significantly increased probability of eruption of Mauna Loa during 1983 or 1984.'
Premonitory activity. "The 25 March outbreak gave almost no short-term instrumental warning. Seismic activity had been increasing gradually through March (figure 2), but was relatively low immediately preceding the outbreak; only 29 microearthquakes were recorded beneath the summit caldera during the preceding 24 hours (in contrast to 700 microearthquakes/day in September 1983).
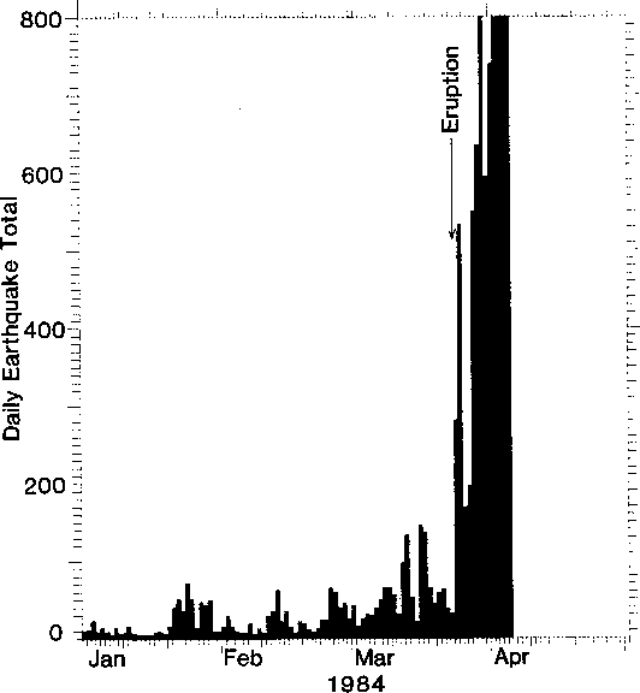 |
Figure 2. Number of earthquakes per day at Mauna Loa, 1 January-5 April. The start of the eruption is indicated by an arrow. |
"Several people saw probable fume clouds from the summit caldera and a camper at the summit noted small explosions from the 1975 eruptive fissures on 23 March. One hiker had reported seeing 'glowing cracks' near the 1940 cone on 18 March, but no anomalous activity was detected on a thermal probe in the 1975 fumaroles. Oxidation state and temperatures of fumarolic gases remained essentially unchanged prior to the last satellite transmission about midnight on 24 March.
Eruption narrative. "At 2255 on 24 March, a small earthquake swarm began directly beneath the summit. Weak harmonic tremor with an amplitude of about 1 mm was recorded at the summit station (WIL, figure 3) at 2330. The number of small summit earthquakes increased at 2350. Tremor amplitude recorded at the summit increased to about 5 mm at 0015 on 25 March, remained high at 0051, and was recorded on all Mauna Loa and Kīlauea summit area stations.
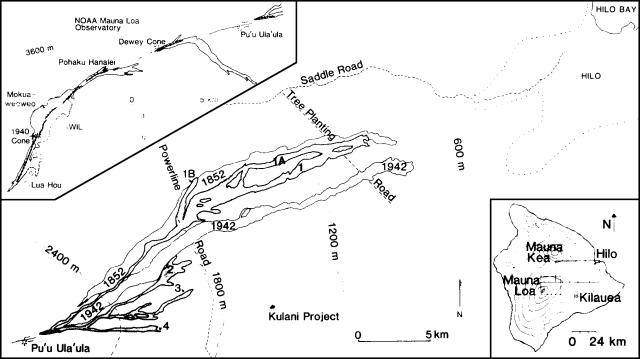 |
Figure 3. Sketch maps of the NE rift zone and summit of Mauna Loa, showing positions of 1984 lava flows (stippled) as of 5 April. Eruption fissures are indicated by hachured lines. The edge of the suburbs of Hilo is shown by a dotted line on the NE rift zone map. The areas covered are shown by the index map (inset). |
"At 0055 a magnitude 4.0 earthquake beneath the summit awoke geologists (from the University of Massachusetts) camped at Pu'u Ula'ula on the NE Rift Zone. At 0056, the telescope at the summit of Mauna Kea (42 km NNW of Mauna Loa) began high-amplitude oscillation, preventing astronomical observations for the next few hours. Between 0051 and 0210, 11 earthquakes with magnitudes between 2.0 and 4.1 were recorded beneath the summit. At 0100 borehole tiltmeters recorded the onset of rapid summit inflation.
"A military satellite detected a strong infrared signal from the summit at 0125. Glow was sighted in the SW portion (1940 cone area) of the summit caldera by an observer on the summit of Mauna Kea at 0129, by the geologists at Pu'u Ula'ula at 0130, and from Kīlauea at 0140. At 0146, fountain reflection on fume clouds observed from HVO suggested that fountaining extended across much of SW Mokuaweoweo and was migrating down the SW Rift Zone.
"At 0232 the tops of fountains within Mokuaweoweo were seen from Pu`u Ula`ula, suggesting a height greater than 100 m. At approximately 0340, fountaining ceased on the SW Rift Zone. At 0357, 30-m-high fountains migrated out of Mokuaweoweo, down the upper NE Rift Zone. Lava flowed downrift and onto the SE flank.
"At approximately 0600, fountaining in the caldera gradually ended. At 0632, a new vent opened about 700 m E of Pohaku Hanalei and 8 minutes later another en echelon fissure began to erupt about 600 m downrift. Lava appearance was preceded by 3 minutes of copious white steam emission from the fissure. For the next 2.5 hours, activity waned.
"At 0905, profuse steaming appeared on a fracture at about 3,510 m altitude, and at 0910 fountaining 15-40 m high began at 3,410 m and migrated downrift. At 0930, fountains above Pohaku Hanalei died down as lava production increased to approximately 1-2 x 10⁶ m3/hour along a 2 km-long curtain of fire between about 3,400 and 3,470 m. The loci of most vigorous fountaining alternated along the 2-km fountain length. Much of the production from these vents was consumed by an open fissure parallel to and S of the principal fissure upslope, although an aa flow did move 5 km SE, S of an 1880 flow. During activity of these vents, episodic turbulent emissions of red and brown `dust' from the eruptive fissures sent clouds to about 500 m height. At 1030, steaming was noted along a 1-km-long crack system extending from about 3,260-3,170 m, but there was no further downrift migration of eruptive vents for several hours. At about 1550, ground cracking extended below 3,000 m, and at 1641 eruptive vents opened at about 2,800 m and migrated both up- and downrift. At 1830 an eruptive vent extended about 1.7 km from about 2,770-2,930 m elevation. Fountains to 50 m height fed fast-moving flows to the E and NE. Activity waned at the 3,400-m vents.
"By 0640 the next day, all lava production had ceased above 3000 m. Fountains (to 30 m height) were localized along a 500-m segment of the fissure that had opened the previous afternoon. The fastest moving flow cut the power line to the NOAA Mauna Loa Observatory shortly before dawn. At 0845, the E flows were spread out over a wide area above 1,900 m elevation, but their advance slowed during the day. Four principal eruptive vents then developed along this fissure system. Two vents fed the NE flow (1), while the other two fed the S (2-4) flows. Flow 1 steadily advanced downslope 27-28 March (figure 4), between the 1852 and 1942 lava flows. Approximately 80% of the lava production fed flow 1. Flows 2-4 ceased significant advance by 28 March. The terminus of flow 1 stopped significant advance by early 29 March, while production at the vents remained essentially constant. This suggested that a new branch flow had developed upslope. Bad weather prevented confirmation of the new branch until 30 March. This new flow (1A) moved rapidly downslope, N of flow 1.
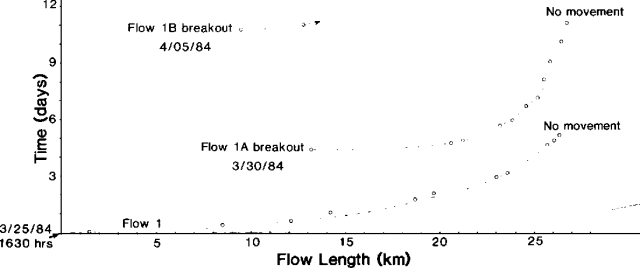 |
Figure 4. Rates of movement of flows 1, 1A, and 1B in kilometers per day. Small circles represnet observations of flow positions. Courtesy of J.P. Lockwood. |
"Phase 17 of Kīlauea's E Rift Zone eruption began that morning but had no apparent effect on Mauna Loa activity. Likewise Kīlauea tilt showed no deflection at the time of the Mauna Loa outbreak on 25 March.
"Flow 1A slowed on 31 March as the feeding channel became sluggish, and the flow thickened and widened upstream. At 1215 on 5 April, the flow was moving very slowly (18 m/hour) slightly below 900 m elevation. A major overflow at about 2,000 m shut off most of its lava supply and created a fast-moving flow (lB), which advanced 3 km NE to about 1,800 m elevation by 1700.
Deformation. "Much of the NE rift zone geodetic monitoring network was measured shortly before the 25 March outbreak, and EDM, tilt, and gravity stations were re-measured several times during the eruption. Although continuously recording tiltmeters at the summit showed sharp inflation (dike emplacement) immediately preceding the outbreak, major subsidence of the summit region accompanied eruptive activity along the NE rift. The center of subsidence, near the S edge of the summit caldera (figure 5), was coincident with the center of uplift identified from repeated geodetic surveys between 1977 and 1983. The amount of summit deflation recorded by tilt and horizontal distance measurements exceeded the amount of gradual inflation of the volcano since the July 1975 summit eruption, suggesting substantial injection of magma into the summit area prior to this eruption, and possibly prior to the first EDM line across the summit caldera in 1964. Maximum vertical elevation change, inferred from repeated gravity measurements, is 500 mm.
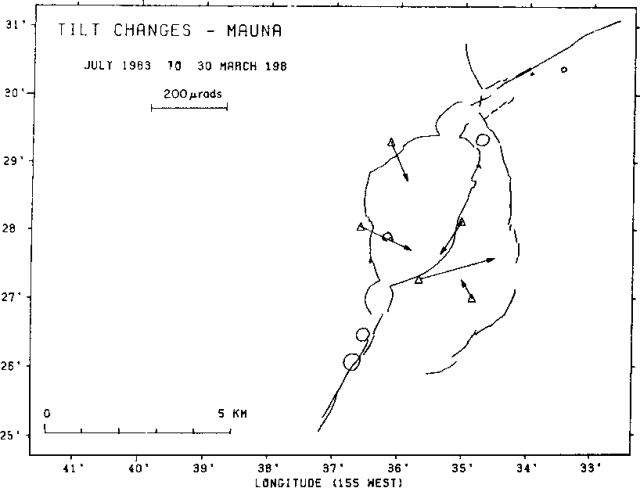 |
Figure 5. Tilt changes near the summit of Mauna Loa, July 1983-30 March 1984. |
"Large extensions occurred across the middle NE rift zone during dike emplacement on 25 March, but EDM monitor lines across this zone showed no significant change after the initial dilation. The rate of summit subsidence initially followed an exponential decay, similar to subsidence episodes in the summit region of Kīlauea. Since 30 March, tilt and horizontal distance measurements have indicated a steady rate of deflation (figures 6 and 7), although measurements on 6 April suggest decreasing deflation rates.
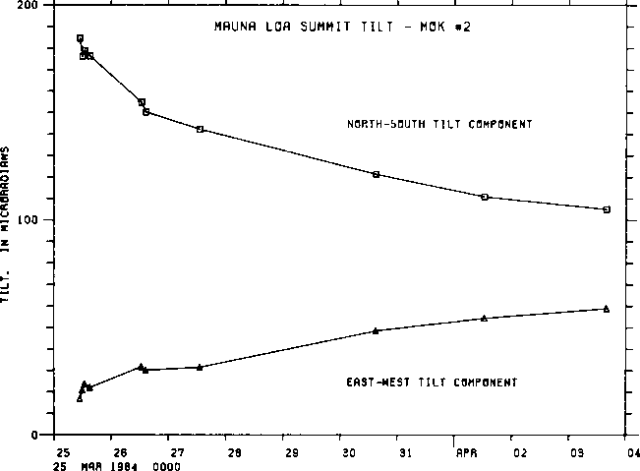 |
Figure 6. Plot of summit tilt vs. time, 25 March-3 April 1984. |
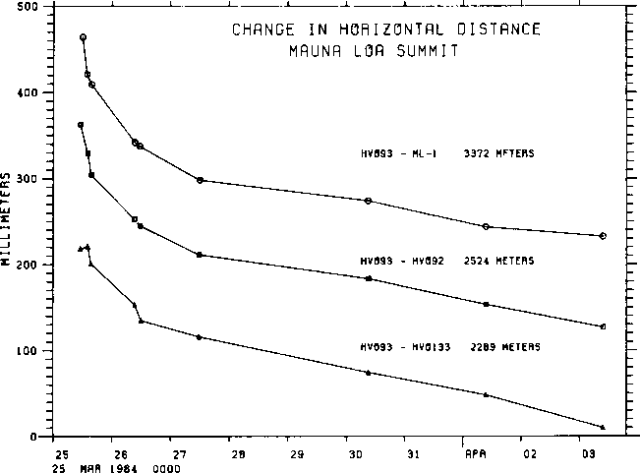 |
Figure 7. Change in horizontal distance across the summit of Mauna Loa vs. time, 25 March-3 April 1984. |
Dike propagation. "All dikes were emplaced within the first 15 hours of the eruption. The eruptive fissure (surface expression of dikes) extended discontinuously along a 25-km zone from 3,890 m on the SW rift zone to about 2,770 m on the NE rift zone. Ground cracking along most of this zone demonstrates the continuity of the dike at shallow levels. Lateral propagation rates vary from >2,500 m/hour down the SW rift zone to about 1,200 m/hour in lower parts of the NE rift zone (figure 8).
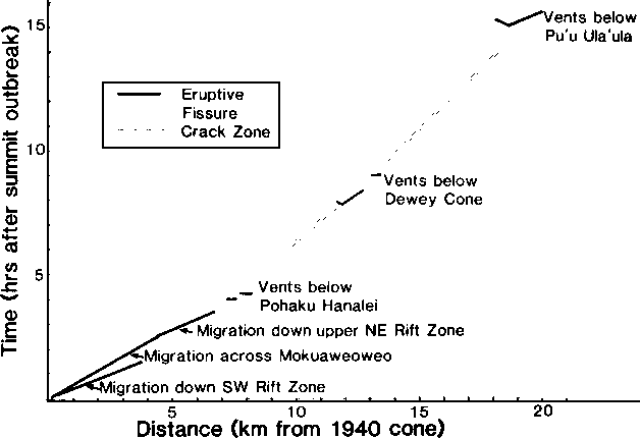 |
Figure 8. Rate of propagation of eruption fissures, shown as distance from the 1940 cone (in the SW part of the summit caldera) vs. hours after the start of the eruption. |
Petrography, lava temperatures, and gas measurements. "Hand specimens of the 1984 basalt are very fine-grained with widely scattered (<1%) phenocrysts of olivine <3 mm in diameter and sparse microphenocrysts of plagioclase and clinopyroxene. Most olivines are anhedral, resorbed, commonly kinked, and surprisingly forsteritic (Fo88-90). Plagioclase and clinopyroxene are barely resolvable in the groundmass. Maximum temperatures determined repeatedly by thermocouple and radiometer ranged from 1,137 to 1,141°C and had not changed as of 5 April.
"Eruptive gases have been extensively sampled and analyzed. Observed C/S ratios are much lower than expected in primitive Hawaiian tholeiite, suggesting extensive degassing in a shallow (<4 km deep) magma reservoir.
Geoelectric studies. "One self-potential (SP) profile, first measured in July 1983, exists across the NE Rift Zone about 1 km W of the main erupting vents. The first complete reoccupation of the SP line 3 days after the eruption's start showed an amplitude increase slightly > l00 mV centered over a zone about 300 m wide across the 1.5 km-long crack zone N of Pu'u Ula'ula. VLF measurements show that the dike is located nearly in the center of the cracked zone, directly beneath the pre-existing SP maximum, at a very approximate depth of 150 m.
Areal extent and volume of lava. "As of 5 April, 25-30 km2 of area was covered. The lava is mostly pahoehoe near the vents, but is mostly aa more than 2 km from the vents. The volume was estimated to be about 150 x 106 m3 by 5 April."
Eruption plume. The eruption produced a large gas plume that was carried thousands of kilometers to the W. The plume from the summit caldera activity was clearly visible from HVO. An airline pilot approaching Honolulu at dawn 25 March reported that the top of the plume was between 10.7 and 11 km altitude and was drifting SW. Observers at Honolulu airport tower (300 km NW of Mauna Loa) reported that the top of a tall cumulus-like cloud became visible S of the airport just before dawn.
There was no evidence that the plume reached the stratosphere; the tropopause on 25 March was at about 18 km altitude. The plume was carried W by trade winds. By 30 March, a haze layer was detected at Wake and Johnston Islands (3,900 km W and 1,400 km WSW of Mauna Loa; table 2). Haze reached Kwajalein (4,000 km WSW of Mauna Loa) the next day and had reached Guam (6,300 km WSW of Mauna Loa) by 2 April.
Table 2. Visibilities at airports on several islands affected by the plume from Mauna Loa (distances are from Mauna Loa). All times are Hawaiian Standard Time. Note that all except Johnston Island are across the International Date Line from Hawaii. Data courtesy of NOAA.
| Island | Distance | Visibility | Date and Time (1984) |
| Johnston | 1,400 km WSW | 6 km | 2200 on 2 April - 0200 on 3 April |
| Wake | 3,900 km W | 1.6 km | 1200 on 2 April - 1700 on 2 April |
| Ponape | 5,000 km WSW | 3.2 km | 1000 on 2 April - 1400 on 2 April |
SO2 emitted by Mauna Loa was detected by the TOMS instrument on the Nimbus 7 polar orbiting satellite, which passed over Hawaii daily at about local noon (figure 9). Although the TOMS instrument was designed to measure ozone, it is also sensitive to SO2. An algorithm has been developed to isolate SO2 values and calculate its approximate concentration within pixels (picture elements) roughly 50 km in diameter. Preliminary estimates of the total SO2 in the Mauna Loa plume, using TOMS data, were roughly 130,000 metric tons on 26 March and 190,000 metric tons on 27 March.
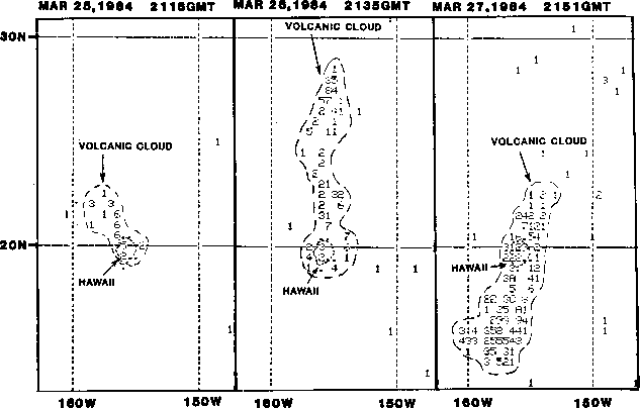 |
Figure 9. Preliminary SO2 data from the TOMS instrument on the Nimbus-7 satellite. All values less than 10 milliatmosphere-cm (100 ppm-meters) have been supressed. Each number or letter represents the average SO2 value within an area 50 km across. 1 = 11-15 matm-cm = 101-150 ppm-m, 2 = 16-20 matm-cm = 151-200s ppm-m, etc; 9 is followed by A, B, C, etc. Courtesy of Arlin Krueger. |
References. Decker, R.W., Koyanagi, R.Y., Dvorak, J.J., Lockwood, J.P. Okamura, A.T. Yamashita, K.M., and Tanigawa, W.R., 1983, Seismicity and surface deformation of Mauna Loa volcano, Hawaii: EOS, v. 64, no. 37, p. 545-547.
Koyanagi, R.Y., Endo, E.T., and Ebisu, J.S., 1975, Reawakening of Mauna Loa volcano, Hawaii; a preliminary evaluation of seismic evidence: Geophys. Res. Letters, v. 2, no. 9, p. 405-408.
Geological Summary. Massive Mauna Loa is a basaltic shield volcano that rises almost 9 km from the ocean floor to form the world's largest Holocene volcano. Flank eruptions typically occur from the lengthy NE and SW rift zones, and from the Moku'aweoweo summit is caldera, which is within an older and larger 6 x 8 km caldera. Two of the youngest large debris avalanches documented in Hawaii traveled nearly 100 km from Mauna Loa; the second of the Alika avalanches was emplaced about 105,000 years ago (Moore et al., 1989). Almost 90% of the surface of the volcano is covered by lavas less than 4,000 years old (Lockwood and Lipman, 1987). Beginning about 1,500 years ago, a series of voluminous overflows from a summit lava lake covered about 25% of the volcano's surface. Over the last 750 years, from shortly after the formation of Moku'aweoweo caldera until the present, an additional 25% of the volcano has been covered with lava flows, mainly from summit and NW rift zone vents.
Information Contacts: J. Lockwood and HVO staff, Hawaii; M. Rhodes, Univ. of Massachusetts; M. Garcia, Univ. of Hawaii; T. Casadevall, CVO, Vancouver, WA; A. Krueger, NASA/GSFC; M. Matson, NOAA/NESDIS.