Report on Izu-Oshima (Japan) — November 1986
Scientific Event Alert Network Bulletin, vol. 11, no. 11 (November 1986)
Managing Editor: Lindsay McClelland.
Izu-Oshima (Japan) Lava from summit vent and two fissures; epicenters plot along NW/SE axis; 12,000 evacuated; summit deflated before eruption
Please cite this report as:
Global Volcanism Program, 1986. Report on Izu-Oshima (Japan) (McClelland, L., ed.). Scientific Event Alert Network Bulletin, 11:11. Smithsonian Institution. https://doi.org/10.5479/si.GVP.SEAN198611-284010
Izu-Oshima
Japan
34.724°N, 139.394°E; summit elev. 746 m
All times are local (unless otherwise noted)
Phase 1 (15-19 November). A vigorous eruption began at 1718 on 15 November. The first phase, lasting 4 days, produced almost continuous lava fountains up to 500 m high (200-300 m average) and a lava lake within the crater of the 1777 cinder cone (Mihara-yama; vent A in figure 3). About 14 x 104 metric tons of scoria fell SE of vent A on 16 November and 1 x 10⁴ metric tons SW of the vent the next day. The lava lake overflowed the crater rim at 0955 on 19 November, sending a flow 0.6 km W before Phase 1 ended at 2320. A total of 1.3 x 10⁶ m3 (33 x 106 metric tons) of lava were erupted at a rate of 1.3 x 10⁴ m3/hour during the first phase.
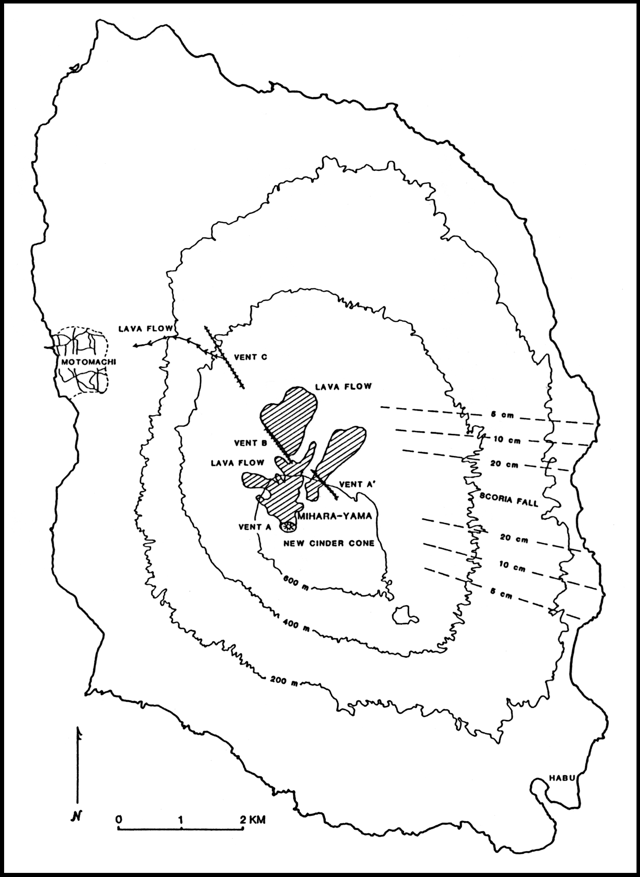 |
Figure 3. Sketch map showing Oshima's new cinder cone, vents, lava flows, and scoria fall. Contour interval is 200 m. Courtesy of the Earthquake Research Institute. |
Phase 2 (21-24 November). After less than 2 days of quiet, the second phase began at 1615 on 21 November. A fissure opened 1.2 km NNW of the crater, on the caldera floor (B on figure 3) and produced lava fountains, flows, and a 9-10-km-high eruption cloud. Flows moved mostly NE and were ~1 km long by 2000. An en-echelon fissure opened a few tens of meters from B at 1627. Scoria fall from vent B extended E and had a maximum thickness of >20 cm, 3.5 km from the vent (figure 3). The first eruptive activity outside the 3 x 4 km caldera began at 1746, from a 1.5-km-long fissure (C) NW of the caldera rim. Lava fountains and flows emerged, feeding a 1.5-km-long flow that soon advanced to within 1 km of Motomachi, the island's main town, on the W coast. At 2100 lava fountaining declined; two hours later ashfall reached the Boso Peninsula, 50 km NE. Eruptive activity weakened by dawn, and by 0600 ashfall had declined. Total Phase 2 ashfall was 500,000 m3. The mass evacuation of Oshima's 10,200 residents and 2,000 tourists the night of 21-22 November was the largest operation of its kind during a natural disaster in Japan; it was completed in less than 12 hours using 39 vessels.
At 0700 on 22 November, lava production began from vent A' on the NE flank of the 1777 cinder cone; lava flowed <1 km NE. On 23 November at 1330, lava began to emerge from the S part of fissure B, advancing about 0.5 km to the NE. By 1800, steam from vents A and A' was the only evidence of eruptive activity. The volcano was quiet by 25 November.
By 24 November a 3-km-long fissure had formed on the SE part of the island (near Habu port), oriented in the same NW-SE direction as the other newly formed fissures, but no eruptve activity was observed. The lava flow that threatened Motomachi had stopped 200 m from the town as of 25 November. An occasional column of steam to ~30 m above the summit was reported on 28 November.
Eruptive activity resumed at 0547 on 18 December with a 2-hour episode that produced 800-m-high ash columns, lava fountains, and at least one series of explosions. Fifty of the 800 residents that had returned to the island gathered at a local high school. The remainder of the residents, who were still at 34 school gyms and other facilities in central Tokyo, had been scheduled to return 19 December.
The total volume of November lava was ~18 x 106 m3, and scoria and ash volume was 1.9 x 10⁶ m3. Preliminary petrologic data indicated that scoria from Phase 1 contained ~53% silica. Samples of scoria, lava flows, and bombs from Phase 2 contain ~54-57% silica. One sample of pumice collected from the E side of the island contains ~61% silica.
Seismicity. From January to the beginning of October, seismic activity was mainly distributed in the northern and western parts of the island, generally at levels of <40 recorded events (M <3) per day with occasional peaks of more than 100 events/day. Seismicity dropped to very low levels in October, and continued at low levels until 15 November.
Seismicity rapidly increased just after noon on 16 November, 19 hours after the eruption began, and reached a peak at 1846 the same day. The number of recorded events/hour fluctuated between 0 and 13, totalling 48 on 17 November, 40 on the l8th, and 9 on the l9th, dropping to near 0 after 0900. The largest events in Phase 1 had magnitudes of 3.9 (at 1846 on 16 November) and 4.1 (at 1455 on 18 November). Epicenters of Phase 1 events were in two broad zones roughly 4-7 km wide that extended N and W of the summit caldera (figure 4). Most events were located closer to the coast than to the summit caldera.
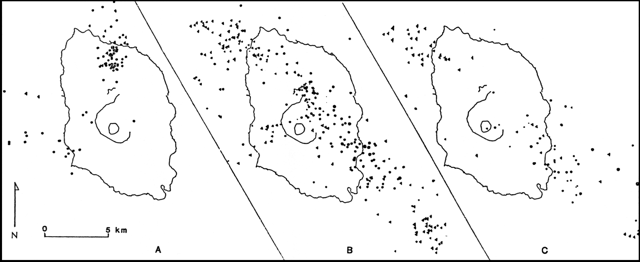 |
Figure 4. Plots of earthquake epicenters at Oshima, courtesy of the Earthquake Research Institute: a) 1725, 15 November-1200, 21 November; b) 0000, 22 November-1415, 28 November; c) 0000, 1 December-0320, 7 December. |
Seismicity increased just after 1400 on 21 November, about two hours before the start of Phase 2. The number of recorded events peaked at the same time as the onset of Phase 2, when ~80/hour, including seven with M > 4, were recorded. Seismicity dropped sharply to near zero within a few days after the conclusion of the eruption on 23 November.
Phase 2 epicenters on 22 November (following the most active part of the eruption) were primarily in a NW-SE-trending zone (figure 4), roughly 3 km wide, centered ~1.5 km NE of the rift zone where Phase 2 eruptions occurred. Early Phase 2 epicenters have not yet been located because of crowded seismic records. Shallow events (<5 km) were concentrated near the vents at the summit of the island, while deeper events (>5 km) were concentrated near the NW and SE coasts and offshore.
Epicenters on 1-9 December were concentrated along the same zone as those of Phase 2 (figure 4), close to the coastline, with shallow events occurring close to the SE coast.
Episodic tremor began on 7 July, more than 18 weeks before the eruption began. Pulses lasted 10-20 minutes at regular intervals of approximately 3 hours until 20 July. Tremor amplitude increased several times during the months before the eruption. The pattern became more irregular at about the beginning of October, then tremor suddenly stopped on 27 October. Continuous tremor started several days later.
A higher amplitude episodic tremor was superimposed on the continuous tremor every 1-2 hours beginning on the morning of 15 November. At the onset of Phase 1 that afternoon, tremor amplitude increased significantly and the characteristic period became significantly longer. Tremor stopped as Phase 1 ended on 19 November at 2320.
Episodic tremor resumed the evening of 20 November. At about noon on 21 November, tremor became continuous, then stopped about 1-2 hours before the onset of Phase 2 at 1615. During Phase 2, tremor was not distinguished; it may have been masked by the high seismicity.
Ground deformation. Prior to the eruption, levelling surveys had been conducted at 3-10-year intervals along the two roads leading to the summit (the 1777 scoria cone). The points near the caldera were remeasured on an annual basis. Results indicate that the summit was deflating before the eruption, with ~40 mm of displacement measured from 1983 to 1986 near the center of the summit cone. Between April 1984 and August 1986, electronic distance measurements across the caldera showed contraction, consistent with deflation.
Before the eruption, a continuously recording tiltmeter near the SE end of the island showed a tilt direction consistent with deflation of the summit region. Tilt accelerated at the start of Phase 1. Between phases 1 and 2, tilt was approximately constant. At the beginning of Phase 2, however, tilt quickly reversed, gradually became flat, then returned to the original direction of movement by about noon on 22 November.
Data from a continuously recording volumetric strainmeter on the NW part of the island indicated that contraction started about July 1981 and continued until the eruption. Contraction accelerated with Phase 1 (consistent with the direction and trend of the tiltmeter on the SE part of the island) then became flat. When Phase 1 ended, expansion began then sharply accelerated 2 hours before the beginning of Phase 2.
The data indicated that expansion continued for nearly all of Phase 2 and ended about 2000 on 21 November, after which a gradual contraction was recorded. Expansion similar to that seen on the Oshima strainmeter, but two orders of magnitude smaller, was seen on strainmeters on the Izu Peninsula; this expansion continued for a few days after the eruption at a lesser rate.
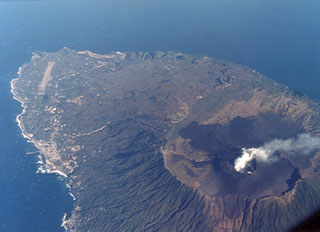
Geological Summary. Izu-Oshima volcano in Sagami Bay, east of the Izu Peninsula, is the northernmost of the Izu Islands. The broad, low stratovolcano forms an 11 x 13 km island constructed over the remnants of three older dissected stratovolcanoes. It is capped by a 4-km-wide caldera with a central cone, Miharayama, that has been the site of numerous recorded eruptions datining back to the 7th century CE. More than 40 cones are located within the caldera and along two parallel rift zones trending NNW-SSE. Although it is a dominantly basaltic volcano, strong explosive activity has occurred at intervals of 100-150 years throughout the past few thousand years. A major eruption in 1986 produced spectacular lava fountains up to 1,600 m high and a 16-km-high eruption column; more than 12,000 people were evacuated from the island.
Information Contacts: Y. Hayakawa, S. Aramaki, Y. Ida, H. Watanabe, K. Yamaoka, and H. Glicken, Earthquake Research Institute, Univ of Tokyo; Y. Sawada, JMA.