The first recorded explosive eruption at Hayli Gubbi was detected in satellite data at around 1130 on 23 November. Explosions produced a significant gas-and-ash plume that rose 10-15 km (32,800-50,000 ft) a.s.l. and drifted E and ENE over several countries, reaching China by the next day. A plume of pyroclastic material also traveled N about 130 km, spreading about 60 km laterally; it was unknown if the plume was related to a pyroclastic density current (PDC) or ash and gas drifting at a low altitude. Photos in news reports suggested that the eruption produced potentially far-reaching PDCs. According to a Centre for Observation and Modelling of Earthquakes, Volcanoes and Tectonics (COMET) uplift of a few centimeters at most was detected during 13-19 November.
Satellite images captured Hayli Gubbi, Erta Ale, and the region on 23 and 25 November, before and after the eruption. The 25 November image showed extensive ashfall to the NNW, NE, and E. The main crater was enlarged, expanding from around 330 to 390 m in diameter N-S and around 330 to 360 m in diameter E-W. Two new craters had formed. The first was located about 100 m ESE of the main crater and was about 255 m in diameter. The second new crater adjacent to S of the first new crater was smaller, about 110 m in diameter. A white plume was rising from the main crater.
News reports noted that although there were no deaths the ashfall contaminated water and food sources, covering grazing fields for livestock.
Sources: Copernicus, The UK Centre for Observation and Modelling of Earthquakes, Volcanoes and Tectonics (COMET), NDTV
2025: November
The first recorded explosive eruption at Hayli Gubbi was detected in satellite data at around 1130 on 23 November. Explosions produced a significant gas-and-ash plume that rose 10-15 km (32,800-50,000 ft) a.s.l. and drifted E and ENE over several countries, reaching China by the next day. A plume of pyroclastic material also traveled N about 130 km, spreading about 60 km laterally; it was unknown if the plume was related to a pyroclastic density current (PDC) or ash and gas drifting at a low altitude. Photos in news reports suggested that the eruption produced potentially far-reaching PDCs. According to a Centre for Observation and Modelling of Earthquakes, Volcanoes and Tectonics (COMET) uplift of a few centimeters at most was detected during 13-19 November.
Satellite images captured Hayli Gubbi, Erta Ale, and the region on 23 and 25 November, before and after the eruption. The 25 November image showed extensive ashfall to the NNW, NE, and E. The main crater was enlarged, expanding from around 330 to 390 m in diameter N-S and around 330 to 360 m in diameter E-W. Two new craters had formed. The first was located about 100 m ESE of the main crater and was about 255 m in diameter. The second new crater adjacent to S of the first new crater was smaller, about 110 m in diameter. A white plume was rising from the main crater.
News reports noted that although there were no deaths the ashfall contaminated water and food sources, covering grazing fields for livestock.
Sources: Copernicus; The UK Centre for Observation and Modelling of Earthquakes, Volcanoes and Tectonics (COMET); NDTV
An ash plume from the first recorded explosive eruption at Hayli Gubbi was detected in satellite data at around 1130 on 23 November. According to a news report, residents described hearing a loud sound and feeling a shock wave; an explosion was heard 50 km from Semera (190 km S of Hayli Gubbi). Ash plumes quickly rose to 13.7 km (45,000 ft) a.s.l., later reaching as high as 15.2 km (50,000 ft) a.s.l. At around 1400 satellite data showed that the plume was spreading into the upper troposphere and contained approximately 220,000 tons of sulfur dioxide. A sequence of satellite images showed the higher ash plume drifting ENE. The images also showed a lower altitude cloud of pyroclastic material moving to the N about 130 km and spreading about 60 km laterally. That plume appeared to be on or low to the ground, and followed terrain, suggesting that it was the dilute part of a pyroclastic density current. Photos included in news reports showed ash plumes rising from the flat ground at some distance from the crater, consistent with material rising from a PDC, although the exact location of the photos was unknown. News reports noted that many surrounding villages, including Afdera (28 km W), were covered in ashfall; no deaths were reported. Several flights were cancelled or diverted across various countries in the region. Although the Toulouse VAAC reported that eruptive activity ceased by 2300, a large ash plume with a significant sulfur dioxide component persisted over Yemen, with lower-level ash continuing to drift over Ethiopia.
The Toulouse VAAC stated that by 0057 on 24 November a substantial ash and sulfur dioxide cloud was present over Yemen and Oman, and by 1058 the plume was situated between Oman and Pakistan, moving ENE at altitudes of 7.6-13.7 km (25,000-45,000 ft) a.s.l. By 1700 a broad ash cloud was spreading E across southern Pakistan and northeastern India, with a possible plume of resuspended ash rising to 4.6 km (15,000 ft) a.s.l. detected near the Gulf of Aden. By 2300 the ash cloud was detected over northern Indian (over Delhi, 4,130 km NE) and was moving quickly towards China. News media reported flight disruptions in India on 25 November.
According to the UK Centre for Observation and Modelling of Earthquakes Volcanoes and Tectonics (COMET) response reports, explosive activity at Erta Ale (12 km NW) on 15 July was accompanied by an intrusion of magma along a dike that propagated SE towards Hayli Gubbi. Sentinel satellite imagery on 16 July showed a line of fissure vents that produced lava flows outside the S caldera of Erta Ale (6 km S of the northern pit craters). Another group of four fissure vents opened further along the rift to the SE, with the most distant only 2 km from the Hayli Gubbi crater. No lava lakes were seen in the pit craters after 18 July, but satellite data indicated uplift in the region during 21 July-3 August, and an anomalous white cloud within Hayli Gubbi’s crater was observed on 25 July. Satellite data showed that the white plume covered the crater floor in most of the images (several per month) at least through 18 November.
Sources: Toulouse Volcanic Ash Advisory Centre (VAAC); Copernicus; Associated Press; The UK Centre for Observation and Modelling of Earthquakes, Volcanoes and Tectonics (COMET); Gulf News; Simon Carn; Afar Communication Bureau; The Week; Hindustan Times
The Global Volcanism Program has no Bulletin Reports available for Hayli Gubbi.
|
|
||||||||||||||||||||||||||
There is data available for 2 confirmed eruptive periods.
2025 Nov 23 - 2025 Nov 23 Confirmed Eruption (Explosive / Effusive)
| Episode 1 | Eruption (Explosive / Effusive) | ||||
|---|---|---|---|---|
| 2025 Nov 23 - 2025 Nov 23 | Evidence from Observations: Reported | |||
6250 BCE (in or after) Confirmed Eruption (Explosive / Effusive)
| Episode 1 | Eruption (Explosive / Effusive) | S flank | |||||||||||||
|---|---|---|---|---|---|---|---|---|---|---|---|---|---|---|
| 6250 BCE (in or after) - Unknown | Evidence from Correlation: Tephrochronology | |||||||||||||
| Barberi and Varet (1970) reported that basaltic lava-flows moving down the S flank of the volcano covered sediments in the Afrera (Giulietti) Plain which Roubet et al. (1969) described as lacustrine limestones and diatomites deposited around 8,200 years BP above hyaloclastite formations. This places the eruption of the SE-most flows sometime within the last 8,000 years, but no additional information about how recent they might be is known; in appearance they are similar to very recent flows from the Erta Ale shield. | ||||||||||||||
|
List of 1 Events for Episode 1 at S flank
|
||||||||||||||
This compilation of synonyms and subsidiary features may not be comprehensive. Features are organized into four major categories: Cones, Craters, Domes, and Thermal Features. Synonyms of features appear indented below the primary name. In some cases additional feature type, elevation, or location details are provided.
Synonyms |
| Hayli Gub | Haily Gubbi |
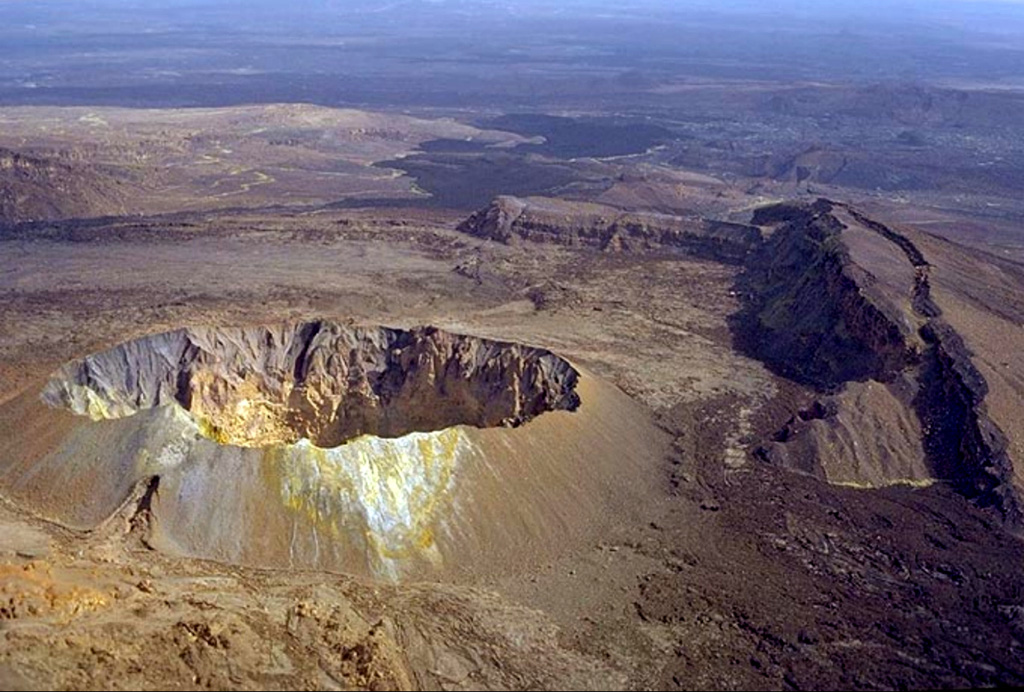
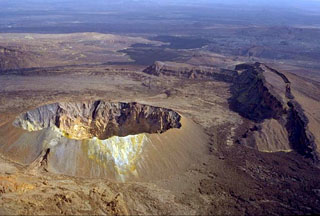 A symmetrical scoria cone with a 200-m-wide crater lies in the center of a graben that cuts the summit of Hayli Gubbi volcano, the southernmost in the Erta Ale Range. The cliffs at the right form the W side of the graben. Dark lava flows seen at the top center were erupted from the axial portion of a fissure system that extends for more than 10 km to the S. The lava flows have reached the floor of the Giulietti plain S of the Erta Ale Range. A steam plume was observed from the crater in February 2002.
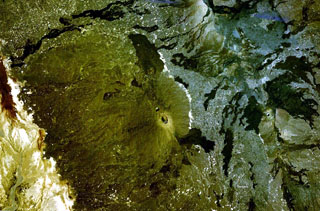 The prominent peak near the center of this NASA Landsat image (with north to the top) is Ale Bagu, also known as Ummuna. This elongated stratovolcano is the highest of the Erta Ale Range volcanoes. The main crater is the 750 x 450 m feature prominent in this image. The light-colored Roram Plain lies at the lower left, and lava flows from Hayli Gubbi volcano are visible at the right.
There are no samples for Hayli Gubbi in the Smithsonian's NMNH Department of Mineral Sciences Rock and Ore collection.
| Copernicus Browser | The Copernicus Browser replaced the Sentinel Hub Playground browser in 2023, to provide access to Earth observation archives from the Copernicus Data Space Ecosystem, the main distribution platform for data from the EU Copernicus missions. |
| MIROVA | Middle InfraRed Observation of Volcanic Activity (MIROVA) is a near real time volcanic hot-spot detection system based on the analysis of MODIS (Moderate Resolution Imaging Spectroradiometer) data. In particular, MIROVA uses the Middle InfraRed Radiation (MIR), measured over target volcanoes, in order to detect, locate and measure the heat radiation sourced from volcanic activity. |
| MODVOLC Thermal Alerts | Using infrared satellite Moderate Resolution Imaging Spectroradiometer (MODIS) data, scientists at the Hawai'i Institute of Geophysics and Planetology, University of Hawai'i, developed an automated system called MODVOLC to map thermal hot-spots in near real time. For each MODIS image, the algorithm automatically scans each 1 km pixel within it to check for high-temperature hot-spots. When one is found the date, time, location, and intensity are recorded. MODIS looks at every square km of the Earth every 48 hours, once during the day and once during the night, and the presence of two MODIS sensors in space allows at least four hot-spot observations every two days. Each day updated global maps are compiled to display the locations of all hot spots detected in the previous 24 hours. There is a drop-down list with volcano names which allow users to 'zoom-in' and examine the distribution of hot-spots at a variety of spatial scales. |
|
WOVOdat
Single Volcano View Temporal Evolution of Unrest Side by Side Volcanoes |
WOVOdat is a database of volcanic unrest; instrumentally and visually recorded changes in seismicity, ground deformation, gas emission, and other parameters from their normal baselines. It is sponsored by the World Organization of Volcano Observatories (WOVO) and presently hosted at the Earth Observatory of Singapore.
GVMID Data on Volcano Monitoring Infrastructure The Global Volcano Monitoring Infrastructure Database GVMID, is aimed at documenting and improving capabilities of volcano monitoring from the ground and space. GVMID should provide a snapshot and baseline view of the techniques and instrumentation that are in place at various volcanoes, which can be use by volcano observatories as reference to setup new monitoring system or improving networks at a specific volcano. These data will allow identification of what monitoring gaps exist, which can be then targeted by remote sensing infrastructure and future instrument deployments. |
| Volcanic Hazard Maps | The IAVCEI Commission on Volcanic Hazards and Risk has a Volcanic Hazard Maps database designed to serve as a resource for hazard mappers (or other interested parties) to explore how common issues in hazard map development have been addressed at different volcanoes, in different countries, for different hazards, and for different intended audiences. In addition to the comprehensive, searchable Volcanic Hazard Maps Database, this website contains information about diversity of volcanic hazard maps, illustrated using examples from the database. This site is for educational purposes related to volcanic hazard maps. Hazard maps found on this website should not be used for emergency purposes. For the most recent, official hazard map for a particular volcano, please seek out the proper institutional authorities on the matter. |
| IRIS seismic stations/networks | Incorporated Research Institutions for Seismology (IRIS) Data Services map showing the location of seismic stations from all available networks (permanent or temporary) within a radius of 0.18° (about 20 km at mid-latitudes) from the given location of Hayli Gubbi. Users can customize a variety of filters and options in the left panel. Note that if there are no stations are known the map will default to show the entire world with a "No data matched request" error notice. |
| UNAVCO GPS/GNSS stations | Geodetic Data Services map from UNAVCO showing the location of GPS/GNSS stations from all available networks (permanent or temporary) within a radius of 20 km from the given location of Hayli Gubbi. Users can customize the data search based on station or network names, location, and time window. Requires Adobe Flash Player. |
| DECADE Data | The DECADE portal, still in the developmental stage, serves as an example of the proposed interoperability between The Smithsonian Institution's Global Volcanism Program, the Mapping Gas Emissions (MaGa) Database, and the EarthChem Geochemical Portal. The Deep Earth Carbon Degassing (DECADE) initiative seeks to use new and established technologies to determine accurate global fluxes of volcanic CO2 to the atmosphere, but installing CO2 monitoring networks on 20 of the world's 150 most actively degassing volcanoes. The group uses related laboratory-based studies (direct gas sampling and analysis, melt inclusions) to provide new data for direct degassing of deep earth carbon to the atmosphere. |
| Large Eruptions of Hayli Gubbi | Information about large Quaternary eruptions (VEI >= 4) is cataloged in the Large Magnitude Explosive Volcanic Eruptions (LaMEVE) database of the Volcano Global Risk Identification and Analysis Project (VOGRIPA). |
| EarthChem | EarthChem develops and maintains databases, software, and services that support the preservation, discovery, access and analysis of geochemical data, and facilitate their integration with the broad array of other available earth science parameters. EarthChem is operated by a joint team of disciplinary scientists, data scientists, data managers and information technology developers who are part of the NSF-funded data facility Integrated Earth Data Applications (IEDA). IEDA is a collaborative effort of EarthChem and the Marine Geoscience Data System (MGDS). |

