Seismic swarm on 8 January
On 8 January in the NE Pacific, the NOAA/PMEL T-phase Monitoring System recorded high seismicity from the E flank of the Gorda Ridge's N section (figure 7). The exact nature of the activity is unknown. Over 500 small earthquakes were recorded during a 6-day period (figures 8 and 9). The events were located along several en-echelon normal faults on the flank of the Gorda Ridge, E of the neovolcanic zone (figure 9). The moment-tensor solution for a M 3.8 earthquake within the swarm showed the event to be a normal fault earthquake.
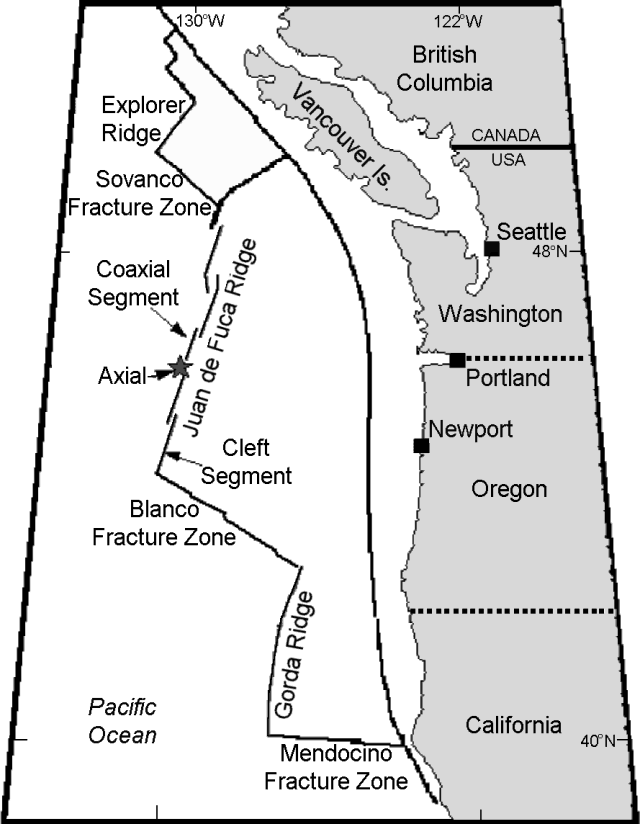 |
Figure 7. Map of plate boundaries and other features associated with the Juan de Fuca Ridge in the NE Pacific. Courtesy of NOAA/PMEL. |
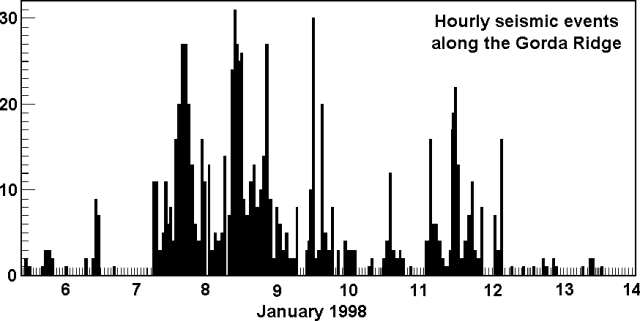 |
Figure 8. Number of seismic events per hour at the N section of the Gorda Ridge during 6-14 January 1998. Courtesy of NOAA/PMEL. |
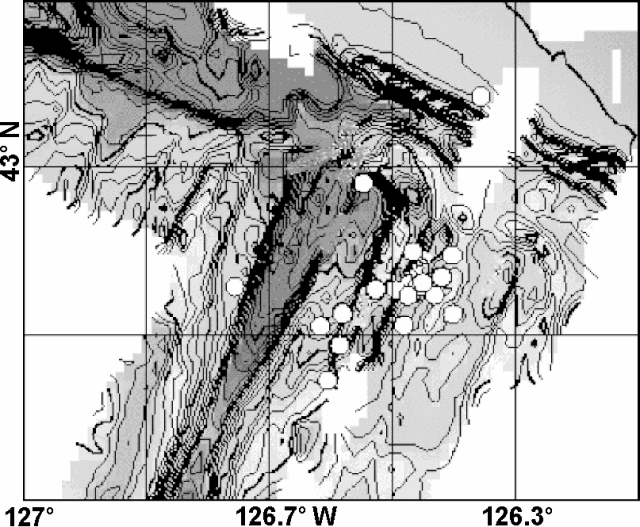 |
Figure 9. Earthquake epicenters along the flank of the N end of Gorda Ridge recorded during 7-14 January 1998. The base map shows bathymetric contours shaded with darker fill patterns at greater depths. Courtesy of NOAA/PMEL. |
Substantial data sets from the Gorda Ridge were collected during the 1980s, including water column surveys, full SeaBeam coverage, SeamarC I and II surveys, camera surveys, extensive dredges, and submersible dives. A submarine lava flow erupted in 1996 (BGVN 21:02 and 21:06) at the N end of the Gorda Ridge (~200 km W of Oregon's S coast). The eruption was initially detected based on acoustic T-waves (seismic waves transmitted through the ocean) from a seismic swarm and based on large thermal plumes in the colder ambient sea water. Subsequent camera tows revealed new lava flows ~100-200 m wide located along a fissure that was at least 3.5-km long.
Information Contacts: Chris Fox and Bob Dziak, NOAA Pacific Marine Environmental Laboratory (PMEL), 2115 SE Osu Drive, Newport, OR 97365 USA (URL: https://www.pmel.noaa.gov/).
The Global Volcanism Program has no Weekly Reports available for North Gorda Ridge Segment.
Reports are organized chronologically and indexed below by Month/Year (Publication Volume:Number), and include a one-line summary. Click on the index link or scroll down to read the reports.
Eruption or intrusive event detected by acoustic signals
In late February and early March a possible submarine eruption was detected on the Gorda Ridge. Seismo-acoustic T-waves established the epicenter at between 42.41 and 42.75°N. Vertical conductivity-temperature-depth (CTD) casts found a candidate plume at 42.67°N, 126.78°W.
Beginning at 0700 GMT on 28 February, intense seismicity was detected using the T-phase Monitoring System developed by National Oceanic and Atmospheric Administration's Pacific Marine Environmental laboratory (NOAA/PMEL) to access the U.S. Navy's Sound Surveillance System (SOSUS) in the NE Pacific. The event was located on the northernmost segment of the Gorda Ridge (figure 1), over 200 km W of the Oregon coast. The seismicity was very similar to that observed in June 1993 at the CoAxial Segment of the Juan de Fuca Ridge at 46.5°N (BGVN 18:07), which was later documented to be the lateral injection of magma with a subsequent eruption.
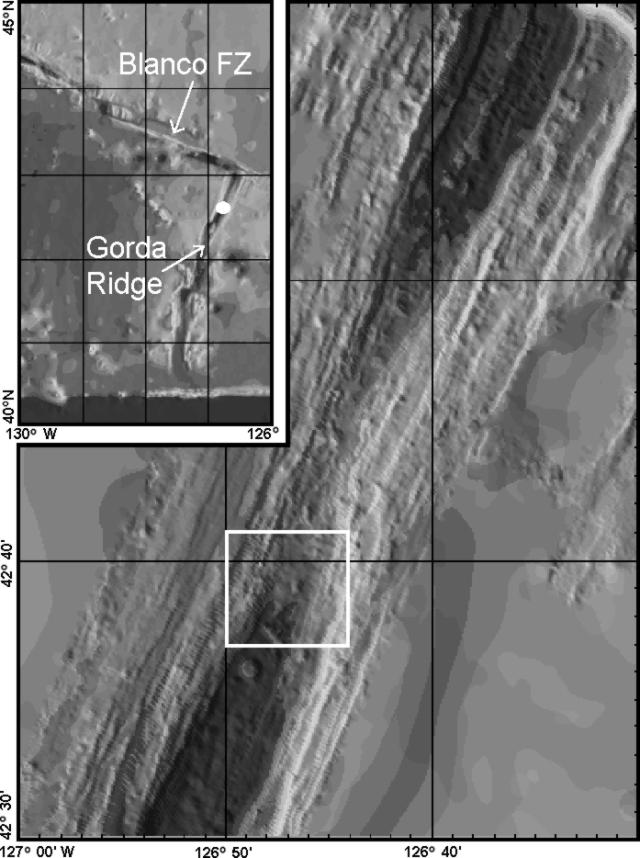 |
Figure 1. Bathymetric map of the northernmost Gorda Ridge, NE Pacific Ocean. White box shows the approximate area of the hydrothermal plumes found during 10-11 March 1996. The "narrow-gate" summit area is located just N of the plume location, around 42.75°N, 126.75°E. Inset bathymetric map shows the Blanco Fracture Zone and the Gorda Ridge, with the eruption site indicated by a white dot. Courtesy of the RIDGE Office. |
For the first 42 hours of T-wave seismicity, two proximal SOSUS arrays were not operating, so the presence of seismicity in the general area of the northern Gorda Ridge was confirmed based on distant arrays. The proximal SOSUS array became operational on 6 March, allowing improved sensitivity and epicenter estimates. Seismicity continued during 6-8 March, located thoughout the S half of the ridge segment from 42°25' to 42°45'N.
The Gorda Ridge Eruption Assessment Team (GREAT), aboard the NOAA Ship MacArthur, reached the area on 8 March. They began a series of vertical CTD casts starting at 42°26.2'N, 126°55.3' W, and proceeding N along the ridge axis with measurements at ~2' intervals; only 2,900 m of wire was useable. No plume signals were detected on the first six casts, although up to 1 km of the water column remained below the deepest CTD depths reached. At 42°37.9'N, 126°47.8'W, temperature and particle plumes were found between 1,850 and 2,800 m above a bottom depth of 3,300 m. The main plume lens was centered at 1,850-2,300 m, with several thinner and less intense plumes below. Plume distribution was similar at the next two stations N, though the overall plume became thinner and less intense. A plume located 24 hours later was similar, perhaps indicating advection of the plume to the W.
On 9 March seismicity decreased to <10 events/hour. Only minor seismic activity was recorded on 10 March, mostly from the shallower "narrow-gate" (summit) area near 42°45'N. That day, GREAT detected a large hydrothermal plume centered near 42°40'N, 126°47'W that may have been due to recent magmatic activity. Initial survey work indicated that the plume may have been an agglomeration of more than one discharge. It had a maximum thickness of ~700 m, a maximum diameter of ~10 km, and a maximum temperature anomaly of ~0.12°C. Seismicity continued at a low level (<5 earthquakes/hour) during 11-14 March. Seismic activity increased again at 1625 GMT on 15 March to >25 events in the first hour. The nature of the seismicity appeared to be due to magma injection rather than eruption. Preliminary locations for the 15 March activity were in the summit area.
Based on their exceptional height above the axial valley, most of the major plumes detected through 15 March were thought to be event plumes. The capability to demonstrate the vertical and horizontal symmetry characteristic of event plumes was not available. Apparently, several distinct event plumes were mapped that differ in depth and in horizontal and vertical dimensions. One alternative hypothesis is that all, or some, of the plumes are chronic plumes originating high on the valley walls. No substantial near-seafloor plumes have been found. The source of the presumed event plumes may be S of their present position in water too deep for available equipment to reach, farther to the N where samples had not yet been taken, or beneath their present position but as yet undetected.
Remaining unanswered questions regarding the Gorda Ridge event, as well as mid-ocean ridge events generally include: spatial and temporal patterns of seismicity, intrusive vs. extrusive behavior, the origin of the event plumes, and patterns and rates of geochemical and microbiological processes associated with event plumes and resulting chronic plumes. A second response cruise on the UNOLS RV Wecoma during the first two weeks of April 1996 will focus on water column work and camera tows.
Substantial data sets have been previously collected in this area. Water column surveys collected by NOAA in 1985 and later surveys by Oregon State University showed water column temperature anomalies in the area, which was labelled GR-14. Full SeaBeam coverage has been collected by NOAA. SeamarC II surveys were collected in the area in 1983 by USGS/University of Hawaii. Detailed SeamarC I surveys were collected by NOAA/PMEL in the northern half of the segment in 1987. Camera surveys were conducted in 1985-86 by USGS and NOAA/PMEL. Extensive dredges were also collected by USGS. The Navy's SeaCliff submersible dove in the area in 1988.
Information Contacts: Chris Fox, Bob Embley, Bob Dziak, and Ed Baker, NOAA Pacific Marine Environmental Laboratory, 2115 SE Osu Drive, Newport, OR 97365 USA (URL: http://www.pmel.noaa.gov); RIDGE Office, Ocean Processes Analysis Laboratory, Morse Hall, 39 College Road, University of New Hampshire, Durham, NH 03824-3525 USA (URL: http://ridge.unh.edu).
Submarine plumes and a brief fissure eruption
The following report describes preliminary results of investigations on the eruptive activity that began on 28 February along the Gorda Ridge (BGVN 21:02). On 10-11 March 1996 NOAA's RV MacArthur carried out a series of conductivity-temperature-depth (CTD) casts to study the plume(s) activity.
Figure 2 shows a N-S cross section of the temperature anomaly through the event plume(s) discovered above the ridge. The temperature anomaly was defined as the increase of the water temperature above that expected for a given density horizon. The contours are based on five vertical casts evenly spaced between 42°36' and 42°43'N. A similar pattern was observed on an E-W transect. Since previous event plumes were characterized by symmetry about a central core, the structure in this anomaly suggested an agglomeration of two or more separate plumes. The events that caused the plumes could have been separated in space and time or both.
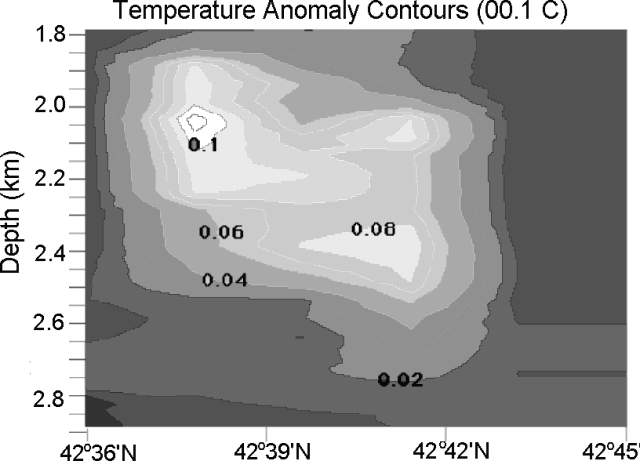 |
Figure 2. N-S cross section of the temperature anomaly through the Gorda Ridge event plume(s), 18 March 1996. Courtesy of E. Baker, NOAA/PMEL. |
Water samples taken from station 7 (42°37.9'N, 126°47.8'W) in mid-March showed a very high enrichment in Helium-3 (figure 3). The presence of this isotope, enriched in fresh oceanic volcanic rocks and in submarine hydrothermal fluids, suggested a hydrothermal input into the ocean. Station 7 was also characterized by an increase in temperature and in suspended particles (nephels).
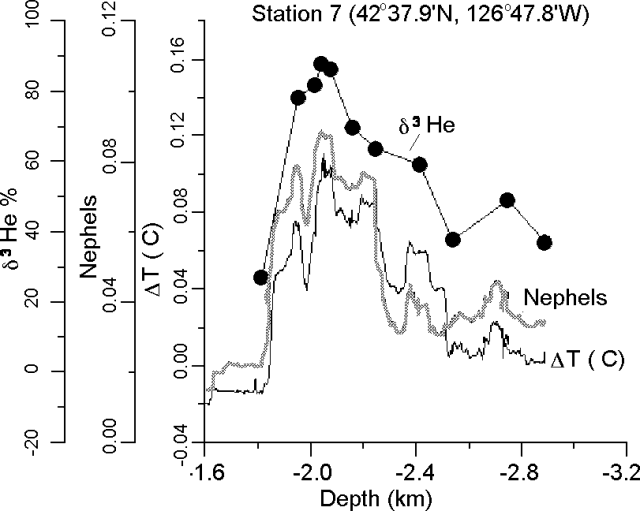 |
Figure 3. Concentration of Helium-3 for station 7 along the Gorda Ridge. Courtesy of J. Lupton, R. Greene, L. Evans, and R. Kovar NOAA/PMEL. |
The plot of Helium-3 concentration versus temperature anomaly at stations 7 and 13 (42°45.7'N, 126°44.8'W) suggested that each had sampled water columns with different plume characteristics (figure 4). The Helium-3/heat trend for station 7 (the event plume) had a flat slope of 0.34 x 10⁻¹² cm3/cal, similar to other event plumes detected in 1986 and 1993 over the Juan de Fuca Ridge. In contrast, the plume detected at station 13 had a much higher helium-3/heat trend of 2.27 x 10⁻¹² cm3/cal.
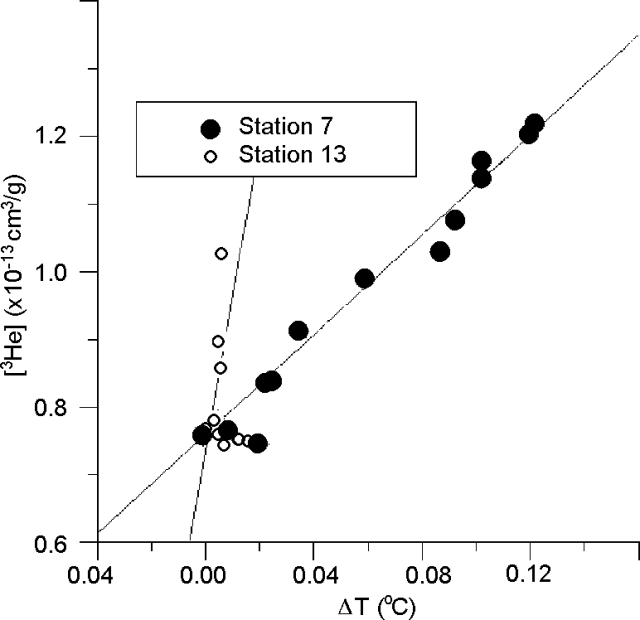 |
Figure 4. Plot of Helium-3 concentration vs. temperature difference for stations 5 and 7 along the Gorda Ridge. The y-axis shows 3He concentrations in units of cubic centimeters of gas at standard temperature and pressure per gram of seawater. Courtesy of J. Lupton, R. Greene, L. Evans, and R. Kovar NOAA/PMEL. |
SEM analysis of the first sample from the megaplume site at GR-14 revealed the presence of Fe-oxides, Zn-sulfides, and bacterial aggregates. The Fe-oxides were found with and without phosphorus. It was suggested that Fe-oxides formed beneath the seafloor lacked phosphorus, whereas Fe-oxides formed within the megaplume were enriched in phosphorus. The Zn-sulfides were very pure (i.e., no Fe). This sample appeared similar to the plume samples collected over the flow site in 1993. Preliminary results from the dissolved concentrations of Mn and Fe suggested that the event plume had formed recently.
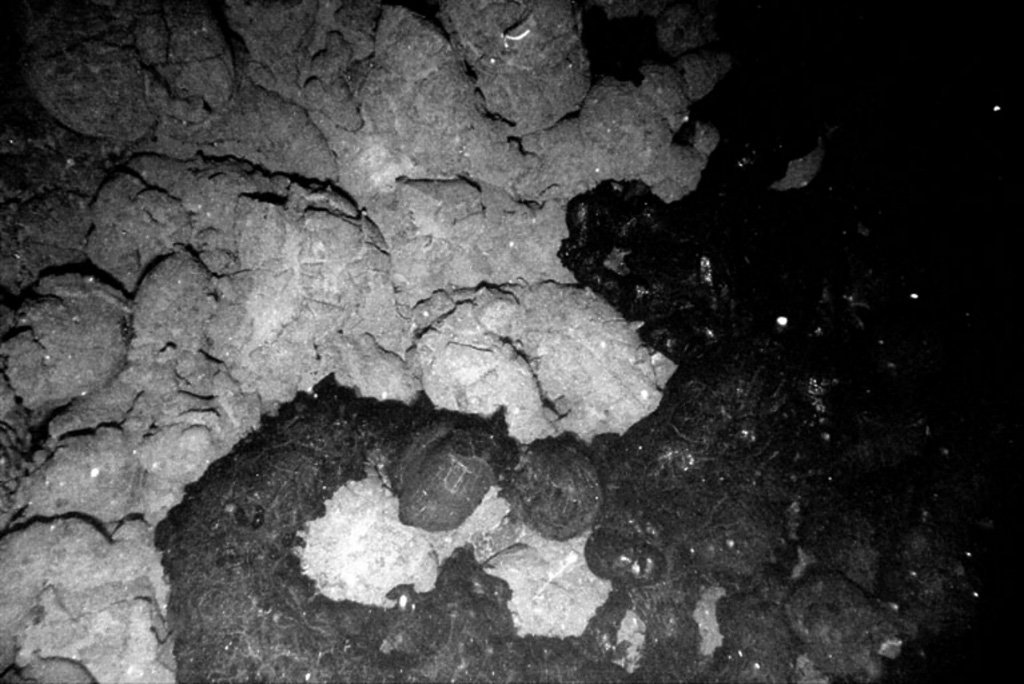
In April the RV Wecoma surveyed a new lava flow with five camera tows. Figure 5 is a digital camera image that shows the contact between the new lava flow at the ridge and the surrounding older lava. The eruption site was at least 3.5 km long and only ~100-200 m wide, based mainly on the distribution of near-bottom temperature anomalies above the cooling flow. With this shape, the flow was clearly the product of a brief fissure eruption, where a dike reached the surface. The lava flow was located directly under the event plume mapped by CTD casts during the RV MacArthur cruise. Figure 6 shows the new lava flow, the camera tows, the CTD casts, the event plume(s), and the epicenters detected in the area since 28 February (BGVN 21:02).
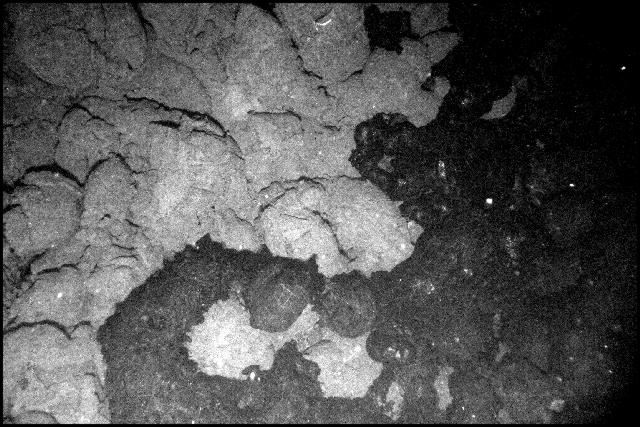 |
Figure 5. Contact between the new lava flow and the surrounding older lava. The image was taken by a Benthos digital camera developed for Woods Hole Oceanographic Institution (Dan Fornari, P.I.) (scale of image was undisclosed). |
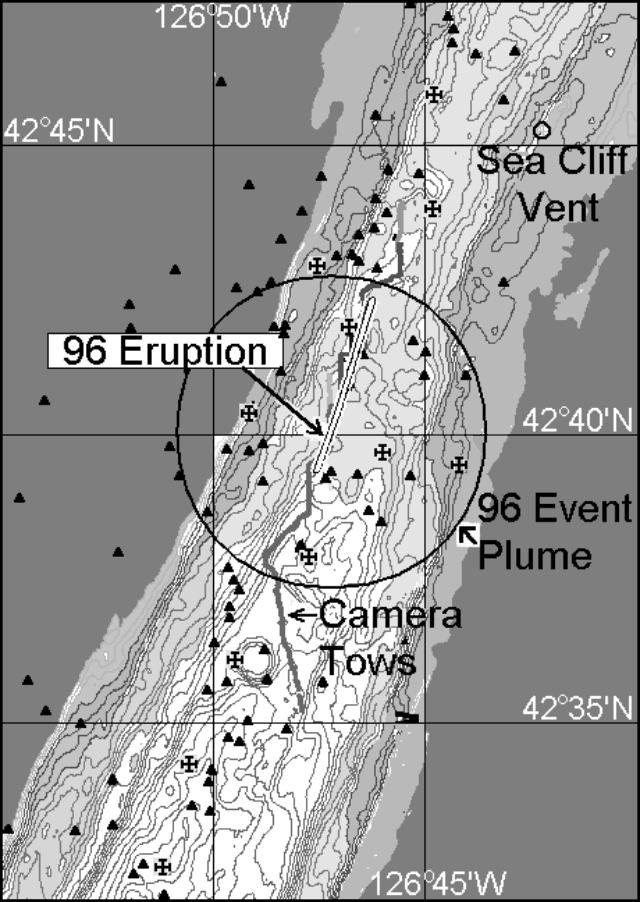 |
Figure 6. Map showing an overview of the investigated area with the general location of the event plume. Courtesy of B. Embley and B. Chadwick. The T-wave epicenters appear as triangles; the RV McArthur CTD casts are shown as crosses. |
Information Contacts: Chris Fox, Bob Dziak, Bob Embley, Bill Chadwick, Ed Baker, John Lupton, Dick Feely, and Gary Massoth, NOAA Pacific Marine Environmental Laboratory, 2115 SE Osu Drive, Newport, OR 97365 USA (URL: https://www.pmel.noaa.gov/eoi/).
Seismic swarm on 8 January
On 8 January in the NE Pacific, the NOAA/PMEL T-phase Monitoring System recorded high seismicity from the E flank of the Gorda Ridge's N section (figure 7). The exact nature of the activity is unknown. Over 500 small earthquakes were recorded during a 6-day period (figures 8 and 9). The events were located along several en-echelon normal faults on the flank of the Gorda Ridge, E of the neovolcanic zone (figure 9). The moment-tensor solution for a M 3.8 earthquake within the swarm showed the event to be a normal fault earthquake.
|
Figure 7. Map of plate boundaries and other features associated with the Juan de Fuca Ridge in the NE Pacific. Courtesy of NOAA/PMEL. |
|
Figure 8. Number of seismic events per hour at the N section of the Gorda Ridge during 6-14 January 1998. Courtesy of NOAA/PMEL. |
|
Figure 9. Earthquake epicenters along the flank of the N end of Gorda Ridge recorded during 7-14 January 1998. The base map shows bathymetric contours shaded with darker fill patterns at greater depths. Courtesy of NOAA/PMEL. |
Substantial data sets from the Gorda Ridge were collected during the 1980s, including water column surveys, full SeaBeam coverage, SeamarC I and II surveys, camera surveys, extensive dredges, and submersible dives. A submarine lava flow erupted in 1996 (BGVN 21:02 and 21:06) at the N end of the Gorda Ridge (~200 km W of Oregon's S coast). The eruption was initially detected based on acoustic T-waves (seismic waves transmitted through the ocean) from a seismic swarm and based on large thermal plumes in the colder ambient sea water. Subsequent camera tows revealed new lava flows ~100-200 m wide located along a fissure that was at least 3.5-km long.
Information Contacts: Chris Fox and Bob Dziak, NOAA Pacific Marine Environmental Laboratory (PMEL), 2115 SE Osu Drive, Newport, OR 97365 USA (URL: https://www.pmel.noaa.gov/).
|
|
||||||||||||||||||||||||||
There is data available for 3 confirmed Holocene eruptive periods.
1996 Feb 28 (?) - 1996 Mar 15 (?) Confirmed Eruption (Explosive / Effusive) VEI: 0
| Episode 1 | Eruption (Explosive / Effusive) | Near center of North Gorda Ridge segment | ||||||||||||||||||||||||
|---|---|---|---|---|---|---|---|---|---|---|---|---|---|---|---|---|---|---|---|---|---|---|---|---|---|
| 1996 Feb 28 (?) - 1996 Mar 15 (?) | Evidence from Observations: Reported | ||||||||||||||||||||||||
|
List of 3 Events for Episode 1 at Near center of North Gorda Ridge segment
|
|||||||||||||||||||||||||
3020 BCE (?) Confirmed Eruption (Explosive / Effusive) VEI: 0
| Episode 1 | Eruption (Explosive / Effusive) | ||||||||||||||||||||
|---|---|---|---|---|---|---|---|---|---|---|---|---|---|---|---|---|---|---|---|---|
| 3020 BCE (?) - Unknown | Evidence from Isotopic: Uranium-series | |||||||||||||||||||
|
List of 2 Events for Episode 1
|
||||||||||||||||||||
4840 BCE (?) Confirmed Eruption (Explosive / Effusive) VEI: 0
| Episode 1 | Eruption (Explosive / Effusive) | ||||||||||||||||||||
|---|---|---|---|---|---|---|---|---|---|---|---|---|---|---|---|---|---|---|---|---|
| 4840 BCE (?) - Unknown | Evidence from Isotopic: Uranium-series | |||||||||||||||||||
|
List of 2 Events for Episode 1
|
||||||||||||||||||||
The Global Volcanism Program has no synonyms or subfeatures listed for North Gorda Ridge Segment.
There are no samples for North Gorda Ridge Segment in the Smithsonian's NMNH Department of Mineral Sciences Rock and Ore collection.
| Copernicus Browser | The Copernicus Browser replaced the Sentinel Hub Playground browser in 2023, to provide access to Earth observation archives from the Copernicus Data Space Ecosystem, the main distribution platform for data from the EU Copernicus missions. |
| MIROVA | Middle InfraRed Observation of Volcanic Activity (MIROVA) is a near real time volcanic hot-spot detection system based on the analysis of MODIS (Moderate Resolution Imaging Spectroradiometer) data. In particular, MIROVA uses the Middle InfraRed Radiation (MIR), measured over target volcanoes, in order to detect, locate and measure the heat radiation sourced from volcanic activity. |
| MODVOLC Thermal Alerts | Using infrared satellite Moderate Resolution Imaging Spectroradiometer (MODIS) data, scientists at the Hawai'i Institute of Geophysics and Planetology, University of Hawai'i, developed an automated system called MODVOLC to map thermal hot-spots in near real time. For each MODIS image, the algorithm automatically scans each 1 km pixel within it to check for high-temperature hot-spots. When one is found the date, time, location, and intensity are recorded. MODIS looks at every square km of the Earth every 48 hours, once during the day and once during the night, and the presence of two MODIS sensors in space allows at least four hot-spot observations every two days. Each day updated global maps are compiled to display the locations of all hot spots detected in the previous 24 hours. There is a drop-down list with volcano names which allow users to 'zoom-in' and examine the distribution of hot-spots at a variety of spatial scales. |
|
WOVOdat
Single Volcano View Temporal Evolution of Unrest Side by Side Volcanoes |
WOVOdat is a database of volcanic unrest; instrumentally and visually recorded changes in seismicity, ground deformation, gas emission, and other parameters from their normal baselines. It is sponsored by the World Organization of Volcano Observatories (WOVO) and presently hosted at the Earth Observatory of Singapore.
GVMID Data on Volcano Monitoring Infrastructure The Global Volcano Monitoring Infrastructure Database GVMID, is aimed at documenting and improving capabilities of volcano monitoring from the ground and space. GVMID should provide a snapshot and baseline view of the techniques and instrumentation that are in place at various volcanoes, which can be use by volcano observatories as reference to setup new monitoring system or improving networks at a specific volcano. These data will allow identification of what monitoring gaps exist, which can be then targeted by remote sensing infrastructure and future instrument deployments. |
| Volcanic Hazard Maps | The IAVCEI Commission on Volcanic Hazards and Risk has a Volcanic Hazard Maps database designed to serve as a resource for hazard mappers (or other interested parties) to explore how common issues in hazard map development have been addressed at different volcanoes, in different countries, for different hazards, and for different intended audiences. In addition to the comprehensive, searchable Volcanic Hazard Maps Database, this website contains information about diversity of volcanic hazard maps, illustrated using examples from the database. This site is for educational purposes related to volcanic hazard maps. Hazard maps found on this website should not be used for emergency purposes. For the most recent, official hazard map for a particular volcano, please seek out the proper institutional authorities on the matter. |
| IRIS seismic stations/networks | Incorporated Research Institutions for Seismology (IRIS) Data Services map showing the location of seismic stations from all available networks (permanent or temporary) within a radius of 0.18° (about 20 km at mid-latitudes) from the given location of North Gorda Ridge Segment. Users can customize a variety of filters and options in the left panel. Note that if there are no stations are known the map will default to show the entire world with a "No data matched request" error notice. |
| UNAVCO GPS/GNSS stations | Geodetic Data Services map from UNAVCO showing the location of GPS/GNSS stations from all available networks (permanent or temporary) within a radius of 20 km from the given location of North Gorda Ridge Segment. Users can customize the data search based on station or network names, location, and time window. Requires Adobe Flash Player. |
| DECADE Data | The DECADE portal, still in the developmental stage, serves as an example of the proposed interoperability between The Smithsonian Institution's Global Volcanism Program, the Mapping Gas Emissions (MaGa) Database, and the EarthChem Geochemical Portal. The Deep Earth Carbon Degassing (DECADE) initiative seeks to use new and established technologies to determine accurate global fluxes of volcanic CO2 to the atmosphere, but installing CO2 monitoring networks on 20 of the world's 150 most actively degassing volcanoes. The group uses related laboratory-based studies (direct gas sampling and analysis, melt inclusions) to provide new data for direct degassing of deep earth carbon to the atmosphere. |
| Large Eruptions of North Gorda Ridge Segment | Information about large Quaternary eruptions (VEI >= 4) is cataloged in the Large Magnitude Explosive Volcanic Eruptions (LaMEVE) database of the Volcano Global Risk Identification and Analysis Project (VOGRIPA). |
| EarthChem | EarthChem develops and maintains databases, software, and services that support the preservation, discovery, access and analysis of geochemical data, and facilitate their integration with the broad array of other available earth science parameters. EarthChem is operated by a joint team of disciplinary scientists, data scientists, data managers and information technology developers who are part of the NSF-funded data facility Integrated Earth Data Applications (IEDA). IEDA is a collaborative effort of EarthChem and the Marine Geoscience Data System (MGDS). |


 This lava flow was erupted in 1996 along the North Gorda Ridge, the northernmost of five segments of the Gorda Ridge located immediately south of the Blanco Transform Fault, which offsets the Gorda and Juan de Fuca spreading ridges. Submarine cameras revealed new lava flows about 100-200 m wide along a fissure that was at least 3.5 km long. The 65-km-long North Gorda Ridge segment is located about 200 km W of the southern Oregon coast and has an hourglass shape in plan view, with a shallower narrow axial valley at the center.