
In repose; 1st report disclosing background conditions and hazards
This report, our first for this volcano, covers the low-level activity of Cerro Bravo and monitoring efforts during 2006-2012 based on reporting by the Servicio Geológico Colombiano (SGC). Cerro Bravo was non-eruptive and the Alert Level remained at IV (Green; "volcanically active with stable behavior") due to minimal seismicity, gas emissions, and deformation.
Data availability. Government and academic investigations during 1980-1990 established the geology and preliminary hazard analysis for Cerro Bravo. Monthly SGC technical bulletins were available online from March 2006 through December 2012 and documented an increasing diversity of datasets that developed as the monitoring network expanded. Those bulletins highlighted low-level seismicity that was frequently dominated by surficial activity (rockfalls and other mass-wasting events); fluctuations in radon gas emissions were also noted and baseline data was established for emission rates. As of December 2012, three seismometers (two short-period and one triaxial station), one tiltmeter, two EDM leveling lines, and 10 diffuse radon detectors comprised the monitoring effort (figure 1).
 |
Figure 1. Location map of Cerro Bravo and the monitoring network maintained by the Servicio Geológico Colombiano (SGC). One seismic station (CAJO) was ~6 km S of the edifice, beyond this map view. The town of Letras (~6 km SW) was the largest community proximal to the volcano. The yellow road crossing the region is Route 50 which continues to Manizales (25 km W of Cerro Bravo) and to Bogota (140 km SE of Cerro Bravo). This map was modified from the original that appeared in the December 2012 Activity Report of the SGC. |
Thouret and others (1990) presented a framework for regional volcanic activity after conducting an assessment of the Ruiz-Tolima Massif (figure 2). The investigators determined that, within a 2 Ma-long period, "recent explosive activity has migrated towards the intersections of the Palestina strike-slip fault and the N 50°W normal faults, first around [the volcanic centers] Quindío and Tolima, secondly in the Cerro Espana area, and most recently close to Cerro Bravo and Ruiz." Holocene activity at Cerro Bravo was characterized as dacitic with evidence of magma mixing. They also highlighted the role of caldera collapse within the region, including the case of Quebrada Seca Caldera, a major bounding feature of Cerro Bravo (figure 3). The concluding remarks included an emphasis on mass wasting at Cerro Bravo and lahar hazards for the ice-clad volcanoes in the region, mainly Nevado del Ruiz and Nevado del Tolima.
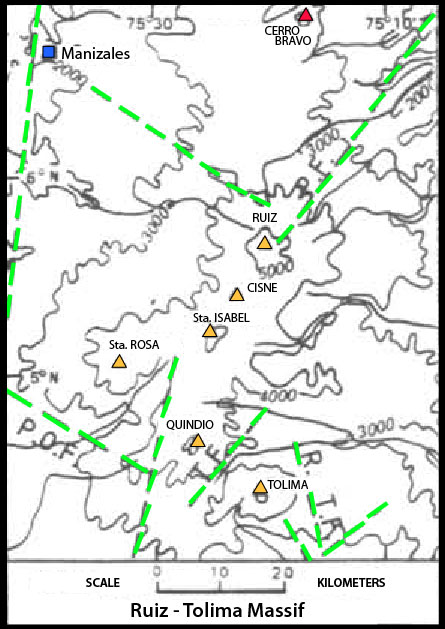 |
Figure 2. This map of seven volcanoes includes Cerro Bravo (red triangle) in the far NE region. Fault lines (dashed green lines) cross the area and are labeled with the following abbreviations: P.F.=Palestina Fault; O.-T.-F.=Otun-Pereira Fault; T.F.=Toche Fault; R.-T.F.=Recio-Tolima Fault. The city of Manizales is marked with a blue square in the NE corner. Modified from Thouret and others, 1995. |
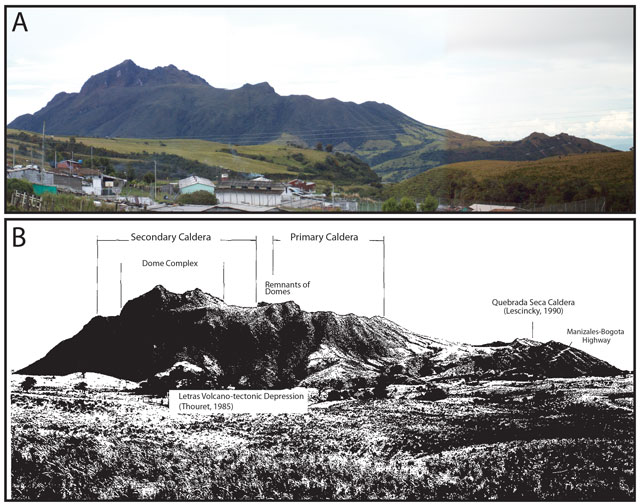 |
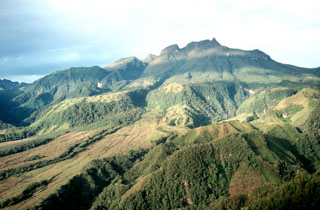
Figure 3. Two views of Cerro Bravo's SW flank from Letras, a town ~6 km SW of the summit. (A) This profile of merged photos was taken in July 2011; note that the youngest domes in the structure comprise the highest peaks on the left-hand side of the photo (northernmost peaks). Courtesy of Maria Luisa Monsalve, SGC. (B) Panorama view of Cerro Bravo annotated with major structural features by Monsalve (1991). |
A government report prepared by Monsalve (1991) assessed the geology of the area and presented several hazard maps for pyroclastic flow, pyroclastic fall, ballistic projectiles, dome collapse, and lahar scenarios. Although ashfall could reach Manizales (~25 km W), most hazards in this study were centrally located around the immediate region of Cerro Bravo, for example pyroclastic flows and flank failures (figure 4). Hazard zones for lahars included the Río Guarino, Río Aguacatal, and Río Gualí which could extend as far as the town of Honda (~80 km E).
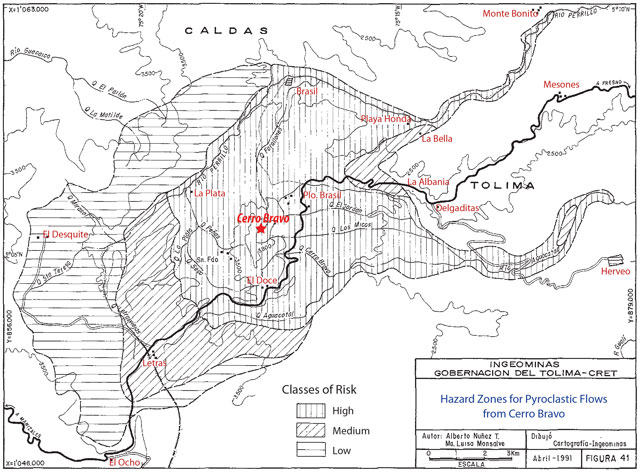 |
Figure 4. This map of hazard zones for Cerro Bravo highlights pyroclastic flow scenarios. The summit of Cerro Bravo is marked with a red star; nearby towns and communities are labeled with green text. Modified from Monsalve (1991). |
Seismicity during 2006-2012. During this reporting period, seismicity occurred at very low levels with 0-9 volcano-tectonic events (VT) recorded per month (table 1). Long-period earthquakes (LP) occurred more frequently with 0-80 events recorded per month. The SGC noted avalanche and rockfall signatures and, relative to the other years reviewed during this report, 2008 and 2011 had a notable number of surficial seismic signatures attributed to small avalanches and rockfalls. An average of 22 avalanche and 14 rockfall events occurred per month whereas the averages were between 1.5 and 10.7, respectively, during other years. The largest single rockfall event occurred in May 2012 and lasted for 34 seconds.
Table 1. Monthly seismicity at Cerro Bravo was tabulated by the occurrence of events: volcano-tectonic (VT), long-period (LP), rockfall, and largest earthquake magnitude. Courtesy of SGC.
| Date | VT | LP | Rockfall | Largest EQ |
| Mar 2006 | 3 | 4 | 2 | 1.62 |
| Apr 2006 | 1 | 5 | 12 | 1.77 |
| May 2006 | 7 | 12 | 15 | 2.15 |
| Jun 2006 | 3 | 12 | 37 | 2.19 |
| Jul 2006 | 0 | 1 | 3 | 1.01 |
| Aug 2006 | 4 | 1 | 7 | 1.49 |
| Sep 2006 | 2 | 0 | 19 | 1.53 |
| Oct 2006 | 2 | 1 | 7 | 0.64 |
| Nov 2006 | 0 | 0 | 5 | -- |
| Dec 2006 | 0 | 0 | 0 | -- |
| Jan 2007 | 0 | 0 | 0 | -- |
| Feb 2007 | 0 | 1 | 0 | 0.7 |
| Mar 2007 | 1 | 7 | 0 | 1.73 |
| Apr 2007 | 2 | 2 | 0 | 2.2 |
| May 2007 | 9 | 7 | 4 | 2.44 |
| Jun 2007 | 4 | 3 | 3 | 2.02 |
| Jul 2007 | 1 | 2 | 0 | 1.67 |
| Aug 2007 | 4 | 3 | 0 | 2.29 |
| Sep 2007 | 0 | 3 | 8 | 1.67 |
| Oct 2007 | 3 | 2 | 1 | 1.77 |
| Nov 2007 | 1 | 1 | 0 | 1.91 |
| Dec 2007 | 1 | 0 | 2 | 0.81 |
| Jan 2008 | 1 | 0 | 0 | 1.3 |
| Feb 2008 | 1 | 0 | 0 | 0.64 |
| Mar 2008 | 1 | 3 | 11 | 2.13 |
| Apr 2008 | 1 | 0 | 2 | 1.9 |
| May 2008 | 0 | 2 | 54 | 1.01 |
| Jun 2008 | 0 | 1 | 74 | 0.81 |
| Jul 2008 | 0 | 0 | 34 | -- |
| Aug 2008 | 1 | 0 | 44 | 1.73 |
| Sep 2008 | 0 | 0 | 7 | -- |
| Oct 2008 | 0 | 0 | 25 | -- |
| Nov 2008 | 0 | 0 | 11 | -- |
| Dec 2008 | 0 | 79 | 3 | 3.4 |
| Jan 2009 | 1 | 9 | 6 | 2.52 |
| Feb 2009 | 0 | 2 | 6 | 2.22 |
| Mar 2009 | 1 | 6 | 2 | 2.32 |
| Apr 2009 | 0 | 0 | 12 | -- |
| May 2009 | 1 | 0 | 18 | 0.88 |
| Jun 2009 | 0 | 0 | 1 | -- |
| Jul 2009 | 0 | 0 | 0 | -- |
| Aug 2009 | 0 | 0 | 8 | -- |
| Sep 2009 | 0 | 3 | 2 | 2.1 |
| Oct 2009 | 0 | 2 | 11 | 1.4 |
| Nov 2009 | 0 | 0 | 0 | -- |
| Dec 2009 | 0 | 1 | 0 | 0.86 |
| Jan 2010 | 1 | 0 | 0 | 1.23 |
| Feb 2010 | 0 | 0 | 5 | -- |
| Mar 2010 | 0 | 2 | 5 | 1.33 |
| Apr 2010 | 0 | 3 | 0 | 2.1 |
| May 2010 | 1 | 5 | 1 | 1.89 |
| Jun 2010 | 0 | 1 | 16 | 1.59 |
| Jul 2010 | 0 | 5 | 2 | 1.98 |
| Aug 2010 | 0 | 0 | 1 | -- |
| Sep 2010 | 1 | 8 | 18 | 1.91 |
| Oct 2010 | 0 | 0 | 6 | -- |
| Nov 2010 | 0 | 5 | 64 | 2.08 |
| Dec 2010 | 0 | 0 | 6 | -- |
| Jan 2011 | 0 | 1 | 1 | 1.75 |
| Feb 2011 | 0 | 0 | 0 | -- |
| Mar 2011 | 0 | 3 | 3 | 1.7 |
| Apr 2011 | 0 | 0 | 26 | -- |
| May 2011 | 0 | 2 | 30 | 1.67 |
| Jun 2011 | 0 | 6 | 40 | 2.43 |
| Jul 2011 | 0 | 0 | 14 | -- |
| Aug 2011 | 2 | 16 | 19 | 1.67 |
| Sep 2011 | 1 | 1 | 12 | 0.64 |
| Oct 2011 | 0 | 0 | 9 | -- |
| Nov 2011 | 3 | 3 | 13 | 1.82 |
| Dec 2011 | 0 | 3 | 5 | 2.37 |
| Jan 2012 | 0 | 2 | 5 | 0.86 |
| Feb 2012 | 1 | 2 | 1 | 1.93 |
| Mar 2012 | 0 | 0 | 2 | -- |
| Apr 2012 | 1 | 1 | 3 | 1.8 |
| May 2012 | 0 | 0 | 2 | -- |
| Jun 2012 | 0 | 0 | 3 | -- |
| Jul 2012 | 1 | 0 | 0 | 1.11 |
| Aug 2012 | 0 | 0 | 1 | -- |
| Sep 2012 | 0 | 1 | 1 | 2.22 |
| Oct 2012 | 0 | 0 | 6 | -- |
| Nov 2012 | 0 | 1 | 0 | 1.61 |
| Dec 2012 | 0 | 0 | 0 | -- |
The largest recorded earthquake magnitude, M 3.4, was recorded in December 2008. The average magnitude during this reporting period was M 1.7. An anomalous 2-hour-long signal was recorded in June 2006; that month, seismicity was slightly elevated (3 VT, 11 LP, and 37 rockfalls).
The SGC August 2008 bulletin highlighted a seismic swarm within the region of Cerro Bravo. The swarm was detected on 9 August 2008 comprising 65 earthquakes at an undetermined distance NE of Paramillo del Quindío (located ~40 km S of Cerro Bravo) at relatively shallow depths (2-5 km). The earthquakes had small magnitudes; the largest was M 1.14. A second swarm occurred on 30 December 2008, when ~80 LP earthquakes were detected. The largest event, an M 2.3 earthquake, occurred S of Cerro Bravo and caused shaking that was noted by residents of Manizales (particularly those in tall buildings).
A swarm of 67 earthquakes occurred during 17-29 November 2010. The SGC noted that rockfalls and avalanches were likely responsible for these events. That month, there were five LP earthquakes but no VT earthquakes were detected.
Rockfalls and avalanches were attributed to elevated seismicity in June 2011 when 40 events were detected that month. While those earthquakes were occurring, there were no associated geophysical or geochemical changes observed at the edifice.
Geochemical monitoring efforts. Radon and carbon dioxide data were recorded by the SGC during 2005 through 2012 (figure 5), although CO2 data became unavailable after October 2009. The SGC reported that background level emissions were classified as values 2 data rarely coincided with radon except for a prominent increase around June 2008 at that Cerro Bravo 2 station CO2 measured ~2.7% volume and the radon peak was ~900 pCi/L.
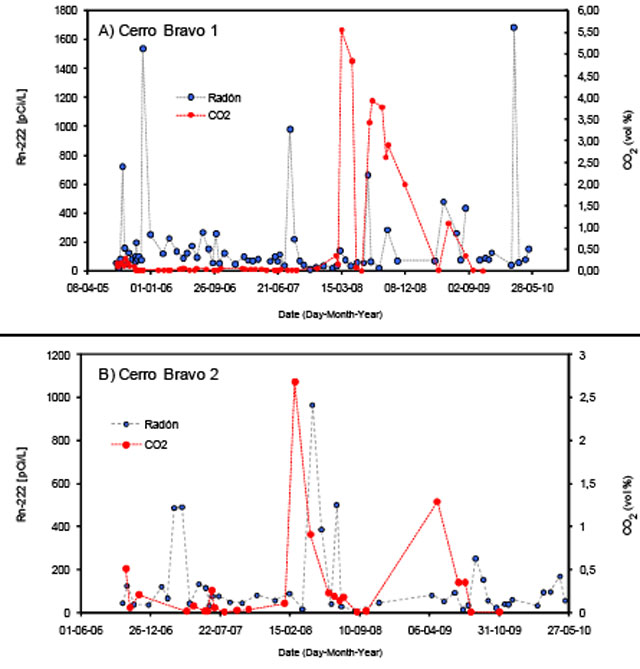 |
Figure 5. Radon and carbon dioxide emissions from Cerro Bravo during April 2005 - May 2010 (Cerro Bravo 1 Station) and June 2005-May 2010 (Cerro Bravo 2 Station). Note that, at both stations, CO2 data ended in October 2009. Courtesy of SGC. |
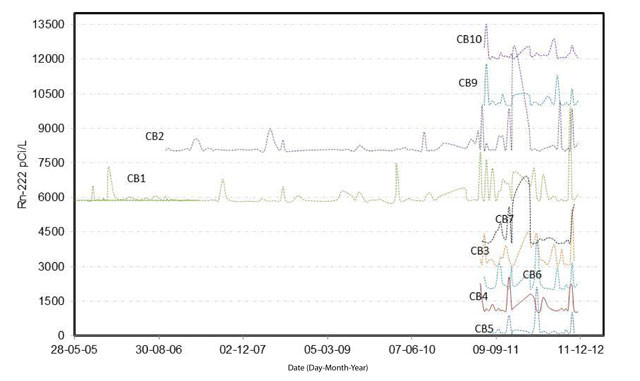 |
Figure 6. This plot of radon emissions for 2005-2012 includes increasingly more radon stations over time. Installation of eight new stations occurred in June 2011 at a time when radon emissions were peaking around 2,000 pCi/L. Courtesy of SGC. |
Surface deformation monitoring. In October 2009, the SGC installed reflectors and base stations for two EDM (Electronic Distance Measurement) lines (figure 1). An EDM survey was conducted three months later, beginning the establishment of long-term surface deformation monitoring. During 2009-2012, eight EDM surveys were conducted from the El Doce base and four EDM surveys were conducted from El Porton; the SGC stated that no significant changes were calculated from these datasets.
Monitoring with an electronic tilt station began in late March 2011 with an installation on the E flank (figure 1). Stable conditions were recorded by the tiltmeter up until December 2011 when decreasing trends suddenly began from both N and E components (figure 7). The SGC noted that from December 2011 to early April 2012 there was a total change of -5 & mu;m and -8 & mu;m (N and E components respectively). During April-December 2012, generally stable conditions resumed.
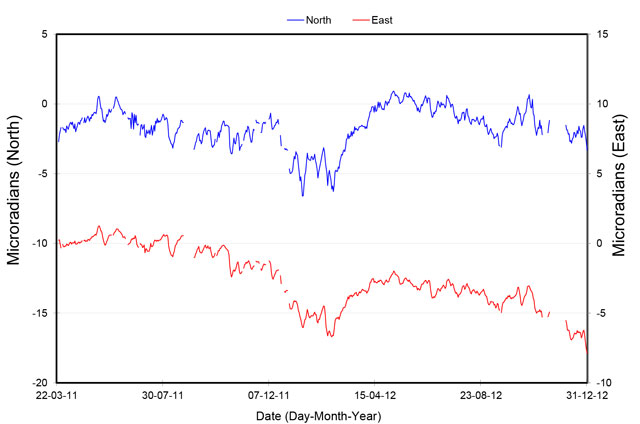 |
Figure 7. The electronic tilt record from CBRE station (located on the E flank). With the exception of December 2011-April 2012 (when significant decreasing trends persisted), this record showed fluctuations within expected range of the instrument. Courtesy of SGC. |
References. Lescinsky, D., 1990, Geology, volcanology and petrology of Cerro Bravo, a young dacitic stratovolcano in West-Central Colombia [Master's Thesis]: Hanover, NH, Dartmouth College, 244 pp.
Monsalve, M.L., 1991. Mapa preliminar de amenaza volcánica del Volcán Cerro Bravo, INGEOMINAS, Prepared for the Government of Tolima and CRE-Tolima.
Thouret, J.C., Cantagrel, J-M., Robin, C., Murcia, A., Salinas, R., and Cepeda, H., 1995, Quaternary eruptive history and hazard-zone model at Nevado del Tolima and Cerro Machin volcanoes, Colombia. Journal of Volcanology Geothermal Research, 66 (1-4):397-426.
Thouret, J.C., Murcia, A., Salinas, R., Parra, E., Cepeda, H., and Cantagrel, J-M., Stratigraphy and quaternary eruptive history of the Ruiz-Tolima volcanic massif (Colombia): Implications for assessment of volcanic hazards. Symposium International Géodynamique Andine: Résumés des communications. 15-17 May 1990, Grenoble, France. p. 391-393.
Information Contacts: María Luisa Monsalve, Gloria Patricia Cortés, and Cristian Mauricio López, Servicio Geológico Colombiano (SGC), Volcanological and Seismological Observatory, Avenida 12 Octubre 15-47, Manizales, Colombia (URL: https://www2.sgc.gov.co/volcanes/index.html).
The Global Volcanism Program has no Weekly Reports available for Cerro Bravo.
Reports are organized chronologically and indexed below by Month/Year (Publication Volume:Number), and include a one-line summary. Click on the index link or scroll down to read the reports.
In repose; 1st report disclosing background conditions and hazards
This report, our first for this volcano, covers the low-level activity of Cerro Bravo and monitoring efforts during 2006-2012 based on reporting by the Servicio Geológico Colombiano (SGC). Cerro Bravo was non-eruptive and the Alert Level remained at IV (Green; "volcanically active with stable behavior") due to minimal seismicity, gas emissions, and deformation.
Data availability. Government and academic investigations during 1980-1990 established the geology and preliminary hazard analysis for Cerro Bravo. Monthly SGC technical bulletins were available online from March 2006 through December 2012 and documented an increasing diversity of datasets that developed as the monitoring network expanded. Those bulletins highlighted low-level seismicity that was frequently dominated by surficial activity (rockfalls and other mass-wasting events); fluctuations in radon gas emissions were also noted and baseline data was established for emission rates. As of December 2012, three seismometers (two short-period and one triaxial station), one tiltmeter, two EDM leveling lines, and 10 diffuse radon detectors comprised the monitoring effort (figure 1).
|
Figure 1. Location map of Cerro Bravo and the monitoring network maintained by the Servicio Geológico Colombiano (SGC). One seismic station (CAJO) was ~6 km S of the edifice, beyond this map view. The town of Letras (~6 km SW) was the largest community proximal to the volcano. The yellow road crossing the region is Route 50 which continues to Manizales (25 km W of Cerro Bravo) and to Bogota (140 km SE of Cerro Bravo). This map was modified from the original that appeared in the December 2012 Activity Report of the SGC. |
Thouret and others (1990) presented a framework for regional volcanic activity after conducting an assessment of the Ruiz-Tolima Massif (figure 2). The investigators determined that, within a 2 Ma-long period, "recent explosive activity has migrated towards the intersections of the Palestina strike-slip fault and the N 50°W normal faults, first around [the volcanic centers] Quindío and Tolima, secondly in the Cerro Espana area, and most recently close to Cerro Bravo and Ruiz." Holocene activity at Cerro Bravo was characterized as dacitic with evidence of magma mixing. They also highlighted the role of caldera collapse within the region, including the case of Quebrada Seca Caldera, a major bounding feature of Cerro Bravo (figure 3). The concluding remarks included an emphasis on mass wasting at Cerro Bravo and lahar hazards for the ice-clad volcanoes in the region, mainly Nevado del Ruiz and Nevado del Tolima.
|
Figure 2. This map of seven volcanoes includes Cerro Bravo (red triangle) in the far NE region. Fault lines (dashed green lines) cross the area and are labeled with the following abbreviations: P.F.=Palestina Fault; O.-T.-F.=Otun-Pereira Fault; T.F.=Toche Fault; R.-T.F.=Recio-Tolima Fault. The city of Manizales is marked with a blue square in the NE corner. Modified from Thouret and others, 1995. |
|
Figure 3. Two views of Cerro Bravo's SW flank from Letras, a town ~6 km SW of the summit. (A) This profile of merged photos was taken in July 2011; note that the youngest domes in the structure comprise the highest peaks on the left-hand side of the photo (northernmost peaks). Courtesy of Maria Luisa Monsalve, SGC. (B) Panorama view of Cerro Bravo annotated with major structural features by Monsalve (1991). |
A government report prepared by Monsalve (1991) assessed the geology of the area and presented several hazard maps for pyroclastic flow, pyroclastic fall, ballistic projectiles, dome collapse, and lahar scenarios. Although ashfall could reach Manizales (~25 km W), most hazards in this study were centrally located around the immediate region of Cerro Bravo, for example pyroclastic flows and flank failures (figure 4). Hazard zones for lahars included the Río Guarino, Río Aguacatal, and Río Gualí which could extend as far as the town of Honda (~80 km E).
|
Figure 4. This map of hazard zones for Cerro Bravo highlights pyroclastic flow scenarios. The summit of Cerro Bravo is marked with a red star; nearby towns and communities are labeled with green text. Modified from Monsalve (1991). |
Seismicity during 2006-2012. During this reporting period, seismicity occurred at very low levels with 0-9 volcano-tectonic events (VT) recorded per month (table 1). Long-period earthquakes (LP) occurred more frequently with 0-80 events recorded per month. The SGC noted avalanche and rockfall signatures and, relative to the other years reviewed during this report, 2008 and 2011 had a notable number of surficial seismic signatures attributed to small avalanches and rockfalls. An average of 22 avalanche and 14 rockfall events occurred per month whereas the averages were between 1.5 and 10.7, respectively, during other years. The largest single rockfall event occurred in May 2012 and lasted for 34 seconds.
Table 1. Monthly seismicity at Cerro Bravo was tabulated by the occurrence of events: volcano-tectonic (VT), long-period (LP), rockfall, and largest earthquake magnitude. Courtesy of SGC.
| Date | VT | LP | Rockfall | Largest EQ |
| Mar 2006 | 3 | 4 | 2 | 1.62 |
| Apr 2006 | 1 | 5 | 12 | 1.77 |
| May 2006 | 7 | 12 | 15 | 2.15 |
| Jun 2006 | 3 | 12 | 37 | 2.19 |
| Jul 2006 | 0 | 1 | 3 | 1.01 |
| Aug 2006 | 4 | 1 | 7 | 1.49 |
| Sep 2006 | 2 | 0 | 19 | 1.53 |
| Oct 2006 | 2 | 1 | 7 | 0.64 |
| Nov 2006 | 0 | 0 | 5 | -- |
| Dec 2006 | 0 | 0 | 0 | -- |
| Jan 2007 | 0 | 0 | 0 | -- |
| Feb 2007 | 0 | 1 | 0 | 0.7 |
| Mar 2007 | 1 | 7 | 0 | 1.73 |
| Apr 2007 | 2 | 2 | 0 | 2.2 |
| May 2007 | 9 | 7 | 4 | 2.44 |
| Jun 2007 | 4 | 3 | 3 | 2.02 |
| Jul 2007 | 1 | 2 | 0 | 1.67 |
| Aug 2007 | 4 | 3 | 0 | 2.29 |
| Sep 2007 | 0 | 3 | 8 | 1.67 |
| Oct 2007 | 3 | 2 | 1 | 1.77 |
| Nov 2007 | 1 | 1 | 0 | 1.91 |
| Dec 2007 | 1 | 0 | 2 | 0.81 |
| Jan 2008 | 1 | 0 | 0 | 1.3 |
| Feb 2008 | 1 | 0 | 0 | 0.64 |
| Mar 2008 | 1 | 3 | 11 | 2.13 |
| Apr 2008 | 1 | 0 | 2 | 1.9 |
| May 2008 | 0 | 2 | 54 | 1.01 |
| Jun 2008 | 0 | 1 | 74 | 0.81 |
| Jul 2008 | 0 | 0 | 34 | -- |
| Aug 2008 | 1 | 0 | 44 | 1.73 |
| Sep 2008 | 0 | 0 | 7 | -- |
| Oct 2008 | 0 | 0 | 25 | -- |
| Nov 2008 | 0 | 0 | 11 | -- |
| Dec 2008 | 0 | 79 | 3 | 3.4 |
| Jan 2009 | 1 | 9 | 6 | 2.52 |
| Feb 2009 | 0 | 2 | 6 | 2.22 |
| Mar 2009 | 1 | 6 | 2 | 2.32 |
| Apr 2009 | 0 | 0 | 12 | -- |
| May 2009 | 1 | 0 | 18 | 0.88 |
| Jun 2009 | 0 | 0 | 1 | -- |
| Jul 2009 | 0 | 0 | 0 | -- |
| Aug 2009 | 0 | 0 | 8 | -- |
| Sep 2009 | 0 | 3 | 2 | 2.1 |
| Oct 2009 | 0 | 2 | 11 | 1.4 |
| Nov 2009 | 0 | 0 | 0 | -- |
| Dec 2009 | 0 | 1 | 0 | 0.86 |
| Jan 2010 | 1 | 0 | 0 | 1.23 |
| Feb 2010 | 0 | 0 | 5 | -- |
| Mar 2010 | 0 | 2 | 5 | 1.33 |
| Apr 2010 | 0 | 3 | 0 | 2.1 |
| May 2010 | 1 | 5 | 1 | 1.89 |
| Jun 2010 | 0 | 1 | 16 | 1.59 |
| Jul 2010 | 0 | 5 | 2 | 1.98 |
| Aug 2010 | 0 | 0 | 1 | -- |
| Sep 2010 | 1 | 8 | 18 | 1.91 |
| Oct 2010 | 0 | 0 | 6 | -- |
| Nov 2010 | 0 | 5 | 64 | 2.08 |
| Dec 2010 | 0 | 0 | 6 | -- |
| Jan 2011 | 0 | 1 | 1 | 1.75 |
| Feb 2011 | 0 | 0 | 0 | -- |
| Mar 2011 | 0 | 3 | 3 | 1.7 |
| Apr 2011 | 0 | 0 | 26 | -- |
| May 2011 | 0 | 2 | 30 | 1.67 |
| Jun 2011 | 0 | 6 | 40 | 2.43 |
| Jul 2011 | 0 | 0 | 14 | -- |
| Aug 2011 | 2 | 16 | 19 | 1.67 |
| Sep 2011 | 1 | 1 | 12 | 0.64 |
| Oct 2011 | 0 | 0 | 9 | -- |
| Nov 2011 | 3 | 3 | 13 | 1.82 |
| Dec 2011 | 0 | 3 | 5 | 2.37 |
| Jan 2012 | 0 | 2 | 5 | 0.86 |
| Feb 2012 | 1 | 2 | 1 | 1.93 |
| Mar 2012 | 0 | 0 | 2 | -- |
| Apr 2012 | 1 | 1 | 3 | 1.8 |
| May 2012 | 0 | 0 | 2 | -- |
| Jun 2012 | 0 | 0 | 3 | -- |
| Jul 2012 | 1 | 0 | 0 | 1.11 |
| Aug 2012 | 0 | 0 | 1 | -- |
| Sep 2012 | 0 | 1 | 1 | 2.22 |
| Oct 2012 | 0 | 0 | 6 | -- |
| Nov 2012 | 0 | 1 | 0 | 1.61 |
| Dec 2012 | 0 | 0 | 0 | -- |
The largest recorded earthquake magnitude, M 3.4, was recorded in December 2008. The average magnitude during this reporting period was M 1.7. An anomalous 2-hour-long signal was recorded in June 2006; that month, seismicity was slightly elevated (3 VT, 11 LP, and 37 rockfalls).
The SGC August 2008 bulletin highlighted a seismic swarm within the region of Cerro Bravo. The swarm was detected on 9 August 2008 comprising 65 earthquakes at an undetermined distance NE of Paramillo del Quindío (located ~40 km S of Cerro Bravo) at relatively shallow depths (2-5 km). The earthquakes had small magnitudes; the largest was M 1.14. A second swarm occurred on 30 December 2008, when ~80 LP earthquakes were detected. The largest event, an M 2.3 earthquake, occurred S of Cerro Bravo and caused shaking that was noted by residents of Manizales (particularly those in tall buildings).
A swarm of 67 earthquakes occurred during 17-29 November 2010. The SGC noted that rockfalls and avalanches were likely responsible for these events. That month, there were five LP earthquakes but no VT earthquakes were detected.
Rockfalls and avalanches were attributed to elevated seismicity in June 2011 when 40 events were detected that month. While those earthquakes were occurring, there were no associated geophysical or geochemical changes observed at the edifice.
Geochemical monitoring efforts. Radon and carbon dioxide data were recorded by the SGC during 2005 through 2012 (figure 5), although CO2 data became unavailable after October 2009. The SGC reported that background level emissions were classified as values 2 data rarely coincided with radon except for a prominent increase around June 2008 at that Cerro Bravo 2 station CO2 measured ~2.7% volume and the radon peak was ~900 pCi/L.
|
Figure 5. Radon and carbon dioxide emissions from Cerro Bravo during April 2005 - May 2010 (Cerro Bravo 1 Station) and June 2005-May 2010 (Cerro Bravo 2 Station). Note that, at both stations, CO2 data ended in October 2009. Courtesy of SGC. |
|
Figure 6. This plot of radon emissions for 2005-2012 includes increasingly more radon stations over time. Installation of eight new stations occurred in June 2011 at a time when radon emissions were peaking around 2,000 pCi/L. Courtesy of SGC. |
Surface deformation monitoring. In October 2009, the SGC installed reflectors and base stations for two EDM (Electronic Distance Measurement) lines (figure 1). An EDM survey was conducted three months later, beginning the establishment of long-term surface deformation monitoring. During 2009-2012, eight EDM surveys were conducted from the El Doce base and four EDM surveys were conducted from El Porton; the SGC stated that no significant changes were calculated from these datasets.
Monitoring with an electronic tilt station began in late March 2011 with an installation on the E flank (figure 1). Stable conditions were recorded by the tiltmeter up until December 2011 when decreasing trends suddenly began from both N and E components (figure 7). The SGC noted that from December 2011 to early April 2012 there was a total change of -5 & mu;m and -8 & mu;m (N and E components respectively). During April-December 2012, generally stable conditions resumed.
|
Figure 7. The electronic tilt record from CBRE station (located on the E flank). With the exception of December 2011-April 2012 (when significant decreasing trends persisted), this record showed fluctuations within expected range of the instrument. Courtesy of SGC. |
References. Lescinsky, D., 1990, Geology, volcanology and petrology of Cerro Bravo, a young dacitic stratovolcano in West-Central Colombia [Master's Thesis]: Hanover, NH, Dartmouth College, 244 pp.
Monsalve, M.L., 1991. Mapa preliminar de amenaza volcánica del Volcán Cerro Bravo, INGEOMINAS, Prepared for the Government of Tolima and CRE-Tolima.
Thouret, J.C., Cantagrel, J-M., Robin, C., Murcia, A., Salinas, R., and Cepeda, H., 1995, Quaternary eruptive history and hazard-zone model at Nevado del Tolima and Cerro Machin volcanoes, Colombia. Journal of Volcanology Geothermal Research, 66 (1-4):397-426.
Thouret, J.C., Murcia, A., Salinas, R., Parra, E., Cepeda, H., and Cantagrel, J-M., Stratigraphy and quaternary eruptive history of the Ruiz-Tolima volcanic massif (Colombia): Implications for assessment of volcanic hazards. Symposium International Géodynamique Andine: Résumés des communications. 15-17 May 1990, Grenoble, France. p. 391-393.
Information Contacts: María Luisa Monsalve, Gloria Patricia Cortés, and Cristian Mauricio López, Servicio Geológico Colombiano (SGC), Volcanological and Seismological Observatory, Avenida 12 Octubre 15-47, Manizales, Colombia (URL: https://www2.sgc.gov.co/volcanes/index.html).
|
|
||||||||||||||||||||||||||
There is data available for 8 confirmed eruptive periods.
1720 ± 150 years Confirmed Eruption (Explosive / Effusive) VEI: 4
| Episode 1 | Eruption (Explosive / Effusive) | CB1 tephra | ||||||||||||||||||||||||||||||||||||||
|---|---|---|---|---|---|---|---|---|---|---|---|---|---|---|---|---|---|---|---|---|---|---|---|---|---|---|---|---|---|---|---|---|---|---|---|---|---|---|---|
| 1720 ± 150 years - Unknown | Evidence from Correlation: Tephrochronology | ||||||||||||||||||||||||||||||||||||||
|
List of 6 Events for Episode 1 at CB1 tephra
|
|||||||||||||||||||||||||||||||||||||||
1330 ± 75 years Confirmed Eruption (Explosive / Effusive) VEI: 4
| Episode 1 | Eruption (Explosive / Effusive) | CB2 tephra | ||||||||||||||||||||||||||||
|---|---|---|---|---|---|---|---|---|---|---|---|---|---|---|---|---|---|---|---|---|---|---|---|---|---|---|---|---|---|
| 1330 ± 75 years - Unknown | Evidence from Isotopic: 14C (uncalibrated) | ||||||||||||||||||||||||||||
|
List of 4 Events for Episode 1 at CB2 tephra
|
|||||||||||||||||||||||||||||
1050 ± 75 years Confirmed Eruption (Explosive / Effusive) VEI: 4
| Episode 1 | Eruption (Explosive / Effusive) | CB3 tephra | |||||||||||||||||||||||||||||||||
|---|---|---|---|---|---|---|---|---|---|---|---|---|---|---|---|---|---|---|---|---|---|---|---|---|---|---|---|---|---|---|---|---|---|---|
| 1050 ± 75 years - Unknown | Evidence from Isotopic: 14C (uncalibrated) | |||||||||||||||||||||||||||||||||
|
List of 5 Events for Episode 1 at CB3 tephra
|
||||||||||||||||||||||||||||||||||
0750 ± 150 years Confirmed Eruption (Explosive / Effusive) VEI: 4
| Episode 1 | Eruption (Explosive / Effusive) | CB4 tephra | |||||||||||||||||||||||||||||||||
|---|---|---|---|---|---|---|---|---|---|---|---|---|---|---|---|---|---|---|---|---|---|---|---|---|---|---|---|---|---|---|---|---|---|---|
| 0750 ± 150 years - Unknown | Evidence from Isotopic: 14C (uncalibrated) | |||||||||||||||||||||||||||||||||
|
List of 5 Events for Episode 1 at CB4 tephra
|
||||||||||||||||||||||||||||||||||
0730 BCE ± 75 years Confirmed Eruption (Explosive / Effusive) VEI: 4
| Episode 1 | Eruption (Explosive / Effusive) | CB5 tephra | ||||||||||||||||||||||||||||||||||||||
|---|---|---|---|---|---|---|---|---|---|---|---|---|---|---|---|---|---|---|---|---|---|---|---|---|---|---|---|---|---|---|---|---|---|---|---|---|---|---|---|
| 0730 BCE ± 75 years - Unknown | Evidence from Isotopic: 14C (uncalibrated) | ||||||||||||||||||||||||||||||||||||||
|
List of 6 Events for Episode 1 at CB5 tephra
|
|||||||||||||||||||||||||||||||||||||||
1050 BCE ± 200 years Confirmed Eruption (Explosive / Effusive) VEI: 4
| Episode 1 | Eruption (Explosive / Effusive) | CB6 tephra | ||||||||||||||||||||||||||||
|---|---|---|---|---|---|---|---|---|---|---|---|---|---|---|---|---|---|---|---|---|---|---|---|---|---|---|---|---|---|
| 1050 BCE ± 200 years - Unknown | Evidence from Correlation: Tephrochronology | ||||||||||||||||||||||||||||
|
List of 4 Events for Episode 1 at CB6 tephra
|
|||||||||||||||||||||||||||||
1310 BCE ± 150 years Confirmed Eruption (Explosive / Effusive) VEI: 4
| Episode 1 | Eruption (Explosive / Effusive) | CB7 tephra | ||||||||||||||||||||||||||||
|---|---|---|---|---|---|---|---|---|---|---|---|---|---|---|---|---|---|---|---|---|---|---|---|---|---|---|---|---|---|
| 1310 BCE ± 150 years - Unknown | Evidence from Isotopic: 14C (uncalibrated) | ||||||||||||||||||||||||||||
|
List of 4 Events for Episode 1 at CB7 tephra
|
|||||||||||||||||||||||||||||
4280 BCE ± 150 years Confirmed Eruption (Explosive / Effusive) VEI: 4
| Episode 1 | Eruption (Explosive / Effusive) | CB9 tephra | ||||||||||||||||||||||||||||
|---|---|---|---|---|---|---|---|---|---|---|---|---|---|---|---|---|---|---|---|---|---|---|---|---|---|---|---|---|---|
| 4280 BCE ± 150 years - Unknown | Evidence from Isotopic: 14C (uncalibrated) | ||||||||||||||||||||||||||||
|
List of 4 Events for Episode 1 at CB9 tephra
|
|||||||||||||||||||||||||||||
This compilation of synonyms and subsidiary features may not be comprehensive. Features are organized into four major categories: Cones, Craters, Domes, and Thermal Features. Synonyms of features appear indented below the primary name. In some cases additional feature type, elevation, or location details are provided.
Craters |
||||
| Feature Name | Feature Type | Elevation | Latitude | Longitude |
| Quebrada Seca | Caldera | |||
 Cerro Bravo is seen from the east. The summit dome was extruded during the most recent eruption and has a spine (a steep dome) near the top. An older lava dome and cone complex is situated to the left. Multiple collapse events sent block-and-ash flows down over lava flows (center) and onto the Plan de Arriba (lower left). The low tree-covered slope (left foreground) is the remnant of the pre-Cerro Bravo edifice that was destroyed by a Pleistocene caldera-forming event.
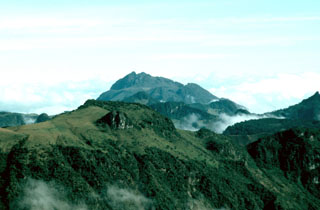 Cerro Bravo in Colombia is seen to the north from the N flank of Nevado del Ruiz. The CB1 summit dome rises above an older dome and cone complex, probably produced during the CB7-CB5 eruptive periods. Below this, the remains of the pre-Cerro Bravo volcano encompass the Pleistocene Quebrada Seca caldera. Most of the Pleistocene lava flows in the foreground are associated with Nevado del Ruiz.
There are no samples for Cerro Bravo in the Smithsonian's NMNH Department of Mineral Sciences Rock and Ore collection.
| Copernicus Browser | The Copernicus Browser replaced the Sentinel Hub Playground browser in 2023, to provide access to Earth observation archives from the Copernicus Data Space Ecosystem, the main distribution platform for data from the EU Copernicus missions. |
| MIROVA | Middle InfraRed Observation of Volcanic Activity (MIROVA) is a near real time volcanic hot-spot detection system based on the analysis of MODIS (Moderate Resolution Imaging Spectroradiometer) data. In particular, MIROVA uses the Middle InfraRed Radiation (MIR), measured over target volcanoes, in order to detect, locate and measure the heat radiation sourced from volcanic activity. |
| MODVOLC Thermal Alerts | Using infrared satellite Moderate Resolution Imaging Spectroradiometer (MODIS) data, scientists at the Hawai'i Institute of Geophysics and Planetology, University of Hawai'i, developed an automated system called MODVOLC to map thermal hot-spots in near real time. For each MODIS image, the algorithm automatically scans each 1 km pixel within it to check for high-temperature hot-spots. When one is found the date, time, location, and intensity are recorded. MODIS looks at every square km of the Earth every 48 hours, once during the day and once during the night, and the presence of two MODIS sensors in space allows at least four hot-spot observations every two days. Each day updated global maps are compiled to display the locations of all hot spots detected in the previous 24 hours. There is a drop-down list with volcano names which allow users to 'zoom-in' and examine the distribution of hot-spots at a variety of spatial scales. |
|
WOVOdat
Single Volcano View Temporal Evolution of Unrest Side by Side Volcanoes |
WOVOdat is a database of volcanic unrest; instrumentally and visually recorded changes in seismicity, ground deformation, gas emission, and other parameters from their normal baselines. It is sponsored by the World Organization of Volcano Observatories (WOVO) and presently hosted at the Earth Observatory of Singapore.
GVMID Data on Volcano Monitoring Infrastructure The Global Volcano Monitoring Infrastructure Database GVMID, is aimed at documenting and improving capabilities of volcano monitoring from the ground and space. GVMID should provide a snapshot and baseline view of the techniques and instrumentation that are in place at various volcanoes, which can be use by volcano observatories as reference to setup new monitoring system or improving networks at a specific volcano. These data will allow identification of what monitoring gaps exist, which can be then targeted by remote sensing infrastructure and future instrument deployments. |
| Volcanic Hazard Maps | The IAVCEI Commission on Volcanic Hazards and Risk has a Volcanic Hazard Maps database designed to serve as a resource for hazard mappers (or other interested parties) to explore how common issues in hazard map development have been addressed at different volcanoes, in different countries, for different hazards, and for different intended audiences. In addition to the comprehensive, searchable Volcanic Hazard Maps Database, this website contains information about diversity of volcanic hazard maps, illustrated using examples from the database. This site is for educational purposes related to volcanic hazard maps. Hazard maps found on this website should not be used for emergency purposes. For the most recent, official hazard map for a particular volcano, please seek out the proper institutional authorities on the matter. |
| IRIS seismic stations/networks | Incorporated Research Institutions for Seismology (IRIS) Data Services map showing the location of seismic stations from all available networks (permanent or temporary) within a radius of 0.18° (about 20 km at mid-latitudes) from the given location of Cerro Bravo. Users can customize a variety of filters and options in the left panel. Note that if there are no stations are known the map will default to show the entire world with a "No data matched request" error notice. |
| UNAVCO GPS/GNSS stations | Geodetic Data Services map from UNAVCO showing the location of GPS/GNSS stations from all available networks (permanent or temporary) within a radius of 20 km from the given location of Cerro Bravo. Users can customize the data search based on station or network names, location, and time window. Requires Adobe Flash Player. |
| DECADE Data | The DECADE portal, still in the developmental stage, serves as an example of the proposed interoperability between The Smithsonian Institution's Global Volcanism Program, the Mapping Gas Emissions (MaGa) Database, and the EarthChem Geochemical Portal. The Deep Earth Carbon Degassing (DECADE) initiative seeks to use new and established technologies to determine accurate global fluxes of volcanic CO2 to the atmosphere, but installing CO2 monitoring networks on 20 of the world's 150 most actively degassing volcanoes. The group uses related laboratory-based studies (direct gas sampling and analysis, melt inclusions) to provide new data for direct degassing of deep earth carbon to the atmosphere. |
| Large Eruptions of Cerro Bravo | Information about large Quaternary eruptions (VEI >= 4) is cataloged in the Large Magnitude Explosive Volcanic Eruptions (LaMEVE) database of the Volcano Global Risk Identification and Analysis Project (VOGRIPA). |
| EarthChem | EarthChem develops and maintains databases, software, and services that support the preservation, discovery, access and analysis of geochemical data, and facilitate their integration with the broad array of other available earth science parameters. EarthChem is operated by a joint team of disciplinary scientists, data scientists, data managers and information technology developers who are part of the NSF-funded data facility Integrated Earth Data Applications (IEDA). IEDA is a collaborative effort of EarthChem and the Marine Geoscience Data System (MGDS). |

