On 28 December IG reported continued anomalous seismic activity at Cayambe characterized by volcano-tectonic and long-period earthquakes located 2-8 km below the summit. As many as 40 earthquakes had been recorded each day for the previous two weeks and starting on 24 December that number again increased, especially for volcano-tectonic events. A swarm on 27 December consisted of 100 small-magnitude events. A strong sulfur odor persisted, and cracks in the glacier near the summit that climbers has recently reported were visible during an overflight. In addition, deformation on the flanks was detected in GPS data.
Source: Instituto Geofísico-Escuela Politécnica Nacional (IG-EPN)
Seismic swarms occur erratically in 2004 and 2005
During 2004, Cayambe's seismicity increased three times, on 25-31 January, on 25 February-5 March, and on 4-12 October. Our previous report on Cayambe discussed events through November 2003 (BGVN 28:11).
The first seismic swarm began on 25 January 2004 when the number of volcano-tectonic (VT) earthquakes increased, with seismic activity occurring in bands lasting 2-3 hours. The events were small in magnitude and were located ~ 1-4 km below the SW flank. At 1934 on 27 January, a magnitude 3.4 earthquake was recorded. On 29 January, the activity peaked with 148 earthquakes reported. Seismicity thereafter decreased to normal base-line levels.
The second earthquake swarm began on 25 February with an increased number of VT earthquakes. Like the January events, these earthquakes were of low magnitude. The largest event occurred on 29 February at 1059 measuring M 3.1. The events were localized primarily below the E flank with peak activity on 2 March, when 271 earthquakes were registered. The energy released by this cluster was far larger than the one in January and was almost comparable to activity in March 2003 (figure 2).
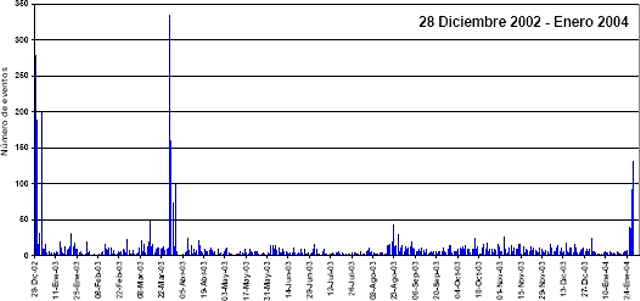 |
Figure 2. The total number of earthquakes each day at Cayambe during 28 December 2002 through early January 2004. The spike in daily earthquakes seen during late March 2003 (up to 330 per day) was discussed in BGVN 28:11. A spike about half that size occurred in late January 2004. Courtesy of the Instituto Geofisico. |
On 12 March, a small increase in activity was recorded, and on the morning of 15 March, a M 3.6 earthquake was recorded on the S flank. Residents reported no felt earthquakes.
On 4 October, there was a slight increase in the number of events registered with a total of 18 events, 17 of which were hybrid events. At 2333 on 6 October a M 3.4 event was recorded. These earthquakes were located in the S zone of the volcano edifice. Two seismic swarms on 8 October consisted of 177 VT earthquakes. The first swarm registered at 0500 and lasted an hour. The second swarm began at 1130 and lasted approximately 9 hours. Some of these events were located in the SW flank. After the seismic anomalies on 4 and 6- 8 October, activity returned to normal base-line levels.
Apart from the swarms between September and October, the seismicity appears to have changed, with the number of VT events diminishing by one-half in relation to those previously recorded, whereas the number of hybrid events tripled. Later, long-period LP events were again observed, which is characteristic of this volcano returning to normal levels.
The internal seismic activity at Cayambe is characterized by the generation of 10 events per day on average. Nevertheless, this type of activity has alternated with sporadic seismic swarms consisting of hundreds of events lasting several days, after which activity returns to the base-line level. These types of seismic swarms were recorded in December 2002, March 2003, and in January, March, and October of 2004 (figure 3), with similar characteristics and averaging 2 days in duration. Scientists inferred the cause of the observed seismicity as related to motion of fluids in the interior of the edifice. Thermal images obtained during 2004 did not contain anomalies.
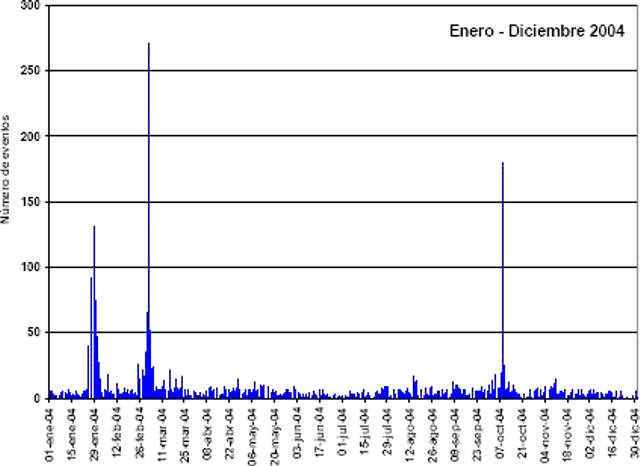 |
Figure 3. The total number of earthquakes each day at Cayambe during 2004 (tick marks along x-axis are every 14 days). The record was punctuated by three strong increases in seismicity, during late January, during February-March, and during October. The spike in daily earthquakes seen during February 2004 neared 300 earthquakes per day. Courtesy of the Instituto Geofisico. |
During 16-18 September 2005 a short seismic episode occurred with earthquakes on the SW flank, ranging from 135 to 330 events per day. The earthquakes reached a maximum magnitude of 3.6.
Information Contacts: Instituto Geofisico (IG), Escuela Politécnica Nacional, Apartado 17-01-2759, Quito, Ecuador (URL: http://www.igepn.edu.ec/).
2016: December
2005: September
2004: February
2003: November
On 28 December IG reported continued anomalous seismic activity at Cayambe characterized by volcano-tectonic and long-period earthquakes located 2-8 km below the summit. As many as 40 earthquakes had been recorded each day for the previous two weeks and starting on 24 December that number again increased, especially for volcano-tectonic events. A swarm on 27 December consisted of 100 small-magnitude events. A strong sulfur odor persisted, and cracks in the glacier near the summit that climbers has recently reported were visible during an overflight. In addition, deformation on the flanks was detected in GPS data.
Source: Instituto Geofísico-Escuela Politécnica Nacional (IG-EPN)
IG reported that a seismic swarm detected at Cayambe on 5 June was characterized by an increase in the number of volcano-tectonic events. The swarm occurred near an active fault system, NE of the volcano. The seismic activity progressively declined to baseline levels during August. A minor increase was again observed in September, with events migrating to locations underneath the volcano, and then became more pronounced in November. Anomalously large-magnitude earthquakes occurred on 14 November (M 3.3) and on 27 November (M 3.6). Another swarm was also detected on 27 November. Seismicity continued above baseline levels through 2 December. In addition, climbers reported an increase in a sulfur odor.
On 13 December IG noted that during the previous week there was an average of 68 earthquakes/day, mainly volcano-tectonic events and some long-period signals. A M3 event located at a depth of 7 km below the summit was recorded on 8 December. Climbers continued to report an increase in a sulfur odor, and also the presence of new cracks in the glacier near the summit.
Source: Instituto Geofísico-Escuela Politécnica Nacional (IG-EPN)
A cluster of earthquakes that had been recorded at Cayambe since 16 September, with about 300 small earthquakes occurring during 16-18 September, decreased in number significantly after 19 September. During 19-25 September, an average of 5.3 earthquakes occurred daily.
Source: Instituto Geofísico-Escuela Politécnica Nacional (IG-EPN)
During 16-18 September, a cluster of 330 small earthquakes occurred at Cayambe. The earthquakes reached a maximum magnitude of 3.6. They occurred on the volcano's SW flank, where previous clusters had been located. The cluster had not reached the level of one that took place in March of 2004. IG reported that these types of clusters occur fairly regularly at Cayambe and could be related to changes in the internal pressure of the volcano. The earthquakes continued through at least 19 September.
Source: Instituto Geofísico-Escuela Politécnica Nacional (IG-EPN)
On 29 January a swarm of ~148 small volcano-tectonic earthquakes occurred at Cayambe. By 1 February seismicity had decreased, reaching "normal" base levels. IG reported that the swarm may have represented an increase in the internal pressure of the volcano due to the arrival of fluid, possibly magma.
Source: Instituto Geofísico-Escuela Politécnica Nacional (IG-EPN)
During 3-9 November, about nine earthquakes occurred per day at Cayambe, near the daily average since August 2003 and about twice the daily average of 4 per day before that. Seismicity also included small clusters of tectonic earthquakes with magnitudes less than 3. There were reports of a strong scent of sulfur in the sector of Picos Jarrína at an elevation of ~5,460 m. The scent was strongest near cracks.
Source: Instituto Geofísico-Escuela Politécnica Nacional (IG-EPN)
Reports are organized chronologically and indexed below by Month/Year (Publication Volume:Number), and include a one-line summary. Click on the index link or scroll down to read the reports.
Some anomalous 2003 seismicity
This report largely discusses seismicity at Cayambe during January-October 2003 (figure 1). On the whole, the numbers of daily earthquakes remained fairly constant at low to moderate levels (typically fewer than 25 earthquakes per day). On six days the number of daily earthquakes approached 50 or greater (1 January, 15, 28, 29, and 30 March, and 1 April). Epicenters were concentrated on the SW flank, similar to the pattern in December 2002. During the year, residents did not report feeling earthquakes at Cayambe, but did notice sulfurous odors. Although some seismic signals had an uncertain origin, others were interpreted as related to magma movement.
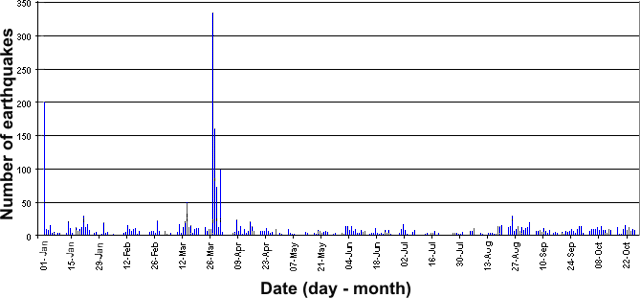 |
Figure 1. The total number of earthquakes each day at Cayambe between 1 January and 27 October 2003. Courtesy of the Instituto Geofisico-Escuela Politecnica Nacional, Ecuador. |
Observers saw no changes at Cayambe during January, although strong sulfurous odors were reported early in the month. Very low seismicity prevailed, with an average of five earthquakes per day during the second week in January. In general, the earthquakes registered since 2 January 2003 were long-period earthquakes; a few hybrid events and fracture events also were recorded. Some small volcano-tectonic (VT) earthquakes registered. On 31 January, following a week of low to moderate seismicity, two larger earthquakes were recorded: the first under the volcano, M 3.9; the second to the E, M 3.5. Neither earthquake was felt by area residents. Associated, small long-period (LP) earthquakes also registered, although the late-January daily totals were still low to modest. Following this activity, seismicity dropped and generally remained low through February and early March.
On 8 March an M 3.6 earthquake triggered about 2 hours of small VT earthquakes beneath Cayambe's S flanks. Seismicity again dropped to low levels until 14 March when there was a small cluster of shallow VT earthquakes lasting about 1 hour. These events were under M 2, and afterwards seismicity dropped to background levels.
The high for the year occurred during 24-30 March when earthquakes peaked at approximately 335 per day. Clusters of events were noted. Those on 27 March included an M 3.9 earthquake, and those on 29 March included two M 3.6 earthquakes. The events were located at 5-6 km depth below the SW flank. This was the same area in which seismic clusters occurred during December 2002. There were 99 earthquakes counted on 31 March. None larger than M 3, they consisted of up to 95 VT and four hybrid events.
In early April seismicity again dropped to low levels, increasing slightly in the second week of the month. The recorded LP and hybrid events registered were thought likely related to fluid movement inside cracks. Small VT earthquakes were recorded on 13 April; otherwise, seismicity remained low through the rest of the month. The smell of sulfur was noticed during a 14-20 April visit, but no other changes were noted. Seismicity remained low throughout May, with only occasional VT, LP, and hybrid events.
Seismicity increased slightly in early June, but still remained close to background levels. A new signal appeared at the Refugio station, characterized by high frequency at the beginning and a very long coda (tail). Thereafter, activity dropped and remained low for the rest of June.
A series of VT earthquakes occurred during the first week of July; the maximum activity was on 1 July, with 16 events. Nevertheless seismicity remained near background levels, and stayed low until early August. A VT earthquake occurred on 4 August beneath the W flank; on 6 August seismicity increased slightly and was characterized by hybrid events. Activity was low through mid-August. A series of VT events related to rock fracturing occurred between 18 and 31 August; the majority occurred on 22 and 25 August, with events reaching M 3.5. These events beneath the SW flank were similar to the spike in activity in March. Activity dropped again during the following month.
For the last week of September, seismicity was still at background levels. A single VT event registered, with a magnitude of 3.2, located beneath the volcano at a depth of 4 km. As with the previous cases, the event was too small to be felt by area residents. Between 13 and 19 October, seismicity generally remained normal, but on 15 October, a small cluster of VT earthquakes occurred S of the crater. On 23 October another small cluster of VT earthquakes (M <3) was recorded beneath the SE flank, in a part of the same zone as the events of the previous week.
Over these weeks the base seismicity level seemed to increase slightly (figure 1). During 3-9 November, about nine earthquakes occurred per day, near the daily average since August 2003 and about twice the daily average of 4/day before that. Seismicity also included small clusters of tectonic earthquakes with magnitudes less than 3. There were reports of a strong scent of sulfur in the vicinity of Picos Jarrína at an elevation of about 5,460 m. The scent was strongest near cracks.
Information Contacts: Geophysical Institute (IG), Escuela Politécnica Nacional, Apartado 17-01-2759, Quito, Ecuador (URL: http://www.igepn.edu.ec/).
Seismic swarms occur erratically in 2004 and 2005
During 2004, Cayambe's seismicity increased three times, on 25-31 January, on 25 February-5 March, and on 4-12 October. Our previous report on Cayambe discussed events through November 2003 (BGVN 28:11).
The first seismic swarm began on 25 January 2004 when the number of volcano-tectonic (VT) earthquakes increased, with seismic activity occurring in bands lasting 2-3 hours. The events were small in magnitude and were located ~ 1-4 km below the SW flank. At 1934 on 27 January, a magnitude 3.4 earthquake was recorded. On 29 January, the activity peaked with 148 earthquakes reported. Seismicity thereafter decreased to normal base-line levels.
The second earthquake swarm began on 25 February with an increased number of VT earthquakes. Like the January events, these earthquakes were of low magnitude. The largest event occurred on 29 February at 1059 measuring M 3.1. The events were localized primarily below the E flank with peak activity on 2 March, when 271 earthquakes were registered. The energy released by this cluster was far larger than the one in January and was almost comparable to activity in March 2003 (figure 2).
|
Figure 2. The total number of earthquakes each day at Cayambe during 28 December 2002 through early January 2004. The spike in daily earthquakes seen during late March 2003 (up to 330 per day) was discussed in BGVN 28:11. A spike about half that size occurred in late January 2004. Courtesy of the Instituto Geofisico. |
On 12 March, a small increase in activity was recorded, and on the morning of 15 March, a M 3.6 earthquake was recorded on the S flank. Residents reported no felt earthquakes.
On 4 October, there was a slight increase in the number of events registered with a total of 18 events, 17 of which were hybrid events. At 2333 on 6 October a M 3.4 event was recorded. These earthquakes were located in the S zone of the volcano edifice. Two seismic swarms on 8 October consisted of 177 VT earthquakes. The first swarm registered at 0500 and lasted an hour. The second swarm began at 1130 and lasted approximately 9 hours. Some of these events were located in the SW flank. After the seismic anomalies on 4 and 6- 8 October, activity returned to normal base-line levels.
Apart from the swarms between September and October, the seismicity appears to have changed, with the number of VT events diminishing by one-half in relation to those previously recorded, whereas the number of hybrid events tripled. Later, long-period LP events were again observed, which is characteristic of this volcano returning to normal levels.
The internal seismic activity at Cayambe is characterized by the generation of 10 events per day on average. Nevertheless, this type of activity has alternated with sporadic seismic swarms consisting of hundreds of events lasting several days, after which activity returns to the base-line level. These types of seismic swarms were recorded in December 2002, March 2003, and in January, March, and October of 2004 (figure 3), with similar characteristics and averaging 2 days in duration. Scientists inferred the cause of the observed seismicity as related to motion of fluids in the interior of the edifice. Thermal images obtained during 2004 did not contain anomalies.
|
Figure 3. The total number of earthquakes each day at Cayambe during 2004 (tick marks along x-axis are every 14 days). The record was punctuated by three strong increases in seismicity, during late January, during February-March, and during October. The spike in daily earthquakes seen during February 2004 neared 300 earthquakes per day. Courtesy of the Instituto Geofisico. |
During 16-18 September 2005 a short seismic episode occurred with earthquakes on the SW flank, ranging from 135 to 330 events per day. The earthquakes reached a maximum magnitude of 3.6.
Information Contacts: Instituto Geofisico (IG), Escuela Politécnica Nacional, Apartado 17-01-2759, Quito, Ecuador (URL: http://www.igepn.edu.ec/).
|
|
||||||||||||||||||||||||||||
There is data available for 22 confirmed Holocene eruptive periods.
1785 Feb - 1786 Mar Confirmed Eruption (Explosive / Effusive) VEI: 2 (?)
| Episode 1 | Eruption (Explosive / Effusive) | Upper SE flank | ||||||||||||||||||||||||||||||||||
|---|---|---|---|---|---|---|---|---|---|---|---|---|---|---|---|---|---|---|---|---|---|---|---|---|---|---|---|---|---|---|---|---|---|---|---|
| 1785 Feb - 1786 Mar | Evidence from Observations: Reported | ||||||||||||||||||||||||||||||||||
|
List of 5 Events for Episode 1 at Upper SE flank
|
|||||||||||||||||||||||||||||||||||
1700 (?) Confirmed Eruption (Explosive / Effusive)
| Episode 1 | Eruption (Explosive / Effusive) | ||||||||||||||||||||
|---|---|---|---|---|---|---|---|---|---|---|---|---|---|---|---|---|---|---|---|---|
| 1700 (?) - Unknown | Evidence from Correlation: Tephrochronology | |||||||||||||||||||
|
List of 2 Events for Episode 1
|
||||||||||||||||||||
1590 (?) Confirmed Eruption (Explosive / Effusive)
| Episode 1 | Eruption (Explosive / Effusive) | North flank of main summit | ||||||||||||||||||||||||||||||||||
|---|---|---|---|---|---|---|---|---|---|---|---|---|---|---|---|---|---|---|---|---|---|---|---|---|---|---|---|---|---|---|---|---|---|---|---|
| 1590 (?) - Unknown | Evidence from Correlation: Tephrochronology | ||||||||||||||||||||||||||||||||||
|
List of 5 Events for Episode 1 at North flank of main summit
|
|||||||||||||||||||||||||||||||||||
1570 (?) Confirmed Eruption (Explosive / Effusive) VEI: 4
| Episode 1 | Eruption (Explosive / Effusive) | North flank of main summit | ||||||||||||||||||||||||||||||||||||||||||||
|---|---|---|---|---|---|---|---|---|---|---|---|---|---|---|---|---|---|---|---|---|---|---|---|---|---|---|---|---|---|---|---|---|---|---|---|---|---|---|---|---|---|---|---|---|---|
| 1570 (?) - Unknown | Evidence from Correlation: Tephrochronology | ||||||||||||||||||||||||||||||||||||||||||||
|
List of 7 Events for Episode 1 at North flank of main summit
|
|||||||||||||||||||||||||||||||||||||||||||||
1440 (?) Confirmed Eruption (Explosive / Effusive)
| Episode 1 | Eruption (Explosive / Effusive) | ||||||||||||||||||||
|---|---|---|---|---|---|---|---|---|---|---|---|---|---|---|---|---|---|---|---|---|
| 1440 (?) - Unknown | Evidence from Correlation: Tephrochronology | |||||||||||||||||||
|
List of 2 Events for Episode 1
|
||||||||||||||||||||
1290 (?) Confirmed Eruption (Explosive / Effusive) VEI: 4
| Episode 1 | Eruption (Explosive / Effusive) | Tarugo Corral lava dome (NE flank) | ||||||||||||||||||||||||||||||||||||||||||||
|---|---|---|---|---|---|---|---|---|---|---|---|---|---|---|---|---|---|---|---|---|---|---|---|---|---|---|---|---|---|---|---|---|---|---|---|---|---|---|---|---|---|---|---|---|---|
| 1290 (?) - Unknown | Evidence from Correlation: Tephrochronology | ||||||||||||||||||||||||||||||||||||||||||||
|
List of 7 Events for Episode 1 at Tarugo Corral lava dome (NE flank)
|
|||||||||||||||||||||||||||||||||||||||||||||
1270 (?) Confirmed Eruption (Explosive / Effusive)
| Episode 1 | Eruption (Explosive / Effusive) | ||||||||||||||||||||
|---|---|---|---|---|---|---|---|---|---|---|---|---|---|---|---|---|---|---|---|---|
| 1270 (?) - Unknown | Evidence from Correlation: Tephrochronology | |||||||||||||||||||
|
List of 2 Events for Episode 1
|
||||||||||||||||||||
1040 (?) Confirmed Eruption (Explosive / Effusive) VEI: 4
| Episode 1 | Eruption (Explosive / Effusive) | Lava dome near eastern summit | |||||||||||||||||||||||||||||||||||||||
|---|---|---|---|---|---|---|---|---|---|---|---|---|---|---|---|---|---|---|---|---|---|---|---|---|---|---|---|---|---|---|---|---|---|---|---|---|---|---|---|---|
| 1040 (?) - Unknown | Evidence from Correlation: Tephrochronology | |||||||||||||||||||||||||||||||||||||||
|
List of 6 Events for Episode 1 at Lava dome near eastern summit
|
||||||||||||||||||||||||||||||||||||||||
0880 (?) Confirmed Eruption (Explosive / Effusive)
| Episode 1 | Eruption (Explosive / Effusive) | ||||||||||||||||||||
|---|---|---|---|---|---|---|---|---|---|---|---|---|---|---|---|---|---|---|---|---|
| 0880 (?) - Unknown | Evidence from Correlation: Tephrochronology | |||||||||||||||||||
|
List of 2 Events for Episode 1
|
||||||||||||||||||||
0260 (?) Confirmed Eruption (Explosive / Effusive)
| Episode 1 | Eruption (Explosive / Effusive) | |||||||||||||||||||||||||
|---|---|---|---|---|---|---|---|---|---|---|---|---|---|---|---|---|---|---|---|---|---|---|---|---|---|
| 0260 (?) - Unknown | Evidence from Correlation: Tephrochronology | ||||||||||||||||||||||||
|
List of 3 Events for Episode 1
|
|||||||||||||||||||||||||
0200 (?) Confirmed Eruption (Explosive / Effusive)
| Episode 1 | Eruption (Explosive / Effusive) | ||||||||||||||||||||
|---|---|---|---|---|---|---|---|---|---|---|---|---|---|---|---|---|---|---|---|---|
| 0200 (?) - Unknown | Evidence from Correlation: Tephrochronology | |||||||||||||||||||
|
List of 2 Events for Episode 1
|
||||||||||||||||||||
0170 (?) Confirmed Eruption (Explosive / Effusive)
| Episode 1 | Eruption (Explosive / Effusive) | ||||||||||||||||||||
|---|---|---|---|---|---|---|---|---|---|---|---|---|---|---|---|---|---|---|---|---|
| 0170 (?) - Unknown | Evidence from Correlation: Tephrochronology | |||||||||||||||||||
|
List of 2 Events for Episode 1
|
||||||||||||||||||||
0010 (?) Confirmed Eruption (Explosive / Effusive)
| Episode 1 | Eruption (Explosive / Effusive) | ||||||||||||||||||||
|---|---|---|---|---|---|---|---|---|---|---|---|---|---|---|---|---|---|---|---|---|
| 0010 (?) - Unknown | Evidence from Correlation: Tephrochronology | |||||||||||||||||||
|
List of 2 Events for Episode 1
|
||||||||||||||||||||
0180 BCE (?) Confirmed Eruption (Explosive / Effusive)
| Episode 1 | Eruption (Explosive / Effusive) | ||||||||||||||||||||
|---|---|---|---|---|---|---|---|---|---|---|---|---|---|---|---|---|---|---|---|---|
| 0180 BCE (?) - Unknown | Evidence from Correlation: Tephrochronology | |||||||||||||||||||
|
List of 2 Events for Episode 1
|
||||||||||||||||||||
0230 BCE (?) Confirmed Eruption (Explosive / Effusive)
| Episode 1 | Eruption (Explosive / Effusive) | ||||||||||||||||||||
|---|---|---|---|---|---|---|---|---|---|---|---|---|---|---|---|---|---|---|---|---|
| 0230 BCE (?) - Unknown | Evidence from Correlation: Tephrochronology | |||||||||||||||||||
|
List of 2 Events for Episode 1
|
||||||||||||||||||||
0260 BCE (?) Confirmed Eruption (Explosive / Effusive)
| Episode 1 | Eruption (Explosive / Effusive) | ||||||||||||||||||||
|---|---|---|---|---|---|---|---|---|---|---|---|---|---|---|---|---|---|---|---|---|
| 0260 BCE (?) - Unknown | Evidence from Correlation: Tephrochronology | |||||||||||||||||||
|
List of 2 Events for Episode 1
|
||||||||||||||||||||
0460 BCE (?) Confirmed Eruption (Explosive / Effusive)
| Episode 1 | Eruption (Explosive / Effusive) | ||||||||||||||||||||
|---|---|---|---|---|---|---|---|---|---|---|---|---|---|---|---|---|---|---|---|---|
| 0460 BCE (?) - Unknown | Evidence from Correlation: Tephrochronology | |||||||||||||||||||
|
List of 2 Events for Episode 1
|
||||||||||||||||||||
0510 BCE (?) Confirmed Eruption (Explosive / Effusive)
| Episode 1 | Eruption (Explosive / Effusive) | ||||||||||||||||||||
|---|---|---|---|---|---|---|---|---|---|---|---|---|---|---|---|---|---|---|---|---|
| 0510 BCE (?) - Unknown | Evidence from Correlation: Tephrochronology | |||||||||||||||||||
|
List of 2 Events for Episode 1
|
||||||||||||||||||||
0560 BCE (?) Confirmed Eruption (Explosive / Effusive)
| Episode 1 | Eruption (Explosive / Effusive) | ||||||||||||||||||||
|---|---|---|---|---|---|---|---|---|---|---|---|---|---|---|---|---|---|---|---|---|
| 0560 BCE (?) - Unknown | Evidence from Correlation: Tephrochronology | |||||||||||||||||||
|
List of 2 Events for Episode 1
|
||||||||||||||||||||
1300 BCE (?) Confirmed Eruption (Explosive / Effusive)
| Episode 1 | Eruption (Explosive / Effusive) | ||||||||||||||||||||
|---|---|---|---|---|---|---|---|---|---|---|---|---|---|---|---|---|---|---|---|---|
| 1300 BCE (?) - Unknown | Evidence from Correlation: Tephrochronology | |||||||||||||||||||
|
List of 2 Events for Episode 1
|
||||||||||||||||||||
1650 BCE (?) Confirmed Eruption (Explosive / Effusive)
| Episode 1 | Eruption (Explosive / Effusive) | ||||||||||||||||||||
|---|---|---|---|---|---|---|---|---|---|---|---|---|---|---|---|---|---|---|---|---|
| 1650 BCE (?) - Unknown | Evidence from Correlation: Tephrochronology | |||||||||||||||||||
|
List of 2 Events for Episode 1
|
||||||||||||||||||||
1800 BCE (?) Confirmed Eruption (Explosive / Effusive)
| Episode 1 | Eruption (Explosive / Effusive) | |||||||||||||||||||||||||
|---|---|---|---|---|---|---|---|---|---|---|---|---|---|---|---|---|---|---|---|---|---|---|---|---|---|
| 1800 BCE (?) - Unknown | Evidence from Correlation: Tephrochronology | ||||||||||||||||||||||||
|
List of 3 Events for Episode 1
|
|||||||||||||||||||||||||
This compilation of synonyms and subsidiary features may not be comprehensive. Features are organized into four major categories: Cones, Craters, Domes, and Thermal Features. Synonyms of features appear indented below the primary name. In some cases additional feature type, elevation, or location details are provided.
Cones |
||||
| Feature Name | Feature Type | Elevation | Latitude | Longitude |
| Angureal | Stratovolcano | 4815 m | ||
| Viejo Cayambe | Stratovolcano | |||
| Virgen, Cono de la | Pyroclastic cone | 0° 1' 30.00" N | 77° 55' 0.00" W | |
Domes |
||||
| Feature Name | Feature Type | Elevation | Latitude | Longitude |
| Tarugo Corral | Dome | |||
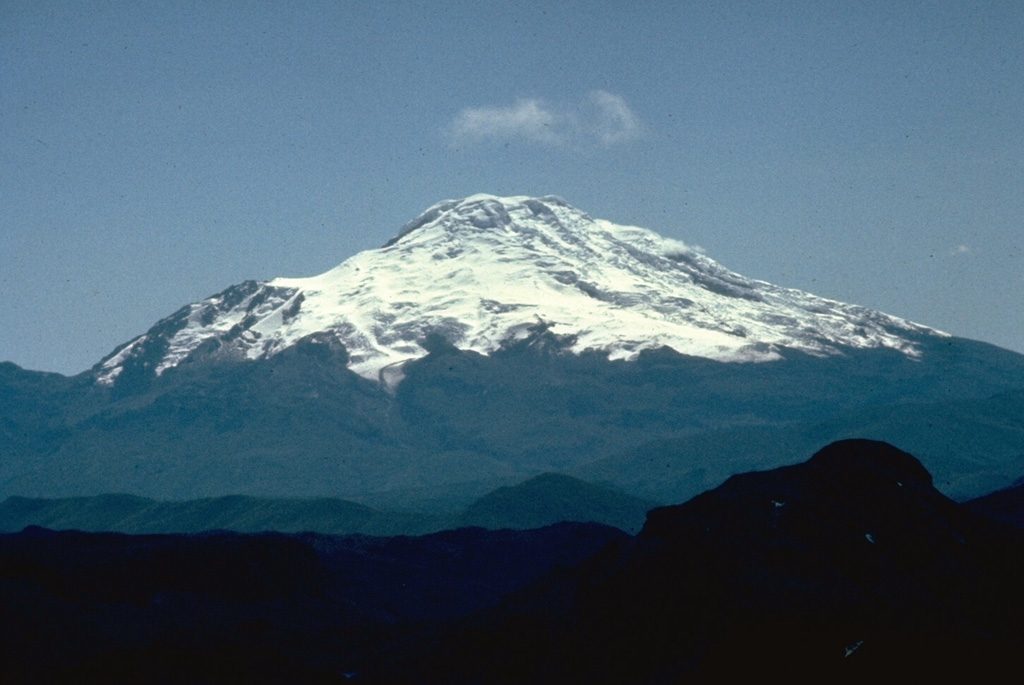
 The massive compound Cayambe stratovolcano, seen here from the SW across Ecuador's Interandean Depression, is the northernmost of a chain of large, glacier-covered Holocene volcanoes along the western edge of the Cordillera Real. No historical eruptions are known from 5790-m-high Cayambe, although lava flows on the flanks of the volcano have very young morphologies. Pyroclastic-flow deposits of possible Holocene age are present.
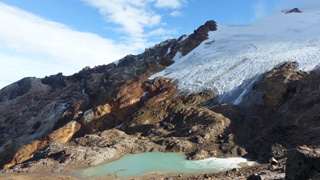 This December 2015 photograph shows the western flank of Volcán Cayambe with a small glacial lake (about 2 km down the SW flank), just above the Refugio Ruales Oleas Bergé. The presence of an ice cap at its summit represents a significant hazard, because melting of the ice by even small eruptions could generate large-volume lahars or debris flows.
There are no samples for Cayambe in the Smithsonian's NMNH Department of Mineral Sciences Rock and Ore collection.
| Copernicus Browser | The Copernicus Browser replaced the Sentinel Hub Playground browser in 2023, to provide access to Earth observation archives from the Copernicus Data Space Ecosystem, the main distribution platform for data from the EU Copernicus missions. |
| MIROVA | Middle InfraRed Observation of Volcanic Activity (MIROVA) is a near real time volcanic hot-spot detection system based on the analysis of MODIS (Moderate Resolution Imaging Spectroradiometer) data. In particular, MIROVA uses the Middle InfraRed Radiation (MIR), measured over target volcanoes, in order to detect, locate and measure the heat radiation sourced from volcanic activity. |
| MODVOLC Thermal Alerts | Using infrared satellite Moderate Resolution Imaging Spectroradiometer (MODIS) data, scientists at the Hawai'i Institute of Geophysics and Planetology, University of Hawai'i, developed an automated system called MODVOLC to map thermal hot-spots in near real time. For each MODIS image, the algorithm automatically scans each 1 km pixel within it to check for high-temperature hot-spots. When one is found the date, time, location, and intensity are recorded. MODIS looks at every square km of the Earth every 48 hours, once during the day and once during the night, and the presence of two MODIS sensors in space allows at least four hot-spot observations every two days. Each day updated global maps are compiled to display the locations of all hot spots detected in the previous 24 hours. There is a drop-down list with volcano names which allow users to 'zoom-in' and examine the distribution of hot-spots at a variety of spatial scales. |
|
WOVOdat
Single Volcano View Temporal Evolution of Unrest Side by Side Volcanoes |
WOVOdat is a database of volcanic unrest; instrumentally and visually recorded changes in seismicity, ground deformation, gas emission, and other parameters from their normal baselines. It is sponsored by the World Organization of Volcano Observatories (WOVO) and presently hosted at the Earth Observatory of Singapore.
GVMID Data on Volcano Monitoring Infrastructure The Global Volcano Monitoring Infrastructure Database GVMID, is aimed at documenting and improving capabilities of volcano monitoring from the ground and space. GVMID should provide a snapshot and baseline view of the techniques and instrumentation that are in place at various volcanoes, which can be use by volcano observatories as reference to setup new monitoring system or improving networks at a specific volcano. These data will allow identification of what monitoring gaps exist, which can be then targeted by remote sensing infrastructure and future instrument deployments. |
| Volcanic Hazard Maps | The IAVCEI Commission on Volcanic Hazards and Risk has a Volcanic Hazard Maps database designed to serve as a resource for hazard mappers (or other interested parties) to explore how common issues in hazard map development have been addressed at different volcanoes, in different countries, for different hazards, and for different intended audiences. In addition to the comprehensive, searchable Volcanic Hazard Maps Database, this website contains information about diversity of volcanic hazard maps, illustrated using examples from the database. This site is for educational purposes related to volcanic hazard maps. Hazard maps found on this website should not be used for emergency purposes. For the most recent, official hazard map for a particular volcano, please seek out the proper institutional authorities on the matter. |
| IRIS seismic stations/networks | Incorporated Research Institutions for Seismology (IRIS) Data Services map showing the location of seismic stations from all available networks (permanent or temporary) within a radius of 0.18° (about 20 km at mid-latitudes) from the given location of Cayambe. Users can customize a variety of filters and options in the left panel. Note that if there are no stations are known the map will default to show the entire world with a "No data matched request" error notice. |
| UNAVCO GPS/GNSS stations | Geodetic Data Services map from UNAVCO showing the location of GPS/GNSS stations from all available networks (permanent or temporary) within a radius of 20 km from the given location of Cayambe. Users can customize the data search based on station or network names, location, and time window. Requires Adobe Flash Player. |
| DECADE Data | The DECADE portal, still in the developmental stage, serves as an example of the proposed interoperability between The Smithsonian Institution's Global Volcanism Program, the Mapping Gas Emissions (MaGa) Database, and the EarthChem Geochemical Portal. The Deep Earth Carbon Degassing (DECADE) initiative seeks to use new and established technologies to determine accurate global fluxes of volcanic CO2 to the atmosphere, but installing CO2 monitoring networks on 20 of the world's 150 most actively degassing volcanoes. The group uses related laboratory-based studies (direct gas sampling and analysis, melt inclusions) to provide new data for direct degassing of deep earth carbon to the atmosphere. |
| Large Eruptions of Cayambe | Information about large Quaternary eruptions (VEI >= 4) is cataloged in the Large Magnitude Explosive Volcanic Eruptions (LaMEVE) database of the Volcano Global Risk Identification and Analysis Project (VOGRIPA). |
| EarthChem | EarthChem develops and maintains databases, software, and services that support the preservation, discovery, access and analysis of geochemical data, and facilitate their integration with the broad array of other available earth science parameters. EarthChem is operated by a joint team of disciplinary scientists, data scientists, data managers and information technology developers who are part of the NSF-funded data facility Integrated Earth Data Applications (IEDA). IEDA is a collaborative effort of EarthChem and the Marine Geoscience Data System (MGDS). |

