


At 1706 on 5 August IMO lowered the Aviation Color Code for Fagradalsfjall to Yellow (the second level on a four-color scale), noting that the eruption had declined during the previous few days and very minor activity at the crater was visible in webcam images. Tremor had decreased during the previous 36 hours and reached background levels by 1500 on 5 August. Gas plumes had typically risen 1-2 km above the vent, though on 1 August plumes rose more than 2.5 km, and according to news articles, a notable amount of fume rose from the vent on 4 August. The crater had become deeper and smaller by 4 August. Activity was last seen on 5 August and a thermal anomaly in the crater was last identified in satellite images on 6 August.
Sources: Icelandic Meteorological Office (IMO), Icelandic National Broadcasting Service (RUV), Icelandic National Broadcasting Service (RUV)
New eruption consisted of lava flows and fountains during July-August 2023
The Fagradalsfjall volcanic system on the Reykjanes Volcanic Zone in Iceland first erupted on 19 March 2021, following more than a year of earthquake activity and inflation/deflation periods. This was the first volcanic activity on the system after about 6,000 years of quiescence. Although the Fagradalsfjall fissure swarm has previously been considered a split or secondary swarm of the Krýsuvík-Trölladyngja volcanic system, as of September 2022 Icelandic volcanologists managing the Catalogue of Icelandic Volcanoes made the decision to identify Fagradalsfjall as a distinct and separate system.
The fissure eruption that started in August 2022 near the border of the previous lava flow field N of Fagradalsfjall in Meradalir was characterized by lava flows, fountains, and sulfur dioxide emissions (BGVN 47:09). This report covers a new eruption period that began on 10 July 2023 and ended in early August, characterized by similar activity. Information comes from Icelandic Meteorological Office (IMO), the Institute of Earth Sciences, and various satellite data.
Inflation began in early April in the western Reykjanes Peninsula, reaching a total of 3 cm, and at a rate of about 1 cm per month. Data indicated possible accumulation of magma at 15 km depth. In June, more than 1,000 earthquakes were recorded, more of which were located beneath Reykjanestá, NE of Fagradalsfjall and SW of Kleifarvatn. Seismicity intensified during 3-4 July. An earthquake swarm began at 1400 on 4 July and by 1150 on 5 July, more than 1,800 earthquakes were detected in the vicinity of the July 2022 dike intrusion (figure 37). The depth of the earthquakes became shallower within the first few hours of the swarm; by 5 July the depths were at 2-3 km. Seven of those earthquakes exceeded an M 4, and the largest was an M 4.8 event that was recorded at 0821 on 5 July. On 5 July at 1055 IMO raised the Aviation Color Code (ACC) to Orange (the third level on a four-color scale). By 1330 on 7 July, more than 7,000 earthquakes were detected in the swarm that began on 4 July. The epicenters were aligned NE-SW between Fagradalsfjall and the Keilir cone, NNE from the 2021 and 2022 eruptions, and mostly concentrated just N of the Litli Hrútur hill. Deformation data (GPS and radar interferometry) showed uplift in the same area, which IMO suggested was a magmatic dike intrusion that reached 1 km depth by early on 6 July. Seismicity decreased during 6-7 July and the rate of deformation slowed; an analysis showed that by 9-10 July the dike had propagated 1 km further NE. Small earthquakes were reported in Kleifarvatn, the largest of which was an M 4.6, and caused some rock falls in Kleifarvatn and Trolladyngja.
 |
Figure 37. Map showing the locations of the earthquakes (circles) at Fagradalsfjall from 30 July 2022 to 5 July 2023. The red circles represent earthquakes in 2023 and the blue circles represent the earthquake swarm that occurred during July-August 2022. The orange line represents the vertical projection of the dike intrusion that occurred in 2022 and the lighter orange color shows the extent of the lava flow field from 2022. The map also shows the magnitude for earthquakes greater than 1, and the size of the circles are proportional to the magnitude of the earthquakes. Courtesy of IMO. |
Tremor was detected at 1425 on 10 July and continued to intensify, leading to a new fissure eruption oriented NE-SW, beginning at 1640 (figure 38). Webcam images showed gas-and-steam emissions and incandescence, but no major ash emissions. The fissure was about 200-m-long, primarily located in a depression, and was characterized by lava fountains (figure 39) and lava flows originating from three short fissures on the E and NE flanks of Litli-Hrútur and moving NE and S. Gas-and-steam emissions drifted NW. As a result, IMO raised the ACC to Red (the highest level on a four-color scale) at 1707. At 1724 the ACC was lowered back to Orange. According to estimate from the Institute of Earth Sciences, the fissure quickly reached about 900-m-long, based on drone footage.
 |
Figure 38. Photo of the start of the new fissure eruption at Litli-Hrútur, part of the Fagradalsfjall volcanic system taken on 10 July 2023. Gas-and-steam emissions accompanied the lava flow. Courtesy of Elísabet Pálmadóttir, IMO. |
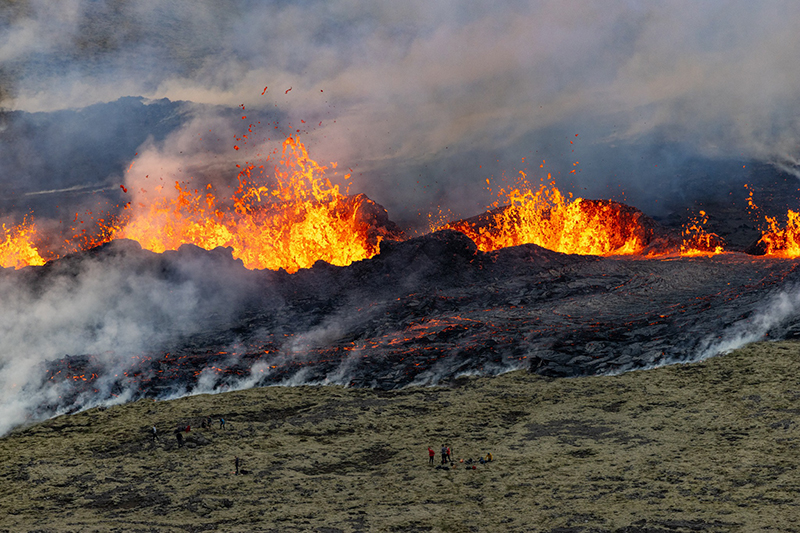 |
Figure 39. Photo of the lava fountains emanating from Litli-Hrútur, part of the Fagradalsfjall volcanic system taken the night of 10 July 2023. People are visible at the bottom middle of this photo for scale. Courtesy of Vilhelm Gunnarsson via Almannavarnadeildar ríkislögreglustjóra. |
Tremor levels peaked between 2100 on 10 July and 0000 on 11 July, and steadily declined through 1100. The intensity of the eruption notably decreased with fewer active lava fountains by 1250 on 11 July. Only one vent with an elongated crater and multiple lava fountains were active by 1635. Gas-and-steam plumes rose as high as 4 km above the vent. Lava flows mostly traveled SE and flowed into a shallow valley S of Litli-Hrútur. On 11 July IMO measured the amount of sulfur dioxide with a remote sensing device, DOAS (Differential Optical Absorption Spectroscopy). The amount of sulfur dioxide ranged around 66-80 kg/s.
On 14 July the advancing edge of the lava flow connected with the 2021 lava field in the NE part of Meradalir. The main vent was elongated and measured roughly 22-m-tall on 15 July. During 13-17 July the lava flow rate was an estimated 12.7 m3/sec, and by 18 July the total erupted volume was about 8.4 million m3. The flow advanced an average of 300-400 m per day. Flow thicknesses averaged 10 m; some areas reached 20 m. Lava filled the main cone and occasionally spilled over onto the flanks at around 2330 on 18 July. Around 0251 on 19 July, a breach was reported high on the NE rim, followed by lava that flowed down the flank. Spatter was ejected past the crater rim. Lava fountaining increased around 0259 and lava flowed short distances E. Around 0412 sections of the NW wall of the cone collapsed, which drained the crater and sent lava flows to the N and W. Around the same time, there was a significant decrease in the rate at the S-moving lava flow and by 0530 it was fully crusted over.
Lava from the main vent had grown to about 90 x 40 m during 19-26 July and continued to advance SSW, according to a VONA (figure 40). Sulfur dioxide plumes rose 1-2 km above the crater rim. Seismicity decreased since the eruption began and was mainly concentrated at the N end of the dike and to the E of Keilir. The effusion rate averaged 8 m3/sec during 18-23 July and the total erupted volume was about 12.4 million m3, based on calculations from the University of Iceland, the Icelandic Institute of Natural History, and the National Land Survey of Iceland (figure 41). The lava flow field covered an area of about 1.2 km2 (figure 42). According to a news article, part of the N crater rim collapsed just before 1200 on 24 July, which directed lava flows down a new channel, mainly to the S, but also moving E.
 |
Figure 40. A hazard map of Litli-Hrútur, part of the Fagradalsfjall volcanic system, updated on 20 July 2023 that shows the hazard area (light pink), the lava flow extent as of 18 July 2023 (dark pink), and earlier lava flow fields from 2021 and 2022 (orange). The location of the vent is marked with a red dot, and the dike propagation is highlighted by the dark blue dotted line, extending from Keilir to Meradalahnúkar. Courtesy of IMO. |
 |
Figure 41. Graphs showing the evolution of the inundated area (top), volume (middle), and effusion rate (bottom) of the lava flow from 18-23 July 2023 at Litli-Hrútur, part of the Fagradalsfjall volcanic system. By 23 July lava covered an area of 1.15 km2, had an erupted volume of 12.4 million m3, and had an effusion rate of 8 m3/s. Courtesy of IES. |
 |
Figure 42. Map showing the extent of the lava flow field for the eruption at Litli-Hrútur, part of the Fagradalsfjall volcanic system on 23 July 2023 (red) compared to the previous eruptions in 2021 (green) and 2022 (orange). The S part of the 2023 flow intersects with the previous 2022 lava flow field. Courtesy of IES. |
During 23-31 July the lava effusion rate decreased to 5 m3/sec and the total erupted volume was about 15.9 million m3. The flow field covered an area of 1.5 km2 by 31 July. During 26 July through 2 August about 150 earthquakes were recorded in the eruptive area, many of which occurred around Keilir. At 1706 on 5 August IMO lowered the ACC to Yellow (the second level on a four-color scale), noting that activity had declined during the previous few days and very minor crater activity was visible in webcam images. Tremor decreased during the previous 36 hours and reached background levels by 1500 on 5 August. Gas-and-steam plumes generally rose 1-2 km above the vent, except on 1 August, where plumes rose more than 2.5 km above the vent. According to news articles, a notable amount of gas-and-steam emissions rose from the vent on 4 August. Activity was last seen on 5 August and a thermal anomaly in the crater was last identified in satellite images on 6 August.
Satellite data. Data from the TROPOMI instrument on the Sentinel-5P satellite, available on maps from the NASA Global Sulfur Dioxide page, showed two sulfur dioxide plumes exceeding 2 DU (Dobson Units) on 11 and 23 July 2023 and drifted W and SE, respectively (figure 43). Strong thermal activity was detected in MODIS data shown on the MIROVA (Middle InfraRed Observation of Volcanic Activity) graphs showing the beginning of the eruption in early July due to lava effusion (figure 44). In late July, the power of the thermal anomalies gradually declined as activity slowed; residual heat remained low through September. Infrared satellite images also showed the start of the fissure eruption and thermal activity expanding NE and SW through July (figure 45). By early August, the lava flows began to cool.
 |
Figure 43. Two strong sulfur dioxide plumes that exceeded 2 DUs (Dobson Units) were detected above Fagradalsfjall on 11 and 23 July 2023 and drifted W and SE, respectively (left and right, respectively), based on data from the TROPOMI instrument on the Sentinel-5P satellite. Courtesy of the NASA Global Sulfur Dioxide Monitoring Page. |
 |
Figure 44. Strong thermal activity began at Fagradalsfjall in early July 2023, according to the MIROVA graph (Log Radiative Power) and continued through early August due to a new eruption characterized by lava flows and fountains. Lower, possibly residual thermal activity persisted through September. Courtesy of MIROVA. |
 |
Figure 45. Infrared (bands B12, B11, B4) satellite imagery showed the onset of a new fissure eruption at Litli-Hrútur, part of the Fagradalsfjall volcanic system on 11 (top left), 13 (top right), and 18 (bottom left) July 2023 and 2 August 2023 (bottom right). The bright yellow-orange color represents the lava flows and fountains as it expanded NE and SW throughout July. By early August, thermal activity declined and began to cool. Courtesy of Copernicus Browser. |
Information Contacts: Icelandic Meteorological Office (IMO), Bústaðavegur 7-9 105 Reykjavík, Iceland (URL: http://en.vedur.is/); Institute of Earth Sciences, Sturlugata 7 101 Reykjavík, Iceland (URL: http://www.earthice.hi.is/); Almannavarnadeildar ríkislögreglustjóra, Skúlagata 21, Reykjavík, Iceland (URL: https://www.almannavarnir.is/); Icelandic National Broadcasting Service (RUV), Efstaleiti 1 150 Rekyjavík, Iceland (URL: http://www.ruv.is/); MIROVA (Middle InfraRed Observation of Volcanic Activity), a collaborative project between the Universities of Turin and Florence (Italy) supported by the Centre for Volcanic Risk of the Italian Civil Protection Department (URL: http://www.mirovaweb.it/); NASA Global Sulfur Dioxide Monitoring Page, Atmospheric Chemistry and Dynamics Laboratory, NASA Goddard Space Flight Center (NASA/GSFC), 8800 Greenbelt Road, Goddard MD 20771, USA (URL: https://so2.gsfc.nasa.gov/); Copernicus Browser, Copernicus Data Space Ecosystem, European Space Agency (URL: https://dataspace.copernicus.eu/browser/).
2023: June
| July
| August
2022: January
| July
| August
| September
2021: February
| March
| April
| May
| June
| July
| August
| September
| October
| November
| December
At 1706 on 5 August IMO lowered the Aviation Color Code for Fagradalsfjall to Yellow (the second level on a four-color scale), noting that the eruption had declined during the previous few days and very minor activity at the crater was visible in webcam images. Tremor had decreased during the previous 36 hours and reached background levels by 1500 on 5 August. Gas plumes had typically risen 1-2 km above the vent, though on 1 August plumes rose more than 2.5 km, and according to news articles, a notable amount of fume rose from the vent on 4 August. The crater had become deeper and smaller by 4 August. Activity was last seen on 5 August and a thermal anomaly in the crater was last identified in satellite images on 6 August.
Sources: Icelandic Meteorological Office (IMO); Icelandic National Broadcasting Service (RUV); Icelandic National Broadcasting Service (RUV)
IMO reported that lava continued to erupt from main vent at Fagradalsfjall during 26 July through 2 August with no significant changes. Lava fountaining persisted in the active vent according to webcam images throughout the week. The lava effusion rate had decreased compared to the previous week, averaging 5 cubic meters per second during 23-31 July based on calculations from the University of Iceland, the Icelandic Institute of Natural History, and the National Land Survey of Iceland. They also estimated that the total erupted volume was about 15.9 million cubic meters, and the flow field covered an area of about 1.5 square kilometers. During 26 July through 2 August about 150 earthquakes were recorded in the eruptive area; the densest activity occurred around Keilir. The Aviation Color Code remained at Orange (the third level on a four-color scale).
Source: Icelandic Meteorological Office (IMO)
IMO reported that lava continued to erupt from main vent at Fagradalsfjall during 19-26 July with no significant changes. Lava from the main vent, which was about 90 x 40 m, continued to advance SSW and sulfur dioxide plumes rose 1-2 km above the crater rim. Seismicity had decreased since the onset of the eruption and was concentrated at the N end of the dike and to the E of Keilir. The lava effusion rate averaged 8 cubic meters per second during 18-23 July based on calculations from the University of Iceland, the Icelandic Institute of Natural History, and the National Land Survey of Iceland. They also estimated that the total erupted volume was about 12.4 million cubic meters, and the flow field covered an area of about 1.2 square kilometers. According to a news article part of the N crater rim collapsed just before noon on 24 July, sending lava flows along a new channel, still mainly to the S but spreading more E. The hiking trails were no longer accessible 24 hours a day and were going to be closed at 1800 each day. Firefighters continued to control the burning vegetation set on fire by the lava. The Aviation Color Code remained at Orange (the third level on a four-color scale).
Sources: Icelandic Meteorological Office (IMO); Icelandic National Broadcasting Service (RUV)
According to the Institute of Earth Sciences lava continues to eruption from main vent at Fagradalsfjall and travel S and SW. On 14 July the advancing edge of the flow connected with the 2021 lava field in the NE part of Meradalir . The main vent was elongated and about 22 m tall on 15 July. During 13-17 July the lava flow rate was an estimated 12.7 cubic meters per second, and by 18 July the total erupted volume was about 8.4 million cubic meters. The flow advanced an average of 300-400 m per day, though the distance was highly variable. Flow thicknesses averaged 10 m, though some areas reached 20 m. At about 2330 on 18 July lava filled the main cone and occasionally spilled over onto the flanks. A breach high on the NW rim occurred at around 0251 on 19 July and lava flowed down the NW flank. Spatter was ejected beyond the crater rim. At around 0259 lava fountaining increased and lava flowed short distances E. At around 0412 sections of the NW wall of the cone collapsed, draining the crater, and sending lava flows N and W. According to Almannavarnadeild ríkislögreglustjóra and news sources the police closed the pathway to see the eruption on 13 July, then reopened the path to tourists on 17 July. Firefighters were working to control the burning vegetation set on fire by the lava.
Sources: Almannavarnadeild ríkislögreglustjóra (National Commissioner of the Icelandic Police and Department of Civil Protection and Emergency Management); Institute of Earth Sciences
Icelandic Meteorological Office (IMO) reported that a new fissure eruption in the Fagradalsfjall volcanic system began on 10 July after intensifying seismicity over the previous month and inflation that was first noted in April. At 1055 on 5 July IMO raised the Aviation Color Code to Orange (the third level on a four-color scale). By 1330 on 7 July there had been more than 7,000 earthquakes detected in the swarm that began on 3 July. Epicenters were aligned NE-SW between Fagradalsfjall and the Keilir cone, NNE from the 2021 and 2022 eruptions, and mostly concentrated just N of the Litli Hrútur hill. Deformation data (GPS and radar interferometry) showed uplift in the same area, suggesting a magmatic dike intrusion that reached to 1 km depth by early on 6 July. Seismicity decreased during 6-7 July and the rate of deformation slowed, with analysis showing that by 9-10 July the dike had propagated 1 km further NE.
Tremor was detected at 1425 on 10 July and continued to intensify, leading to an eruption at 1640 just NW [Correction: E and NE] of Litli-Hrútur. Webcam images showed visible gas emissions and incandescence, but no major ash emissions. IMO raised the Aviation Color Code to Red (the highest level on a four-color scale) at 1707. Flowing lava from a NE-SW fissure that was about 200 m long was confirmed by people present in the area and webcam images; at 1724 the Aviation Color Code was lowered back to Orange. The fissure was mainly located in a depression and bisected the E and NE flanks of Litli Hrútur. Based on observations from drone video the fissure quickly reached about 900 m long according to estimates from Institute of Earth Sciences. Lava fountaining occurred along the fissure, sending lava flows S. Gas-and-steam emissions drifted NW. According to Almannavarnadeild ríkislögreglustjóra, the police closed the area around the eruption to tourists due to the high concentrations of volcanic gases and particulates from burning vegetation.
Tremor levels peaked between 2100 on 10 July and 0000 on 11 July, then steadily declined through 1100. By 1250 on 11 July the intensity of the eruption had noticeably decreased, with fewer active lava fountains. Only one vent with an elongated crater and multiple lava fountains was active by 1635. Gas plumes rose as high as 4 km above the vent. Lava flows mostly traveled SE and flowed into a shallow valley S of Litli-Hrútur. IMO noted that if lava continued to flow S it may come into contact with the 2022 Merardalir lava flow. A 10-km-long trail from the road up to the eruption site was opened to the public.
Sources: Icelandic Meteorological Office (IMO); Almannavarnadeild ríkislögreglustjóra (National Commissioner of the Icelandic Police and Department of Civil Protection and Emergency Management); Institute of Earth Sciences
Icelandic Meteorological Office (IMO) reported that inflation began in April in the western Reykjanes Peninsula, reaching a total of 3 cm, with rates up to about 1 cm per month. Data possibly indicated accumulating magma at 15 km depth beneath Fagradalsfjall. In June more than 1,000 earthquakes were recorded with most of them located beneath Reykjanestá, NE of Fagradalsfjall and SW of Kleifarvatn.
Seismicity intensified during 3-4 July. An earthquake swarm began at 1400 on 4 July and more than 1,600 earthquakes were detected beneath Fagradalsfjall, in the vicinity of the July 2022 dike intrusion, by mid-morning on 5 July. The earthquake locations became shallower within the first few hours of the swarm and by 5 July were at depths of 2-3 km. Seven of the earthquakes were above M 4, with the largest being M 4.6 [Correction: the largest event was a M 4.8] recorded at 0821 on 5 July. At 1055 on 5 July IMO raised the Aviation Color Code to Orange (the third level on a four-color scale).
Source: Icelandic Meteorological Office (IMO)
IMO stated that the Fagradalsfjall and Krýsuvík-Trölladyngja volcanic systems have been designated as two separate systems based on previous scientific research combined with data collected and analyzed from the two recent eruptions (2021 and 2022). On 15 September the Aviation Color Code for Fagradalsfjall was lowered to Green; lava from the fissure that opened in Meradalir stopped erupting on 21 August. Seismicity remained at low levels and no deformation was detected.
Source: Icelandic Meteorological Office (IMO)
The Institute of Earth Sciences reported that lava effusion at the fissure eruption in the Krýsuvík-Trölladyngja volcanic system continued during 16-19 August. Lava erupted mainly from a central cone, containing a lava pond, and flowed SE. Measurements taken during an overflight on 16 August indicated that the flow rate had decreased to 2 cubic meters per second. An estimated 12 million cubic meters of lava had erupted. The lava near the vent was 20-40 m thick, but flows were 5-15 m thick in the Meradalir valley, outside the crater area. Seismic tremor began to decrease on 19 August. Incandescence from the northern vent and from the lava flows was reflected by the gas plume that rose from the crater, but through the night of 20-21 August incandescence from the flow diminished. Incandescence from the vent was visible until about 0400 on 21 August. Beginning at around 0500 several explosions ejected spatter from the vent over a period of about 15 minutes. Just before 0600 a dense, bluish-gray plume rose from the crater, and simultaneously seismic tremor signals stopped. On 22 August IMO lowered the Aviation Color Code to Yellow.
Sources: Icelandic Meteorological Office (IMO); Institute of Earth Sciences
The fissure eruption in the Krýsuvík-Trölladyngja volcanic system that began on 3 August continued in the Meradalir valley during 10-16 August. Lava erupted mainly from a central cone and flowed ESE. According to the Institute of Earth Sciences the effusion rate had notably decreased, from an average of 11 cubic meters per second during 4-13 August to 3-4 cubic meters per second during 13-15 August. A news article stated that the effusion rate significantly decreased during 0530-0630 on 13 August based on information from IMO staff who were investigating the eruption site for new changes. The Institute of Earth Sciences estimated that 10.6 million cubic meters of lava had covered an area of 1.25 square kilometers by 15 August. Data collected during an overflight on 16 August indicated that the effusion rate had further reduced to 2 cubic meters per second during the previous day, though the uncertainty in that estimate was high. On 16 August residents reported seeing a purple-tinged sulfur dioxide gas cloud over the eruption area slowly drifting SW during sunrise.
Sources: Icelandic Meteorological Office (IMO); Institute of Earth Sciences; Icelandic National Broadcasting Service (RUV); Icelandic National Broadcasting Service (RUV)
The fissure eruption of the Krýsuvík-Trölladyngja volcanic system that began at around 1318 on 3 August continued at least through 9 August. Numerous small lava fountains rose along the fissure, located near the border of the previous flow field N of Fagradalsfjall, and lava flows traveled downslope to the NW. Scientists from the Institute of Earth Sciences stated that the initial flow rate was 5-10 times greater than the flow rate at the start of the 2021 eruption, based on model estimates, field data, and satellite measurements. The flow rate was about 32 cubic meters per second during the initial hours of the eruption, then decreased to an average of 18 cubic meters per second from 1700 on 3 August until 1100 on 4 August, by which time about 1.6 million cubic meters of lava had covered an area of 0.14 square kilometers. The average flow thickness was around 11 m. According to a news article the length of the active fissure had decreased and the middle part of the fissure was the most active. On 5 August Icelandic Meteorological Office (IMO) reported that the number of daily earthquakes declined after the eruption began and deformation stabilized. Thousands of people were walking on the trails to view the eruption; authorities warned the public to heed inclement weather warnings, and closed access to the site during 7-9 August due to weather conditions and trail maintenance.
Sources: Icelandic Meteorological Office (IMO); Institute of Earth Sciences; Icelandic National Broadcasting Service (RUV); Icelandic National Broadcasting Service (RUV); Icelandic National Broadcasting Service (RUV)
Icelandic Meteorological Office (IMO) reported that an intense earthquake swarm began around noon on 30 July within the Krýsuvík-Trölladyngja volcanic system. The earthquakes were located in an area just NE of lava field in Geldingadalir, along the dike intrusion that preceded the March-September 2021 eruption. The swarm was likely caused by a magmatic intrusion at depths of 5-7 km. Earthquakes were reportedly felt in SW Iceland, in Reykjanesbær, Grindavík, the Capital region, and as far as Borgarnes. Several earthquakes were above M 3; a larger M 4 event was recorded at 1403. IMO raised the Aviation Color Code to Yellow, based on above-background seismic levels. At around 1800 the epicenters shallowed to depths of 2-5 km. By 1527 on 31 July almost 3,000 earthquakes had been detected, with four of the events larger than an M 4. A larger M 5.4 earthquake was detected at 1748. IMO reported at 1749 on 2 August that deformation models indicated magma around 1 km below the surface. The intrusion rate was close to double that recorded prior to the 2021 eruption, though by the reporting time the intrusion and seismicity rates had slowed. IMO noted that a similar pattern of events took place prior to the last eruption and stated that the likelihood of an eruption had increased. An effusive eruption began at 1315 on 3 August in Meradalir, near the border of the previous flow field N of Fagradalsfjall. Webcam video showed lava fountains rising along a 300-m-long fissure. As a result, IMO raised the Aviation Color Code to Orange at 1536. Gas-and-steam plumes rose 500-1,000 m high, but no ash was detected.
Source: Icelandic Meteorological Office (IMO)
Icelandic Meteorological Office (IMO) reported that the earthquake swarm at the Krýsuvík-Trölladyngja volcanic system that began on 21 December 2021 had ceased. Additionally, InSAR and GPS data last recorded deformation on 28 December. IMO lowered the Aviation Color Code to Yellow on 7 January.
Source: Icelandic Meteorological Office (IMO)
Icelandic Meteorological Office (IMO) reported that the earthquake swarm at the Krýsuvík-Trölladyngja volcanic system was ongoing with more than 19,000 earthquakes recorded during 21-28 December. Earthquakes M 4 or above totaled 14. The number and size of the earthquakes progressively decreased during 29 December 2021 to 3 January 2022; 200 events were recorded during 0000-1535 on 3 January. The seismicity was located along the same dyke system that fed the recent eruption at Geldingadalir. The Aviation Color Code remained at Orange.
Source: Icelandic Meteorological Office (IMO)
Icelandic Meteorological Office (IMO) reported that the earthquake swarm at the Krýsuvík-Trölladyngja volcanic system was ongoing at least through 26 December. The swarm began at 1800 on 21 December in an area 2-4 km NE of Geldingadalir. Around 3,000 daily earthquakes recorded by the seismic network were mostly located near Fagradalsfjall volcano at depths of 5-8 km, though some were located near the town of Grindavík and lake Kleifarvatn. The swarm was episodic with periods of intense activity. Three earthquakes over M 4 were recorded near Grindavík on 24 December; the largest was a M 4.8. Deformation during 20-26 December was clear in InSAR data, and similar to the deformation observed at the end of February as the dike intrusion was starting near Fagradalsfjall. The seismicity and deformation indicated that magma was moving at depth, likely along the same dyke system that fed the previous eruption at Geldingadalir. The Aviation Color Code remained at Orange.
Source: Icelandic Meteorological Office (IMO)
Icelandic Meteorological Office (IMO) reported that as of 18 December no eruptive activity at the Krýsuvík-Trölladyngja volcanic system had been observed for the previous three months, so the eruption was officially declared to have ended on 18 September. IMO noted that deformation data showed continuing magma accumulation beneath Geldingadalir.
Seismicity increased at 1800 on 21 December in an area 2-4 km NE of Geldingadalir. The seismicity notably intensified at 0030 on 22 December with 1-10 earthquakes recorded per minute, bringing the total number of events to about 900 by 0222. The largest event was a M 3.3. The Aviation Color Code was raised to Orange.
Source: Icelandic Meteorological Office (IMO)
Icelandic Meteorological Office (IMO) reported that no eruptive activity at the Krýsuvík-Trölladyngja volcanic system had been visible since 18 September. Small quantities of volcanic gases continued to be detected in the atmosphere. At the end of September, after the eruption had ceased, inflation of the Reykjanes Peninsula began to be detected and broadly correlated with an area that deflated during the eruption. The inflation was thought to be most likely caused by further intrusion of magma; the earthquake swarm detected S of Keilir in late September may be related to such an intrusion, though no deformation was detected at the surface during the swarm. IMO noted that such an influx of magma following an eruption was not uncommon, and that the inflation did not necessarily mean that another eruption was imminent.
Source: Icelandic Meteorological Office (IMO)
Icelandic Meteorological Office (IMO) reported that during 18 September-18 October no lava effusion was detected at the Krýsuvík-Trölladyngja volcanic system. The seismic swarm that had begun on 26 September in an area SW of Keilir (about 10 km NE of the fifth vent), at the N end of the dike intrusion, had significantly decreased in mid-October. The Aviation Color Code was lowered to Yellow (the second lowest level on a four-color scale) on 18 October. IMO noted that gas emissions were ongoing, though with very low concentrations of eruptive gases. Minor thermal anomalies were detected less often; incandescence from previously emplaced lava flows was occasionally visible at night. IMO also stated that residual heat, gases, and incandescence may continue for weeks to months.
Source: Icelandic Meteorological Office (IMO)
The Institute of Earth Sciences reported that lava effusion at Krýsuvík-Trölladyngja volcanic system, close to Fagradalsfjall on the Reykjanes Peninsula, likely ceased during the evening of 18 September. The area of the flow field was about 4.85 square kilometers, and the total volume erupted was 150 million cubic meters, based on 30 September measurements. Parts of lava flows thickened in areas to the S of Geldingadalur and in Nàtthagi valley, and deflated in areas N of Geldingadalur. Points of incandescence were visible at night, at least through 4 October, likely from lava flows that continued to advance downslope.
A seismic swarm in an area SW of Keilir (about 10 km NE of the fifth vent), at the N end of the dike intrusion, began on 27 September. According to news reports, over 6,000 earthquakes at depths of 5-6 km had been recorded by 4 October with at least 12 of them over M 3; the largest event was a M 3.8. Some of the larger events were felt in the capital. The seismicity was similar to patterns recorded before the beginning of the eruption to the SW. IMO stated that more data was needed to characterize the data as either indicative of magma movement or due to tectonic stress. The Aviation Color Code remained at Orange due to the lack of ash and tephra emissions, though IMO warned of the potential for lapilli and scoria fallout within a 650 m radius of the active vent. Authorities also warned of gas emission hazards.
Sources: Icelandic Meteorological Office (IMO); Icelandic National Broadcasting Service (RUV); Icelandic National Broadcasting Service (RUV); Almannavarnadeild ríkislögreglustjóra (National Commissioner of the Icelandic Police and Department of Civil Protection and Emergency Management)
The eruption from the fifth vent in the W part of the Krýsuvík-Trölladyngja volcanic system, close to Fagradalsfjall on the Reykjanes Peninsula, continued during 15-18 September. According to a news article lava ponded for a few days in Geldingadalur, and during 14-15 September the crust ruptured and sent a larger lava flow rapidly into the S part of the valley; the flow then turned E into the Nàtthagi valley. Authorities temporarily closed the area due to the activity and the large number of tourists; the Coast Guard rescued two people whose exit route had been cut off by the flow. Lava continued to flow on this path during 16-17 September and overtook the “A” hiking trail. Later that day at around 1800 the flow rate decreased or paused, and only minor incandescence from the vent was visible.
The Institute of Earth Sciences reported that based on aerial photography acquired on 17 September the area of the flow field had grown to 4.8 square kilometers, and the total volume erupted was 151 million cubic meters. The lava-flow rate during 11-17 September averaged 16 cubic meters per second. IMO noted that 19 September marked six months since the eruption started.
Sources: Icelandic Meteorological Office (IMO); Institute of Earth Sciences; Icelandic National Broadcasting Service (RUV); Icelandic National Broadcasting Service (RUV); Almannavarnadeild ríkislögreglustjóra (National Commissioner of the Icelandic Police and Department of Civil Protection and Emergency Management); Dr. Evgenia Ilyinskaya (University of Leeds)
The fissure eruption in the W part of the Krýsuvík-Trölladyngja volcanic system, close to Fagradalsfjall on the Reykjanes Peninsula, had paused for several days. The Institute of Earth Sciences reported that based on aerial photography acquired on 9 September, during the pause, the area of the flow field had grown to 4.6 square kilometers, and the total volume erupted was 143 million cubic meters. The crater floor was visible and was at least 70 m deep, with a deeper cavity or drainage sometimes visible.
Lava visibly returned on 11 September; RSAM values increased and low lava fountains emerged from a few areas on the flow field to the W of the main crater. Lava also returned to the main vent. Lava fountains from the main crater were visible for periods of 5-10 minutes on 13 September and lava advanced in multiple directions. Lava flowed N on 14 September. By 15 September lava quickly advanced S, flowing past the earthen barriers constructed at the S end of Geldingadalur valley, and turning E into the Nàtthagi valley. The Aviation Color Code remained at Orange due to the lack of ash and tephra emissions, though IMO warned of the potential for lapilli and scoria fallout within a 650 m radius of the active vent. Authorities also warned of gas emission hazards.
Sources: Icelandic Meteorological Office (IMO); Institute of Earth Sciences; Icelandic National Broadcasting Service (RUV); Oliver Lamb (University of North Carolina); Icelandic National Broadcasting Service (RUV); Benjamin Hennig (University of Iceland)
The fissure eruption in the W part of the Krýsuvík-Trölladyngja volcanic system, close to Fagradalsfjall on the Reykjanes Peninsula, paused on 2 September. Steam-and-gas emissions were seen rising from the crater during 2-7 September. The Aviation Color Code remained at Orange due to the lack of ash and tephra emissions, though IMO warned of the potential for lapilli and scoria fallout within a 650 m radius of the active vent. Authorities also warned of gas emission hazards.
Sources: Icelandic Meteorological Office (IMO); Icelandic National Broadcasting Service (RUV)
The fissure eruption in the W part of the Krýsuvík-Trölladyngja volcanic system, close to Fagradalsfjall on the Reykjanes Peninsula, continued during 25-31 August, though weather often obscured the view of the vents. Low lava fountaining and overflows from the main vent were interspersed with periods of calm. Parts of the crater sometimes collapsed and produced minor ash clouds based on webcam views. According to a news article, lava flowed into the S part of Meradalir valley and then down a hillside into Nàtthagi valley on 26 August in multiple branches. Observers noted that parts of the flows were turbulent and splashed above the flow surface. Lava stopped advancing at around 1600 as the eruption paused. A geophysicist noted that lava had been flowing S more often due to the new vent that had opened on the flank of the cone during the previous few weeks. The Aviation Color Code remained at Orange due to the lack of ash and tephra emissions, though IMO warned of the potential for lapilli and scoria fallout within a 650 m radius of the active vent. Authorities also warned of gas emission hazards.
Sources: Icelandic Meteorological Office (IMO); Icelandic National Broadcasting Service (RUV); Icelandic National Broadcasting Service (RUV)
The fissure eruption in the W part of the Krýsuvík-Trölladyngja volcanic system, close to Fagradalsfjall on the Reykjanes Peninsula, continued during 18-24 August, though weather often obscured the view of the vents. During 18-19 August new lava flows were observed overflowing the SW and NE crater rims and traveling S, E, and SE in the Geldingadalur and Meradalir valleys. Gas-and-steam plumes often accompanied these flows. On 20 August a large collapse from the inner crater rim was observed in video images (Langihryggur camera), generating some ash emissions. Lava flows traveled toward the Nàtthagi valley during 21-24 August, based on webcam data. Video taken during 21-22 August showed some lava fountaining and flows overflowing the sides of the main cone, accompanied by white gas-and-steam emissions. The Aviation Color Code remained at Orange due to the lack of ash and tephra emissions, though IMO warned of the potential for lapilli and scoria fallout within a 650 m radius of the active vent. Authorities also warned of gas emissions hazards.
Sources: Icelandic Meteorological Office (IMO); Icelandic National Broadcasting Service (RUV); Green Iceland Vid
The fissure eruption in the W part of the Krýsuvík-Trölladyngja volcanic system, close to Fagradalsfjall on the Reykjanes Peninsula, continued during 11-17 August. According to the Institute of Earth Sciences photographs of the flow field captured on 8 August suggested that the lava effusion rate averaged 9.3 cubic meters per second over the previous 12 days. The area of the flow field had grown to 4.4 square kilometers, and the total volume erupted was 119 million cubic meters. New ground cracks were observed in Gónhóll, a hill S of the main crater (the fifth vent) that was a former vantage point but is now surrounded by lava, though they had likely formed sometime in the previous two weeks and may not have been caused by rising magma. A new vent that opened on 9 August was not confirmed to be separate from the nearby main vent until about a week later. The new cone quickly grew from intense spattering and by 17 August was around the same height as the main crater. Spattering from the new vent was at times ejected higher than spatter from the main vent. The Aviation Color Code remained at Orange due to the lack of ash and tephra emissions, though IMO warned of the potential for lapilli and scoria fallout within a 650 m radius of the active vent. Authorities also warned of gas emissions hazards.
Sources: Icelandic Meteorological Office (IMO); Institute of Earth Sciences; mbl.is
The fissure eruption in the W part of the Krýsuvík-Trölladyngja volcanic system, close to Fagradalsfjall on the Reykjanes Peninsula, continued during 28 July-3 August. Lava fountaining and overflows from the fifth vent occurred at intervals of 10-15 hours, with similarly long periods of no activity in between; this pattern emerged around 17 July. According to the Institute of Earth Sciences an overflight was conducted on 27 July; based on new measurements, the lava effusion rate averaged 11 cubic meters per second during 2-27 July, though the average since 17 July was likely lower. The area of the flow field had grown to 4.3 square kilometers, and the total volume erupted was 109 million cubic meters. Lava flowed into the Meradalir Valley and areas to the W and did not advance in the Geldingadalur, Nátthaga, and Sydri Meradalir (SE of the fifth vent) valleys. The flows in Meradalir thickened about 1 m per day. The Aviation Color Code remained at Orange due to the lack of ash and tephra emissions, though IMO warned of the potential for lapilli and scoria fallout within a 650 m radius of the active vent. Authorities also warned of gas emissions hazards.
Sources: Icelandic Meteorological Office (IMO); Institute of Earth Sciences
The fissure eruption in the W part of the Krýsuvík-Trölladyngja volcanic system, close to Fagradalsfjall on the Reykjanes Peninsula, continued during 21-27 July. Lava fountaining and overflows from the fifth vent were periodically visible, in between long pauses in the eruption, and lava from the crater flowed in tubes as well as on the surface.
The Institute of Earth Sciences noted that during 2-19 July the lava effusion rate averaged 7.5 cubic meters per second, which was notably lower than averages in May and June. The area of the flow field had grown to almost 4 square kilometers, and the total volume erupted was 96 million cubic meters. Lava flowed into the Meradalir Valley and areas to the W, but did not advance in the Geldingadalur, Nátthaga, and Sydri Meradalir (SE of the fifth vent) valleys. The Aviation Color Code remained at Orange due to the lack of ash and tephra emissions, though IMO warned of the potential for lapilli and scoria fallout within a 650 m radius of the active vent. Authorities warned of increased gas emissions hazards.
Sources: Icelandic Meteorological Office (IMO); Institute of Earth Sciences
The fissure eruption in the W part of the Krýsuvík-Trölladyngja volcanic system, close to Fagradalsfjall on the Reykjanes Peninsula, continued during 14-20 July. Lava fountaining and overflows from the fifth vent were sometimes visible, and lava from the crater flowed in tubes as well as on the surface. Visible activity at the vent occasionally paused for various lengths of time. The Aviation Color Code remained at Orange due to the lack of ash and tephra emissions, though IMO warned of the potential for lapilli and scoria fallout within a 650 m radius of the active vent. Authorities warned of increased gas emissions hazards.
Sources: Icelandic Meteorological Office (IMO); Icelandic National Broadcasting Service (RUV)
The fissure eruption in the W part of the Krýsuvík-Trölladyngja volcanic system, close to Fagradalsfjall on the Reykjanes Peninsula, continued during 7-13 July. Lava fountaining and overflows from the fifth vent were sometimes visible, and lava from the crater flowed in tubes as well as on the surface. Visible activity at the vent occasionally paused for various lengths of time, though sub-surface lava likely continued flowing through the tube system. Weather conditions prevented views of the crater on some days and also created hazardous conditions. The Aviation Color Code remained at Orange due to the lack of ash and tephra emissions, though IMO warned of the potential for lapilli and scoria fallout within a 650 m radius of the active vent. Authorities warned of increased gas emissions hazards.
Sources: Icelandic Meteorological Office (IMO); Icelandic National Broadcasting Service (RUV); Icelandic National Broadcasting Service (RUV)
The fissure eruption in the W part of the Krýsuvík-Trölladyngja volcanic system, close to Fagradalsfjall on the Reykjanes Peninsula, periodically continued during 30 June-6 July. Lava fountaining and overflows from the fifth vent were occasionally visible, and lava from the crater flowed in tubes as well as on the surface. Occasional rim collapses generated minor ash plumes on 2 July based on footage captured by a visitor. A longest pause in the eruption so far, also reflected in seismic data, began near midnight on 5 July and ended early on 7 July according to a news source. The Aviation Color Code remained at Orange due to the lack of ash and tephra emissions, though IMO warned of the potential for lapilli and scoria fallout within a 650 m radius of the active vent. Authorities warned of increased gas emissions hazards.
Sources: Icelandic Meteorological Office (IMO); The Environment Agency of Iceland; mbl.is; GutnTog
The fissure eruption in the W part of the Krýsuvík-Trölladyngja volcanic system, close to Fagradalsfjall on the Reykjanes Peninsula, continued during 23-29 June. Lava fountaining and overflows from the fifth vent were periodically visible, and lava from the crater flowed in tubes as well as on the surface. The Institute of Earth Sciences noted that during 11-26 June the lava effusion rate averaged 13 cubic meters per second, which was high but similar to rates during May. The area of the flow field had grown to 3.82 square kilometers, and the total volume erupted was 80 million cubic meters. Lava flows thickened 10-15 m in the Meradalir Valley, 15 m in the Nátthaga Valley, and 20 m in the S and E part of Geldingadalur. The Aviation Color Code remained at Orange due to the lack of ash and tephra emissions, though IMO warned of the potential for lapilli and scoria fallout within a 650 m radius of the active vent. Authorities warned of increased gas emissions hazards.
Sources: Icelandic Meteorological Office (IMO); Institute of Earth Sciences
The fissure eruption in the W part of the Krýsuvík-Trölladyngja volcanic system, close to Fagradalsfjall on the Reykjanes Peninsula, continued during 9-15 June. Lava fountaining from the fifth vent was periodically visible, and lava from the crater flowed in tubes as well as on the surface. Sections of the cone’s rim periodically collapsed, sending lava cascading down the flanks. A notable event on 10 June began with lava rising in the crater and vigorously splashing above the rim; an overflow began with several streams of lava that quickly merged into a wide, fast-moving “lava fall” that broke parts of the crater rim. On 13 June lava overflowed the southern area of Geldingadalur valley and flowed over hiking trail “A”, causing authorities to restrict access to the eruption site that day due to safety reasons. The narrow lava flow then turned E and entered the Nátthaga valley from the W wall and joined the larger advancing flow. Lava in Nátthaga continued to get closer to Highway 427 (Suðurstrandarvegur) to the S, and buried fiber optic communication cables. The leading edge of the flow ignited the vegetation, causing small fires. The Aviation Color Code remained at Orange due to the lack of ash and tephra emissions, though IMO warned of the potential for lapilli and scoria fallout within a 650 m radius of the active vent. Authorities warned of increased gas emissions hazards.
Sources: Icelandic Meteorological Office (IMO); Icelandic National Broadcasting Service (RUV); Icelandic National Broadcasting Service (RUV); Icelandic National Broadcasting Service (RUV); Traveller In The Whole World
The fissure eruption in the W part of the Krýsuvík-Trölladyngja volcanic system, close to Fagradalsfjall on the Reykjanes Peninsula, continued during 2-8 June. The flow rate at the fifth vent, now the main lava source, was 12.4 cubic meters per second by 3 June, similar to the 11-13 cubic meters per second measured in May. Cycles of lava fountaining followed by no activity persisted at the fifth vent, though observers noted that the vent opening was getting smaller as the crater walls thickened. One observer described standing waves of lava 20 m high during a period of greater lava effusion. Lava advanced in the Nátthaga, Geldingadalur, and Merardalur valleys. The flows in Nátthaga continued to get closer to Highway 427 (Suðurstrandarvegur) to the S, covering an area with buried fiber optic communication cables. The leading edge of the flow ignited vegetation, causing small fires. The Aviation Color Code remained at Orange due to the lack of ash and tephra emissions, though IMO warned of the potential for lapilli and scoria fallout within a 650 m radius of the active vent. Authorities warned of increased gas emissions hazards.
Sources: Icelandic Meteorological Office (IMO); Institute of Earth Sciences; Icelandic National Broadcasting Service (RUV); Icelandic National Broadcasting Service (RUV)
The fissure eruption in the W part of the Krýsuvík-Trölladyngja volcanic system, close to Fagradalsfjall on the Reykjanes Peninsula, continued during 26 May-1 June. Cycles of lava fountaining followed by no activity persisted at the fifth vent. Lava fountains rose a few hundred meters above the vent and lava advanced in the Nátthaga and Geldingadalur valleys. Lava in Nátthaga continued to get closer to Highway 427 (Suðurstrandarvegur) to the S, and buried fiber optic communication cables. Seismic activity had been decreasing; during 21-28 May there were about 90 earthquakes, compared to the 200 events recorded the previous week. According to a news article, an estimated 31 hectares of vegetation had been scorched by fires set by lava and hot ejected material since early May. The Aviation Color Code remained at Orange due to the lack of ash and tephra emissions, though IMO warned of the potential for lapilli and scoria fallout within a 650 m radius of the active vent. Authorities warned of increased gas emissions hazards.
Sources: Icelandic Meteorological Office (IMO); Icelandic National Broadcasting Service (RUV); Icelandic National Broadcasting Service (RUV)
The fissure eruption in the W part of the Krýsuvík-Trölladyngja volcanic system, close to Fagradalsfjall on the Reykjanes Peninsula, continued during 19-25 May. Lava fountains rose from the fifth vent and continued to feed the lava flows. According to news sources, lava during 20-21 May overtook the eastern earthen dam that had been constructed at the head of Nátthaga valley in an attempt to prevent flows from descending towards Highway 427 (Suðurstrandarvegur) to the S, and burying fiber optic cables. By 22 May the lava was about 2.5 km from the road. The Aviation Color Code remained at Orange due to the lack of ash and tephra emissions. Authorities warned of increased gas emissions hazards.
Sources: Icelandic Meteorological Office (IMO); Icelandic National Broadcasting Service (RUV)
IMO reported that the fissure eruption in the W part of the Krýsuvík-Trölladyngja volcanic system, close to Fagradalsfjall on the Reykjanes Peninsula, continued during 11-18 May. The lava effusion rate was 10.8 meters per second, lower than the 12.9 meters per second rate recorded the week before. Pulsating lava fountains from crater 5, about 7-8 episodes per hour, sent material higher than 300 m. Very high fountains were visible in Reykjavik. Lava continued to flow into the Meradalir Valley; on 17 May video showed sections of the cone’s rim collapsing into the crater. By 18 May the area of the flow field had grown to 2.06 square kilometers, the total volume erupted was 38 million cubic meters. Authorities directed the construction of earthen barriers to prevent lava flowing into the Nátthaga valley and possibly overtaking Highway 427 (Suðurstrandarvegur) to the S, protecting the road and buried fiberoptic cables. The Aviation Color Code remained at Orange due to the lack of ash and tephra emissions. Authorities warned of increased gas emissions hazards.
Sources: Icelandic Meteorological Office (IMO); Institute of Earth Sciences; Icelandic National Broadcasting Service (RUV); National Commissioner of the Icelandic Police (NCIP) Department of Civil Protection and Emergency Management
IMO reported that the fissure eruption in the W part of the Krýsuvík-Trölladyngja volcanic system, close to Fagradalsfjall on the Reykjanes Peninsula, continued during 5-11 May. On 2 May pulsating high jets of lava from crater 5 prompted authorities to widen the restricted zone because; ash and lava could be deposited several hundred of meters away. Cycles of lava jetting and effusion periodically continued during 3-7 May, with lava steadily enlarging the flow field. By 4 May the area of the flow field had grown to 1.41 square kilometers, and the total volume erupted was 23 million cubic meters. Activity was quiet for a period of time during 8-9 May, though IMO noted that fountaining quickly resumed during the morning of 9 May. High jets of lava occurred every 10 minutes, sometimes with jets rising as high as 300 m. Tephra (a few centimeters in diameter) was deposited as far as 1 km from the vent and small amounts of tephra were reported in Gríndavík. Hot deposits have caused small vegetation fires within a few hundreds of meters around the eruption site. On 10 May gas plumes rose higher than 2 km a.s.l. The eruption area was closed due to local wildfires and unfavorable wind conditions. Very high fountains were visible in Reykjavik. On 11 May lava fountains again rose up to 300 m tall and were seen from the capital. The cone had grown to about 50 m high. The Aviation Color Code remained at Orange due to the lack of ash and tephra emissions.
Sources: Icelandic Meteorological Office (IMO); Icelandic National Broadcasting Service (RUV); Institute of Earth Sciences
IMO reported that the fissure eruption in the W part of the Krýsuvík-Trölladyngja volcanic system, close to Fagradalsfjall on the Reykjanes Peninsula, continued during 28 April-4 May. According to a news source, activity at the S vent of the fifth cone, which had opened on 13 April with N and S vents, intensified at around 2030 on 26 April. Fountaining became more explosive and lava was jetted 40-50 m high. The lava-flow rate significantly increased; lava flowed S then E and descended a valley into Meradalir.
By 29 April activity had intensified at the fifth cone where lava ejections reached 250 m high, but had ceased at the others. By 1 May lava flows had traveled N in Meradalir and connected to the flows that had previously descended into the valley from a fissure that opened on 5 April. IMO noted that fountaining at the vent was steady until around 0000-0100 on 2 May when it became more pulsating. Resting periods of 1-2 minutes were punctuated by intense fountaining reaching 100-150 m high for periods of 8-12 minutes. Gas plumes with minor amounts of ash rose 800-900 m a.s.l. A news source noted that on 2 May lava fountains rose over 300 m, the highest to date, and were seen from Reykjavik. Ejecta set fire to vegetation on the hill to the S of the vent, causing a smoke plume. The Aviation Color Code remained at Orange due to the lack of ash and tephra emissions.
Sources: Icelandic Meteorological Office (IMO); Icelandic National Broadcasting Service (RUV)
IMO reported that the fissure eruption in the W part of the Krýsuvík-Trölladyngja volcanic system, close to Fagradalsfjall on the Reykjanes Peninsula, continued during 21-27 April. A M 4.1 earthquake was recorded at 2305 on 21 April about 6 km WSW of the fissures and followed by several aftershocks; it was the largest on the Reykjanes Peninsula since 15 March, before the eruption began. The average lava-flow rate was calculated by the University of Iceland’s Institute of Earth Sciences using photographs most recently collected during an overflight on 26 April. They reported that during the previous five days the flow rate from all of the active craters averaged just over 6 cubic meters per second; the average rate during the 38 days of the eruption was 5.6 cubic meters per second. The area of the flow field was 1.13 square kilometers, the total volume was over 18.4 million cubic meters, with an average thickness of just over 16 m. The Aviation Color Code remained at Orange due to the lack of ash and tephra emissions.
Source: Icelandic Meteorological Office (IMO)
IMO reported that the fissure eruption in the W part of the Krýsuvík-Trölladyngja volcanic system, close to Fagradalsfjall on the Reykjanes Peninsula, continued during 14-20 April. Lava flowed from about eight vents and the flow field continued to expand; on 14 April a new hiking trail (“A”) had been covered. Volcanic gas emissions were at dangerous levels during 14-15 April so the eruption site was closed to the public. At about 1500 on 17 April a new vent was confirmed to have opened. It was small and close to another crater, possibly the one that had opened on 13 April. Lava was not flowing from the northernmost crater (the first that had opened outside Geldingadalur) during 18-20 April.
The eruption had been ongoing for 30 days by 17 April. Based on a report from University of Iceland’s Institute of Earth Sciences, the average lava-flow rate during the first 17 days of the eruption was 4.5-5 cubic meters per second but had increased to 7 cubic meters per second over the previous 13 days. During 12-18 April the flow rate was closer to 8 cubic meters per second, a slight increase over the recent average. By 19 April the area of the flow field was 0.9 square kilometers and the total volume was over 14 million cubic meters.
IMO warned visitors that new fissures could open without adequate visible warning, especially in an area by Litla-Hrút, just S of Keilir, `where seismicity was concentrated. They also warned of increased gas emissions hazards. The Aviation Color Code remained Orange due to the lack of ash and tephra emissions.
Source: Icelandic Meteorological Office (IMO)
IMO reported that the fissure eruption in the W part of the Krýsuvík-Trölladyngja volcanic system, close to Fagradalsfjall on the Reykjanes Peninsula, continued during 7-13 April. Lava from the third fissure flowed S into Geldingadalur and NE towards the Meradalir valley site. Flows from the three fissures connected into one flow field on 7 April. Another new fissure opened at around 0300 on 10 April, halfway between two existing fissures, and all four fissures were simultaneously active. Lava flowed towards Geldingadalur. Gas-rich emission plumes were visible in webcam images rising 1.1-1.3 km (3,600-4,300 ft) a.s.l. At least two new vents opened on 13 April based on webcam views. On 14 April IMO noted that lava was flowing from at least eight vents and unverified reports form the morning suggested two additional vents had opened. Sulfur dioxide gas flux was 29 kilograms per second, comparable to measurements collected during the previous few weeks.
IMO warned visitors that new fissures could open without adequate visible warning, especially in an area just S of Keilir, by Litla-Hrút, where seismicity was concentrated. They also warned of increased gas emissions hazards. The Aviation Color Code remained Orange due to the lack of ash and tephra emissions.
Source: Icelandic Meteorological Office (IMO)
IMO reported that the small eruption in the W part of the Krýsuvík-Trölladyngja volcanic system, close to Fagradalsfjall on the Reykjanes Peninsula, continued during 31 March-6 April. Video and visitor photographs showed spattering and lava fountaining from the two cones, and lava flows from both cones moved W and S within the Geldingadalur valley. A new fissure, 100-200 m long, opened about 700 m NE of the Geldingadalur cones around noon on 5 April. During a helicopter overflight, scientists observed a gas plume rising from the new fissure and a fast-moving lava flow descending into the Meradalir valley to the SE. On 6 April lava from the second fissure was advancing at a rate of 7 cubic meters per second; lava-flow rates at the Geldingadalir site averaged 5.5 cubic meters per second. Around midnight during 6-7 April a third fissure opened in between the first two; all three were oriented NE-SW. Earlier on 6 April field teams had observed a landslide in same area. Lava from the third fissure mostly flowed SW into Geldingadalur. The Aviation Color Code remained Orange due to the lack of ash and tephra emissions.
Sources: Icelandic Meteorological Office (IMO); Icelandic Coast Guard
IMO reported that the small eruption in the W part of the Krýsuvík-Trölladyngja volcanic system, close to Fagradalsfjall on the Reykjanes Peninsula continued during 24-30 March. Video and visitor photographs showed that continuous spattering and lava fountaining resulted in the formation of a second large cone adjacent to the main cone. Lava flows from both cones moved W and S within Geldingadalur valley. On 25 and 29 March the extrusion rate from the cone was an estimated 5.8 and 5.3 cubic meters per second, respectively, based on the latest Pléiades image acquisition (LMI).
A gas plume on 25 and 29 March rose to 1 km (3,300 ft) a.s.l; no ash or tephra was produced. Minor seismicity continued around the Fagradalsfjall area. Video data showed that on the morning of 28 March the N part of the largest cone along the fissure collapsed. Sulfur dioxide flux was 18-19 kg/s and drifted predominantly S. The IMO periodically issued warnings about weather conditions that would cause high concentrations of volcanic gases to settle near the eruption site, causing hazardous conditions for visitors. The Aviation Color Code remained Orange due to the lack of ash and tephra emissions.
Sources: Icelandic Meteorological Office (IMO); Icelandic National Broadcasting Service (RUV)
IMO reported that a small eruption in the western part of the Krýsuvík-Trölladyngja volcanic system, close to Fagradalsfjall on the Reykjanes Peninsula, began at around 2045 on 19 March. The eruption was first visible in webcam images and confirmed by satellite data, and an orange glow in clouds on the horizon was seen from Reykjanesbaer and Grindavík (10 km SW). The Aviation Color Code was raised to Red. Reykjanesbraut, the main road from the capital region to Reykjanesbaer and the international airport at Keflavík, was closed.
A fissure, 500-700 m long, had opened on a slope in the Geldingadalur valley about 4.7 km N of the coast and just off the SE flank of Fagradalsfjall mountain. Small lava fountains rose as high as 100 m above the fissure, and by 1110 on 20 March, the lava had covered an area less than 1 square kilometer and was approximately 500 m across. The extrusion rate was an estimated 5 cubic meters per second. The Aviation Color Code was lowered to Orange because there was little to no ash production that would affect aircraft. Reykjanesbraut reopened, but Sudurstrandarvegur, the road along the S coastline, was closed between Grindavík and Thorlakshofn.
The eruption continued during 21-23 March with a consistent extrusion rate. About three cones had formed along the fissure; the tallest and widest was situated at the higher part of the fissure. Lava flows, mainly from the largest cone, fanned out to the NW, W, and SW, and also flowed S and fanned out to the E. Spatter was ejected above the cones. Video captured by visitors showed parts of the largest cone collapsing and rebuilding. The IMO periodically issued warnings about weather conditions that would cause high concentrations of volcanic gases to settle near the eruption site, causing hazardous conditions for visitors. IMO noted that through the night of 22-23 March night sulfur dioxide levels in Reykjavík had increased, though not to unsafe levels.
Source: Icelandic Meteorological Office (IMO)
IMO reported that seismicity in the Reykjanes Peninsula remained elevated with thousands of earthquakes recorded during 10-16 March, in the western part of the Krýsuvík-Trölladyngja volcanic system in the Fagradalsfjall fissure swarm area. About 16,500 earthquakes had been detected over the week. Some of the largest events, M 4.3-5.4 recorded during 10-12 and 14-15 March, were felt as far as Hvanneyri (97 km NNE of Grindavik), Hvolsvollur (110 km ESE of Grindavik), and Saudakrokur (250 NE of Grindavik). A few, short-lived pulses of tremor were also recorded. The magma intrusion continued to move SW along a fault between Keilir and Fagradalsfjall, and was as shallow as 1 km below the surface. GPS, satellite, and seismic data indicated that the intrusion had expanded S to Nátthaga, a valley just E of Borgarfjall and S of Fagradalsfjall, and was 3-5 km long. Ground fracturing was visible in the area above the intrusion. The Aviation Color Code for Krýsuvík remained at Orange.
Source: Icelandic Meteorological Office (IMO)
IMO reported that seismicity in the area between the Krýsuvík and Reykjanes-Svartsengi volcanic systems remained elevated during 4-10 March. GPS and InSAR data indicated that the intrusion was ongoing, with magma moving slowly SW along a fault between Keilir and Fagradalsfjall at depths of 2-6 km. Seismicity fluctuated during 6-7 March but continued to be elevated; the largest event was a M 5.1 on 7 March. The geophysical and satellite data on 8 March suggested that magma movement had decelerated over the past week, and was possibly as shallow as 1 km. A burst of seismicity was recorded around 0520 on 9 March, concentrated at the S end of the intrusion in an area that was most likely source of the magma. On 10 March IMO stated that more than 34,000 earthquakes had been detected during the past two weeks, a total larger than all of 2020 which was characterized as an unusually high year for seismicity. The Aviation Color Code for Krýsuvík remained at Orange.
Source: Icelandic Meteorological Office (IMO)
IMO reported that seismicity in the area between Krýsuvík and Reykjanes-Svartsengi volcanic systems remained elevated during 26 February-1 March. More than 6,000 earthquakes had been detected after a M 5.7 event was recorded at 1005 on 24 February; two of those events were above M 5. The earthquakes were distributed over a 25-km-long section of a N-S striking fault along the E-W striking plate boundary, primarily located between Keilir and Fagradalsfjall. GPS data showed 4 cm of horizontal displacement near the epicenter of the M 5.7 event. An InSAR interferogram showed left-lateral movement over a large section of the plate boundary. Tremor began to be recorded by several stations at 1425 on 3 March, in an area located 2 km SW of Keilir. The signals possibly indicated magma rising towards the surface and prompted IMO to raise the Aviation Color Code for Krýsuvík to Orange.
Source: Icelandic Meteorological Office (IMO)
IMO raised the Aviation Color Code for Krýsuvík to Yellow on 24 February based on recent increased seismicity. Intense seismic activity had been detected for the previous few days and since midnight through the generation of the report at 1107 more than 500 earthquakes had been recorded. At 1005 a M 5.7 earthquake occurred 5 km W of Krýsuvík and at 1027 a M 4.2 was located in Nupshlidarhals, less than 1 km NW of Krýsuvík. The seismic unrest was unusual for the area in the context of the unrest in the Reykjanes peninsula that began in January 2020.
Source: Icelandic Meteorological Office (IMO)
Reports are organized chronologically and indexed below by Month/Year (Publication Volume:Number), and include a one-line summary. Click on the index link or scroll down to read the reports.
New fissure eruption began in March 2021, producing fountains and lava flows
The Krýsuvík-Trölladyngja system, one of five volcanic systems along the Reykjanes Peninsula in Iceland, is characterized by a 50-km-long composite fissure swarm trending about N38°E. The system includes the shorter Fagradalsfjall and Krýsuvík fissure swarms; there is no clear sign of a central volcano. Seismicity in this area began on 24 February 2021 and continued to increase through March, causing some surface fractures. An orange glow observed on 19 March indicated the start of a fissure eruption near Fagradalsfjall in the Geldingadalur (also referred to as Geldingadalir) valley (figure 1). Several fissure vents opened along a NE-SW trend, accompanied by white gas-and-steam emissions, spatter, and lava fountains; flows began to fill Geldingadalur and eventually reached the Meradalir valley. This report covers activity through April 2021 and describes the beginning of the new eruption using information from the Icelandic Meteorological Office, the Institute of Earth Sciences, Icelandic National Broadcasting Service, the University of Iceland, and various satellite data.
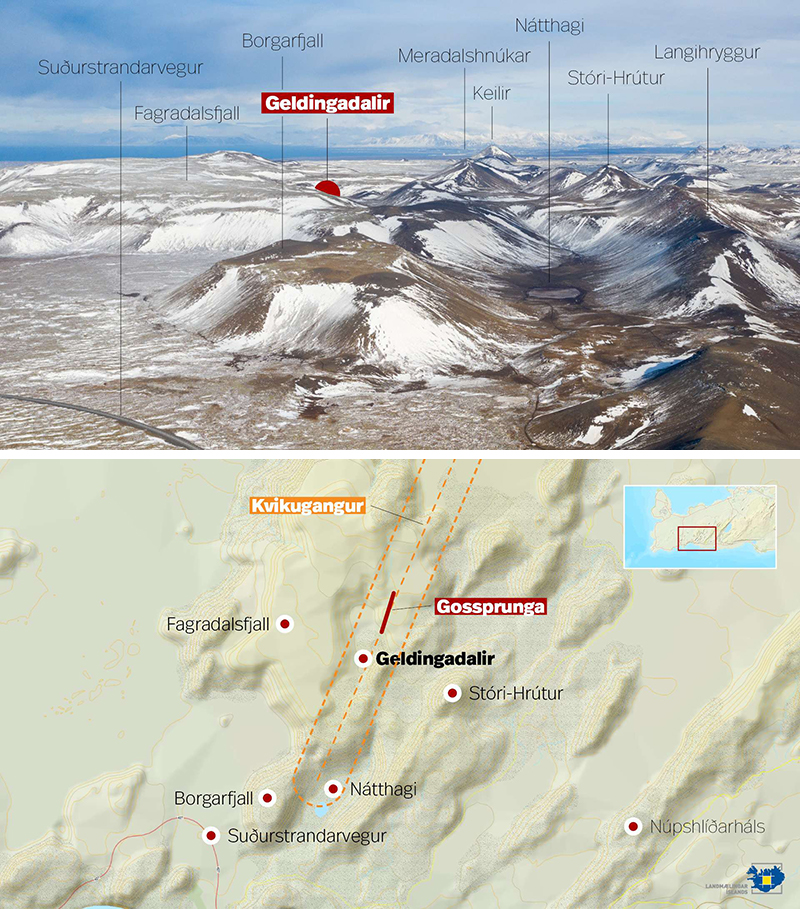 |
Figure 1. Photo (top) showing part of the Krýsuvík-Trölladyngja region on the Reykjanes Peninsula, looking NE from Suðurstrandavegur, highlighting the location of the Geldingadalur valley and posted on 20 March 2021. The Meradalir valley is located directly to the E of Geldingadalur. A map (bottom) shows the location of the initial fissure eruption (red line also marked Gossprunga) in the Geldingadalur valley, the dike intrusion is outlined in orange. The map was posted on 19 March 2021. Courtesy of RÚV and IMO. |
Seismicity during February 2021. On 24 February 2021 seismicity in the region increased notably; at 1005 an Mw 5.7 earthquake was detected 5 km W of Krýsuvík and at 1027 an Mw 4.2 was detected in Núpshlíðarháls (less than 1 km NW). More than 6,000 earthquakes were recorded through the end of the month after the Mw 5.7 event, two above Mw 5. The earthquakes were distributed over a 25-km-long section of a N-S striking fault, primarily between Keilir (a mountain to the W of Trölladyngja) and Fagradalsfjall (a volcanic system 1 km N of Nátthaga). Most of the earthquakes were located about 5 km deep at Fagradalsfjall and likely indicated magma movement. GPS data showed a 4 cm horizontal displacement near the epicenter of the Mw 5.7 event, and satellite data also indicated ground deformation. By 27 February, more than 7,200 earthquakes had been recorded since 24 February. These earthquakes seemed to have shifted to the SW corner of Fagradalsfjall.
Seismicity during 1-19 March 2021. Thousands of earthquakes continued to be detected through mid-March. On 3 March seismic stations recorded tremor starting around 1425 in an area 2 km SW of Keilir, which likely indicated magma was rising toward the surface. By 5 March more than 20,000 earthquakes had been recorded since 24 February. InSAR satellite images between 25 February and 3 March showed signs of a magmatic intrusion moving slowly SW along a fault between Fagradalsfjall and Keilir at depths of 2-6 km. Another 2,800 earthquakes were detected on the peninsula on 7 March, the largest of which was an Mw 5 at 0201 and by 10 March IMO reported that more than 34,000 earthquakes had been detected over the past two weeks, a few of which were in the Mw 5 range. The magmatic intrusion continued to move SW and was as shallow as 1-1.5 km beneath the surface. GPS, satellite, and seismic data indicated that the intrusion was 3-5 km long and had expanded S to Nátthaga, a valley just E of Borgarfjall and S of Fagradalsfjall. Ground fracturing was visible in the area above the intrusion. On 17 March about 1,400 earthquakes were detected on the Reykjanes peninsula. The number of earthquakes decreased to 400 on 18 March. At least 1,000 earthquakes were detected during 19 March.
Volcanism during March 2021. A small eruption in the W part of the Krýsuvík-Trölladyngja volcanic system began around 2045 on 19 March and was first visible in webcam images and confirmed by thermal satellite data (figure 2). An orange glow reflected from clouds on the horizon was visible from Reykjanesbær and Grindavík (10 km SW). The initial length of the fissure was 200 m (figure 3), which gradually grew to 700 m long, on a slope in the Geldingadalur valley about 4.7 km inland from the S coast of the peninsula. Small lava fountains rose as high as 100 m above the fissure and by 1110 on 20 March lava had covered an area less than 1 km2 and was approximately 500 m wide (figures 4 and 5). The rate of extrusion was an estimated 5 m3/s. Three cones formed, with the tallest and widest cone at the higher part of the fissure. Lava flows, mainly originating from the largest cone, spread out to the NW, W, E, and SW, and also flowed S. Spatter was ejected above the cones. Video captured by visitors showed that parts of the largest cone, measuring at least 30 m high, had collapsed and was being rebuilt.
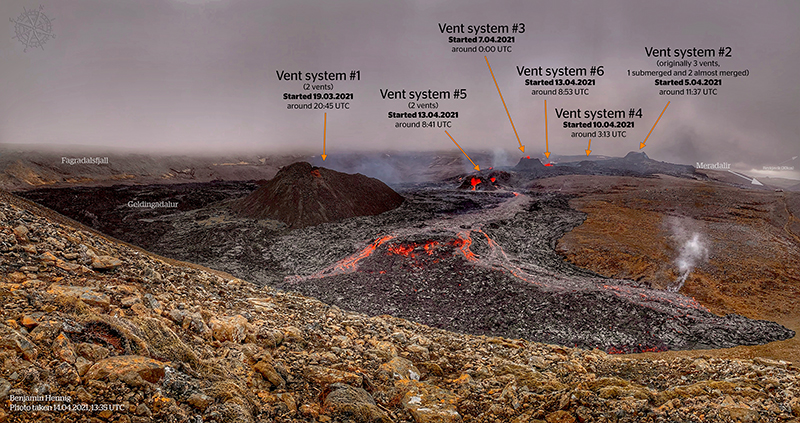 |
Figure 2. Annotated photo showing the location of the six fissure vents that opened on 19 March (fissure 1), 5 April (fissure 2), 7 April (fissure 3), 10 April (fissure 4), and 13 April (fissures 5 and 6) 2021 and the resulting lava flows from each. Lava flows from three original vents (marked as Vent 2) had intersected to one single, continuous field that traveled into the Meradalir valley (E of Geldingadalur) on 5 April. Photo updated on 14 April 2021; courtesy of Benjamin Hennig, University of Iceland. |
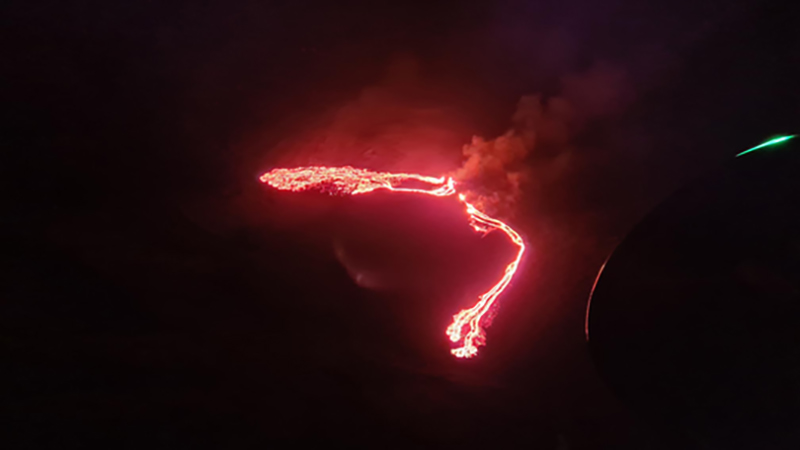 |
Figure 3. Photo at the start of the Krýsuvík-Trölladyngja eruption on 19 March 2021 showing incandescent lava flows traveling SSW and W and gas-and-steam emissions from the 200-m-long fissure in the Geldingadalur valley. The area covered by lava is roughly 500 m wide. Photo was taken from the Icelandic Coast Guard helicopter. Courtesy of IMO. |
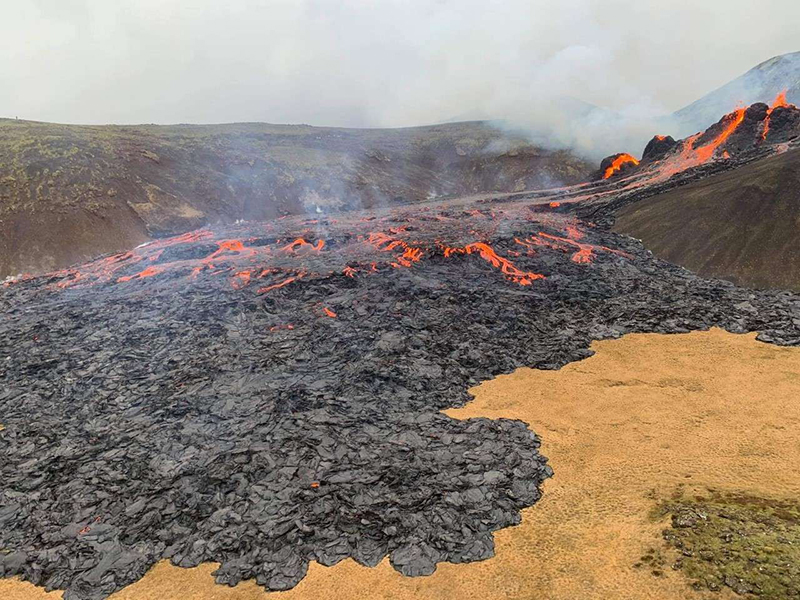 |
Figure 4. Photo of the eruption site in the Geldingadalur valley at Krýsuvík on the morning of 20 March 2021 showing the active lava flows and white gas-and-steam emissions. Courtesy of Gísli Berg, RÚV. |
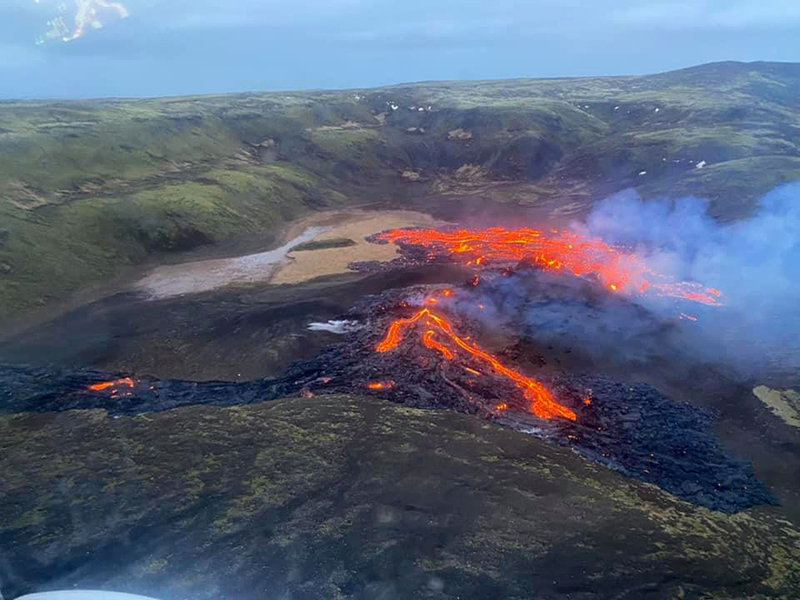 |
Figure 5. Aerial view of the eruption site in the Geldingadalur valley at Krýsuvík on the morning of 20 March 2021 during a surveillance overflight showing the active lava flows and gas-and-steam emissions. Courtesy of the Icelandic Coast Guard. |
On 21 March DOAS (Differential Optical Absorption Spectrometer) traverses showed that the SO2 flux was between 15-55 kg/s and a gas-and-steam plume had risen to 400-1,000 m altitude. Video data showed that on 21 March lava was flowing through where the rim of the cone had collapsed (figure 6). IMO noted that during the night of 22-23 March sulfur dioxide levels in Reykjavík had increased. A gas plume on 23 March rose to 1.3 km altitude during 0900-1000. Analysis of a Pléiades satellite image taken from 23 March showed a cone height of 20 m, a maximum lava thickness of 22 m, and an average lava thickness of 9.5 m. The total erupted volume was 1.8 million cubic meters, and the average rate of effusion was 5.7 m3/s since the start of the eruption. On 24 March a DOAS traverse recorded the SO2 flux as 18 kg/s while a gas plume had risen to 1 km altitude, based on calibrated images. During 25-26 March the latest Pléiades image acquisition (LMI) showed that the rate of extrusion was 5.8-7 m3/s, spreading dominantly to the W and S, though it remained in Geldingadalur (figure 7). Spatter was ejected above the main vent and resulted in the formation of a second spatter cone adjacent to the main cone. Small lava fountains rose above the two vents.
 |
Figure 6. Image from video showing the active lava flows filling the Geldingadalur valley at Krýsuvík at 1423 on 21 March 2021. In the background new lava flows breached the rim of the active cone (on the right side) causing a partial collapse. Courtesy of RÚV. |
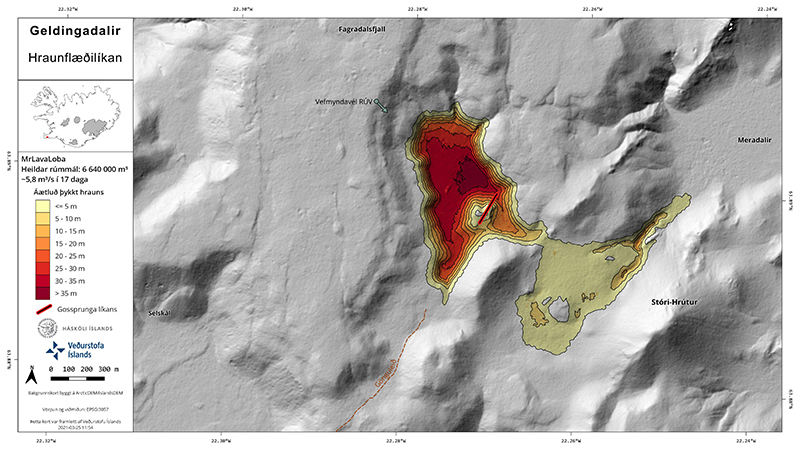 |
Figure 7. Initial map of the probable extent of the lava field in Geldingadalur at Krýsuvík 17 days after the start of the eruption. The effusion rate is about 5.8 m3/s. The colors represent the thickness of the lava flows from 5 m (light yellow) to 35 m (darkest red). The total volume of lava erupted according to this map is 6.6 million cubic meters. The red line represents the location of the fissure. The Geldingadalur valley is covered by the thickest lava flows (dark red) and the southern Meradalir valley is covered by the thinnest (light yellow). Created on 25 March 2021. Courtesy of IMO. |
According to the Institute of Earth Sciences, by 28 March activity was concentrated in two vents, referred to as the N and S vents. During the evening of 27-28 March a lava flow from the N vent continued to flow through a gap in the N crater wall, forming a broad river of lava that traveled W and then S toward the southernmost depression of Geldingadalur, near a hiking trail. The flow fed into a crusted-over tunnel in the N part of the valley, gradually extending N due to inflation. Little flow was observed in the S vent, but before midnight some lava began to effuse through a breach in the S rim. Spattering increased at the same time, and within 30 minutes the flow began to move S, splitting into E and W branches. The E stream soon stopped, but the W one continued to grow, almost merging with the flow from the N vent. Around 0100 a lateral outbreak to the W formed from the S vent and remained active through 0400. By 0430 a new flow from the S vent was moving roughly NW; within five minutes it had reached the N lava flow. Over the next few hours this flow built a well-confined channel that remained active into 28 March. Video data showed that on the morning of 28 March the N part of the largest cone along the fissure had collapsed. A DOAS transverse showed that the SO2 flux was 19 kg/s and the resulting plume drifted predominantly S; a gas-and-steam plume on 25 and 29 March rose to 1 km altitude. The total volume of erupted lava was 3-7 million cubic meters on 28 March. By 29 March the rate of extrusion had decreased slightly to 5.3 m3/s using the latest Pléiades image acquisition.
Activity during April 2021. Video and visitor photographs continued to show spattering, lava fountaining, and flows from both cones; the flows spread W and S in Geldingadalur. During 2 April the N vent had ejected some tephra to the E, forming a narrow deposit that covered part of the lava surface E of the vents and extending a few tens of meters up the slope, according to the Institute of Earth Sciences (figure 8). During the evening, the level of the lava pond at the N vent dropped by a few meters, though lava continued to feed into it (figure 9).
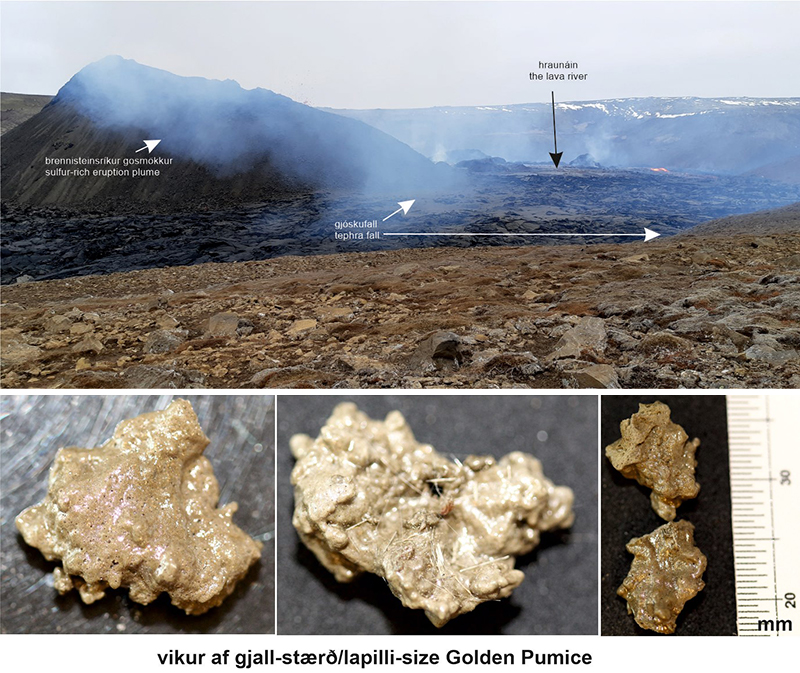 |
Figure 8. Photo of the eruption site at Krýsuvík with annotations (top photo) indicating the location of gas-and-steam emissions (left), a lava flow (back right), and tephra deposits E of the vent (center). Some of this tephra was composed of “golden pumice” (bottom photos) that scientists collected at the site. It also contains a significant amount of Pele’s hair, some of which measure up to 10 cm long. Photos courtesy of Ármann Höskuldsson and Thor Thordarson, University of Iceland. |
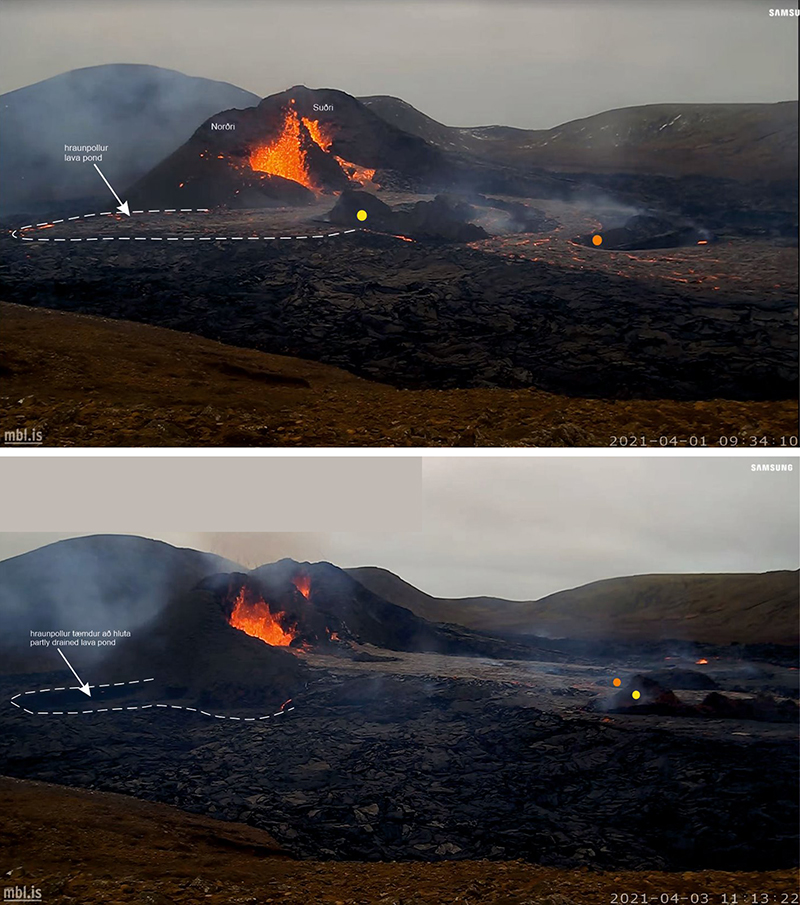 |
Figure 9. Comparison of webcam images showing the N (left) and S (right) vents at Krýsuvík taken on 1 (top) and 3 (bottom) April 2021. Spattering at both vents was accompanied by some gas-and-steam emissions. The white outline represents the rim of the lava pond, fed by the N vent. The S vent feeds a lava flow. The top image shows the outline of the lava pond before drainage, while the bottom image shows the changes in the pond after part of it had drained. Courtesy of the University of Iceland. |
Around 1137 on 15 April a new 100-200 m fissure (fissure two) opened in Geldingadalur about 1 km NE of the first eruptive vents (figure 2). Another fissure opened just W of the one that activated at 1137, though it was smaller; its lava flows were traveling into Meradalir (figure 10). During a helicopter overflight, scientists observed a gas plume rising above the new fissure, as well as a 15-m-thick lava flow traveling E into the Meradalir valley (figure 11). At midnight during 6-7 April a third fissure opened between the other two active vents and began to effuse lava at an average rate of 4-5 m3/s, with flows moving S into Geldingadalur and NE toward Meradalir; all three fissures were oriented NE-SW (figure 10). An overflight in the afternoon of 7 April reported that the resulting lava fields from the three fissures intersected with each other, creating a single continuous field (figure 2). A fourth fissure was reported around 0300 on 10 April between the two most recent fissures (from 5 and 7 April) that activated five days earlier, according to IMO (figures 2 and 10).
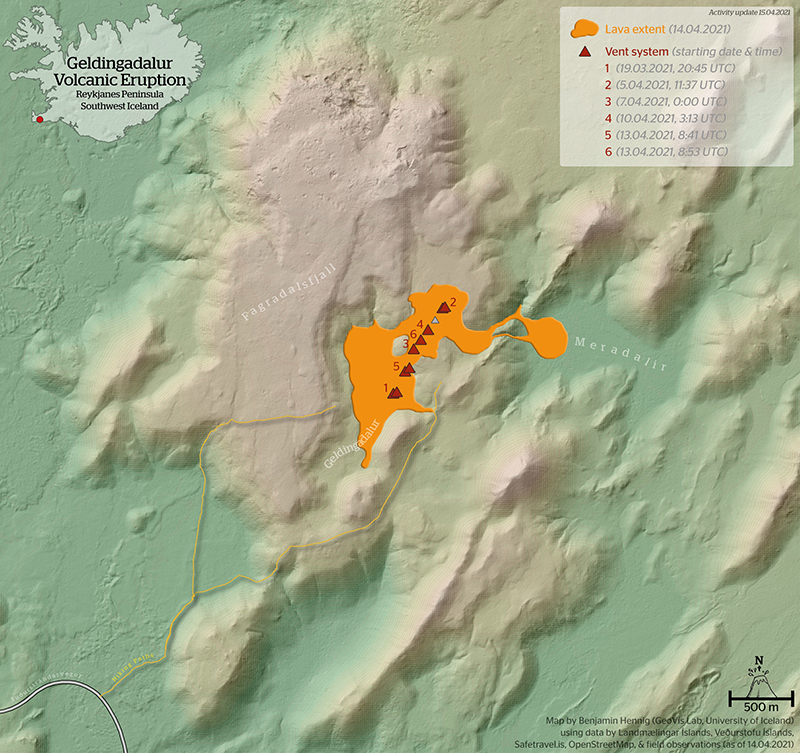 |
Figure 10. A map of the eruption area at Krýsuvík showing the location of the six active fissures (red triangles) and the direction of the lava flows (orange color) in the Geldingadalur and Meradalir valleys. Map was updated on 15 April 2021. Courtesy of Benjamin Hennig, University of Iceland. |
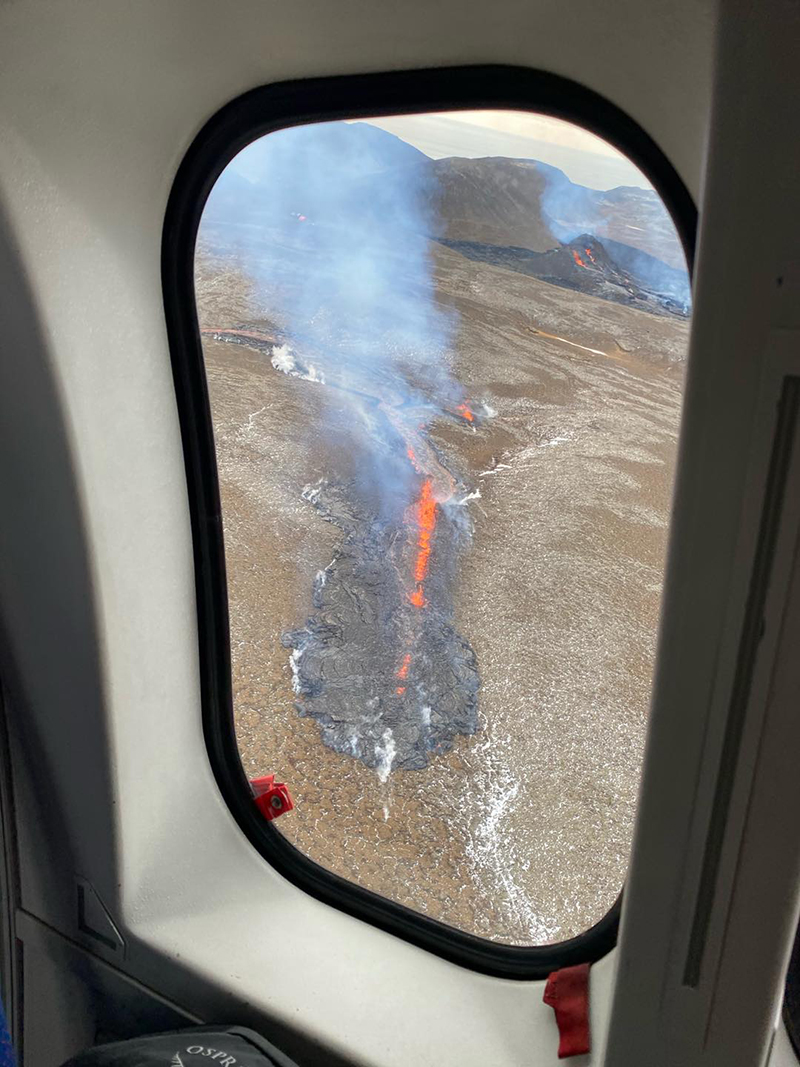 |
Figure 11. Photo of the new fissure that opened at Krýsuvík on 5 April 2021 taken during a helicopter overflight. The lava flow was accompanied by gas-and-steam emissions. Courtesy of the Icelandic Coast Guard. |
On 13 April at least two new fissures were detected by webcams on both sides of the 7 April fissure and on the E side of a lava branch that extended from the northernmost vents S into Geldingadalur. According to the University of Iceland, these two new vents opened between fissures three and four (figure 2). On 14 April one hiking trail was covered by lava. An update on 15 April noted that the greatest seismic activity was on the Reykjanes peninsula near Litla-Hrút (S of Keilir); minor deformation was observed in this area based on GPS and satellite data. Around 1500 on 17 April another small fissure opened on the lava field. The average effusion rate from all vents during 12-18 April was 8 m3/s, slightly higher than the previous measurements.
According to aerial photos of the first fissure vent showing 18-20 April, no active lava was visible. By 19 April the area of the lava flow field was 0.9 km2 with a total erupted volume of 14.4 million cubic meters. IMO generate several graphs to track the changes in the area of the lava flow field, the volume of erupted lava, and the rate of lava effusion through 23 April (figure 12). On 26 April at 2030 activity increased from fissure 5 at the southernmost vent that had been active since 13 April; lava fountains became more explosive and ejected material 40-50 high (figure 13). The lava effusion rate increased, and flows traveled S then E into the Meradalir valley. By 29 April activity at most cones had stopped but intensified at the fifth cone; lava fountains reached 250 m high. At 2031 a small surface breakout appeared near the top of the lava flow extending toward Meradalir. By 1 May the lava flows moving N in Meradalir had intersected flows that had previously descended into the valley from the fifth fissure (5 April).
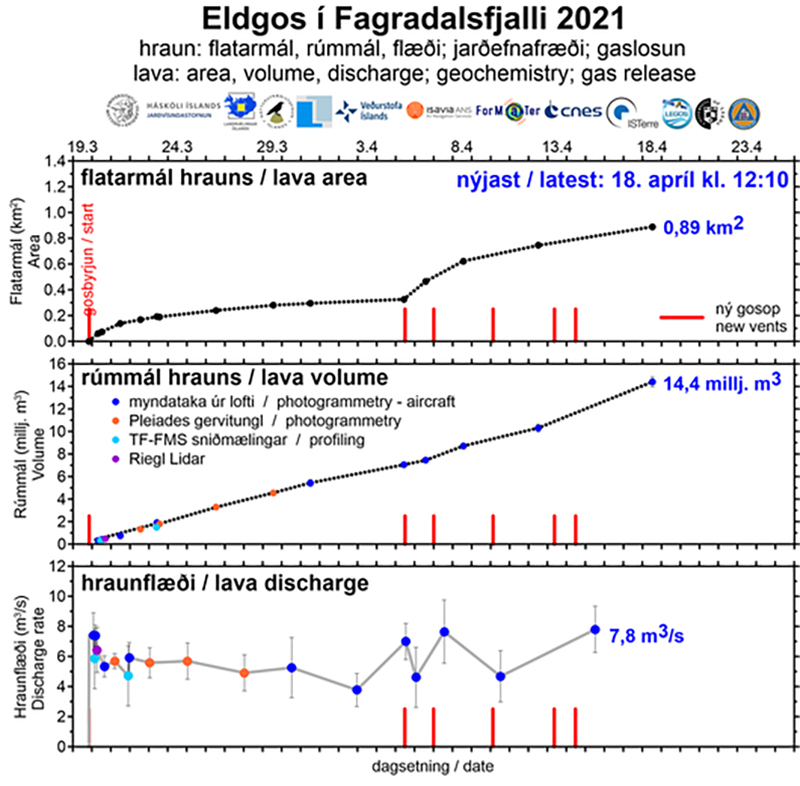 |
Figure 12. Graphs showing the evolution of the area (top), volume (middle) of lava, and rate of effusion (bottom) from 19 March through 23 April 2021 at Krýsuvík. By 18 April the area of lava was 0.89 km2, the volume of erupted lava was 14.4 million cubic meters, and the effusion rate was 7.8 m3/s. Courtesy of IMO. |
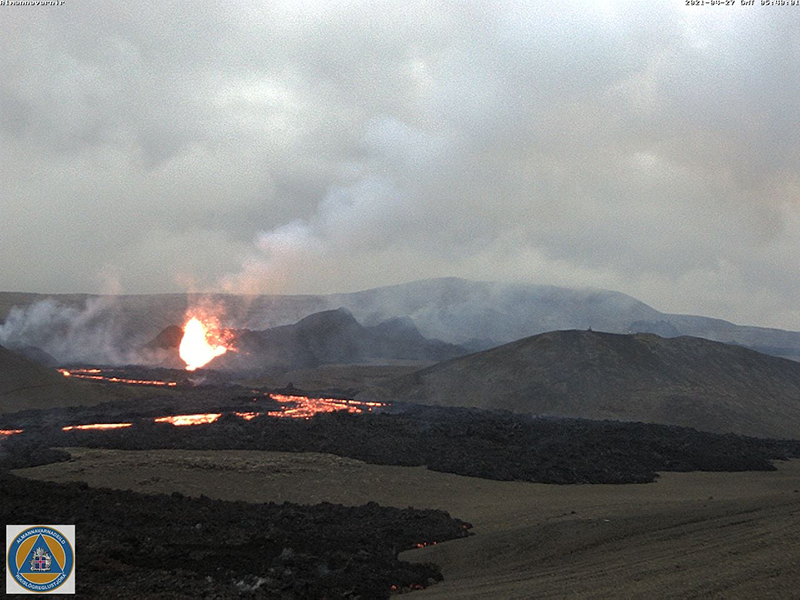 |
Figure 13. Webcam image of fissure 5 at Krýsuvík on 27 April 2021 showing spattering and lava fountains that rose 40-50 m high. Lava flows traveled SE toward the Meradalir valley. The image is taken from a viewpoint in the Meradalir valley. Courtesy of the University of Iceland. |
Satellite data. The NASA Global Sulfur Dioxide page, using data from the TROPOMI instrument on the Sentinel-5P satellite, showed persistent sulfur dioxide plumes during 25-27 and 30 April (figure 14). These plumes exceeded 2 DUs (Dobson Units) according to the satellite data. Beginning in mid-March, MIROVA detected strong and frequent thermal anomalies that continued through April due to the lava flows. On clear weather days, these thermal anomalies were visible in Sentinel-2 infrared satellite imagery (figure 15).
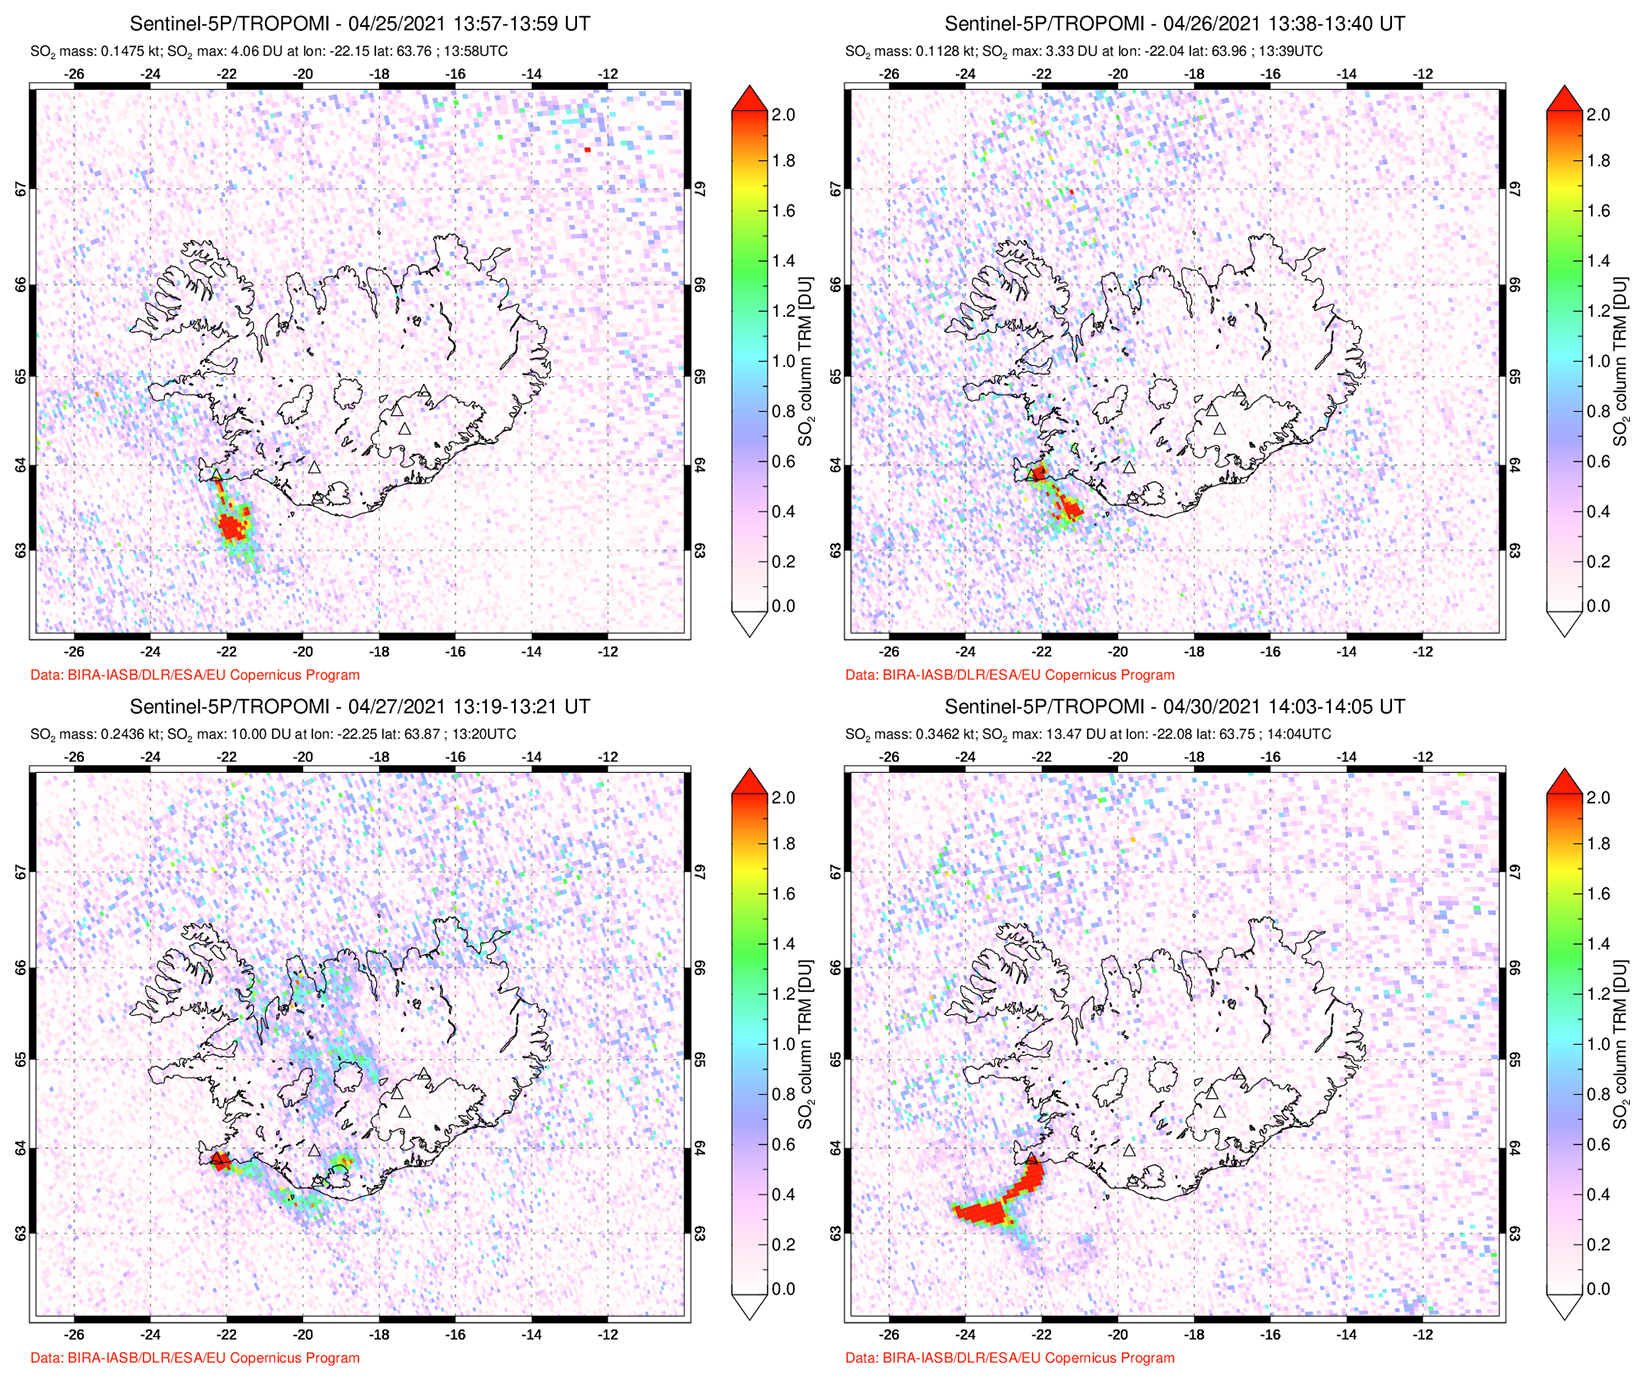 |
Figure 14. Near-continuous sulfur dioxide plumes were detected above Krýsuvík based on data from the TROPOMI instrument on the Sentinel-5P satellite for four days in April 2021. Plumes drifted SE on 25-26 April (top left and right) 2021, E on 27 April (bottom left), and SW on 30 April (bottom right). Courtesy of the NASA Global Sulfur Dioxide Monitoring Page. |
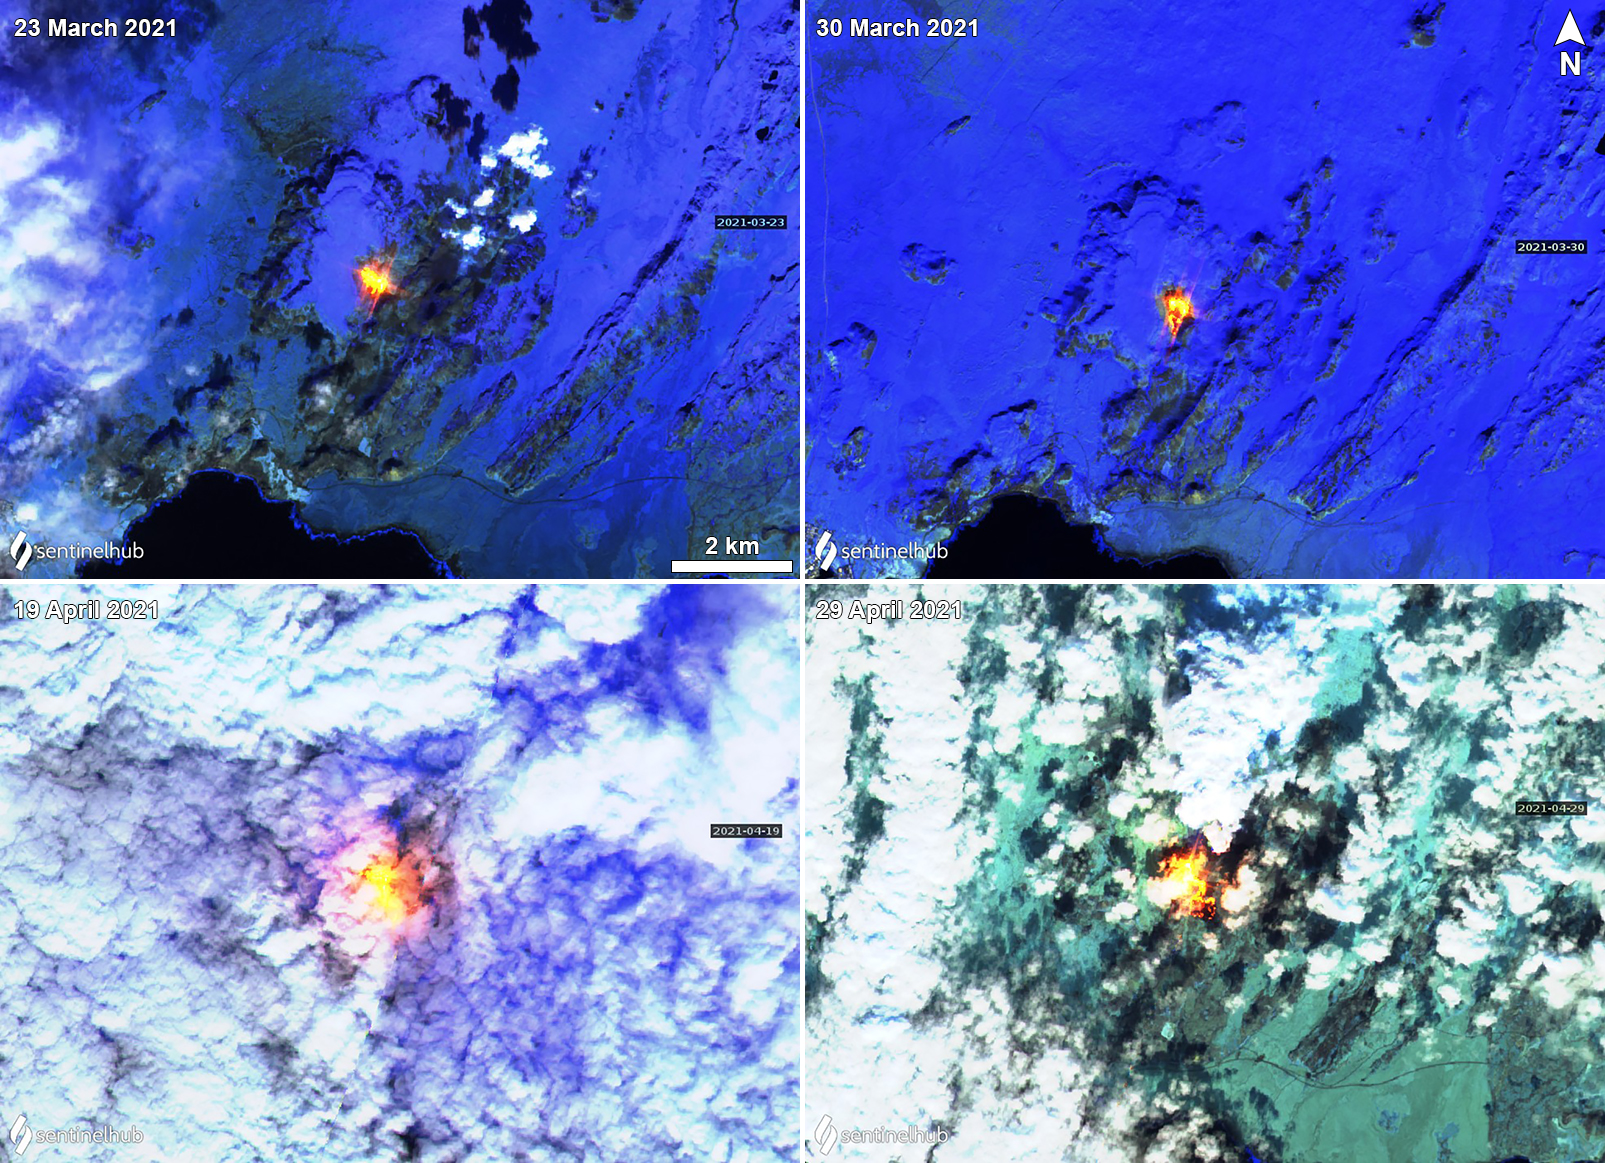 |
Figure 15. Sentinel-2 infrared satellite images show a strong thermal anomaly in the Krýsuvík-Trölladyngja volcanic system on 23 (top left) and 30 (top right) March and 19 (bottom left) and 29 (bottom right) April 2021. During 19 and 29 April, clouds obscured most of the field, but strong thermal activity was still visible. Sentinel-2 satellite images with “Atmospheric penetration” (bands 12, 11, 8A) rendering. Courtesy of Sentinel Hub Playground. |
Information Contacts: Icelandic Meteorological Office (IMO), Bústaðavegur 7-9 105 Reykjavík, Iceland (URL: http://en.vedur.is/); Institute of Earth Sciences, Sturlugata 7 101 Reykjavík, Iceland (URL: http://www.earthice.hi.is/); Icelandic National Broadcasting Service (RUV), Efstaleiti 1 150 Rekyjavík, Iceland (URL: http://www.ruv.is/); University of Iceland, Volcanology and Natural Hazard Group, Askja, Sturlugötu 7 101 Reykjavík, Iceland (URL: https://www.hi.is/); Icelandic Coast Guard, Skógarhlío 14 105 Reykjavík, Iceland (URL: www.lhg.is, https://www.facebook.com/Landhelgisgaeslan/); NASA Global Sulfur Dioxide Monitoring Page, Atmospheric Chemistry and Dynamics Laboratory, NASA Goddard Space Flight Center (NASA/GSFC), 8800 Greenbelt Road, Goddard, Maryland, USA (URL: https://so2.gsfc.nasa.gov/); Sentinel Hub Playground (URL: https://www.sentinel-hub.com/explore/sentinel-playground); Benjamin Hennig, University of Iceland, Sæmundargata 2 102 Reykjavík (URL: https://english.hi.is/staff/ben, https://geoviews.net/).
Lava fountaining and flows persist during May-September 2021
The Krýsuvík-Trölladyngja system is one of five volcanic systems along the Reykjanes Peninsula in Iceland. The system is characterized by a 50-km-long composite fissure swarm trending about N38°E and includes the shorter Fagradalsfjall and Krýsuvík fissure swarms. Seismicity in this area began on 24 February 2021 and continued to increase through March, causing some surface fractures. An orange glow observed on 19 March indicated the start of a fissure eruption near Fagradalsfjall in the Geldingadalur (also referred to as Geldingadalir) valley (see figure 1 in BGVN 46:05). Several fissure vents opened along a NE-SW trend during early- to mid-April 2021 (BGVN 46:05), accompanied by white gas-and-steam emissions, spatter, and lava fountains; flows began to fill Geldingadalur and eventually reached the Meradalir valley to the SE. This report covers activity from May through September 2021, describing persistent lava fountains and flows mainly from vent 5 (also referred to as the “main crater”), using information primarily from the Icelandic Meteorological Office, the Institute of Earth Sciences, Icelandic National Broadcasting Service, the University of Iceland, and various satellite data. The Aviation Color Code remained at Orange due to the lack of ash and tephra emissions.
Activity during May 2021. Lava fountaining and lava flows continued to be reported during May; by 1 May flows had traveled N in Meradalir, connecting to those that had previously descended into the valley. Fountaining from vent 5 was consistent until around 0000-0100 on 2 May, when IMO noted a that the fountaining changed to cycles of intense lava jetting and effusion, followed by periods of calm. Intense fountains rose 100-150 m high for periods of 8-12 minutes and gas plume with minor amounts of ash rising 440-540 m above the vent or 800-900 m altitude. Ejecta rose several hundred meters above the crater and could been seen from Reykjavik as the lava flows traveled in channels under the crater rim (figure 16). Ejecta ignited small vegetation fires on the hill S of the vent, causing a smoke plume. Intermittent lava field measurements were taken by the Institute of Earth Sciences at the University of Iceland, growing from a volume of 23 million cubic meters over 1.4 km2 on 4 May, to 143 million cubic meters over 4.6 km2 on 9 September (table 1).
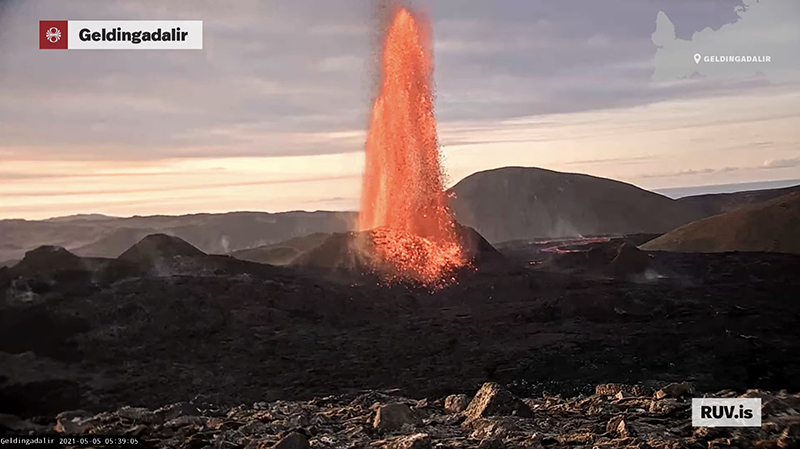 |
Figure 16. Webcam image of a high lava fountain from the Geldingadalur eruption at Krýsuvík-Trölladyngja on 5 May at 0539. A lava flow is visible in the background. Courtesy of RÚV. |
Table 1. Summary of the gradually increasing volume and area measurements taken during the Krýsuvík-Trölladyngja during May-September 2021. Courtesy of IMO and IES.
| Date | Volume of erupted lava (million m3) | Area covered by lava (km2) |
| 04 May 2021 | 23 | 1.4 |
| 12 May 2021 | 30 | 1.8 |
| 18 May 2021 | 38 | 2.1 |
| 02 Jun 2021 | 54 | 2.7 |
| 13 Jun 2021 | 63 | 3.2 |
| 26 Jun 2021 | 80 | 3.8 |
| 22 Jul 2021 | 96 | 4 |
| 27 Jul 2021 | 109 | 4.3 |
| 08 Aug 2021 | 119 | 4.4 |
| 09 Sep 2021 | 143 | 4.6 |
During the morning of 8 May a helicopter pilot reported that lava had begun to flow from the first vent in Geldingadalur. On 9 May seismic tremor confirmed that the fifth vent, which had become the “main” vent, had resumed lava fountaining in the morning. High jets of lava occurred every ten minutes, rising 300 m high. Some centimeter-sized tephra was found 1 km from the vent and minor tephra deposits were reported in the nearby town of Gríndavik; small vegetation fires were also ignited by falling pyroclasts up to hundreds of meters from the eruption site. By 10 May the fountains were rising 300-500 m high, resulting in lava spatter and ejecta; the higher fountains could be seen from Reykjavik. Webcams showed accompanying gas-and-steam plumes rising to 2 km altitude and SO2 measurements were 4,000-5,000 tons/day.
During 11-18 May the effusion rate was 10.8 m3/s, based on data from the University of Iceland and the Icelandic Institute of Natural History, a decrease in rate compared to the previous week of 12.9 m3/s. Fountains on 11 May again rose to 300 m and could be seen from the capital. Due to constant spatter, the cone height increased to 50 m. On 12 May a strong lava flow was reported in the Meradalir valley. Seven to eight lava fountain episodes every hour from vent 5 rose 100-300 m above the crater, depositing material nearby and causing some vegetation fires. Sections of the top walls of vent 5 collapsed into the crater on 17 May, which increased the lava flow significantly (figure 17); flows traveled into Geldingadalur, Meradalir, and S of Meradalir (also referred to as Syðri-Meradalir SE of vent 5).
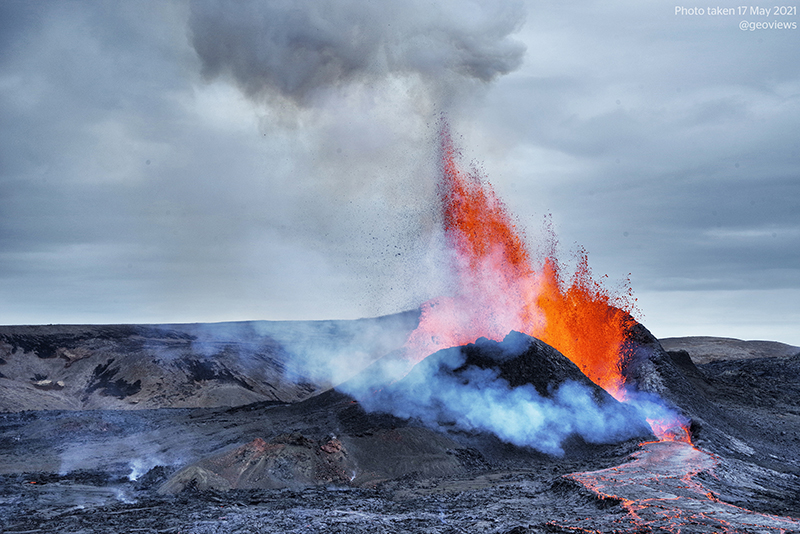 |
Figure 17. Photo of strong lava fountains rising 100-300 m high above vent 5 from the Geldingadalur eruption at Krýsuvík-Trölladyngja on 17 May 2021. A lava flow is visible in the foreground, accompanied by white gas-and-steam plumes. Courtesy of Benjamin Hennig, University of Iceland. |
By 18 May the area of the flow had grown to 2.06 km2 and had a total volume of 38 million cubic meters. Barriers were being constructed to prevent lava flowing into the Nátthaga (also known as Nátthagi) valley and possibly overtaking Highway 427 (Suðurstrandarvegur) to the S, protecting the road and buried fiberoptic cables; by 22 May the flow had broken past the E barrier and was about 2.5 km from the road. A DOAS (Differential Optical Absorption Spectrometer) traverse was made on 27 May that measured 48-58 kg/s of SO2. By 28 May only vent 5 remained active and remained characterized by cycles of lava fountains that reached 500 m; lava flows continued to travel into the Geldingadalur and Meradalir valleys and into the Nátthaga valley. Seismicity had also decreased on the Reykjanes peninsula, 90 of which were detected compared to the 200 that were detected the previous week. An estimated 31 hectares of vegetation had been burned by fires from lava and hot ejected material since early May, according to a report from the Icelandic National Broadcasting Service (RUV).
Activity during June 2021. Lava fountains and flows continued to be reported during June, the latter of which traveled through tubes and along the surface, with vent 5 as the primary source. Flow rate was comparable to the previous month, averaging 12-13 m3/s, based on measurements by University of Iceland scientists. Due to continued fountaining, observations showed that the opening at vent 5 was decreasing in size as the crater walls became thicker. During one period of stronger effusion fountains were rising as high as 20 m. Flows continued to advance in the Geldingadalur, Meradalir, and Nátthaga valleys; lava in the Nátthaga valley continued S in the direction of Highway 427. The leading edges of the flows ignited small vegetation fires. By 2 June the volume of effused lava was 54 million cubic meters and covered an area of 2.7 km2.
On 5 June lava began to advance W toward the S Meradalir valley. Lava at vent 5 vigorously splashed above the crater rim which led to an overflow on 10 June with several streams merging into a wide, fast-moving “lava fall” that collapsed parts of the crater rim. On 13 June lava began to flow over the S part of the Geldingadalur valley and over a hiking trail during the morning, which then became a narrow lava flow that turned E and entered the Nátthaga valley from the W wall, joining the larger advancing flow (figure 18). By 26 June the volume of erupted lava had increased to 80 million cubic meters and covered an area of 3.82 km2. The lava flow was 10-15 m thick in the Meradalir valley and 15 m thick in the Nátthaga valley to the S. Thickening was greatest, at 20 m, in the S and E part of the Geldingadalur valley. On 28 June the lava effusion stopped at the same time that volcanic tremor decreased to very low levels, which remained low through the following day. A DOAS traverse measurement showed that the SO2 flux was 50-85 kg/s. By 30 June tremor and lava effusion renewed and became more vigorous; gas-and-steam emissions continued from the main crater, accompanied by high SO2 values.
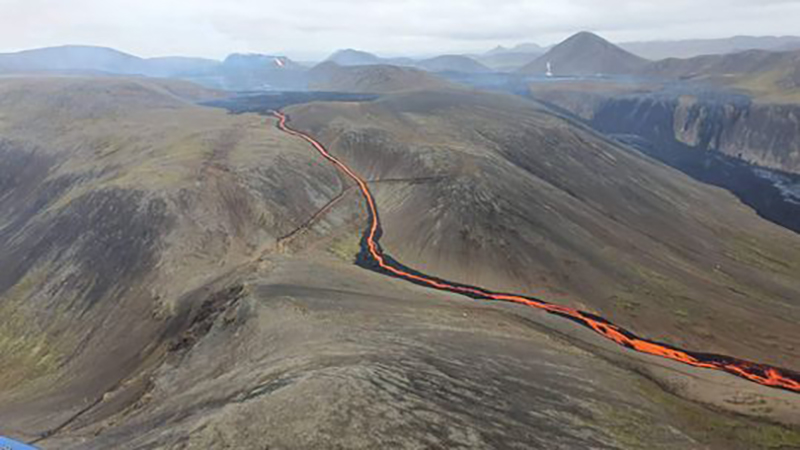 |
Figure 18. Photo of a lava flow at Krýsuvík-Trölladyngja traveling from Geldingadalur toward the Nátthaga valley on 13 June 2021. Courtesy of IMO. |
Activity during July 2021. The fissure eruption persisted through July with lava fountaining and overflows from vent 5. Occasional rim collapses produced minor ash plumes on 2 July, based on footage captured by a visitor. During 2-19 July the average lava effusion rate was 7.5 m3/s, which was notably lower than those during May and June. The total erupted volume had grown to 96 million cubic meters and covered an area of 4 km2. A long pause in activity was recorded around midnight on 5 July, which ended early on 7 July, as reflected in seismic data. On 17 July lava fountaining and overflows from vent 5 occurred at intervals of 10-15 hours, separated by intervals of 10-15 hours. IMO reported that lava was mostly accumulating in the Meradalir valley on the W slope and that no lava was flowing in the Geldingadalur, Nátthaga, and S Meradalir valleys during most of July. IMO generated several graphs to track the changes in the area of the lava flow field, the volume of erupted lava, and the rate of lava effusion through 27 July (figure 19). By 29 July there was a slight increase in the flow on the W slope of the Meradalir valley and thickened at a rate of 1 m/day.
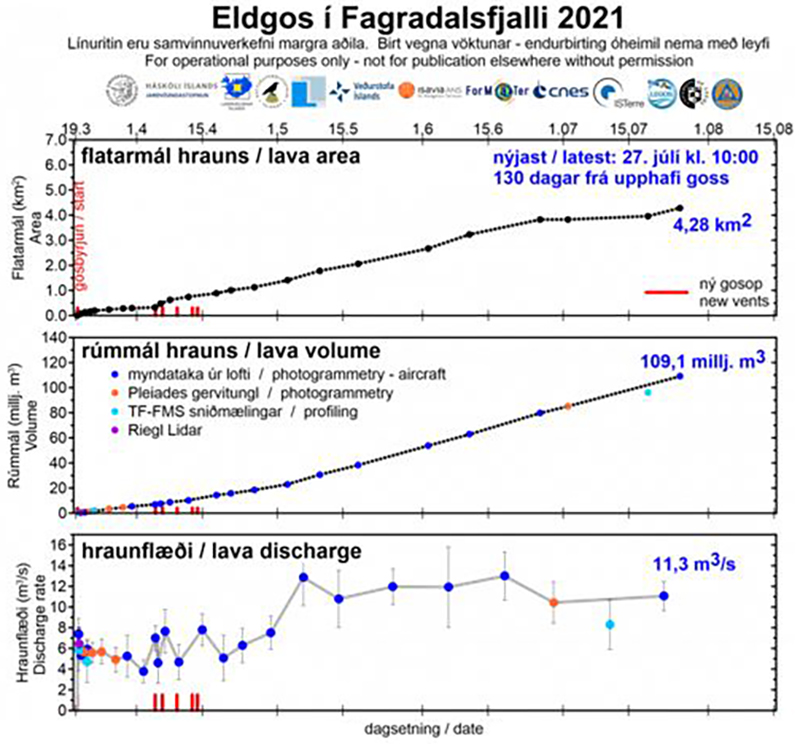 |
Figure 19. Graphs showing the evolution of the area (top), volume (middle) of lava, and rate of effusion (bottom) from 19 March through 27 July 2021 at Krýsuvík-Trölladyngja. By 27 July the area of lava was 4.28 km2, the volume of erupted lava was 109.1 million cubic meters, and the effusion rate was 11.3 m3/s. Courtesy of IMO. |
Activity during August 2021. Cycles of fountaining and overflows from vent 5 persisted during August; the lava flow continued to travel into the Meradalir valley and area to the W and did not advance in the Geldingadalur, Nátthaga, and S Meradalir valleys. According to photographs from IES captured on 8 August, the average lava effusion rate was 9.3 m3/s during the first half of the month, that covered an area of 4.4 km2 and had a total volume of 119 million cubic meters. A new vent first detected on 9 August was producing a lava flow. The new cone quickly grew due to constant and intense spattering, so that by 17 August it was about the same height as vent 5. A small lava flow overflowed the crater wall to the S toward Geldingadalur during the night on 10 August.
During 18-19 August new lava flows were reported overflowing the SW and NE crater rims, traveling S, E, and SE in the Geldingadalur and Meradalir valleys, frequently accompanied by gas-and-steam plumes (figure 20). A large collapse of the inner crater rim was observed in webcam images, which produced some ash emissions. Lava flowed into the S part of the Meradalir valley and down a slope into the Nátthaga valley in multiple branches on 26 August (figure 21). Observers noted that parts of the flows were turbulent and splashed above the flow surface; lava stopped advancing around 1600 as the eruption paused.
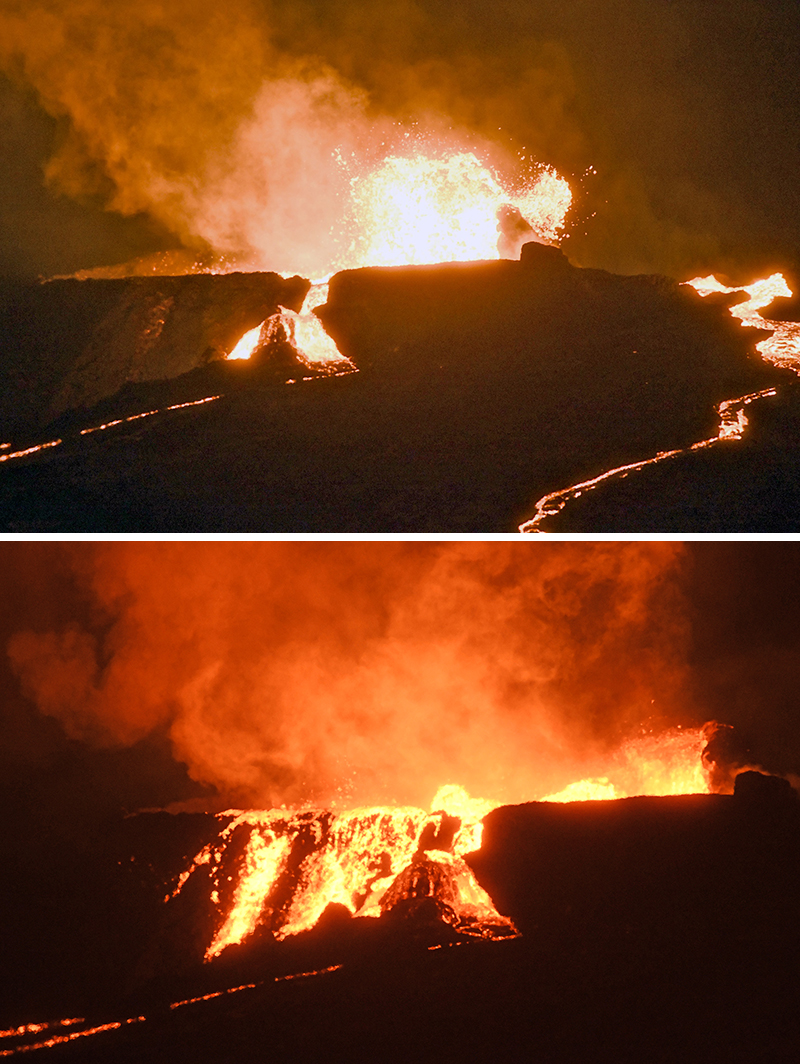 |
Figure 20. Photo of lava splashing over the NE (top) and SW (bottom) crater rim from the Geldingadalur eruption at Krýsuvík-Trölladyngja on 19 August 2021, accompanied by strong gas-and-steam emissions and lava flows advancing into the Geldingadalur, Meradalir, and southern Meradalir valleys. Courtesy of Ben Edwards, Dickinson College. |
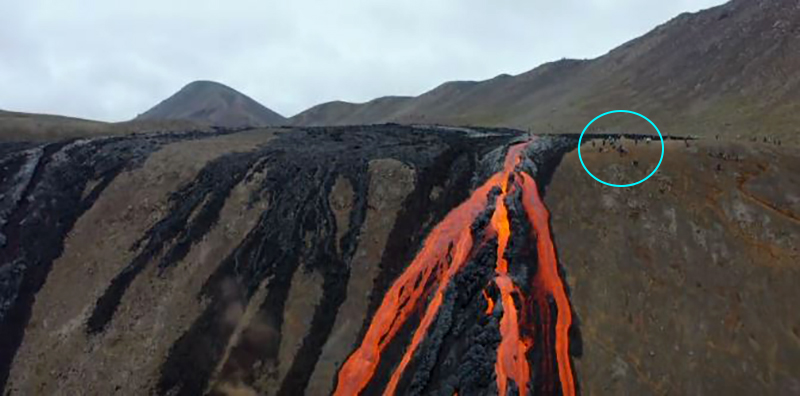 |
Figure 21. Drone image of lava flows from the Geldingadalur eruption at Krýsuvík-Trölladyngja descending into the southern part of Geldingadalur valley and toward Nátthaga on 26 August 2021. People on the right are shown for scale (blue circle). Courtesy of RÚV. |
Activity during September 2021. Activity had paused on 2 September, characterized primarily by gas-and-steam emissions that rose from the crater during 2-7 September. Aerial photography on 9 September showed that the area of the lava flow field had grown to 4.6 km2 and had a total erupted volume of 143 million cubic meters. The crater floor was visible and measured at least 70 m deep, with a deeper cavity or drainage that was sometimes visible. Activity picked up again on 11 September, which included increased RSAM values and low lava fountains that emerged from a few areas W of vent 5. Lava was also visible in the main vent. On 13 September fountains were visible for periods of 5-10 minutes and lava flows advanced in multiple directions; on 14 September lava had advanced N. During 14-15 September lava that was ponding in Geldingadalur fed a larger lava flow traveling into the S part of the valley, which then advanced E into the Nátthaga valley.
During 16-17 September lava continued to advance, moving over a hiking trail; around 1800 the flow rate decreased or paused, and only minor incandescence was visible from the vent, according to IMO (figure 22). By 17 September the area of the lava flow field was 4.8 km2 and had a volume of 151 million cubic meters. The average flow rate during 11-17 September was 16 m3/s. Parts of the lava field thickened in areas to the S of Geldingadalur and in the Nátthaga valley; some deflation was noted in areas N of Geldingadalur. On 27 September a seismic swarm was detected SW of Keilir (10 km NE of vent 5), at the N end of the dike intrusion; more than 6,000 earthquakes at depths of 5-6 km were detected by 4 October. A total of six fissures were mapped within the eruption site, but only vent 5 remained active through 2 October (figure 23).
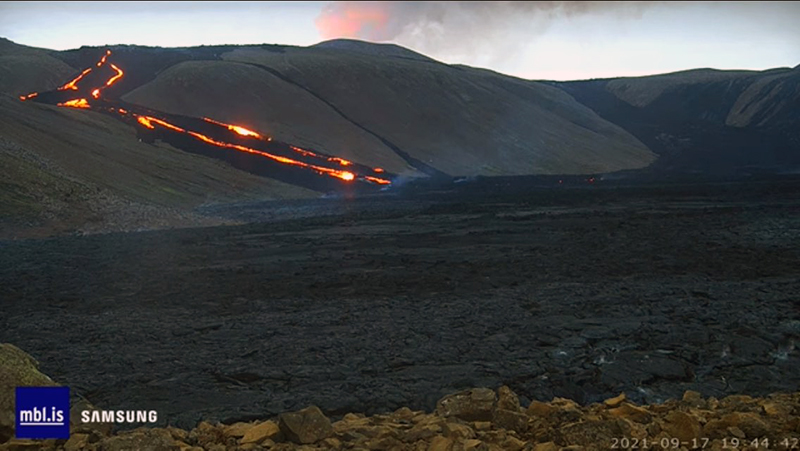 |
Figure 22. Webcam image of lava flows advancing into the Nátthaga valley on 17 September 2021 during the Geldingadalur eruption at Krýsuvík-Trölladyngja. Courtesy of Morgunblaðið (MBL). |
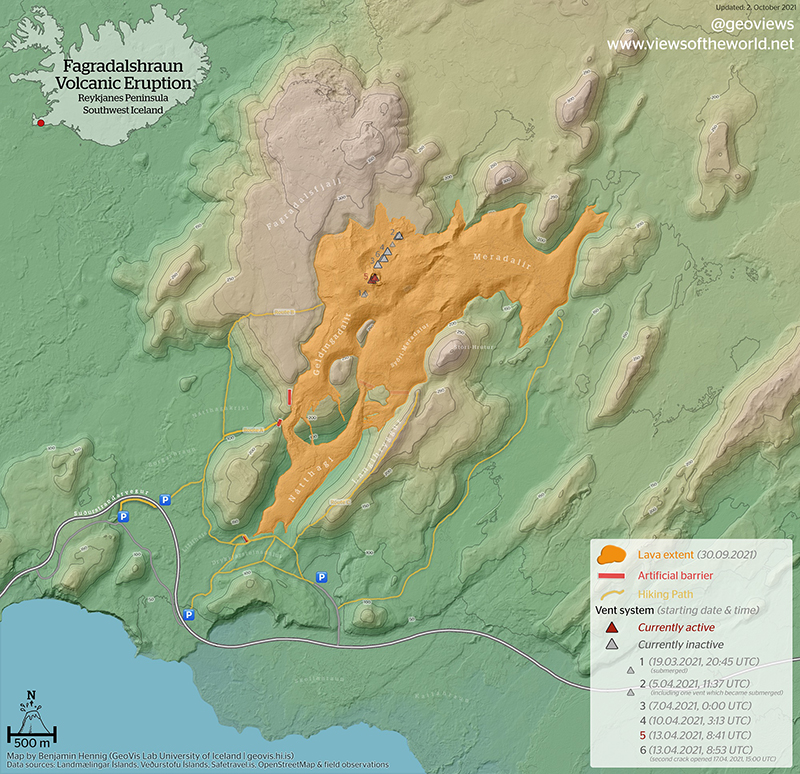 |
Figure 23. Map updated on 2 October 2021 showing the lava field of the Geldingadalur eruption at Krýsuvík-Trölladyngja, including the location of the active (red triangle) and inactive (gray triangles) fissures and the extent of the lava flows (orange color) in the Geldingadalur, Meradalir (including Syðri-Meradalir), and Nátthaga valleys. The red lines represent artificial barriers. Courtesy of Benjamin Hennig, University of Iceland. |
Satellite data. The NASA Global Sulfur Dioxide page, using data from the TROPOMI instrument on the Sentinel-5P satellite, showed distinct, strong sulfur dioxide plumes exceeding 2 DUs (Dobson Units) intermittently through the reporting period (figure 24). Strong thermal activity was detected in the MIROVA graph during late March through September 2021 due to the constant lava flows; the frequency declined slightly during June, mid-July, mid-August, and mid-September, but remained strong (figure 25). Similarly, Sentinel-2 infrared satellite images showed the direction of the lava flows during May through September on clear weather days that moved W, E, and S, often accompanied by white gas-and-steam plumes (figure 26).
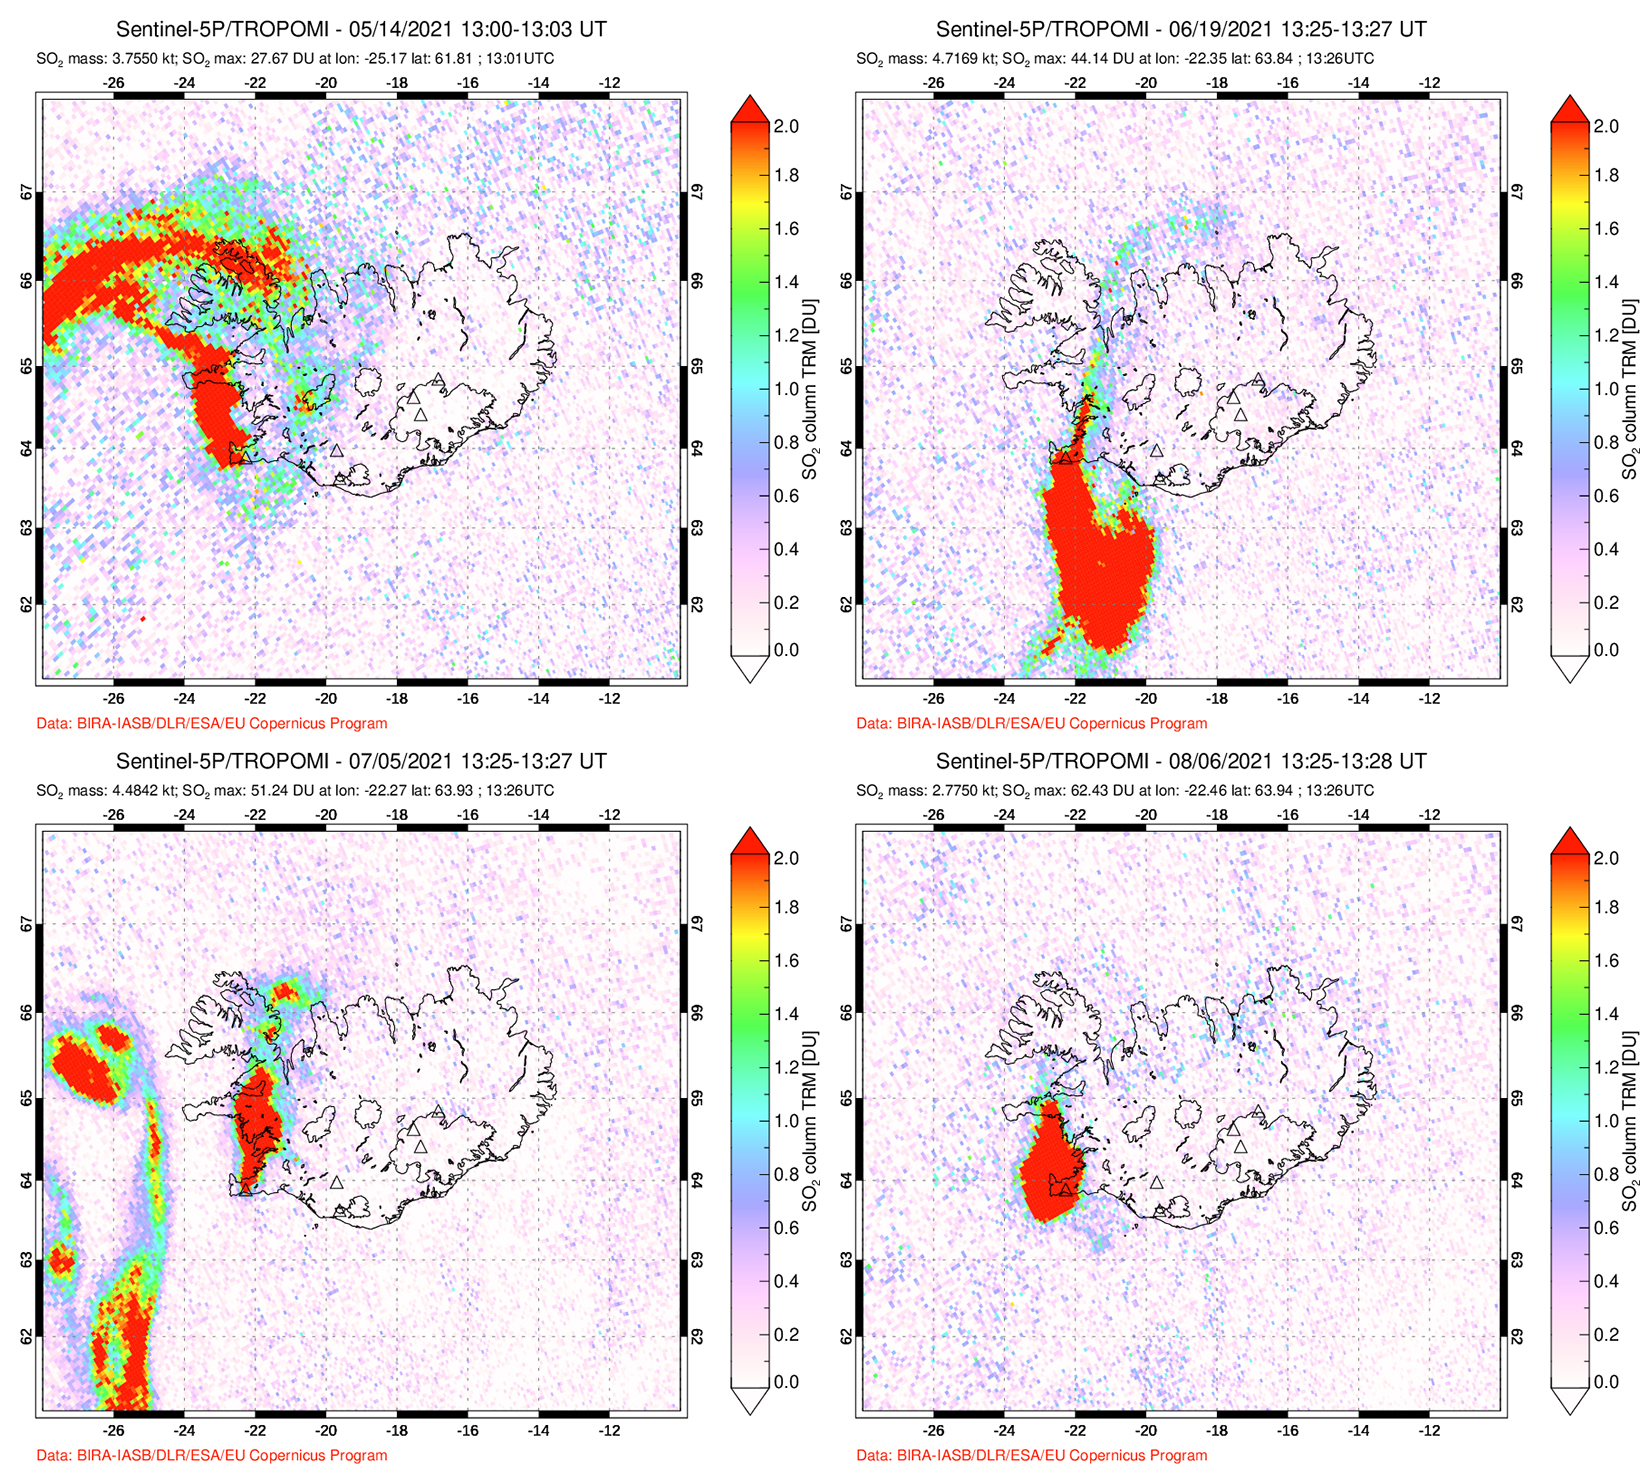 |
Figure 24. Intermittent distinct sulfur dioxide plumes that exceeded 2 DUs (Dobson Units) were detected above the Geldingadalur eruption at Krýsuvík-Trölladyngja, as shown on 14 May (top left), 19 June (top right), 5 July (bottom left), and 6 August (bottom right) 2021, based on data from the TROPOMI instrument on the Sentinel-5P satellite. Plumes drifted in different directions. Courtesy of the NASA Global Sulfur Dioxide Monitoring Page. |
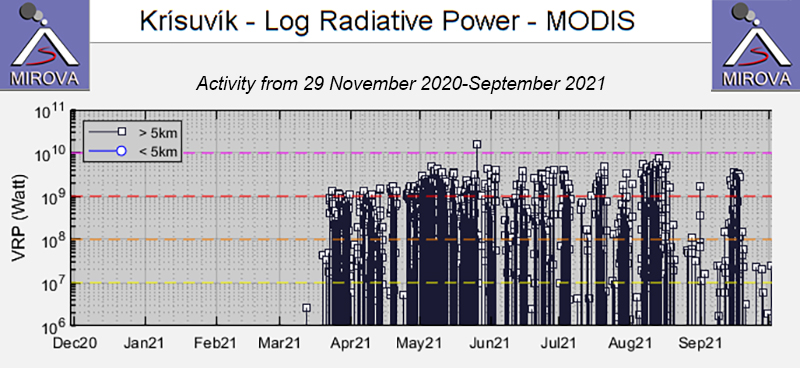 |
Figure 25. Strong thermal activity from the Geldingadalur eruption at Krýsuvík-Trölladyngja was detected in the MIROVA graph (Log Radiative Power) during late March through September 2021 due to the constant lava flows; the frequency declined slightly during June, mid-July, mid-August, and mid-September. Courtesy of MIROVA. |
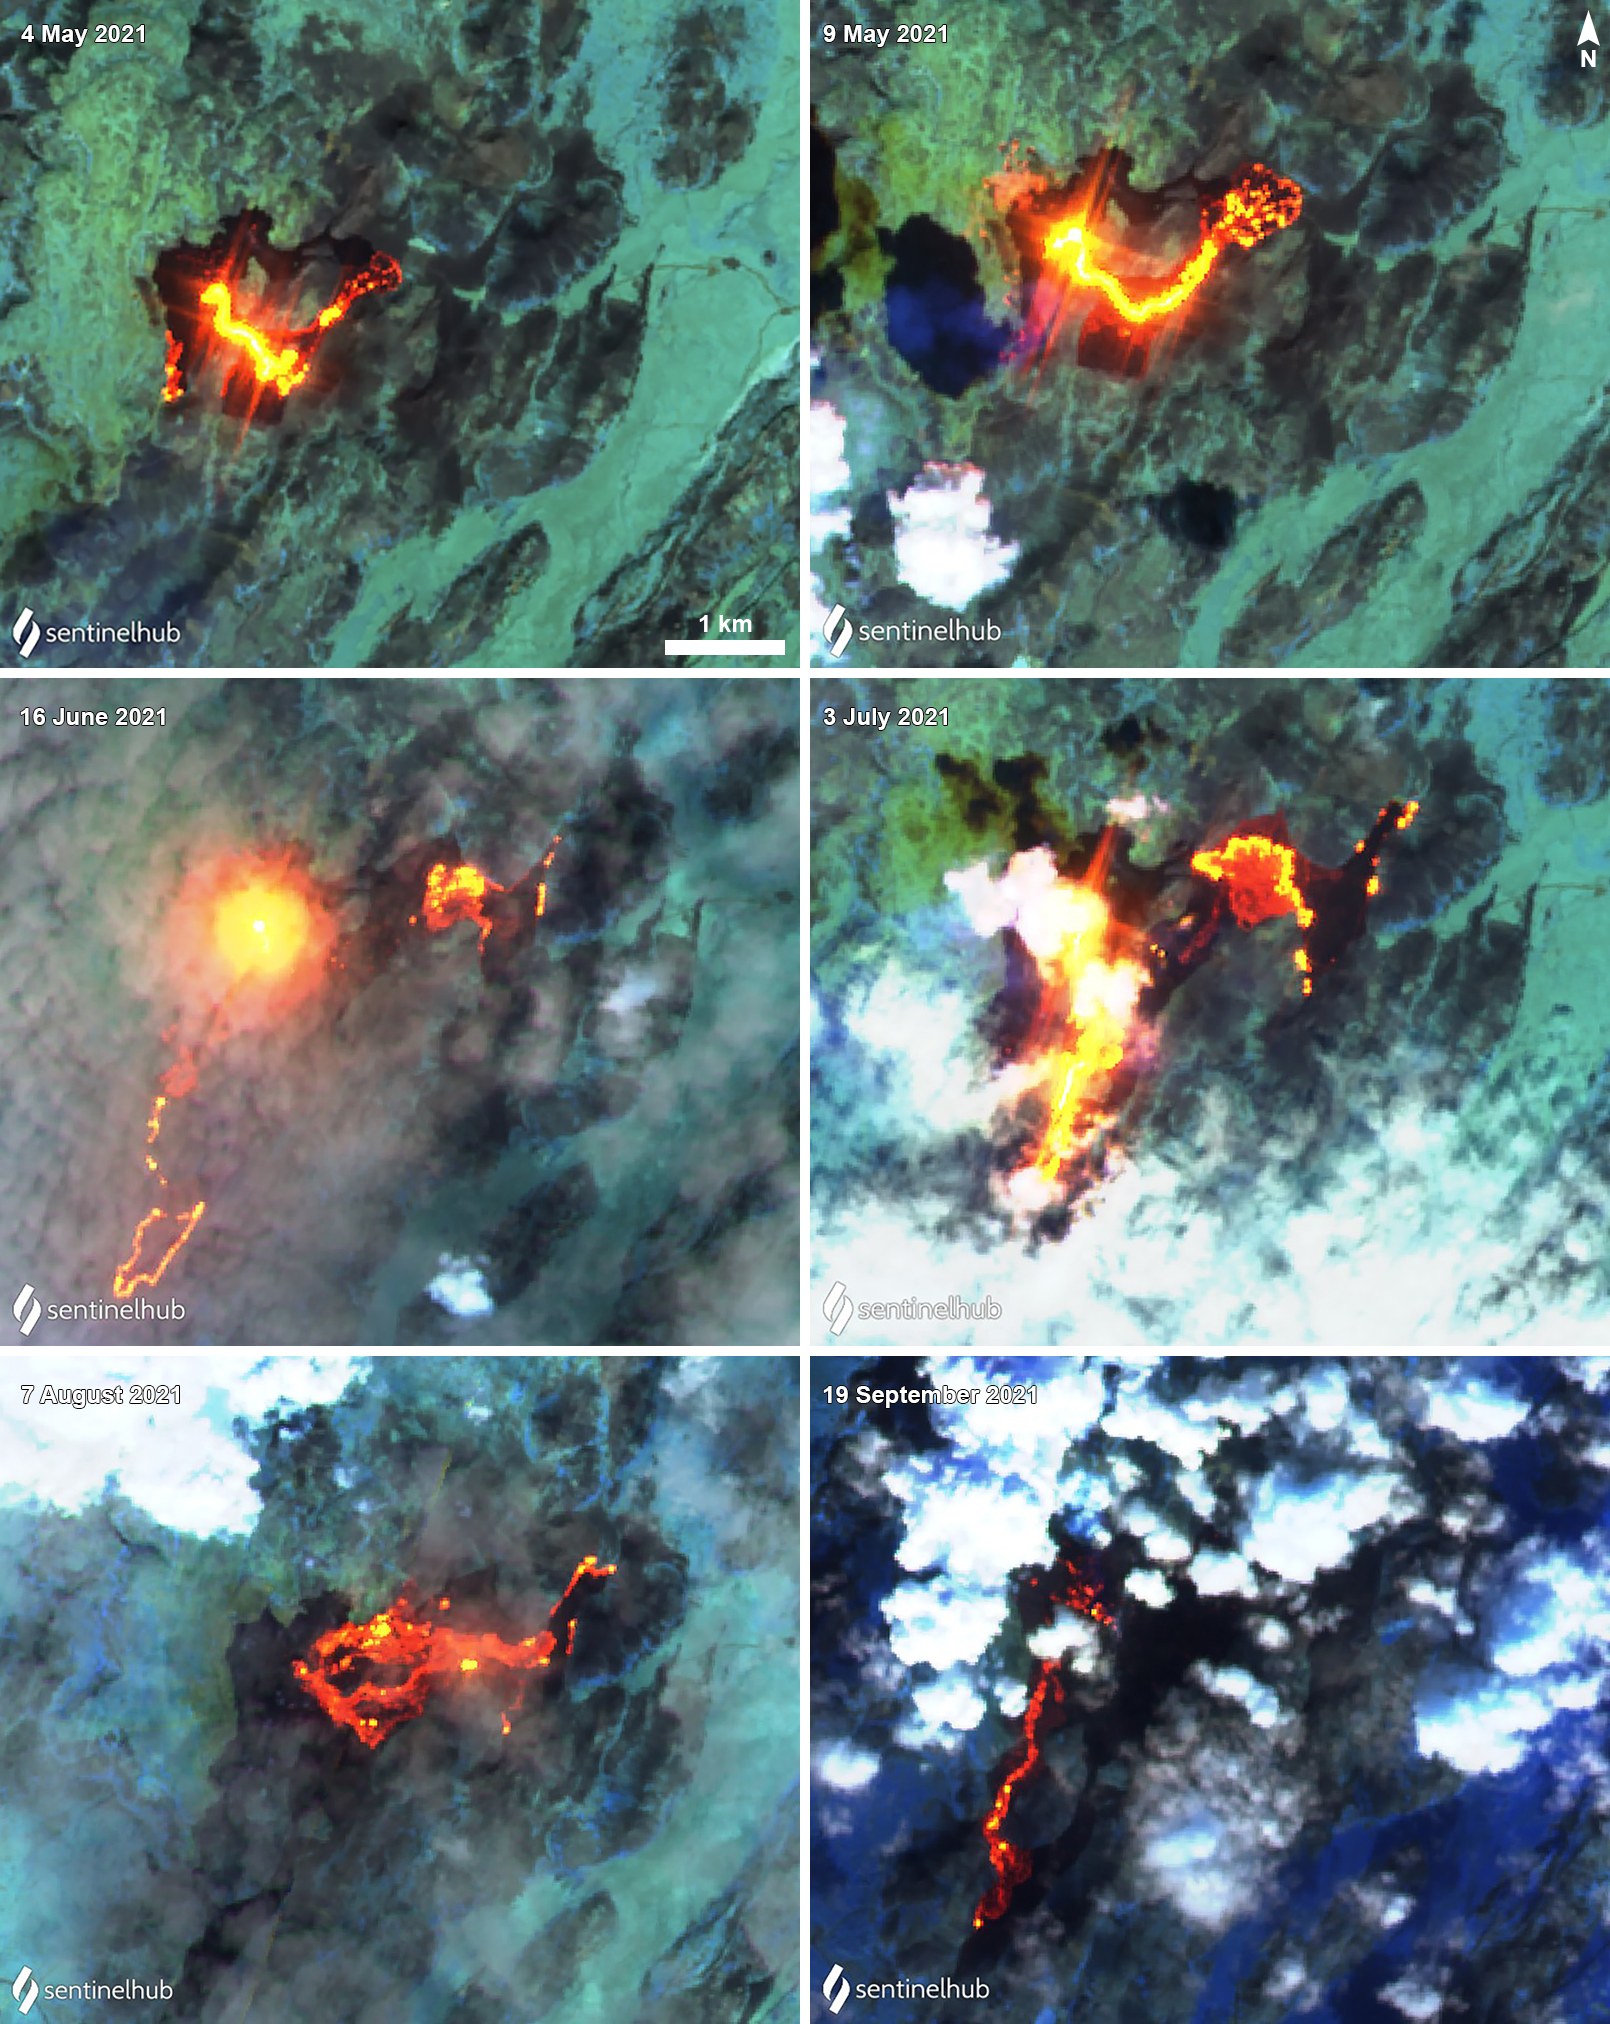 |
Figure 26. Sentinel-2 infrared satellite images show strong lava flows represented by thermal anomalies from the Geldingadalur eruption at Krýsuvík-Trölladyngja on 4 May (top left), 9 May (top right), 16 June (middle left), 3 July (middle right), 7 August (bottom left), and 19 September (bottom right) 2021. Sentinel-2 satellite images with “Atmospheric penetration” (bands 12, 11, 8A) rendering. Courtesy of Sentinel Hub Playground. |
Information Contacts: Icelandic Meteorological Office (IMO), Bústaðavegur 7-9 105 Reykjavík, Iceland (URL: http://en.vedur.is/); Institute of Earth Sciences, Sturlugata 7 101 Reykjavík, Iceland (URL: http://www.earthice.hi.is/); Icelandic National Broadcasting Service (RUV), Efstaleiti 1 150 Rekyjavík, Iceland (URL: http://www.ruv.is/); University of Iceland, Volcanology and Natural Hazard Group, Askja, Sturlugötu 7 101 Reykjavík, Iceland (URL: https://www.hi.is/); Icelandic Coast Guard, Skógarhlío 14 105 Reykjavík, Iceland (URL: www.lhg.is, https://www.facebook.com/Landhelgisgaeslan/); Morgunblaðið (MBL), Hádegismóum 2, 110 Reykjavík, Iceland (URL: https://www.mbl.is/frettir/); MIROVA (Middle InfraRed Observation of Volcanic Activity), a collaborative project between the Universities of Turin and Florence (Italy) supported by the Centre for Volcanic Risk of the Italian Civil Protection Department (URL: http://www.mirovaweb.it/); NASA Global Sulfur Dioxide Monitoring Page, Atmospheric Chemistry and Dynamics Laboratory, NASA Goddard Space Flight Center (NASA/GSFC), 8800 Greenbelt Road, Goddard MD 20771, USA (URL: https://so2.gsfc.nasa.gov/); Sentinel Hub Playground (URL: https://www.sentinel-hub.com/explore/sentinel-playground); Benjamin Hennig, University of Iceland, Sæmundargata 2 102 Reykjavík, Iceland (URL: https://english.hi.is/staff/ben, https://geoviews.net/); Ben Edwards, Dickinson College, P.O. Box 1773, Carlisle, PA 17013, USA (URL: https://blogs.dickinson.edu/edwardsb/).
New eruption during August 2022 consisted of lava fountains and flows
The Fagradalsfjall volcanic system on the Reykjanes Volcanic Zone in Iceland erupted on 19 March 2021, following more than a year of earthquake activity and inflation/deflation periods. This was the first volcanic activity on the system after about 6,000 years of quiescence. Although the Fagradalsfjall fissure swarm has previously been considered a split or secondary swarm of the Krýsuvík-Trölladyngja volcanic system, as of September 2022 Icelandic volcanologists managing the Catalogue of Icelandic Volcanoes made the decision to identify Fagradalsfjall as a distinct and separate system.
The fissure eruption that started in March 2021 in the Geldingadalur (also referred to as Geldingadalir) valley continued until mid-September 2021 (BGVN 46:05; 46:10). Several fissure vents opened along a NE-SW trend, accompanied by gas-and-steam emissions, spatter, and lava fountains; flows began to fill Geldingadalur and eventually reached the Meradalir valley. This report covers a new eruption period that began on 3 August 2022 using information from the Icelandic Meteorological Office (IMO), the Institute of Earth Sciences, and various satellite data.
Activity during October 2021-29 July 2022. The Institute of Earth Sciences reported that lava effusion had stopped during the evening of 18 September 2021. The area of the flow field was about 4.85 km2, and the total volume erupted was 150 million cubic meters, based on 30 September measurements. Nighttime incandescence was visible through 4 October, likely from lava flows that continued to advance downslope. According to news reports, over 6,000 earthquakes at depths of 5-6 km were recorded by 4 October, the largest event of which was an Mw 3.8. The seismic swarm had significantly decreased by mid-October and on 18 October the ACC was lowered to Yellow (the second lowest level on a four-color scale). IMO also reported that gas emissions were ongoing, though with low concentrations of eruptive gases. Incandescence from previously emplaced lava flows were occasionally visible at night.
Seismicity increased at 1800 on 21 December 2021 in an area 2-4 km NE of Geldingadalur, which consisted of 18 events. Then, activity markedly intensified at 00300 on 22 December; there were 1-10 tremors recorded per minute, totaling to more than 1,400 events by 1047, the largest of which was an Mw 4.9 at 0923. This seismic swarm continued through 28 December, consisting of more than 19,000 earthquakes; about 14 earthquakes were at an Mw 4 or higher. During 29 December 2021 to 3 January 2022, the number and size of these events had progressively decreased; more than 200 events detected during 0000-1535 on 3 January. By 7 January, the seismic events had stopped.
Activity from 30 July 2022-2 August 2022. IMO reported an intense earthquake swarm that began around noon on 30 July in an area just NE of the lava field in Geldingadalur, along the dike intrusion that preceded the March-September 2021 eruption. Earthquakes were reportedly felt in SW Iceland, in Reykjanesbær, Grindavík, the Capital region, and as far as Borgarnes. Several of these earthquakes were above an Mw 3, with the largest event of an Mw 4 occurring at 1403. Almost 3,000 earthquakes had been detected by 1527 on 31 July, according to the Norwegian Meteorological Agency’s automatic location system; an Mw 5.4 event was detected at 1748. Deformation models indicated magma was around 1 km below the surface at 1749 on 2 August, according to IMO.
Activity during 3-21 August 2022. An effusive fissure eruption began around 1315 on 3 August near the border of the previous lava flow field N of Fagradalsfjall in Meradalir. IMO scientists, in conjunction with the Coast Guard, took photos of the activity during a surveillance flight and made measurements of the fissure that appeared at the northern edge of the lava field from the last eruption; initial measurements showed that the fissure was about 300 m long (figures 27 and 28). Webcam video showed lava fountains rising along the fissure, causing IMO to increase the ACC to Orange at 1536. Gas-and-steam plumes rose 500-1,000 m high, but no ash was detected. Lava flows were reported traveling downslope to the NW. The flow rate was about 32 m3/s during the initial hours of the eruption, which then decreased to an average of 18 m3/s from 1700 on 3 August until 1100 on 4 August. By this time, about 1.6 million cubic meters of lava had covered an area of 0.14 km2. The average flow thickness was around 11 m. During 3 August through the morning of 4 August, about 400 earthquakes were recorded, though these were smaller in both number and size compared to the events before the eruption began. On 5 August IMO reported that the number of daily earthquakes had declined after the eruption began; on 2 August about 2,700 earthquakes were recorded, on 4 August there were a total of 900 earthquakes, and on 5 August about 300 were detected up until 1300.
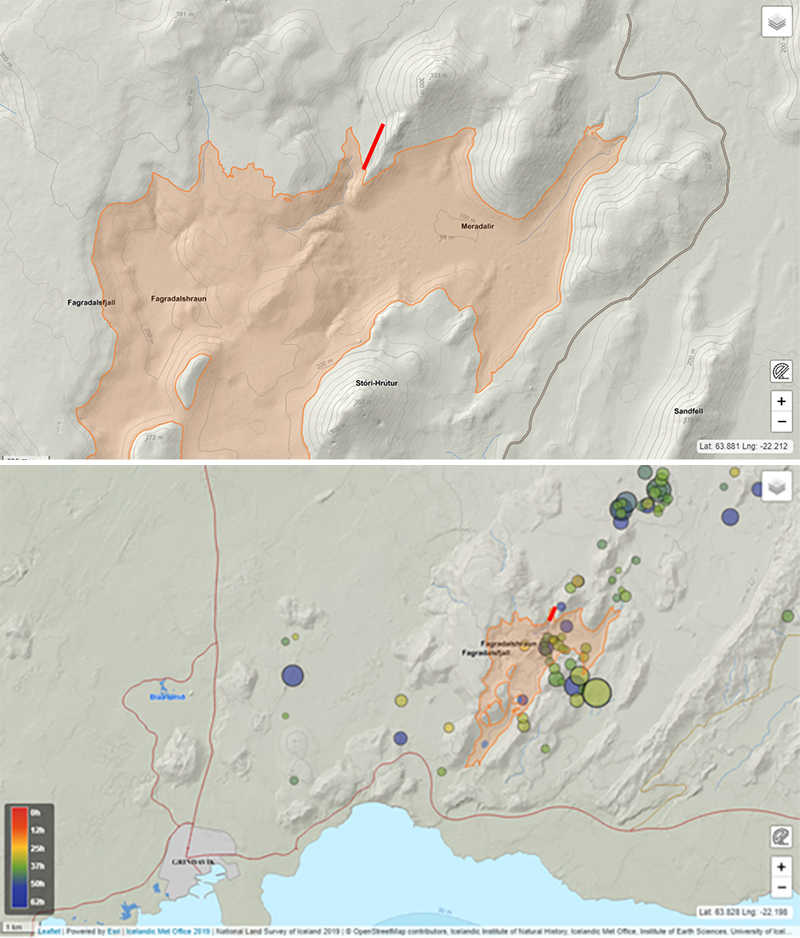 |
Figure 27. Location maps showing the approximate location of the new fissure (red line) that emerged at Fagradalsfjall (top), based on initial images taken during the overflight on 3 August 2022. The fissure is located on the northern edge of the lava that erupted during the previous eruption in March 2021 (pink colored area). The circles indicate seismic events and their location in relation to the fissure (bottom). Courtesy of IMO. |
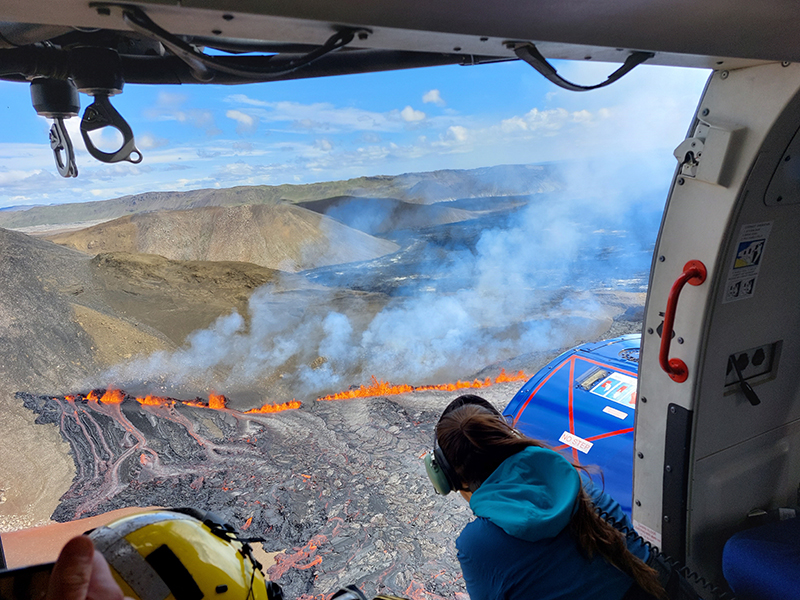 |
Figure 28. Photo showing lava fountains along with gas-and-steam emissions from the Fagradalsfjall fissure eruption on 3 August 2022. The fissure opened on the western side of Meradalir and on the northern edge of the lava flows that erupted during the previous eruption in March 2021. Courtesy of Halldór Björnsson, IMO. |
According to a news article from RUV, the length of the active fissure had decreased and the middle part of the fissure was the most active by 5 August. In addition, the number of daily earthquakes declined around the same day; strong gas-and-steam emissions were still visible (figure 29). By 10 August lava was primarily erupting from a central cone and flowed ESE and NW (figure 30). IMO reported that lava was mostly flowing onto the 2021 lava flow field and was filling the eastern end of the Meradalir lava through at least 16 August. There were three vents within the building cone that were visible on 10 August: the first is the largest and most centrally located vent, the second is to the left (east) of the central vent, and the third is the smallest one located to the right (west) of the central vent (figure 31). Each of these vents erupted strong lava fountains rising tens to several tens of meters high during at least 10-13 August, then during 14-16 August the height of the lava fountains diminished. A smaller, secondary cone formed to the east of the main cone around 12 August (figure 32). These vents fed into a large lava pond that traveled NW of the breached vent and occasionally, lava breakouts would be noted along the ponded lava (figure 31). Each day during 12-16 August the primary eruptive cone continued to grow, evolving to a perched lava pond that fed the lava flows to the NW of it (figure 32).
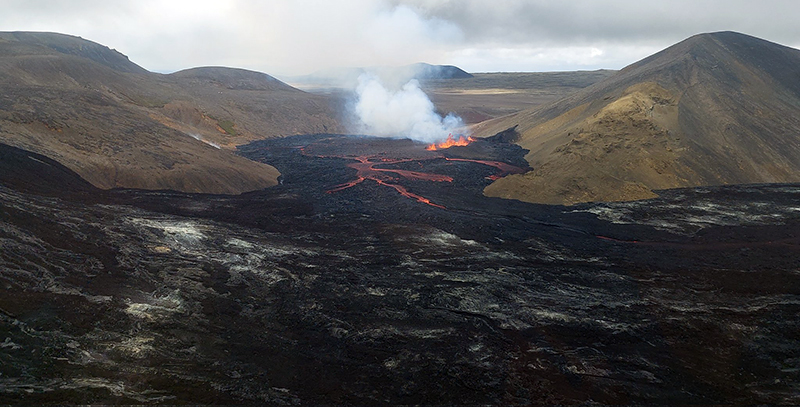 |
Figure 29. Photo showing the new fissure eruption at Fagradalsfjall on 5 August 2022 with lava fountains and lava flows moving onto the 2021 lava flow field in the Meradalir valley (older lava is black). Strong white gas-and-steam emissions accompany this activity. Courtesy of Kristín Jónsdóttir, IMO. |
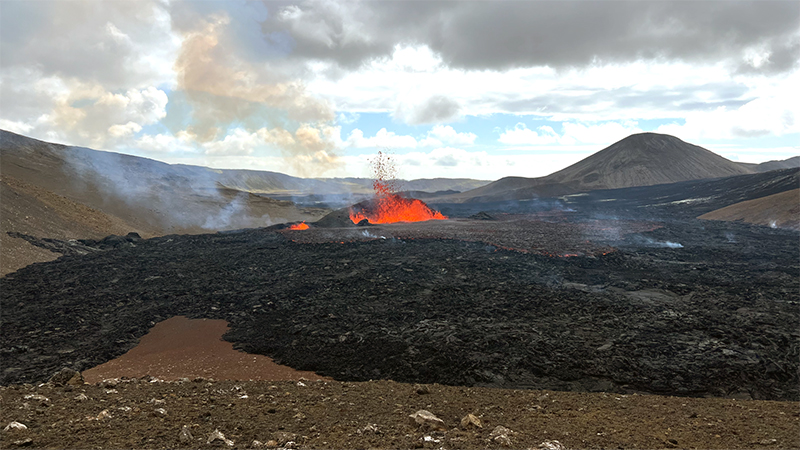 |
Figure 30. Photo showing strong lava fountains emerging from the main (larger fountain to the right) and secondary crater (smaller fountain to the left) at Fagradalsfjall on 10 August 2022. The black rocks in the foreground are the older lava flows from the 2021 eruption as new lava flows over it. Constant degassing was also visible. Courtesy of Arianna Soldati, North Carolina State University. |
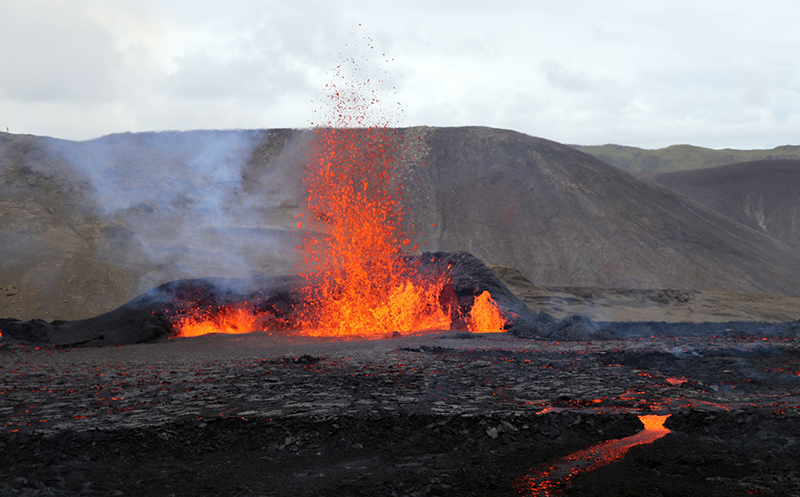 |
Figure 31. Photo showing strong lava fountains rising several tens of meters above the eruption site at Fagradalsfjall around 1200-1400 on 11 August 2022. The vent shows three distinct places where lava erupted; the first is the central one, the second is to the left, and the third is the smaller fountain to the right. The open part of the vent area faces NNW, with lava flows moving NW onto older 2021 flows. There were also several lava pond breakouts as shown in the foreground of this photo. Courtesy of Alison Graettinger, University of Missouri – Kansas City. |
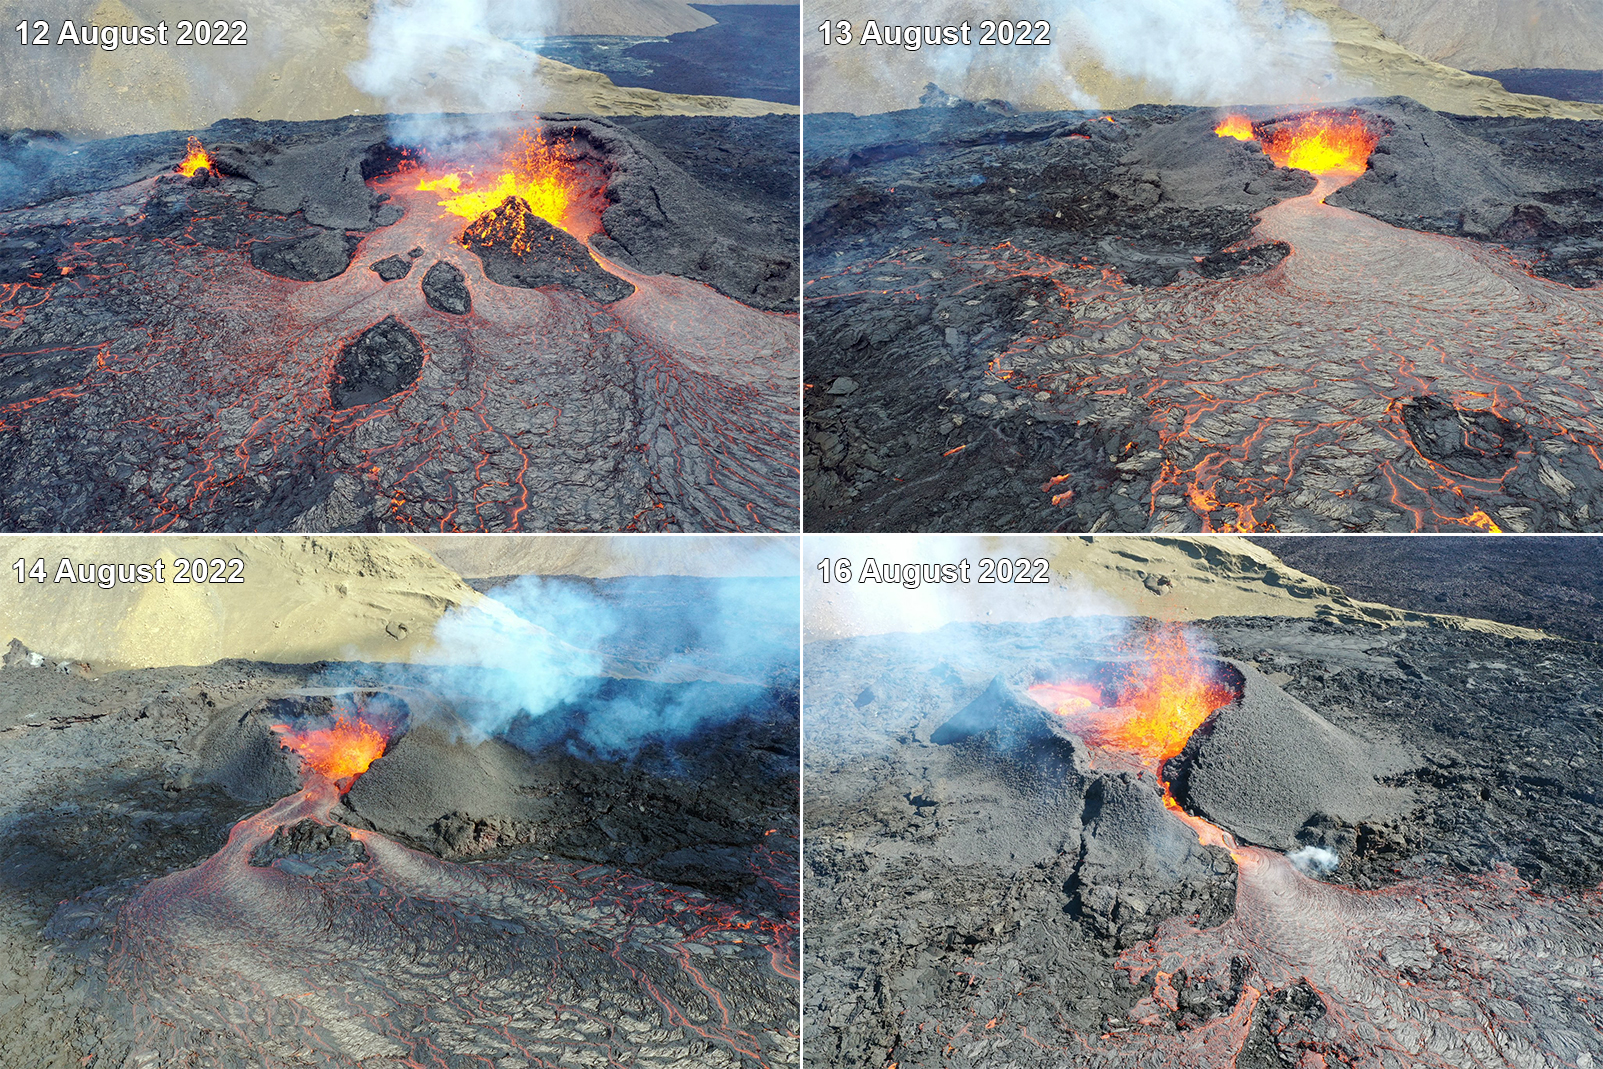 |
Figure 32. Photos showing the evolution of the primary cone at Fagradalsfjall from a breached lava pond to a perched lava pond. Lava fountains and flows persisted each day on 12th (top left), 13th (top right), 14th (bottom left), and 16th of August 2022 (bottom right). A smaller secondary cone is seen to the left (east) of the primary vent on the 12 August image. Courtesy of Brett Carr, University of Arizona. |
According to IES, the effusion rate had notably decreased from an average of 11 m3/s during 4-13 August to 3-4 m3/s during 13-15 August. By 15 August, IES estimated that 10.6 million cubic meters of lava had covered an area of 1.25 km2 (figure 33). On 16 August residents reported seeing a purple-tinged sulfur dioxide gas cloud over the eruption area slowly drifting SW during sunrise. Lava near the vent was 20-40 m thick, but flows were 5-15 m thick in the Meradalir valley, outside of the crater area. A small vent collapse on the main cone was reported sometime between 16 and 18 August, based on webcam videos. Seismic tremor began to decrease on 19 August and the level of the lava pond that had accumulated in the primary vent. There was no visible outflow from the vent. Incandescence from the northern vent and from the lava flows reflected by the gas-and-steam emissions that rose above the crater. During 20-21 August, incandescence from the vent decreased; incandescence from the vent was visible until about 0400 on 21 August. Beginning at around 0500, several explosions ejected spatter from the vent for about 15 minutes. Just before 0600 a dense, bluish-gray plume rose from the crater, and simultaneously seismic tremor signals stopped. On 22 August IMO lowered the ACC to Yellow.
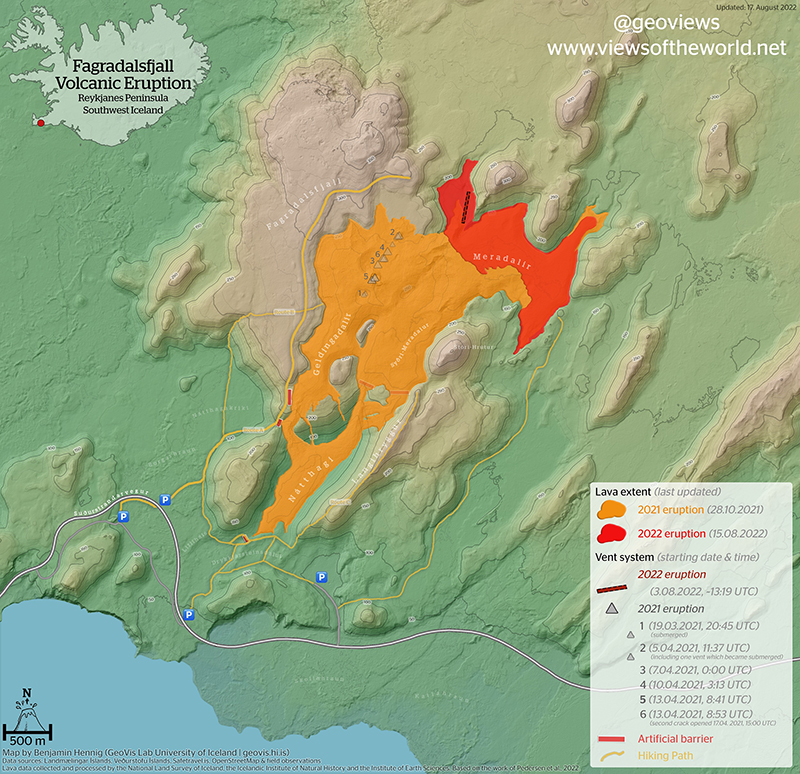 |
Figure 33. Map updated on 15 August 2022 showing the lava flow field of both recent Fagradalsfjall eruptions, including the location of the active fissure (dark red dotted line), the extent of the 2021 lava flow field (bright orange), and the extent of the 2022 lava flow field. Courtesy of Benjamin Hennig, University of Iceland. |
According to IMO, the lava from the fissure stopped erupting on 21 August. Seismicity remained at low levels and no deformation was detected. As a result, on 15 September the ACC was lowered to Green (the lowest level on a four-color scale).
Satellite data. Data from the TROPOMI instrument on the Sentinel-5P satellite, available on maps from the NASA Global Sulfur Dioxide page, showed two distinct sulfur dioxide plumes exceeding 2 DU (Dobson Units) on 4 and 14 August 2022 (figure 34). Strong thermal activity was detected MODIS data shown on MIROVA (Middle InfraRed Observation of Volcanic Activity) graphs starting at the beginning of the eruption in early August due to lava effusion (figure 35). The power of these thermal anomalies started to decline by mid-August as activity began to decrease. After the eruption stopped on 21 August 2022, some residual heat was detected through September, as seen in the MIROVA graph. Sentinel-2 infrared satellite images also showed the strong thermal activity during August, though the area was often obscured by weather clouds (figure 36). A small lava flow was visible on 15 August that flowed to the SE (figure 36).
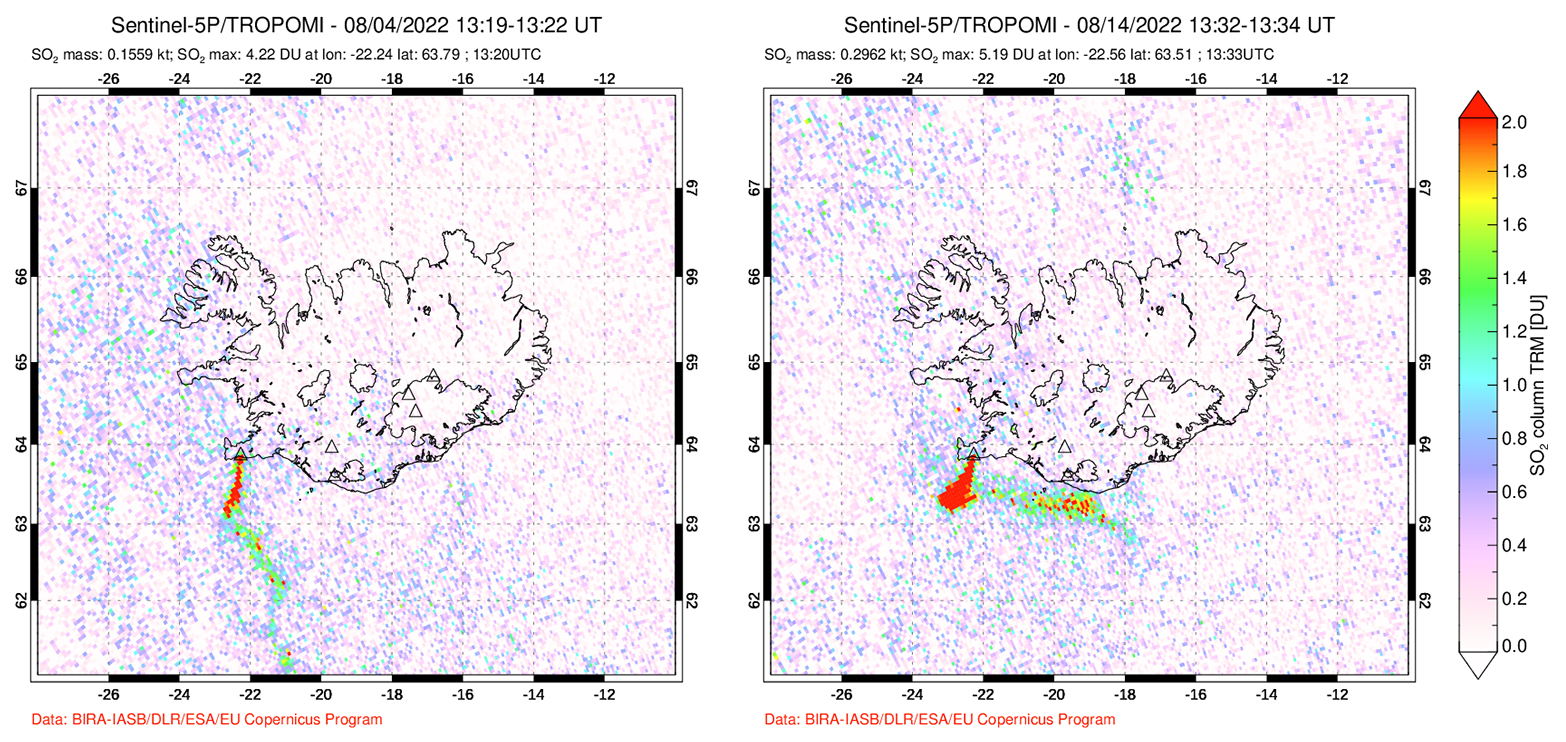 |
Figure 34. Two strong sulfur dioxide plumes that exceeded 2 DUs (Dobson Units) were detected above Fagradalsfjall on 4 August 2022 (left) and 14 August (right) and drifted SW, based on data from the TROPOMI instrument on the Sentinel-5P satellite. Courtesy of the NASA Global Sulfur Dioxide Monitoring Page. |
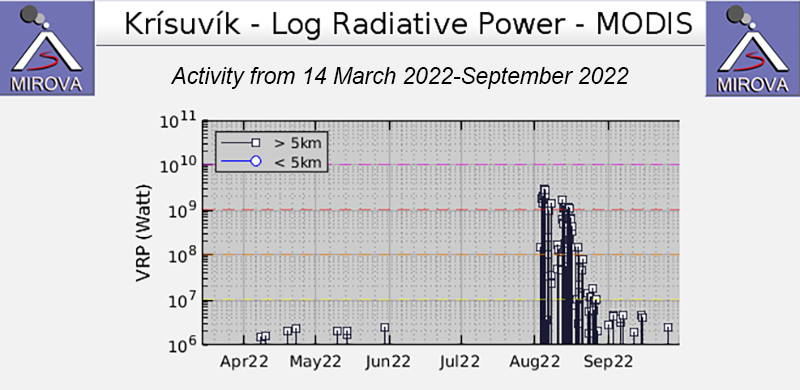 |
Figure 35. Strong thermal activity began at Fagradalsfjall in early August 2022, according to the MIROVA graph (Log Radiative Power) and continued through the month due to a new eruption that consisted of lava fountains and flows. Lower, possibly residual thermal activity remained in September. Courtesy of MIROVA. |
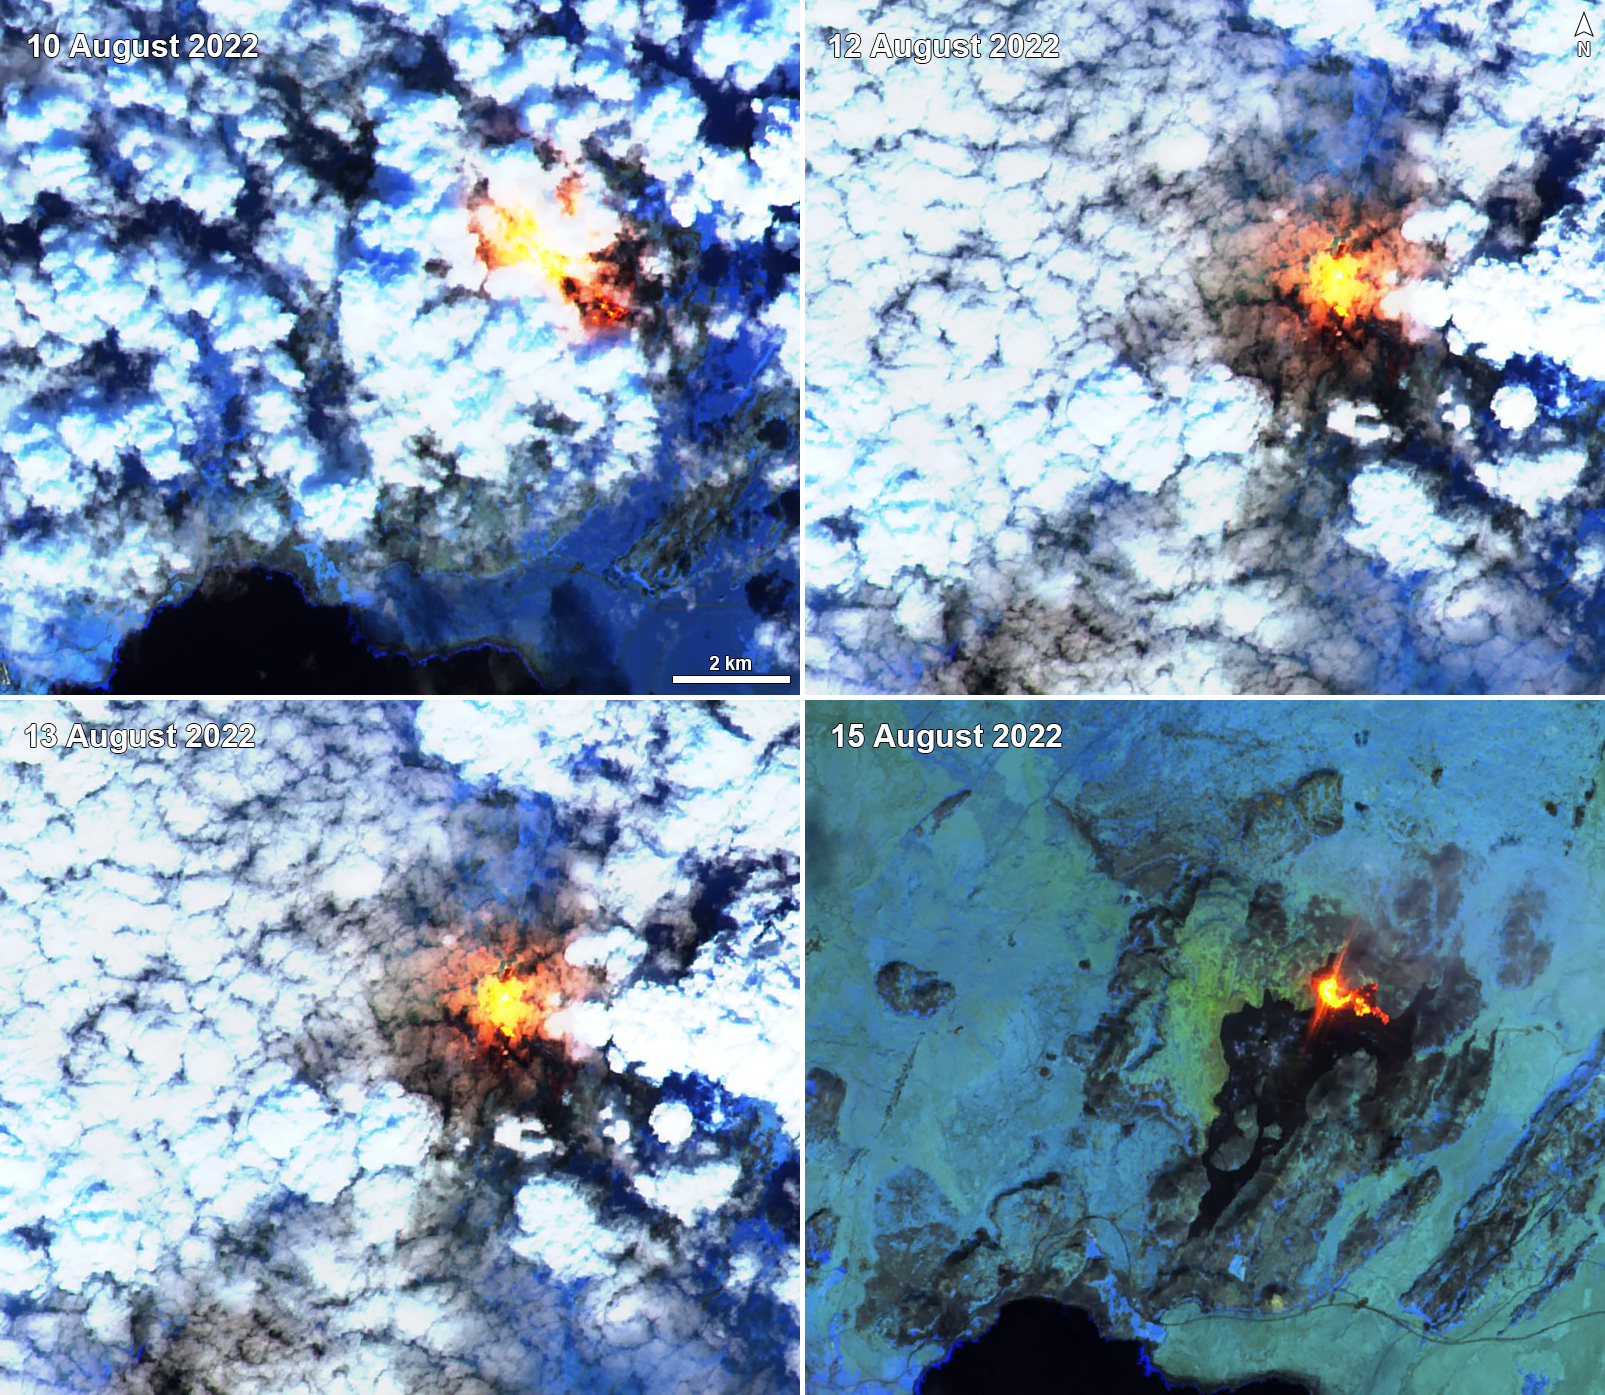 |
Figure 36. Sentinel-2 infrared satellite images show a strong thermal anomaly from Fagradalsfjall on 10 August (top left), 12 August (top right), 13 August (bottom left), and 15 August 2022 (bottom right). This thermal activity reflected the new lava flow activity during August 2022. Sentinel-2 satellite images with “Atmospheric penetration” (bands 12, 11, 8A) rendering. Courtesy of Sentinel Hub Playground. |
Information Contacts: Icelandic Meteorological Office (IMO), Bústaðavegur 7-9 105 Reykjavík, Iceland (URL: http://en.vedur.is/); Institute of Earth Sciences, Sturlugata 7 101 Reykjavík, Iceland (URL: http://www.earthice.hi.is/); Icelandic National Broadcasting Service (RUV), Efstaleiti 1 150 Rekyjavík, Iceland (URL: http://www.ruv.is/); MIROVA (Middle InfraRed Observation of Volcanic Activity), a collaborative project between the Universities of Turin and Florence (Italy) supported by the Centre for Volcanic Risk of the Italian Civil Protection Department (URL: http://www.mirovaweb.it/); NASA Global Sulfur Dioxide Monitoring Page, Atmospheric Chemistry and Dynamics Laboratory, NASA Goddard Space Flight Center (NASA/GSFC), 8800 Greenbelt Road, Goddard MD 20771, USA (URL: https://so2.gsfc.nasa.gov/); Sentinel Hub Playground (URL: https://www.sentinel-hub.com/explore/sentinel-playground); Brett Carr, Lunar and Planetary Laboratory, Gerard P. Kuiper Space Sciences, University of Arizona, 1629 E. University Blvd., Tucson, AZ 85719 USA (URL: https://bcarr07.wixsite.com/brettcarr); Benjamin Hennig, University of Iceland, Sæmundargata 2 102 Reykjavík, Iceland (URL: https://english.hi.is/staff/ben, https://geoviews.net/); Alison Graettinger, University of Missouri – Kansas City, Volker Campus 5000 Holmes St. Kansas City, MO 64110, USA (URL: https://sse.umkc.edu/profiles/graettinger-alison.html, https://agraettinger.weebly.com/); Arianna Soldati, North Carolina State University, 2800 Faucette Drive NC State University, Raleigh, North Carolina 27695, USA (URL: https://meas.sciences.ncsu.edu/people/asoldat/, https://volcanicarianna.wordpress.com/).
New eruption consisted of lava flows and fountains during July-August 2023
The Fagradalsfjall volcanic system on the Reykjanes Volcanic Zone in Iceland first erupted on 19 March 2021, following more than a year of earthquake activity and inflation/deflation periods. This was the first volcanic activity on the system after about 6,000 years of quiescence. Although the Fagradalsfjall fissure swarm has previously been considered a split or secondary swarm of the Krýsuvík-Trölladyngja volcanic system, as of September 2022 Icelandic volcanologists managing the Catalogue of Icelandic Volcanoes made the decision to identify Fagradalsfjall as a distinct and separate system.
The fissure eruption that started in August 2022 near the border of the previous lava flow field N of Fagradalsfjall in Meradalir was characterized by lava flows, fountains, and sulfur dioxide emissions (BGVN 47:09). This report covers a new eruption period that began on 10 July 2023 and ended in early August, characterized by similar activity. Information comes from Icelandic Meteorological Office (IMO), the Institute of Earth Sciences, and various satellite data.
Inflation began in early April in the western Reykjanes Peninsula, reaching a total of 3 cm, and at a rate of about 1 cm per month. Data indicated possible accumulation of magma at 15 km depth. In June, more than 1,000 earthquakes were recorded, more of which were located beneath Reykjanestá, NE of Fagradalsfjall and SW of Kleifarvatn. Seismicity intensified during 3-4 July. An earthquake swarm began at 1400 on 4 July and by 1150 on 5 July, more than 1,800 earthquakes were detected in the vicinity of the July 2022 dike intrusion (figure 37). The depth of the earthquakes became shallower within the first few hours of the swarm; by 5 July the depths were at 2-3 km. Seven of those earthquakes exceeded an M 4, and the largest was an M 4.8 event that was recorded at 0821 on 5 July. On 5 July at 1055 IMO raised the Aviation Color Code (ACC) to Orange (the third level on a four-color scale). By 1330 on 7 July, more than 7,000 earthquakes were detected in the swarm that began on 4 July. The epicenters were aligned NE-SW between Fagradalsfjall and the Keilir cone, NNE from the 2021 and 2022 eruptions, and mostly concentrated just N of the Litli Hrútur hill. Deformation data (GPS and radar interferometry) showed uplift in the same area, which IMO suggested was a magmatic dike intrusion that reached 1 km depth by early on 6 July. Seismicity decreased during 6-7 July and the rate of deformation slowed; an analysis showed that by 9-10 July the dike had propagated 1 km further NE. Small earthquakes were reported in Kleifarvatn, the largest of which was an M 4.6, and caused some rock falls in Kleifarvatn and Trolladyngja.
|
Figure 37. Map showing the locations of the earthquakes (circles) at Fagradalsfjall from 30 July 2022 to 5 July 2023. The red circles represent earthquakes in 2023 and the blue circles represent the earthquake swarm that occurred during July-August 2022. The orange line represents the vertical projection of the dike intrusion that occurred in 2022 and the lighter orange color shows the extent of the lava flow field from 2022. The map also shows the magnitude for earthquakes greater than 1, and the size of the circles are proportional to the magnitude of the earthquakes. Courtesy of IMO. |
Tremor was detected at 1425 on 10 July and continued to intensify, leading to a new fissure eruption oriented NE-SW, beginning at 1640 (figure 38). Webcam images showed gas-and-steam emissions and incandescence, but no major ash emissions. The fissure was about 200-m-long, primarily located in a depression, and was characterized by lava fountains (figure 39) and lava flows originating from three short fissures on the E and NE flanks of Litli-Hrútur and moving NE and S. Gas-and-steam emissions drifted NW. As a result, IMO raised the ACC to Red (the highest level on a four-color scale) at 1707. At 1724 the ACC was lowered back to Orange. According to estimate from the Institute of Earth Sciences, the fissure quickly reached about 900-m-long, based on drone footage.
|
Figure 38. Photo of the start of the new fissure eruption at Litli-Hrútur, part of the Fagradalsfjall volcanic system taken on 10 July 2023. Gas-and-steam emissions accompanied the lava flow. Courtesy of Elísabet Pálmadóttir, IMO. |
|
Figure 39. Photo of the lava fountains emanating from Litli-Hrútur, part of the Fagradalsfjall volcanic system taken the night of 10 July 2023. People are visible at the bottom middle of this photo for scale. Courtesy of Vilhelm Gunnarsson via Almannavarnadeildar ríkislögreglustjóra. |
Tremor levels peaked between 2100 on 10 July and 0000 on 11 July, and steadily declined through 1100. The intensity of the eruption notably decreased with fewer active lava fountains by 1250 on 11 July. Only one vent with an elongated crater and multiple lava fountains were active by 1635. Gas-and-steam plumes rose as high as 4 km above the vent. Lava flows mostly traveled SE and flowed into a shallow valley S of Litli-Hrútur. On 11 July IMO measured the amount of sulfur dioxide with a remote sensing device, DOAS (Differential Optical Absorption Spectroscopy). The amount of sulfur dioxide ranged around 66-80 kg/s.
On 14 July the advancing edge of the lava flow connected with the 2021 lava field in the NE part of Meradalir. The main vent was elongated and measured roughly 22-m-tall on 15 July. During 13-17 July the lava flow rate was an estimated 12.7 m3/sec, and by 18 July the total erupted volume was about 8.4 million m3. The flow advanced an average of 300-400 m per day. Flow thicknesses averaged 10 m; some areas reached 20 m. Lava filled the main cone and occasionally spilled over onto the flanks at around 2330 on 18 July. Around 0251 on 19 July, a breach was reported high on the NE rim, followed by lava that flowed down the flank. Spatter was ejected past the crater rim. Lava fountaining increased around 0259 and lava flowed short distances E. Around 0412 sections of the NW wall of the cone collapsed, which drained the crater and sent lava flows to the N and W. Around the same time, there was a significant decrease in the rate at the S-moving lava flow and by 0530 it was fully crusted over.
Lava from the main vent had grown to about 90 x 40 m during 19-26 July and continued to advance SSW, according to a VONA (figure 40). Sulfur dioxide plumes rose 1-2 km above the crater rim. Seismicity decreased since the eruption began and was mainly concentrated at the N end of the dike and to the E of Keilir. The effusion rate averaged 8 m3/sec during 18-23 July and the total erupted volume was about 12.4 million m3, based on calculations from the University of Iceland, the Icelandic Institute of Natural History, and the National Land Survey of Iceland (figure 41). The lava flow field covered an area of about 1.2 km2 (figure 42). According to a news article, part of the N crater rim collapsed just before 1200 on 24 July, which directed lava flows down a new channel, mainly to the S, but also moving E.
|
Figure 40. A hazard map of Litli-Hrútur, part of the Fagradalsfjall volcanic system, updated on 20 July 2023 that shows the hazard area (light pink), the lava flow extent as of 18 July 2023 (dark pink), and earlier lava flow fields from 2021 and 2022 (orange). The location of the vent is marked with a red dot, and the dike propagation is highlighted by the dark blue dotted line, extending from Keilir to Meradalahnúkar. Courtesy of IMO. |
|
Figure 41. Graphs showing the evolution of the inundated area (top), volume (middle), and effusion rate (bottom) of the lava flow from 18-23 July 2023 at Litli-Hrútur, part of the Fagradalsfjall volcanic system. By 23 July lava covered an area of 1.15 km2, had an erupted volume of 12.4 million m3, and had an effusion rate of 8 m3/s. Courtesy of IES. |
|
Figure 42. Map showing the extent of the lava flow field for the eruption at Litli-Hrútur, part of the Fagradalsfjall volcanic system on 23 July 2023 (red) compared to the previous eruptions in 2021 (green) and 2022 (orange). The S part of the 2023 flow intersects with the previous 2022 lava flow field. Courtesy of IES. |
During 23-31 July the lava effusion rate decreased to 5 m3/sec and the total erupted volume was about 15.9 million m3. The flow field covered an area of 1.5 km2 by 31 July. During 26 July through 2 August about 150 earthquakes were recorded in the eruptive area, many of which occurred around Keilir. At 1706 on 5 August IMO lowered the ACC to Yellow (the second level on a four-color scale), noting that activity had declined during the previous few days and very minor crater activity was visible in webcam images. Tremor decreased during the previous 36 hours and reached background levels by 1500 on 5 August. Gas-and-steam plumes generally rose 1-2 km above the vent, except on 1 August, where plumes rose more than 2.5 km above the vent. According to news articles, a notable amount of gas-and-steam emissions rose from the vent on 4 August. Activity was last seen on 5 August and a thermal anomaly in the crater was last identified in satellite images on 6 August.
Satellite data. Data from the TROPOMI instrument on the Sentinel-5P satellite, available on maps from the NASA Global Sulfur Dioxide page, showed two sulfur dioxide plumes exceeding 2 DU (Dobson Units) on 11 and 23 July 2023 and drifted W and SE, respectively (figure 43). Strong thermal activity was detected in MODIS data shown on the MIROVA (Middle InfraRed Observation of Volcanic Activity) graphs showing the beginning of the eruption in early July due to lava effusion (figure 44). In late July, the power of the thermal anomalies gradually declined as activity slowed; residual heat remained low through September. Infrared satellite images also showed the start of the fissure eruption and thermal activity expanding NE and SW through July (figure 45). By early August, the lava flows began to cool.
|
Figure 43. Two strong sulfur dioxide plumes that exceeded 2 DUs (Dobson Units) were detected above Fagradalsfjall on 11 and 23 July 2023 and drifted W and SE, respectively (left and right, respectively), based on data from the TROPOMI instrument on the Sentinel-5P satellite. Courtesy of the NASA Global Sulfur Dioxide Monitoring Page. |
|
Figure 44. Strong thermal activity began at Fagradalsfjall in early July 2023, according to the MIROVA graph (Log Radiative Power) and continued through early August due to a new eruption characterized by lava flows and fountains. Lower, possibly residual thermal activity persisted through September. Courtesy of MIROVA. |
|
Figure 45. Infrared (bands B12, B11, B4) satellite imagery showed the onset of a new fissure eruption at Litli-Hrútur, part of the Fagradalsfjall volcanic system on 11 (top left), 13 (top right), and 18 (bottom left) July 2023 and 2 August 2023 (bottom right). The bright yellow-orange color represents the lava flows and fountains as it expanded NE and SW throughout July. By early August, thermal activity declined and began to cool. Courtesy of Copernicus Browser. |
Information Contacts: Icelandic Meteorological Office (IMO), Bústaðavegur 7-9 105 Reykjavík, Iceland (URL: http://en.vedur.is/); Institute of Earth Sciences, Sturlugata 7 101 Reykjavík, Iceland (URL: http://www.earthice.hi.is/); Almannavarnadeildar ríkislögreglustjóra, Skúlagata 21, Reykjavík, Iceland (URL: https://www.almannavarnir.is/); Icelandic National Broadcasting Service (RUV), Efstaleiti 1 150 Rekyjavík, Iceland (URL: http://www.ruv.is/); MIROVA (Middle InfraRed Observation of Volcanic Activity), a collaborative project between the Universities of Turin and Florence (Italy) supported by the Centre for Volcanic Risk of the Italian Civil Protection Department (URL: http://www.mirovaweb.it/); NASA Global Sulfur Dioxide Monitoring Page, Atmospheric Chemistry and Dynamics Laboratory, NASA Goddard Space Flight Center (NASA/GSFC), 8800 Greenbelt Road, Goddard MD 20771, USA (URL: https://so2.gsfc.nasa.gov/); Copernicus Browser, Copernicus Data Space Ecosystem, European Space Agency (URL: https://dataspace.copernicus.eu/browser/).
|
|
||||||||||||||||||
There is data available for 3 confirmed eruptive periods.
2023 Jul 10 - 2023 Aug 5 Confirmed Eruption (Explosive / Effusive) VEI: 0
| Episode 1 | Eruption (Explosive / Effusive) | ||||||||||||||
|---|---|---|---|---|---|---|---|---|---|---|---|---|---|---|
| 2023 Jul 10 - 2023 Aug 5 | Evidence from Observations: Reported | |||||||||||||
|
List of 1 Events for Episode 1
|
||||||||||||||
2022 Aug 3 - 2022 Aug 21 Confirmed Eruption (Explosive / Effusive) VEI: 0
| Episode 1 | Eruption (Explosive / Effusive) | |||||||||||||||||||||||||||||
|---|---|---|---|---|---|---|---|---|---|---|---|---|---|---|---|---|---|---|---|---|---|---|---|---|---|---|---|---|---|
| 2022 Aug 3 - 2022 Aug 21 | Evidence from Observations: Reported | ||||||||||||||||||||||||||||
|
List of 4 Events for Episode 1
|
|||||||||||||||||||||||||||||
2021 Mar 19 - 2021 Sep 18 Confirmed Eruption (Explosive / Effusive) VEI: 0
| Episode 1 | Eruption (Explosive / Effusive) | |||||||||||||||||||||||||||||
|---|---|---|---|---|---|---|---|---|---|---|---|---|---|---|---|---|---|---|---|---|---|---|---|---|---|---|---|---|---|
| 2021 Mar 19 - 2021 Sep 18 | Evidence from Observations: Reported | ||||||||||||||||||||||||||||
|
List of 4 Events for Episode 1
|
|||||||||||||||||||||||||||||
The Global Volcanism Program has no synonyms or subfeatures listed for Fagradalsfjall.
The Global Volcanism Program has no photographs available for Fagradalsfjall.
There are no samples for Fagradalsfjall in the Smithsonian's NMNH Department of Mineral Sciences Rock and Ore collection.
| Catalogue of Icelandic Volcanoes (Link to Fagradalsfjall) | The Catalogue of Icelandic Volcanoes is an interactive, web-based tool, containing information on volcanic systems that belong to the active volcanic zones of Iceland. It is a collaboration of the Icelandic Meteorological Office (the state volcano observatory), the Institute of Earth Sciences at the University of Iceland, and the Civil Protection Department of the National Commissioner of the Iceland Police, with contributions from a large number of specialists in Iceland and elsewhere. This official publication is intended to serve as an accurate and up-to-date source of information about active volcanoes in Iceland and their characteristics. The Catalogue forms a part of an integrated volcanic risk assessment project in Iceland GOSVÁ (commenced in 2012), as well as being part of the effort of FUTUREVOLC (2012-2016) on establishing an Icelandic volcano supersite. |
| Copernicus Browser | The Copernicus Browser replaced the Sentinel Hub Playground browser in 2023, to provide access to Earth observation archives from the Copernicus Data Space Ecosystem, the main distribution platform for data from the EU Copernicus missions. |
| MIROVA | Middle InfraRed Observation of Volcanic Activity (MIROVA) is a near real time volcanic hot-spot detection system based on the analysis of MODIS (Moderate Resolution Imaging Spectroradiometer) data. In particular, MIROVA uses the Middle InfraRed Radiation (MIR), measured over target volcanoes, in order to detect, locate and measure the heat radiation sourced from volcanic activity. |
| MODVOLC Thermal Alerts | Using infrared satellite Moderate Resolution Imaging Spectroradiometer (MODIS) data, scientists at the Hawai'i Institute of Geophysics and Planetology, University of Hawai'i, developed an automated system called MODVOLC to map thermal hot-spots in near real time. For each MODIS image, the algorithm automatically scans each 1 km pixel within it to check for high-temperature hot-spots. When one is found the date, time, location, and intensity are recorded. MODIS looks at every square km of the Earth every 48 hours, once during the day and once during the night, and the presence of two MODIS sensors in space allows at least four hot-spot observations every two days. Each day updated global maps are compiled to display the locations of all hot spots detected in the previous 24 hours. There is a drop-down list with volcano names which allow users to 'zoom-in' and examine the distribution of hot-spots at a variety of spatial scales. |
|
WOVOdat
Single Volcano View Temporal Evolution of Unrest Side by Side Volcanoes |
WOVOdat is a database of volcanic unrest; instrumentally and visually recorded changes in seismicity, ground deformation, gas emission, and other parameters from their normal baselines. It is sponsored by the World Organization of Volcano Observatories (WOVO) and presently hosted at the Earth Observatory of Singapore.
GVMID Data on Volcano Monitoring Infrastructure The Global Volcano Monitoring Infrastructure Database GVMID, is aimed at documenting and improving capabilities of volcano monitoring from the ground and space. GVMID should provide a snapshot and baseline view of the techniques and instrumentation that are in place at various volcanoes, which can be use by volcano observatories as reference to setup new monitoring system or improving networks at a specific volcano. These data will allow identification of what monitoring gaps exist, which can be then targeted by remote sensing infrastructure and future instrument deployments. |
| Volcanic Hazard Maps | The IAVCEI Commission on Volcanic Hazards and Risk has a Volcanic Hazard Maps database designed to serve as a resource for hazard mappers (or other interested parties) to explore how common issues in hazard map development have been addressed at different volcanoes, in different countries, for different hazards, and for different intended audiences. In addition to the comprehensive, searchable Volcanic Hazard Maps Database, this website contains information about diversity of volcanic hazard maps, illustrated using examples from the database. This site is for educational purposes related to volcanic hazard maps. Hazard maps found on this website should not be used for emergency purposes. For the most recent, official hazard map for a particular volcano, please seek out the proper institutional authorities on the matter. |
| IRIS seismic stations/networks | Incorporated Research Institutions for Seismology (IRIS) Data Services map showing the location of seismic stations from all available networks (permanent or temporary) within a radius of 0.18° (about 20 km at mid-latitudes) from the given location of Fagradalsfjall. Users can customize a variety of filters and options in the left panel. Note that if there are no stations are known the map will default to show the entire world with a "No data matched request" error notice. |
| UNAVCO GPS/GNSS stations | Geodetic Data Services map from UNAVCO showing the location of GPS/GNSS stations from all available networks (permanent or temporary) within a radius of 20 km from the given location of Fagradalsfjall. Users can customize the data search based on station or network names, location, and time window. Requires Adobe Flash Player. |
| DECADE Data | The DECADE portal, still in the developmental stage, serves as an example of the proposed interoperability between The Smithsonian Institution's Global Volcanism Program, the Mapping Gas Emissions (MaGa) Database, and the EarthChem Geochemical Portal. The Deep Earth Carbon Degassing (DECADE) initiative seeks to use new and established technologies to determine accurate global fluxes of volcanic CO2 to the atmosphere, but installing CO2 monitoring networks on 20 of the world's 150 most actively degassing volcanoes. The group uses related laboratory-based studies (direct gas sampling and analysis, melt inclusions) to provide new data for direct degassing of deep earth carbon to the atmosphere. |
| EarthChem | EarthChem develops and maintains databases, software, and services that support the preservation, discovery, access and analysis of geochemical data, and facilitate their integration with the broad array of other available earth science parameters. EarthChem is operated by a joint team of disciplinary scientists, data scientists, data managers and information technology developers who are part of the NSF-funded data facility Integrated Earth Data Applications (IEDA). IEDA is a collaborative effort of EarthChem and the Marine Geoscience Data System (MGDS). |