

The Icelandic Meteorological Office (IMO) reported that the seismic swarm that began at Bárdarbunga on 14 January in the NW part of the caldera did not escalate further. Only two earthquakes were recorded during 15-16 January, with magnitudes of 2.4 and 1.6, on each day respectively. At 1605 on 16 January the Aviation Color Code was lowered back to Green (the lowest color on a four-color scale).
Source: Icelandic Meteorological Office (IMO)
Monitoring data from early 2016
The fissure eruption from the Bardarbunga volcanic system began on 29 August 2014 (BGVN 39:10) about 45 km NE of the subglacial caldera at what was designated the Holuhraun vent. Lava emission ended on 28 February 2015 (BGVN 40:01), after creating a lava field almost 85 km2 in size. This report includes additional information provided by the Icelandic Meterological Office and NASA's Earth Observatory. Information from a report of the Icelandic Civil Protection Scientific Advisory Board, which met on 23 June 2016 to review recent data, is included below.
A scientific team working on the Vatnajökull glacier during 3-10 June 2016 did echo soundings to examine whether changes in bedrock topography within the Bardarbunga caldera could be detected from the recent eruption. No changes in the bedrock topography were apparent. There were also no indications that meltwater was accumulating within the caldera. The 65-m-deep depression in the glacier formed during the 2014-2015 activity was getting shallower due to the flow of ice into the caldera and snow accumulation, and the depression had decreased in depth by 8 m since the previous year.
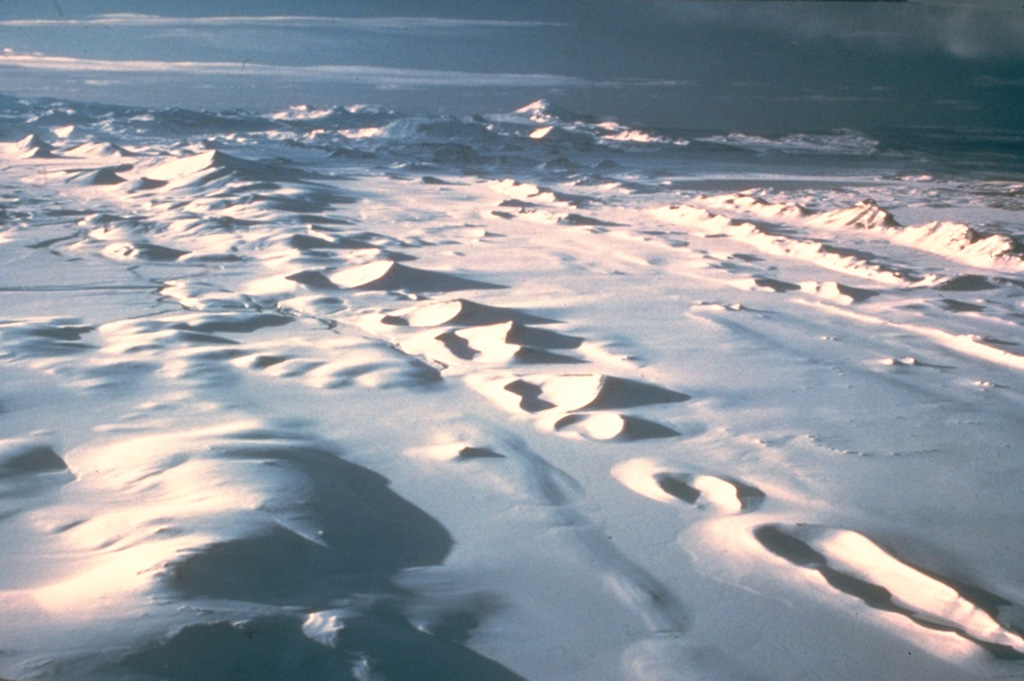
Expedition scientists also measured gas emissions at ice cauldrons (figures 13 and 14), which are formed by subglacial geothermal activity, along the caldera rim; these measurements showed little change since the previous year's expedition. Seismic data showed that accumulated moment magnitude had been increasing since mid-September 2015. A total of 51 earthquakes stronger than M3 had been registered at Bardarbunga since the end of the eruption in 2015. GPS stations showed slow movement away from the caldera.
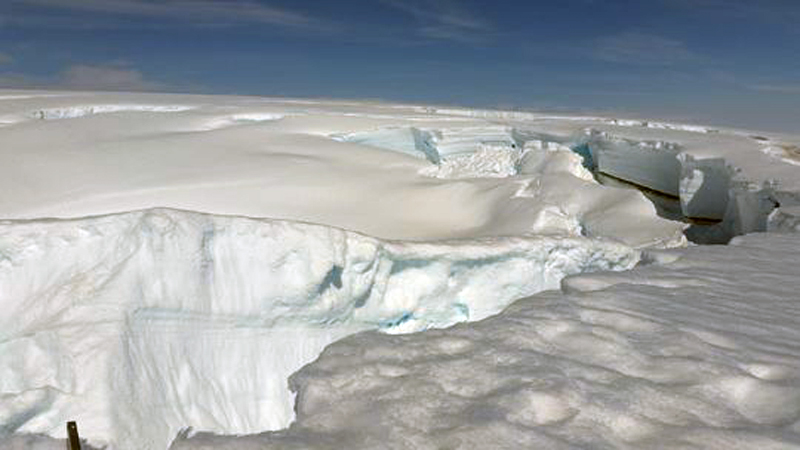 |
Figure 13. The edge of a cauldron at the southernmost rim of the Bardarbunga caldera, 10 June 2016. Photo by Benedikt G. Ófeigsson; courtesy of the IMO. |
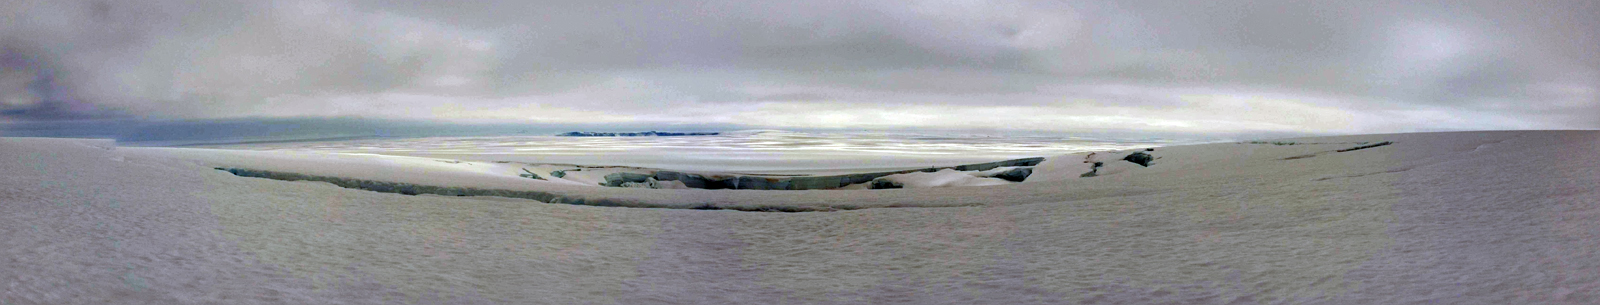 |
Figure 14. A panorama view from 7 June 2016 shows the same cauldron at Bardarbunga, with Grimsvotn in the background. Photo by Benedikt G. Ófeigsson; courtesy of the IMO. |
The Advisory Board report concluded that the most probable explanations for the ground deformation and seismicity was the inflow of magma from around 10-15 km below Bardarbunga into the area from which the magma erupted at Holuhraun during 2014-2015. There were no indications of magma collecting at shallower depths.
An image posted by the NASA Earth Observatory showed the extent of the Holuhraun lava field on 5 November 2016 surrounded by snow (figure 15).
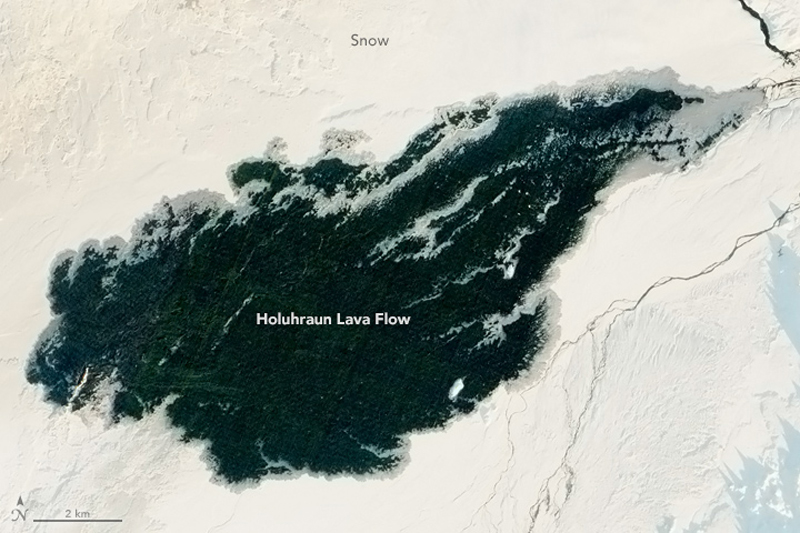 |
Figure 15. Acquired 5 November 2016, this image was captured by the Advanced Land Imager on the Earth Observing-1 satellite at 1000 local time. The photo has been edited to correct for the low angle of the Sun, which caused the white snow to appear reddish. Snow does appear to build up along the edges of the lava flow, where the lava is thinner. Courtesy NASA Earth Observatory. |
Information Contacts: Icelandic Met Office (IMO), Reykjavík, Iceland (URL: http://en.vedur.is/); NASA Earth Observatory, EOS Project Science Office, NASA Goddard Space Flight Center, Goddard, Maryland, USA (URL: http://earthobservatory.nasa.gov/).
2025: January
2015: January
| February
| April
2014: August
| September
| October
| November
| December
The Icelandic Meteorological Office (IMO) reported that the seismic swarm that began at Bárdarbunga on 14 January in the NW part of the caldera did not escalate further. Only two earthquakes were recorded during 15-16 January, with magnitudes of 2.4 and 1.6, on each day respectively. At 1605 on 16 January the Aviation Color Code was lowered back to Green (the lowest color on a four-color scale).
Source: Icelandic Meteorological Office (IMO)
The Icelandic Meteorological Office (IMO) reported that an earthquake swarm began at Bárdarbunga at 0610 on 14 January in the NW part of the caldera. Initial estimates indicated that there were three earthquakes larger than an M 3 and one above an M 4; at 0705 the Aviation Color Code was raised to Yellow (the second lowest color on a four-color scale). The swarm continued though the morning and at 0805 a M 5 earthquake was detected. Seismicity began to decrease in intensity at around 0900 and continued at lower levels. The seismic network recorded about 130 earthquakes by 1418; seismicity continued overnight during 14-15 January. Similar activity occurred in 2014 before an effusive eruption that began after two weeks of unrest.
Source: Icelandic Meteorological Office (IMO)
On 26 April the Icelandic Met Office (IMO) lowered the Aviation Color Code for Bárdarbunga to Green (the lowest on a four-color scale). No further signs of unrest had been noted since the end of the eruption on 27 February; seismicity within the caldera and the associated dyke intrusion continued to decline.
Source: Icelandic Meteorological Office (IMO)
The Icelandic Met Office reported that the eruption at Bárdarbunga’s Holuhraun eruptive fissure, which began on 31 August 2014, had ended on 27 February; the Aviation Colour Code was lowered to Yellow. During an overflight scientists did not see any incandescence from the vents, although gas emissions persisted. Radar measurements showed that no increase in the extent of the lava field had been detected since mid-February.
Source: Icelandic Meteorological Office (IMO)
During 17-19 February, Icelandic Met Office reported continued activity at Bárdarbunga’s Holuhraun eruptive fissure, though the overall intensity of the eruption continued to decrease. Only one active vent was present in the crater, and the lava level in that crater continued to sink. The eruption plume rose no more than 1 km above the ground and drifted NE, and the lava channel was crusted over beyond the uppermost 200-300 m. The lava tube continued to feed the N and NE parts of Holuhraun, inflating the lava field. The reduced effusion rate was no longer able to sustain active breakouts in an area 17-18 km ENE from the vent. A 24 February report noted that the rate of subsidence was less than 2 cm per day and lava flows decreased substantially. Seismic activity continued to decrease although it was still considered to be strong.
Source: Icelandic Meteorological Office (IMO)
During 11-17 February, IMO maintained Aviation Colour Code Orange due to continued activity at Bárdarbunga’s Holuhraun eruptive fissure; the overall activity was persistent, but lower compared to recent weeks and months. Seismicity remained strong. Local air pollution from gas emissions persisted and GPS measurements showed that subsidence continued. The lava field covered 85 square kilometers on 14 February; measurements from 4 and 12 February showed almost no changes in the extent of the field.
Source: Icelandic Meteorological Office (IMO)
During 4-10 February, IMO maintained Aviation Colour Code Orange due to continued activity at Bárdarbunga’s Holuhraun eruptive fissure. A 6 February statement noted that although there was a visible reduction in activity during the previous two weeks, seismicity remained strong. Local air pollution from gas emissions persisted and GPS measurements showed that subsidence continued.
Source: Icelandic Meteorological Office (IMO)
During 27 January-3 February, IMO maintained Aviation Colour Code Orange due to continued activity at Bárdarbunga’s Holuhraun eruptive fissure, with a lava-flow rate of about 100 cubic meters per second. Seismicity remained strong and local air pollution from gas emissions persisted. GPS measurements showed that subsidence continued. On 27 January the plume rose an estimated 1.3 km. A map made on 21 January showed that the lava field was thickening and not expanding significantly; the erupted volume was an estimated 1.4 cubic kilometers (15% uncertainty).
Source: Icelandic Meteorological Office (IMO)
During 21-27 January, IMO maintained Aviation Colour Code Orange due to continued activity at Bárdarbunga’s Holuhraun eruptive fissure. The lava field expanded along the N and NE margins. Seismicity remained strong and local air pollution from gas emissions persisted. Very high values of sulfur dioxide, about 84,000 µg/m3, were recorded at the eruption site on 21 January; this value was the highest recorded at ground level since the eruption started. Total subsidence of the Bárdarbunga surface since mid-August was 61 m, and the volume of erupted lava was an estimated 1.4 cubic kilometers. The lava field covered 84.7 square kilometers on 22 January. A report issued on 27 January stated that the average rate of lava emission during the previous three weeks was just less than 100 cubic meters per second, therefore the intensity of the eruption was slowly decreasing.
Source: Icelandic Meteorological Office (IMO)
During 14-20 January, IMO maintained Aviation Colour Code Orange due to continued activity at Bárdarbunga’s Holuhraun eruptive fissure. The lava field expanded the N and NE margins. Seismicity remained strong and local air pollution from gas emissions persisted. GPS measurements showed that subsidence continued. The lava field covered 84.3 square kilometers on 15 January.
Source: Icelandic Meteorological Office (IMO)
During 7-13 January, IMO maintained Aviation Colour Code Orange due to continued activity at Bárdarbunga’s Holuhraun eruptive fissure. The lava field expanded the N and NE margins. Seismicity remained strong and local air pollution from gas emissions persisted. GPS measurements showed that subsidence continued. The lava field covered 84.1 square kilometers on 10 January.
Source: Icelandic Meteorological Office (IMO)
During 31 December-6 January, IMO maintained Aviation Colour Code Orange due to continued activity at Bárdarbunga’s Holuhraun eruptive fissure. The lava was flowing through a closed channel to the E edge of the lava field, about 15 km from the crater. Lava was also flowing N. Seismicity remained strong and local air pollution from gas emissions persisted. Subsidence continued at a rate of 25 cm/day. The lava field covered 83.4 square kilometers on 6 January.
Preliminary analysis of radar measurements taken during an overflight on 30 December showed that the lava is on average 10 m thick in the E part, 12 m thick at the center, and about 14 m in the W part. The maximum thickness, near the craters, was about 40 m at the E margin of the lava lake. A preliminary estimate for the volume of the lava was 1.1 cubic kilometers. Total subsidence of the Bárdarbunga surface since mid-August was 59 m.
Source: Icelandic Meteorological Office (IMO)
During 24-30 December, IMO maintained Aviation Colour Code Orange due to continued activity at Bárdarbunga’s Holuhraun eruptive fissure. The lava was flowing through a closed channel to the E edge of the lava field, about 15 km from the crater. Lava was also flowing N. Seismicity remained strong and local air pollution from gas emissions persisted. The lava field covered 82.8 square kilometers as of 29 December.
Source: Icelandic Meteorological Office (IMO)
During 17-23 December, IMO maintained Aviation Colour Code Orange due to continued activity at Bárdarbunga’s Holuhraun eruptive fissure. The lava field covered just over 79.8 square kilometers on 18 December. Data collected during an overflight showed that subsidence of Bárdarbunga Caldera continued with a total amount of 56 m and a volume of 1.7 cubic kilometers since the beginning of the eruption. On 22 December lava was flowing through a closed channel to the E edge of the lava field, about 15 km from the crater. Lava was also flowing N.
Source: Icelandic Meteorological Office (IMO)
During 10-16 December, IMO maintained Aviation Colour Code Orange due to continued activity at Bárdarbunga’s Holuhraun eruptive fissure. A decreased rate of subsidence of the Bárdarbunga Caldera continued. The lava field covered just over 78.6 square kilometers on 15 December.
Source: Icelandic Meteorological Office (IMO)
During 3-9 December, IMO maintained Aviation Colour Code Orange due to continued activity at Bárdarbunga’s Holuhraun eruptive fissure. The Scientific Advisory Board of the Icelandic Civil Protection reviewed data from the beginning of the eruption on 31 August to 3 December and found a decreased rate of subsidence of the Bárdarbunga Caldera from up to 80 cm/day to 25 cm/day, with most of the subsidence concentrated at the center of the caldera. Data also showed a decline in the intensity of the eruption at Holuhraun, although seismic activity remained strong. The lava field covered just over 76 square kilometers on 9 December, making it the largest lava field in Iceland since the Laki eruption (1783-1784). Additionally, the gas emissions have had an impact all over Iceland for the first time in 150 years.
Source: Icelandic Meteorological Office (IMO)
During 26 November-2 December, IMO maintained Aviation Colour Code Orange due to continued activity at Bárdarbunga’s Holuhraun eruptive fissure. Based on a field report from 25 or 26 November the activity was characterized as pulsating; lava surged from the vent for 2-3 minutes, every 5-10 minutes, causing bulges in the upper parts of the lava channel. Measurements obtained during an overflight on 26 November indicated that the total amount of subsidence of the Bárdarbunga Caldera was about 50 m, with an estimated volume of 1.4 cubic kilometers. The rate of subsidence in the center of the caldera had decreased slowly compared to the first month of the eruption. Observers in Dyngjusandur, NE of the vent, photographed the plume at 1441 on 27 November and indicated that the top of the plume was 3.1 km above Dyngjusandur, and the base of the aerosol-laden lower part of the plume was about 1.4 km above the sand plain. A thermal image from 1 December showed several changes to the lava field: in just over 24 hours a new lava extrusion at the NE margin traveled 450 m; a new flow traveled N, just W of the lava lake; and a new flow was forming S of the lava lake, and then to the E of that flow. The lava field covered just over 75 square kilometers on 1 December.
Source: Icelandic Meteorological Office (IMO)
During 18-25 November, IMO maintained Aviation Colour Code Orange due to continued activity at Bárdarbunga’s Holuhraun eruptive fissure; FLIR thermal images of the craters on 18 November showed that the most intense area of thermal convection was at the northern part of the eruption site, called Heimasæta. Lava flowed ESE. Subsidence of the Bárdarbunga caldera continued and local air pollution from gas emissions persisted. On 20 November observers characterized the eruption as pulsating explosions in the crater every 10-15 minutes, followed by a gush of lava down the main channel with splashing on either side.
Sources: Icelandic Meteorological Office (IMO); Institute of Earth Sciences
During 12-18 November, IMO maintained Aviation Colour Code Orange due to continued activity at Bárdarbunga’s Holuhraun eruptive fissure; lava from the lava lake in the main vent, Baugur Crater, flowed ESE. Subsidence of the Bárdarbunga Caldera continued and local air pollution from gas emissions persisted. Seismicity remained strong, although a report on 14 November noted that the number of earthquakes over M 5 seemed to be decreasing. The lava field covered 71.9 square kilometers on 14 November.
Source: Icelandic Meteorological Office (IMO)
During 5-11 November, IMO maintained Aviation Colour Code Orange due to continued activity at Bárdarbunga’s Holuhraun eruptive fissure. Subsidence of the Bárdarbunga Caldera continued, and seismicity remained strong. The lava field was 60 square kilometers on 9 November. Local air pollution from gas emissions persisted.
Source: Icelandic Meteorological Office (IMO)
During 29 October-4 November, IMO maintained Aviation Colour Code Orange due to continued activity at Bárdarbunga’s Holuhraun eruptive fissure. Subsidence of the Bárdarbunga Caldera continued; by 31 October the depression was about 42 m. The lava field was 65.7 square kilometers on 31 October.
Source: Icelandic Meteorological Office (IMO)
During 22-28 October, IMO maintained Aviation Colour Code Orange due to continued activity at Bárdarbunga’s Holuhraun eruptive fissure. The eruption was confined to the main vent, Baugur Crater, which had reached 80 m high on 24 October. Subsidence of the Bárdarbunga Caldera continued; during an overflight on 24 October volcanologists noted that the depression in the caldera was 40 m. A report on 27 October noted that geothermal heat was increasing, and a cauldron in the SE corner of Bárdarbunga had deepened by 25 m over the previous month, thought to be linked to the caldera subsidence. In addition, the lava field covered 64.6 square kilometers.
Source: Icelandic Meteorological Office (IMO)
During 15-21 October, IMO maintained Aviation Colour Code Orange due to continued activity at Bárdarbunga’s Holuhraun eruptive fissure. Subsidence of the Bárdarbunga Caldera continued at a rate of 30-40 cm per day, concentrated in the NE part of the caldera, and on 15 October was an estimated 0.75 cubic kilometers. On 18 October a M 5.4 earthquake was detected at 0940 in N Bárdarbunga making it one of the biggest earthquakes since the start of the eruption. The lava field continued to grow and the lava production continued at the same rate; the lava field was 60.7 square kilometers on 19 October.
Source: Icelandic Meteorological Office (IMO)
During 8-14 October, IMO maintained Aviation Colour Code Orange due to continued activity at Bárdarbunga’s Holuhraun eruptive fissure. Subsidence of the Bárdarbunga Caldera continued. The lava field continued to grow, with lava production unchanged. Seismic activity was low in the N part of the dyke and around the eruption site.
Source: Icelandic Meteorological Office (IMO)
During 1-7 October, IMO maintained Aviation Colour Code Orange due to continued activity at Bárdarbunga’s Holuhraun eruptive fissure. Subsidence of the Bárdarbunga caldera continued. Seismic activity at the N part of the dyke and around the vents declined, although the lava field continued to grow and lava production continued at the same output. On 5 October a new lava front at the S edge of the main lava flow advanced E.
Source: Icelandic Meteorological Office (IMO)
During 23-30 September, IMO maintained Aviation Colour Code Orange due to continued activity at Bárdarbunga’s Holuhraun eruptive fissure. Subsidence of the Bárdarbunga caldera continued and had reached 27-28 m by 24 September. On 29 September the subsidence rate slowed slightly and was about 40 cm per 24 hours. Lava production continued at the same rate; the lava field was 46 square kilometers on 30 September.
Source: Icelandic Meteorological Office (IMO)
During 17-23 September, IMO maintained Aviation Colour Code Orange due to continued activity at Bárdarbunga’s Holuhraun eruptive fissure. Chemical analysis and geophysical modeling indicated that the source of the magma was at a depth of more than 10 km. Persistent subsidence was detected from the Bárdarbunga caldera and crustal movements signified that the volume of magma in the dyke slightly increased. On 21 September the lava field measured 37 square kilometers. Field scientists estimated that about 90% of the sulfur dioxide gas from the eruption originated at the active craters and the rest rose from the lava field. Dead birds were also found around the eruption site. A report on 22 September noted that the total volume of the erupted lava was 0.4-0.6 cubic kilometers and the flow rate was 250-350 cubic meters per second. Persistent subsidence was detected from the Bárdarbunga caldera; the volume of the depression was an estimated 0.6 cubic kilometers on 23 September.
Source: Icelandic Meteorological Office (IMO)
During 10-16 September, IMO maintained Aviation Colour Code Orange due to continued activity at Bárdarbunga’s Holuhraun eruptive fissure. Lava flows continued to advance at a consistent rate toward the E and W, and by 13 September, the lava field measured 24.5 km2. The main flow had entered the river bed of Jökulsá á Fjöllum and continued to follow its course; steam rose from the river where the lava was in contact but no explosive activity occurred. Persistent subsidence was detected from the Bárðarbunga caldera; approximately 23 m of total subsidence was measured during a survey on 14 September.
Seismicity persisted mainly around the caldera and the Dyngjujökull glacier. The largest earthquakes, M 5.5, M 5.3, and M 5.0, were detected on 10, 11, and 15 September respectively.
IMO reported continued elevated SO2 emissions during 10-16 September and issued warnings to the public in the municipality of Fjarðarbyggð on 13 September.
Source: Icelandic Meteorological Office (IMO)
During 3-9 September the Icelandic Met Office reported ongoing lava effusion, high gas emissions, and elevated seismicity from Bárdarbunga’s Holuhraun lava field. On 3 September, the lava flow continued advancing ENE and covered 7.2 km2. Field observations determined that ash production was almost negligible. Radar images provided measurements of a 0.5-1 km wide depression that had formed within the Dyngjujökull glacier (located ~2 km S of the eruption site).
On 4 September there was no decline in effusive activity and the lava field had an aerial extent of 10.8 km2. There were no obvious changes on the Dyngjujökull glacier.
Two new eruptive fissures were observed south of the main eruption site on 5 September. These sites were less effusive and were located ~2 km away from the Dyngjujökull glacier. The eruption also continued from the original fissure and generated a ~460 m high steam plume. During a surveillance flight, the depression within Dyngjujökull glacier appeared to have grown deeper. On 6 September large changes were observed from the overlying glacier of Bárdarbunga (Vatnajökull glacier); a large area subsided that corresponded to deformation of the caldera floor. There were no signs of an eruption from the caldera. Two depressions were noted on the Dyngjujökull glacier, suggesting that small, short sub-glacial eruptions may have occurred.
The fissure eruption continued during 6-7 September and lava effusion was 100-200 m3/s on 7 September. Activity from the S fissures was less than that of the N fissure which had been active since the beginning of the eruption. The advancing lava flow reached the W main branch of the Jökulsá á Fjöllum river. No explosive activity due to lava and river water interaction was observed, but steam rose from the area.
During 8-9 September activity was no longer detected from the southernmost fissure. Lava continued to advance and interact with the Jökulsá á Fjöllum river. The extent of the lava flow reached 19 km2 and gas emissions remained high.
The London VAAC reported no ash plumes associated with the fissure eruptions. The Aviation Color Code remained at Orange.
Sources: Icelandic Meteorological Office (IMO); London Volcanic Ash Advisory Centre (VAAC)
During 27 August-2 September the Icelandic Met Office reported ongoing seismic activity at Bárdarbunga volcano. On 27 August an overflight showed a 4-6-km-long row of cauldrons 10-15 m in diameter S of Bárdarbunga. On 29 August a small fissure eruption started in Holuhraun along an old fissure about 600 m in length north of Dyngjujökull. Lava again erupted starting on 31 August along a 1.5 km long fissure. The Aviation Color Code was raised to Red and lowered to Orange later in the day. On 1-2 September a white steam and gas plume rose 4.5 km (15,000 ft) a.s.l. and drifted 60 km to NNE and ENE. Lava flowed N and lava plumes rose tens of meters. There was a noticeable decrease in seismicity from 500 earthquakes on 1 September to 300 earthquakes on 2 September. Earthquakes up to magnitude 4-5.4 have been detected at or near the volcano. On 2 September the lava had covered 4.2 square kilometers and was 4.5 km from the glaciers edge. The London VAAC reported no ash plumes associated with the fissure eruptions. The Aviation Color Code remains at Orange.
Sources: Icelandic Meteorological Office (IMO); London Volcanic Ash Advisory Centre (VAAC)
During 20-26 August the Icelandic Met Office reported ongoing high rates of seismic activity at Bárdarbunga volcano. Global Postioning System and seismic data indicated that an intrusive dike had increased from 25 to 40 km in length E, NE, and N of the volcano over the past week. During 22-26 August several earthquakes in the 4.7-5.7 magnitude range had been detected at or near the volcano. On 23 August seismic tremor indicated a small lava-eruption 150-400 m beneath the Dyngjujökull glacier, prompting a change in the Aviation Color Code to Red. On 24 August observations from an overflight indicated there was no eruption and the Aviation Color Code was changed to Orange. On 26 August the location of the seismicity was located primarily along the 10 km long tip of the dike that extended 5 km beyond the glacier margin.
Source: Icelandic Meteorological Office (IMO)
During 13-19 August the Icelandic Met Office reported increased seismic activity at Bárdarbunga volcano. On 16 August more than 200 earthquakes were reported under the NW Vatnajökull ice cap, and GPS stations have shown an increasing signal upward and away from the volcano since early June 2014. On 16 August the Aviation Color code was increased to Yellow. On 18 August the Icelandic Met Office reported an earthquake swarm to the E and another to the N of Bárdarbunga. A M4 earthquake was recorded that was the strongest in the region since 1996. By 18 August there had been 2,600 earthquakes detected at the volcano; earthquake locations from N and E swarms had been migrating NE, but in the evening activity of the N swarm had decreased significantly. That same day the Aviation Color code was raised to Orange.
Source: Icelandic Meteorological Office (IMO)
Reports are organized chronologically and indexed below by Month/Year (Publication Volume:Number), and include a one-line summary. Click on the index link or scroll down to read the reports.
Published paper about a 1986 jökulhlaup
[Björnsson and Einarsson (1990) note that since 1955, twenty jökulhlaups (glacier bursts) have originated in geothermal areas beneath two ice cauldrons on Loki Ridge, ~10 km NW of frequently active Grímsvötn volcano. Seismic data suggest that a small eruption occurred from beneath the eastern cauldron during a 1986 jökulhlaup in a river (Skaftá), that drains the SW part of the glacier (Vatnajökull). The flood in Skaftá began on 29 November, and short bursts of continuous tremor were recorded on seismographs around Vatnajökull during the next two days. A 30 November overflight revealed new concentric crevasses in the cauldron, cut by a rift in its center that had not been observed during earlier jökulhalups.]
Reference. Björnsson, H., and Einarsson, P., 1990, Volcanoes beneath Vatnajökull, Iceland: evidence from radio echo-sounding, earthquakes and jökulhlaups: Jökull, no. 40, p. 147-168.
Information Contacts:
Substantial dike eruption ~45 km NE at Holuhraun begins 29 August 2014
[Barbarbunga is a subglacial caldera beneath the NW part of the Vatnajokull ice cap. Carrivick and Gertisser (2014) described the volcano as a caldera 700 m deep with a diameter of 11 km, covered by glacial ice ~850 m thick. This report is divided into two major sections, the first discussing activity between 1986 and 2008 and the second looking at more recent activity from 2014 to early 2015.]
1986-2008 activity. In 2010, the Icelandic Meteorological Office (IMO) presented a list of Icelandic volcanic eruptions from 1902-2010 on their website. That list lacks any eruption at the Bardarbunga caldera. Seibert and others (2010) stated that between 1986 and 2008, there were several uncertain cases of eruptions or unrest in the area of Loki-Fögrufjöll (S-SW of Bardarbunga caldera), which they consider a part of the larger Bardarbunga volcanic system (green in figure 1). The eruptive characteristics of these events included regional fissure and subglacial events associated with jökulhlaups (glacier bursts).
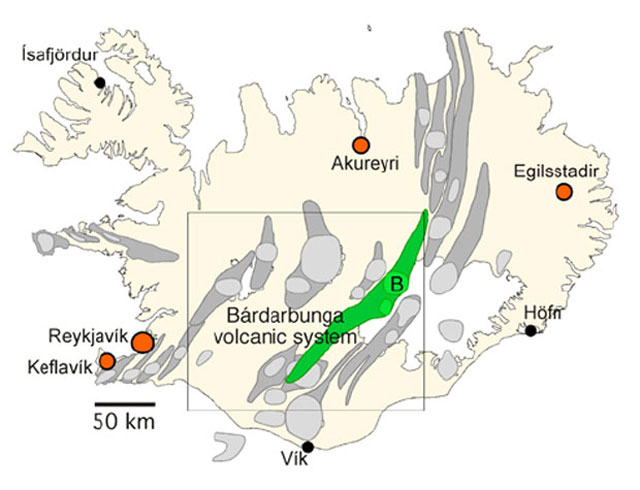 |
Figure 1. Map of Iceland that highlights the Bardarbunga volcanic system (shaded in green), which is 190 km long (NE-SW) and up to 25 km wide (NW-SE). The main Bardarbunga volcano, a subglacial caldera, is represented by the letter 'B' on the map. This map, showing all of Iceland was part of a more detailed map of the Bardarbunga volcanic system. Iceland's capital, Reykjavik, and other towns are also highlighted on the map. Taken from Larsen and others (2014). |
The associated jökulhlaups from 1986-2008 originated from the East and West Loki cauldrons found along the Loki Ridge of the Loki-Fögrufjöll system (figure 2). The cauldrons are located ~15 km SW of the center of the Bardarbunga caldera. Other terms for the Loki cauldrons include the East and West Skaftárketill cauldrons; the Eastern and Western Skaftá cauldrons; and the Eastern and Western cauldrons.
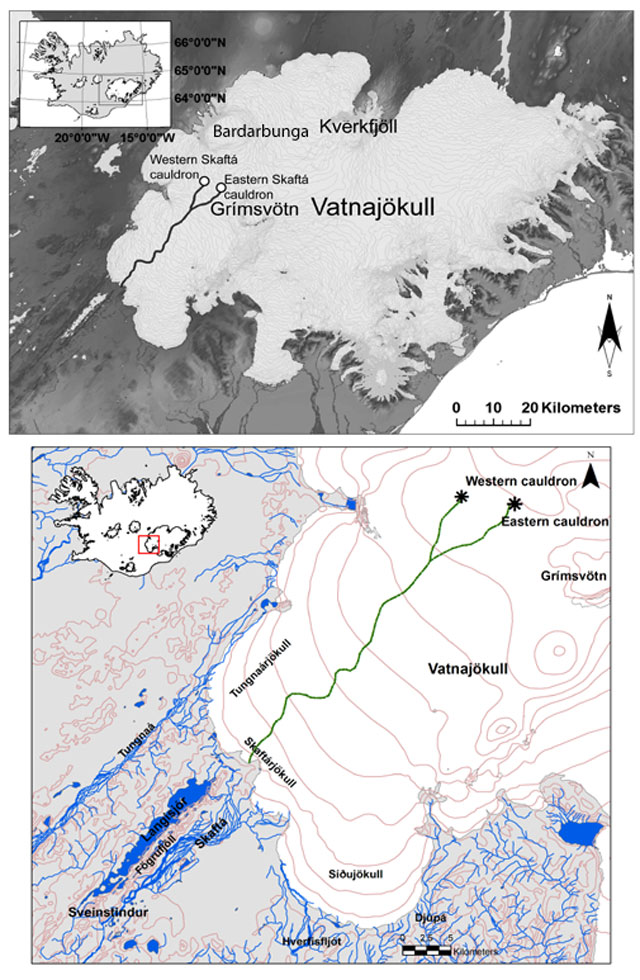 |
Figure 2. Two maps showing the location of East and West Loki cauldrons on the Vatnajokull glacier surface. The Loki cauldrons are found along the Loki Ridge of the Loki-Fögrufjöll system, located SW of Bardarbunga volcano and are within the larger Bardarbunga volcanic system. (Top) The Loki cauldrons are labeled as the Eastern and Western Skaftá cauldrons. (Bottom) The cauldrons are labelled the Eastern and Western cauldrons and the Skatfá river is highlighted. Both maps highlight the inferred subglacial water route (black and green lines) of melt water that is eventually discharged during a jökulhlaup. The jökulhlaups that originate from the Loki cauldrons empty into the Skatfá river. Top map after being taken from Marteinsson and others (2013) was slightly edited and the bottom map was taken from Einarsson (2009). |
The Loki cauldrons are depressions formed in the Vatnajokull glacier surface by two underlying, subglacial geothermal areas (Einarsson, 2009). The geothermal areas melt the glacier's base and melt water collects forming subglacial lakes. As the lakes grow, the ice above them flattens. Eventually, the melt water escapes from the subglacial lakes in a jökulhlaup. The water of the jökulhlaup then travels ~40 km subglacially to flood the Skatfá river (Einarsson, 2009). Once the subglacial lake has emptied, the overlying ice collapses and the cauldrons can be seen again in the glacier surface (Einarsson, 2009).
Table 1 presents the dates of uncertain cases of eruption within the Bardarbunga volcanic system. The source of the jökulhlaups associated with these uncertain eruptions consistently originated from the East or West Loki cauldron or both.
Table 1. Table condensing Bardarbunga's uncertain cases of eruptive history during 1986-2008. The uncertain cases all reside in the area of Loki-Fögrufjöll. The table also show the source of the jökulhlaup associated with each of the cases. None of these uncertain cases occurred at the Bardarbunga caldera. Data in this table summarizes written communication with Páll Einarsson in 2008.
| Month | Jökulhlaup source |
| Nov 1986 | East Loki |
| Aug 1991 | East Loki |
| Jul 1995 | East Loki |
| Aug 1996 | West Loki |
| Aug 1997 | East Loki |
| Aug 2000 | East and West Loki |
| Jul 2002 | West Loki |
| Sep 2002 | East Loki |
| Jul-Aug 2005 | West Loki |
| Apr 2006 | East Loki |
| Aug 2008 | West Loki |
Two examples of uncertain eruptions at the East Loki cauldron follow. They occurred in November 1986 and August 1991. For the 1986 case, Björnsson and Einarsson (1990) stated, "There is a seismic indication that a small eruption occurred in 1986 during a Skaftá jökulhlaup from beneath the easternmost ice cauldron [figure 2]. The flood in Skaftá began on November 29, and on November 30 and the following day short bursts of continuous tremor were recorded on seismographs around Vatnajokull.... It is likely that the pressure release associated with the jökulhlaup triggered a short eruption that did not reach the surface of the glacier."
For the 1991 case, Björnsson and Einarsson (1990) reported that "Bursts of tremor were recorded on seismographs near Vatnajokull on Aug. 12, 1991, during a jökulhlaup in Skaftá. The course of events is similar to that of Nov. 30, 1986, and suggests that a small and short-lived eruption may have occurred beneath the Eastern Loki cauldron."
Based on the communication between Einarsson and GVP, the other cases in table 1 followed a similar pattern. For each of those events, the occurrence of a jökulhlaup was followed by either an eruption tremor or bursts of eruption tremor, which suggested the possibility of a small, subglacial eruption at East or West Loki.
Confirmed 1996 eruptions. There are two confirmed eruptions at Bardarbunga, both within a few weeks of each other in 1996 (1 and 2 below).
(1) Einarsson and others (1997) discuss the complex interplay of events that occurred during 29 September through 7 November 1996, which involved seismicity, dikes, jökulhlaups, and various eruptions at Bardarbunga, Grímsvötn and Gjálp (fissure between the two calderas). Einarsson and others (1997) start with this introduction: "A volcanic eruption beneath the Vatnajokull ice cap in central Iceland... began on September 30, 1996, along a 7-km-long fissure between the volcanoes Bardarbunga and Grímsvötn. The eruption continued for 13 days...."
They further note "... a minor subglacial eruption occurred on the southeast rim of the Bardarbunga caldera, 6-7 km to the north. Two small depressions formed in the ice surface there." Regarding this, Páll Einarsson added this comment in a 2015 email: "The small subglacial eruptions at the Bárðarbunga caldera rim, mentioned in our paper, are a separate event [from the one a few weeks later mentioned in (2) below]. They are evidenced by sinkholes in the glacier that were discovered late and the timing of these events is not known. Most likely the sinkholes were initiated during the Gjálp eruption, i.e. between September 30 and October 13."
(2) According to the Institute of Earth Sciences of the University of Iceland (IES, posting date uncertain), a small eruption took place at Bardarbunga in 1996. They wrote the following: "A small eruption started in Bardarbunga around 1300 hrs on November 6th. The eruption lasted for about 20 to 30 min. According to seismograms at the Meteorological office, the eruption was initiated by some intrusive activity. The intrusive activity is based on recorded eruption tremor picked up [by] the seismometers. Eruption column reached about 4 km in to the air. Relation between pressure decrease due to the flooding [has] been suggested as the main cause of the eruption." This eruption came a day after a jökulhlaup was released from the Grímsvötn caldera (BGVN 21:09 and 23:11, and IES (posting date uncertain). We have not found a clear description of where in the caldera the eruption took place on 6 November 1996.
In regards to the confirmed eruption of 6 November, Einarsson's email made these remarks: "Keep in mind that Bárðarbunga is very remote and observations of the activity are difficult and very dependent on weather conditions. The webpage of our institute describes a small explosive event that happened on Nov. 6 at the end of the large jökulhlaup, when the meltwater from the large Gjálp eruption was flushed down to the coast. Most of us think now that this was a phreatic reaction of the still hot edifice to the sudden pressure release when the caldera lake of Grímsvötn was emptied, i.e. not due to a fresh injection of magma. But observations were scarce and there may be other opinions on this."
2014-early 2015 activity. This section of the Bulletin report primarily summarizes events from 16 August 2014, when seismic activity began, into mid-January 2015. The eruption was still ongoing at that time.
Bardarbunga is monitored by a seismic network, an extensive GPS network, and various sensors such as webcams and infrared cameras. Monitoring and analyses at Bardarbunga is conducted by a group of collaborators that include the IMO, the Institute of Earth Sciences (IES) at the University of Iceland, and the National Commissioner of Police, and the Department of Civil Protection and Emergency Management.
Gudmundsson and others (2014) and IMO describe dike emplacement (without apparent breaching the ground surface) associated with a seismic swarm that began at the caldera and migrated tens of kilometers with branches to the N and NE during 16-31 August 2014. On 29 August 2014, two days before the swarm ended, an eruption was first documented at the surface at a flank vent devoid of ice cover ~45 km NE of the caldera.
Figures 3 and 4 help explain the location of volcanoes in Iceland and Bardarbunga lava that progressed northward as a dike and ultimately erupted in the Holuhraun vent.
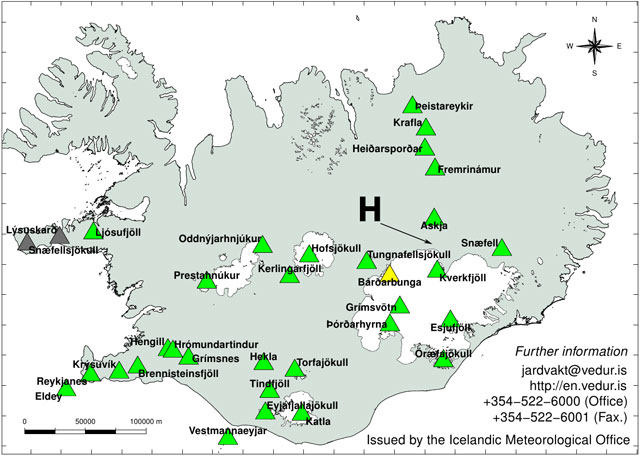 |
Figure 3. IMO map of Iceland showing key Holocene volcano locations. Bardarbunga (yellow triangle) is located on the NW part of the 14,000 km2 Vatnajokull ice cap (continental glacier). Although seismicity and dike injection began at Bardarbunga, intrusive processes seemingly prevailed until dikes had propagated to Holuhraun (tip of arrow designated with "H", location approximate). Holuhraun sits ~45 km NE of the caldera. Courtesy of Iceland Met Office. |
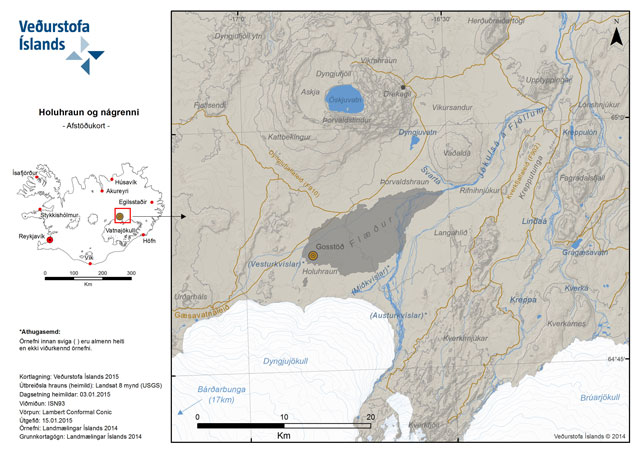 |
Figure 4. A map reflecting Bardarbunga's lava that erupted in the Holuhraun vent area between 29 August 2014 and about 15 January 2015 (shaded lens-shaped zone between the glacier and Askja volcano). The map shows the N margin of the Vatnajokull ice cap but Bardarbunga caldera lies 17 km off the map to lower left. The site of the eruptive fissure is in the vicinity of the orange bull's eye. Dyngjujokull glacier is an outlet glacier that forms a N-trending lobe streaming N and outward from the much larger Vatnajokull glacier. Note the E end of the new flow field following the drainage system (the Jökulsá á Fjöllum river). Image published online by the Icelandic Met Office (IMO) on 15 January 2015 (based, in part, on a NASA Landsat 8 image). |
The NE-trending dike reached an area outboard of the Vatnajokull ice cap at the Holuhraun volcanic field (figure 4), where the first clear eruption began on 29 August 2014. The fissure vent area was 4.5 km from the ice margin of the outlet glacier Dyngjujökull. The venting took place along an old fissure, and came out along an N-trending zone 600 m long. According to Gudmundsson and others (2014), that eruption was moderate and effusive.
Holuhraun is sometimes discussed in the context of Askja volcano (figure 4), which lies just to the N. Holuhraun is sometimes considered as peripheral vent system for Askja (Ialongo and others, 2015).
Figure 5 indicates the location of earthquakes during the first 16 days of dike emplacement (where days 1-16 correspond to 16-31 August 2014). Gudmundsson and others (2014) comment that "During this time, the dike generated some 17,000 earthquakes, more than produced in Iceland as a whole over a normal year." The venting to the surface at Holuhraun took place on 29 August 2014 and became strong by 31 August. In the early hours of the 29 August, the onset consisted of a minor, four-hour long, fissure eruption. The pattern on figure 5, depicting a 45-km-long dike injection along the rift system passing through Bardarbunga, testifies to the importance and utility of the seismograph in monitoring shallow magmatism leading to eruption.
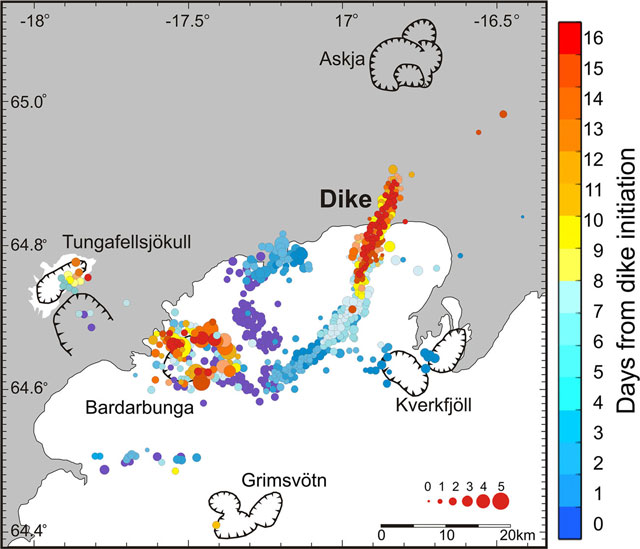 |
Figure 5. For the Bardarbunga eruption, earthquake locations during the first 16 days of the dike emplacement (16-31 August 2014). The word 'Dike' is located approximately where the fissure eruptions have taken place (at a volcanic field called Holuhraun). The white area is the Vatnajokull ice cap (including the associated Dyngjujokull outlet glacier; figure 4). Earthquake magnitudes are indicated in the lower right portion of the map. Taken from Gudmundsson and others (2014), based on preliminary data from IMO. |
According to IMO, seismic activity associated with Bardarbunga had gradually increased during the last seven years, although it temporarily diminished during the Grimsvotn eruption in May 2011. Vatnajokull GPS stations showed both upward and outward movements since early June 2014, and on 16 August 2014, the number of earthquakes significantly increased, with more than 300 earthquakes detected under the NW part of Vatnajokull ice cap (figure 5). As a result, the Aviation Color Code was increased to Yellow, the third level from the highest on a five color scale (Gray, Green, Yellow, Orange, and Red). On 18 August, IMO reported one earthquake swarm to the E and another swarm to the N of Bardarbunga. An M 4 earthquake occurred, the strongest in the region since 1996. By 18 August, 2,600 earthquakes had been detected at the volcano; earthquake locations from the E and N swarms had been migrating NE. In the evening of 18 August, earthquakes diminished in the N swarm. That same day the Aviation Color Code was raised to Orange.
According to IMO, GPS and seismic data during 20-26 August suggested that a NE-trending intrusive dike had increased from 25 to 40 km in length. During 22-26 August, several earthquakes in the 4.7-5.7 magnitude range had been detected at or near the volcano. These values were among the largest detected in the first few weeks of the swarm (Gudmundsson and others, 2014). The Aviation Color Code, chiefly Orange during this reporting interval, rose to the highest level, Red, several times during late August and September.
On 23 August seismic tremor indicated what IMO initially suggested was a small lava eruption at beneath the Dyngjujokull glacier (which is 150-400 m thick in this region). An overflight the next day found no evidence for an eruption.
On 27 August an overflight showed a 4- to 6-km-long row of cauldrons 10-15 m in diameter S of Bardarbunga.
Beginning on 31 August, lava erupted along a 1.5 km long fissure. During 1-2 September a white steam-and-gas plume rose to an altitude of 4.5 km and drifted 60 km NNE and ENE. Lava flowed N and lava fountains rose tens of meters. The number of earthquakes decreased from 500 earthquakes on 1 September to 300 earthquakes on 2 September. During the middle of September, seismicity persisted mainly around the caldera and the Dyngjujokull glacier.
On 2 September the lava had covered 4.2 km2 and was 4.5 km from the glacier's edge. By 3 September, the lava flow advanced ENE and covered 7.2 km2. The following day, the lava flow had an aerial extent of 10.8 km2. During 3-9 September, IMO observers noted ongoing lava effusion, high gas emissions, and elevated seismicity from the Holuhraun lava field. Ash production was almost negligible.
On 5 September, two new eruptive fissures were observed S of the main eruption site. These sites were less effusive and were located ~2 km from the edge of Dyngjujokull glacier (see this small shaded area in figure 2). The eruption also continued from the original fissure and generated a ~460 m high steam plume. Eventually, a row of craters formed along the eruptive fissure, the largest one was named Baugur crater.
The fissure eruption continued during 6-7 September, and the lava effusion rate was 100-200 m3/sec on 7 September (figures 6 and 7). Activity from the S fissures was less than that of the N fissure, which had been active since the beginning of the eruption. The advancing lava flow reached the W main branch of the Jökulsá á Fjöllum river (figure 4), which is fed by the icecap and exits the icecap ENE of the volcano. No explosive activity due to lava and river water interaction was observed, but steam rose from the area.
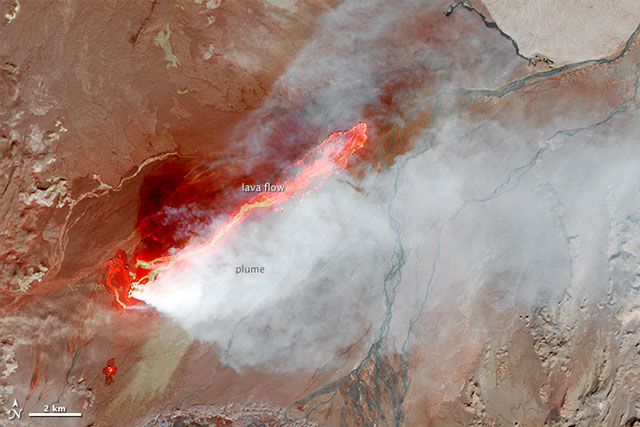 |
Figure 6. Lava fountaining, lava flows, and plumes emerging from Holuhraun on 6 September 2014, as viewed by NASA's Landsat 8. Much of the flow was in lava rivers on the surface during September. Courtesy of NASA Earth Observatory. |
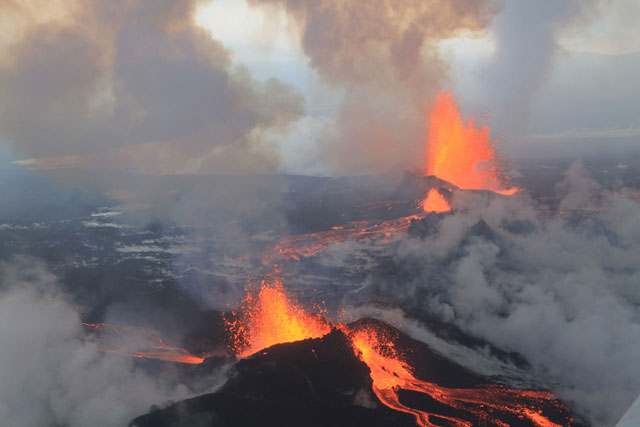 |
Figure 7. Aerial view Bardarbunga fissure eruptions taken on 4 September 2014. The fissure venting these eruptions is in Holuhraun lava field. Courtesy of Peter Hartree. |
During 8-9 September, activity was no longer detected from the southernmost fissure. Lava continued to advance and interact with the Jökulsá á Fjöllum river. The extent of the lava flow reached 19 km2 and gas emissions remained high.
During 10-16 September, lava flows continued to advance at a consistent rate toward the E and W. A report on 22 September noted that the total volume of the erupted lava was 0.4-0.6 km3 and the flow rate was 250-350 m3/sec. By 30 September, the lava field was 46 km2, and the main flow had entered the river bed of Jökulsá á Fjöllum and continued to follow the river's course. Steam rose from the river where the lava was in contact with water but no explosive activity occurred.
Although reporting noted a lack of tall mobile ash plumes blown towards Europe and causing air traffic delays, the plumes remained lower and more local causing widespread air quality problems in Iceland. IMO reported continued gas emissions that included elevated SO2 emissions during 10-16 September and issued warnings to the public in the municipality of Fjarðarbyggð (180 km ENE of Bardarbunga) on 13 September. These emissions persisted through at least November.
During 17-23 September, chemical analysis and geophysical modeling indicated that the source of the magma was at a depth of more than 10 km. On 21 September, field scientists estimated that about 90% of the SO2 from the eruption originated at the active craters and the rest rose from the lava field. Dead birds were also found around the eruption site.
Seismic activity at the N part of the dike and around the vents declined in October 2014, although the lava field continued to grow and lava production continued at the same output. On 5 October, a new lava front emerged at the S edge of the main lava flow and advanced E.
On 18 October, an M 5.4 earthquake struck in the N part of Bardarbunga caldera, one of the biggest earthquakes since the start of the eruption. The growing lava field at Holuhraun was 66 km2 by 31 October. By late October, the fissure's main vent (Baugur crater) had constructed a local topographic high that stood 80 m higher than the local landscape.
In November, eruption-associated seismicity remained strong although an IMO report on the 19th suggested that the number of large, M~5 events seemed to be decreasing. FLIR thermal images of the craters on 18 November showed that by then the most intense area of thermal convection was at a crater in the N part of the eruption site. On 20 November, observers characterized the eruption in the crater as pulsating explosions every 10-15 minutes, followed by a gush of lava down the main channel with splashing on either side. During 25-26 November, the activity was characterized as pulsating, with lava surging from the vent for 2-3 minutes at intervals of about 5-10 minutes. The upper parts of the lava channel developed a sinuous appearance owing to a series of bulges in the channel's margins.
On 12 November, IMO indicated that it monitored gas releases from Holuhraun using DOAS and FTIR instruments to estimate the fluxes of SO2 and other gases in the volcanic cloud. In the first month and a half of the eruption, the average flux was 400 kg/s (~35,000 metric tons per day, t/d) with peaks up to 1300 kg/s (~112,000 t/d). The IMO calculated that, assuming a constant release of gas through 12 November, the eruption had injected into the atmosphere an amount of SO2 in the range 3.5–11.2 Mega tons, Mt (depending on whether the computed from the average or the peak flux).
On 27 November, observers indicated that a plume rose 3.1 km above the sandy plain. A thermal image from 1 December showed several changes to the lava field. In just over 24 hours there was a new lava extrusion at the NE margin that had traveled 450 m. A new flow traveled N in an area just W of the lava lake. One or more new flows also developed S of the lava lake. The lava field from this eruption was just over 75 km2.
In early December, data also showed a decline in the eruption's intensity, although seismic activity remained strong. By 9 December, the lava field at Holuhraun had covered just over 76 km2, making its aerial extent the second largest in Iceland (but still considerably smaller than the largest historical field created by the Laki fissure eruption of 1783-1784). By 18 January 2015, the lava covered an area of 85 km2. A NASA photo of the lava flow is shown in figure 8. The vent area contained a lava lake, a large mass of highly radiant (molten, red-colored) lava.
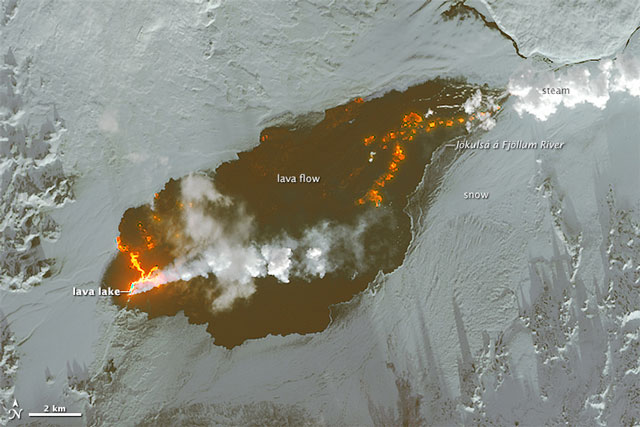 |
Figure 8. NASA image of the Bardarbunga eruption venting at Holuhraun on 3 January 2015, as captured by the Operational Land Imager on Landsat 8. According to the NASA caption, the false-color images combine shortwave infrared, near infrared, and red light. The dark area represents newly-formed basalt associated with the 2014-2015 eruption. The plume of steam and sulfur dioxide appears white, while fresh lava is bright orange. Courtesy of NASA Earth Observatory. |
According to the IMO, the ongoing eruption's very gas-rich emissions had affected the entire country. IMO stated that "we have to go 150 years back to find an event (Trölladyngja) that had a comparable impact on Iceland and its inhabitants, in terms of environmental and health issues."
Radar measurements of the flow field during a surveillance flight on 30 December 2014 provided preliminary evidence that lava thickness averaged ~10 m in the eastern part, ~12 m in the center, and at least 14 m in the western part. IMO indicated that the preliminary estimate of the lava volume was 1.1 km3. (A later estimate in 2015 took the volume to 1.4 km3, roughly 10% of the Laki fissure eruption.)
IMO reported that during 31 December-6 January fresh lava flowed N and also to the E where in part it transited through a closed channel (shallow lava tube). During 7-20 January 2015, IMO noted that the lava field expanded along its N and NE margins. Seismicity remained strong and local air pollution from gas emissions persisted. IMO said that on the days10 and 15 January the lava field covered 84.1 and 84.3 km2, respectively.
Figure 9 shows the eruption on 21 January 2015.
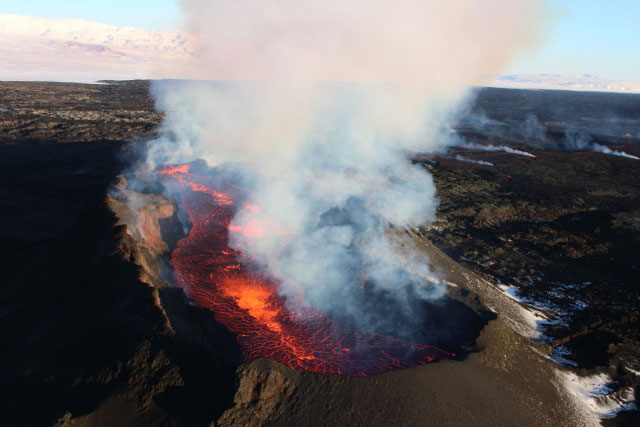 |
Figure 9. Photo taking on 21 January 2015 showing the Bardarbunga' eruption site at Holuhraun, including fissure vent, crater, lava flow, and plumes. The margins of the flow field are distinct in the distance, owing to snow cover. The main body of the flow field lies off the photo's margin to the right. Courtesy of IMO (Morten S. Riishuus). |
Subsidence. The caldera had been subsiding during the reporting period. The subsidence at Bardarbunga caldera was visible on the ice surface and was interpreted as reflecting deformation of the caldera itself. The depression developed in a roughly bowl-shape area that, as of 20 January 2015, was about 80 km2 in area with a volume exceeding 1.5 km3.
Figure 10 shows the chronology of subsidence levels between 5 September 2014 and 30 December 2014. The subsidence in the center of the caldera was about 60 m by 20 January 2015, a value determined by comparing the ice surface elevation with that elevation at the same location before the beginning of the collapse. Gudmundsson states that the assumption is that the ice surface lies more or less passively on top of the bedrock in the caldera. As of 20 January, no evidence of major ice melting had been observed; however, increased geothermal activity on the caldera rims has resulted in ice depressions over the hot spots. Other ice depressions on the Dyngjujokull glacier were also observed, suggesting that small, short sub-glacial eruptions may have occurred there. According to Gunnar Gudmundsson, there was no evidence of a subglacial eruption within the caldera.
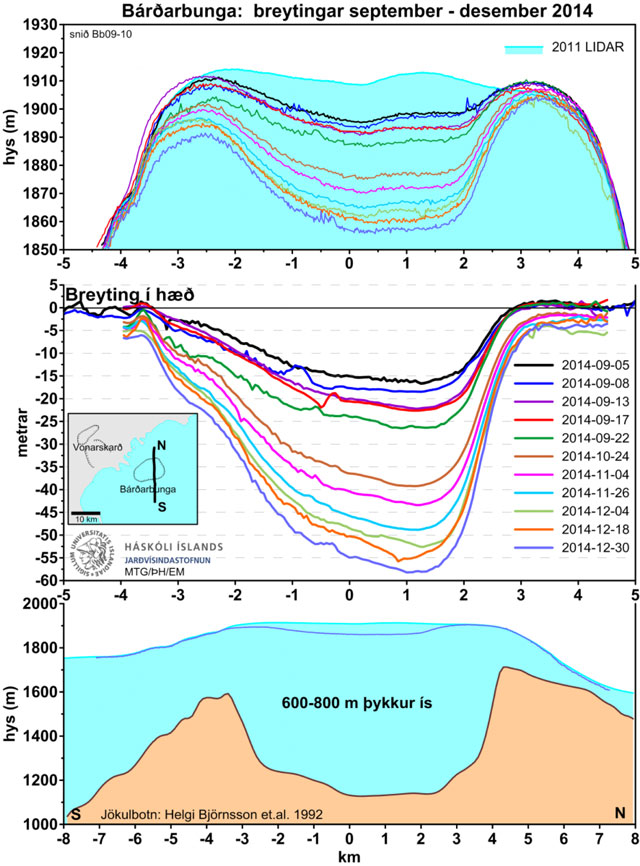 |
Figure 10. Topographic profiles plotted along a line across Bardarbunga's caldera for 5 September-30 December 2014. The N-trending profile crosses the E-central caldera (see inset on middle panel). The ice surface (top of light blue area) was constrained by lidar in 2011. The y-axis terms hys (m) and metrar refer to elevation and subsidence (both in meters). Subsidence (colored lines) was measured by a GPS station on the glacier surface in the caldera's center and by radar altimetry from aircraft. The bottom profile shows the overall picture with the caldera's surface and the 30 December 2014 profile (maximum subsidence). Courtesy of the Institute of Earth Sciences, University of Iceland (Magnus Gudmundsson and Thordis Hognadottir). |
During early December, IMO reported that the Scientific Advisory Board of the Icelandic Civil Protection had reviewed data from the beginning of the eruption to 3 December. They acknowledged that the subsidence rate had decreased during that time, dropping from highs of up to 80 cm/day down to 25 cm/day, with most of the subsidence concentrated at the caldera center.
References. Björnsson, H. and Einarsson, P., 1990, Volcanoes beneath Vatnajokull, Iceland: Evidence from radio echo-sounding, earthquakes and j kulhlaups, Jökull, no. 40, pp 147-168.
Carrivick, J and Gertisser, R, 2014, Bardabunga: eruption develops in Iceland, Geology Today, v. 30, Issue 6, pp. 205-206, November/December 2014, John Wiley & Sons Ltd.
Einarsson, P., B. Brandsdóttir, M. T. Gudmundsson, H. Björnsson, K. Grínvold, and F. Sigmundsson, 1997, Center of the Iceland hotspot experiences volcanic unrest, Eos Trans. AGU, 78(35),369–375, doi:10.1029/97EO00237.
Einarsson, B., 2009, Jökulhlaups in Skaftá: A study of a jökulhlaup from the Western Skaftá cauldron in the Vatnajokull ice cap, Iceland, Thesis for Master of Science in Geophysics degree, School of Engineering and Natural Sciences, Faculty of Sciences, University of Iceland, (URL: https://notendur.hi.is/~mtg/nemritg/BE-MS_2009.pdf)
Gudmundsson, A, Lecoeur, N, Mohajeri, N, and Thordarson, T, 2014, Dike emplacement at Bardarbunga, Iceland, induces unusual stress changes, caldera deformation, and earthquakes. Bulletin of Volcanology, vol. 76, no. 10, pp. 1-7.
Hartley, M. E., and Thordarson, T., 2013, The 1874–1876 volcano-tectonic episode at Askja, North Iceland: Lateral flow revisited. Geochemistry, Geophysics, Geosystems, vol. 14, no. 7, pp. 2286-2309.
Ialongo, I., Hakkarainen, J., Kivi, R., Anttila, P., Krotkov, N. A., Yang, K., & Tamminen, J., 2015, Validation of satellite SO2 observations in northern Finland during the Icelandic Holuhraun fissure eruption. Atmospheric Measurement Techniques Discussions, vol. 8, no. 1, pp. 599-621.
Institute of Earth Sciences (IES), 1996, The Gjálp eruption in Vatnajokull 30/9 - 13/10 1996, Institute of Earth Sciences (IES), University of Iceland, Accessed on 31 March 2015 (URL: http://earthice.hi.is/gjalp_eruption_vatnajokull_309_1310_1996) .
Larsen, G. and Gudmundsson, M. T., 2014, Volcanic system: Bárðarbunga system, pre-publication extract from the Catalogue of Icelandic Volcanoes, Accessed on 4 April 2015, (URL: http://blog.snaefell.de/images/Bardarbunga_kafli20140825.pdf).
Icelandic Meteorological Office, 2010, List of recent volcanic eruptions in Iceland, Accessed on 31 March 2015 (URL: http://en.vedur.is/earthquakes-and-volcanism/articles/nr/1874).
Marteinsson, V.T., Rúnarsson, Á., Stefánsson, A., Thorsteinsson, T., Jóhannesson, T., Magnússon, S.H., Reynisson, E., Einarsson, B., Wade, N., Morrison, H., and Gaidos, E., 2013, Microbial communities in the subglacial waters of the Vatnajokull ice cap, Iceland, The ISME Journal, vol. 7, pp. 427–437, doi:10.1038/ismej.2012.97, (URL: http://www.nature.com/ismej/journal/v7/n2/full/ismej201297a.html).
Seibert, L., Simkin, T., and Kimberly, P., 2010, Volcanoes of the World (Third Edition), pp. 204-205, University of Cailfornia Press, ISBN 978-0-520-26877-7.
Information Contacts: Icelandic Met Office (IMO) (URL: http://en.vedur.is/); London Volcanic Ash Advisory Centre (URL: http://www.metoffice.gov.uk/aviation/vaac/); Institute of Earth Sciences (IES), University of Iceland (URL: http://earthice.hi.is); Pall Einarsson, IES, University of Iceland; Gunnar Gudmundsson, IMO; Magnus Tumi Gudmundsson, IES, University of Iceland (URL: http://earthice.hi.is); National Commissioner of Police, Department of Civil Protection and Emergency Management (URL: http://avd.is/en/):NASA Earth Observatory (URL: http://earthobservatory.nasa.gov); Peter Hartree, Reykjavik, Iceland (UR: https://web.peterhartree.co.uk/).
Eruption ceases on 28 February 2015
This report extends our recent coverage of Bardarbunga (BGVN 39:10) by discussing activity between 7 January 2015 and 1 May 2015, although the eruption ceased on 28 February 2015. Most of the information below is based on reports from the Icelandic Met Office (IMO), with ancillary information from other agencies as noted. For sources other than the IMO reports shown in the reference list, see the websites provided in the "Information contacts" section at the end of this report. In general, the information sources there closely coincides with the date range of interest. The eruption began at Holuhraun on 31 August 2014 (BGVN 39:10).
IMO reports for January 2015 noted that activity at Bárdarbunga's Holuhraun lava field grew slightly along its N and NE margins. The lava field covered 84.1 km2on 10 January, 84.3 km2 on 15 January, and 84.7 km2 on 22 January. Seismicity remained strong, for example, an earthquake swarm occurred on 29 January 2015. (Specific numbers of earthquakes appear in some IMO reporting, although no plot has emerged with graphical depiction of earthquakes in this reporting interval such as figure 5 in BGVN 39:10.) Local air pollution from gas emissions persisted. GPS measurements showed that subsidence continued. As measured on the ice surface, total subsidence of the Bárdarbunga surface between mid-August 2014 and the end of January 2015 was 61 m. During this period, IMO maintained an Aviation Colour Code of Orange (the second highest on a five-color scale).
IMO noted that on 21 January, "Handheld meters, carried by scientist near the eruptive site . . . showed SO2 concentrations of 29 ppm and 14 ppm. This is in concordance with the sulphur veils apparent from the aircraft and is reminiscent of the circumstances in SE Iceland [on] 28 October 2014. Since 1 ppm is about 3000 μg/m³ [micrograms per cubic meter ] this refers to concentrations of 87,000 μg/m³ and 42,000 μg/m³ respectively. For comparison, see values in the table compiled by the Environment Agency of Iceland and the Directorate of Health."
According to the Environmental Agency of Iceland, an SO2 concentration above 14,000 μg/m3 is the most hazardous of six health hazard categories; the Agency advises that serious respiratory symptoms are to be expected. More specifically, the Agency states that when SO2 concentrations exceed 14,000 μg/m3, residents should remain indoors, close the windows, and shut down air conditioning.
The Institute of Earth Sciences (IES) at the University of Iceland provided a map prepared on 21 January showing that the lava field was thickening and not spreading significantly; the volume of erupted lava was an estimated 1.4 km3 (15% uncertainty)(figure 11). An IMO report on 27 January stated that the average rate of lava emission during the previous three weeks had been just less than 100 m3 per second, taken by the report authors as a sign that the eruption intensity was slowly decreasing. On 27 January, a plume rose to an estimated height of 1.3 km above the plain.
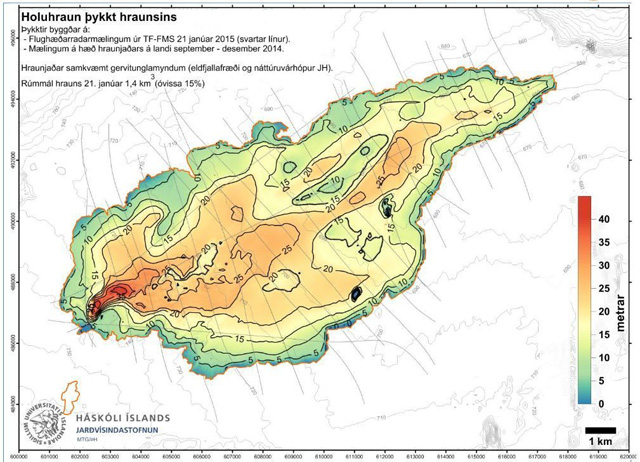 |
Figure 11. Map of the new lava from Bardarbunga, prepared on 21 January 2015. During January, the lava thickened, without extending much further. Numbers indicate the thickness (m) which is also color-coded (legend on right). Courtesy of Institute of Earth Sciences (IES), University of Iceland. |
On 6 February, IMO issued a statement that eruptive activity had decreased visibly during the previous two weeks, although seismicity was still strong. Lower seismicity continued during 11-19 February with many days of over a dozen earthquakes and seismic activity ranging up to M 4.3. On 14 February, the lava field covered 85 km2; measurements of the lava field's size on 4 and 12 February found no significant change.
An IES report issued on 20 February 2015 for 17-19 February 2015 noted "There is only one active vent inside the crater and the surface of the molten lava continues to sink. The lava channel has crusted over, except the 200-300 m nearest to the vent. The eruption column reaches no more than 1000 m above ground. The photos below show breakouts 15–16 km ENE of the vent, fed by the closed lava pathway which is inflating the lava field."
According to the IMO, a lava tube continued to feed the N and NE parts of Holuhraun, inflating the lava field. They also noted a reduced rate of effusion no longer sustained active breakouts in an area 17-18 km ENE from the vent.
A 24 February report noted that the rate of subsidence at Bardarbunga caldera was less than 2 cm per day. (IMO cautioned that care was needed with the interpretation of these data, given that GPS measurements are affected by ice flowing slowly into the caldera.) The eruption rate decreased substantially, and seismic activity continued to decrease although it was still considered strong.
IMO reported that a 27 February 2015 evening overflight found no visible incandescence at Holuhraun. According to FLIR thermal measurements, the radiant heat was greatest from the crater's rim, and lesser from the crater's depths. A gas detector in flight showed a maximum concentration of 0.5 ppm SO2, and a maximum concentration of 0.4 ppm when tested on the ground at the SW edge of the lava field. Glowing areas were observed in the NE part of the lava field; the maximum temperature detected was 560°C (compared to 1,200°C earlier). Radar measurements showed that the extent of the lava field had not increased since mid-February. (Data from SENTINEL-1 radar image 0741 UTC 27 February 2015 and helicopter flight, 1515 UTC 27 February 2015). According to IMO, experience with other lava-bearing eruptions suggested that the Holuhraun lava field would continue to emit gas for a long time. Without buoyant rise, driven by thermal emission from an active vent, the gases would remain low (near the ground surface). Therefore, IMO expected even greater concentrations of gas than residents had previously seen.
IMO reported that the eruption at the fissure of Bárdarbunga's Holuhraun, which began on 31 August 2014 ended on 28 February 2015. The Aviation Colour Code was lowered to Yellow.
IMO scientists conducted a field study on 3-4 March 2015, and found no signs of activity, other than a diffuse bluish haze at ground level across the lava field (figure 12). The IMO scientists reported that the crater rim had several cracks at the very edge, and while standing close to the crater rim it was possible to hear rumbling due to movements of rocks/solidified lava inside the crater.
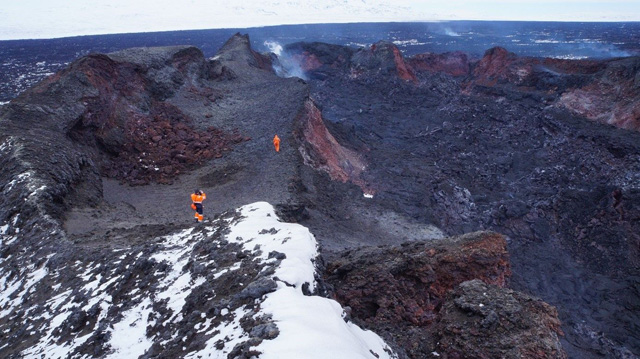 |
Figure 12. Photo of IMO geologists inside the Baugur crater on 4 March 2015. From the photo it appears that the vent discharging the lava is in the distance at the far end of the crater (area with white plume). According to the IMO caption, the photo was taken from the central part of Baugur crater as viewed looking along it to the N. The encrusted surface of the lava lake has collapsed, its remains seen as coarse, black rubble at the crater floor. On the crater floor, observers saw small vents sporadically discharging bluish gas. Part of the crater rim seen on the right side had broken, providing an outlet onto the lava field beyond. The resulting lava channel was about 50 m wide and 40 m deep. Courtesy of IMO (Ármann Höskuldsson; taken from IMO's March-April 2015 report). |
In early March maximum CO (carbon monoxide) and SO2 concentrations, measured with personal sensors near and at the crater rim, were 3 ppm and 2.5 ppm, respectively. A multiGAS instrument at the crater rim measured concentrations of SO2, CO2, H2S, and H2 for about 30 minutes, and provided ratios of CO2/SO2, H2O/SO2, and H2O/CO2 of 17, 101, and 6, respectively. The scientists noted that comparing the CO2/SO2 ratio with previous measurements showed a clear increase, consistent with the end of an eruption. The maximum concentrations measured with the MultiGAS instrument were at the level of 30 ppm for SO2 (the concentration at which the instrument saturates). For CO2 and H2S, the respective measurements were 700 ppm and 5 ppm. The level of SO2 was measured with an automatic gas detector, as reported by the Science Advisory Board of the Icelandic Civil Protection and disseminated by the Icelandic Commissioner of the Icelandic Police, as 500 µg/m3 (~0.5 ppm). Blönduós is a town and municipality in the North of Iceland situated on Route 1 at the mouth of the glacial river, Blanda. The report of the Police contained a links to a Gas Forecast and a Gas Model and involved scientists from the IMO and the IES along with representatives from the Icelandic Civil Protection, the Environmental Agency of Iceland and the Directorate of Health. The area to the SW and S of Blönduós was reported as possibly affected on the day following the measurement.
On 26 April, IMO lowered the Aviation Color Code to Green (the second lowest level), stating that no further signs of unrest had been noted since the end of the eruption on 28 February. Seismicity both within the caldera and the associated dyke intrusion continued to decline.
References.IMO, 2015 (January), Bárðarbunga 2015-January events, Seismic and volcanic events, 1-31 January, Icelandic Meteorological Office Accessed on 31 March 2015 (URL: http://en.vedur.is/earthquakes-and-volcanism/articles/nr/3071 ) (accessed May 2015).
IMO, 2015 (February), Bárðarbunga 2015-February events, Seismic and volcanic events, 1-28 February, Icelandic Meteorological Office Accessed on 31 March 2015 (URL: http://en.vedur.is/earthquakes-and-volcanism/articles/nr/3087 ) (accessed May 2015).
Information Contacts: Icelandic Met Office (IMO) (URL: http://en.vedur.is/); Institute of Earth Sciences (IES), University of Iceland (URL: http://earthice.hi.is); National Commissioner of Police, Department of Civil Protection and Emergency Management (URL: http://avd.is/en/); and The Environmental Agency of Iceland (URL: http://www.ust.is/the-environment-agency-of-iceland).
Monitoring data from early 2016
The fissure eruption from the Bardarbunga volcanic system began on 29 August 2014 (BGVN 39:10) about 45 km NE of the subglacial caldera at what was designated the Holuhraun vent. Lava emission ended on 28 February 2015 (BGVN 40:01), after creating a lava field almost 85 km2 in size. This report includes additional information provided by the Icelandic Meterological Office and NASA's Earth Observatory. Information from a report of the Icelandic Civil Protection Scientific Advisory Board, which met on 23 June 2016 to review recent data, is included below.
A scientific team working on the Vatnajökull glacier during 3-10 June 2016 did echo soundings to examine whether changes in bedrock topography within the Bardarbunga caldera could be detected from the recent eruption. No changes in the bedrock topography were apparent. There were also no indications that meltwater was accumulating within the caldera. The 65-m-deep depression in the glacier formed during the 2014-2015 activity was getting shallower due to the flow of ice into the caldera and snow accumulation, and the depression had decreased in depth by 8 m since the previous year.
Expedition scientists also measured gas emissions at ice cauldrons (figures 13 and 14), which are formed by subglacial geothermal activity, along the caldera rim; these measurements showed little change since the previous year's expedition. Seismic data showed that accumulated moment magnitude had been increasing since mid-September 2015. A total of 51 earthquakes stronger than M3 had been registered at Bardarbunga since the end of the eruption in 2015. GPS stations showed slow movement away from the caldera.
|
Figure 13. The edge of a cauldron at the southernmost rim of the Bardarbunga caldera, 10 June 2016. Photo by Benedikt G. Ófeigsson; courtesy of the IMO. |
|
Figure 14. A panorama view from 7 June 2016 shows the same cauldron at Bardarbunga, with Grimsvotn in the background. Photo by Benedikt G. Ófeigsson; courtesy of the IMO. |
The Advisory Board report concluded that the most probable explanations for the ground deformation and seismicity was the inflow of magma from around 10-15 km below Bardarbunga into the area from which the magma erupted at Holuhraun during 2014-2015. There were no indications of magma collecting at shallower depths.
An image posted by the NASA Earth Observatory showed the extent of the Holuhraun lava field on 5 November 2016 surrounded by snow (figure 15).
|
Figure 15. Acquired 5 November 2016, this image was captured by the Advanced Land Imager on the Earth Observing-1 satellite at 1000 local time. The photo has been edited to correct for the low angle of the Sun, which caused the white snow to appear reddish. Snow does appear to build up along the edges of the lava flow, where the lava is thinner. Courtesy NASA Earth Observatory. |
Information Contacts: Icelandic Met Office (IMO), Reykjavík, Iceland (URL: http://en.vedur.is/); NASA Earth Observatory, EOS Project Science Office, NASA Goddard Space Flight Center, Goddard, Maryland, USA (URL: http://earthobservatory.nasa.gov/).
|
|
||||||||||||||||||||||||||
There is data available for 44 confirmed eruptive periods.
2014 Aug 29 - 2015 Feb 27 Confirmed Eruption (Explosive / Effusive) VEI: 0
| Episode 1 | Eruption (Explosive / Effusive) | Holuhraun vent, 45 km NE | |||||||||||||||||||||||||||||||||||||||||||||||||||||||||||||||||||||||||||||||||||||||||||||||||||||||||||||||||||||||||||||||||||||||||||||||||||||||||||||||||||||||||||||||||||||||||||||||||||||||||||||||||||||||||||||||||||||||||||||||||||||||||||||||||||||||
|---|---|---|---|---|---|---|---|---|---|---|---|---|---|---|---|---|---|---|---|---|---|---|---|---|---|---|---|---|---|---|---|---|---|---|---|---|---|---|---|---|---|---|---|---|---|---|---|---|---|---|---|---|---|---|---|---|---|---|---|---|---|---|---|---|---|---|---|---|---|---|---|---|---|---|---|---|---|---|---|---|---|---|---|---|---|---|---|---|---|---|---|---|---|---|---|---|---|---|---|---|---|---|---|---|---|---|---|---|---|---|---|---|---|---|---|---|---|---|---|---|---|---|---|---|---|---|---|---|---|---|---|---|---|---|---|---|---|---|---|---|---|---|---|---|---|---|---|---|---|---|---|---|---|---|---|---|---|---|---|---|---|---|---|---|---|---|---|---|---|---|---|---|---|---|---|---|---|---|---|---|---|---|---|---|---|---|---|---|---|---|---|---|---|---|---|---|---|---|---|---|---|---|---|---|---|---|---|---|---|---|---|---|---|---|---|---|---|---|---|---|---|---|---|---|---|---|---|---|---|---|---|---|---|---|---|---|---|---|---|---|---|---|---|---|---|---|---|---|---|---|---|---|---|---|---|---|---|---|---|---|---|---|---|---|
| 2014 Aug 29 - 2015 Feb 27 | Evidence from Observations: Reported | |||||||||||||||||||||||||||||||||||||||||||||||||||||||||||||||||||||||||||||||||||||||||||||||||||||||||||||||||||||||||||||||||||||||||||||||||||||||||||||||||||||||||||||||||||||||||||||||||||||||||||||||||||||||||||||||||||||||||||||||||||||||||||||||||||||||
|
List of 51 Events for Episode 1 at Holuhraun vent, 45 km NE
|
||||||||||||||||||||||||||||||||||||||||||||||||||||||||||||||||||||||||||||||||||||||||||||||||||||||||||||||||||||||||||||||||||||||||||||||||||||||||||||||||||||||||||||||||||||||||||||||||||||||||||||||||||||||||||||||||||||||||||||||||||||||||||||||||||||||||
[ 2008 Aug 16 ± 15 days ] Uncertain Eruption
| Episode 1 | Eruption (Explosive / Effusive) | Loki-Fögrufjöll (West Loki cauldron) | |||||||||||||||||||||||
|---|---|---|---|---|---|---|---|---|---|---|---|---|---|---|---|---|---|---|---|---|---|---|---|---|
| 2008 Aug 16 ± 15 days - Unknown | Evidence from Unknown | |||||||||||||||||||||||
|
List of 3 Events for Episode 1 at Loki-Fögrufjöll (West Loki cauldron)
|
||||||||||||||||||||||||
[ 2006 Apr 16 ± 15 days ] Uncertain Eruption
| Episode 1 | Eruption (Explosive / Effusive) | Loki-Fögrufjöll (East Loki cauldron) | |||||||||||||||||||||||
|---|---|---|---|---|---|---|---|---|---|---|---|---|---|---|---|---|---|---|---|---|---|---|---|---|
| 2006 Apr 16 ± 15 days - Unknown | Evidence from Unknown | |||||||||||||||||||||||
|
List of 3 Events for Episode 1 at Loki-Fögrufjöll (East Loki cauldron)
|
||||||||||||||||||||||||
[ 2005 Jul 16 ± 15 days - 2005 Aug 16 ± 15 days ] Uncertain Eruption
| Episode 1 | Eruption (Explosive / Effusive) | Loki-Fögrufjöll (West Loki cauldron) | |||||||||||||||||||||||
|---|---|---|---|---|---|---|---|---|---|---|---|---|---|---|---|---|---|---|---|---|---|---|---|---|
| 2005 Jul 16 ± 15 days - 2005 Aug 16 ± 15 days | Evidence from Unknown | |||||||||||||||||||||||
|
List of 3 Events for Episode 1 at Loki-Fögrufjöll (West Loki cauldron)
|
||||||||||||||||||||||||
[ 2002 Jul 16 ± 15 days - 2002 Sep 16 ± 15 days ] Uncertain Eruption
| Episode 1 | Eruption (Explosive / Effusive) | Loki-Fögrufjöll (W and E Loki cauldrons) | |||||||||||||||||||||||
|---|---|---|---|---|---|---|---|---|---|---|---|---|---|---|---|---|---|---|---|---|---|---|---|---|
| 2002 Jul 16 ± 15 days - 2002 Sep 16 ± 15 days | Evidence from Unknown | |||||||||||||||||||||||
|
List of 3 Events for Episode 1 at Loki-Fögrufjöll (W and E Loki cauldrons)
|
||||||||||||||||||||||||
[ 2000 Aug 16 ± 15 days ] Uncertain Eruption
| Episode 1 | Eruption (Explosive / Effusive) | Loki-Fögrufjöll (W and E Loki cauldrons) | |||||||||||||||||||||||
|---|---|---|---|---|---|---|---|---|---|---|---|---|---|---|---|---|---|---|---|---|---|---|---|---|
| 2000 Aug 16 ± 15 days - Unknown | Evidence from Unknown | |||||||||||||||||||||||
|
List of 3 Events for Episode 1 at Loki-Fögrufjöll (W and E Loki cauldrons)
|
||||||||||||||||||||||||
[ 1997 Aug 16 ± 15 days ] Uncertain Eruption
| Episode 1 | Eruption (Explosive / Effusive) | Loki-Fögrufjöll (East Loki cauldron) | |||||||||||||||||||||||
|---|---|---|---|---|---|---|---|---|---|---|---|---|---|---|---|---|---|---|---|---|---|---|---|---|
| 1997 Aug 16 ± 15 days - Unknown | Evidence from Unknown | |||||||||||||||||||||||
|
List of 3 Events for Episode 1 at Loki-Fögrufjöll (East Loki cauldron)
|
||||||||||||||||||||||||
[ 1996 Aug 16 ± 15 days ] Uncertain Eruption
| Episode 1 | Eruption (Explosive / Effusive) | Loki-Fögrufjöll (West Loki cauldron) | |||||||||||||||||||||||
|---|---|---|---|---|---|---|---|---|---|---|---|---|---|---|---|---|---|---|---|---|---|---|---|---|
| 1996 Aug 16 ± 15 days - Unknown | Evidence from Unknown | |||||||||||||||||||||||
|
List of 3 Events for Episode 1 at Loki-Fögrufjöll (West Loki cauldron)
|
||||||||||||||||||||||||
[ 1995 Jul 16 ± 15 days ] Uncertain Eruption
| Episode 1 | Eruption (Explosive / Effusive) | Loki-Fögrufjöll (East Loki cauldron) | |||||||||||||||||||||||
|---|---|---|---|---|---|---|---|---|---|---|---|---|---|---|---|---|---|---|---|---|---|---|---|---|
| 1995 Jul 16 ± 15 days - Unknown | Evidence from Unknown | |||||||||||||||||||||||
|
List of 3 Events for Episode 1 at Loki-Fögrufjöll (East Loki cauldron)
|
||||||||||||||||||||||||
[ 1991 Aug 12 ] Uncertain Eruption
| Episode 1 | Eruption (Explosive / Effusive) | Loki-Fögrufjöll (East Loki cauldron) | |||||||||||||||||||||||
|---|---|---|---|---|---|---|---|---|---|---|---|---|---|---|---|---|---|---|---|---|---|---|---|---|
| 1991 Aug 12 - Unknown | Evidence from Unknown | |||||||||||||||||||||||
|
List of 3 Events for Episode 1 at Loki-Fögrufjöll (East Loki cauldron)
|
||||||||||||||||||||||||
[ 1986 Nov 29 - 1986 Dec 1 (?) ] Uncertain Eruption
| Episode 1 | Eruption (Explosive / Effusive) | Loki-Fögrufjöll (East Loki cauldron) | |||||||||||||||||||||||
|---|---|---|---|---|---|---|---|---|---|---|---|---|---|---|---|---|---|---|---|---|---|---|---|---|
| 1986 Nov 29 - 1986 Dec 1 (?) | Evidence from Unknown | |||||||||||||||||||||||
|
List of 3 Events for Episode 1 at Loki-Fögrufjöll (East Loki cauldron)
|
||||||||||||||||||||||||
1910 Jun 18 - 1910 Oct Confirmed Eruption (Explosive / Effusive) VEI: 2
| Episode 1 | Eruption (Explosive / Effusive) | Loki-Fögrufjöll (East Loki cauldron) | |||||||||||||||||||||||
|---|---|---|---|---|---|---|---|---|---|---|---|---|---|---|---|---|---|---|---|---|---|---|---|---|
| 1910 Jun 18 - 1910 Oct | Evidence from Observations: Reported | |||||||||||||||||||||||
|
List of 3 Events for Episode 1 at Loki-Fögrufjöll (East Loki cauldron)
|
||||||||||||||||||||||||
1902 Dec - 1903 Jun Confirmed Eruption (Explosive / Effusive) VEI: 2 (?)
| Episode 1 | Eruption (Explosive / Effusive) | Volcano Uncertain: Dyngjuhals ? | ||||||||||||||||||
|---|---|---|---|---|---|---|---|---|---|---|---|---|---|---|---|---|---|---|---|
| 1902 Dec - 1903 Jun | Evidence from Unknown | ||||||||||||||||||
|
List of 2 Events for Episode 1 at Volcano Uncertain: Dyngjuhals ?
|
|||||||||||||||||||
1872 (?) Confirmed Eruption (Explosive / Effusive)
| Episode 1 | Eruption (Explosive / Effusive) | Volcano Uncertain: Dyngjuhals ? | |||
|---|---|---|---|---|
| 1872 (?) - Unknown | Evidence from Unknown | |||
1862 Jun 30 - 1864 Oct 15 ± 45 days Confirmed Eruption (Explosive / Effusive) VEI: 2
| Episode 1 | Eruption (Explosive / Effusive) | Trollagigar | |||||||||||||||||||||||||||||||||
|---|---|---|---|---|---|---|---|---|---|---|---|---|---|---|---|---|---|---|---|---|---|---|---|---|---|---|---|---|---|---|---|---|---|---|
| 1862 Jun 30 - 1864 Oct 15 ± 45 days | Evidence from Observations: Reported | |||||||||||||||||||||||||||||||||
|
List of 5 Events for Episode 1 at Trollagigar
|
||||||||||||||||||||||||||||||||||
[ 1807 ] Uncertain Eruption
| Episode 1 | Eruption (Explosive / Effusive) | NW-Vatnajökull | |||
|---|---|---|---|---|
| 1807 - Unknown | Evidence from Unknown | |||
1797 Confirmed Eruption (Explosive / Effusive)
| Episode 1 | Eruption (Explosive / Effusive) | Volcano Uncertain | |||
|---|---|---|---|---|
| 1797 - Unknown | Evidence from Unknown | |||
1794 Confirmed Eruption (Explosive / Effusive)
| Episode 1 | Eruption (Explosive / Effusive) | ||||||||||||||
|---|---|---|---|---|---|---|---|---|---|---|---|---|---|---|
| 1794 - Unknown | Evidence from Observations: Reported | |||||||||||||
|
List of 1 Events for Episode 1
|
||||||||||||||
1769 Confirmed Eruption (Explosive / Effusive) VEI: 2
| Episode 1 | Eruption (Explosive / Effusive) | Volcano Uncertain: Bárdarbunga or Grímsvötn | |||||||||||||||||||||||
|---|---|---|---|---|---|---|---|---|---|---|---|---|---|---|---|---|---|---|---|---|---|---|---|---|
| 1769 - Unknown | Evidence from Unknown | |||||||||||||||||||||||
|
List of 3 Events for Episode 1 at Volcano Uncertain: Bárdarbunga or Grímsvötn
|
||||||||||||||||||||||||
1766 Jul Confirmed Eruption (Explosive / Effusive) VEI: 2
| Episode 1 | Eruption (Explosive / Effusive) | |||||||||||||||||||||||||||||
|---|---|---|---|---|---|---|---|---|---|---|---|---|---|---|---|---|---|---|---|---|---|---|---|---|---|---|---|---|---|
| 1766 Jul - Unknown | Evidence from Observations: Reported | ||||||||||||||||||||||||||||
|
List of 4 Events for Episode 1
|
|||||||||||||||||||||||||||||
1750 ± 10 years Confirmed Eruption (Explosive / Effusive)
| Episode 1 | Eruption (Explosive / Effusive) | |||||||||||||||||||
|---|---|---|---|---|---|---|---|---|---|---|---|---|---|---|---|---|---|---|---|
| 1750 ± 10 years - Unknown | Evidence from Sidereal: Ice Core | ||||||||||||||||||
|
List of 2 Events for Episode 1
|
|||||||||||||||||||
1739 Confirmed Eruption (Explosive / Effusive) VEI: 2
| Episode 1 | Eruption (Explosive / Effusive) | ||||||||||||||||||||||||
|---|---|---|---|---|---|---|---|---|---|---|---|---|---|---|---|---|---|---|---|---|---|---|---|---|
| 1739 - Unknown | Evidence from Sidereal: Ice Core | |||||||||||||||||||||||
|
List of 3 Events for Episode 1
|
||||||||||||||||||||||||
1729 Confirmed Eruption (Explosive / Effusive) VEI: 1
| Episode 1 | Eruption (Explosive / Effusive) | Volcano Uncertain: Dyngjuhals ? | ||||||||||||||||||||||||||||
|---|---|---|---|---|---|---|---|---|---|---|---|---|---|---|---|---|---|---|---|---|---|---|---|---|---|---|---|---|---|
| 1729 - Unknown | Evidence from Unknown | ||||||||||||||||||||||||||||
|
List of 4 Events for Episode 1 at Volcano Uncertain: Dyngjuhals ?
|
|||||||||||||||||||||||||||||
1726 Feb 1 ± 30 days - 1726 May 1 ± 30 days Confirmed Eruption (Explosive / Effusive) VEI: 1 (?)
| Episode 1 | Eruption (Explosive / Effusive) | Dyngjujökull, Dyngjuhal ? | |||||||||||||||||||||||
|---|---|---|---|---|---|---|---|---|---|---|---|---|---|---|---|---|---|---|---|---|---|---|---|---|
| 1726 Feb 1 ± 30 days - 1726 May 1 ± 30 days | Evidence from Observations: Reported | |||||||||||||||||||||||
|
List of 3 Events for Episode 1 at Dyngjujökull, Dyngjuhal ?
|
||||||||||||||||||||||||
1720 Confirmed Eruption (Explosive / Effusive) VEI: 2
| Episode 1 | Eruption (Explosive / Effusive) | ||||||||||||||||||||||||
|---|---|---|---|---|---|---|---|---|---|---|---|---|---|---|---|---|---|---|---|---|---|---|---|---|
| 1720 - Unknown | Evidence from Sidereal: Ice Core | |||||||||||||||||||||||
|
List of 3 Events for Episode 1
|
||||||||||||||||||||||||
1717 Aug 4 - 1717 Sep 17 (on or after) Confirmed Eruption (Explosive / Effusive) VEI: 3 (?)
| Episode 1 | Eruption (Explosive / Effusive) | ||||||||||||||||||||||||||||||||||
|---|---|---|---|---|---|---|---|---|---|---|---|---|---|---|---|---|---|---|---|---|---|---|---|---|---|---|---|---|---|---|---|---|---|---|
| 1717 Aug 4 - 1717 Sep 17 (on or after) | Evidence from Observations: Reported | |||||||||||||||||||||||||||||||||
|
List of 5 Events for Episode 1
|
||||||||||||||||||||||||||||||||||
1716 Oct 5 ± 4 days Confirmed Eruption (Explosive / Effusive) VEI: 2
| Episode 1 | Eruption (Explosive / Effusive) | ||||||||||||||||||||||||||||||||||
|---|---|---|---|---|---|---|---|---|---|---|---|---|---|---|---|---|---|---|---|---|---|---|---|---|---|---|---|---|---|---|---|---|---|---|
| 1716 Oct 5 ± 4 days - Unknown | Evidence from Observations: Reported | |||||||||||||||||||||||||||||||||
|
List of 5 Events for Episode 1
|
||||||||||||||||||||||||||||||||||
1712 Jan 15 ± 45 days Confirmed Eruption (Explosive / Effusive) VEI: 2
| Episode 1 | Eruption (Explosive / Effusive) | ||||||||||||||||||||||||||||||||||
|---|---|---|---|---|---|---|---|---|---|---|---|---|---|---|---|---|---|---|---|---|---|---|---|---|---|---|---|---|---|---|---|---|---|---|
| 1712 Jan 15 ± 45 days - Unknown | Evidence from Observations: Reported | |||||||||||||||||||||||||||||||||
|
List of 5 Events for Episode 1
|
||||||||||||||||||||||||||||||||||
1707 Confirmed Eruption (Explosive / Effusive) VEI: 2
| Episode 1 | Eruption (Explosive / Effusive) | ||||||||||||||||||||||||
|---|---|---|---|---|---|---|---|---|---|---|---|---|---|---|---|---|---|---|---|---|---|---|---|---|
| 1707 - Unknown | Evidence from Observations: Reported | |||||||||||||||||||||||
|
List of 3 Events for Episode 1
|
||||||||||||||||||||||||
1706 Confirmed Eruption (Explosive / Effusive) VEI: 2
| Episode 1 | Eruption (Explosive / Effusive) | ||||||||||||||||||||||||
|---|---|---|---|---|---|---|---|---|---|---|---|---|---|---|---|---|---|---|---|---|---|---|---|---|
| 1706 - Unknown | Evidence from Observations: Reported | |||||||||||||||||||||||
|
List of 3 Events for Episode 1
|
||||||||||||||||||||||||
1702 Confirmed Eruption (Explosive / Effusive) VEI: 2
| Episode 1 | Eruption (Explosive / Effusive) | Volcano Uncertain: Dyngjuhals ? | ||||||||||||||||||||||||||||
|---|---|---|---|---|---|---|---|---|---|---|---|---|---|---|---|---|---|---|---|---|---|---|---|---|---|---|---|---|---|
| 1702 - Unknown | Evidence from Unknown | ||||||||||||||||||||||||||||
|
List of 4 Events for Episode 1 at Volcano Uncertain: Dyngjuhals ?
|
|||||||||||||||||||||||||||||
1697 Confirmed Eruption (Explosive / Effusive) VEI: 2
| Episode 1 | Eruption (Explosive / Effusive) | |||||||||||||||||||||||||||||
|---|---|---|---|---|---|---|---|---|---|---|---|---|---|---|---|---|---|---|---|---|---|---|---|---|---|---|---|---|---|
| 1697 - Unknown | Evidence from Sidereal: Ice Core | ||||||||||||||||||||||||||||
|
List of 4 Events for Episode 1
|
|||||||||||||||||||||||||||||
1477 Feb (?) Confirmed Eruption (Explosive / Effusive) VEI: 6
| Episode 1 | Eruption (Explosive / Effusive) | Veidivötn (Veidivatnahraun) | |||||||||||||||||||||||||||||||||||||||||||
|---|---|---|---|---|---|---|---|---|---|---|---|---|---|---|---|---|---|---|---|---|---|---|---|---|---|---|---|---|---|---|---|---|---|---|---|---|---|---|---|---|---|---|---|---|
| 1477 Feb (?) - Unknown | Evidence from Observations: Reported | |||||||||||||||||||||||||||||||||||||||||||
|
List of 7 Events for Episode 1 at Veidivötn (Veidivatnahraun)
|
||||||||||||||||||||||||||||||||||||||||||||
1410 (?) Confirmed Eruption (Explosive / Effusive)
| Episode 1 | Eruption (Explosive / Effusive) | ||||
|---|---|---|---|---|
| 1410 (?) - Unknown | Evidence from Correlation: Tephrochronology | |||
1350 ± 10 years Confirmed Eruption (Explosive / Effusive)
| Episode 1 | Eruption (Explosive / Effusive) | |||||||||||||||||||
|---|---|---|---|---|---|---|---|---|---|---|---|---|---|---|---|---|---|---|---|
| 1350 ± 10 years - Unknown | Evidence from Sidereal: Ice Core | ||||||||||||||||||
|
List of 2 Events for Episode 1
|
|||||||||||||||||||
1290 ± 10 years Confirmed Eruption (Explosive / Effusive)
| Episode 1 | Eruption (Explosive / Effusive) | |||||||||||||||||||
|---|---|---|---|---|---|---|---|---|---|---|---|---|---|---|---|---|---|---|---|
| 1290 ± 10 years - Unknown | Evidence from Sidereal: Ice Core | ||||||||||||||||||
|
List of 2 Events for Episode 1
|
|||||||||||||||||||
1270 ± 10 years Confirmed Eruption (Explosive / Effusive)
| Episode 1 | Eruption (Explosive / Effusive) | |||||||||||||||||||
|---|---|---|---|---|---|---|---|---|---|---|---|---|---|---|---|---|---|---|---|
| 1270 ± 10 years - Unknown | Evidence from Sidereal: Ice Core | ||||||||||||||||||
|
List of 2 Events for Episode 1
|
|||||||||||||||||||
1250 ± 50 years Confirmed Eruption (Explosive / Effusive) VEI: 1
| Episode 1 | Eruption (Explosive / Effusive) | Frambuni | |||||||||||||||||||||||
|---|---|---|---|---|---|---|---|---|---|---|---|---|---|---|---|---|---|---|---|---|---|---|---|---|
| 1250 ± 50 years - Unknown | Evidence from Correlation: Tephrochronology | |||||||||||||||||||||||
|
List of 3 Events for Episode 1 at Frambuni
|
||||||||||||||||||||||||
1210 ± 10 years Confirmed Eruption (Explosive / Effusive)
| Episode 1 | Eruption (Explosive / Effusive) | |||||||||||||||||||
|---|---|---|---|---|---|---|---|---|---|---|---|---|---|---|---|---|---|---|---|
| 1210 ± 10 years - Unknown | Evidence from Sidereal: Ice Core | ||||||||||||||||||
|
List of 2 Events for Episode 1
|
|||||||||||||||||||
1159 (?) Confirmed Eruption (Explosive / Effusive)
| Episode 1 | Eruption (Explosive / Effusive) | ||||
|---|---|---|---|---|
| 1159 (?) - Unknown | Evidence from Observations: Reported | |||
1080 (?) Confirmed Eruption (Explosive / Effusive)
| Episode 1 | Eruption (Explosive / Effusive) | ||||
|---|---|---|---|---|
| 1080 (?) - Unknown | Evidence from Correlation: Tephrochronology | |||
0940 (?) Confirmed Eruption (Explosive / Effusive)
| Episode 1 | Eruption (Explosive / Effusive) | ||||
|---|---|---|---|---|
| 0940 (?) - Unknown | Evidence from Correlation: Tephrochronology | |||
0880 (?) Confirmed Eruption (Explosive / Effusive)
| Episode 1 | Eruption (Explosive / Effusive) | ||||||||||||||
|---|---|---|---|---|---|---|---|---|---|---|---|---|---|---|
| 0880 (?) - Unknown | Evidence from Correlation: Tephrochronology | |||||||||||||
|
List of 1 Events for Episode 1
|
||||||||||||||
0870 (?) Confirmed Eruption (Explosive / Effusive) VEI: 4
| Episode 1 | Eruption (Explosive / Effusive) | Vatnaöldur | ||||||||||||||||||||||||||||||||||||||
|---|---|---|---|---|---|---|---|---|---|---|---|---|---|---|---|---|---|---|---|---|---|---|---|---|---|---|---|---|---|---|---|---|---|---|---|---|---|---|---|
| 0870 (?) - Unknown | Evidence from Correlation: Tephrochronology | ||||||||||||||||||||||||||||||||||||||
|
List of 6 Events for Episode 1 at Vatnaöldur
|
|||||||||||||||||||||||||||||||||||||||
0150 ± 100 years Confirmed Eruption (Explosive / Effusive) VEI: 2 (?)
| Episode 1 | Eruption (Explosive / Effusive) | Veidivötn (Tjorvahraun) | ||||||||||||||||||||||||||||
|---|---|---|---|---|---|---|---|---|---|---|---|---|---|---|---|---|---|---|---|---|---|---|---|---|---|---|---|---|---|
| 0150 ± 100 years - Unknown | Evidence from Correlation: Tephrochronology | ||||||||||||||||||||||||||||
|
List of 4 Events for Episode 1 at Veidivötn (Tjorvahraun)
|
|||||||||||||||||||||||||||||
1200 BCE (?) Confirmed Eruption (Explosive / Effusive)
| Episode 1 | Eruption (Explosive / Effusive) | Veidivötn (Burfellshraun, Drekahraun) | |||||||||||||
|---|---|---|---|---|---|---|---|---|---|---|---|---|---|---|
| 1200 BCE (?) - Unknown | Evidence from Correlation: Tephrochronology | |||||||||||||
|
List of 1 Events for Episode 1 at Veidivötn (Burfellshraun, Drekahraun)
|
||||||||||||||
4200 BCE (?) Confirmed Eruption (Explosive / Effusive)
| Episode 1 | Eruption (Explosive / Effusive) | Veidvötn (Sigolduhraun THf) | |||||||||||||
|---|---|---|---|---|---|---|---|---|---|---|---|---|---|---|
| 4200 BCE (?) - Unknown | Evidence from Correlation: Tephrochronology | |||||||||||||
|
List of 1 Events for Episode 1 at Veidvötn (Sigolduhraun THf)
|
||||||||||||||
4400 BCE (?) Confirmed Eruption (Explosive / Effusive)
| Episode 1 | Eruption (Explosive / Effusive) | Veidvötn (Tungnaárhraun THe) | |||||||||||||
|---|---|---|---|---|---|---|---|---|---|---|---|---|---|---|
| 4400 BCE (?) - Unknown | Evidence from Correlation: Tephrochronology | |||||||||||||
|
List of 1 Events for Episode 1 at Veidvötn (Tungnaárhraun THe)
|
||||||||||||||
4550 BCE (?) Confirmed Eruption (Explosive / Effusive)
| Episode 1 | Eruption (Explosive / Effusive) | Veidivötn (Sigolduhraun, Kalfahraun) | |||||||||||||
|---|---|---|---|---|---|---|---|---|---|---|---|---|---|---|
| 4550 BCE (?) - Unknown | Evidence from Correlation: Tephrochronology | |||||||||||||
|
List of 1 Events for Episode 1 at Veidivötn (Sigolduhraun, Kalfahraun)
|
||||||||||||||
4600 BCE (?) Confirmed Eruption (Explosive / Effusive)
| Episode 1 | Eruption (Explosive / Effusive) | Veidvötn (Tungnaárhraun THd) | |||||||||||||
|---|---|---|---|---|---|---|---|---|---|---|---|---|---|---|
| 4600 BCE (?) - Unknown | Evidence from Correlation: Tephrochronology | |||||||||||||
|
List of 1 Events for Episode 1 at Veidvötn (Tungnaárhraun THd)
|
||||||||||||||
4800 BCE (?) Confirmed Eruption (Explosive / Effusive)
| Episode 1 | Eruption (Explosive / Effusive) | Veidvötn (Tungnaárhraun THc) | |||||||||||||
|---|---|---|---|---|---|---|---|---|---|---|---|---|---|---|
| 4800 BCE (?) - Unknown | Evidence from Correlation: Tephrochronology | |||||||||||||
|
List of 1 Events for Episode 1 at Veidvötn (Tungnaárhraun THc)
|
||||||||||||||
5000 BCE (?) Confirmed Eruption (Explosive / Effusive)
| Episode 1 | Eruption (Explosive / Effusive) | Trölladyngja | ||||||||||||||||||||||||||||
|---|---|---|---|---|---|---|---|---|---|---|---|---|---|---|---|---|---|---|---|---|---|---|---|---|---|---|---|---|---|
| 5000 BCE (?) - Unknown | Evidence from Correlation: Tephrochronology | ||||||||||||||||||||||||||||
|
List of 4 Events for Episode 1 at Trölladyngja
|
|||||||||||||||||||||||||||||
6650 BCE ± 50 years Confirmed Eruption (Explosive / Effusive)
| Episode 1 | Eruption (Explosive / Effusive) | Veidivötn (Thjorsarhraun) | ||||||||||||||||||
|---|---|---|---|---|---|---|---|---|---|---|---|---|---|---|---|---|---|---|---|
| 6650 BCE ± 50 years - Unknown | Evidence from Isotopic: 14C (calibrated) | ||||||||||||||||||
|
List of 2 Events for Episode 1 at Veidivötn (Thjorsarhraun)
|
|||||||||||||||||||
7050 BCE ± 1000 years Confirmed Eruption (Explosive / Effusive)
| Episode 1 | Eruption (Explosive / Effusive) | Veidivötn (Haahraun, Botnahraun) | |||||||||||||
|---|---|---|---|---|---|---|---|---|---|---|---|---|---|---|
| 7050 BCE ± 1000 years - Unknown | Evidence from Correlation: Tephrochronology | |||||||||||||
|
List of 1 Events for Episode 1 at Veidivötn (Haahraun, Botnahraun)
|
||||||||||||||
7100 BCE (?) Confirmed Eruption (Explosive / Effusive)
| Episode 1 | Eruption (Explosive / Effusive) | Trölladyngja (Bardarhalshraun) | |||||||||||||
|---|---|---|---|---|---|---|---|---|---|---|---|---|---|---|
| 7100 BCE (?) - Unknown | Evidence from Correlation: Tephrochronology | |||||||||||||
|
List of 1 Events for Episode 1 at Trölladyngja (Bardarhalshraun)
|
||||||||||||||
This compilation of synonyms and subsidiary features may not be comprehensive. Features are organized into four major categories: Cones, Craters, Domes, and Thermal Features. Synonyms of features appear indented below the primary name. In some cases additional feature type, elevation, or location details are provided.
Cones |
||||
| Feature Name | Feature Type | Elevation | Latitude | Longitude |
| Hamarinn | Stratovolcano | 1570 m | 64° 29' 0.00" N | 17° 48' 0.00" W |
| Loki-Fögrufjöll | Submarine cone | 1570 m | 64° 29' 0.00" N | 17° 48' 0.00" W |
| Trolladyngja | Shield volcano | 1459 m | 64° 54' 0.00" N | 17° 15' 0.00" W |
Craters |
||||
| Feature Name | Feature Type | Elevation | Latitude | Longitude |
| Askahraun | Fissure vent | 64° 27' 0.00" N | 18° 5' 0.00" W | |
| Brydjuhraun | Fissure vent | 64° 29' 0.00" N | 18° 3' 0.00" W | |
| Burfellshraun | Fissure vent | 64° 21' 0.00" N | 18° 25' 0.00" W | |
| Drekagigarod | Fissure vent | 728 m | 64° 14' 0.00" N | 18° 38' 0.00" W |
| Dvergahraun | Crater Row | 64° 21' 0.00" N | 18° 17' 0.00" W | |
| Dyngjuhals | Fissure vent | 64° 50' 0.00" N | 17° 17' 0.00" W | |
| Flagdahraun | Fissure vent | 64° 25' 0.00" N | 18° 37' 0.00" W | |
| Fogrufjöll | Fissure vent | |||
| Fontur | Fissure vent | 732 m | 64° 15' 0.00" N | 18° 39' 0.00" W |
| Grahahraun | Fissure vent | 64° 24' 0.00" N | 18° 31' 0.00" W | |
| Haahraun | Fissure vent | 64° 16' 0.00" N | 18° 38' 0.00" W | |
| Hagonguhraun | Fissure vent | 843 m | 64° 32' 0.00" N | 18° 12' 0.00" W |
| Hattur | Fissure vent | 640 m | 64° 9' 0.00" N | 18° 53' 0.00" W |
| Hnausagigarod | Fissure vent | 64° 2' 0.00" N | 19° 2' 0.00" W | |
| Hnausapollur | Crater | 64° 3' 0.00" N | 19° 2' 0.00" W | |
| Koldukvislarhraun | Fissure vent | 827 m | 64° 34' 0.00" N | 18° 5' 0.00" W |
| Ljosufjallahraun | Crater Row | 64° 18' 0.00" N | 18° 25' 0.00" W | |
| Ljotipollur | Crater | 720 m | 64° 2' 0.00" N | 19° 0' 0.00" W |
| Loki | Fissure vent | |||
| Madahraun | Fissure vent | 64° 15' 0.00" N | 18° 44' 0.00" W | |
| Sigolduhraun | Fissure vent | 64° 19' 0.00" N | 18° 39' 0.00" W | |
| Skeifuhraun | Fissure vent | 64° 11' 0.00" N | 18° 57' 0.00" W | |
| Svartikrokur | Crater Row | 600 m | 64° 4' 0.00" N | 18° 57' 0.00" W |
| Thorsarhraun | Fissure vent | 840 m | 64° 21' 0.00" N | 18° 25' 0.00" W |
| Throskuldshraun | Crater Row | 64° 14' 0.00" N | 18° 34' 0.00" W | |
| Trollagigar | Crater Row | 1020 m | 64° 27' 0.00" N | 18° 5' 0.00" W |
| Tungnarbotnahraun | Fissure vent | 64° 19' 0.00" N | 18° 16' 0.00" W | |
| Vatnaoldur | Crater Row | 899 m | 64° 7' 0.00" N | 18° 56' 0.00" W |
| Veidivötn | Crater Row | 920 m | 63° 57' 0.00" N | 19° 17' 0.00" W |
There are no samples for Bárðarbunga in the Smithsonian's NMNH Department of Mineral Sciences Rock and Ore collection.
| Catalogue of Icelandic Volcanoes (Link to Bárðarbunga) | The Catalogue of Icelandic Volcanoes is an interactive, web-based tool, containing information on volcanic systems that belong to the active volcanic zones of Iceland. It is a collaboration of the Icelandic Meteorological Office (the state volcano observatory), the Institute of Earth Sciences at the University of Iceland, and the Civil Protection Department of the National Commissioner of the Iceland Police, with contributions from a large number of specialists in Iceland and elsewhere. This official publication is intended to serve as an accurate and up-to-date source of information about active volcanoes in Iceland and their characteristics. The Catalogue forms a part of an integrated volcanic risk assessment project in Iceland GOSVÁ (commenced in 2012), as well as being part of the effort of FUTUREVOLC (2012-2016) on establishing an Icelandic volcano supersite. |
| Copernicus Browser | The Copernicus Browser replaced the Sentinel Hub Playground browser in 2023, to provide access to Earth observation archives from the Copernicus Data Space Ecosystem, the main distribution platform for data from the EU Copernicus missions. |
| MIROVA | Middle InfraRed Observation of Volcanic Activity (MIROVA) is a near real time volcanic hot-spot detection system based on the analysis of MODIS (Moderate Resolution Imaging Spectroradiometer) data. In particular, MIROVA uses the Middle InfraRed Radiation (MIR), measured over target volcanoes, in order to detect, locate and measure the heat radiation sourced from volcanic activity. |
| MODVOLC Thermal Alerts | Using infrared satellite Moderate Resolution Imaging Spectroradiometer (MODIS) data, scientists at the Hawai'i Institute of Geophysics and Planetology, University of Hawai'i, developed an automated system called MODVOLC to map thermal hot-spots in near real time. For each MODIS image, the algorithm automatically scans each 1 km pixel within it to check for high-temperature hot-spots. When one is found the date, time, location, and intensity are recorded. MODIS looks at every square km of the Earth every 48 hours, once during the day and once during the night, and the presence of two MODIS sensors in space allows at least four hot-spot observations every two days. Each day updated global maps are compiled to display the locations of all hot spots detected in the previous 24 hours. There is a drop-down list with volcano names which allow users to 'zoom-in' and examine the distribution of hot-spots at a variety of spatial scales. |
|
WOVOdat
Single Volcano View Temporal Evolution of Unrest Side by Side Volcanoes |
WOVOdat is a database of volcanic unrest; instrumentally and visually recorded changes in seismicity, ground deformation, gas emission, and other parameters from their normal baselines. It is sponsored by the World Organization of Volcano Observatories (WOVO) and presently hosted at the Earth Observatory of Singapore.
GVMID Data on Volcano Monitoring Infrastructure The Global Volcano Monitoring Infrastructure Database GVMID, is aimed at documenting and improving capabilities of volcano monitoring from the ground and space. GVMID should provide a snapshot and baseline view of the techniques and instrumentation that are in place at various volcanoes, which can be use by volcano observatories as reference to setup new monitoring system or improving networks at a specific volcano. These data will allow identification of what monitoring gaps exist, which can be then targeted by remote sensing infrastructure and future instrument deployments. |
| Volcanic Hazard Maps | The IAVCEI Commission on Volcanic Hazards and Risk has a Volcanic Hazard Maps database designed to serve as a resource for hazard mappers (or other interested parties) to explore how common issues in hazard map development have been addressed at different volcanoes, in different countries, for different hazards, and for different intended audiences. In addition to the comprehensive, searchable Volcanic Hazard Maps Database, this website contains information about diversity of volcanic hazard maps, illustrated using examples from the database. This site is for educational purposes related to volcanic hazard maps. Hazard maps found on this website should not be used for emergency purposes. For the most recent, official hazard map for a particular volcano, please seek out the proper institutional authorities on the matter. |
| IRIS seismic stations/networks | Incorporated Research Institutions for Seismology (IRIS) Data Services map showing the location of seismic stations from all available networks (permanent or temporary) within a radius of 0.18° (about 20 km at mid-latitudes) from the given location of Bárðarbunga. Users can customize a variety of filters and options in the left panel. Note that if there are no stations are known the map will default to show the entire world with a "No data matched request" error notice. |
| UNAVCO GPS/GNSS stations | Geodetic Data Services map from UNAVCO showing the location of GPS/GNSS stations from all available networks (permanent or temporary) within a radius of 20 km from the given location of Bárðarbunga. Users can customize the data search based on station or network names, location, and time window. Requires Adobe Flash Player. |
| DECADE Data | The DECADE portal, still in the developmental stage, serves as an example of the proposed interoperability between The Smithsonian Institution's Global Volcanism Program, the Mapping Gas Emissions (MaGa) Database, and the EarthChem Geochemical Portal. The Deep Earth Carbon Degassing (DECADE) initiative seeks to use new and established technologies to determine accurate global fluxes of volcanic CO2 to the atmosphere, but installing CO2 monitoring networks on 20 of the world's 150 most actively degassing volcanoes. The group uses related laboratory-based studies (direct gas sampling and analysis, melt inclusions) to provide new data for direct degassing of deep earth carbon to the atmosphere. |
| Large Eruptions of Bárðarbunga | Information about large Quaternary eruptions (VEI >= 4) is cataloged in the Large Magnitude Explosive Volcanic Eruptions (LaMEVE) database of the Volcano Global Risk Identification and Analysis Project (VOGRIPA). |
| EarthChem | EarthChem develops and maintains databases, software, and services that support the preservation, discovery, access and analysis of geochemical data, and facilitate their integration with the broad array of other available earth science parameters. EarthChem is operated by a joint team of disciplinary scientists, data scientists, data managers and information technology developers who are part of the NSF-funded data facility Integrated Earth Data Applications (IEDA). IEDA is a collaborative effort of EarthChem and the Marine Geoscience Data System (MGDS). |
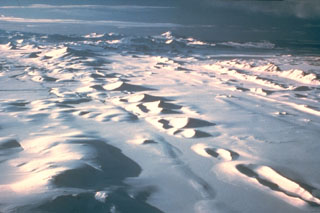 The Veidivötn fissure system, which extends about 100 km SW from Bárdarbunga volcano, has been the source of major eruptions during the Holocene. The approximately 60-km-long Vatnaöldur crater row, seen stretching across this image, formed during a major eruption on the southern part of the fissure system in about 877 CE. The explosive eruption produced large volumes of tephra and small lava flows. The peak on the center horizon is Hekla volcano.