A 29 December satellite image of Heard Island’s Big Ben volcano showed a thermal anomaly at the summit that was elongated to the SW. The anomaly narrowed and terminated at an area that was about 1 km from the summit, suggesting the presence of a lava flow.
Source: Sentinel Hub
Intermittent lava flows and persistent thermal anomalies during February 2022-January 2023
Heard is a remote island located in the southern Indian Ocean and consists of two volcanic structures: Big Ben and the smaller Mt. Dixon. The active Mawson Peak is located within a 5-6 km wide caldera breached to the SW side of Big Ben. Intermittent eruptions have occurred since 1910 and the most recent eruption began in September 2012 and has mainly been characterized by consistent thermal activity and lava flows (BGVN 47:02). Similar events are covered in this report during February 2022 through January 2023 primarily using various satellite data.
MIROVA (Middle InfraRed Observation of Volcanic Activity) analysis of MODIS satellite data showed that intermittent low-to-moderate thermal activity occurred during July 2022 through January 2023 (figure 51). Periods of increased thermal activity were recorded during late July through early August, late September through early October, mid-November, and early-to-mid-December. MODIS satellite instruments using the MODVOLC thermal algorithm also detected a total of 34 strong thermal hotspots on 15 March, 1 and 6 April, 29 May, 14, 20, 22, and 23 June, 10 and 12 August, 23 September, 11, 13, 15, and 26 November, 2, 6, and 8 December, and 11, 13, and 23 January 2023. On clear weather days, Sentinel-2 infrared satellite imagery also captured thermal activity at and near the summit of Mawson Peak (figure 52). A persistent thermal anomaly sometimes accompanied by gas-and-steam emissions was captured to the NW of Mawson Peak at a second vent on 4 and 17 February, 3 August, 15, 25 September, 15 October and at Mawson Peak on 4 June.
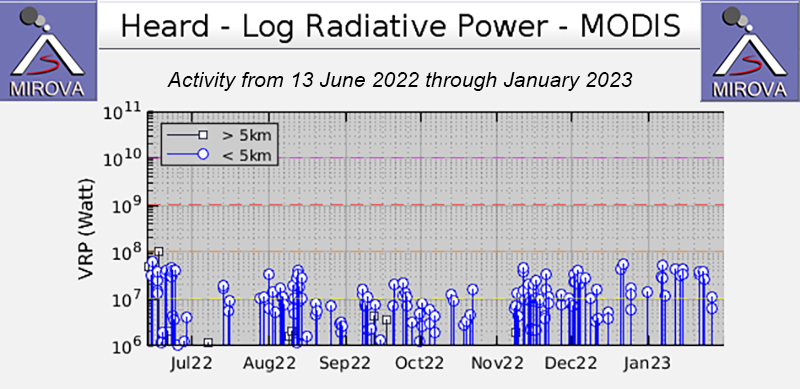 |
Figure 51. Intermittent low-to-moderate thermal activity was recorded at Heard during July 2022 through January 2023, according to this MIROVA graph (Log Radiative Power). Periods of more frequent thermal anomalies occurred during late July through early August, late September through early October, mid-November, and early December. Courtesy of MIROVA. |
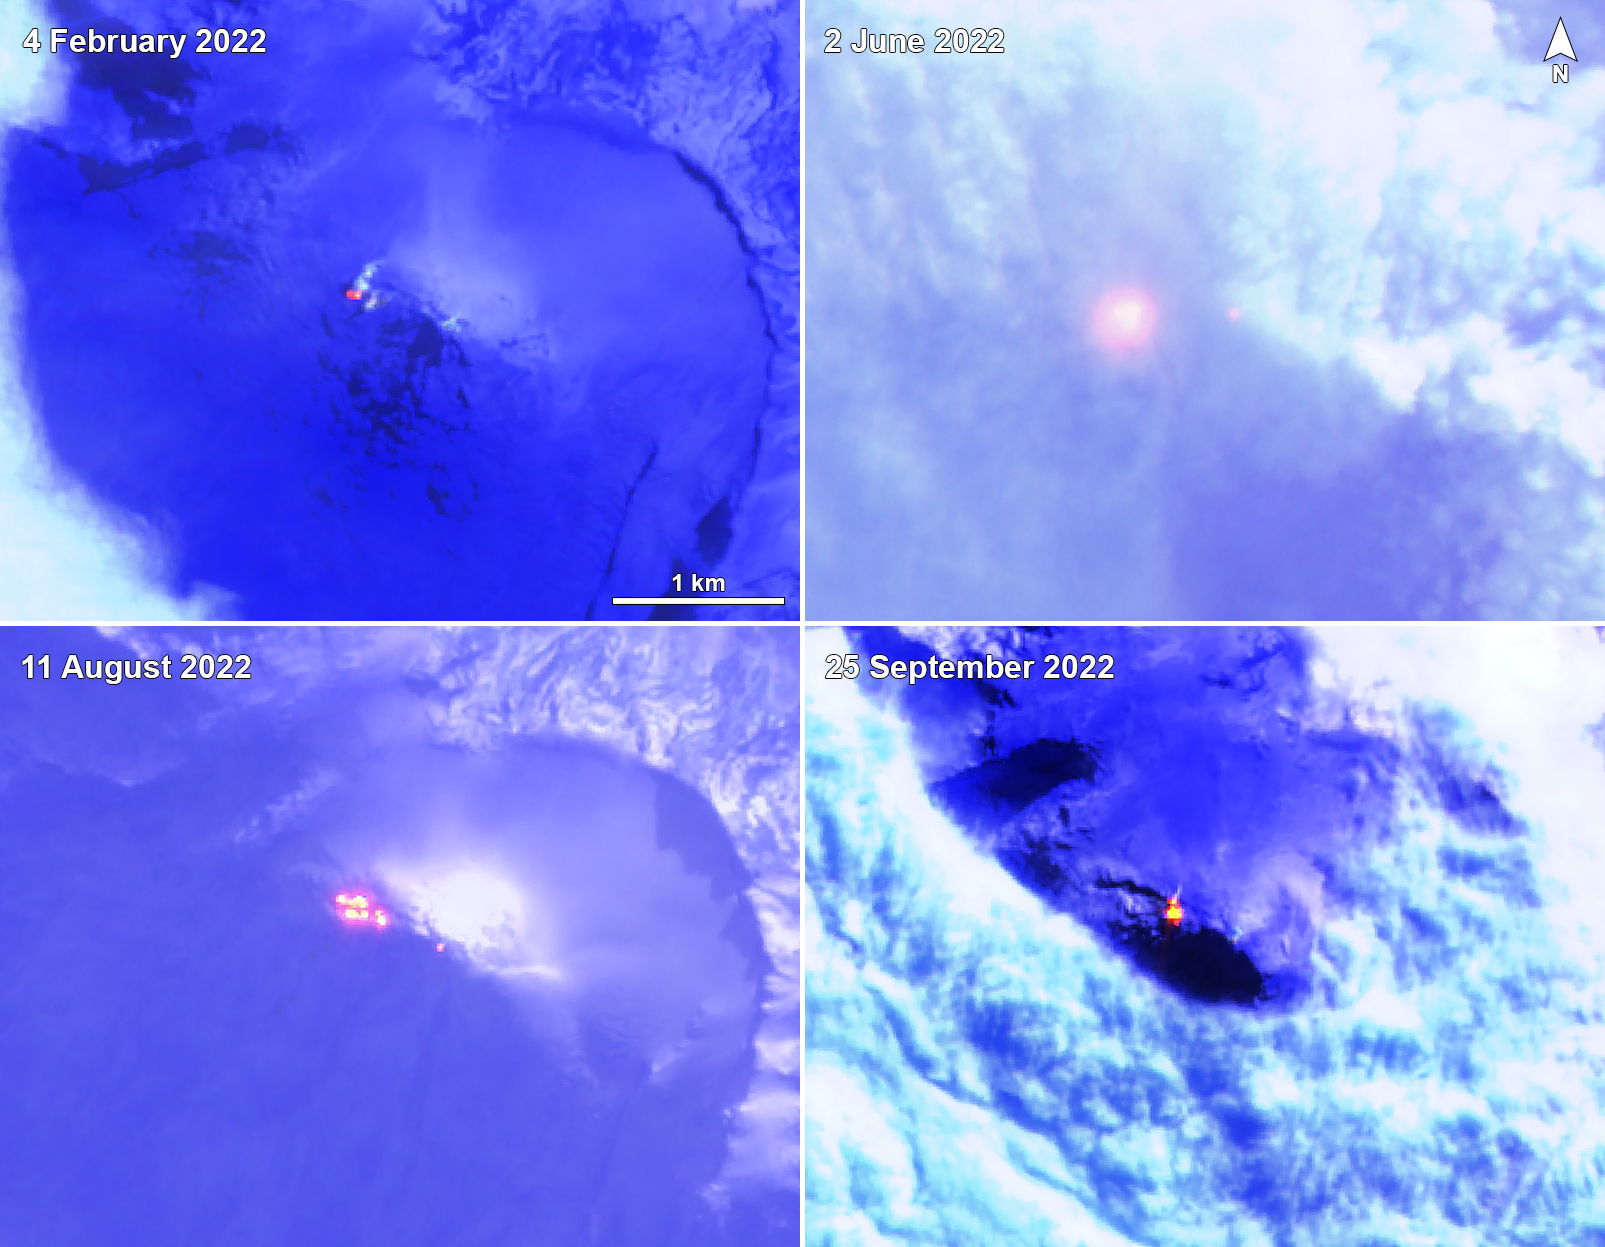 |
Figure 52. Sentinel-2 infrared satellite imagery of Heard Island’s Big Ben showed persistent thermal anomalies at the Mawson Peak summit crater and occasionally at a secondary vent to the NW of Mawson Peak on 4 February 2022 (top left), 2 June 2022 (top right), 11 August 2022 (bottom left) and 25 September 2022 (bottom right). Sentinel-2 satellite images with “Atmospheric penetration” (bands 12, 11, 8A) rendering. Courtesy of Sentinel Hub Playground. |
Stronger thermal anomalies indicative of active lava flows originated from the second NW flank vent and moved W and SW were captured in Sentinel-2 infrared satellite imagery 39 times on 11 and 31 March, 13 April, 3, 10, 13, 15, 18, 20, 25, and 30 May, 2, 12, 14, 17, 22, and 24 June, 2, 9, 17, and 24 July, 1, 6, 11, 13, and 31 August, 20 September, 2, 22, and 25 October, 9, 14, 16, 21, 24, and 26 November, 4 and 21 December, and 23 January; a hotspot was also detected over Mawson Peak, sometimes accompanied by gas-and-steam emissions (figure 53).
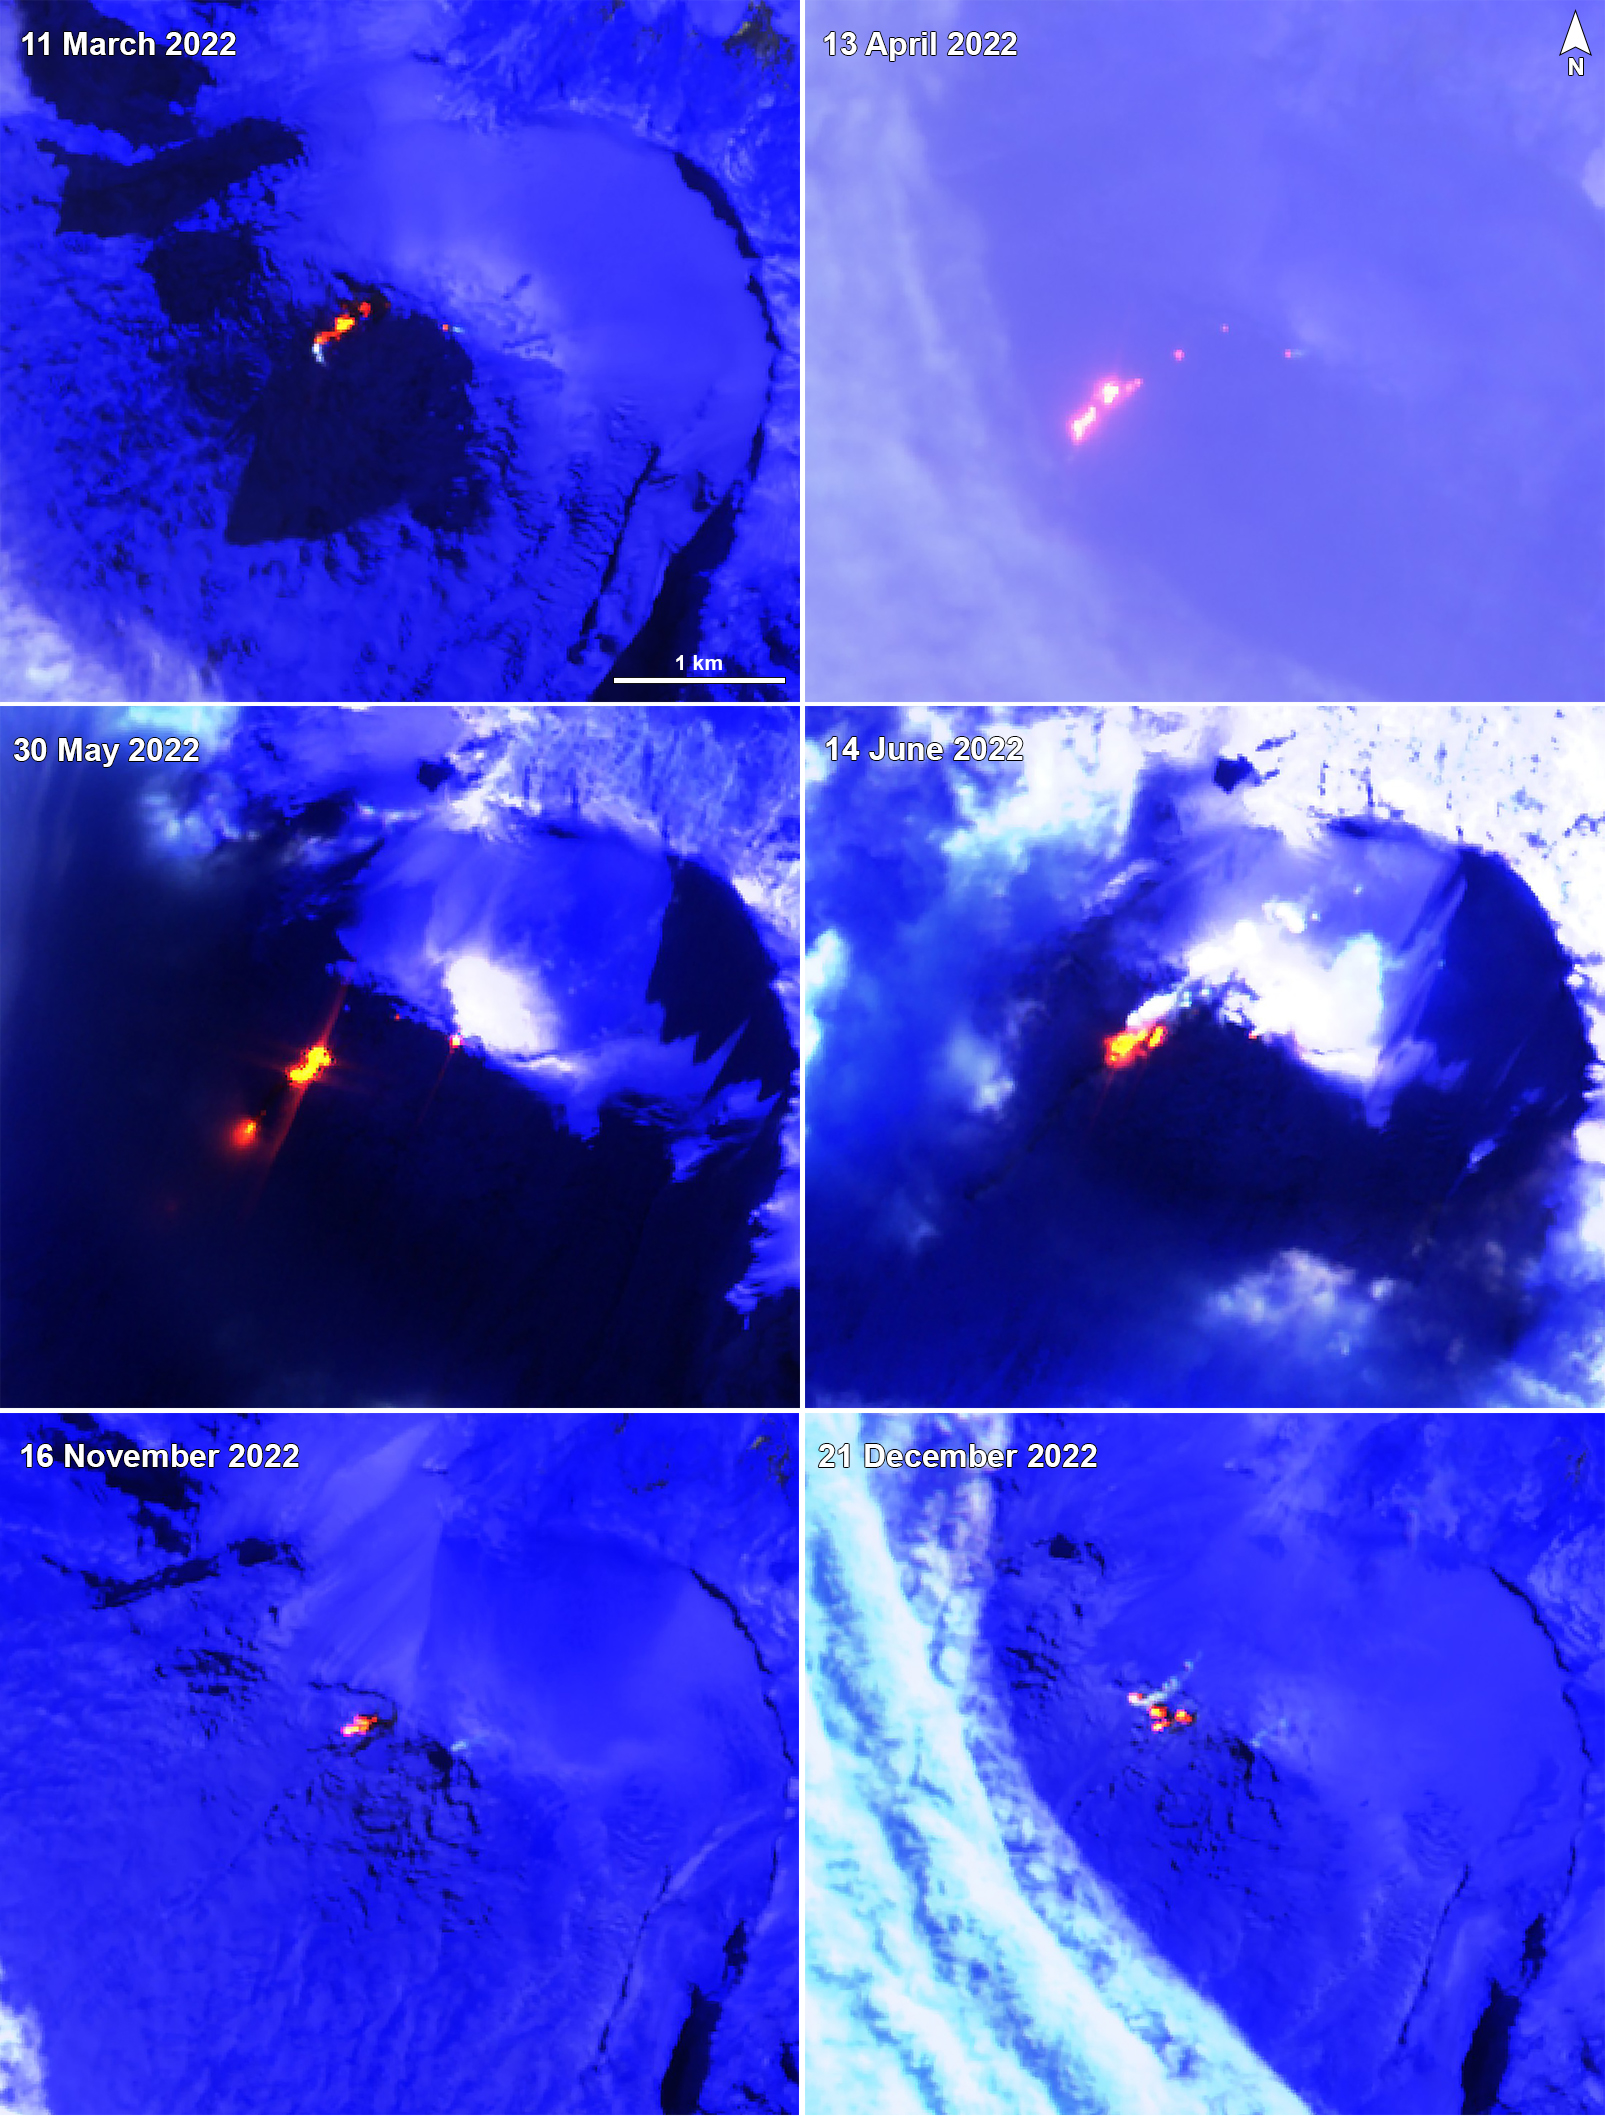 |
Figure 53. Sentinel-2 infrared satellite imagery of Heard Island’s Big Ben showed lava flow activity (bright yellow-orange) from the NW flank vent moving to the SW and W on 11 March 2022 (top left), 13 April 2022 (top right), 30 May 2022 (middle left), 14 June 2022 (middle right), 16 November 2022 (bottom left), and 21 December 2022 (bottom right). A secondary hotspot was detected above Mawson Peak on 11 March, 13 April, 30 May, and 14 June. Sentinel-2 satellite images with “Atmospheric penetration” (bands 12, 11, 8A) rendering. Courtesy of Sentinel Hub Playground. |
Information Contacts: MIROVA (Middle InfraRed Observation of Volcanic Activity), a collaborative project between the Universities of Turin and Florence (Italy) supported by the Centre for Volcanic Risk of the Italian Civil Protection Department (URL: http://www.mirovaweb.it/); Hawai'i Institute of Geophysics and Planetology (HIGP) - MODVOLC Thermal Alerts System, School of Ocean and Earth Science and Technology (SOEST), Univ. of Hawai'i, 2525 Correa Road, Honolulu, HI 96822, USA (URL: http://modis.higp.hawaii.edu/); Sentinel Hub Playground (URL: https://www.sentinel-hub.com/explore/sentinel-playground).
2023: December
2022: April
| November
2021: November
2016: January
2015: October
2014: November
2013: May
2012: October
2006: June
A 29 December satellite image of Heard Island’s Big Ben volcano showed a thermal anomaly at the summit that was elongated to the SW. The anomaly narrowed and terminated at an area that was about 1 km from the summit, suggesting the presence of a lava flow.
Source: Sentinel Hub
Satellite images of Heard Island’s Big Ben volcano showed thermal anomalies of varying intensity over Mawson Peak (the summit area) and on the NW flank on 9 and 14 November. Weather clouds prevented views of the volcano for the rest of the month. The thermal anomaly on 9 November consisted of three pixels that trended NE-SW from the summit. The activity on 14 November was visible as a larger anomaly over a vent or multiple vents about less than 1 km NW of the peak.
Source: Sentinel Hub
Satellite images of Heard Island’s Big Ben volcano showed thermal anomalies of varying intensity over Mawson Peak (the summit area) and on the NW flank during the previous month. Weather clouds prevented views of the volcano for 11 of the 14 acquisitions during 11 March-13 April. On 11 March a small thermal anomaly at the peak was visible along with a larger anomaly over a vent or multiple vents about 1 km W; the larger anomaly was elongated NE-SW, suggesting a lava flow. Multiple anomalies in the same areas were visible on 31 March and 13 April.
Source: Sentinel Hub
Thermal satellite images of Heard Island’s Big Ben volcano showed thermal anomalies of varying intensity over the summit area or on the NW and W flanks on 4, 11, 14, and 21 November. Weather clouds prevented views of the volcano on eight other acquisitions during the month. On 11 November four anomalies on the NW flank formed a “v” shape open to the NW, possibly indicating a branched lava flow. On 21 November the anomaly was on the W flank and possible emissions from the E and SE margins of it drifted SE.
Source: Sentinel Hub
Scientists and crew aboard CSIRO’s (Commonwealth Scientific and Industrial Research Organisation) Marine National Facility research vessel Investigator circled Heard Island and observed a plume rising from Mawson Peak’s crater and lava flows traveling down the NW flanks during 30-31 January. Visual observations of Heard are very rare due to its remote location. A MODVOLC thermal alert had been issued for 28 January.
Sources: Commonwealth Scientific and Industrial Research Organisation (CSIRO); NASA MODIS Rapid Response System
A plume from Heard was visible in a satellite image drifting SSW on 30 October.
Source: 557th Weather Wing, United States Air Force
According to a NOAA National Environmental Satellite, Data, and Information Service (NESDIS) scientist, thermal anomalies seemingly on the E flank of Heard were detected in Visible Infrared Imaging Radiometer Suite (VIIRS) satellite images during 2-30 November. Dense cloud cover prevented views of the volcano during 1-2 December. MODIS (Moderate Resolution Imaging Spectroradiometer) images had detected thermal anomalies from September [2013] to 21 July 2014, and again on 16 November 2014, due to a persisting lava lake and possible lava flows.
Sources: Michael J. Pavolonis (NOAA/NESDIS), personal communication; NASA MODIS Rapid Response System
According to NASA Earth Observatory (EO) an image acquired on 7 April from the Advanced Land Imager (ALI) on NASA's EO-1 satellite showed that Mawson's Peak crater on Heard Island had filled and a lava flow had traveled down the SW flank. The lava flow was visible in an image acquired on 20 April and had slightly widened just below the summit.
Source: NASA Earth Observatory
According to Volcano Live, satellite imagery of Heard Island showed thermal anomalies on 21 and 24 September, and 10 and 19 October. NASA's Earth Observatory reported that a satellite image acquired on 13 October showed a possible dark area in the summit crater of Mawson Peak and hot surfaces within the crater, indicating the presence of lava in or just beneath the crater.
Sources: Volcano Live; NASA Earth Observatory
From 11 March to 2 June, MODVOLC (a MODIS thermal alert system) detected approximately 10 alerts from or near the summit of Big Ben on Heard Island. The area of the thermal anomaly was 1 to 2 pixels in size (1 pixel=1 km).
Source: Hawai'i Institute of Geophysics and Planetology (HIGP) Thermal Alerts Team
Reports are organized chronologically and indexed below by Month/Year (Publication Volume:Number), and include a one-line summary. Click on the index link or scroll down to read the reports.
Lava flow from upper S flank vent; plume
During the night of 14-15 January, personnel of the French oceanographic mission Sibex (ship) observed an eruption on Heard Island. A lava flow emerged from a vent at ~ 2,750 m altitude, on the upper S flank (between Big Ben and Mawson, figure 1). For 2 days, a plume was visible from 32 km away. An image from the NOAA 7 polar orbiting satellite showed a diffuse plume extending SE from the island on 14 January at 1712. The plume was narrow over the island, widening over the ocean until obscured by weather clouds 20-25 km to the SE. The next day at 1658, NOAA 7 imagery showed that the island was free of weather clouds, but no volcanic plume was evident.
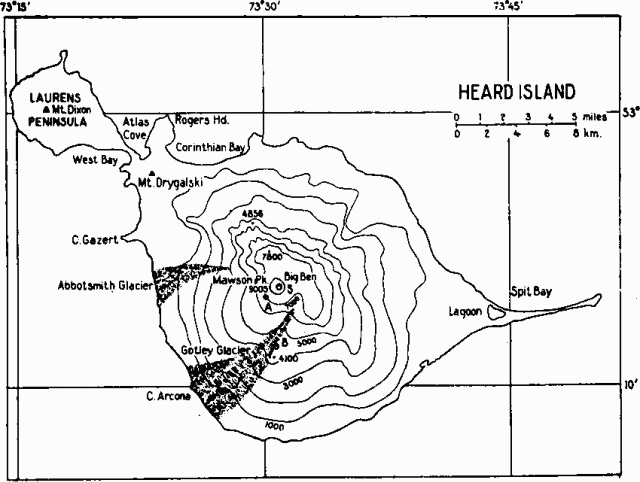 |
Figure 1.Sketch map of Heard Island. From Neumann van Padang (1963). |
Reference. Neumann van Padang, M., 1963, Catalog of active volcanoes of the world, Part XVI.
Information Contacts: J. Bull, Terres Australes et Antarctiques Françaises; A. Giret, Expeditions Polaires Françaises; J-L. Cheminée, IPG, Paris; W. Gould, NOAA.
Steam and two areas of glow
No further reports of volcanic activity on this remote, uninhabited island were received until 29 September, when scientists from the MV Nella Dan (ship) observed steam rising from a vertical crack in the Gotley Glacier (on the SW flank). On 4 October at about 2100, from 11.5 km offshore, two distinct areas of glow were observed: at the summit, and at a point between 1,500 and 2,000 m altitude in Gotley Glacier, 6.5-7 km from the summit. The observers believed the flank glow to be a second source of lava, although they noted the possibility that lava originating at the summit might have flowed under the glacier and emerged at that point. Space Shuttle astronauts observed the volcano emitting vapor every day during their 30 October-5 November mission and took a photograph (no. 61A-49-047), but there was no sign of fresh lava or ash on the summit.
Further Reference. Quilty, P., 1985, New volcanic vent on Heard Island?: ANARE News, December. 1985, p. 11.
Information Contacts: R. Varne, Univ. of Tasmania; M. Helfert, NASA.
Plumes and glow; volcano morphology and 1986-87 activity described; 1992 summit eruption
[The following from Graeme Wheller] includes observations of continued activity in late 1986 and early 1987, and a renewed eruption in 1992.
Volcano morphology. Heard Island consists of two volcanic cones, Big Ben and Mt. Dixon, joined by a narrow isthmus (figure 2). Both cones are young, but only Big Ben has been observed to erupt. Many young lavas, including two that are unvegetated, lie on the flanks of Mt. Dixon. The separation of the two volcanoes is evident from the contrasting petrographic, geochemical, and isotopic characteristics of their respective eruptives [(Barling and others, 1994)].
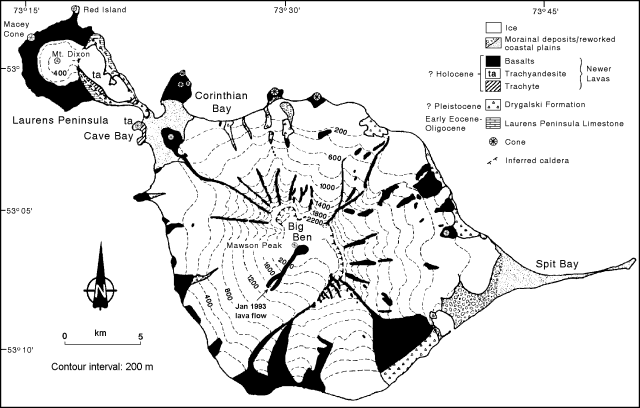 |
Figure 2.Geologic sketch map of Heard Island (after Barling, 1990) showing the location of the lava flow observed by Rod Ledingham in mid-January 1993. |
Big Ben is a large, glacier-covered, composite cone 20-25 km in diameter at sea-level, consisting mainly of basaltic lavas and lesser ash and scoria. Its summit region consists of a SW-facing semi-circular ridge 5-6 km in diameter, 2,200-2,400 m asl. The ridge appears to have formed from breaching of the SW flank of Big Ben, possibly by landsliding caused by seismicity or a laterally directed blast. The E, N, and W flanks of Big Ben have been deeply scoured by glacial erosion, forming high-standing radial ribs to 7-8 km long.
Eruptions have built a new regularly shaped cone, Mawson Peak, within the breached region of the summit. Mawson Peak is snow-and ice-covered on all sides, . . . and its SW flank slopes smoothly to the coast. All . . . historical volcanism has apparently originated at the summit of Mawson Peak.
Young volcanic deposits. Mt. Dixon, much smaller than Big Ben, appears to be the latest manifestation of volcanic activity that has created a peninsula 9 km long and up to 5 km wide extending from the NW side of Big Ben. Mt. Dixon, at the end of the peninsula, is a glacier-covered rounded cone 706 m tall. More than 20 separate relatively young basaltic lava flows have been identified on its flanks, including two that are largely vegetation-free and may have been erupted within the last few hundred years. These lavas have flowed from vents on the upper flanks of Mt. Dixon, except for one from a fissure marked by an elongate scoria ridge ~1 km long near the base of the S flank. A crater ~50 m in diameter occurs at the head of one W-flank flow ~1 km inland. Several small hornitos occur on the lava flow near this crater. One is still well-formed, ~2.5 m high and 3-4 m in diameter, but the others have largely collapsed. On the W and N flanks of Mt. Dixon, particularly near Red Island, trachytic lavas lie beneath the basalt lavas.
Eleven parasitic scoria cones and associated small basaltic lava flows occur around the coastline . . . . Some are at or near the edges of vertical sea cliffs, indicating that erosion by the sea may have obliterated other cones. The parasitic cones are typically ~100 m high and well-formed with deep central craters. Lava spatter usually occurs abundantly around the upper parts of the cones. Lavas produced from these vents are typically small-volume pahoehoe flows. From their morphology and relative lack of vegetation, the cones and their lavas may be only a few thousand years old. On Azorella Peninsula, the parasitic cone forms the W side of Corinth Head which, together with Rogers Head, appears to be a remnant of an older and much larger cone formed of thinly stratified leucocratic tuff. The basaltic flow erupted from the Corinth Head crater contains partly collapsed tumuli and lava tunnels.
A similarly youthful, trachytic, airfall (Plinian?) pumice deposit 1-1.5 m thick occurs at the E end of the island. The lower 0.5 m of the deposit is distinctly darker than the upper part, showing a sharp horizontal transition. The deposit is overlain by moraine but underlying material is not visible. Similar deposits are not known from any other parts of the island. Although it is primary deposit and must therefore have been produced by an eruption on Heard Island, the location of its originating vent is not known.
December 1986-January 1987 activity. A deep, well-formed crater at the top of Mawson Peak was discovered on helicopter overflights in December 1986 and January 1987, during the 1986/87 Heard Island ANARE. On 21 December, a brief landing was made on the summit beside the crater. The crater was cylindrical and, from visual estimates, ~40-50 m in diameter and 50-70 m deep, with vertical walls exposing dark horizontal ash layers thinly coated in yellow sulfur. The crater was floored by a black ropy lava surface in which small patches of red lava periodically appeared, indicating an active lava lake within the crater. Larger red patches, ~ 5-10 m across, appeared less frequently, accompanied by gentle emissions of a little blue smoke. Minor steam emission also occurred from around the crater rim and from a rocky area on the crater's E side. The crater appears to have been formed by the 1985/87 eruption because it was not seen by climbing parties that reached the summit of Mawson Peak in 1965 and 1983.
A new pahoehoe lava flow in a glacial valley on Mawson Peak's SW flank was also discovered during the 1986/87 ANARE. The flow extended ~8-9 km from the summit crater rim, where it exited through a deep V-shaped notch, to within 2-3 km of the coast (near Cape Arkona). Small amounts of steam emanated from parts of the flow, which probably formed in January 1985, as observed from the Marion Dufresne.
1992 summit activity. Satellite images and observations from the ANARE base revealed eruptive activity in 1992. Data from the NOAA 11 polar orbiter showed plumes extending 300 km NNE then E from the island on 17 January at about 1720, and 200 km NE the next day at 0300. Weather in the region is usually cloudy, and no other activity was evident . . . until a short-lived thermal anomaly was detected on 18 May at 2146. The ANARE team had not yet reached Heard Island on 17 January, but the summit area was visible for 20 days in March, 18 days in April, and 7 days in May (as of the 29th). Gas had been emerging from the summit during fieldwork in mid-1990, but no activity was evident in 1992 until 29 May, when an orange glow was first noticed above the mountain at 2130. The glow rapidly intensified and appeared to be pulsating, faded after about a minute, then reappeared a few minutes later. Three or four such cycles were observed, with glow intensity changing randomly. Glow faded for the last time at about 2200. Although some auroral activity occurred that night, none of the observers believed that it was the source of the glow. Activity was next reported on 8 June, when vapor began to emerge from the summit at about 1430, soon forming a plume to the SE. Mist soon obscured the activity. Traces of steam were also visible on 10 June.
Reference. Barling, J., 1990, Heard and McDonald Islands, in Le Masurier, W., and Thomson, J., eds., Volcanoes of the Antarctic Plate and southern Oceans: American Geophysical Union, Washington DC, p. 435-441.
Further References. Barling, J., Goldstein, S.L., and Nicholls, I.A., 1994, Geochemistry of Heard Island (southern Indian Ocean): characterisation of an enriched mantle component and implications for enrichment of sub-Indian Ocean mantle: Journal of Petrology, v. 35, p. 1017-1053.
Hilton, D.R., Barling, J., and Wheller, G.E., 1995, Effect of shallow-level contamination on the helium isotope systematics of ocean-island lavas: Nature, v. 373, p. 330-333.
Information Contacts: G. Wheller, CSIRO Division of Exploration Geoscience, Australia; R. Varne, Univ of Tasmania; A. Vrana, K. Green, and T. Jacka, Australian Antarctic Division, Tasmania; W. Gould, NOAA/NESDIS.
New lava flow on SW flank
Evidence of recent eruptive activity was observed by Rod Ledingham, a geologist aboard the cruise ship Kapitan Klebnikov, during a visit . . . in mid-January. Lava had emerged from a new wedge-shaped graben-like feature that extended roughly 150 m down the summit cone's SW flank (figure 2). The flow had divided into two lobes and advanced to below 1,400 m elevation, apparently along approximately the same path taken by the 1985-87 lava. Steam rose from its distal end, but the central part of the flow appeared to be lightly snow-covered. A narrow plume rose from the summit crater, and the area from there E to the caldera wall was covered with gray ash. Vapor was also rising from a fissure roughly 100 m below the summit.
A team of five biologists has been on the island for ~14 months, but weather conditions are poor and the start time of the eruption is uncertain. Attila Vrana, head of the team, reported a strongly felt earthquake on 19 December that was not documented by the Worldwide Standardized Seismic Net.
Information Contacts: P. Quilty, Australian Antarctic Division, Tasmania.
No evidence of recent activity in March
During 18-21 March geologists sampled Holocene lava flows on Heard Island. On beaches of the N Laurens Peninsula, they found fresh pumice ranging in size up to about 20 x 20 cm . The pumice was concentrated among other storm- transported debris a little distance above the normal surf zone and appeared to have been deposited by wave action. Light creamy green to pale gray in color, the pumice had angular, ovoid or flattened shapes and contained predominantly microphenocrysts and occasional phenocrysts visible to the naked eye. Lithic fragments were not observed.
On Heard Island, Big Ben's summit was usually obscured by clouds. The summit was visible on 20 March, however, and at this time no evidence of recent volcanic activity was observed at Mawson Peak, Big Ben's recently active crater (figure 3). Similarly no plume was seen coming from Heard when McDonald vented steam in early April. In accord with these observations, scientists inferred that the December 1996-January 1997 volcanic activity attributed to Heard actually denoted activity at McDonald.
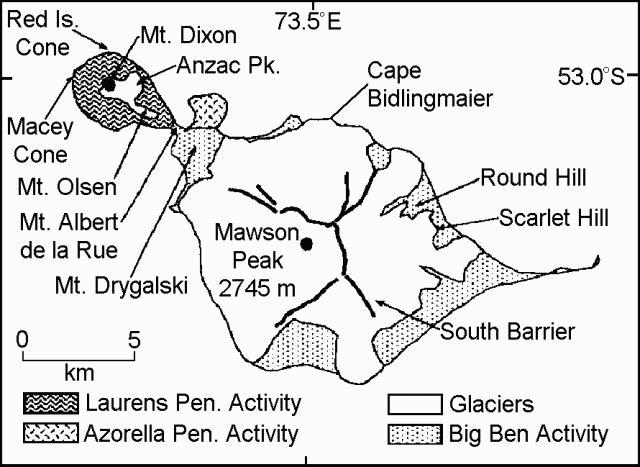 |
Figure 3. Map of Heard Island showing principal volcanic centers on both the Laurens and Azorella Peninsulas (see shaded boxes) and on Big Ben (the massif comprising the bulk of the SE part of the island). The beached pumice samples were collected at the N end of the Laurens Peninsula. Courtesy of K. Collerson. |
References. LeMasurier, W.E., and Thompson, J.W., primary eds., 1990, Volcanoes of the Antarctic Plate and Southern Oceans, Antarctic Research Series: American Geophysical Union, Washington, D. C. (ISBN 0066-4634).
Collerson, K. D., 1997, Field studies at Heard and McDonald Island in March 1997: unpublished Australian National Antarctic Research Expedition (ANARE) report.
Information Contacts: Kenneth Collerson, Department of Earth Sciences, University of Queensland, Brisbane, Queensland 4072, Australia; Kevin Kiernan, Department of Geography and Environmental Sciences, University of Newcastle, Newcastle, New South Wales 2300, Australia; Richard Williams, Australian Antarctic Division, Channel Highway, Hobart, Tasmania, Australia; Andrew Tupper, Northern Territory Regional Forecasting Centre, Bureau of Meteorology, P. O. Box 735, Darwin, Northern Territory 0801, Australia.
Discovery of a distinct vent below Mawson Peak; brown fumes in November
Activity from Mawson Peak, a discrete volcanic cone that lies atop Big Ben stratovolcano, was observed by the Australian National Antarctic Research Expedition (ANARE) during October-November 2000. Frequent cloud cover obscured Big Ben.
On 19 October, workers observed several hours of fumarolic activity from the RSV Aurora Australis while 2-3 km off the N shore of Heard Island between Corinthian and Spit Bays. Gaseous emissions were rising at least 200 m above the summit. During the early morning of 20 October, those aboard the ship observed similar continuing activity until clouds obscured the view. From the Red Island area at the W end of Heard Island, on 28 October strong fumarolic activity was seen emanating from the summit of Mawson Peak. Observers suggested the presence of a second emission point on the S slopes 100-200 m below the summit.
On 9 November, a helicopter flyover of Mawson Peak revealed that the crater and lava lake observed in 1987 were no longer visible. Instead, the summit had the form of a steep, irregular ice dome with gases venting through its apex (figure 4). The flyover also confirmed an apparently distinct area of activity 150-200 m below Mawson Peak near the head of Lied Glacier (Kiernan and McConnell, 2000). This newly discovered area was separated from the summit vent by several hundred meters of clean, white ice.
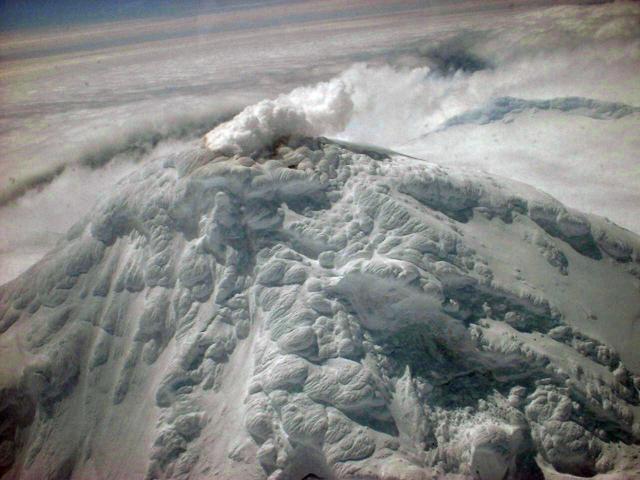 |
Figure 4. Summit of Mawson Peak (Heard Island) discharging gases, viewed from the SW on 9 November 2000. Approximately the top 150 m of the peak can be seen in this view. Photo by Paul Scott, courtesy of Kevin Kiernan. |
Reports of more than one red glow source from the 1950-52 and 1985 eruptive events hinted at the possible existence of a second vent on Big Ben (ANARE Station Reports, and Neumann van Padang, 1963). Recent failure to locate such a vent led Quilty and Wheller (2000) to conclude that the previously observed multiple red glows were attributable to magma ponded in the summit crater and lava flowing down Big Ben's flanks. Current observations, however, now suggest the presence of a separate, lower vent in the vicinity of the 1985 flow.
On 13 November observers from Fairchild Beach on the N coast of Heard Island noted brown fumes venting from the summit area. The following day, fumarolic activity was observed from a vantage point on the E moraine of Browns Glacier Lagoon on the N coast.
References. Kiernan, K., and McConnell, A., 2000, ASAC Project 1118, Geomorphological Evolution of Heard Island: Report to Atlas Cove Station Leader, ANARE.
Neumann van Padang, M., 1963, Arabia and the Indian Ocean: Catalogue of the Active Volcanoes of the World, v. 16, p. 1-64.
Quilty, P.G., and Wheller, G., 2000, Heard Island and the McDonald Islands: A window on the Kerguelen Plateau: Papers & Proceedings of the Royal Society of Tasmania, v. 133, no. 2, p. 1-12.
Information Contacts: Kevin Kiernan, Geography and Environmental Studies, University of Tasmania, GPO Box 252-79, Hobart TAS 7001, Australia.
Increased fumarolic activity in February and March 2001; possible lava flow
Fumarolic activity emanating from Big Ben stratovolcano on Heard Island increased since the previous report period of October-November 2000 (BGVN 25:11). Both the vent at the summit of Mawson Peak and the second, recently confirmed vent downslope from the summit, were involved in the activity in early February 2001.
At about 2100 on 2 February an increased emission of volatiles was observed from Atlas Cove, located ~15 km NW of the summit where the main island connects with the Laurens Peninsula (see maps in SEAN 10:02 and BGVN 23:02). Under daylight the plume had a yellow-colored tinge. By midnight venting increased substantially. Observations continued until 0100 on 3 February when emissions appeared to diminish and clouds obscured the view. No lava or ejecta were observed from the Atlas Cove vantage point.
The plumes rose up to ~1,000 m in height, but tended to vary in extent over time. The precise points of emission were hidden by the high shoulder of Big Ben. Nevertheless, the emissions appeared to emanate from two discrete vents, one at Mawson Peak, and the other the newly discovered vent estimated to be 300-400 m vertically below it (lower than previously thought) on the S-facing slope.
Observations on the afternoon of 3 February revealed further abatement of volatile venting. Some workers suggested the presence of a third vent based on observations from Anzac Peak on Laurens Peninsula at the NW end of the island, but these findings are not yet substantiated. From a high point on Laurens Peninsula a black lava flow (?) on Mawson Peak was observed to be closer to the Atlas Cove side of the island than on previous visits. The possible flow was ~100 m wide and ~1,500 m long, but size estimates were hindered by distance, the enormity of Big Ben, the lack of any comparative scale, and the acute viewing angle.
On 5 March observers obtained good views of Big Ben from Red Island, at the farthest N tip of the Laurens Peninsula, but were unable to discern any summit activity despite clear conditions. Further observations from the same vantage point at 1330 on 7 March afforded a brief 5-8 minute view of the summit and revealed that a significant plume rose 100-200 m and drifted several kilometers downwind. The plume's width was estimated to be 50 m. The "black scar" first viewed on 3 February and interpreted as a plausible lava flow was again visible and appeared unchanged since its last observation.
The findings in early February and March 2001 are consistent with recent observations during a helicopter overflight of Big Ben that confirmed the presence of a vent well below the summit of Mawson Peak (Kiernan & McConnell, 2000). They compound the likelihood that more than one vent was involved in earlier eruptive activity during 1950-52 and 1985 (ANARE Station Reports; Neumann van Padang, 1963), contrary to recent conclusions by Quilty & Wheller (2000). Observations of volcanism on Heard Island, however, are limited because of its remoteness, and since the summit area is frequently shrouded in clouds. Hence, the general level of activity observed recently is difficult to assess.
References. Kiernan, K., and McConnell, A., 2000, ASAC Project 1118, Geomorphological Evolution of Heard Island: Report to Atlas Cove Station Leader, ANARE.
Neumann van Padang, M., 1963, Arabia and the Indian Ocean: Catalogue of the Active Volcanoes of the World, v. 16, p. 1-64.
Quilty, P.G., and Wheller, G., 2000, Heard Island and the McDonald Islands: A window on the Kerguelen Plateau: Papers & Proceedings of the Royal Society of Tasmania, v. 133, no. 2, p. 1-12.
Information Contacts: Stu Fitch and Andrew Lock, Australian Antarctic Division, Channel Highway, Kingston, TAS 7050, Australia (URL: http://www.antarctica.gov.au/); C.J. Klok, Department of Zoology and Entomology, University of Pretoria, Pretoria 0002, South Africa (URL: http://www.up.ac.za/zoology-entomology/); Kevin Kiernan and Anne McConnell, Geography & Environmental Studies, University of Tasmania, GPO Box 252-79, Hobart TAS 7001, Australia.
Photographs of upper slopes substantiate reports of activity from two distinct vents
Photographs taken during early February 2001 at Heard (BGVN 26:02) revealed the character and location of the activity there. Figures 5 and 6 were taken on the early morning of 3 February, shortly after midnight against a dark sky. Light from the active vents illuminated the overcast sky and Big Ben stratovolcano. The two distinct light sources pictured in figure 6 evidenced activity from two separate vents. No research-related visits to the remote Heard Island are planned in the immediate future.
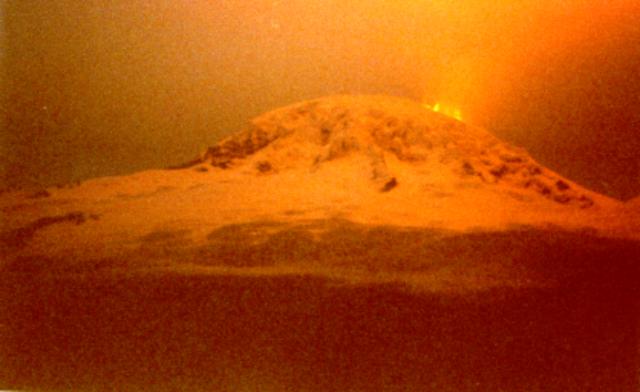 |
Figure 5. View of Big Ben looking SE from Atlas Cove. Copyrighted photo by Stu Fitch, courtesy of Kevin Kiernan. |
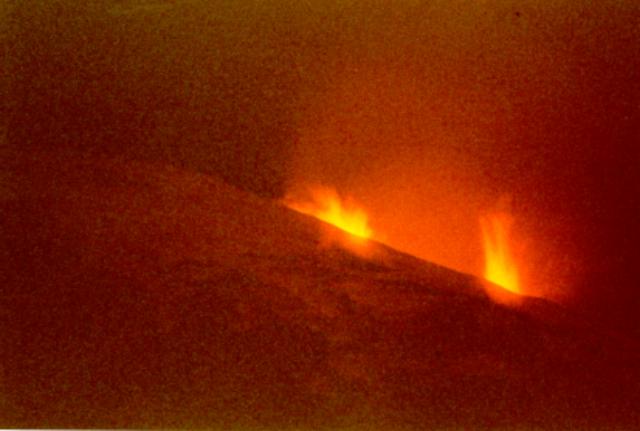 |
Figure 6. Telephoto view of Big Ben's upper slopes looking SE from Atlas Cove. Copyrighted photo by Stu Fitch, courtesy of Kevin Kiernan. |
References. Kiernan, K., and McConnell, A., 2000, ASAC Project 1118, Geomorphological Evolution of Heard Island: Report to Atlas Cove Station Leader, ANARE.
Neumann van Padang, M., 1963, Arabia and the Indian Ocean: Catalogue of the Active Volcanoes of the World, v. 16, p. 1-64.
Quilty, P.G., and Wheller, G., 2000, Heard Island and the McDonald Islands: A window on the Kerguelen Plateau: Papers & Proceedings of the Royal Society of Tasmania, v. 133, no. 2, p. 1-12.
Information Contacts: Stu Fitch, Australian Antarctic Division (AAD); Andrew Lock, AAD; C.J. Klok, Department of Zoology and Entomology, University of Pretoria, Pretoria 0002, South Africa; Kevin Kiernan and Anne McConnell, Geography & Environmental Studies, University of Tasmania, GPO Box 252-79, Hobart TAS 7001, Australia.
Infrared data show previously unknown activity during May-June 2000
Between 13 May 2000 and 30 January 2003, thermal alerts on Heard Island occurred on the following dates: 24 May; 3, 5, and 6 June; 25 September; 29 October; 5, 15, 19, and 24 November; 16, 17, 26, and 30 December 2000; and 2 February 2001 (figure 7). Since then no further thermal alerts have been recorded. There have been no reports of May-June 2000 activity on Heard Island published in the Bulletin. However, Rothery and Coppola are confident that the MODIS data prove high-temperature volcanic activity at these times. The late-2000 period of MODIS thermal alerts is substantiated by reports from ships and helicopters. The first of these, "fumarolic activity" on 19 October (BGVN 25:11), is 24 days later than the first MODIS thermal alert in this period. A fresh lava flow was suspected but unproven on 3 February (BGVN 26:02), and two incandescent vents were photographed on the same day (BGVN 26:03). The interpretation of the MODIS data is that lava effusion is likely. The locations of the alert pixels (figure 8) suggest that activity was on the WSW side of the summit, and may have extended about halfway to the shore.
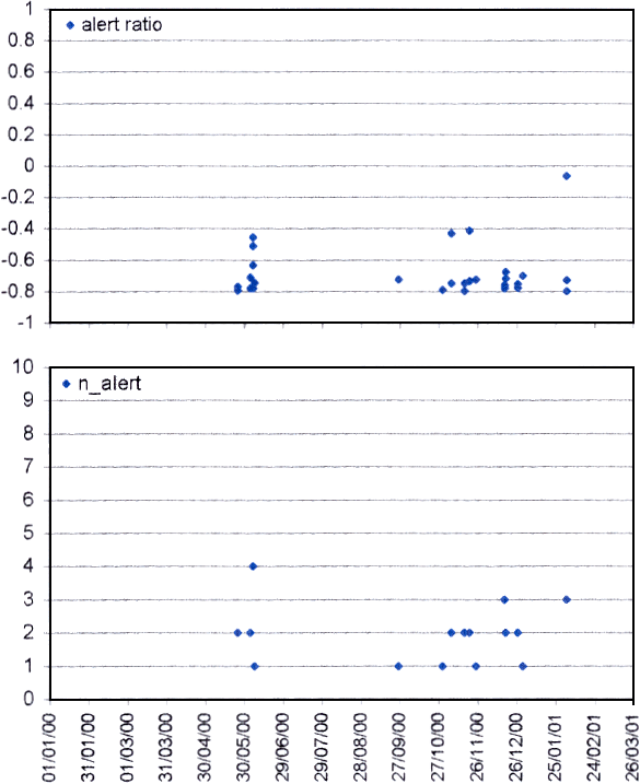 |
Figure 7. MODIS detected alerts on Heard during January 2000-March 2001. Courtesy of Diego Coppola and David Rothery, The Open University. |
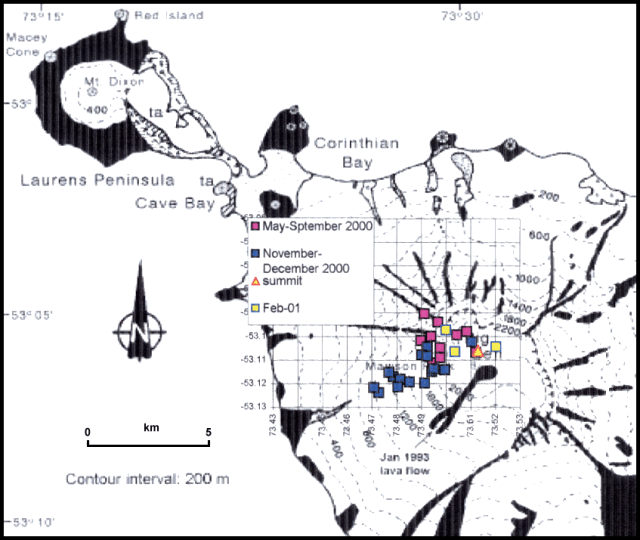 |
Figure 8. Locations of alert-pixels on Heard during 2001-2002. Grid squares are 1 km on a side. Base map from BGVN 17:05 (after Barling, 1990). Courtesy of Diego Coppola and David Rothery, The Open University. |
Reference. Barling, J., 1990, Heard and McDonald Islands, in Le Masurier, W., and Thomson, J., eds., Volcanoes of the Antarctic Plate and southern Oceans: American Geophysical Union, Washington DC, p. 435-441.
Information Contacts: David A. Rothery and Diego Coppola, Department of Earth Sciences, The Open University, Milton Keynes MK 6AA, United Kingdom.
Thermal alerts indicate crater lake activity starting in June 2003 until June 2004
Infrared satellite data triggered MODVOLC thermal alerts between 24 May 2000 and 2 February 2001 (BGVN 28:01). A new series of alerts began on 9 June 2003, with frequent alerts continuing until 14 June 2004. The cloud-free ASTER imagery from June 2003 to June 2004 was examined, and although it does not offer very complete coverage of this new phase of activity, all the images contained very small anomalies (just a few pixels) in the central crater. This suggests that most of these alerts are due to increased activity at the lava lake, with no indication of lava flows. Also, all the 2003-2004 MODVOLC anomalies were 1-2 pixels (no elongate thermal anomalies), further suggesting that this is local central-vent activity.
Information Contacts: Matt Patrick, Luke Flynn, Harold Garbeil, Andy Harris, Eric Pilger, Glyn Williams-Jones, and Rob Wright, HIGP Thermal Alerts Team, Hawai'i Institute of Geophysics and Planetology (HIGP) / School of Ocean and Earth Science and Technology (SOEST), University of Hawai'i, 2525 Correa Road, Honolulu, HI 96822, USA (URL: http://modis.higp.hawaii.edu/).
2006 imagery indicates renewed volcanism
Matt Patrick observed from MODIS (Moderate Resolution Imaging Spectroradiometer) images analyzed by the HIGP MODVOLC algorithm that relatively new activity began in March 2006 at Heard Island. Two isolated alerts occurred on 11-12 March 2006, and sustained alerts occurred from 7-18 May, 28 May-5 June, and 13-20 June (table 1). Alerts were 1-3 pixels in size. The pixel locations all appeared to be clustered generally near the summit of Big Ben, suggesting central vent (lava lake?) activity rather than lava flows. Advanced Spaceborne Thermal Emission and Reflection Radiometer (ASTER) images over the last several months have all been cloudy and therefore unable to reinforce or support the MODVOLC results. However, a nighttime ASTER image on 29 May 2006 at 0110 showed the new activity (figure 9).
Table 1. MODVOLC alerts for 2006 through 21 June. Courtesy of Hawai'i Institute of Geophysical and Planetology (HIGP) Thermal Alerts Team.
| Date | Time (local) | Pixels | Satellite |
| 11 Mar 2006 | 2315 | 1 | Terra |
| 12 Mar 2006 | 0100 | 2 | Aqua |
| 07 May 2006 | 0100 | 1 | Terra |
| 07 May 2006 | 2305 | 1 | Terra |
| 08 May 2006 | 0150 | 1 | Aqua |
| 09 May 2006 | 2255 | 1 | Terra |
| 10 May 2006 | 0140 | 1 | Aqua |
| 11 May 2006 | 2335 | 1 | Terra |
| 18 May 2006 | 2250 | 2 | Terra |
| 28 May 2006 | 2325 | 1 | Terra |
| 29 May 2006 | 0110 | 2 | Aqua |
| 02 Jun 2006 | 2345 | 3 | Terra |
| 03 Jun 2006 | 0130 | 2 | Aqua |
| 05 Jun 2006 | 0115 | 1 | Aqua |
| 13 Jun 2006 | 2325 | 2 | Terra |
| 14 Jun 2006 | 0110 | 4 | Aqua |
| 15 Jun 2006 | 0010 | 2 | Terra |
| 16 Jun 2006 | 0100 | 1 | Aqua |
| 20 Jun 2006 | 2330 | 1 | Terra |
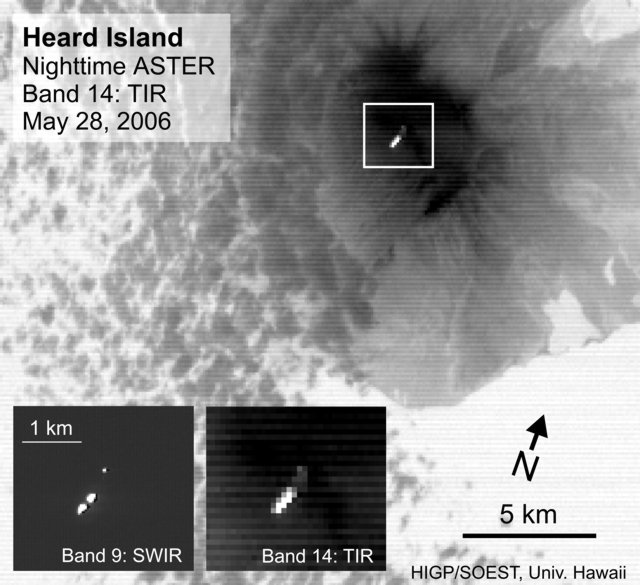 |
Figure 9. ASTER image of Heard Island taken at 0110 on 29 May 2006. The main image is the thermal infrared Band 14 (90 m pixel size), with the inserts showing the shortwave infrared (SWIR Band 9; 30 m pixel size) and thermal infrared (TIR Band 14) closeups. This a nighttime image with no visible bands with 15 m pixel size was difficult to interpret. The N-most segment of the summit anomaly, seen clearly in the Band 9 image, may be the vent, with the remainder of the anomaly possibly representing a ~900-m-long lava flow to the S. Alternatively, the segmentation of the anomaly may reflect different vents. Courtesy Matt Patrick, HIGP Thermal Alert Team. |
The previous phases of activity spanned May 2000-February 2001 and June 2003-June 2004 (BGVN 29:12).
Information Contacts: Matt Patrick, HIGP Thermal Alerts Team, Hawai'i Institute of Geophysics and Planetology (HIGP) / School of Ocean and Earth Science and Technology (SOEST), University of Hawai'i, 2525 Correa Road, Honolulu, HI 96822, USA (URL: http://modis.higp.hawaii.edu/); Andrew Tupper, Darwin Volcanic Ash Advisory Centre, Bureau of Meteorology, Australia.
ASTER images show hotspot for possible lava lake and flow 8 December
Matt Patrick reported that Heard Island continued to display evidence of activity in its summit crater (continuing the phase which began in May 2006, BGVN 31:05). Figure 10 presents an ASTER image (Bands 9-3-2) from 8 December 2006 showing a hotspot at the summit, presumably a lava lake, with a recently emplaced lava flow extending 700 m E.
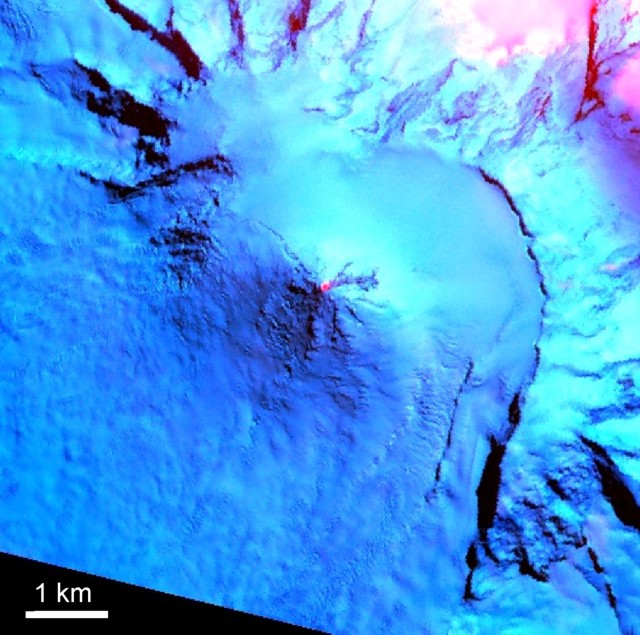 |
Figure 10. ASTER image (Bands 9-3-2) from 8 December 2006 showing a hotspot at the summit of Heard Island. This is one of the rare daytime ASTER images that shows the summit clearly. Courtesy of Matt Patrick. |
Table 2 lists the thermal anomalies recorded by the Hawai'i Institute of Geophysics and Planetology (HIGP) during 25 June 2006 (as last reported in the BGVN 31:05) to mid December 2006. The table lists 27 thermal anomalies during 25 June to 15 December 2006. There is no MODVOLC thermal anomaly on 8 December, the date of the ASTER image in the previous figure.
Table 2. Thermal anomalies from mid-June to mid-December 2006 from MODIS satellites. Courtesy of HIGP Thermal Alerts Team.
| Date | Time (UTC) | Pixels | Satellite |
| 25 Jun 2006 | 1850 | 1 | Terra |
| 17 Jul 2006 | 2000 | 1 | Aqua |
| 06 Aug 2006 | 1935 | 1 | Aqua |
| 13 Aug 2006 | 0425 | 1 | Terra |
| 13 Aug 2006 | 1755 | 1 | Terra |
| 13 Aug 2006 | 1940 | 1 | Aqua |
| 15 Aug 2006 | 1930 | 1 | Aqua |
| 22 Aug 2006 | 1935 | 2 | Aqua |
| 10 Sep 2006 | 1820 | 2 | Terra |
| 12 Sep 2006 | 1805 | 1 | Terra |
| 20 Sep 2006 | 0930 | 1 | Aqua |
| 21 Sep 2006 | 1800 | 1 | Terra |
| 21 Sep 2006 | 1950 | 1 | Aqua |
| 11 Oct 2006 | 1735 | 1 | Terra |
| 11 Oct 2006 | 1925 | 2 | Aqua |
| 24 Oct 2006 | 0920 | 1 | Aqua |
| 27 Oct 2006 | 1735 | 2 | Terra |
| 27 Oct 2006 | 1925 | 1 | Aqua |
| 02 Nov 2006 | 1835 | 1 | Terra |
| 07 Nov 2006 | 1715 | 2 | Terra |
| 07 Nov 2006 | 1905 | 4 | Aqua |
| 17 Nov 2006 | 0830 | 1 | Aqua |
| 24 Nov 2006 | 0430 | 2 | Terra |
| 25 Nov 2006 | 0920 | 1 | Aqua |
| 26 Nov 2006 | 1750 | 2 | Terra |
| 15 Dec 2006 | 1820 | 1 | Terra |
| 15 Dec 2006 | 2005 | 1 | Aqua |
Matt Patrick noted that it is not surprising that the ASTER image showed a thermal anomaly but MODVOLC did not. First, because ASTER has infrared bands at 30-90 m, it is inherently more sensitive to thermal anomalies than the 1-km MODIS bands (MODVOLC uses MODIS data). Second, the MODVOLC algorithm has a threshold which sometimes disregards low-level eruptive activity in order to avoid false alarms. The anomaly in the ASTER image was not particularly large or intense, so it is not surprising it did not show up in MODVOLC.
Information Contacts: Matthew Patrick, Dept. of Geological and Mining Engineering and Sciences, Michigan Technological University, 1400 Townsend Drive, Houghton, MI 49931, USA; Hawai'i Institute of Geophysics and Planetology (HIGP) Thermal Alerts Team, School of Ocean and Earth Science and Technology (SOEST), Univ. of Hawai'i, 2525 Correa Road, Honolulu, HI 96822, USA (URL: http://modis.higp.hawaii.edu/).
Thermal anomalies ~300 m apart may suggest two vents
An ASTER image over Heard for 29 February 2007 (figure 11) was found by Matt Patrick in which two thermal anomalies are shown, separated by ~ 300 m. The anomaly to the SE appeared to be a new feature, representing either a distinct vent or a hot distal portion of an active flow from the main vent. There are no anomalous shortwave pixels between the two anomalies as one might expect for an active lava surface, but the flow may be channeled underground between the anomalies. The total lack of anomalous pixels in the region between the two anomalies, however, caused Patrick to suspect that this is a distinct vent. If this is a distinct vent, it would be the first clear illustration of multiple vents at Heard. None of the previous images Patrick has studied covering the last 6 years (including the 8 December 2006 image, also using Band 9-3-1 color mapping, shown in figure 12) showed indications of a secondary anomaly.
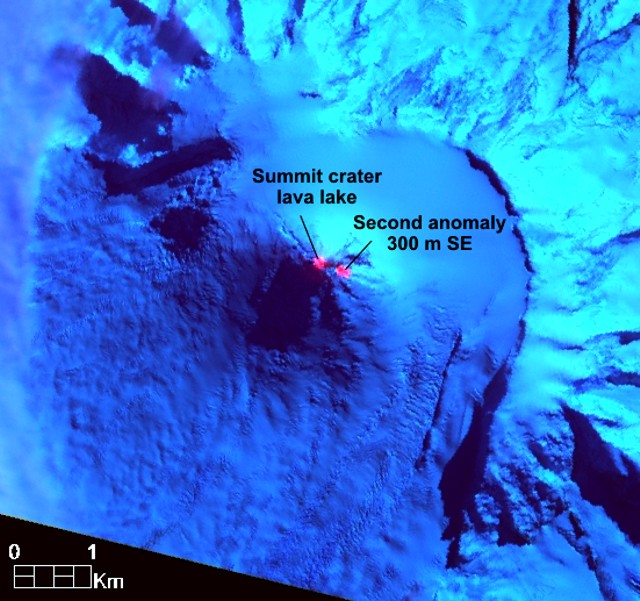 |
Figure 11. An ASTER Band 9-3-1 RGB composite image of Heard for 29 February 2007, with the shortwave infrared band 9 mapped to red, indicating high temperatures. Two distinct anomalies near the summit of Mawson Peak are shown. The W-most anomaly is at the location of previous anomalies, which appear to be the summit crater (lava lake), while the anomaly 300 m SE is a new feature. Courtesy Matt Patrick. |
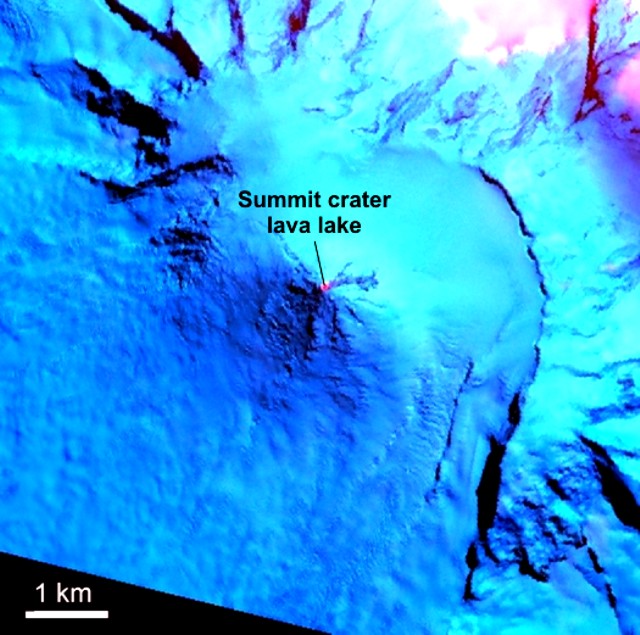 |
Figure 12. An ASTER Band 9-3-1 RGB composite image of Heard for 8 December 2006, with the shortwave infrared band 9 mapped to red, indicating high temperatures. One distinct anomaly near the summit of Mawson Peak is shown. Courtesy Matt Patrick. |
MODIS satellite data also revealed thermal anomalies on 24 different days between 27 December 2006 and 6 April 2007 (table 3).
Table 3. Thermal anomalies at Heard from mid-December 2006 to early April 2007 from MODIS satellites. Continued from table in BGVN 31:05. Courtesy of Hawai'i Institute of Geophysics and Planetology (HIGP) Hot Spots System.
| Date | Time (UTC) | Pixels | Satellite |
| 27 Dec 2006 | 1845 | 1 | Terra |
| 29 Dec 2006 | 1830 | 1 | Terra |
| 31 Dec 2006 | 1820 | 2 | Terra |
| 31 Dec 2006 | 2005 | 1 | Aqua |
| 09 Jan 2007 | 1815 | 2 | Terra |
| 19 Jan 2007 | 1850 | 1 | Terra |
| 04 Feb 2007 | 1900 | 1 | Aqua |
| 05 Feb 2007 | 1940 | 1 | Aqua |
| 07 Feb 2007 | 1930 | 2 | Aqua |
| 16 Feb 2007 | 1925 | 1 | Aqua |
| 21 Feb 2007 | 1940 | 1 | Aqua |
| 26 Feb 2007 | 0445 | 1 | Terra |
| 05 Mar 2007 | 1820 | 2 | Terra |
| 07 Mar 2007 | 1810 | 1 | Terra |
| 11 Mar 2007 | 1745 | 1 | Terra |
| 12 Mar 2007 | 1825 | 2 | Terra |
| 12 Mar 2007 | 2015 | 1 | Aqua |
| 14 Mar 2007 | 1815 | 1 | Terra |
| 14 Mar 2007 | 2000 | 2 | Aqua |
| 18 Mar 2007 | 1935 | 1 | Aqua |
| 20 Mar 2007 | 1925 | 1 | Aqua |
| 24 Mar 2007 | 1850 | 1 | Terra |
| 26 Mar 2007 | 0505 | 1 | Terra |
| 27 Mar 2007 | 1745 | 2 | Terra |
| 28 Mar 2007 | 2015 | 2 | Aqua |
| 29 Mar 2007 | 1920 | 1 | Aqua |
| 06 Apr 2007 | 0450 | 1 | Terra |
Information Contacts: Hawai'i Institute of Geophysics and Planetology (HIGP) Hot Spots System, University of Hawai'i, 2525 Correa Road, Honolulu, HI 96822, USA (URL: http://modis.higp.hawaii.edu/); Matthew Patrick, Dept. of Geological and Mining Engineering and Sciences, Michigan Technological University, 1400 Townsend Drive, Houghton, MI 49931, USA.
Eruption ends in April; three eruptions of more than 11 months long since 2000
Based on Hawai'i Institute of Geophysics and Planetology (HIGP) Thermal Alerts System MODVOLC analysis of MODIS (Moderate Resolution Imaging Spectroradiometer) satellite thermal anomaly data, Matt Patrick reported in June 2007 that the eruption at Heard that started about a year ago (BGVN 31:05, 31:11, and 32:03) seemed to have ceased. Due to its isolated location, Heard Island is rarely visited, and satellite imagery provides the only regular information on eruptive activity. There have been three eruptive periods of 11 months or longer during which thermal anomalies were frequent since MODIS data came online in early 2000 up to 21 July 2007 (table 4).
Table 4. Summary of eruptive episodes at Heard based on MODVOLC analyses of MODIS thermal satellite data. Courtesy of Matt Patrick.
| Eruption | First Anomaly | Last Anomaly | Duration | Comments |
| 2000-2001 | 07 Mar 2000 | 02 Feb 2001 | 332 days | 857 days until next eruption. An earlier report (BGVN 28:01) indicated that this eruption began in May 2000, while Patrick's data indicated that MODIS thermal alerts began in March 2000. |
| 2003-2004 | 09 Jun 2003 | 14 Jun 2004 | 371 days | 635 days until next eruption. |
| 2006-2007 | 11 Mar 2006 | 06 Apr 2007 | 391 days | A single anomaly on 11-12 March 2006 was followed by lack on anomalies until 6 May, when they became frequent. (Note: since 6 April 2007, only one, single-pixel anomaly has been measured--24 July 2007. Patrick concluded that the 2006-2007 eruptive phase of nearly daily alerts ended on 6 April 2007.) |
A graph prepared by Patrick and the HIGP Thermal Alert System Team (figure 13) showing radiant heat output and distance of alert pixels from the volcano vent (1 pixel=1 km) also shows the three separate eruptions since 2000. Pixel distances determined from Advanced Spaceborne Thermal Emission and Reflection Radiometer (ASTER) data and the MODVOLC alert show that activity during all three eruptions was centered around the summit crater, with sporadic lava flows during the 2000-2001 and 2006-2007 episodes. Only the 2000-2001 eruption clearly featured long (i.e. several kilometer long) lava flows, as shown by the > 3 km distance in July 2000 (figure 13). Patrick noted that a 2-km-long lava flow seen in Landsat imagery early in the 2000 eruption, on 7 July 2000 (figure 14), was detected by MODVOLC on 10 July 2000. However, since the location of the MODVOLC alerts from that time period were not far from the source vent, the alerts were not effective for showing the length of the lava flow.
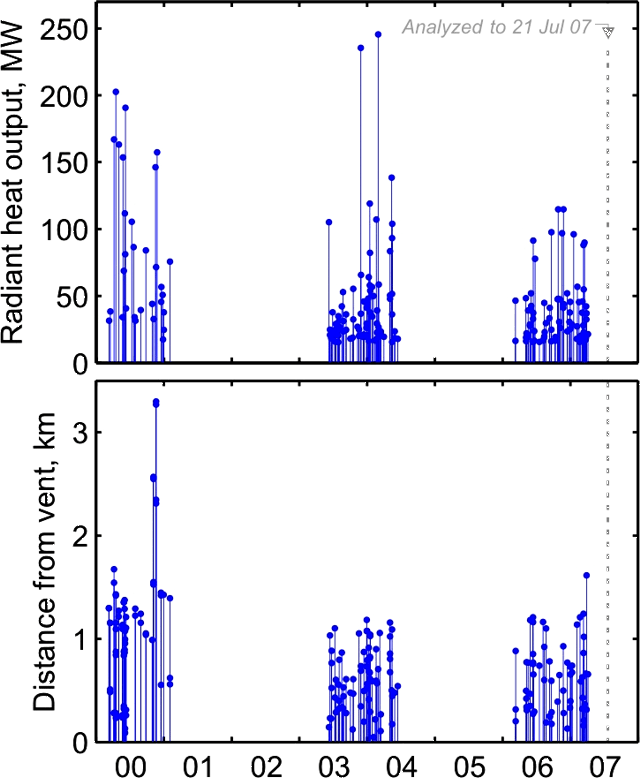 |
Figure 13. MODVOLC data for Heard showing radiant heat output (top) and distance of alert pixels from the vent (bottom), January 2000-21 July 2007. Courtesy of Matt Patrick. |
 |
Figure 14. Landsat image showing active flow at Heard Island, 7 July 2000. Courtesy of Matt Patrick. |
The 2003-2004 and 2006-2007 activity appeared to be largely limited to the summit crater, as indicated by the small MODVOLC distances (i.e. 1 km or less, with 1 km being the size of the pixels and inherent uncertainty) and ASTER data examined. ASTER data did show a possible 900-m-long flow to the SW of the vent in May 2006 (BGVN 31:05 and 31:11) and a clear 700-m-long flow of lava extending NE of the summit crater in December 2006, indicating that small effusive events have occurred in addition to central vent activity in the 2006-2007 phase. Patrick has not observed to this time any obvious ash plumes in the ASTER images, but all of the images examined appeared to be partly cloudy.
Patrick noted that it is difficult to determine exactly how often thermal anomalies for Heard Island may be completely obscured by clouds. The benefit of MODIS is the 1-2 observations per day, so that if activity is indeed present, it should not elude detection for very long. In the MODVOLC plot (figure 13), there were fairly regular alerts over the course of a year or so at a time, during which there must have been some cloud cover.
Information Contacts: Matt Patrick, Dept. of Geological and Mining Engineering and Sciences, Michigan Technological University, 1400 Townsend Drive, Houghton, MI 49931, USA; Hawai'i Institute of Geophysics and Planetology (HIGP) Thermal Alerts System, School of Ocean and Earth Science and Technology (SOEST), Univ. of Hawai'i, 2525 Correa Road, Honolulu, HI 96822, USA (URL: http://modis.higp.hawaii.edu/); NASA Earth Observatory (URL: http://earthobservatory.nasa.gov/NaturalHazards/).
Rare thermal anomalies through March 2008 suggest eruptions
Due to its isolated location in the S Indian Ocean on the Kerguelen Plateau, Heard Island is rarely visited, and satellite imagery provides the only regular information on eruptive activity. The Hawai'i Institute of Geophysics and Planetology (HIGP) Thermal Alerts System MODVOLC provides an analysis of MODIS (Moderate Resolution Imaging Spectroradiometer) satellite thermal anomaly data, with 1-2 daily observations. That system remains the best source of evidence at isolated, glacier-covered volcanoes like Heard, though it is difficult to determine how often meteorological clouds may obscure thermal anomalies.
The last report summarized activity beginning in March 2000 (BGVN 32:06), describing three eruptive episodes (based on thermal anomalies). The last thermal anomaly mentioned was on 6 April 2007. As seen on table 5, the MODVOLC system recorded the next thermal anomaly on 24 July 2007. For the rest of 2007, there were anomalies recorded on two days in August and two days in November. During 2008 as late as 2 March, anomalies occurred in February and March.
Table 5. Thermal anomalies measured by MODIS/MODVOLC over Heard Island during 7 April 2007 through 2 March 2008. Courtesy of HIGP Thermal Anomalies Team.
| Date | Time (UTC) | Pixels | Satellite |
| 24 Jul 2007 | 1750 | 1 | Aqua |
| 12 Aug 2007 | 1820 | 1 | Terra |
| 30 Aug 2007 | 1955 | 1 | Aqua |
| 11 Nov 2007 | 1800 | 1 | Terra |
| 11 Nov 2007 | 1945 | 2 | Aqua |
| 22 Feb 2008 | 1955 | 3 | Aqua |
| 02 Mar 2008 | 1950 | 1 | Aqua |
Information Contacts: Hawai'i Institute of Geophysics and Planetology (HIGP) Thermal Alerts System, School of Ocean and Earth Science and Technology (SOEST), Univ. of Hawai'i, 2525 Correa Road, Honolulu, HI 96822, USA (URL: http://modis.higp.hawaii.edu/).
Quiet, with minor thermal anomalies, since March 2008
According to Matt Patrick (USGS) in a report dated 25 October 2010, satellite imagery has not detected unambiguous eruptive activity at Heard since March 2008. No MODVOLC thermal anomalies have been detected since that time, and recent cloud-free ASTER images generally lacked indications of eruptive activity. Given Heard's isolation, satellite imagery provides the only regular information on its behavior. As previously reported, numerous anomalies had been noted in 2006 and 2007, clearly indicating eruptions (BGVN 31:05, 31:11, 32:03, and 32:06). Rare thermal anomalies were recorded through 2 March 2008, with sufficient radiance and extent to suggest eruptions (BGVN 33:01).
Patrick found recent ASTER images that include faint thermal anomalies. The anomalies appeared at Big Ben volcano's Mawson Peak, which is both the volcano's and the island's summit, and hosts the active vent. The most recent cloud-free image, taken on 25 February 2010 (figure 15), shows a small (2-3 pixels in size) thermal anomaly, indicating either very low-level activity or simply warm ground in and around the vent.
 |
Figure 15. ASTER image of Heard on 25 February 2010, showing a thermal anomaly (image based on Aster band 14, 11-micron wavelength). Courtesy of Matt Patrick (USGS) and the ASTER project. |
Information Contacts: Matthew R. Patrick, Hawaiian Volcano Observatory (HVO), U.S. Geological Survey, PO Box 51, Hawai'i National Park, HI 96718, USA (URL: https://volcanoes.usgs.gov/observatories/hvo/); Hawai'i Institute of Geophysics and Planetology (HIGP) Thermal Alerts System, School of Ocean and Earth Science and Technology (SOEST), Univ. of Hawai'i, 2525 Correa Road, Honolulu, HI 96822, USA (URL: http://modis.higp.hawaii.edu/); ASTER (Advanced Spaceborne Thermal Emission and Reflection Radiometer), Earth Remote Sensing Data Analysis Center (ERSDAC) in Japan, and the Jet Propulsion Laboratory in the U.S. (URL: http://asterweb.jpl.nasa.gov/).
Satellite imagery reveals lava flows in December 2012
We received an informal report from Matt Patrick (Hawaiian Volcano Observatory) on a new eruptive episode at Big Ben volcano, Heard Island (figure 16). He noted that MODVOLC thermal alerts reappeared at Heard in September 2012 after a four year hiatus (the last eruptive episode ended on 2 March 2008; BGVN 33:01), suggesting the start of a new eruptive episode at the volcano. Since Heard Island is unsettled and extremely isolated, monitoring of the volcano is possibly primarily through satellite imagery (Patrick, 2013).
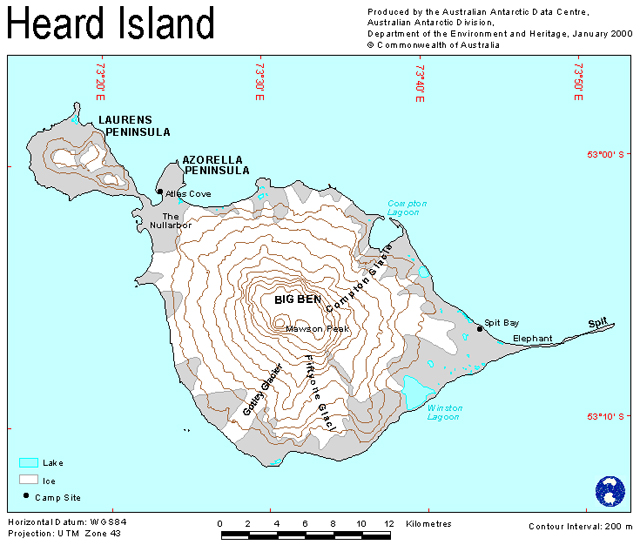 |
Figure 16. A contour map (interval = 200 m) showing the partly ice-covered Heard Island. At the time of map preparation, the brown areas were ice free. Produced and issued in January 2000 by the Australian Antarctic Data Centre, Department of the Environment and Heritage, Commonwealth of Australia. |
EO-1 Advanced Land Imager images collected through late 2012 and early 2013 confirm that eruptive activity resumed around September 2012, in the form of a low-level effusive style eruption similar to its other recent eruptions (figures 17 and 18). Patrick noted that the vent crater had enlarged significantly over the four years following the end of the last eruptive phase, March 2006-March 2008.
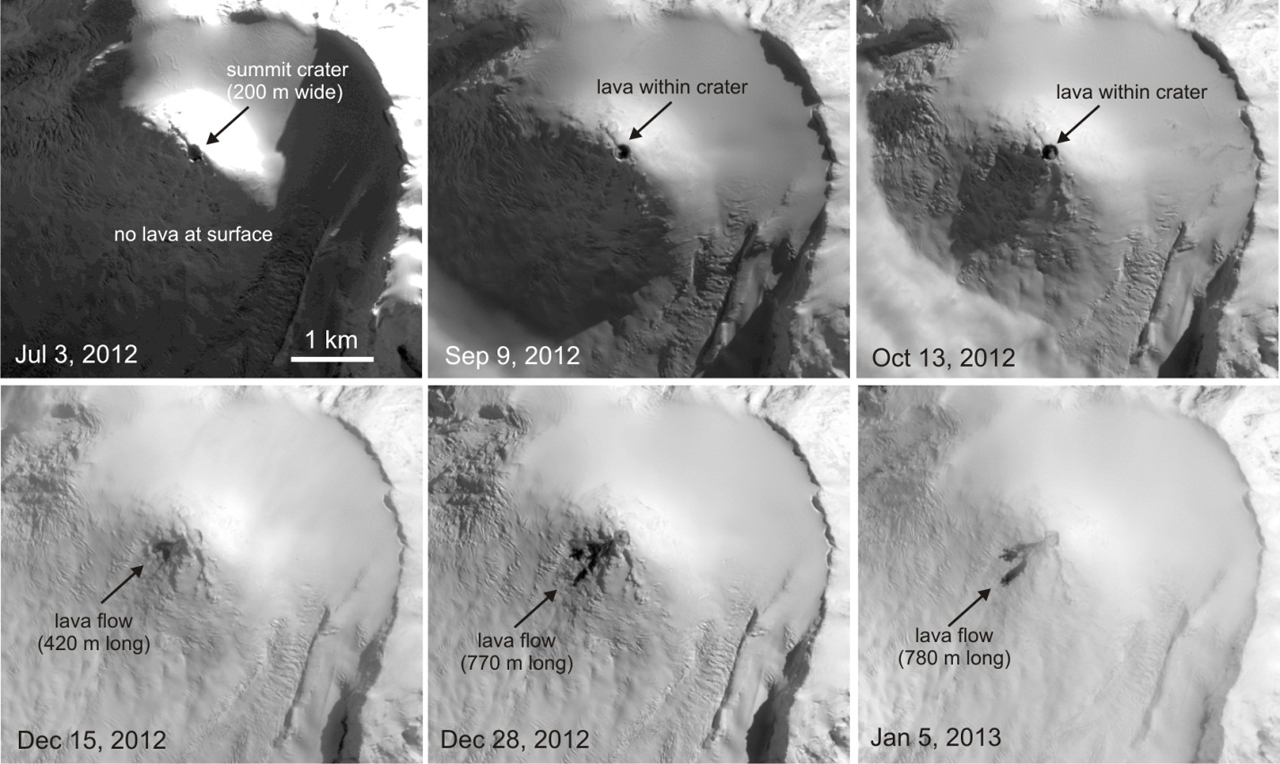 |
Figure 17. A series of images documenting the summit crater and subsequent lava advances at Mawson Peak, Heard Island from 3 July 2012 to 5 January 2013. The Earth Observing-1 (EO-1) satellite's Advanced Land Imager (ALI) Band 1 (panchromatic) images (10-m-pixel size) acquired several clear images on 3 July, 9 September, 13 October, 15 and 28 December 2012, and 5 January 2013. North is to the top of the photos. In the first three images the 200-m diameter crater at the summit of Mawson Peak is easily visible, and there is no evidence of activity outside of the crater. Courtesy of Matt Patrick. |
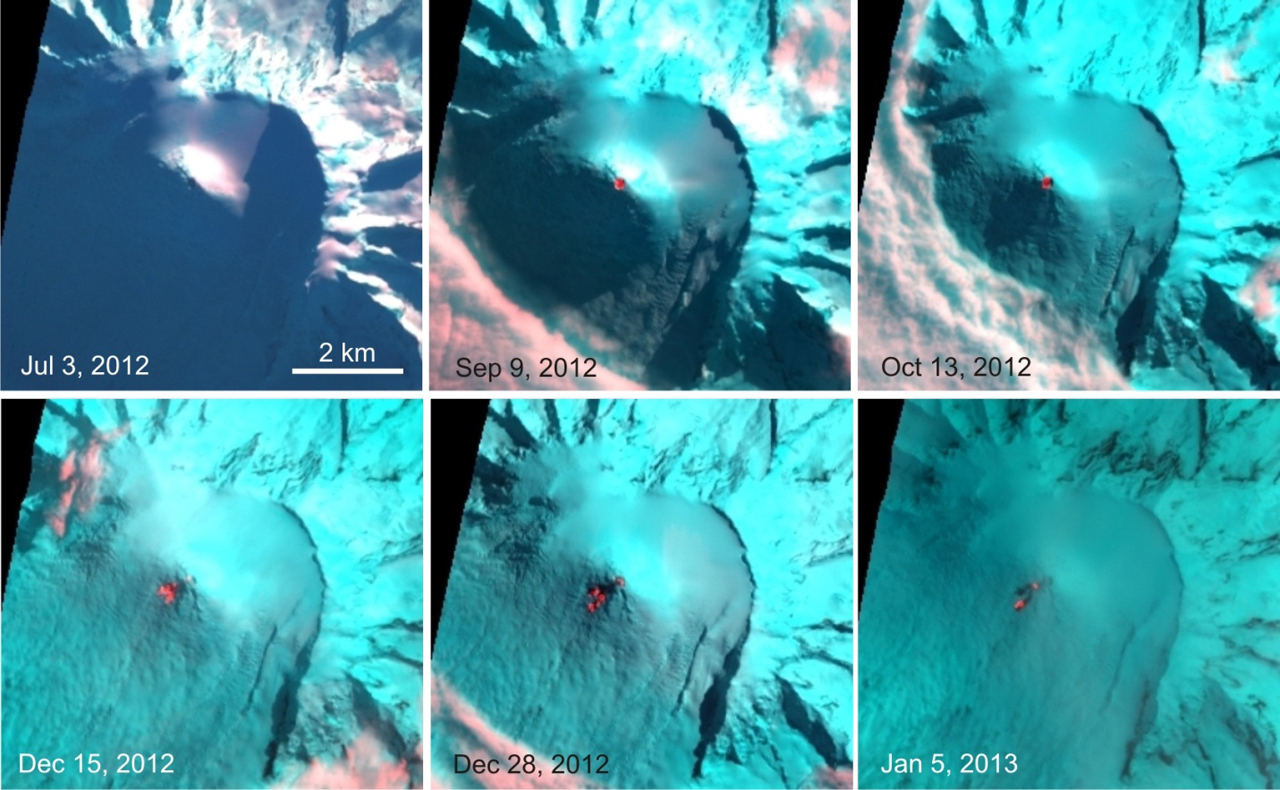 |
Figure 18. EO-1 ALI Band 10-3-2 RGB composites (30-m-pixel size) of the same series of images as in figure 17 (3 July 2012 to 5 January 2013). North is to the top of the photos. The red is the shortwave infrared band (Band 10, 2 microns); red pixels indicate high temperatures suggesting hot lava surfaces. As in figure 17, the 3 July 2012 image shows that the summit crater was cold, with no evidence of lava inside. However, the 9 September 2012 image clearly shows that elevated temperatures (and presumably lava) had appeared in the crater, consistent with the appearance of MODVOLC thermal alerts later that month. Therefore, this eruptive episode appears to have started around September. Courtesy of Matt Patrick. |
The 15 December 2012 image in figure 17 shows that a short lava flow from the summit was emplaced on the SW flank. The flow was ~420 m long and had two lobes. By 28 December, a flow consisting of two lobes (presumably the same flow as in the 15 December image) had reached 770 m SW of the summit crater. In the 5 January 2013 image this flow was 780 m long and had changed little over the previous week.
Figure 18 shows that the 9 September and 13 October 2012 images suggested active lava contained with the summit crater. The 15 and 28 December 2012 images showed elevated temperatures on the lava flow SW of the summit, suggesting it was active over this interval, which was consistent with the observed elongation of the flow in the visible images. Fewer high-temperature pixels in the 5 January 2013 image and the meager advancement observed in the visible images, suggested that the flow had stalled by this point.
Overall, the activity as of mid-March 2013 had consisted of lava within the crater and a lava flow of at least 770 m long emplaced SW of the crater. This low-level effusive activity is consistent with the previous three eruptive episodes observed in satellite images at Heard Island (Patrick and Smellie, in review). These three episodes, May 2000-November 2001 (BGVN 25:11, 26:02, 26:03, and 28:01), June 2003-July 2004 (BGVN 29:12), and March 2006-March 2008 (BGVN 31:05, 31:11, 32:03, 32:06, 33:01, and 35:09), each lasted 1-2 years. On this basis, Patrick suggested that this new eruptive episode may persist for a similar duration. MODVOLC thermal alerts were measured nearly continuously from 21 September 2012 through 24 February 2013.
References. Patrick, M., 2013, A new eruptive episode at Big Ben Volcano, Heard Island, informal communication to BGVN, 23 February 2013.
Patrick, M.R., and Smellie, J.L., in review, A spaceborne inventory of volcanic activity in Antarctica and southern oceans, 2000-2010, Antarctic Science, in review in 2013.
Information Contacts: Matt Patrick, Hawaiian Volcano Observatory (HVO), U.S. Geological Survey, PO Box 51, Hawai'i National Park, HI 96718, USA (URL: https://volcanoes.usgs.gov/observatories/hvo/); Australian Antarctic Data Centre, Department of the Environment and Heritage, Commonwealth of Australia (URL: https://data.aad.gov.au/database/mapcat/heard/heard_island.gif); MODVOLC, Hawai'i Institute of Geophysics and Planetology (HIGP) Thermal Alerts System, School of Ocean and Earth Science and Technology (SOEST), Univ. of Hawai'i, 2525 Correa Road, Honolulu, HI 96822, USA (URL: http://modis.higp.hawaii.edu/).
Satellite thermal alerts continue to early October 2013
[A previous report (BGVN 38:01) provided] information from Matt Patrick of the Hawaiian Volcano Observatory (HVO) on the onset of thermal alerts measured by satellites for Heard Island (see map in BGVN 38:01) in September 2012 after a 4-year hiatus. MODIS/MODVOLC measured thermal alerts fairly regularly from 21 September 2012 through 6 October 2013, with the greatest number of days with measured thermal alerts in December 2012 and March 2013.
In a satellite image acquired by NASA Earth Observatory on 13 October 2012 (figure 19), Heard Island is covered in [clean snow and glacial ice, and Mawson Peak appears quiet....] By 7 April 2013 Mawson's steep-walled summit crater had filled, and a trickle of lava had spilled down the volcano's SW flank (figure 20). On 20 April (figure 21), the lava flow remained visible, and had even widened slightly just below the summit.
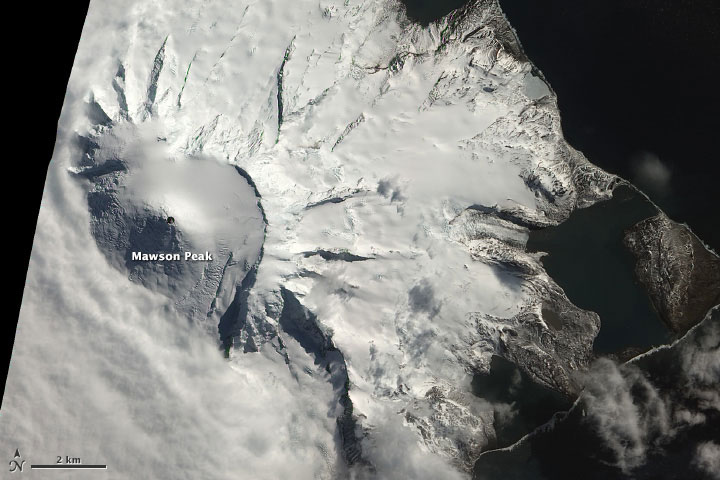 |
Figure 19. Although not definitive, this natural-color satellite image taken 13 October 2012 suggests an ongoing eruption. The dark summit crater (much darker than Mawson's shaded SW face) is at least partially snow-free. There is also a faint hint of an even darker area within, perhaps a lava flow. Shortwave infrared data shows hot surfaces within the crater, indicating the presence of lava in or just beneath the crater. Heavy cloud cover camouflaged what may have been a plume that erupted less than an hour after the image above was captured. Image and information courtesy of Robert Simmon, NASA Earth Observatory, using data from Advanced Land Imager (ALI) aboard the Earth Observing-1 (EO-1) satellite. |
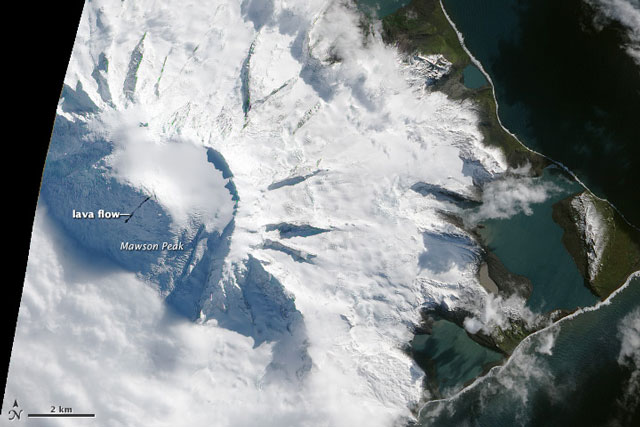 |
Figure 20. Natural-color satellite image of Heard Island acquired 7 April 2013 by the EO-1 ALI. Image courtesy of Jesse Allen and Robert Simmon, NASA Earth Observatory, using data from Advanced Land Imager (ALI) aboard the Earth Observing-1 (EO-1) satellite; information courtesy of Robert Simmon. |
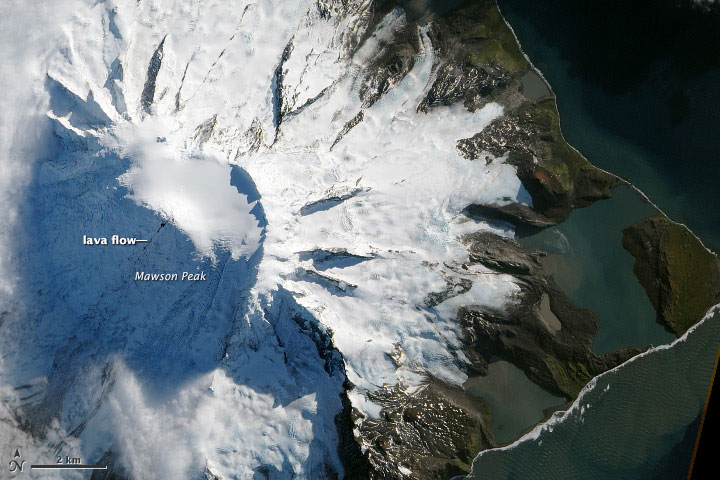 |
Figure 21. Satellite image of Heard Island acquired on 20 April 2013 by the Advanced Land Imager (ALI) aboard the Earth Observing-1 (EO-1) satellite. When compared with an image taken 7 April 2013 (figure 20), it appears that the lava flow is widening at the volcano's caldera; the caldera appears to have filled with so much lava that some has cascaded down Mawson Peak. Image courtesy of Jesse Allen and Robert Simmon, NASA Earth Observatory, using data from Advanced Land Imager (ALI) aboard the Earth Observing-1 (EO-1) satellite; information courtesy of Robert Simmon. |
Satellite inventory, 2000-2010. Patrick and Smellie (2013) recently published an article on a 10-year (2000-2010) spaceborne inventory of volcanic activity in Antarctica and southern oceans, including Heard Island. They noted that MODVOLC alerts indicated that eruptive activity at Heard Island comprised three sustained episodes during the decade; 24 May 2000-2 February 2001, 9 June 2003-June 2004, and 11 March 2006-2 March 2008. "Throughout the first two eruptions and their subsequent repose intervals, the summit vent was small, and less than 100 m wide... At some time in 2008 or early 2009 ... the summit crater widened to 200 m." Also, the authors noted that "the activity at Heard Island was entirely effusive and there is no evidence for any low-level explosive activity" during the study decade. The article notes that a limiting factor for satellite monitoring in this region is persistent cloud cover, although tall volcanoes such as Big Ben on Heard Island often have their summits above the cloud cover, resulting in "a higher rate of cloud-free views."
Reference. Patrick, M.R., and Smellie, J.L., 2013, Synthesis: A spaceborne inventory of volcanic activity in Antarctica and southern oceans, 2000-10, Antactic Science, v. 25, no. 4, p. 475-500, doi:10.1017/S0954102013000436.
Information Contacts: Matt Patrick, Hawaiian Volcano Observatory (HVO), U.S. Geological Survey, PO Box 51, Hawai'i National Park, HI 96718, USA (URL: https://volcanoes.usgs.gov/observatories/hvo/); NASA Earth Observatory (URL: http://earthobservatory.nasa.gov/); MODIS/MODVOLC, Hawai'i Institute of Geophysics and Planetology (HIGP), MODVOLC Thermal Alerts System, School of Ocean and Earth Science and Technology (SOEST), Univ. of Hawai'i, 2525 Correa Road, Honolulu, HI 96822, USA (URL: http://modis.higp.hawaii.edu/).
Intermittent thermal activity during 2013-14; plumes detected in 2015 and early 2016
Thermal activity detected by MODIS (Moderate Resolution Imaging Spectroradiometer) recorded by the MODVOLC system occurred regularly from 21 September 2012 through 6 October 2013 (BGVN 38:08). This report covers thermal alerts and anomalies from the remainder of 2013 through March 2016, and describes the observations of two plumes, one by satellite image on 30 October 2015, and the other by scientists aboard a research vessel during 30-31 January 2016.
Thermal anomalies continued to be seen in MODIS data between October 2013 and 21 July 2014, and again on 16 November 2014, due to a persistent lava lake and possible lava flows. According to a NOAA National Environmental Satellite, Data, and Information Service (NESDIS) scientist, thermal anomalies seemingly on the E flank were detected in Visible Infrared Imaging Radiometer Suite (VIIRS) satellite images during 2-30 November 2014. Dense cloud cover prevented views during 1-2 December.
The frequency of MODVOLC alerts decreased in 2015, with the exception of frequent alerts during June and July 2015, with a single alert on 31 December. In early 2016 there were alerts measured on 28 January and 21 February.
A plume from Heard was visible in a U.S. Air Force satellite image drifting SSW on 30 October 2015. Data provided by Middle InfraRed Observation of Volcanic Activity (MIROVA) show frequent moderate thermal anomalies that tapered off after September 2015. MIROVA data also show that the frequent anomalies occurred farther from the summit during the early to mid-portion of 2015 (figure 22).
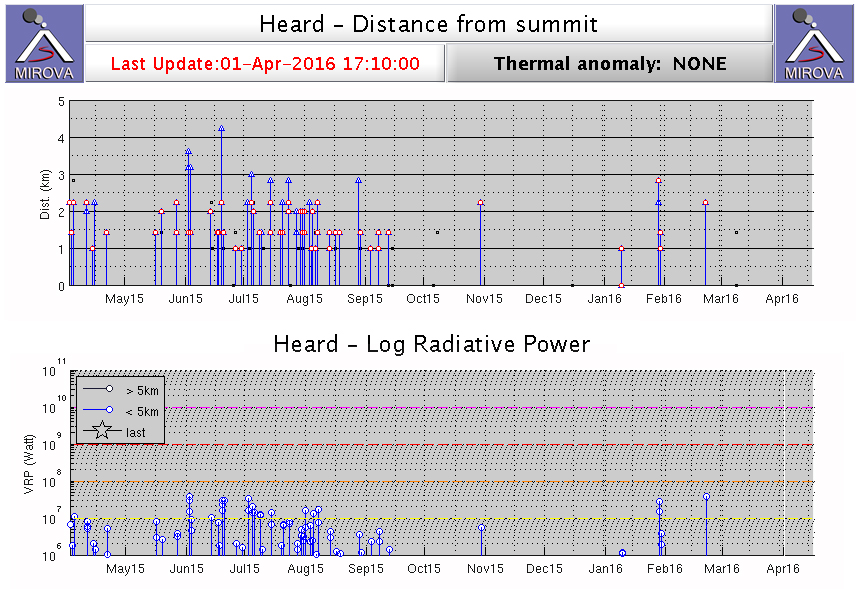 |
Figure 22. MIROVA graphs showing thermal anomalies at Heard 2 April 2015 to 1 April 2016. The log radiative power (bottom) indicates moderate thermal energy at distances (top) of generally 1-2.5 km from the summit. Recorded anomalies tapered off starting in early August 2015, with a few seen again in late January and February 2016. Courtesy of MIROVA. |
During 30-31 January 2016, scientists and crew aboard CSIRO's (Commonwealth Scientific and Industrial Research Organisation) Marine National Facility research vessel Investigator circled the island and observed a plume rising from Mawson Peak's crater and lava flows traveling down the NW flanks (figure 23). Visual observations are very rare due to its remote location. A MODVOLC thermal alert on 28 January was likely due to the lava emissions.
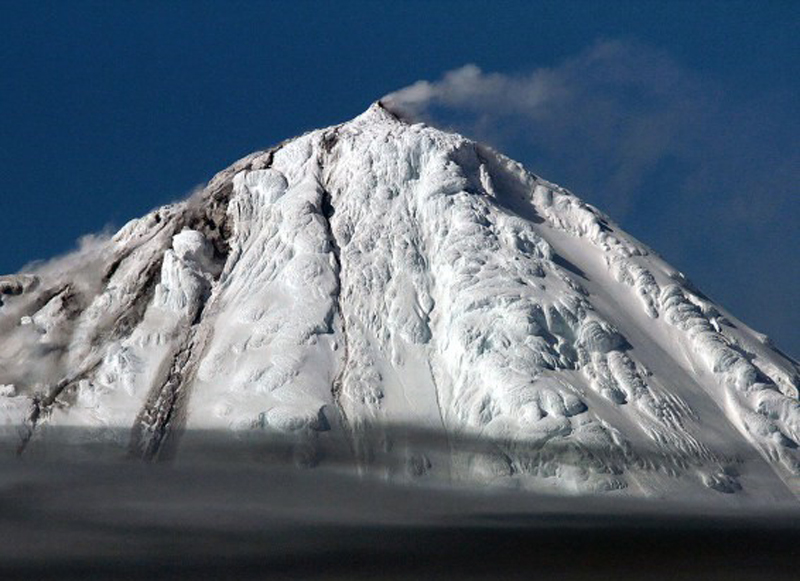 |
Figure 23. Small ash plume rising from Big Ben on Heard Island, 30-31 January 2016. On the flank at left in this view, the gray material is lava, from which steam is rising due to interaction with the snow and ice; a video taken at the same time shows the lava moving. Photo by Pete Harmsen; courtesy of CSIRO. |
Information Contacts: Marine National Facility, Commonwealth Scientific and Industrial Research Organisation (CSIRO), Hobart, Tasmania, Australia (URL: http://mnf.csiro.au/, https://blog.csiro.au/big-ben-erupts/); Michael J. Pavolonis, NOAA/NESDIS Center for Satellite Applications and Research (STAR), Advanced Satellite Products Branch (ASPB), Madison, Wisconsin, USA (URL: https://www.star.nesdis.noaa.gov/star/aspb_index.php); Hawai'i Institute of Geophysics and Planetology (HIGP), MODVOLC Thermal Alerts System, School of Ocean and Earth Science and Technology (SOEST), Univ. of Hawai'i, 2525 Correa Road, Honolulu, HI 96822, USA (URL: http://modis.higp.hawaii.edu/, http://modis.higp.hawaii.edu/cgi-bin/modisnew.cgi); MIROVA (Middle InfraRed Observation of Volcanic Activity), a collaborative project between the Universities of Turin and Florence (Italy) supported by the Centre for Volcanic Risk of the Italian Civil Protection Department (URL: http://www.mirovaweb.it/); United States Air Force, 557th Weather Wing, Weather Intel Flight, 2 WS/WXI Offutt AFB, NE 68133, USA.
Expedition visit in March-April 2016, intermittent eruptive activity through September 2017
The remote island of Heard in the southern Indian Ocean is home to the Big Ben stratovolcano, which has had confirmed intermittent activity since 1910. The nearest continental landmass, Antarctica, lies over 1,000 km S. Visual confirmation of lava flows on Heard are rare; thermal anomalies detected by satellite-based instruments provide the most reliable information about eruptive activity. Thermal alerts reappeared in September 2012 after a four-year hiatus (BGVN 38:01), and have been intermittent since that time. Information comes primarily from MODVOLC and MIROVA thermal anomaly data, but Australia's Commonwealth Scientific and Industrial Research Organisation (CSIRO) also provides reports from research expeditions. The independent March-April 2016 Cordell Expedition also provided recent ground-based observations mentioned in this report, which covers activity through September 2017.
Expeditions during January-April 2016. Scientists aboard the CSIRO Research Vessel Investigator observed an eruption of Big Ben on 31 January 2016. Vapor was seen emanating from the peak and lava flowed down the flank over a glacier (see figure 23, BGVN 41:08, and video link in Information Contacts). The research team, lead by the University of Tasmania's Institute for Marine and Antarctic Studies (IMAS), was conducting a study of the link between active volcanoes on the seafloor and the mobilization of iron by hydrothermal systems which enriches and supports life in the Southern Ocean.
During a private expedition from 22 March to 11 April 2016, scientists and engineers from the 2016 Cordell Expedition documented changes to the island and its life since a prior visit in 1997, and tested radio operations. On 23 March the team was able to photograph the usually cloud-covered Mawson Peak, the summit of Big Ben (figure 24). Steam was visible above the flat upper surface, possibly a crater rim or fissure. They estimated a height of about 45 m of an edifice rising above the adjacent slope. The ground at the site of the team campsite, near Atlas Cove on the NW side of the island, was covered with lava flows (figure 25). While the expedition had to cancel a planned expedition to the summit, rocks collected from the shoreline confirmed the diversity of volcanic rocks on the island (figure 26).
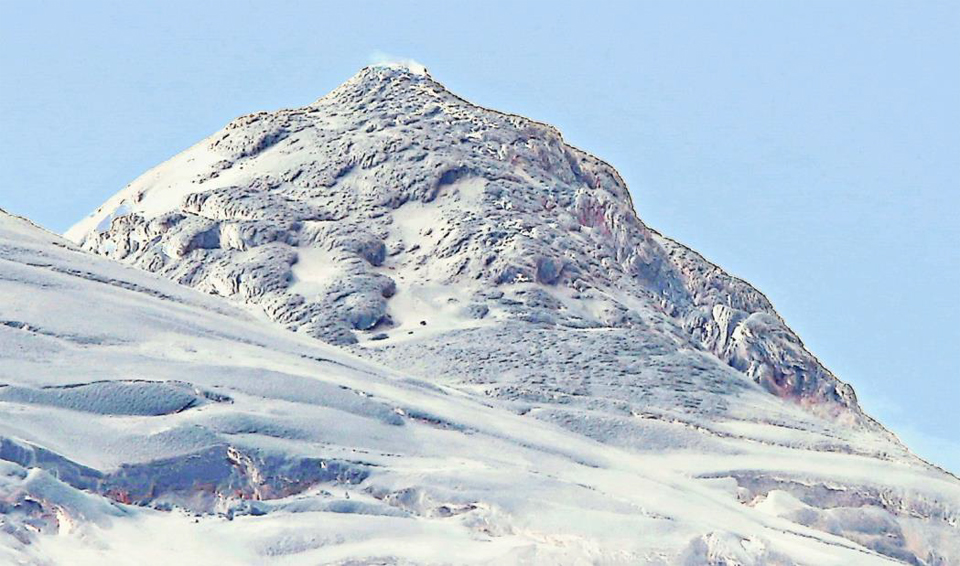 |
Figure 24. Mawson Peak is the summit of Big Ben volcano on Heard Island in the southern Indian Ocean. This photograph, taken on 23 March 2016 from Altas Cove on the NW side of the island by the 2016 Cordell Expedition, shows steam from a possible crater or vent area at the summit, and lava flows covered with a dusting of snow around the otherwise glacier-covered peak. Courtesy of Robert W. Schmieder, 2016 Cordell Expedition, used with permission. |
 |
Figure 25. Lava flows cover the ground near the 2016 Cordell Expedition campsite at Atlas Cove on the NW side of Heard Island in March 2016. Courtesy of Robert W. Schmieder, 2016 Cordell Expedition, used with permission. |
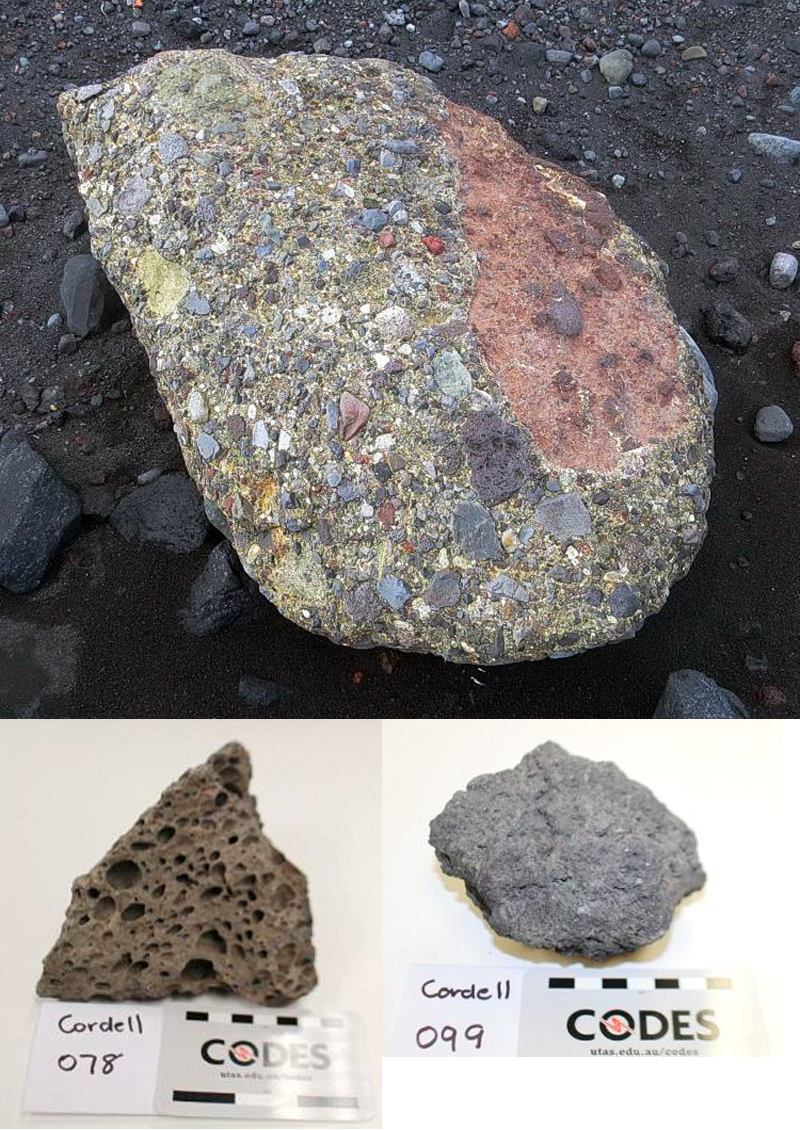 |
Figure 26. Rock samples collected at Heard by the 2016 Cordell Expedition during 23 March-11 April 2016 attest to the volcanic activity of the island. Top: A conglomerate sampled from the east shore of Stephenson Lagoon with mostly volcanic rock fragments, including vesicular basalt (dark brown, lower center) and clasts of volcanic breccia containing fragments of lava (large clast on right side). Sample is about 25 cm long. Bottom: A variety of textures was typical in the volcanic rocks collected on the islands. Courtesy of Robert W. Schmieder, 2016 Cordell Expedition, used with permission. |
At the southern end of Sydney Cove, near Magnet Point on the northern tip of Laurens Peninsula (the NW side of the island), the team identified a small islet, with dimensions of about 40 x 120 m and nearly vertical sides about 100 m high. Columnar jointing in the volcanic rocks is well exposed at the base and on the nearly flat upper surface (figure 27).
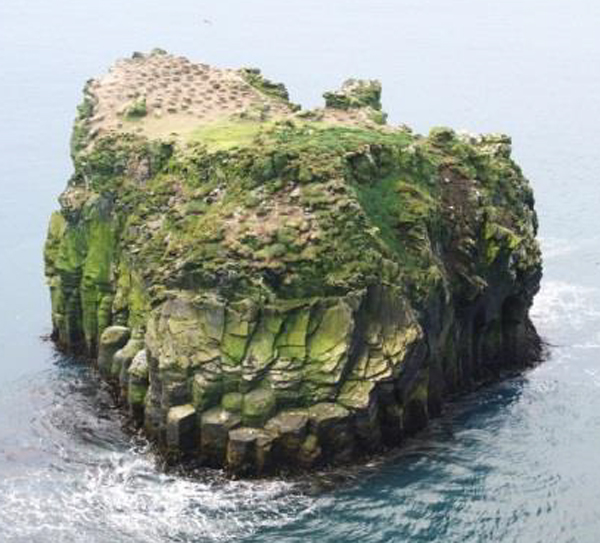 |
Figure 27. Distinctive columnar jointing in the volcanic rocks is visible around the base and on the top of a small islet in Sydney Cove off the NW end of Heard Island in this image taken during the 23 March-11 April 2016 Cordell Expedition. Courtesy of Robert W. Schmieder, 2016 Cordell Expedition, used with permission. |
Satellite thermal and visual data, 2012-2017. The most consistent source of information about eruptive activity at Heard comes from satellite instruments in the form of visual and thermal imagery, and thermal anomaly detection. From the time that renewed activity was detected in MODVOLC data in late September 2012 through September 2017, either the MODVOLC or MIROVA systems have consistently detected thermal signals, with only a few short breaks. A four-month span from mid-July to mid-November 2014, and a two-month gap during February and March 2015 are the only periods longer than a month when no thermal signal was reported. Continuous MIROVA information from late January 2016 through September 2017 shows intermittent but persistent thermal anomalies throughout the period (figure 28).
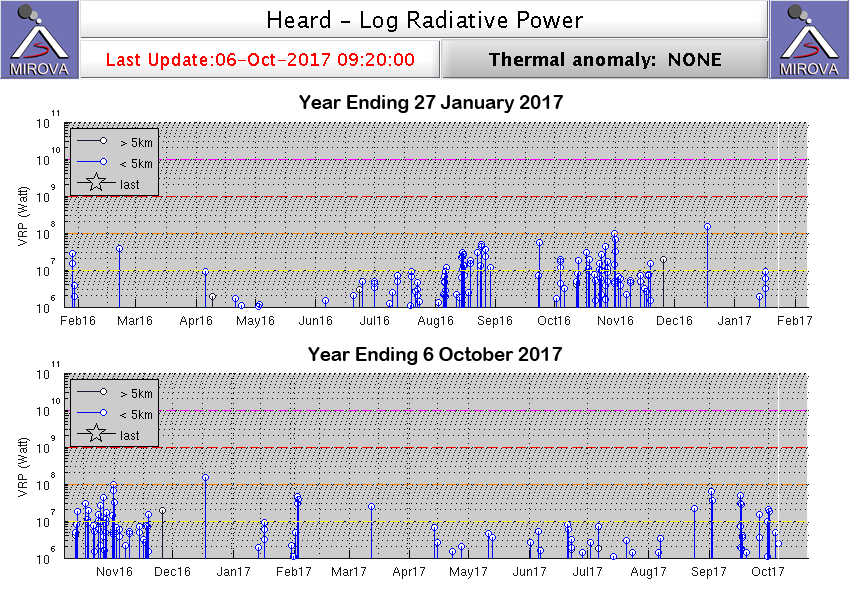 |
Figure 28. A continuous MIROVA signal from 27 January 2016 through 6 October 2017 shows persistent low-level thermal activity through the period with intervals of increased activity during late January 2016, July-August 2016, late September-November 2016, early February 2017, and September 2017. Courtesy of MIROVA. |
The moderate signal at the very end of January 2016 coincides with the CSIRO expedition observing the lava flows on the flank of Big Ben. Low-level MIROVA anomalies were recorded in April and early May 2016. Activity picked up during June, and strengthened through July and August 2016. Late September through November 2016 was a period with heightened activity as well. From December 2016 through August 2017, intermittent low-to-moderate intensity anomalies were recorded every month. Activity appeared to increase briefly during early February and September 2017. On 4 February 2017, Landsat 8 captured a rare clear view that showed fresh lava and debris flows emanating from the summit on top of the snow (figure 29). The longest flow is estimated to be 1,300 m long. False-color infrared imagery of the same image of Mawson Peak also reveals two vents separated by about 250 m (figure 30). Subsequent imagery on 20 and 27 February also detected thermal anomalies at the summit. The visual imagery of the lava flows on 4 February 2017 corresponds to the early February spike in MIROVA thermal anomaly data.
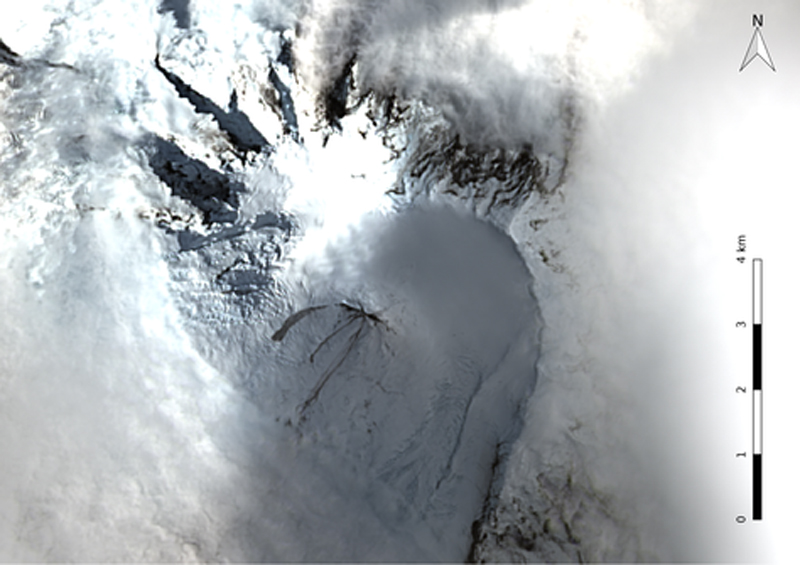 |
Figure 29. Lava and debris flows radiate away from Mawson Peak on Heard Island in this Landsat 8 OLI image captured on 4 February 2017. MIROVA thermal anomaly data show a spike in activity at the same time. Courtesy of NASA and Bill Mitchell (CC-BY). |
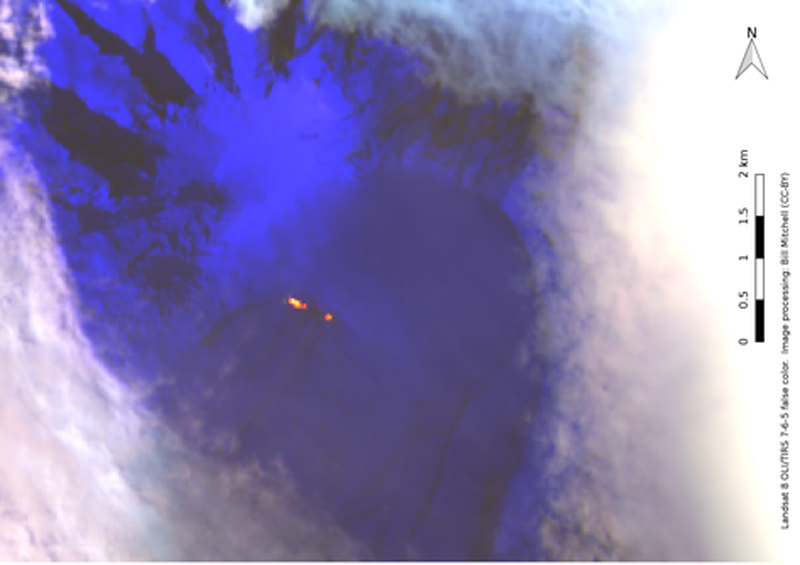 |
Figure 30. False-color infrared imagery of Mawson Peak, Heard Island, 4 February 2017. Two vents are visible in red-yellow, separated by about 250 m. Data source: Landsat 8 OLI/TIRS bands 7-6-5. Image courtesy of Bill Mitchell (CC-BY), data from NASA/USGS. |
Information Contacts: Commonwealth Scientific and Industrial Research Organisation (CSIRO) (URL: http://www.csiro.au/); CSIROscope, CSIRO Blog, Big Ben Erupts: Australia's active volcano cluster blows its lid (URL: https://blog.csiro.au/big-ben-erupts/); Robert W. Schmieder, 2016 Cordell Expedition, 4295 Walnut Blvd., Walnut Creek, CA 94596, Post Expedition report to the Australian Antarctic Division (AAD) (URL: http://www.cordell.org/, http://www.heardisland.org/); MIROVA (Middle InfraRed Observation of Volcanic Activity), a collaborative project between the Universities of Turin and Florence (Italy) supported by the Centre for Volcanic Risk of the Italian Civil Protection Department (URL: http://www.mirovaweb.it/); Hawai'i Institute of Geophysics and Planetology (HIGP) - MODVOLC Thermal Alerts System, School of Ocean and Earth Science and Technology (SOEST), Univ. of Hawai'i, 2525 Correa Road, Honolulu, HI 96822, USA (URL: http://modis.higp.hawaii.edu/); NASA Earth Observatory, EOS Project Science Office, NASA Goddard Space Flight Center, Goddard, Maryland, USA (URL: http://earthobservatory.nasa.gov/); Bill Mitchell, The Inquisitive Rockhopper, Big Ben eruption update 2017-02-27 (URL: https://inquisitiverockhopper.wordpress.com/2017/02/).
Intermittent low-to-moderate thermal anomalies end in mid-November 2017
The most recent eruptive period at Heard began in September 2012 (BGVN 38:01). Direct observations are rare at this remote volcano, but the presence of lava flows can frequently be discerned using infrared satellite data. Thermal anomalies were intermittent, with some episodes of clearly stronger activity, during 2016 and through September 2017 (BGVN 42:10).
During all of 2017, MODIS infrared satellite data analyzed using the MODVOLC algorithm showed anomalies near the summit only on 2, 16, and 26 September, and on 1 and 22 October. The MIROVA system also detected numerous hotspots within 5 km of the volcano through late October. One additional significant anomaly was identified on approximately 12 November 2017 (figure 31). No further significant anomalies were noted through February 2018.
 |
Figure 31. Low to moderate power thermal anomalies in MODIS data were identified by the MIROVA system in September and October, with another on approximately 12 November 2017. Courtesy of MIROVA. |
Information Contacts: MIROVA (Middle InfraRed Observation of Volcanic Activity), a collaborative project between the Universities of Turin and Florence (Italy) supported by the Centre for Volcanic Risk of the Italian Civil Protection Department (URL: http://www.mirovaweb.it/); Hawai'i Institute of Geophysics and Planetology (HIGP) - MODVOLC Thermal Alerts System, School of Ocean and Earth Science and Technology (SOEST), Univ. of Hawai'i, 2525 Correa Road, Honolulu, HI 96822, USA (URL: http://modis.higp.hawaii.edu/).
Thermal hotspots persist at Mawson Peak, lava flows visible in satellite data November 2017-September 2018
Remote Heard Island in the southern Indian Ocean is home to the snow-covered Big Ben stratovolcano, which has had confirmed intermittent activity since 1910. The nearest continental landmass, Antarctica, lies over 1,000 km S. Visual confirmation of lava flows on Heard are rare; thermal anomalies and hotspots detected by satellite-based instruments provide the most reliable information about eruptive activity. Thermal alerts reappeared in September 2012 after a four-year hiatus (BGVN 38:01), and have been intermittent since that time. Information comes from instruments on the European Space Agency's (ESA) Sentinel-2 satellite and MODVOLC and MIROVA thermal anomaly data from other satellite instruments. This report reviews evidence for eruptive activity from November 2017 through September 2018.
Satellite observations indicated intermittent hot spots at the summit through 12 December 2017. A few observations in January and February 2018 suggested steam plumes at the summit, but no significant thermal activity. An infrared pixel indicative of renewed thermal activity appeared again on 7 March, and similar observations were made at least twice each month in April and May. Activity increased significantly during June and remained elevated through September 2018 with multiple days of hotspot observations in satellite data each of those months, including images that indicated lava flowing in different directions from Mawson Peak. MODVOLC and MIROVA data also indicated increased thermal activity during June-September 2018.
Activity during October-December 2017. MIROVA thermal anomalies recorded during October 2017 indicated ongoing thermal activity at Heard (figure 32). This was confirmed by Sentinel-2 satellite imagery that revealed hotpots at the summit on ten different days in October (3, 6, 8, 13, 16, 21, 23, 26, 28, and 31), and included images suggesting lava flows descending from the summit in different directions on different days (figure 33).
 |
Figure 32. MODVOLC thermal alerts indicated significant thermal activity at Heard during October 2017 that tapered off during November. Intermittent signals appeared in December 2017, March, and April 2018, and a strong signal returned in June 2018 that continued through September. Courtesy of MIROVA. |
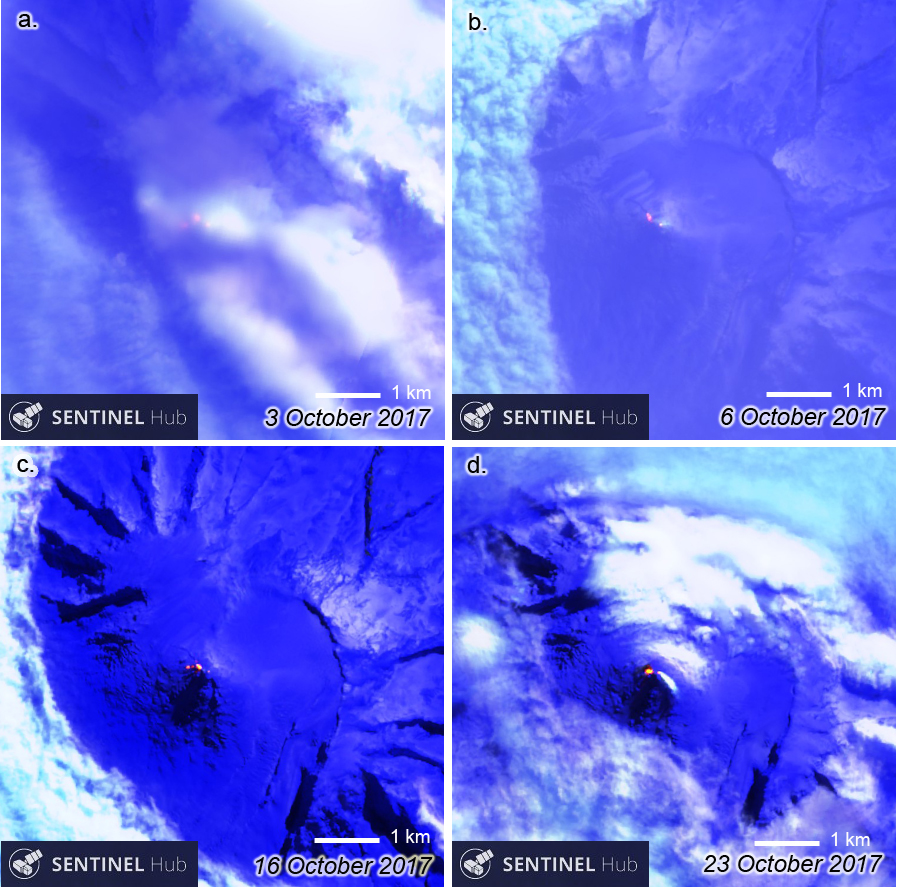 |
Figure 33. Sentinel-2 images of Heard Island's Big Ben volcano during October 2017 showed strong evidence of active effusive activity. a) 3 October 2017: at least three hot spots were visible through cloud cover at the summit and W of Mawson Peak, suggesting active lava flows. b) 6 October 2017: a small hot spot is visible at the peak with a small steam plume, and a larger hotspot to the NW suggested a still active lava flow. c) 16 October 2017: a small hotspot at the summit and larger hotspots W of the summit were indicative of ongoing flow activity. d) 23 October 2017: a steam plume drifted SE from a small summit hotspot and a larger hotspot to the W suggested a lava lake or active flow. Sentinel-2 images with Atmospheric Penetration view (bands 12, 11, and 8A), courtesy of Sentinel Hub Playground. |
The MODVOLC thermal alert data showed no further alerts for the year after 22 October 2017, and the MIROVA system anomalies tapered off in mid-November 2017. The Sentinel-2 satellite imagery, however, continued to record intermittent hotspots at and around Mawson Peak, the summit of Big Ben volcano, into December 2017 (figure 34). Hotspots were visible during six days in November (7, 15, 20, 25, 27, and 30) and three days during December (5, 7, and 12).
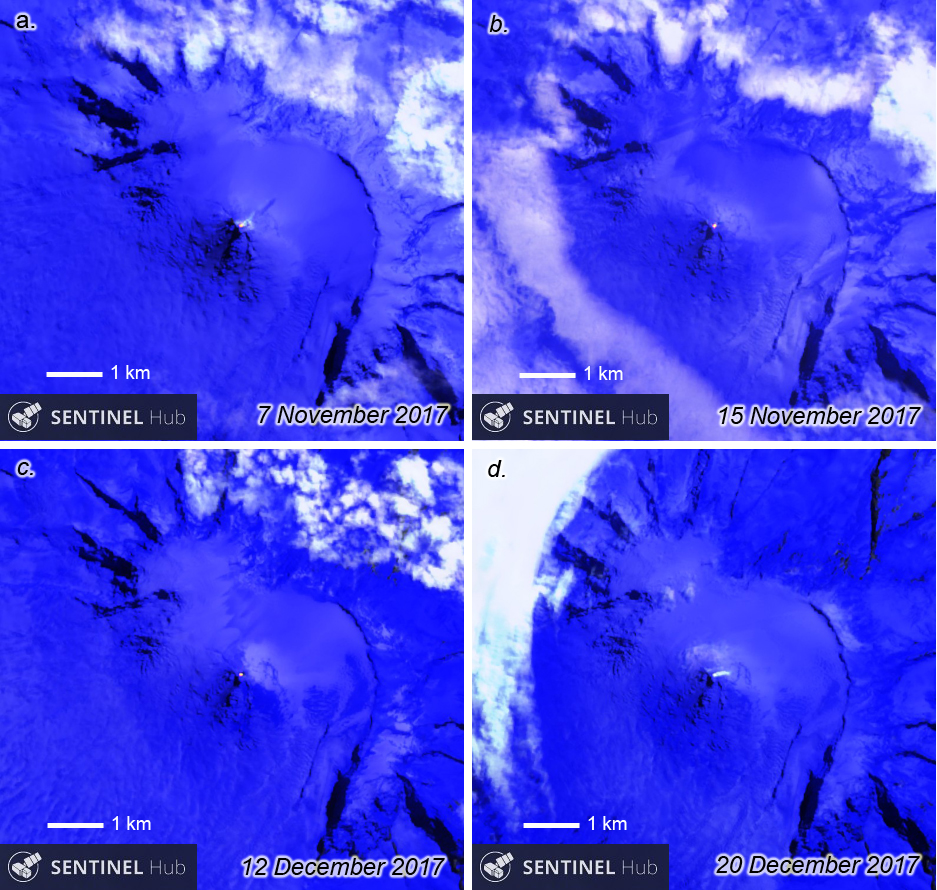 |
Figure 34. Sentinel-2 images of Heard Island's Big Ben volcano showed reduced but ongoing thermal activity during November and December 2017. a) 7 November 2017: a steam plume drifts NE from a hotspot at Mawson Peak. b and c) 15 November and 12 December 2017: a small hotspot is distinct at the summit. d) 20 December 2017: a steam plume drifts east from the peak, but no clear hotspot is visible. Sentinel-2 images with Atmospheric Penetration view (bands 12, 11, and 8A), courtesy of ESA Sentinel Hub Playground. |
Activity during January-May 2018. The satellite images during January and February 2018 were indicative of steam plumes at the summit, but distinct thermal signals reappeared on 7 and 12 March 2018 (figure 35). In spite of extensive cloud cover, the Sentinel-2 imagery also captured thermal signals twice each month in April (4 and 14) and May (9 and 14) (figure 36).
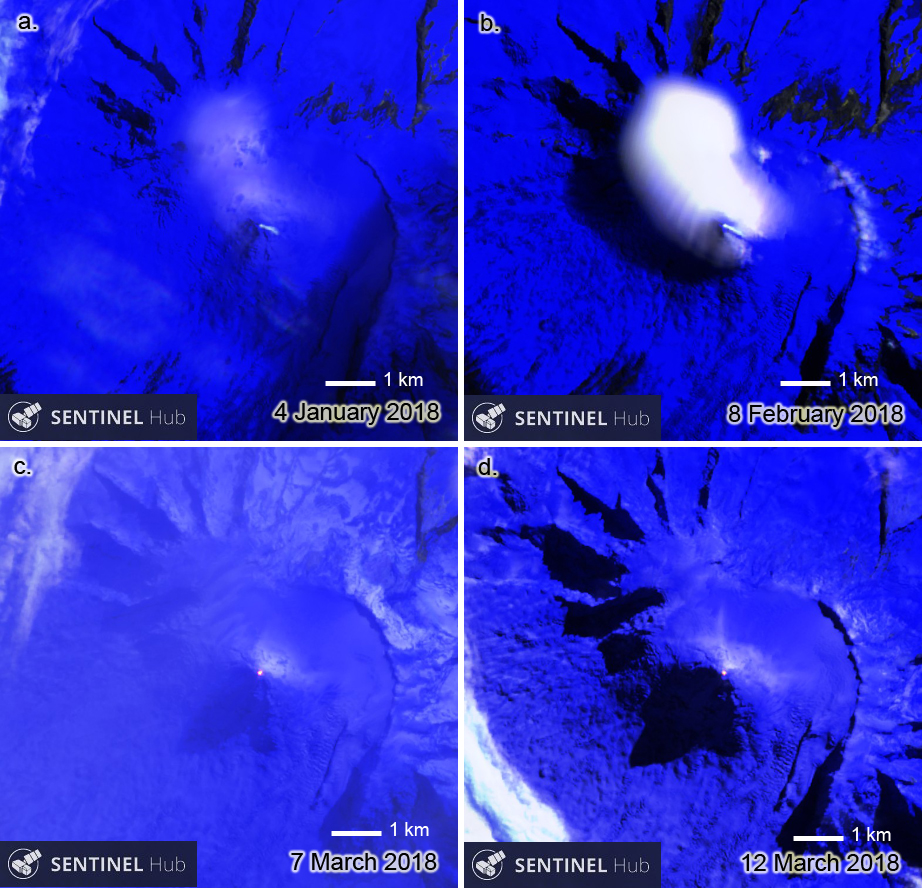 |
Figure 35. Sentinel-2 images of Heard Island's Big Ben volcano showed only steam plumes at the summit during January and February, but hotspots reappeared in March 2018. a) 4 January 2018: a steam plume drifts SE from the summit under clear skies. b) 8 February 2018: a steam plume drifts SE from the summit adjacent to a large cloud on the N side of the volcano. c) 7 March 2018: the first hotspot in about three months is visible at the summit. d) 12 March 2018: a distinct hotspot is visible at Mawson Peak. Sentinel-2 images with Atmospheric Penetration view (bands 12, 11, and 8A), courtesy of ESA Sentinel Hub Playground. |
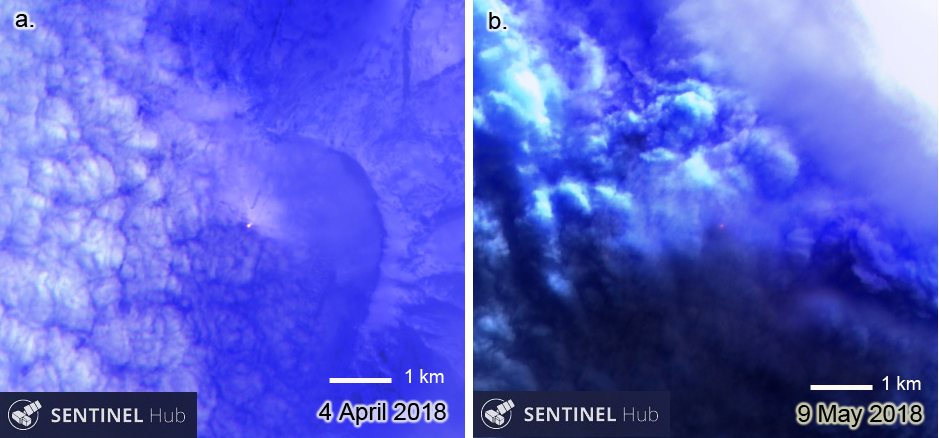 |
Figure 36. Sentinel-2 images of Heard Island's Big Ben volcano showed intermittent low-level thermal activity during April and May 2018. a) 4 April 2018: a small hotspot is visible at the summit through a hazy atmosphere. b) 9 May 2018: a distinct hotspot glows from the summit beneath cloud cover. Sentinel-2 images with Atmospheric Penetration view(bands 12, 11, and 8A), courtesy of ESA Sentinel Hub Playground. |
Activity during June-September 2018. Thermal signals increased significantly in the satellite data during June 2018. The sizes of the thermal anomalies were bigger, and they were visible at least nine days of the month (3, 5, 8, 10, 15, 18, 23, 25, and 30). Five substantial thermal signals appeared during July (3, 10, 15, 18, and 28); images on 23 June and 3 July distinctly show a lava flow trending NE from the summit (figure 37). MODVOLC thermal alerts appeared in June 2018 on three days (2, 26, and 27) and on four days during July (7, 8, 9, 10) indicating increased activity during this time. The MIROVA thermal signals also showed a substantial increase in early June that peaked in mid-July and remained steady through September 2018 (figure 32).
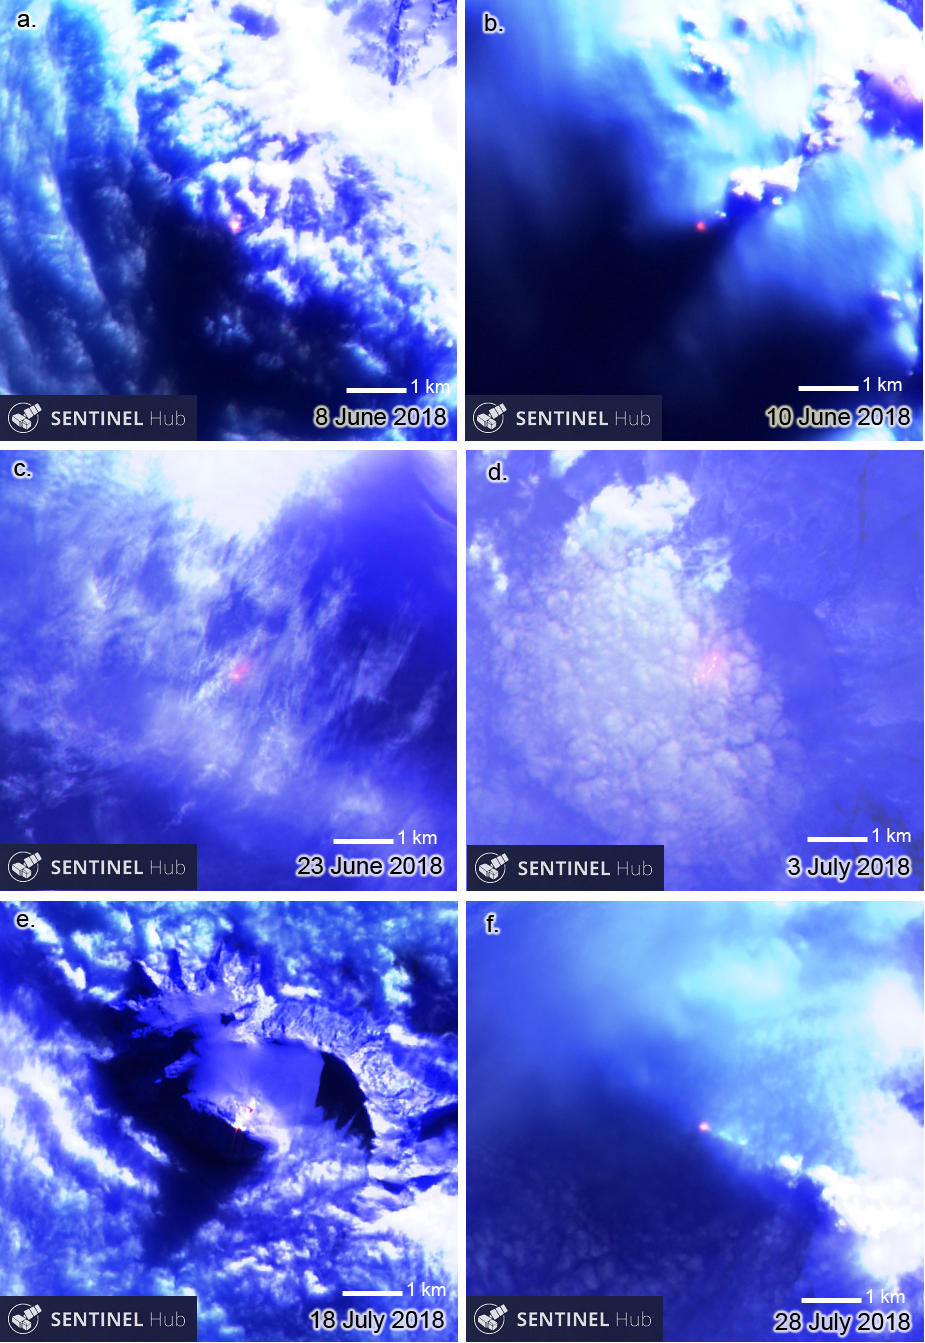 |
Figure 37. Sentinel-2 images of Heard Island's Big Ben volcano showed significantly increased thermal activity during June and July 2018. a) 8 June 2018: a substantial hotspot is visible through the cloud cover at the summit of Big Ben. b) 10 June 2018: the darker red hotspot at Mawson Peak was significantly larger than it was earlier in the year. c) 23 June 2018: the first multi-point hotspot since 31 October shows a distinct glow trending NE from the summit. d) 3 July 2018: a trail of hotspots defines a lava flow curving NNE from Mawson Peak. e) 18 July 2018: a second significant hotpot is visible a few hundred meters NE of the summit hotspot indicating a still active flow. f) 28 July 2018: the summit hotspot continued to glow brightly at the end of July, but no second hotspot was visible. Sentinel-2 images with Atmospheric Penetration view (bands 12, 11, and 8A), courtesy of ESA Sentinel Hub Playground. |
Six images in August (2, 7, 9, 22, 27, 29) showed evidence of active lava at the summit, and suggested flows both NE and SE from the summit that were long enough to cause multiple hotspots (figure 38). During September and early October 2018 the satellite images continued to show multiple hotspots that indicated flow activity tens of meters SE from the summit multiple days of each month (figure 39).
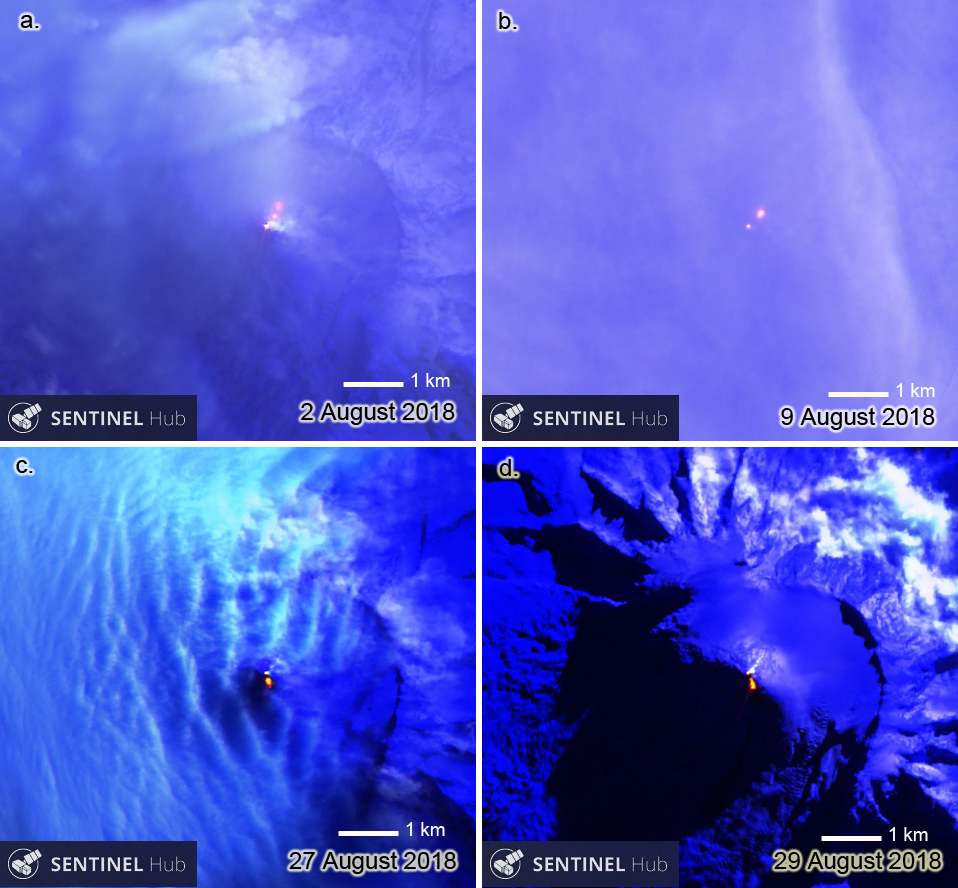 |
Figure 38. Sentinel-2 images of Heard Island's Big Ben volcano showed lava flow activity in two different directions from the summit during August 2018. a) 2 August 2018: lava flows NE from Mawson Peak while a steam plume drifts E from the summit. b) 9 August 2018: a second hotspot NE of the summit hotspot indicates continued flow activity in the same area observed on 2 August. c and d) 27 and 29 August 2018: a different secondary hotspot appeared SSE from the summit indicating a distinct flow event from the one recorded earlier in August. Sentinel-2 images with Atmospheric Penetration view (bands 12, 11, and 8A), courtesy of ESA Sentinel Hub Playground. |
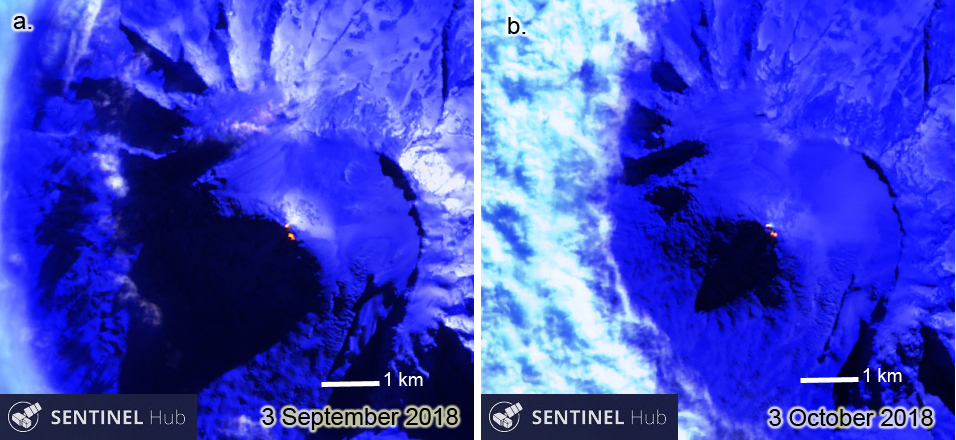 |
Figure 39. Sentinel-2 images of Heard Island's Big Ben volcano in September and October 2018 showed hotspots indicating active flows SE of the summit on multiple days. a) 3 September 2018: a small hotspot at the summit and a larger hotspot SE of the summit indicated continued flow activity. b) 3 October 2018: a small steam plume drifted east from a small hotspot at the summit and a larger pair of hotspots to the SE indicated continued effusive activity. Sentinel-2 images with Atmospheric Penetration view (bands 12, 11, and 8A), courtesy of ESA Sentinel Hub Playground. |
Information Contacts: Sentinel Hub Playground (URL: https://www.sentinel-hub.com/explore/sentinel-playground); Hawai'i Institute of Geophysics and Planetology (HIGP) - MODVOLC Thermal Alerts System, School of Ocean and Earth Science and Technology (SOEST), Univ. of Hawai'i, 2525 Correa Road, Honolulu, HI 96822, USA (URL: http://modis.higp.hawaii.edu/); MIROVA (Middle InfraRed Observation of Volcanic Activity), a collaborative project between the Universities of Turin and Florence (Italy) supported by the Centre for Volcanic Risk of the Italian Civil Protection Department (URL: http://www.mirovaweb.it/).
Thermal hotspots continue during October 2018-March 2019 at the summit and on the upper flanks
Heard Island, in the Southern Indian Ocean, includes the large Big Ben stratovolcano and the smaller, apparently inactive, Mt. Dixon. Because of the island's remoteness, satellites are the primary monitoring tool. Big Ben has been active intermittently since 1910, and was active during October 2017-September 2018 (BGVN 43:10). Activity continued during October 2018-March 2019.
Satellite photos using Sentinel Hub showed hotspots every month between October 2018 and March 2019. Because the area was frequently covered by a heavy cloud layer, most of the hotspot signals were partially obscured. Though thermal anomalies are usually seen at summit vents, on 18 October 2018 an anomaly was present about 300 m down the E flank. Similarly, on 1 January 2019, a weak anomaly beginning about 200 m down the NW flank was about 300 m long (figure 40).
The MIROVA (Middle InfraRed Observation of Volcanic Activity) system detected three hotspots, two in October and one in early November 2018, all of low radiative power. There were no MODVOLC alert pixels during this period.
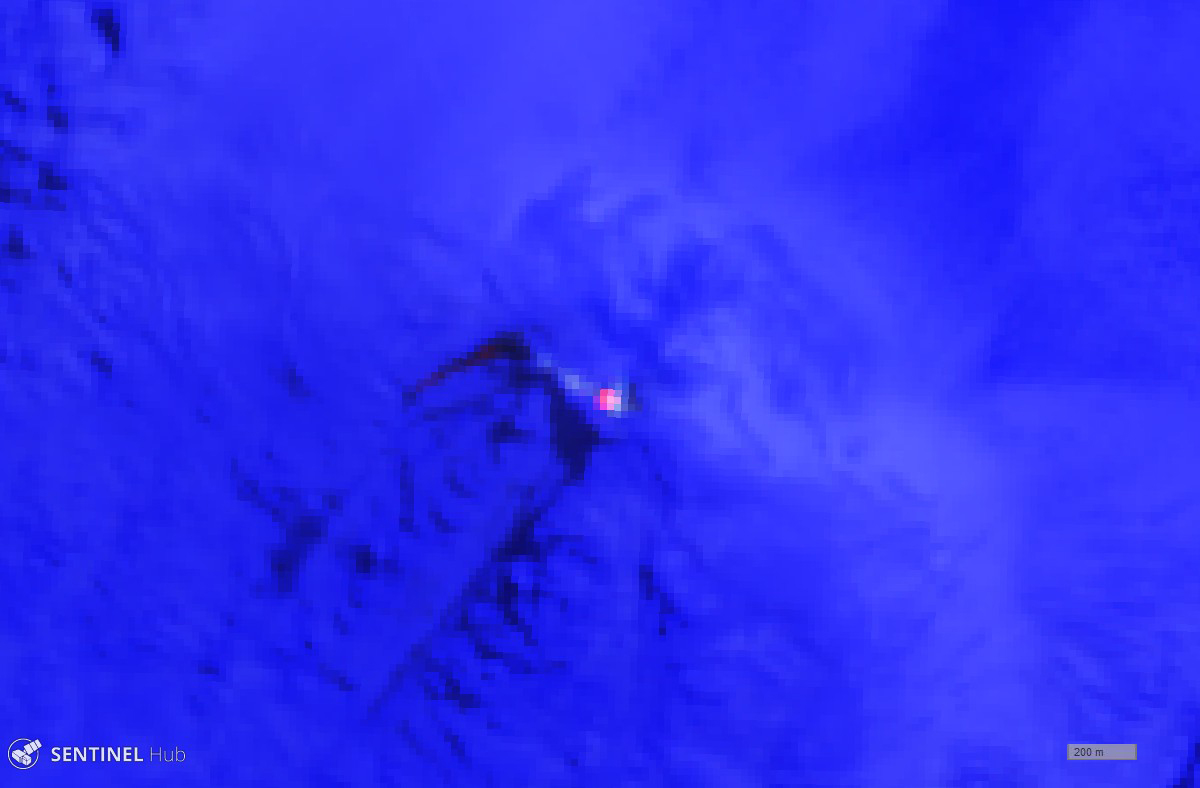 |
Figure 40. Sentinel-2 L1C image of Heard Island's Big Ben volcano on 1 January 2019 one summit hotspot and an elongated thermal anomaly to the NW. Scale bar (bottom right) is 200 m. The photo was taken in atmospheric penetration view (bands 12, 11, and 8A), courtesy of Sentinel Hub Playground. |
Information Contacts: Sentinel Hub Playground (URL: https://www.sentinel-hub.com/explore/sentinel-playground); Hawai'i Institute of Geophysics and Planetology (HIGP) - MODVOLC Thermal Alerts System, School of Ocean and Earth Science and Technology (SOEST), Univ. of Hawai'i, 2525 Correa Road, Honolulu, HI 96822, USA (URL: http://modis.higp.hawaii.edu/); MIROVA (Middle InfraRed Observation of Volcanic Activity), a collaborative project between the Universities of Turin and Florence (Italy) supported by the Centre for Volcanic Risk of the Italian Civil Protection Department (URL: http://www.mirovaweb.it/).
Ongoing thermal anomalies at the summit crater during April-September 2019
Heard Island, in the Southern Indian Ocean, is about 4,000 km from its closest point to Australia and about 1,500 km from the closest point in Antarctica. Because of the island's remoteness, monitoring is primarily accomplished by satellites. The Big Ben volcano has been active intermittently since 1910, if not before (BGVN 42:10), and thermal anomalies have been observed every month since June 2018 (BGVN 43:10, 44:04). The current reporting period is from April to September 2019.
During April-September 2019, only one thermal anomaly was detected with the MODIS satellite instruments analyzed using the MODVOLC algorithm, and that was on 10 June (2 pixels). The MIROVA (Middle InfraRed Observation of Volcanic Activity) volcano hotspot detection system, also based on analysis of MODIS data, detected a few scattered thermal alerts in late May-early June and three in September; most were between 1-2 km of the summit and of low to moderate power.
The island is usually covered by heavy clouds, obscuring satellite views. However, Sentinel-2 satellite imagery detected cloud-obscured thermal anomalies during the reporting period, most likely due to a persistent lava lake and possibly lava flows (BGVN 41:08).
Information Contacts: Sentinel Hub Playground (URL: https://www.sentinel-hub.com/explore/sentinel-playground); Hawai'i Institute of Geophysics and Planetology (HIGP) - MODVOLC Thermal Alerts System, School of Ocean and Earth Science and Technology (SOEST), Univ. of Hawai'i, 2525 Correa Road, Honolulu, HI 96822, USA (URL: http://modis.higp.hawaii.edu/); MIROVA (Middle InfraRed Observation of Volcanic Activity), a collaborative project between the Universities of Turin and Florence (Italy) supported by the Centre for Volcanic Risk of the Italian Civil Protection Department (URL: http://www.mirovaweb.it/).
Eruptive activity including a lava flow during October 2019-April 2020
Heard Island is located on the Kerguelen Plateau in the southern Indian Ocean and contains Big Ben, a snow-covered stratovolcano with intermittent volcanism reported since 1910. Due to its remote location, visual observations are rare; therefore, thermal anomalies and hotspots detected by satellite-based instruments are the primary source of information. This report updates activity from October 2019 to April 2020.
MIROVA (Middle InfraRed Observation of Volcanic Activity) analysis of MODIS satellite data showed three prominent periods of strong thermal anomaly activity during this reporting period: late October 2019, December 2019, and the end of April 2020 (figure 41). These thermal anomalies were relatively strong and occurred within 5 km of the summit. Similarly, the MODVOLC algorithm reported a total of six thermal hotspots during 28 October, 1 November 2019, and 26 April 2020.
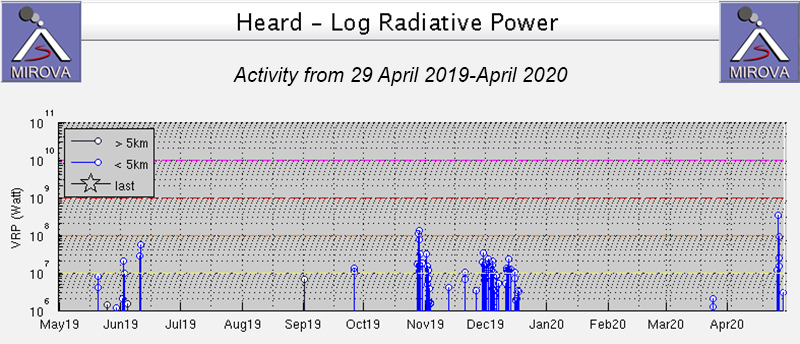 |
Figure 41. Thermal anomalies at Heard from 29 April 2019 through April 2020 as recorded by the MIROVA system (Log Radiative Power) were strong and frequent in late October, during December 2019, and at the end of April 2020. Courtesy of MIROVA. |
Six thermal satellite images ranging from late October 2019 to late March showed evidence of active lava at the summit (figure 42). These images show hot material, possibly a lava flow, extending SW from the summit; a hotspot also remained at the summit. Cloud cover was pervasive during the majority of this reporting period, especially in April 2020, though gas-and-steam emissions were visible on 25 April through the clouds.
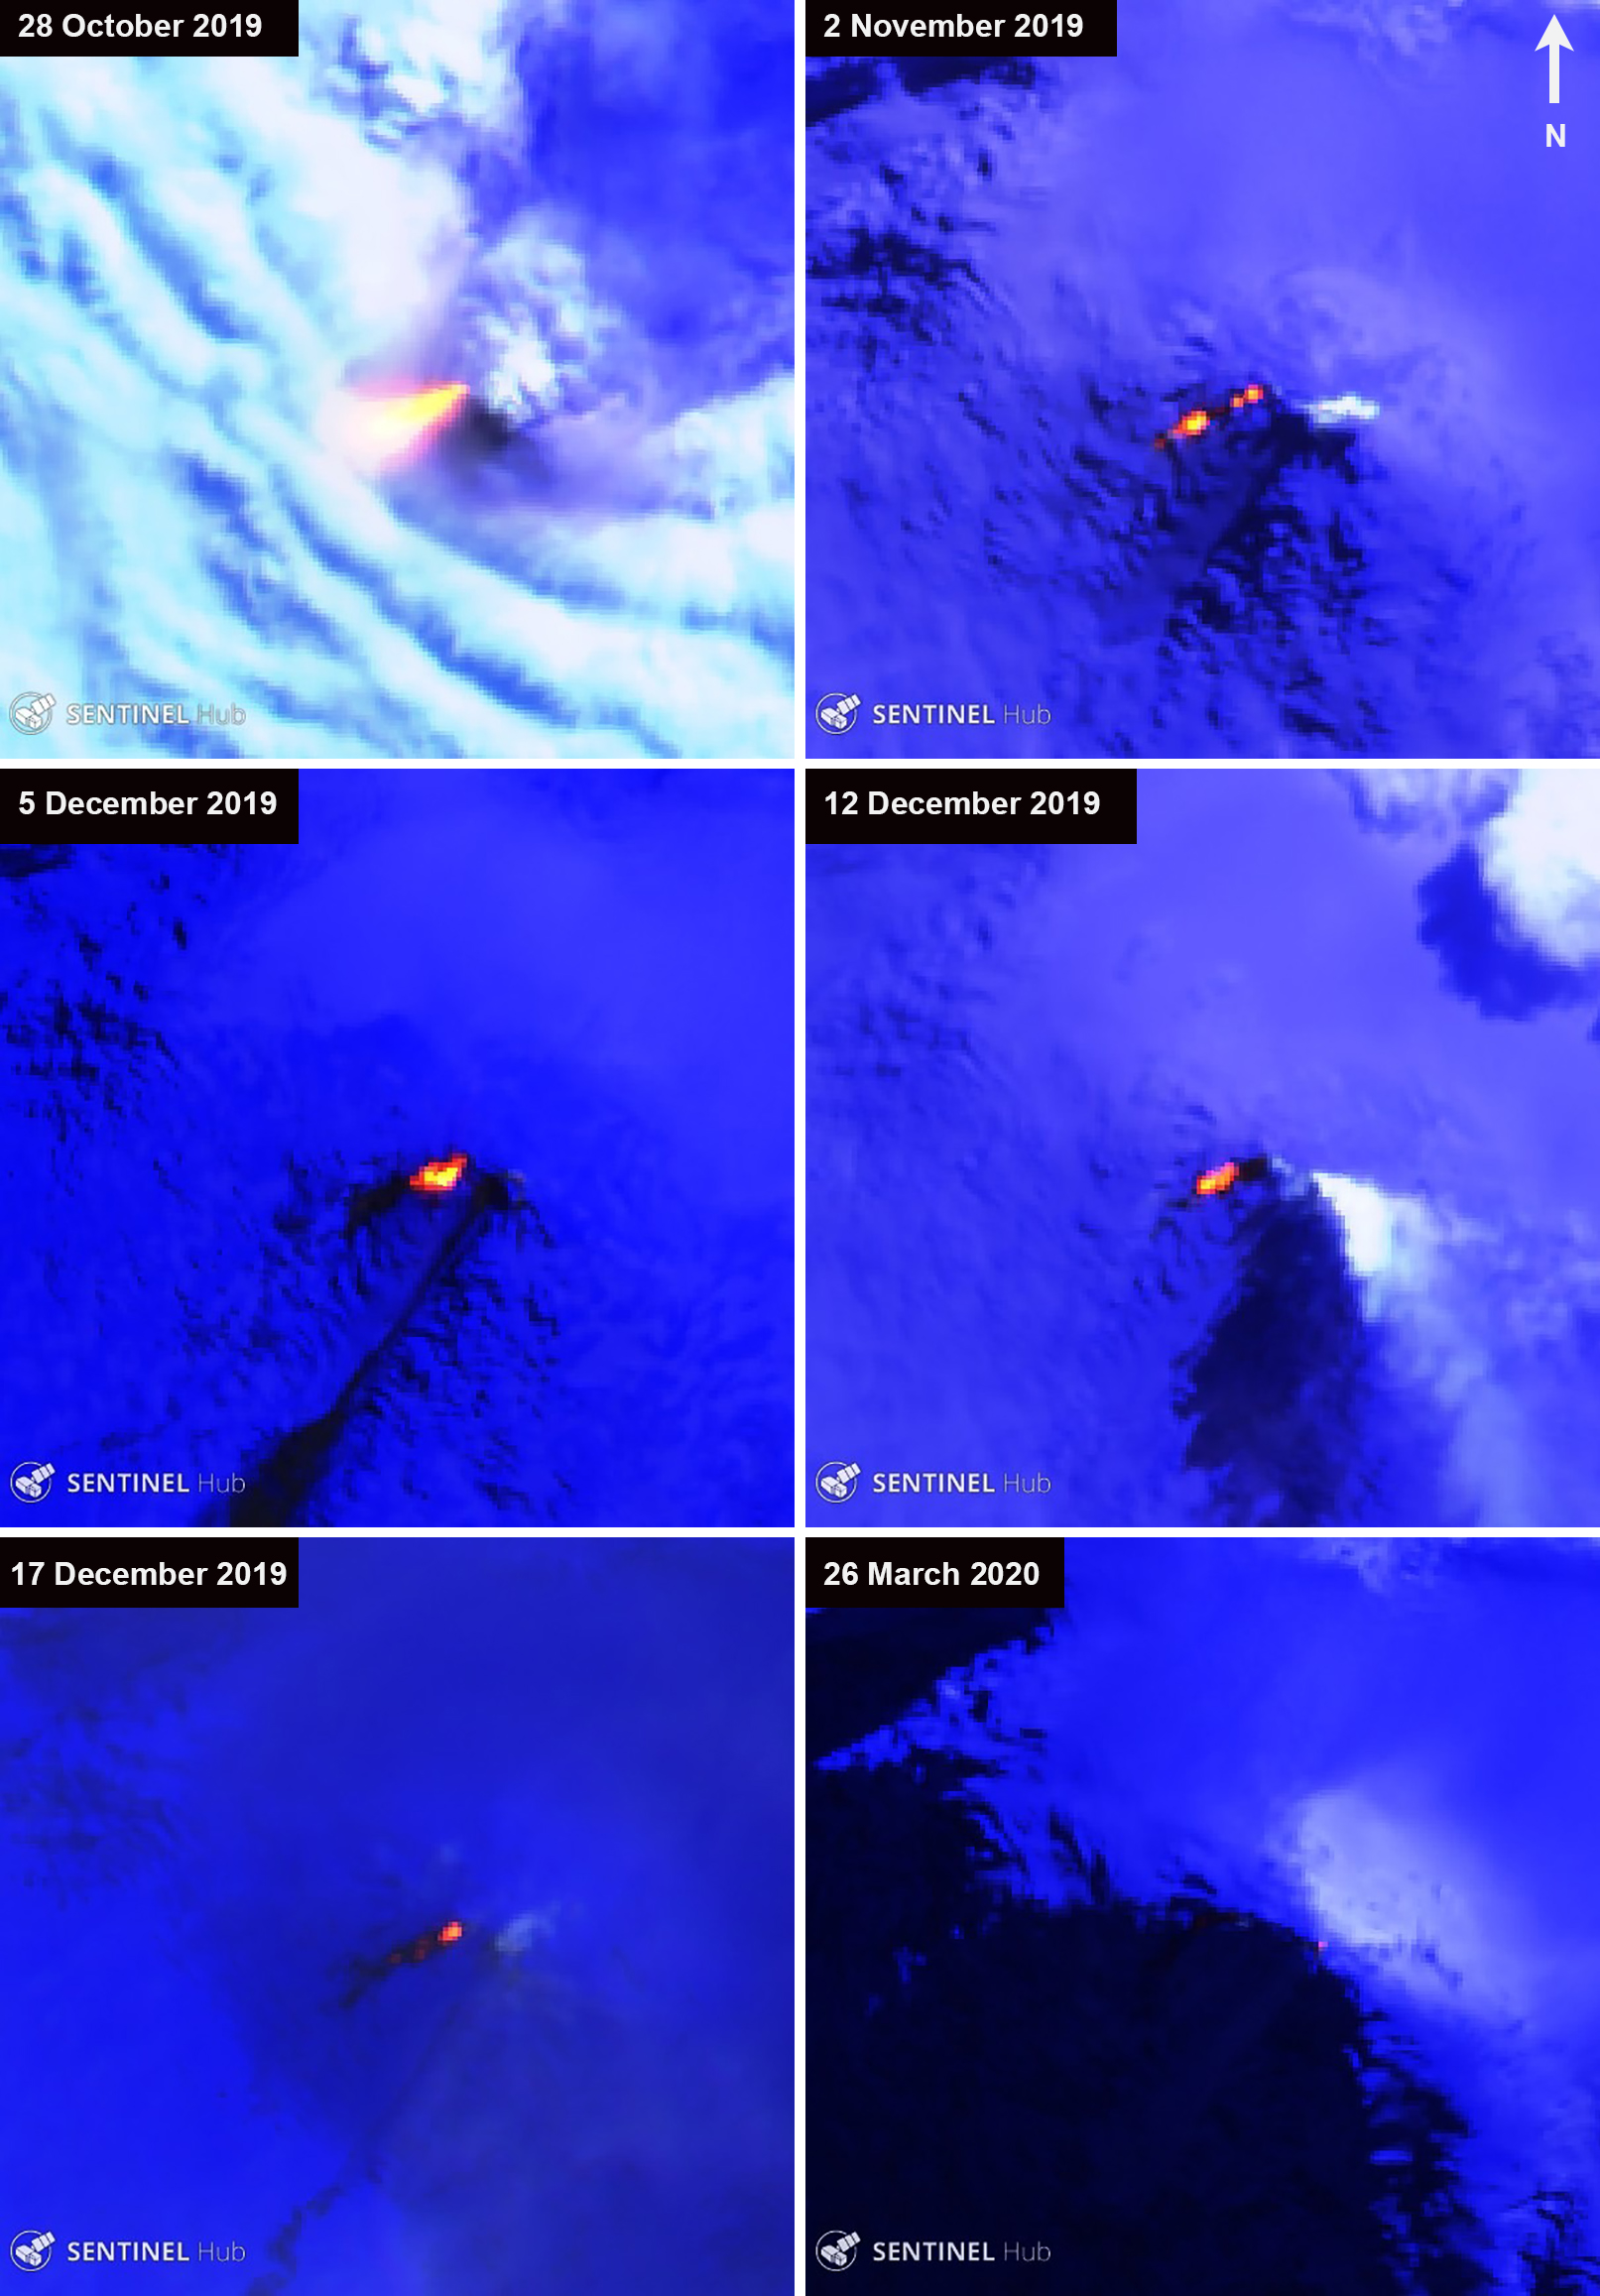 |
Figure 42. Thermal satellite images of Heard Island’s Big Ben showing strong thermal signatures representing a lava flow in the SW direction from 28 October to 17 December 2019. These thermal anomalies are located NW from Mawson Peak. A faint thermal anomaly is also captured on 26 March 2020. Satellite images with atmospheric penetration (bands 12, 11, and 8A), courtesy of Sentinel Hub Playground. |
Information Contacts: MIROVA (Middle InfraRed Observation of Volcanic Activity), a collaborative project between the Universities of Turin and Florence (Italy) supported by the Centre for Volcanic Risk of the Italian Civil Protection Department (URL: http://www.mirovaweb.it/); Hawai'i Institute of Geophysics and Planetology (HIGP) - MODVOLC Thermal Alerts System, School of Ocean and Earth Science and Technology (SOEST), Univ. of Hawai'i, 2525 Correa Road, Honolulu, HI 96822, USA (URL: http://modis.higp.hawaii.edu/); Sentinel Hub Playground (URL: https://www.sentinel-hub.com/explore/sentinel-playground).
Persistent thermal anomalies in the summit crater from June through October 2020
The remote Heard Island is located in the southern Indian Ocean and contains the Big Ben stratovolcano, which has had intermittent activity since 1910. The island’s activity, characterized by thermal anomalies and occasional lava flows (BGVN 45:05), is primarily monitored by satellite instruments. This report updates activity from May through October 2020 using information from satellite-based instruments.
MIROVA (Middle InfraRed Observation of Volcanic Activity) analysis of MODIS satellite data showed frequent thermal activity in early June that continued through July (figure 43). Intermittent, slightly higher-power thermal anomalies were detected in late August through mid-October, the strongest of which occurred in October. Two of these anomalies were also detected in the MODVOLC algorithm on 12 October.
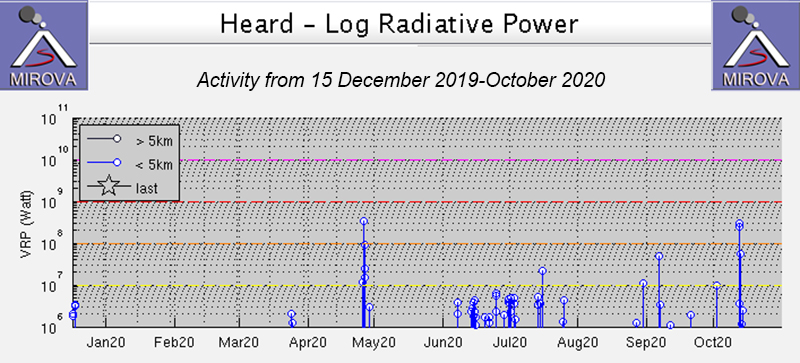 |
Figure 43. A small pulse in thermal activity at Heard was detected in early June and continued through July 2020, according to the MIROVA system (Log Radiative Power). Thermal anomalies appeared again starting in late August and continued intermittently through mid-October 2020. Courtesy of MIROVA. |
Sentinel-2 thermal satellite imagery showed a single thermal anomaly on 3 May. In comparison to the MIROVA graph, satellite imagery showed a small pulse of strong thermal activity at the summit of Big Ben in June (figure 44). Some of these thermal anomalies were accompanied by gas-and-steam emissions. Persistent strong thermal activity continued through July. Starting on 2 July through at least 17 July two hotspots were visible in satellite imagery: one in the summit crater and one slightly to the NW of the summit (figure 45). Some gas-and-steam emissions were seen rising from the S hotspot in the summit crater. In August the thermal anomalies had decreased in strength and frequency but persisted at the summit through October (figure 45).
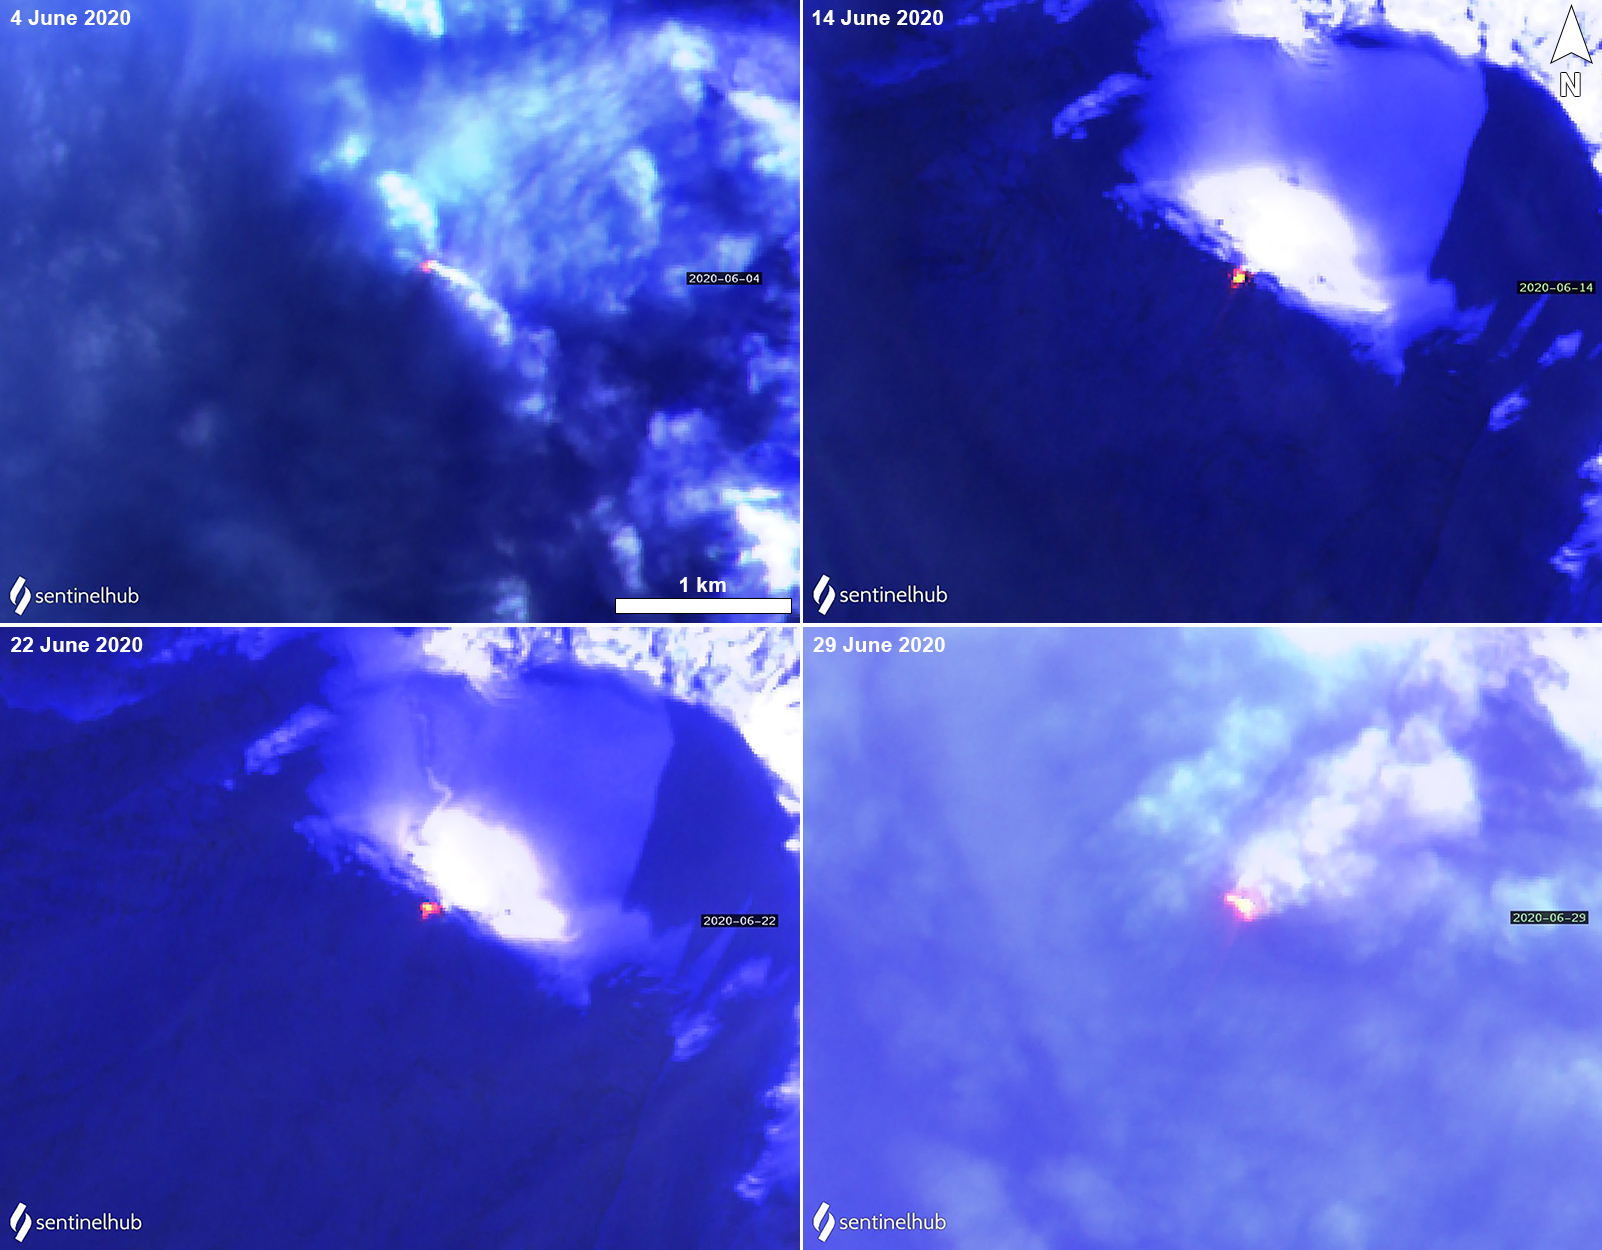 |
Figure 44. Thermal satellite images of Heard Island’s Big Ben volcano showed strong thermal signatures (bright yellow-orange) sometimes accompanied by gas-and-steam emissions drifting SE (top left) and NE (bottom right) during June 2020. Sentinel-2 satellite images with “Atmospheric penetration” (bands 12, 11, 8A) rendering; courtesy of Sentinel Hub Playground. |
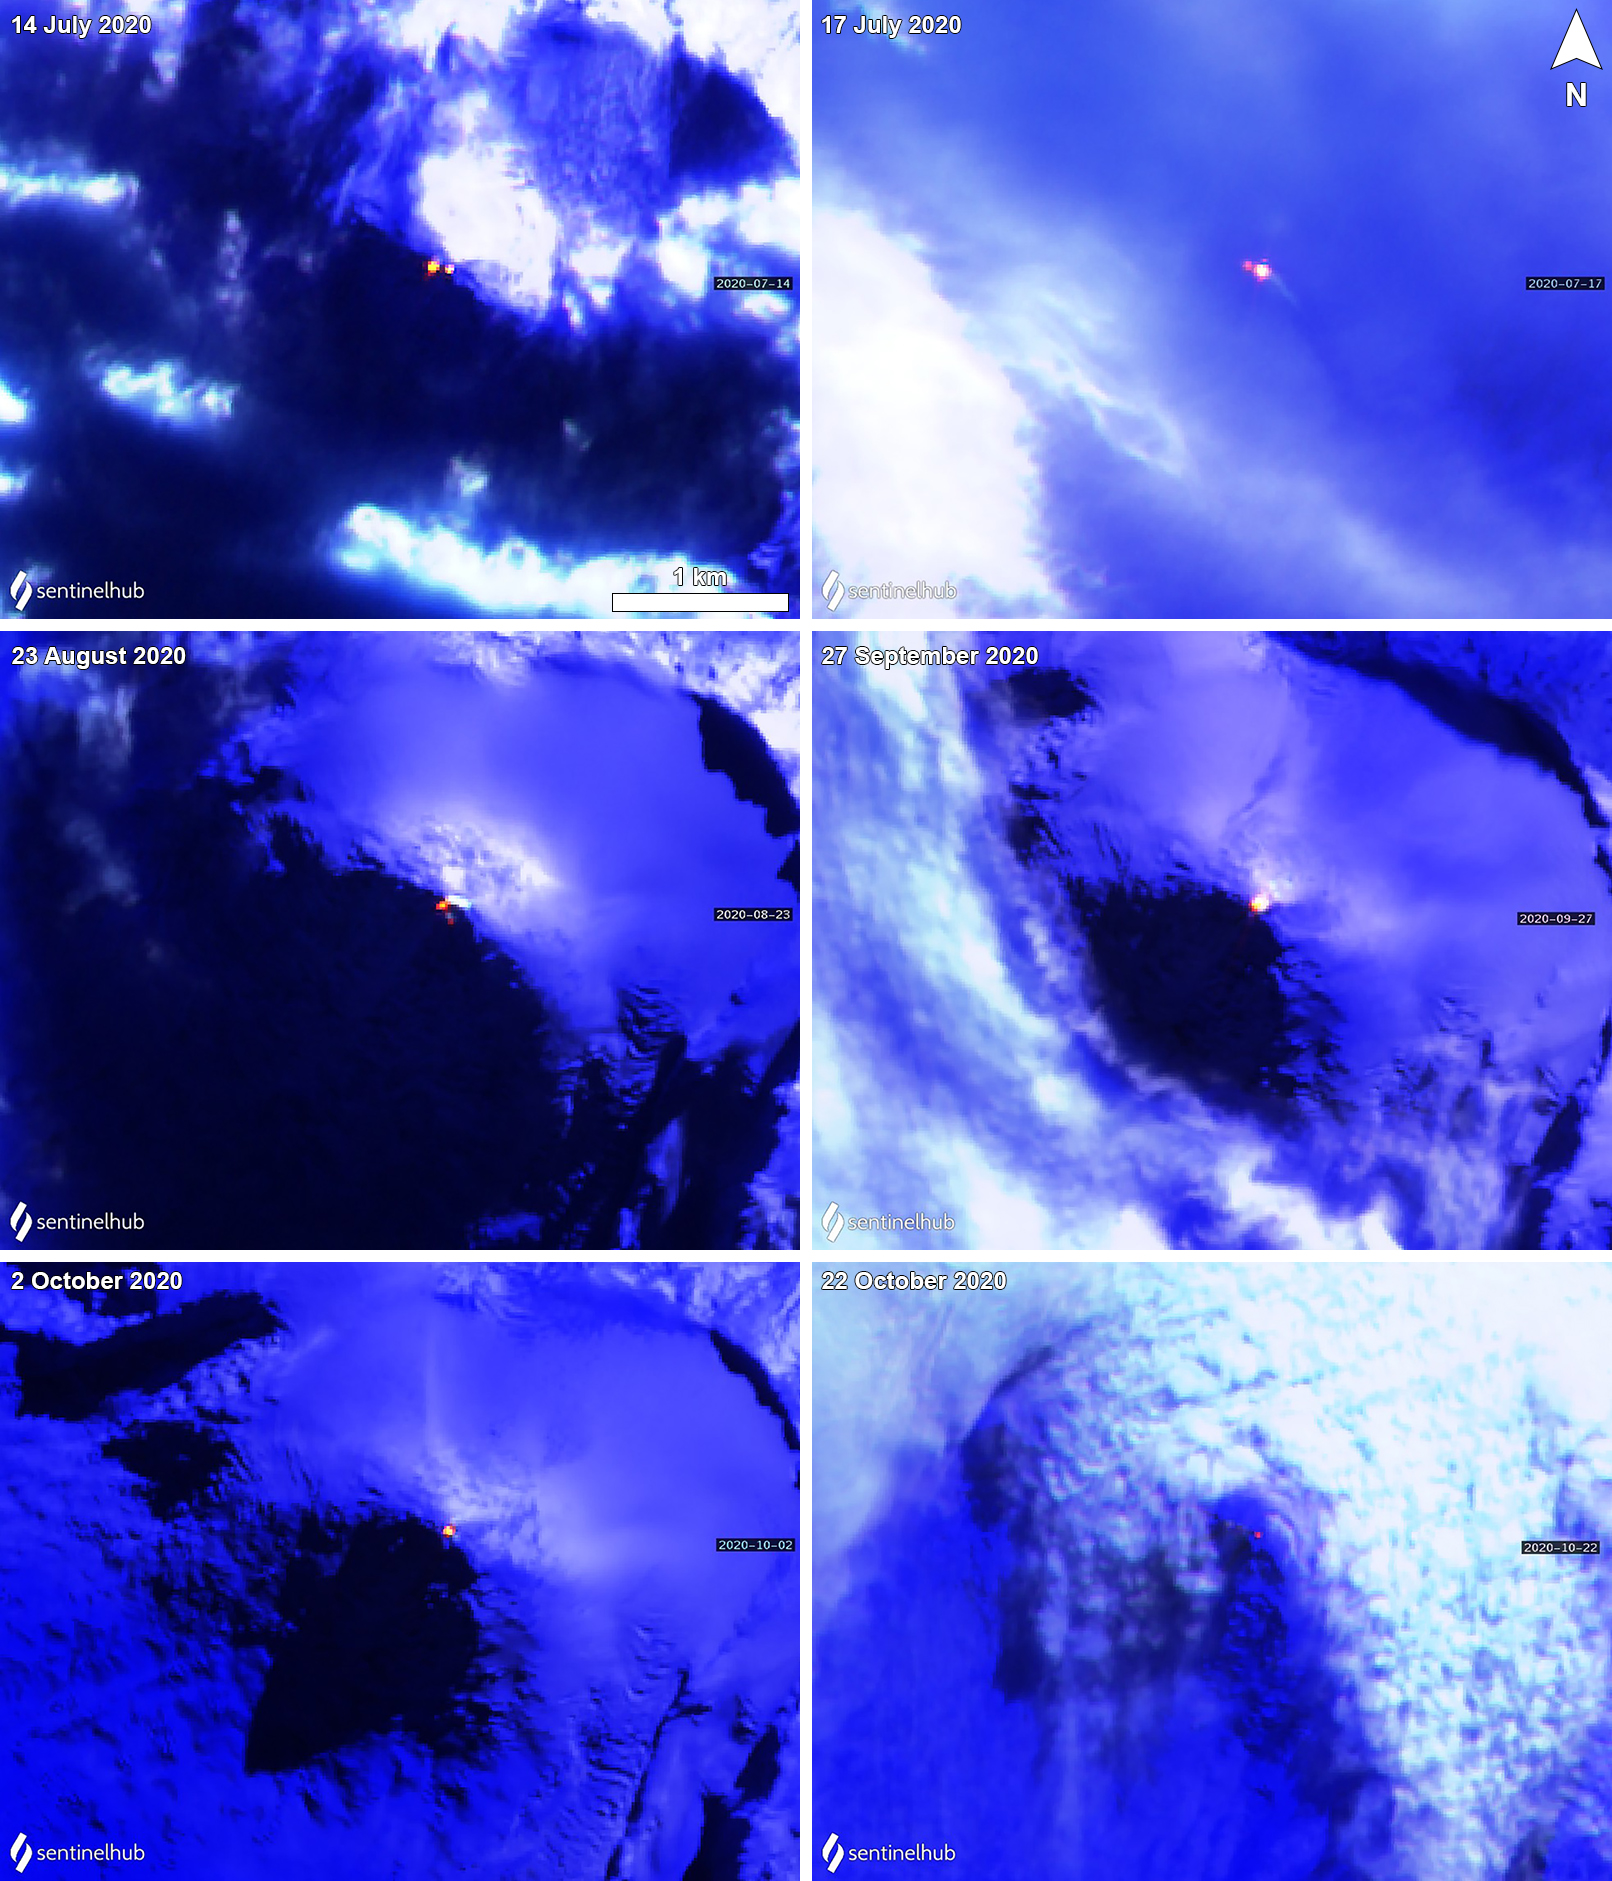 |
Figure 45. Thermal satellite images of Heard Island’s Big Ben volcano showed persistent thermal anomalies (bright yellow-orange) near the summit during July through October 2020. During 14 (top left) and 17 (top right) July a second hotspot was visible NW of the summit. By 22 October (bottom right) the thermal anomaly had significantly decreased in strength in comparison to previous months. Sentinel-2 satellite images with “Atmospheric penetration” (bands 12, 11, 8A) rendering; courtesy of Sentinel Hub Playground. |
Information Contacts: MIROVA (Middle InfraRed Observation of Volcanic Activity), a collaborative project between the Universities of Turin and Florence (Italy) supported by the Centre for Volcanic Risk of the Italian Civil Protection Department (URL: http://www.mirovaweb.it/); Hawai'i Institute of Geophysics and Planetology (HIGP) - MODVOLC Thermal Alerts System, School of Ocean and Earth Science and Technology (SOEST), Univ. of Hawai'i, 2525 Correa Road, Honolulu, HI 96822, USA (URL: http://modis.higp.hawaii.edu/); Sentinel Hub Playground (URL: https://www.sentinel-hub.com/explore/sentinel-playground).
Thermal anomalies during November 2020 and January 2021
Heard is a remote island located in the southern Indian Ocean that contains the Big Ben stratovolcano, which has had intermittent activity since 1910. More recent activity since 2012 through October 2020 has been characterized by thermal anomalies in the summit crater and lava flows, primarily identified based on information from satellite data (BGVN 45:11). This report covers similar activity that continued during November 2020 and January 2021.
MIROVA (Middle InfraRed Observation of Volcanic Activity) analysis of MODIS satellite data shows a total of three thermal anomalies of varying power during November 2020 (figure 46). Sentinel-2 thermal satellite imagery shows a single thermal anomaly on 9 November 2020 and later, on 11 November two strong thermal anomalies, possibly two lava flows, were observed descending the S and SW flanks (figure 47). These thermal anomalies were also detected by the MIROVA system. Weaker thermal anomalies were observed on 18 and 20 January 2021 in the summit crater. No new thermal activity was detected after November through April 2021 by the MIROVA system.
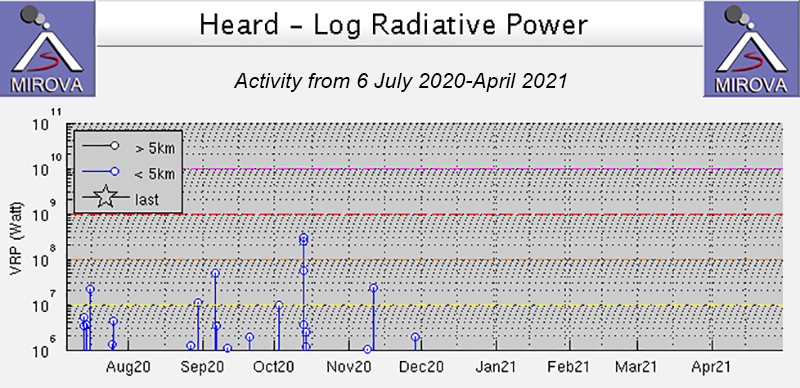 |
Figure 46. Only three thermal anomalies at Heard were detected during November 2020, according to the MIROVA system, shown in this Log Radiative Power graph. The strongest thermal anomaly represents the two possible lava flows that were observed in Sentinel-2 infrared satellite data. No thermal anomalies were observed during December through April 2021. Courtesy of MIROVA. |
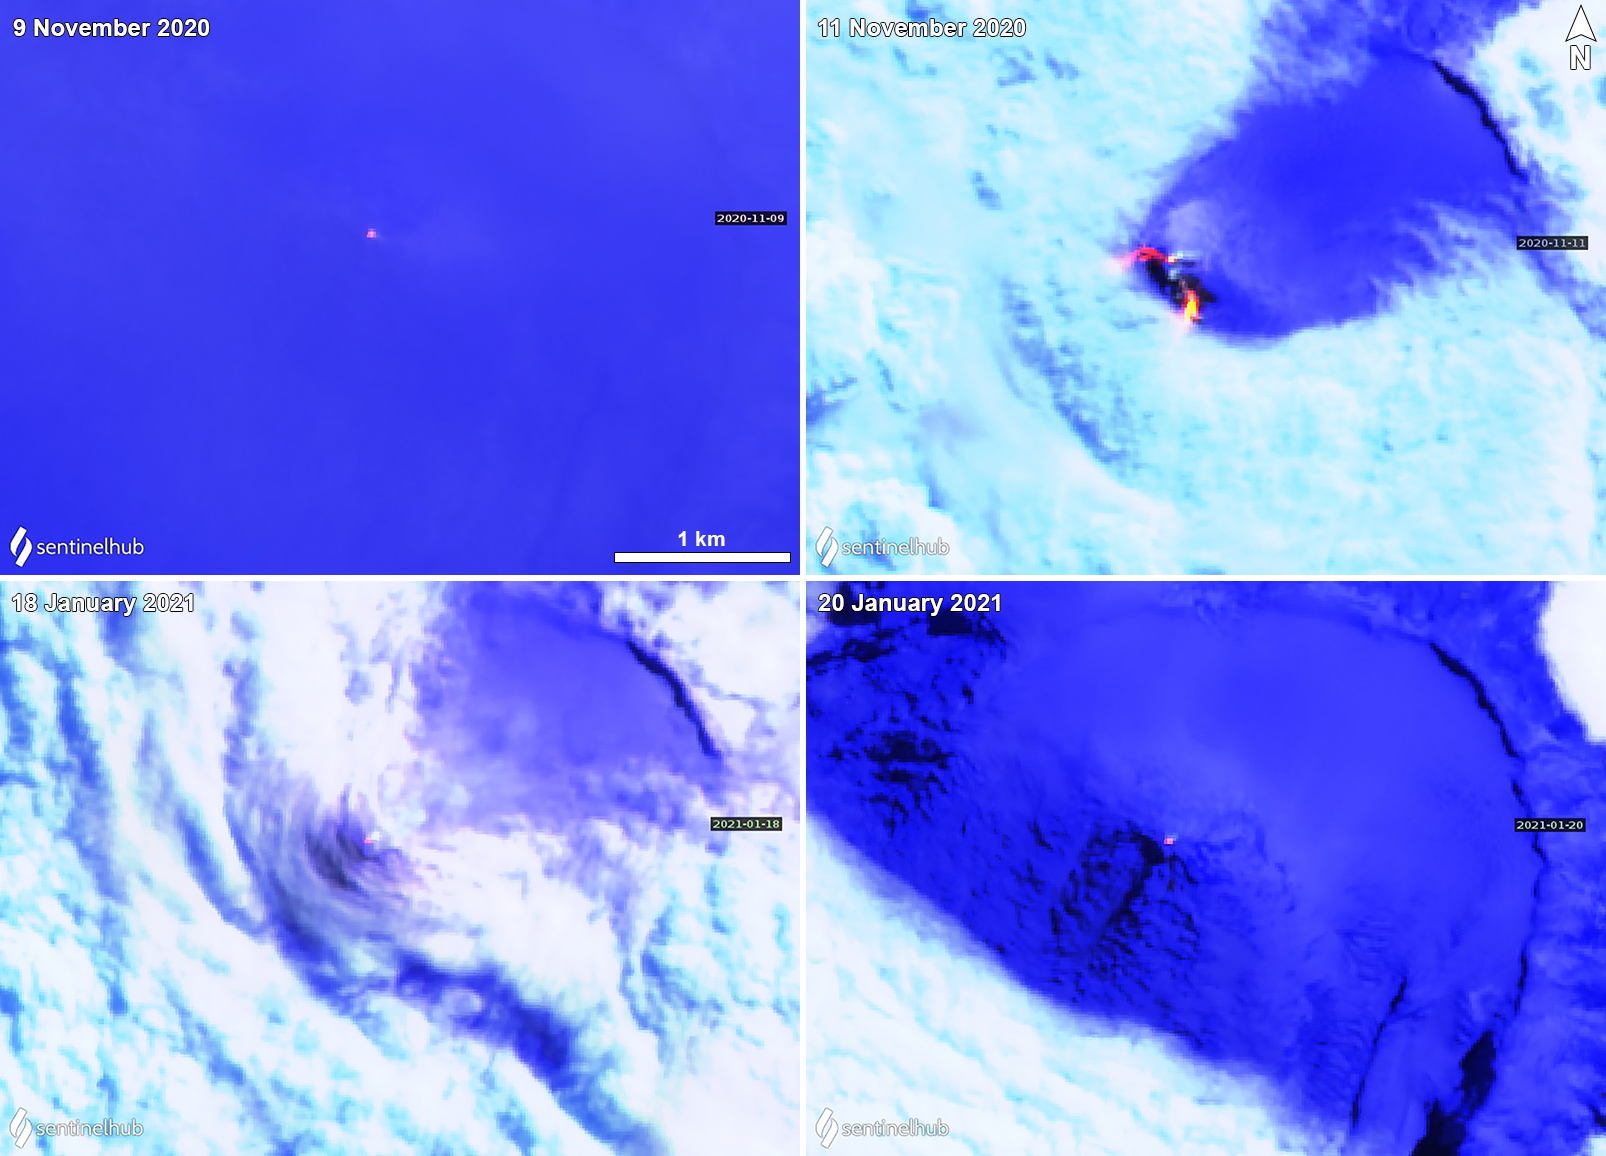 |
Figure 47. Sentinel-2 infrared satellite imagery of Heard Island’s Big Ben volcano showed a thermal anomaly (bright yellow-orange) on clear weather days on 9 (top left) and 11 (top right) November 2020, along with 18 (bottom left) and 20 (bottom right) January 2021. On 11 November two strong thermal anomalies, possibly representing different lava flows, were observed descending to the S and SW flanks, though much of the activity was covered by clouds. Sentinel-2 satellite images with “Atmospheric penetration” (bands 12, 11, 8A) rendering. Courtesy of Sentinel Hub Playground. |
Information Contacts: MIROVA (Middle InfraRed Observation of Volcanic Activity), a collaborative project between the Universities of Turin and Florence (Italy) supported by the Centre for Volcanic Risk of the Italian Civil Protection Department (URL: http://www.mirovaweb.it/); Sentinel Hub Playground (URL: https://www.sentinel-hub.com/explore/sentinel-playground).
Thermal anomalies and lava flows continue; strong lava flow event during 3-5 January 2022
The remote island of Heard is located in the southern Indian Ocean and contains the Big Ben stratovolcano, which has been intermittently active since 1910. Activity during late November 2020 through January 2021 produced thermal anomalies over the active Mawson Peak and lava flows (BGVN 46:05), which is similar to activity during this reporting period of February 2021 through January 2022. Information primarily comes from satellite data.
MIROVA (Middle InfraRed Observation of Volcanic Activity) analysis of MODIS satellite data shows that the thermal activity was relatively low during February through September 2021, with the exception of four low-power anomalies between late May and early June and two stronger anomalies in mid-July (figure 48). Despite the cloudy weather, Sentinel-2 infrared satellite imagery also detected the stronger anomaly at Mawson Peak on 22 July (figure 49). Very weak anomalies were also visible in satellite imagery on 31 August and 22 and 25 September, though they remained stationary and close to the summit (figure 49).
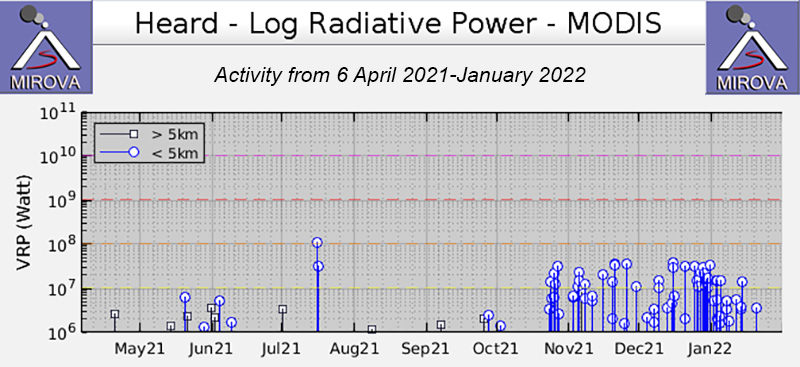 |
Figure 48. Thermal activity at Heard was relatively low during April-September 2021 and consisted of four low-power anomalies between late May and early June and two stronger anomalies in mid-July. No thermal activity was detected during February and March 2021 (see figure 46 from BGVN 46:05). Activity notably increased in both power and frequency near the end of October 2021, according to the MIROVA system, shown in this Log Radiative Power graph. Courtesy of MIROVA. |
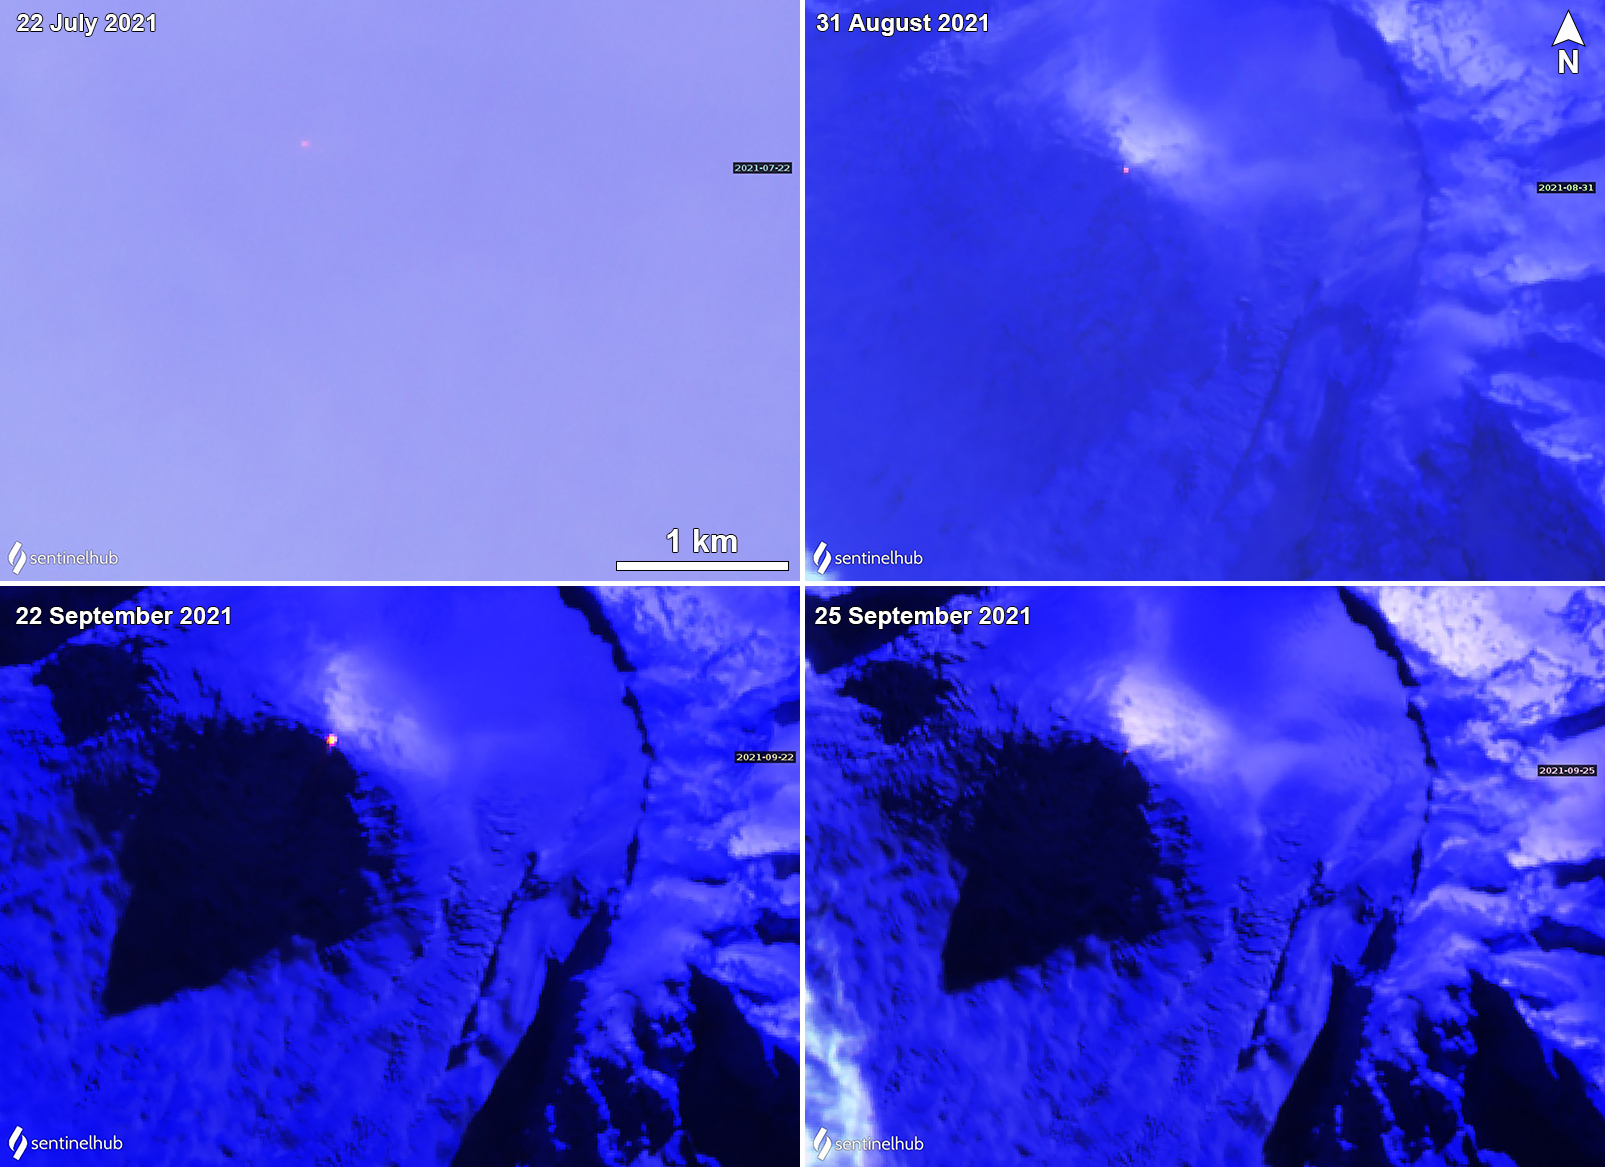 |
Figure 49. Sentinel-2 infrared satellite imagery of Heard Island’s Big Ben showed weak thermal anomalies (bright yellow-orange) on 22 July (top left), 31 August (top right), 22 September (bottom left), and 25 September (bottom right) 2021. The activity on 22 July was also reflected in MIROVA data. The activity remained confined to the summit during these dates. Sentinel-2 satellite images with “Atmospheric penetration” (bands 12, 11, 8A) rendering. Courtesy of Sentinel Hub Playground. |
Renewed thermal activity of varying intensities was detected in Sentinel-2 infrared satellite imagery over the summit area and on the NW and W flanks on 4, 11, 14, and 21 November, though weather clouds often prevented clear views of the summit. On 11 November four anomalies just NW of Mawson Peak formed a “v” shape open to the NW, which could indicate a branched lava flow; this increase in thermal activity was also noted in MIROVA data (figure 50). According to the MODVOLC Thermal Algorithm, there was a total of twelve thermal alerts on 15, 20, and 25 November and 15, 24, and 28 December. A strong anomaly was visible on the W flank on 21 November, accompanied by possible gas-and-steam emissions that extended E and SE.
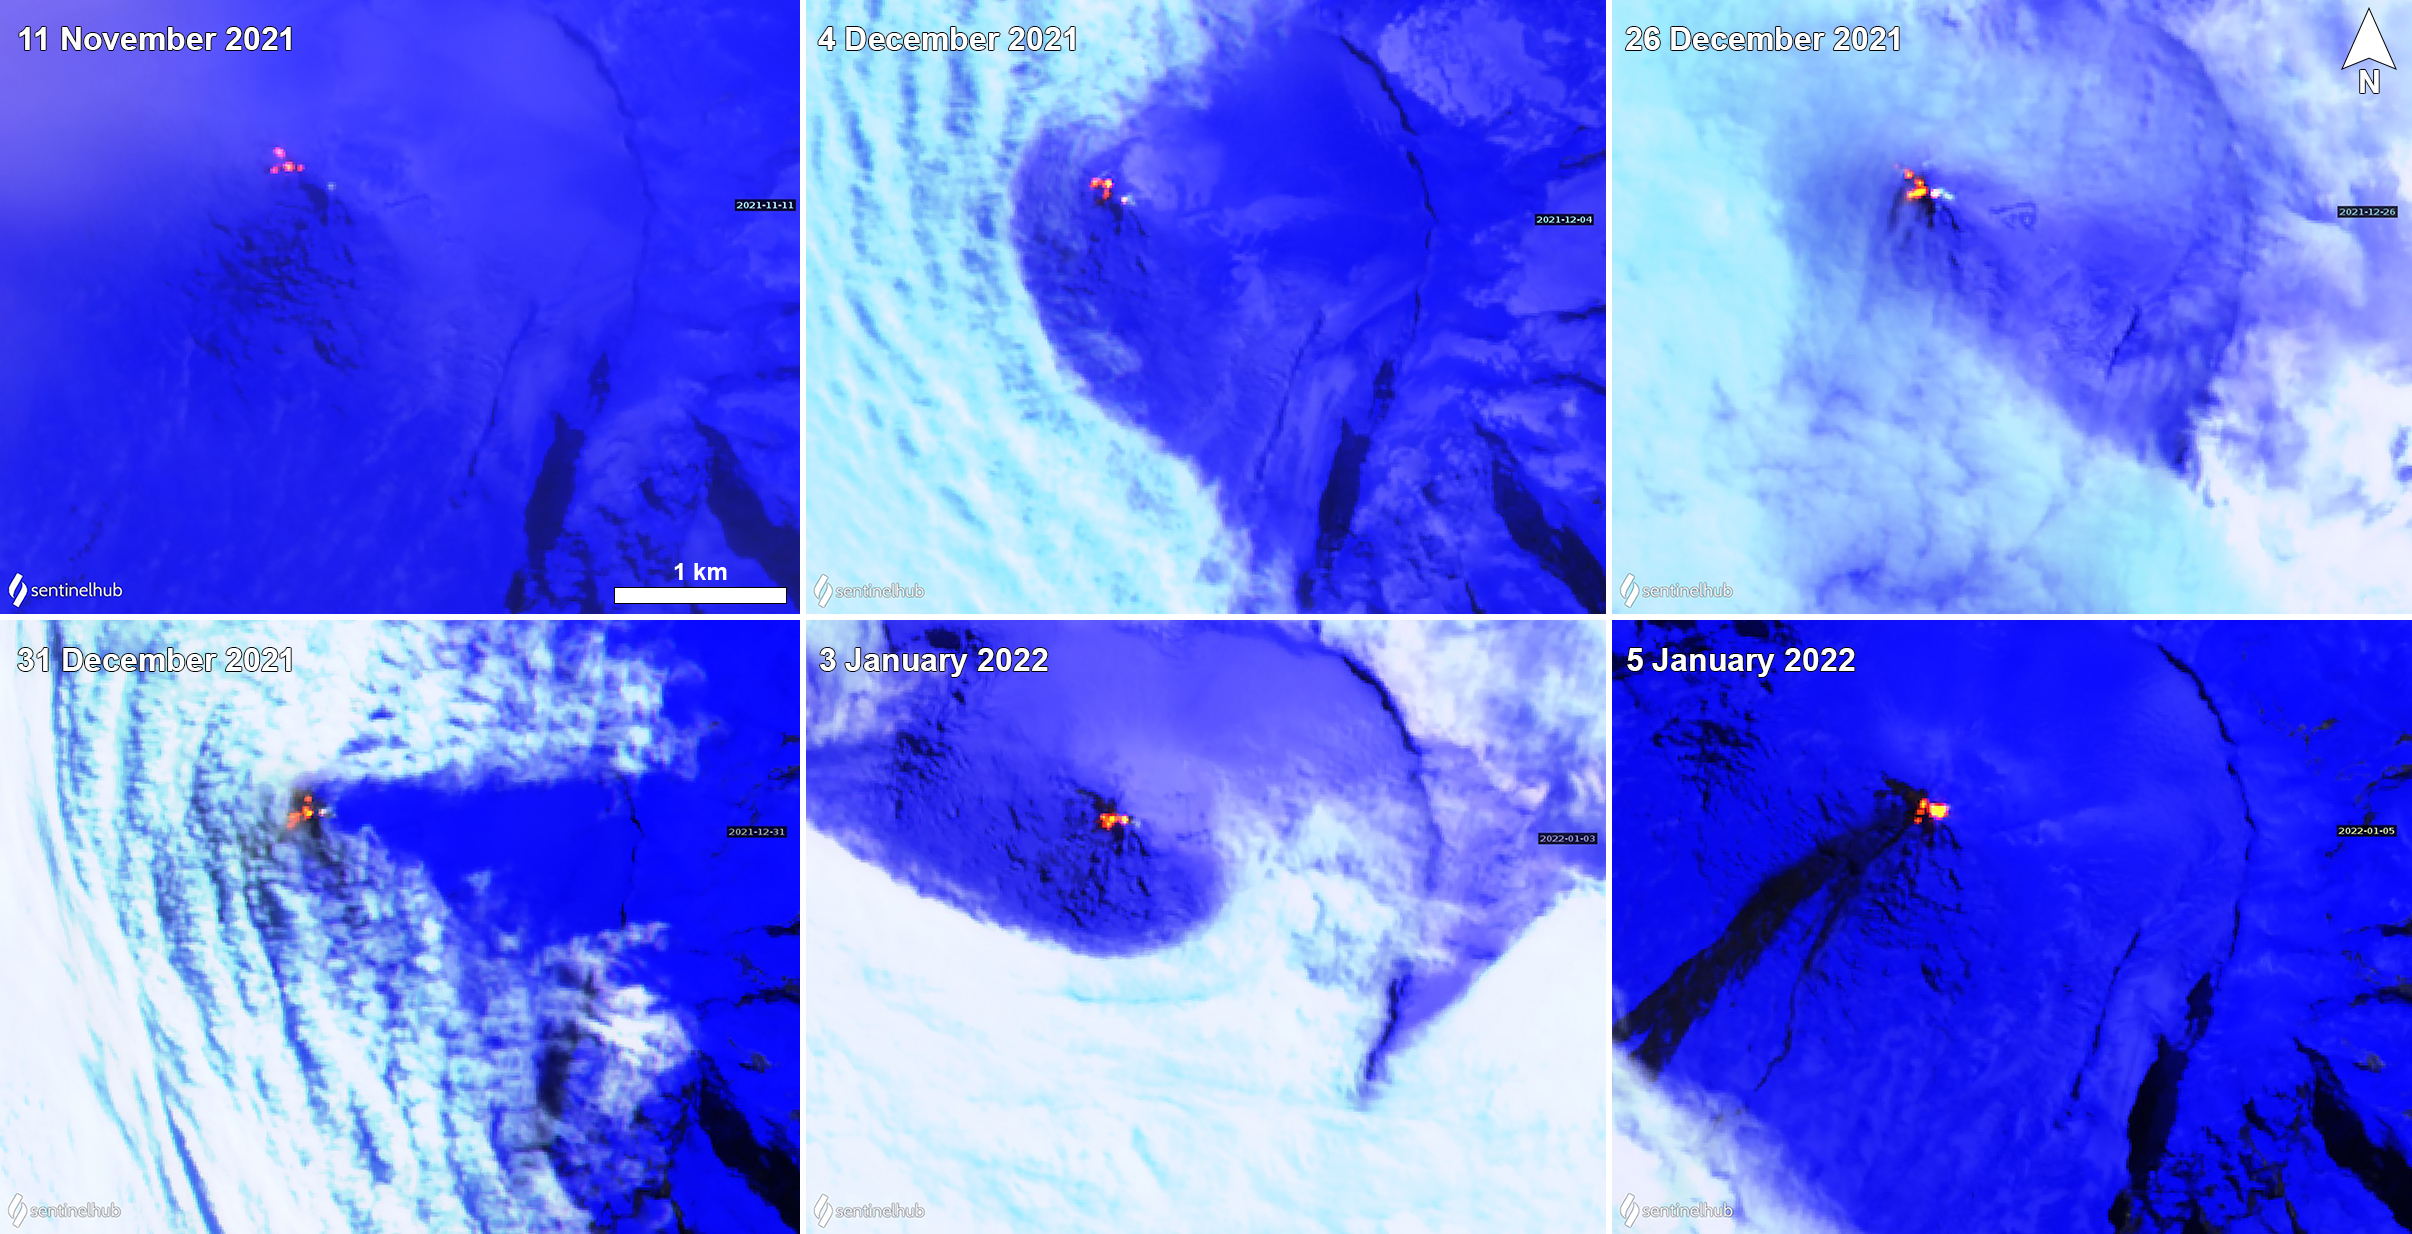 |
Figure 50. Sentinel-2 infrared satellite imagery of Heard Island’s Big Ben showed stronger thermal anomalies (bright yellow-orange) on 11 November (top left), 4 December (top middle), 26 December (top right), 31 December (bottom left) 2021, 3 January (bottom middle), and 5 January (bottom right) 2022. Activity on 11 November marks the start of increased thermal activity according to the MIROVA graph; four distinct anomalies were detected just NW of Mawson Peak, which persisted into December. On 26 and 31 December a possible lava flow was visible traveling W. Between 3 and 5 January a strong lava flow was noted on the SW flank (black streak). Sentinel-2 satellite images with “Atmospheric penetration” (bands 12, 11, 8A) rendering. Courtesy of Sentinel Hub Playground. |
Anomalies continued to be detected through January 2022. A possible lava flow was observed on 4 December on the NW flank, accompanied by gas-and-steam emissions to the SE. A strong gas-and-steam plume occurred on 16 December, extending NE and accompanied by a lava flow. A small possible branched lava flow was visible traveling NW and SW on 26 December, accompanied by a small gas-and-steam emission to the E. This activity was also visible on 31 December. Sometime during 3 and 5 January, a strong lava flow event occurred, descending the SW flank, based on satellite images (figure 50). Clouds obscured views of the summit during a majority of the month, though a small anomaly and gas-and-steam emission drifting N were detected on 20 January. A weaker anomaly was visible on the NW flank on 30 January.
Information Contacts: MIROVA (Middle InfraRed Observation of Volcanic Activity), a collaborative project between the Universities of Turin and Florence (Italy) supported by the Centre for Volcanic Risk of the Italian Civil Protection Department (URL: http://www.mirovaweb.it/); Hawai'i Institute of Geophysics and Planetology (HIGP) - MODVOLC Thermal Alerts System, School of Ocean and Earth Science and Technology (SOEST), Univ. of Hawai'i, 2525 Correa Road, Honolulu, HI 96822, USA (URL: http://modis.higp.hawaii.edu/); Sentinel Hub Playground (URL: https://www.sentinel-hub.com/explore/sentinel-playground).
Intermittent lava flows and persistent thermal anomalies during February 2022-January 2023
Heard is a remote island located in the southern Indian Ocean and consists of two volcanic structures: Big Ben and the smaller Mt. Dixon. The active Mawson Peak is located within a 5-6 km wide caldera breached to the SW side of Big Ben. Intermittent eruptions have occurred since 1910 and the most recent eruption began in September 2012 and has mainly been characterized by consistent thermal activity and lava flows (BGVN 47:02). Similar events are covered in this report during February 2022 through January 2023 primarily using various satellite data.
MIROVA (Middle InfraRed Observation of Volcanic Activity) analysis of MODIS satellite data showed that intermittent low-to-moderate thermal activity occurred during July 2022 through January 2023 (figure 51). Periods of increased thermal activity were recorded during late July through early August, late September through early October, mid-November, and early-to-mid-December. MODIS satellite instruments using the MODVOLC thermal algorithm also detected a total of 34 strong thermal hotspots on 15 March, 1 and 6 April, 29 May, 14, 20, 22, and 23 June, 10 and 12 August, 23 September, 11, 13, 15, and 26 November, 2, 6, and 8 December, and 11, 13, and 23 January 2023. On clear weather days, Sentinel-2 infrared satellite imagery also captured thermal activity at and near the summit of Mawson Peak (figure 52). A persistent thermal anomaly sometimes accompanied by gas-and-steam emissions was captured to the NW of Mawson Peak at a second vent on 4 and 17 February, 3 August, 15, 25 September, 15 October and at Mawson Peak on 4 June.
|
Figure 51. Intermittent low-to-moderate thermal activity was recorded at Heard during July 2022 through January 2023, according to this MIROVA graph (Log Radiative Power). Periods of more frequent thermal anomalies occurred during late July through early August, late September through early October, mid-November, and early December. Courtesy of MIROVA. |
|
Figure 52. Sentinel-2 infrared satellite imagery of Heard Island’s Big Ben showed persistent thermal anomalies at the Mawson Peak summit crater and occasionally at a secondary vent to the NW of Mawson Peak on 4 February 2022 (top left), 2 June 2022 (top right), 11 August 2022 (bottom left) and 25 September 2022 (bottom right). Sentinel-2 satellite images with “Atmospheric penetration” (bands 12, 11, 8A) rendering. Courtesy of Sentinel Hub Playground. |
Stronger thermal anomalies indicative of active lava flows originated from the second NW flank vent and moved W and SW were captured in Sentinel-2 infrared satellite imagery 39 times on 11 and 31 March, 13 April, 3, 10, 13, 15, 18, 20, 25, and 30 May, 2, 12, 14, 17, 22, and 24 June, 2, 9, 17, and 24 July, 1, 6, 11, 13, and 31 August, 20 September, 2, 22, and 25 October, 9, 14, 16, 21, 24, and 26 November, 4 and 21 December, and 23 January; a hotspot was also detected over Mawson Peak, sometimes accompanied by gas-and-steam emissions (figure 53).
|
Figure 53. Sentinel-2 infrared satellite imagery of Heard Island’s Big Ben showed lava flow activity (bright yellow-orange) from the NW flank vent moving to the SW and W on 11 March 2022 (top left), 13 April 2022 (top right), 30 May 2022 (middle left), 14 June 2022 (middle right), 16 November 2022 (bottom left), and 21 December 2022 (bottom right). A secondary hotspot was detected above Mawson Peak on 11 March, 13 April, 30 May, and 14 June. Sentinel-2 satellite images with “Atmospheric penetration” (bands 12, 11, 8A) rendering. Courtesy of Sentinel Hub Playground. |
Information Contacts: MIROVA (Middle InfraRed Observation of Volcanic Activity), a collaborative project between the Universities of Turin and Florence (Italy) supported by the Centre for Volcanic Risk of the Italian Civil Protection Department (URL: http://www.mirovaweb.it/); Hawai'i Institute of Geophysics and Planetology (HIGP) - MODVOLC Thermal Alerts System, School of Ocean and Earth Science and Technology (SOEST), Univ. of Hawai'i, 2525 Correa Road, Honolulu, HI 96822, USA (URL: http://modis.higp.hawaii.edu/); Sentinel Hub Playground (URL: https://www.sentinel-hub.com/explore/sentinel-playground).
This compilation of synonyms and subsidiary features may not be comprehensive. Features are organized into four major categories: Cones, Craters, Domes, and Thermal Features. Synonyms of features appear indented below the primary name. In some cases additional feature type, elevation, or location details are provided.
Synonyms |
||||
| Kaiser Wilhelm Mountain | ||||
Cones |
||||
| Feature Name | Feature Type | Elevation | Latitude | Longitude |
| Big Ben | Stratovolcano | 2415 m | 53° 6' 0" S | 73° 20' 0" E |
| Cape Bidlingmaier | Cone | 120 m | 53° 1' 5" S | 73° 31' 55" E |
| Cape Cartwright | Cone | 52° 59' 0" S | 73° 15' 0" E | |
| Corinth Head | Cone | 180 m | 53° 0' 32" S | 73° 24' 32" E |
| Dixon, Mount | Stratovolcano | 706 m | 52° 59' 49" S | 73° 17' 0" E |
| Drygalski, Mount | Cone | 210 m | 53° 2' 0" S | 73° 23' 0" E |
| Macey Cone | Cone | 124 m | 52° 58' 55" S | 73° 15' 25" E |
| Red Island | Cone | 52° 57' 54" S | 73° 17' 53" E | |
| Rogers Head | Cone | 145 m | 53° 0' 4" S | 73° 24' 11" E |
| Saddle Point | Cone | 107 m | 53° 0' 47" S | 73° 29' 28" E |
| Scarlet Hill | Cone | 410 m | 53° 5' 49" S | 73° 39' 32" E |
|
|
||||||||||||||||||||||||
There is data available for 11 confirmed Holocene eruptive periods.
2012 Sep 5 ± 4 days - 2024 Apr 19 (continuing) Confirmed Eruption Max VEI: 0
| Episode 1 | Lava Lake Episode | Mawson Peak | ||||||||||||||||||||||||||||||||||||||||||||||||||||||||||||||||||||||||||||||||||||||||||||||||||||||||||||||||||||||||||||||||||||||||||||||||||||||||||||||||||||||||||||||||||||||||||||||||||||||||||||||||||||||||||||||||||||||||||||||||||||||||||||||||||||||||||||||||||||||||||||||||||||||||||||||||||||||||||||||||||||||||||||||||||||||||||||||||||||||||||||||||||||||||||||||||||||||||||||||||||||||||||||||||||||||||||||||||||||||||||||||||||||||||||||||||||||||||||||||||||||||||||||||||||||||||||||||||||||||||||||||||||||||||||||||||||||||||||||||||||||||||||||||||||||||||||||||||||||||||||||||||||||||||||||||||||||||||||||||||||||||||||||||||||||||||||||||||||||||||||||||||||||||||||||||||||||||||||||||||||||||||||||||||||||||||||||||||||||||||||||||||||||||||||||||||||||||||||||||||||||||||||||||||||||||||||||||||||||||||||||||||||||||||||||||||||||||||||||||||||||||||||||||||||||||||||||||||||
|---|---|---|---|---|---|---|---|---|---|---|---|---|---|---|---|---|---|---|---|---|---|---|---|---|---|---|---|---|---|---|---|---|---|---|---|---|---|---|---|---|---|---|---|---|---|---|---|---|---|---|---|---|---|---|---|---|---|---|---|---|---|---|---|---|---|---|---|---|---|---|---|---|---|---|---|---|---|---|---|---|---|---|---|---|---|---|---|---|---|---|---|---|---|---|---|---|---|---|---|---|---|---|---|---|---|---|---|---|---|---|---|---|---|---|---|---|---|---|---|---|---|---|---|---|---|---|---|---|---|---|---|---|---|---|---|---|---|---|---|---|---|---|---|---|---|---|---|---|---|---|---|---|---|---|---|---|---|---|---|---|---|---|---|---|---|---|---|---|---|---|---|---|---|---|---|---|---|---|---|---|---|---|---|---|---|---|---|---|---|---|---|---|---|---|---|---|---|---|---|---|---|---|---|---|---|---|---|---|---|---|---|---|---|---|---|---|---|---|---|---|---|---|---|---|---|---|---|---|---|---|---|---|---|---|---|---|---|---|---|---|---|---|---|---|---|---|---|---|---|---|---|---|---|---|---|---|---|---|---|---|---|---|---|---|---|---|---|---|---|---|---|---|---|---|---|---|---|---|---|---|---|---|---|---|---|---|---|---|---|---|---|---|---|---|---|---|---|---|---|---|---|---|---|---|---|---|---|---|---|---|---|---|---|---|---|---|---|---|---|---|---|---|---|---|---|---|---|---|---|---|---|---|---|---|---|---|---|---|---|---|---|---|---|---|---|---|---|---|---|---|---|---|---|---|---|---|---|---|---|---|---|---|---|---|---|---|---|---|---|---|---|---|---|---|---|---|---|---|---|---|---|---|---|---|---|---|---|---|---|---|---|---|---|---|---|---|---|---|---|---|---|---|---|---|---|---|---|---|---|---|---|---|---|---|---|---|---|---|---|---|---|---|---|---|---|---|---|---|---|---|---|---|---|---|---|---|---|---|---|---|---|---|---|---|---|---|---|---|---|---|---|---|---|---|---|---|---|---|---|---|---|---|---|---|---|---|---|---|---|---|---|---|---|---|---|---|---|---|---|---|---|---|---|---|---|---|---|---|---|---|---|---|---|---|---|---|---|---|---|---|---|---|---|---|---|---|---|---|---|---|---|---|---|---|---|---|---|---|---|---|---|---|---|---|---|---|---|---|---|---|---|---|---|---|---|---|---|---|---|---|---|---|---|---|---|---|---|---|---|---|---|---|---|---|---|---|---|---|---|---|---|---|---|---|---|---|---|---|---|---|---|---|---|---|---|---|---|---|---|---|---|---|---|---|---|---|---|---|---|---|---|---|---|---|---|---|---|---|---|---|---|---|---|---|---|---|---|---|---|---|---|---|---|---|---|---|---|---|---|---|---|---|---|---|---|---|---|---|---|---|---|---|---|---|---|---|---|---|---|---|---|---|---|---|---|---|---|---|---|---|---|---|---|---|---|---|---|---|---|---|---|---|---|---|---|---|---|---|---|---|---|---|---|---|---|---|---|---|---|---|---|---|---|---|---|---|---|---|---|---|---|---|---|---|---|---|---|---|---|---|---|---|---|---|---|---|---|---|---|---|---|---|---|---|---|---|---|---|---|---|---|---|---|---|---|---|---|---|---|---|---|---|---|---|---|---|---|---|---|---|---|---|---|---|---|---|---|---|---|---|---|---|---|---|---|---|---|---|---|---|---|---|---|---|---|---|---|---|---|---|---|---|---|---|---|---|---|---|---|---|---|---|---|---|---|---|---|---|---|---|---|---|---|---|---|---|---|---|---|---|---|---|---|---|---|---|---|---|---|---|---|---|---|---|---|---|---|---|---|---|---|---|---|---|---|---|---|---|---|---|---|---|---|---|---|---|---|---|---|---|---|---|---|---|---|---|---|---|---|---|---|---|---|---|---|---|---|---|---|---|---|---|---|---|---|---|---|---|---|---|---|---|---|---|---|---|---|---|---|---|---|---|---|---|---|---|---|---|---|---|---|---|---|---|---|---|---|---|---|---|---|---|---|---|---|---|---|---|---|---|---|---|---|---|---|
| 2012 Sep 5 ± 4 days - 2024 Apr 19 (continuing) | Evidence from Observations: Reported | ||||||||||||||||||||||||||||||||||||||||||||||||||||||||||||||||||||||||||||||||||||||||||||||||||||||||||||||||||||||||||||||||||||||||||||||||||||||||||||||||||||||||||||||||||||||||||||||||||||||||||||||||||||||||||||||||||||||||||||||||||||||||||||||||||||||||||||||||||||||||||||||||||||||||||||||||||||||||||||||||||||||||||||||||||||||||||||||||||||||||||||||||||||||||||||||||||||||||||||||||||||||||||||||||||||||||||||||||||||||||||||||||||||||||||||||||||||||||||||||||||||||||||||||||||||||||||||||||||||||||||||||||||||||||||||||||||||||||||||||||||||||||||||||||||||||||||||||||||||||||||||||||||||||||||||||||||||||||||||||||||||||||||||||||||||||||||||||||||||||||||||||||||||||||||||||||||||||||||||||||||||||||||||||||||||||||||||||||||||||||||||||||||||||||||||||||||||||||||||||||||||||||||||||||||||||||||||||||||||||||||||||||||||||||||||||||||||||||||||||||||||||||||||||||||||||||||||||||||
|
List of 181 Events for Episode 1 at Mawson Peak
| |||||||||||||||||||||||||||||||||||||||||||||||||||||||||||||||||||||||||||||||||||||||||||||||||||||||||||||||||||||||||||||||||||||||||||||||||||||||||||||||||||||||||||||||||||||||||||||||||||||||||||||||||||||||||||||||||||||||||||||||||||||||||||||||||||||||||||||||||||||||||||||||||||||||||||||||||||||||||||||||||||||||||||||||||||||||||||||||||||||||||||||||||||||||||||||||||||||||||||||||||||||||||||||||||||||||||||||||||||||||||||||||||||||||||||||||||||||||||||||||||||||||||||||||||||||||||||||||||||||||||||||||||||||||||||||||||||||||||||||||||||||||||||||||||||||||||||||||||||||||||||||||||||||||||||||||||||||||||||||||||||||||||||||||||||||||||||||||||||||||||||||||||||||||||||||||||||||||||||||||||||||||||||||||||||||||||||||||||||||||||||||||||||||||||||||||||||||||||||||||||||||||||||||||||||||||||||||||||||||||||||||||||||||||||||||||||||||||||||||||||||||||||||||||||||||||||||||||||||
2006 Mar 11 - 2008 Mar 3 Confirmed Eruption Max VEI: 0
| Episode 1 | Eruption Episode | Mawson Peak | ||||||||||||||||||||||||
|---|---|---|---|---|---|---|---|---|---|---|---|---|---|---|---|---|---|---|---|---|---|---|---|---|---|
| 2006 Mar 11 - 2008 Mar 3 | Evidence from Observations: Reported | ||||||||||||||||||||||||
|
List of 3 Events for Episode 1 at Mawson Peak
| |||||||||||||||||||||||||
2003 Jun 9 - 2004 Jun 14 Confirmed Eruption Max VEI: 0
| Episode 1 | Eruption Episode | Mawson Peak | |||||||||||||||||||
|---|---|---|---|---|---|---|---|---|---|---|---|---|---|---|---|---|---|---|---|---|
| 2003 Jun 9 - 2004 Jun 14 | Evidence from Observations: Reported | |||||||||||||||||||
|
List of 2 Events for Episode 1 at Mawson Peak
| ||||||||||||||||||||
2000 Mar 7 (?) - 2001 Feb 16 ± 15 days Confirmed Eruption Max VEI: 2
| Episode 1 | Eruption Episode | Mawson Peak and upper south flank | |||||||||||||||||||||||||||||
|---|---|---|---|---|---|---|---|---|---|---|---|---|---|---|---|---|---|---|---|---|---|---|---|---|---|---|---|---|---|---|
| 2000 Mar 7 (?) - 2001 Feb 16 ± 15 days | Evidence from Observations: Reported | |||||||||||||||||||||||||||||
|
List of 4 Events for Episode 1 at Mawson Peak and upper south flank
| ||||||||||||||||||||||||||||||
1993 Jan 2 ± 15 days Confirmed Eruption Max VEI: 2 (?)
| Episode 1 | Eruption Episode | Mawson Peak | |||||||||||||||||||||||||||||
|---|---|---|---|---|---|---|---|---|---|---|---|---|---|---|---|---|---|---|---|---|---|---|---|---|---|---|---|---|---|---|
| 1993 Jan 2 ± 15 days - Unknown | Evidence from Observations: Reported | |||||||||||||||||||||||||||||
|
List of 4 Events for Episode 1 at Mawson Peak
| ||||||||||||||||||||||||||||||
1992 May 29 (?) Confirmed Eruption Max VEI: 0
| Episode 1 | Eruption Episode | Mawson Peak | |||||||||||||||||||
|---|---|---|---|---|---|---|---|---|---|---|---|---|---|---|---|---|---|---|---|---|
| 1992 May 29 (?) - Unknown | Evidence from Observations: Reported | |||||||||||||||||||
|
List of 2 Events for Episode 1 at Mawson Peak
| ||||||||||||||||||||
[ 1992 Jan 17 - 1992 Jan 18 ] Uncertain Eruption
| Episode 1 | Eruption Episode | Mawson Peak | ||||||||||||||
|---|---|---|---|---|---|---|---|---|---|---|---|---|---|---|---|
| 1992 Jan 17 - 1992 Jan 18 | Evidence from Unknown | ||||||||||||||
|
List of 1 Events for Episode 1 at Mawson Peak
| |||||||||||||||
1985 Jan 14 - 1987 Jan 16 (?) ± 15 days Confirmed Eruption Max VEI: 2 (?)
| Episode 1 | Eruption Episode | Mawson Peak | ||||||||||||||||||||||||||||||||||
|---|---|---|---|---|---|---|---|---|---|---|---|---|---|---|---|---|---|---|---|---|---|---|---|---|---|---|---|---|---|---|---|---|---|---|---|
| 1985 Jan 14 - 1987 Jan 16 (?) ± 15 days | Evidence from Observations: Reported | ||||||||||||||||||||||||||||||||||
|
List of 5 Events for Episode 1 at Mawson Peak
| |||||||||||||||||||||||||||||||||||
1954 Apr 13 (?) - 1954 Jun 13 (?) Confirmed Eruption Max VEI: 2
| Episode 1 | Eruption Episode | Mawson Peak | ||||||||||||||||||||||||
|---|---|---|---|---|---|---|---|---|---|---|---|---|---|---|---|---|---|---|---|---|---|---|---|---|---|
| 1954 Apr 13 (?) - 1954 Jun 13 (?) | Evidence from Observations: Reported | ||||||||||||||||||||||||
|
List of 3 Events for Episode 1 at Mawson Peak
| |||||||||||||||||||||||||
1953 Aug 20 - 1953 Nov 18 Confirmed Eruption Max VEI: 2
| Episode 1 | Eruption Episode | Mawson Peak | |||||||||||||||||||
|---|---|---|---|---|---|---|---|---|---|---|---|---|---|---|---|---|---|---|---|---|
| 1953 Aug 20 - 1953 Nov 18 | Evidence from Observations: Reported | |||||||||||||||||||
|
List of 2 Events for Episode 1 at Mawson Peak
| ||||||||||||||||||||
1950 Jan 24 - 1952 Mar 12 (?) Confirmed Eruption Max VEI: 2
| Episode 1 | Eruption Episode | Mawson Peak | |||||||||||||||||||||||||||||
|---|---|---|---|---|---|---|---|---|---|---|---|---|---|---|---|---|---|---|---|---|---|---|---|---|---|---|---|---|---|---|
| 1950 Jan 24 - 1952 Mar 12 (?) | Evidence from Observations: Reported | |||||||||||||||||||||||||||||
|
List of 4 Events for Episode 1 at Mawson Peak
| ||||||||||||||||||||||||||||||
1910 Mar - 1910 Apr Confirmed Eruption Max VEI: 2
| Episode 1 | Eruption Episode | Mawson Peak | |||||||||||||||||||
|---|---|---|---|---|---|---|---|---|---|---|---|---|---|---|---|---|---|---|---|---|
| 1910 Mar - 1910 Apr | Evidence from Observations: Reported | |||||||||||||||||||
|
List of 2 Events for Episode 1 at Mawson Peak
| ||||||||||||||||||||
[ 1881 Jun 2 ] Uncertain Eruption
| Episode 1 | Eruption Episode | |||||||||||||||||||||||||
|---|---|---|---|---|---|---|---|---|---|---|---|---|---|---|---|---|---|---|---|---|---|---|---|---|---|
| 1881 Jun 2 - Unknown | Evidence from Unknown | ||||||||||||||||||||||||
|
List of 3 Events for Episode 1
| |||||||||||||||||||||||||
There is no Deformation History data available for Heard.
There is data available for 1 emission periods. Expand each entry for additional details.
| Start Date: 1985 Jan 14 | Stop Date: 1985 Jan 14 | Method: Satellite (Nimbus-7 TOMS) |
| SO2 Altitude Min: 8 km | SO2 Altitude Max: 8 km | Total SO2 Mass: 10 kt |
Data Details
| Date Start | Date End | Assumed SO2 Altitude | SO2 Algorithm | SO2 Mass |
| 19850114 | 7.7 | 10.000 |
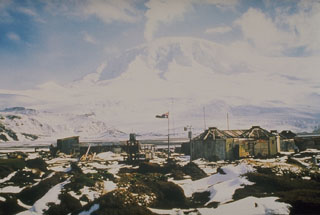 A plume rises in 1985 or 1986 from the summit of Big Ben volcano on Heard Island in the southern Indian Ocean. It is seen here from an abandoned Australian geophysical station at Atlas Cove, NNW of the summit. The historically active Mawson Peak forms the island's high point and lies within a 5-6 km wide caldera breached to the SW side of Big Ben. Small satellite scoria cones are mostly located on the N coast. Several subglacial eruptions have been reported.
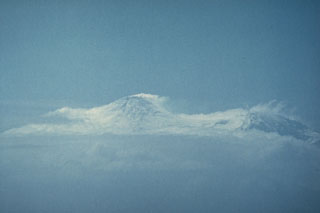 A plume, seen here from a ship to the SW, drifts from the summit of Heard volcano on 14 January 1985. Incandescence and a lava flow were observed that night from the ship 25 km offshore and an eruption plume was visible for two days. Eruptive activity may have continued into 1987. An active lava lake in a new crater was observed during a December 1986-January 1987 summit expedition. A lava flow, probably dating back to January 1985, was seen descending 8-9 km from the summit.
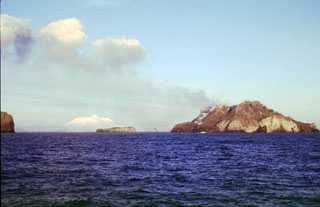 Three small, low islands on the Kerguelen Plateau form the McDonald Islands. The largest island, McDonald, is only 1 km2 in area and around 200 m high. This April 1997 photo shows a plume at Samarang Hill (right). The Island is composed of a layered tuff plateau cut by dikes and lava domes. A possible nearby active submarine center was inferred from pumice that washed up on Heard Island in 1992. The snow-capped peak in the background is Heard volcano, 44 km to the E.
The Global Volcanism Program has no maps available for Heard.
There are no samples for Heard in the Smithsonian's NMNH Department of Mineral Sciences Rock and Ore collection.
| Copernicus Browser | The Copernicus Browser replaced the Sentinel Hub Playground browser in 2023, to provide access to Earth observation archives from the Copernicus Data Space Ecosystem, the main distribution platform for data from the EU Copernicus missions. |
| MIROVA | Middle InfraRed Observation of Volcanic Activity (MIROVA) is a near real time volcanic hot-spot detection system based on the analysis of MODIS (Moderate Resolution Imaging Spectroradiometer) data. In particular, MIROVA uses the Middle InfraRed Radiation (MIR), measured over target volcanoes, in order to detect, locate and measure the heat radiation sourced from volcanic activity. |
| MODVOLC Thermal Alerts | Using infrared satellite Moderate Resolution Imaging Spectroradiometer (MODIS) data, scientists at the Hawai'i Institute of Geophysics and Planetology, University of Hawai'i, developed an automated system called MODVOLC to map thermal hot-spots in near real time. For each MODIS image, the algorithm automatically scans each 1 km pixel within it to check for high-temperature hot-spots. When one is found the date, time, location, and intensity are recorded. MODIS looks at every square km of the Earth every 48 hours, once during the day and once during the night, and the presence of two MODIS sensors in space allows at least four hot-spot observations every two days. Each day updated global maps are compiled to display the locations of all hot spots detected in the previous 24 hours. There is a drop-down list with volcano names which allow users to 'zoom-in' and examine the distribution of hot-spots at a variety of spatial scales. |
|
WOVOdat
Single Volcano View Temporal Evolution of Unrest Side by Side Volcanoes |
WOVOdat is a database of volcanic unrest; instrumentally and visually recorded changes in seismicity, ground deformation, gas emission, and other parameters from their normal baselines. It is sponsored by the World Organization of Volcano Observatories (WOVO) and presently hosted at the Earth Observatory of Singapore.
GVMID Data on Volcano Monitoring Infrastructure The Global Volcano Monitoring Infrastructure Database GVMID, is aimed at documenting and improving capabilities of volcano monitoring from the ground and space. GVMID should provide a snapshot and baseline view of the techniques and instrumentation that are in place at various volcanoes, which can be use by volcano observatories as reference to setup new monitoring system or improving networks at a specific volcano. These data will allow identification of what monitoring gaps exist, which can be then targeted by remote sensing infrastructure and future instrument deployments. |
| Volcanic Hazard Maps | The IAVCEI Commission on Volcanic Hazards and Risk has a Volcanic Hazard Maps database designed to serve as a resource for hazard mappers (or other interested parties) to explore how common issues in hazard map development have been addressed at different volcanoes, in different countries, for different hazards, and for different intended audiences. In addition to the comprehensive, searchable Volcanic Hazard Maps Database, this website contains information about diversity of volcanic hazard maps, illustrated using examples from the database. This site is for educational purposes related to volcanic hazard maps. Hazard maps found on this website should not be used for emergency purposes. For the most recent, official hazard map for a particular volcano, please seek out the proper institutional authorities on the matter. |
| IRIS seismic stations/networks | Incorporated Research Institutions for Seismology (IRIS) Data Services map showing the location of seismic stations from all available networks (permanent or temporary) within a radius of 0.18° (about 20 km at mid-latitudes) from the given location of Heard. Users can customize a variety of filters and options in the left panel. Note that if there are no stations are known the map will default to show the entire world with a "No data matched request" error notice. |
| UNAVCO GPS/GNSS stations | Geodetic Data Services map from UNAVCO showing the location of GPS/GNSS stations from all available networks (permanent or temporary) within a radius of 20 km from the given location of Heard. Users can customize the data search based on station or network names, location, and time window. Requires Adobe Flash Player. |
| DECADE Data | The DECADE portal, still in the developmental stage, serves as an example of the proposed interoperability between The Smithsonian Institution's Global Volcanism Program, the Mapping Gas Emissions (MaGa) Database, and the EarthChem Geochemical Portal. The Deep Earth Carbon Degassing (DECADE) initiative seeks to use new and established technologies to determine accurate global fluxes of volcanic CO2 to the atmosphere, but installing CO2 monitoring networks on 20 of the world's 150 most actively degassing volcanoes. The group uses related laboratory-based studies (direct gas sampling and analysis, melt inclusions) to provide new data for direct degassing of deep earth carbon to the atmosphere. |
| Large Eruptions of Heard | Information about large Quaternary eruptions (VEI >= 4) is cataloged in the Large Magnitude Explosive Volcanic Eruptions (LaMEVE) database of the Volcano Global Risk Identification and Analysis Project (VOGRIPA). |
| EarthChem | EarthChem develops and maintains databases, software, and services that support the preservation, discovery, access and analysis of geochemical data, and facilitate their integration with the broad array of other available earth science parameters. EarthChem is operated by a joint team of disciplinary scientists, data scientists, data managers and information technology developers who are part of the NSF-funded data facility Integrated Earth Data Applications (IEDA). IEDA is a collaborative effort of EarthChem and the Marine Geoscience Data System (MGDS). |

