According to Institute of Geological & Nuclear Sciences Limited (GNS) in a media release on 11 August, the Laboratoire de Géophysique (Papeete, Tahiti) reported that seismographs in Rarotonga recorded eruptive activity at Monowai seamount on 3 August. The activity then stopped overnight.
Source: GeoNet
Frequent submarine eruptions through November 2016; discolored water observations
Evidence of submarine volcanism at Monowai has been frequently observed since October 1977, when the Royal New Zealand Air Force (RNZAF) noted a plume of discolored water above the seamount. Most subsequent eruptions have been determined based on additional observations of discolored water or the seismic detection of acoustic waves (T waves or T phases) caused by explosive activity. Monitoring reports are provided by New Zealand's GeoNet through their website and other publications. The hydro-acoustic signals are most frequently detected by seismometers in Rarotonga (Cook Islands) or by the Polynesian Seismic Network (Réseau Sismique Polynésien, or RSP) in Tahiti. Research visits over the past 20 years have resulted in many detailed analyses of morphological changes due to volcanism and subsequent collapses.
Some of those results have been reviewed in previous Bulletin reports. This issue will focus on reviewing eruptive episodes after a sector-collapse event on 24 May 2002, which caused anomalous seismic signals originally thought to be explosive in nature. Following the May 2002 event, no activity was detected until T phases were recorded during 1-24 November 2002 (figure 28 and see BGVN 28:02). The next eruptive period began on 10 April 2003 (figure 28 and see BGVN 28:05) and continued until a seismic swarm on 14 August 2004 (BGVN 28:11, 30:07), which included the building of a new cone and ended just prior to a bathymetric survey from the R/V Tangaroa in September 2004. Another sequence of swarms began on 2 March 2005 and continued until 27 June 2006. Although there appear to have been small signals in September 2006, scientists at the Laboratoire de Géophysique, Commissariat à l'Energie Atomique (CEA/DASE/LDG) reported that there were 6 months of quiet after the June 2006 swarms (BGVN 32:01).
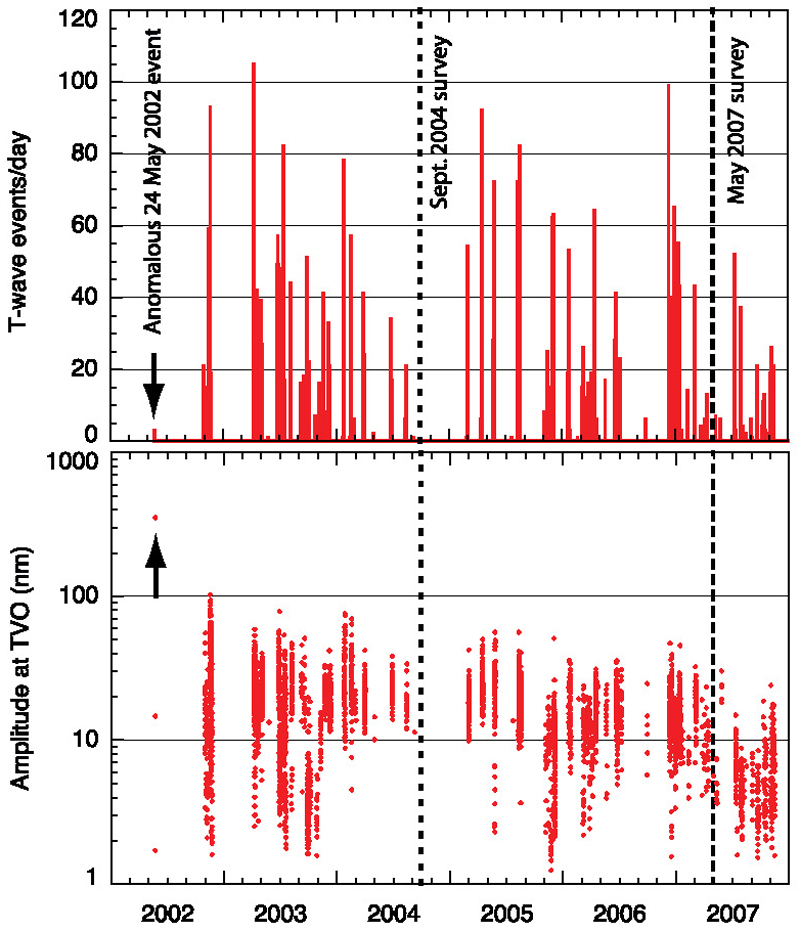 |
Figure 28. Monitoring data from the Polynesian Seismic Network showing T wave swarms at Monowai throughout January 2002-December 2007. The times of the September 2004 and May 2007 bathymetric surveys (dashed vertical lines), and the time of the anomalous 24 May 2002 swarm (arrows) are shown. (top) Number of T wave events per day. (bottom) Amplitudes of T wave events, in nanometers as recorded at station TVO in Tahiti. Note unusually high amplitude of the 24 May 2002 event, interpreted as the sector collapse between the 1998 and 2004 surveys. Modified from Chadwick et al. (2008). |
While the R/V Sonne was on site conducting a bathymetric survey during 1-4 May 2007 (Chadwick et al, 2008), scientists heard booming sounds and saw slicks and bubbles on the surface (BGVN 33:03). That activity was part of an eruptive period that began on 12 December 2006 and continued into at least early November 2007 (figure 29 and see BGVN 32:01). A "big acoustic event" was detected by the Polynesian Seismic Network (Réseau Sismique Polynésien, or RSP) on 8 February 2008 (BGVN 33:03).
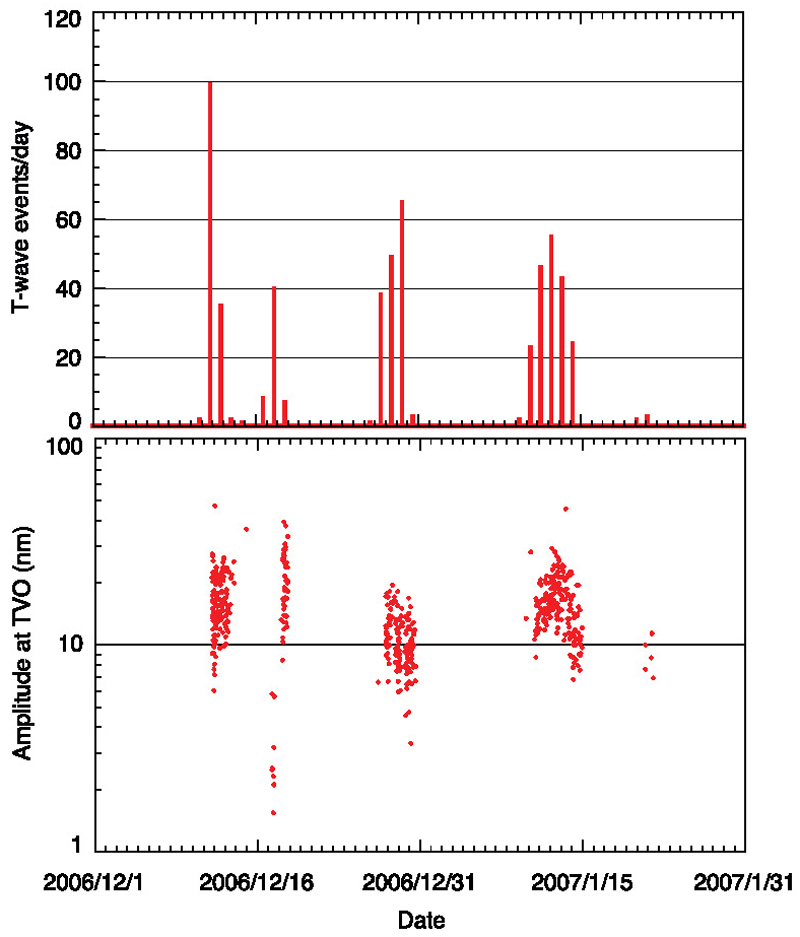 |
Figure 29. Monitoring data from the Polynesian Seismic Network showing the T wave swarms at Monowai in December 2006 and January 2007. (top) Number of events per day, (bottom) amplitude at station TVO in nanometers. Modified from Chadwick et al. (2008). |
A network of 23 ocean-bottom seismometers (OBS) and hydrophones was deployed in July 2007 over the fore-arc just to the E of Monowai at distances of 70-250 km to acquire data about local seismicity associated with subduction (Grevemeyer et al., 2016). The instruments also detected T waves and direct wave signals from the ongoing explosive activity. Analysis by Grevemeyer et al. (2016) showed that between deployment and recovery at the end of January 2008 there had been more than 2,000 events associated with Monowai, clustered into 13-15 major sequences that each lasted between several hours to about two days. Quiet periods between the event sequences varied between 1 and 70 days.
Intermittent activity during 2009 was described in a GeoNet posting from 6 January 2010. Activity was noted in early and mid-May, early July, mid-September (figure 30), late October (figure 31), mid-November, late November to early December, and mid-December 2009 based on seismic data recorded in Rarotonga, Cook Islands. On 27 October the RNZAF overflew the area and confirmed the activity, observing discolored sea water related to suspended sediment and precipitates. Another flight in May 2010 did not show similar activity. A summary of 2010 activity in New Zealand by GeoNet noted continued evidence of small-scale eruptive activity on the Rarotonga seismic record during the year (no dates given), but no activity was confirmed by surface observations.
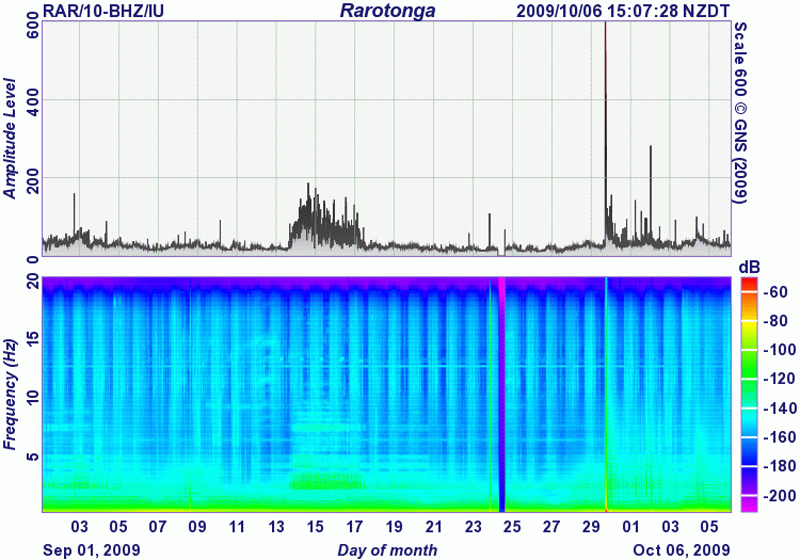 |
Figure 30. Seismic data from Rarotonga showing an eruption at Monowai during 13-17 September 2009. Courtesy of GNS. |
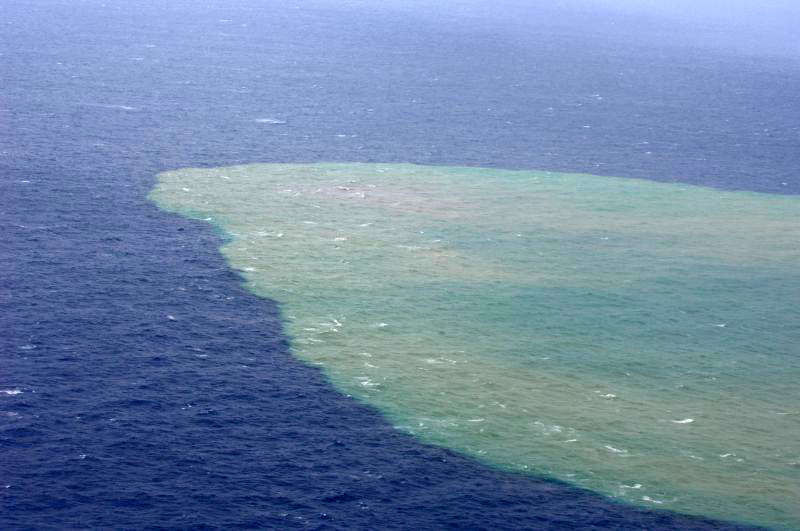 |
Figure 31. Aerial photo of discolored water near Monowai on 27 October 2009. Photo taken by Royal New Zealand Air Force, courtesy of GeoNet. |
[Discolored water with gas bubbles and a sulfurous odor was observed during a planned swath mapping visit by the R/V Sonne on 14 May 2011 (Peirce and Watts, 2011).] According to Metz et al. (2016), explosive eruptions took place over [17-22 May] as detected by T phase waves recorded at broadband seismic stations on Rarotonga (Cook Islands), Papeete (Tahiti), and the Marquesas Islands. Signals were also received at an International Monitoring System hydrophone array (maintained by the Comprehensive Nuclear-Test-Ban Treaty Organization) near Ascension Island, ~15,800 km from the seamount in the equatorial South Atlantic Ocean. A second round of mapping by R/V Sonne on the return transit was accomplished on 1-2 June, [following the explosive activity]. Watts et al. (2012) showed that there had been a depth change to the summit of 18.8 m between two surveys (BGVN 37:06), which was attributed to the growth of a cone or lava spine during the intervening eruption. There was an additional visual confirmation of activity in August 2011, and GeoNet stated that activity was continuing in September. The 2011 volcanic summary by GeoNet again noted undated evidence of small-scale activity seen in the Rarotonga seismic data.
Seismicity during 1-4 June 2012 indicated another period of significant activity, which was confirmed by discolored seawater in the area observed from an RNZAF flight on 3 June. Seismographs in Rarotonga recorded eruptive activity during 3-19 August 2012 (figure 32). A posting from GeoNet on 2 October noted that Monowai had "not been active recently."
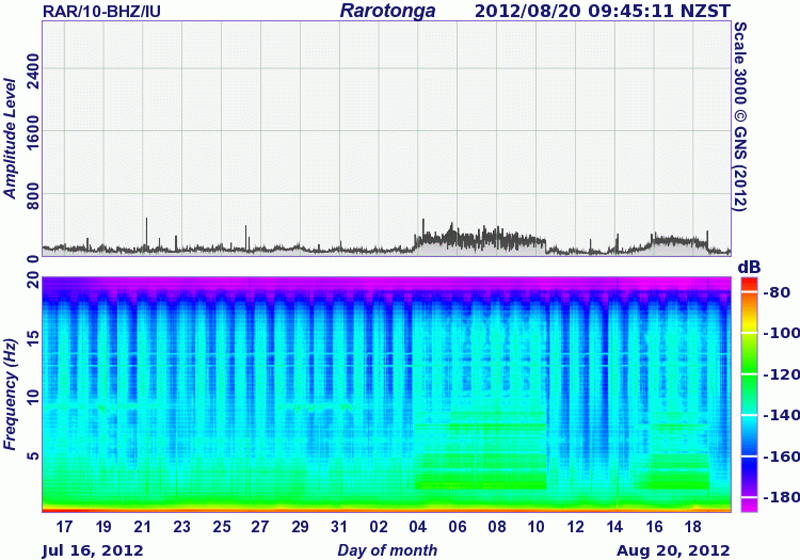 |
Figure 32. Seismic data from Rarotonga showing an eruption at Monowai during 3-19 August 2012. Courtesy of GNS. |
There were no GeoNet reports of activity during 2013. However, the R/V Sonne was planning to add to the time series of maps of Monowai while making a final transit to Auckland (Werner et al., 2013). While they were approaching the seamount on 1 January 2014, with a summit estimated to be ~60 m below the surface based on 2011 bathymetry data, scientists noticed a light yellowish water discoloration and a faint rumble. The cruise report further noted that during profiling close to the summit a "sudden and significant increase in volcanic activity with explosive hydroclastic eruptions was accompanied by thunder and shock waves rapidly spreading out on the water surface." Pumice was also collected in the vicinity, but the source volcano was not known.
In a GeoNet volcanic activity update on 10 November 2014, Brad Scott observed that there had been eruptions detected during approximately 16-22 and 23-27 October, and 1-5 November (figure 33) based on T phase waves measured at Rarotonga, but the activity appeared to be weaker than that seen in 2009 and 2012. Confirming these observations was material seen floating on the ocean surface over the seamount by a RNZAF airplane on 31 October 2014 (figure 34). GeoNet noted that volcanic activity regularly occurs about 3-10 days a month; the yearly summary said the seamount erupted often in 2014.
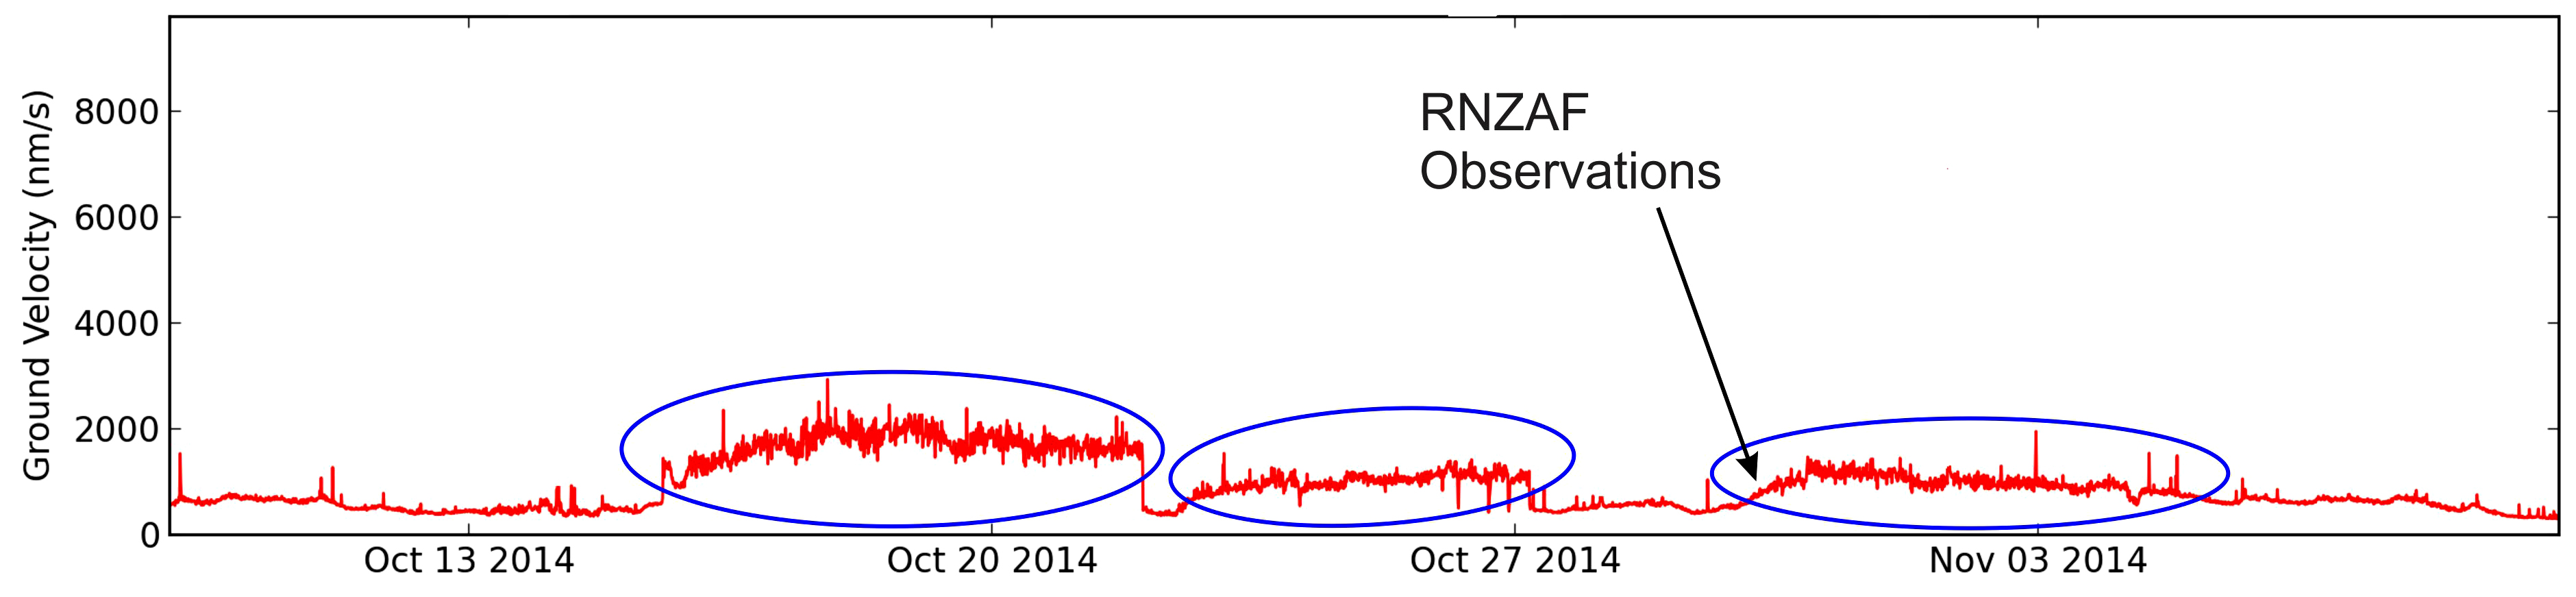 |
Figure 33. Eruptive activity at Monowai during October-November 2014 identified on a seismic amplitude plot recorded from the Rarotonga T phase seismic monitoring site. Courtesy of GeoNet. |
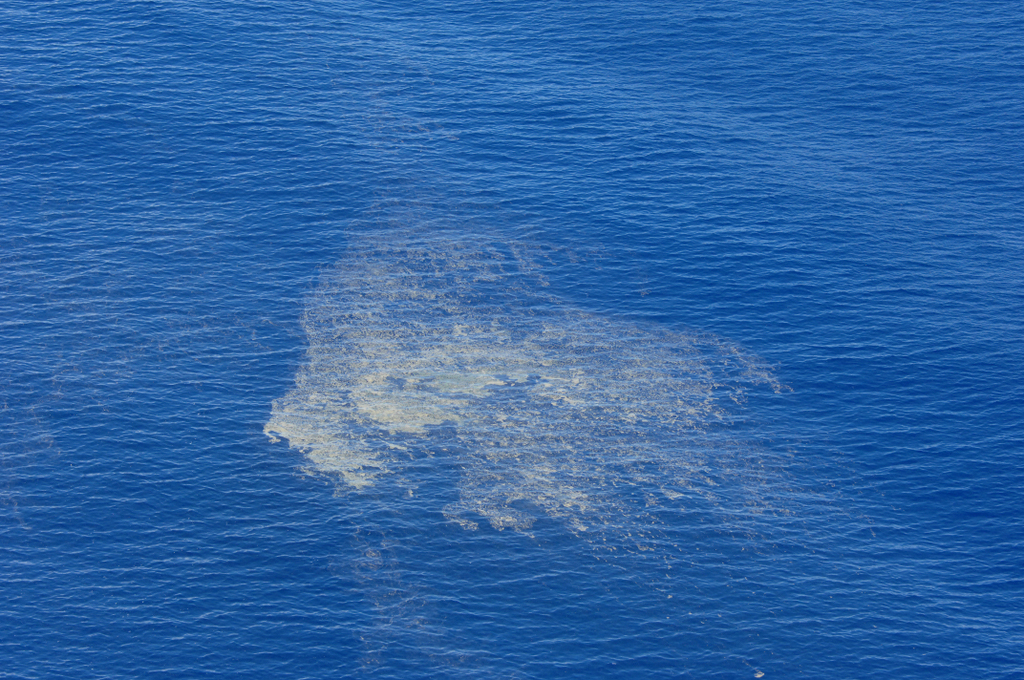 |
Figure 34. Aerial view from a RNZAF airplane of the ocean over Monowai showing floating debris (pumice) on 31 October 2014. Courtesy of GeoNet. |
There were no reports of activity during 2015, but a plume of discolored water was once again seen by the RNZAF on 19 May 2016. According to a 16 November 2016 GeoNet update by Brad Scott, activity was recorded for about 24 hours over 11-12 November. The report noted that this type of activity is seen a few days every month.
References: Chadwick, W.W., Jr., Wright, I.C., Schwarz-Schampera, U., Hyvernaud O., Reymond, D., and de Ronde, C.E.J., 2008, Cyclic eruptions and sector collapses at Monowai submarine volcano, Kermadec arc: 1998-2007, GeochemistryGeophysicsGeosystemsG3, v. 9, p. 1-17 (DOI: 10.1029/2008GC002113).
Grevemeyer, I., Metz, D., and Watts, A., 2016, Submarine explosive activity and ocean noise generation at Monowai Volcano, Kermadec Arc: constraints from hydroacoustic T-waves: EGU General Assembly 2016.
Peirce C, Watts A, 2011, R/V Sonne SO 215 - Cruise Report, The Louisville Ridge - Tonga Trench collision: Implications for subduction zone dynamics: Durham, Department of Earth Sciences, Durham University.
Metz, D., Watts, A.B., Grevemeyer, I., Rodgers, M., and Paulatto, M., 2016 (22 February), Ultra-long-range hydroacoustic observations of submarine volcanic activity at Monowai, Kermadec Arc, Geophysical Research Letters, v. 43, no. 4, p. 1529-1536.
Watts, A.B., Peirce, C., Grevemeyer, I., Paulatto, M., Stratford, W., Bassett, D., Hunter, J.A., Kalnins, L.M., and de Ronde, C.E.J., 2012 (13 May), Rapid rates of growth and collapse of Monowai submarine volcano in the Kermadec Arc, Nature Geoscience, v. 5, p. 510-515 (DOI: 10.1038/ngeo1473).
Werner, R., D. Nürnberg, and F. Hauff, 2013, RV SONNE — Cruise report SO 225, Helmholtz-Zentrum fur Ozeanforschung Kiel (GEOMAR) (DOI: 10.3289/GEOMAR_REP_NS_5_2012).
Information Contacts: New Zealand GeoNet Project, a collaboration between the Earthquake Commission and GNS Science, Wairakei Research Centre, Private Bag 2000, Taupo 3352, New Zealand (URL: http://www.geonet.org.nz/).
2012: August
According to Institute of Geological & Nuclear Sciences Limited (GNS) in a media release on 11 August, the Laboratoire de Géophysique (Papeete, Tahiti) reported that seismographs in Rarotonga recorded eruptive activity at Monowai seamount on 3 August. The activity then stopped overnight.
Source: GeoNet
Reports are organized chronologically and indexed below by Month/Year (Publication Volume:Number), and include a one-line summary. Click on the index link or scroll down to read the reports.
Water discoloration extending 5 km from area of brown turbulence
Royal New Zealand Air Force (RNZAF) personnel observed submarine volcanic activity at a site above the Tonga Ridge on 13 October at 1430. Discoloration stretched about 5 km SW from a patch of brown, gaseous, turbulent water 200 m in diameter. A sonar buoy dropped into the turbulent water detected pulsating rumbles and an explosion, believed to originate from a source about 4000 m deep. No records exist of previous activity in the area.
Information Contacts: J. Latter, DSIR, Wellington.
Shallow submarine eruption
A shallow submarine eruption from Monowai was detected by Polynesian Seismic Network (Réseau Sismique Polynésien, or RSP) stations (2,800 and 4,300 km from the volcano) on [9 September from 0950 until 1820]. Acoustic T-waves, generated from lava/seawater interaction, indicated an eruption of fluctuating intensity without explosions. RSP stations recorded seismic activity from Monowai in April 1977, January 1980, May 1982, and June 1986.
Information Contacts: J. Talandier, Laboratoire de Géophysique, (LDG) Tahiti.
Extensive zone of sulfurous discolored water; bathymetric data show two plumes
A sharply defined zone of brown water extended W from the seamount's summit area during a visit by the research vessel HMNZS Tui on 13 August between 0800 and 1400. A strong sulfur smell was noted but no bubbles were visible. The surface temperature in discolored water 400 m from the plume's origin was 2.0 ± 0.5°C higher than that of the surrounding sea water. At 9 km from the summit, the plume of discolored water was ~3.7 km wide.
An attempt to contour the bathymetry of the top 500 m of the seamount (figure 1) was hampered by intermittent availability of GPS satellite fixes. Southern slopes appeared to have a regular cone shape, but the N slopes, where ship navigation was based on inputs from a gyrocompass and doppler log, appeared distorted to the NE. A minimum depth of 100 m was measured. Two vertical plumes extended to the surface.
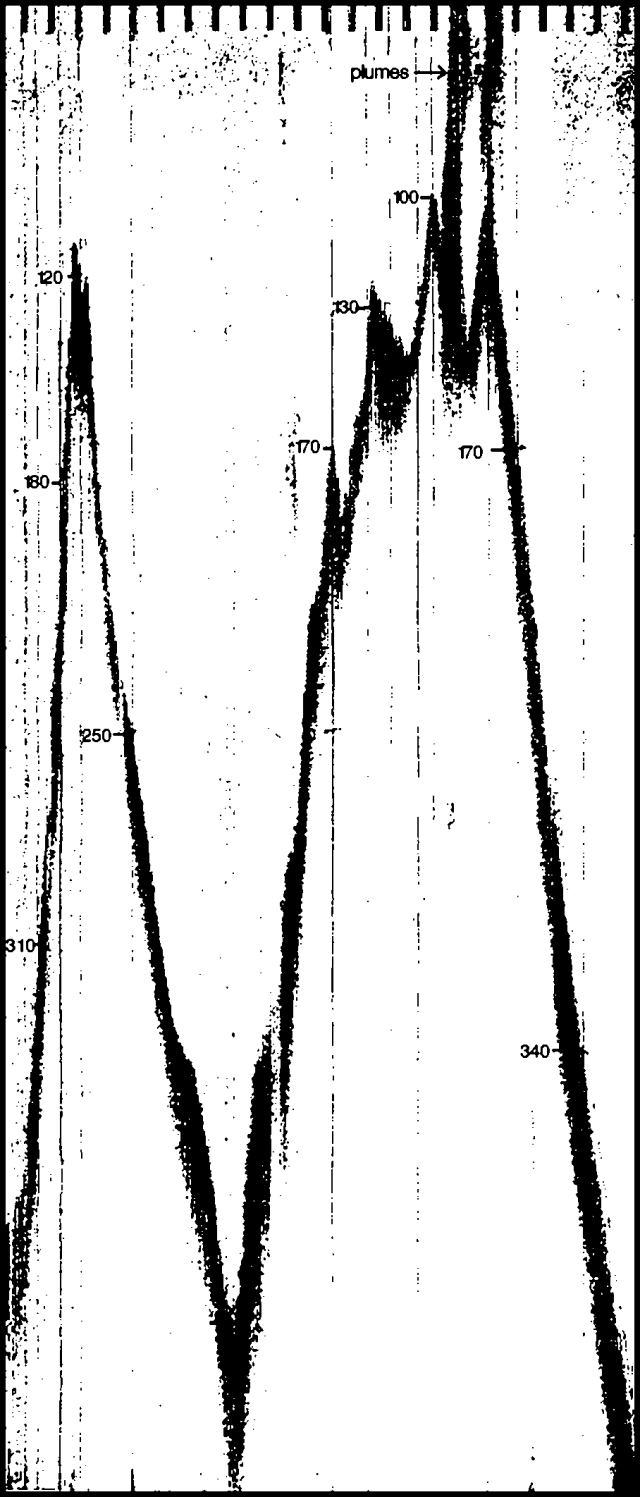 |
Figure 1. N-S profile across the summit of Monowai Seamount using a 45-kHz sounder. Vertical exaggeration 6:1. Depths are in meters. Two vertical plumes (not seen on the 12 kHz sounder) extend from the summit area to the surface. Courtesy of the Defence Scientific Establishment. |
Information Contacts: Lt. Cdr. Owen Hanley, HMNZSTui, Auckland Naval Base, Auckland; L. Hall, Defence Scientific Establishment, Auckland Naval Base, Auckland.
T-waves suggest shallow volcanic activity
Acoustic T-waves of long duration and emergent form were recorded 30 May-18 June and 5-7 September by the Sismique Polynésien RSP large-aperture seismic network centered on Tahiti. The signals, typical of shallow submarine eruptions, originated in the vicinity of Monowai Seamount ...
Information Contacts: J. Talandier, LDG, Tahiti.
Acoustic T-wave swarms
Acoustic T-waves of long duration, typical of shallow submarine eruptions, were recorded 29 October-2 November and 15-19 November 1990, 20-25 January, 2-5 February, and 10-25 March 1991 by the RSP. The signals originated in the vicinity of Monowai Seamount.
Information Contacts: J. Talandier, LDG, Tahiti.
Earthquake swarm in late November detected acoustically
During November, Reseau Sismique Polynesien (RSP) stations on the islands of Tahiti, Rangiroa, Tubuai, and Rikitea registered acoustic T-waves. The waves were associated with a seismic swarm centered >2,500 km E of these islands. The swarm was located at 25.92 S, 177.15 W, essentially the coordinates of the Monowai seamount.
The T-wave swarm consisted of four episodes. The first, at 1751 on 27 November, lasted for 20 minutes and included seven separate explosions and other strong events. The second, 1403 on 28 November lasted 4 minutes and included small-amplitude events. The third, at 1842 on 30 November, prevailed for 7 minutes and included moderate-amplitude events. Ten minutes later, the fourth episode included 25 distinct explosions and other strong events.
The character of the T-wave signals was consistent with volcanism. T-waves are sound waves with paths that propagate through the sea; on reaching land the energy travels at the higher speed of ordinary seismic waves. Compared to earthquake-generated T-waves, volcanically generated ones are impulsive and of comparatively short duration.
Recent activity includes a possible eruption in 1944, and about seven documented eruptions during 1977-90 (BGVN 16:03). The seamount lies midway between the Kermadec and Tonga Islands, ~1,400 km NE of New Zealand. The adjacent trench is significantly shallower (~4 km) compared to the Tonga and Kermadec trenches (9-11 km deep).
Information Contacts: Francois Schindele, Laboratoire de Geophysique, B.P. 640, Papeete, Tahiti.
September T-waves from an interpreted eruption
Monowai generated intense acoustic T-waves during 20-22 September (figure 2). During these three days, the seismic stations on Tahiti and Gambiers islands recorded >100 acoustic T-waves. This acoustic crisis, which occurred from 0230 on 20 September to 1358 on 22 September, began with a short explosion of high intensity that was followed by an amplitude-modulated noise during the first hour. Short explosions were sometimes associated with high-energy noise puffs. The two strongest puffs of noise were recorded at 0318 on 21 September and at 0256 on 22 September. There was an intense period of acoustic waves registered between 1404 on 21 September and at 0456 on 22 September. The intensity of acoustic waves began to decline at 0456 on 22 September. The event was interpreted as an eruption.
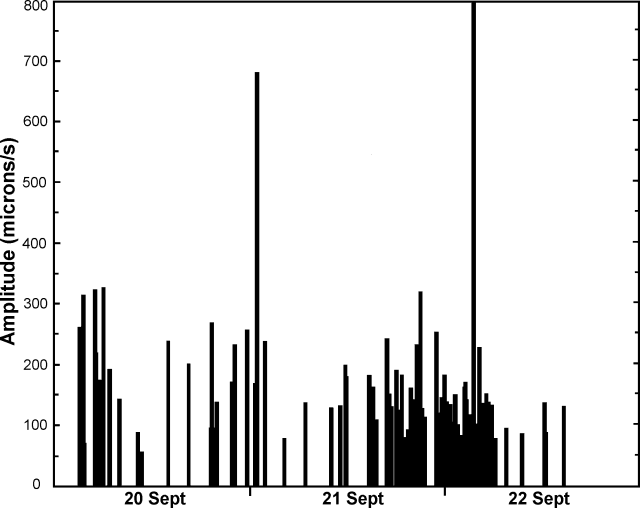 |
Figure 2. Amplitude of acoustic waves recorded during 20-22 September (times shown are for signal origin at Monowai). Courtesy of Olivier Hyvernaud. |
Monowai Seamount also had a T-wave swarm in November 1995 (BGVN 20:11/12). Other noteworthy recent activity at Monowai included a possible eruption in 1944, and about seven documented eruptions during 1977-90 (BGVN 16:03). The seamount lies midway between the Kermadec and Tonga Islands, ~1,400 km NE of New Zealand. The adjacent trench is significantly shallower (~4 km) compared to the Tonga and Kermadec trenches (9-11 km deep).
Information Contacts: Olivier Hyvernaud, B.P. 640, Laboratoire de Geophysique, Papeete, Tahiti.
Seismically inferred eruption during 17-20 April
Between 17 and 20 April the seismic network of the French Laboratoire de Geophysique in Tahiti recorded an acoustic swarm from Monowai seamount (figure 3). The swarm ended on 20 April at 2058 GMT. It was very similar to the swarm of September 1996, with similar amplitudes and overall duration.
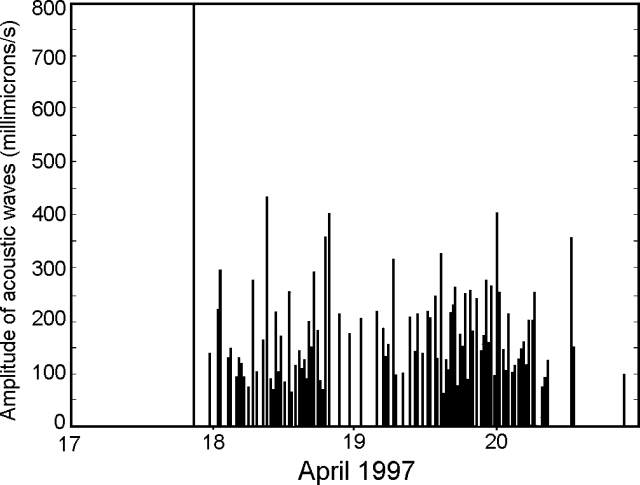 |
Figure 3. The 17-20 April 1997 acoustic swarm at Monawai seamount shown as a plot of wave amplitude versus time. Courtesy of Olivier Hyvernaud. |
The signals for the 17 April acoustic swarm that started at 2007 GMT consisted of strong acoustic waves with a maximum peak-to-peak amplitude of 1.01 m/s. These and later signals were interpreted as an indication of explosive phenomena. The subsequent acoustic waves were weaker, with amplitudes between 50 and 450 millimicrons/second. Overall, the laboratory recorded 136 acoustic waves. Most of the signals clustered into two episodes. The first took place on 18 April during 0013-1911 GMT and included 46 acoustic waves. The second occurred on 19 April during 0308-0810 GMT and included 81 acoustic waves. In addition to including more waves in a shorter time interval, the second episode was stronger.
The above-cited coordinates (25.89°S, 177.19°W) are for the summit of the volcano. A bubbling area was discovered on 17 October 1977 at 25.917°S, 177.233°W. The exact coordinates of the acoustic source discussed here are not well known, and can not be located precisely using currently available T-wave selections.
Proceeding NNE from the Rumble (I, II, III, and IV) seamounts (New Zealand), the next known active volcanoes lie in the Southern Kermadec Islands. From S to N, these consist of Curtis (submarine), Brimstone Island (submarine), Macauley Island (a sub-aerial caldera), Raoul Island (a vigorously active stratovolcano), an unnamed center (submarine), and then Monowai (submarine). Monowai was the source of over six inferred eruptions; in some cases these eruption reports were also based on collateral visual observations such as discolored water and bubbles.
Information Contacts: Olivier Hyvernaud, BP 640, Laboratoire de Geophysique, Tahiti, French Polynesia.
Inferred eruption during 15-18 December
A cluster of high-amplitude acoustic signals from Monowai was recorded during 15-17 December (figure 4). During the activity, 171 acoustic waves of varying duration were recorded. Of the waves, nine were interpreted as explosive, determined according to seismic signal characteristics. The explosive waves occurred during the first episode of heightened activity on 15 December. The signals indicated that an eruptive event stronger than those of September 1996 (BGVN 21:11) and April 1997 (BGVN 22:05) was occurring. However, infrared and visible GOES-9 imagery showed no evidence of near-surface activity.
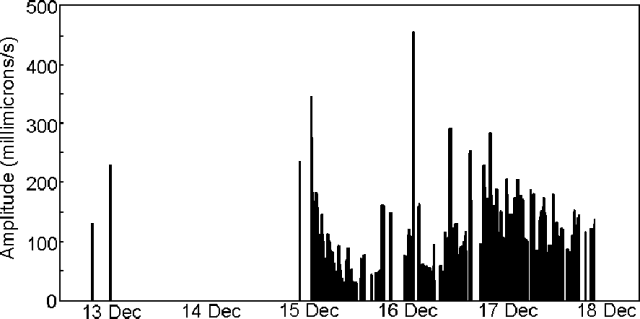 |
Figure 4. Acoustic signals from Monowai Seamount during 13-18 December. Courtesy of O. Hyvernaud. |
Three small acoustic waves on 12 and 14 December preceded the heightened activity. The first high- amplitude acoustic wave was generated at 2330 GMT on 14 December; the last was generated at 2021 GMT on 17 December. The acoustic activity stopped suddenly after a sequence of weak, very long acoustic waves. The strongest wave, generated at 0021 GMT on 16 December, had a peak-to-peak amplitude of 0.46 mm/s but was not explosive.
Monowai Seamount lies midway between the Kermadec and Tonga Islands, ~1,400 km NE of New Zealand. The adjacent trench is significantly shallower (~4 km) than the Tonga and Kermadec trenches (9-11 km deep). A T-wave swarm was detected in November 1995 (BGVN 20:11/12). Other noteworthy recent activity at Monowai included a possible eruption in 1944, and about seven documented eruptions during 1977-90 (BGVN 16:03).
Information Contacts: Olivier Hyvernaud, BP 640, Laboratoire de Geophysique, Papeete, Tahiti, French Polynesia.
Acoustic signals from submarine explosions detected
The French Polynesian Seismic Network detected short episodes of acoustic signals from the Kermadec area during both 16-17 January and 31 January-3 February. According to the signal arrival times at various stations, the source was Monowai Seamount. The two events were interpreted as later stages of the eruptive activity of 15-17 December 1997 (BGVN 22:11).
The first episode, which lasted from 1739 on 16 January until 1034 the next day (figure 5), included weak, long, high-frequency tremors. At 0200 on 17 January, the tremors increased in intensity and short explosive waves appeared. The total number of acoustic waves recorded during the event was 69; nine of the waves during the first two hours were interpreted as explosive. The strongest wave, recorded at 0927 on 17 January, was not explosive.
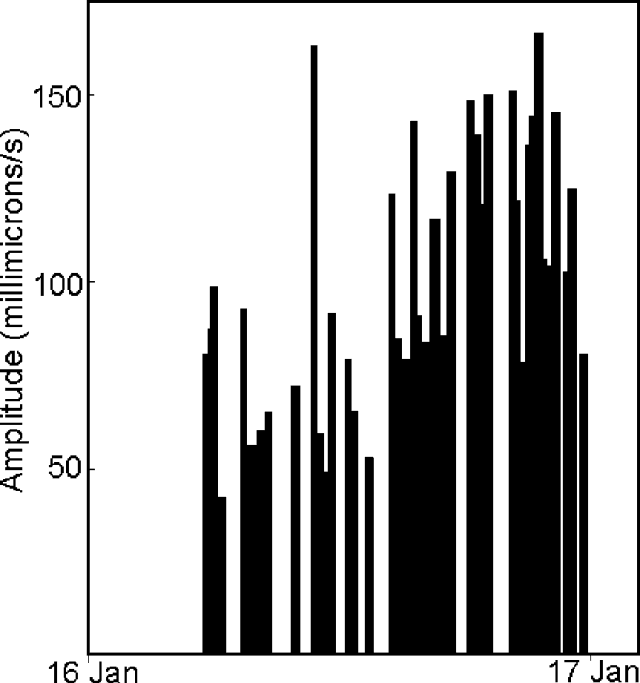 |
Figure 5. Acoustic waves from Monowai Seamount during 16-17 January (times are GMT). Courtesy of O. Hyvernaud. |
The second episode of acoustic activity consisted of 86 waves during 31 January-4 February (figure 6). Explosive waves accounted for 18 of the total. The strongest, at 0250 on 4 February, was not explosive. The main activity was concentrated on 3 February but stopped suddenly.
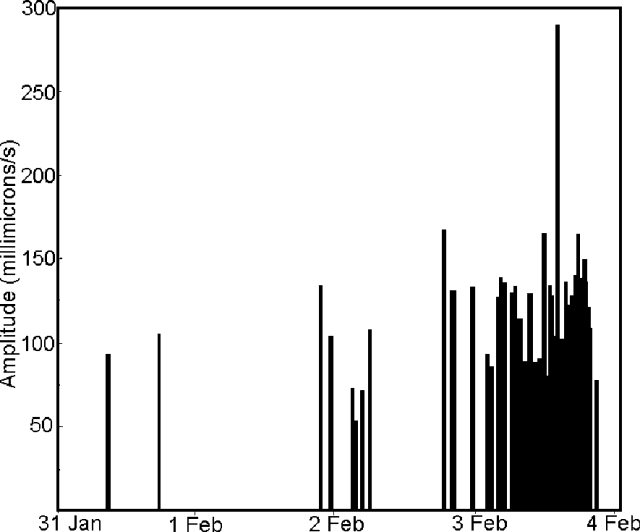 |
Figure 6. Acoustic signals from Monowai Seamount during 31 January-4 February (times are GMT). Courtesy of O. Hyvernaud. |
Monowai Seamount, also known as Orion seamount, lies midway between the Kermadec and Tonga Islands, ~1,400 km NE of New Zealand. Small parasitic cones occur on its N and W flanks. Numerous eruptions have been detected from submarine acoustic signals since 1977. Surface observations have included water discoloration, vigorous gas bubbling, and areas of upwelling water accompanied by rumbling noises.
Information Contacts: Olivier Hyvernaud, BP 640, Laboratoire de Geophysique, Papeete, Tahiti, French Polynesia.
Strong acoustic crisis recorded during 5-10 June
The French Polynesian Seismic Network recorded a strong acoustic crisis originating from Kermadec, very near Monowai Seamount, during 5-10 June. The acoustic crisis started at 0300 on 6 June (1500 on 5 June GMT) and ended at 0100 on 11 June (1300 on 10 June GMT) with no precursory activity (figure 7). Two distinct episodes were separated by a 4-hour period of inactivity. The network recorded more than 394 strong acoustic T-waves; the strongest took place at 1115 on 6 June (2315 on 5 June GMT). The first signal received on 6 June began with an impulse and lasted more than 12 minutes. Many of them had explosive characteristics, short and strong. The activity stopped with a small explosive T-wave. No tremor was recorded.
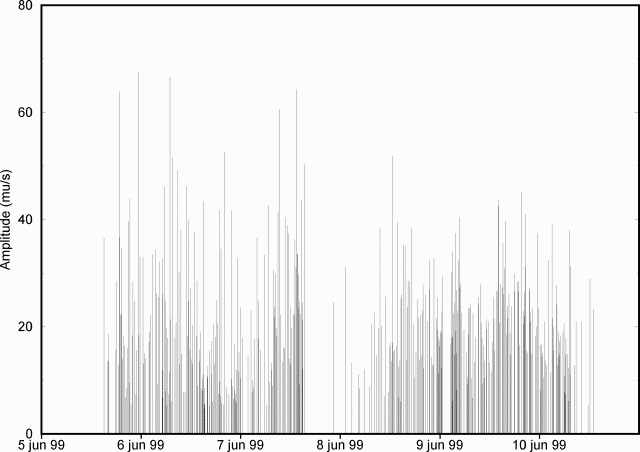 |
Figure 7. Acoustic wave amplitudes recorded by the French Polynesian Seismic Network during 5-10 June. The source of these waves was near the Monowai Seamount. Courtesy of Olivier Hyvernaud. |
Monowai Seamount lies midway between the Kermadec and Tonga Islands, ~1,400 km NE of New Zealand. The adjacent trench is much shallower (~4 km) compared with the Tonga and Kermadec trenches (9-11 km deep). There was a T-wave swarm in November 1995 (BGVN 20:11/12). Other noteworthy recent activity at Monowai included a possible eruption in 1944, and about seven documented eruptions during 1977-90 (BGVN 16:03).
Information Contacts: Olivier Hyvernaud, Laboratoire de Géophysique, BP 640 Pamatai, Tahiti, French Polynesia.
Strong T-waves during May 2002 indicate explosive activity
The last reported activity at Monowai occurred during June 1999 when a strong acoustic crisis was recorded (BGVN 24:06). During May 2002, strong T-waves coming from Monowai were detected by the French Polynesian Seismic Network. The signal began at 1522 on 24 May and suggested explosive activity. Several small events were detected during the next two hours. No further activity was recorded following the event.
General Reference. Davey, F.J., 1980, The Monowai Seamount: an active submarine volcanic centre on the Tonga-Kermadec Ridge (Note): New Zealand Journal of Geology and Geophysics, v. 23, p. 533-536.
Information Contacts: Dominique Reymond, Geophysical Laboratory, CEA/DASE, PO Box 640, Papeete, Tahiti, French Polynesia.
Volcanic earthquake swarm during 1-24 November eruption
Numerous eruptions of Monowai Seamount (also known as Orion Seamount), an active volcano located in the Kermadec Island arc, were detected by the Polynesian Seismic Research (Reseau Sismique Polynesien, RSP) seismic network in Tahiti (figure 8). Strong T-phase waves were recorded at all of the stations in the RSP network (figure 9). The last reports of Monowai eruption activities were in January 1998 (BGVN 23:01), June 1999 (BGVN 24:06), and May 2002 (BGVN 27:05).
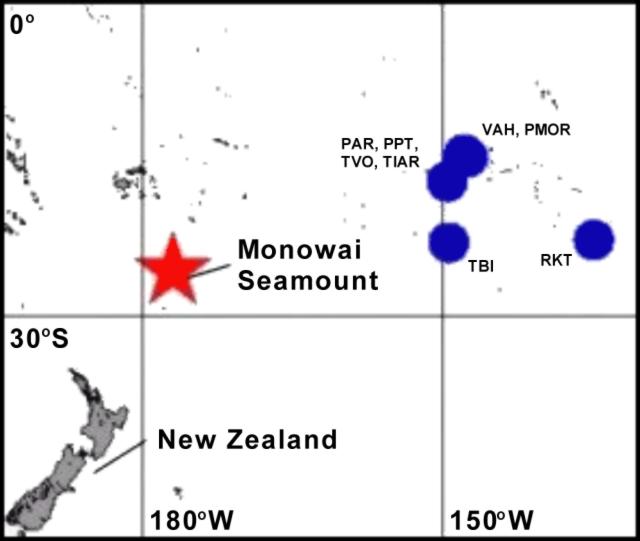 |
Figure 8. Map of the South Pacific Ocean showing the location of some RSP (Reseau Sismique Polynesien) seismic network stations (circles indicate area of island group with labeled stations) and Monowai Seamount (star). All seismic stations are inland; there are no hydrophones in the network. Stations shown include VAH and PMOR (Tuamotu archipelago), PAE, PPT, TVO, and TIAR (Society Islands), TBI (Austral Islands), and RKT (Gambier archipelago). Courtesy of Laboratoire de Geophysique, Tahiti. |
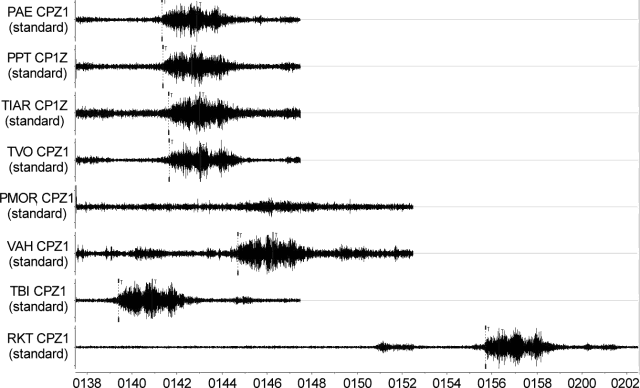 |
Figure 9. Example of strong T-phase waves detected by the RSP from Monowai, 18 November 2002 (times are UTC). All the seismic stations in the network recorded the wave generated during eruption of the volcano. Note the good signal coherency between most stations. The record at the PMOR station, located in the north of Rangiroa, was masked for the T waves. Courtesy of Laboratoire de Geophysique, Tahiti. |
Geophysical network. The Polynesian Seismic Network is composed of short-period seismic stations on Rangiroa atoll in the Tuamotu archipelago (stations VAH and PMOR), on Tahiti in the Society Islands (stations PAE, PPT, TVO, and TIAR), on Tubuai in the Austral Islands (station TBI), and on Rikitea in the Gambier archipelago (station RKT). There are also three long-period seismic stations in Tahiti, Tubuai, and Rikitea. In addition, Comprehensive Test Ban Treaty (CTBT) instruments located in Tahiti include a mini-array of micro-barographs, a primary seismic station (station PS18 at Papeete), and a radionuclide station.
Earthquake swarm. A volcanic earthquake swarm started on 1 November 2002 at 1200 UTC with strong explosive T-phase waves recorded by the RSP network (figure 10). The swarm stopped temporarily between 8 and 17 November; a second, very intense swarm started on 17 November (figure 11) and ended on 24 November. From inversion of T-phase wave arrival times, it was deduced that the swarm was located around Monowai Seamount. Because of the small aperture of the RSP network, the location is poorly constrained in longitude, but well constrained in latitude (figure 12). The source of the T-phase waves is most probably at Monowai.
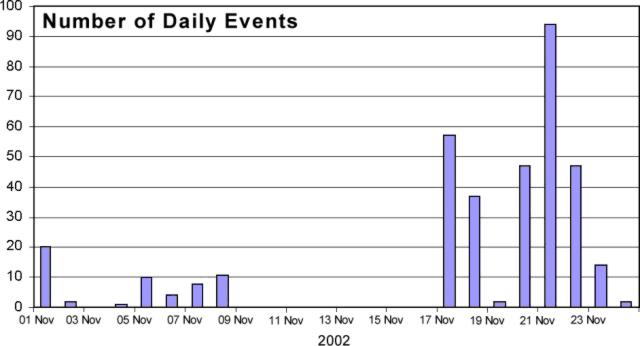 |
Figure 10. Daily history of the Monowai swarm. The maximum number of daily events was on 21 November, but the higher amplitude T-phase waves were detected during 17-19 November. Courtesy of Laboratoire de Geophysique, Tahiti. |
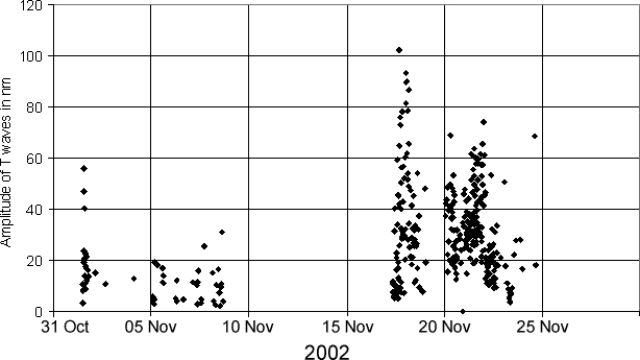 |
Figure 11. Daily history of amplitude (in nanometers) of Monowai swarm T-phase waves recorded at TVO station on Tahiti. The maximum intensity was between 17 and 19 November. These amplitudes should correlate to ground vibrations generated by the volcanic eruptions. Courtesy of Laboratoire de Geophysique, Tahiti. |
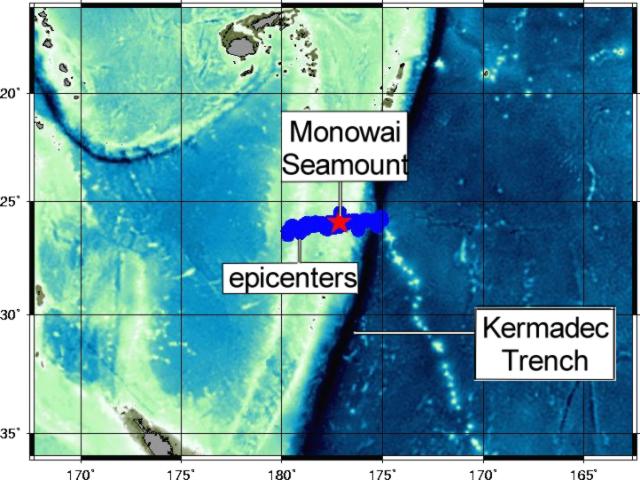 |
Figure 12. Map showing the best source locations of the swarms using the entire seismic network. The star is Monowai Seamount, and the dots are possible source epicenters. The effect of linearity observed on the epicenters is due essentially to the aperture size of the network, but note that the latitude is well constrained. Courtesy of Laboratoire de Geophysique, Tahiti. |
Regarding T-Phase waves. A short-period wave group from a seismic source that has propagated in part through the ocean is called T-phase or T(ertiary)-wave (Linehan, 1940; Tolstoy and Ewing, 1950; Walker and Hammond, 1998). The wave group propagates with low attenuation as hydro-acoustic (compressional) waves in the ocean, constrained within a low sound speed wave guide (the sound fixing and ranging - SOFAR - channel) formed by the sound speed structure in the ocean. The T-phase signal may be picked up by hydrophones in the ocean or by land seismometers. Upon incidence with the continental shelf/slope, the wave group is transformed into ordinary seismic waves that arrive considerably later than seismic wave groups from the same source that propagated entirely through the solid earth.
References. Brothers, R.N., Heming, R.F., Hawke, M.M., and Davey, F.J., 1980, Tholeiitic basalt from the Monowai seamount, Tonga-Kermadec ridge (Note): New Zealand Journal of Geology and Geophysics, v. 23, p. 537-539.
Davey, F.J., 1980, The Monowai Seamount: an active submarine volcanic centre of the Tonga-Kermadec Ridge (Note): New Zealand Journal of Geology and Geophysics, v. 23, p. 533-536.
Linehan, D, 1940, Earthquakes in the West Indian region: Transactions, American Geophysical Union, Pt. II, p. 229-232.
Tolstoy, I., and Ewing, M., 1950, The T phase of shallow-focus earthquakes: Bulletin of the Seismological Society of America, v. 40, p. 25-51.
Walker, D.A., and Hammond, S.R., 1998, Historical Gorda Ridge T-phase swarms; relationships to ridge structure and the tectonic and volcanic state of the ridge during 1964-1966: Deep-Sea Research Part II, v. 45, n. 12, p. 2531-2545.
Information Contacts: Dominique Reymond and Olivier Hyvernaud, Laboratoire de Geophysique, CEA/DASE/LDG, Tahiti, PO Box 640, Papeete, French Polynesia.
Volcanic earthquake swarm April-May detected by T-waves
Monowai is a frequently active submarine volcano, with a volcanic swarm recorded in November 2002 (BGVN 28:02) and another during April-May 2003. A major part of its volcanic activity is detected by hydro-acoustic waves (also called T-waves) generated during the eruptions, through the Réseau Sismique Polynésien (RSP), the French Polynesian seismic network (table 1).
Table 1. Seismic station codes and coordinates of instruments in the French Polynesian seismic network. Courtesy of RSP.
| Station code | Latitude | Longitude |
| PAE | 17.6619°S | 149.5800°W |
| PPT | 17.5682°S | 149.5761°W |
| PPN | 17.5308°S | 149.4322°W |
| TIA | 17.5578°S | 149.3458°W |
| VO | 17.7825°S | 149.2517°W |
| MEH | 17.8753°S | 148.0661°W |
| PMOR | 15.0017°S | 147.8942°W |
| VAH | 15.2364°S | 147.6272°W |
| TBI | 23.3489°S | 149.4608°W |
| RKT | 23.1197°S | 134.9733°W |
A strong volcanic swarm located on the Monowai seamount was recorded during April-May 2003 (figure 13). This volcanic swarm was very well located around Monowai, using the inversion of the arrival times of T-waves recorded by the network. As an example of the precision of location, with the contribution of some IRIS stations like RAR (Cook Island) to enlarge the array dimension, the ellipse of error can typically be 13 km on the major axis and 2 km on the minor axis, with a Root Mean Squared (RMS) of 0.25 s.
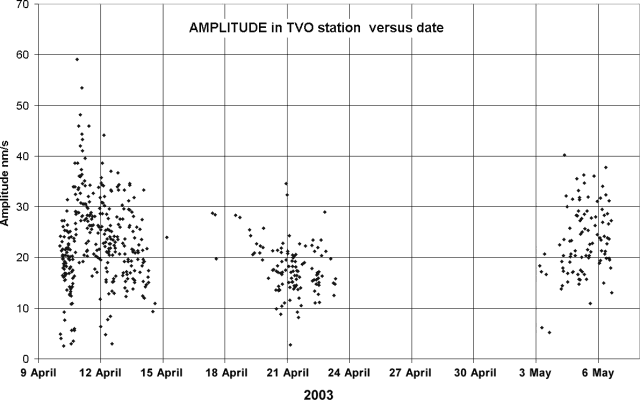 |
Figure 13. T-wave amplitude versus time for the TVO seismic station, showing the three distinct and well separated episodes of the Monowai Seamount swarm. Courtesy of RSP. |
This volcanic swarm was composed of three episodes lasting 4-5 days each. It started suddenly on 10 April 2003 with a rate of 100 events per day (about one signal every 10 minutes) and reached a maximum intensity later that day. The average rate over the first four days was 75 events per day (300 signals between 10 and 14 April), but the number of events detected is thought to be underestimated by a factor of at least 3 to 5 because only the main packets of recorded T-waves were picked. Volcanic activity started again during 19 April, with 120 events recorded in the next five days. The last episode occurred between 3 and 6 May, with ~100 volcanic signals recorded. The swarm ended as suddenly as it started.
Information Contacts: Dominique Reymond and Olivier Hyvernaud, Laboratoire de Geophysique, CEA/DASE/LDG Tahiti, PO Box 640, Papeete, French Polynesia.
Eleven earthquake and T-wave swarms during April-November
Monowai is a frequently active submarine volcano that has had volcanic earthquake swarms recorded in May 2002 (BGVN 27:05), November 2002 (BGVN 28:02), and April-May 2003 (BGVN 28:05). Monowai exhibited increased activity for the first 11 months of 2003, during which more than 1,300 events were detected and located by the French Polynesian seismic network via hydro-acoustic waves (also called T-waves) generated by this submarine volcano. Each volcanic eruption, creating explosions and boiling water, generates hydro-acoustic waves that are able to propagate several thousands of kilometers through the ocean in a wave guide (a low velocity zone located at ~1,000 m depth called the SOFAR—Sound Fixing and Ranging—channel). Consequently, a major part of the volcanic activity can be monitored at great distances in the oceans (> 3,000 km) using the T-waves. The amplitudes of T-waves correlate with the strength or intensity of the eruptions.
Activity at Monowai during 2003 has been much greater than in 2002. From April through November 2003, 11 swarms have been detected (figure 14); about one swarm was detected every two weeks except in the months of June and September, when no T-waves were detected from Monowai. A volcanic swarm started suddenly on 10 April 2003 with an average rate of about 50-60 events per day (figure 15). The activity seemed to decrease smoothly in 2003 compared to abrupt halts in activity in 2002.
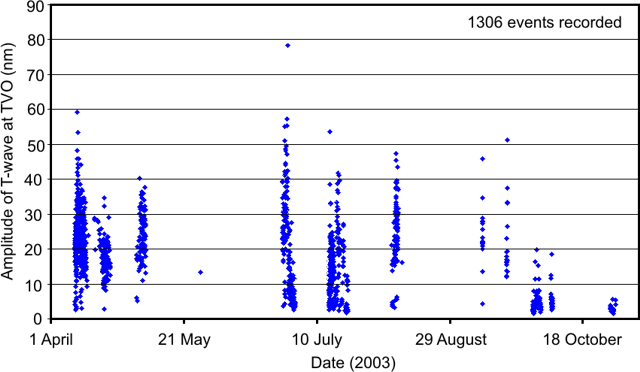 |
Figure 14. Amplitudes of T-waves from Monowai recorded at the TVO station on Tahiti during 1 April through early November 2003. Courtesy of Laboratoire de Geophysique, Tahiti. |
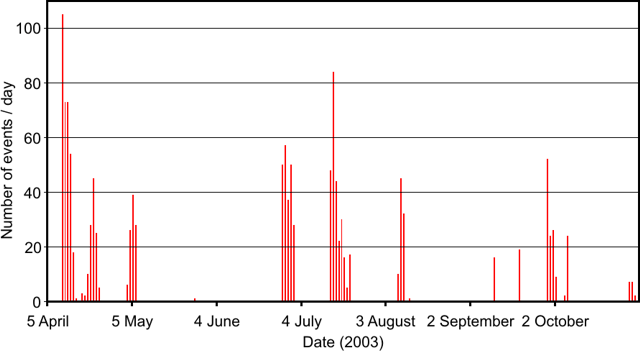 |
Figure 15. Number of daily seismic events at Monowai recorded by the Polynesian seismic network, RSP (Réseau Sismique Polynésien) during 5 April through early November 2003. These numbers are probably largely underestimated. Courtesy of Laboratoire de Geophysique, Tahiti. |
The observed swarms are composed of a lot of events over at least 30 minutes containing many tens of signals, producing a quasi-continuous and fluctuating noise. However, these types of signals are detected across the entire seismic network. If a particular wave (a maximum amplitude, or the beginning of a wave) visible in all the seismic records is selected, it is possible to locate the source by the inversion of the travel time. Sometimes strong amplitudes are recorded that can be correlated with the strength of the volcanic explosion.
Information Contacts: Dominique Reymond and Olivier Hyvernaud, Laboratoire de Geophysique, CEA/DASE/LDG Tahiti, P.O. Box 640, Papeete, French Polynesia.
Activity revealed by T phase swarms in 2004 and 2005
Monowai is a frequently active submarine volcano; during April-November 2003, eleven earthquake and T phase swarms from Monowai were recorded by the Polynesian seismic network (Réseau Sismique Polynésien, RSP) operated by the Laboratoire de Geophysique (LDG) (BGVN 28:11). Approximately 260 T phases in 2004 and 365 in January-August 2005 were detected and analyzed by LDG.
In 2004, four short swarms, of 2-3 days duration and 50-80 T phases per swarm (figure 16), occurred on 18-19 February, 31 March-2 April, 27-29 June, and 14 August. Between August 2004 and March 2005, no T phases from Monowai were recorded, indicating a period of quiescence at the volcano. In 2005, T phase swarms from Monowai were recorded on 2-3 March, 16-21 April, and 25-26 May.
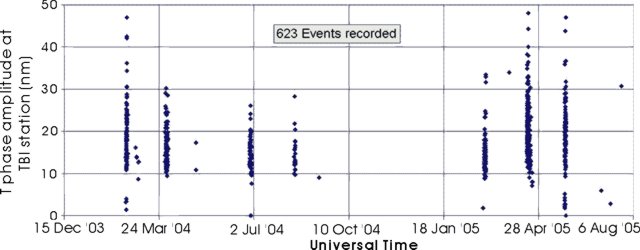 |
Figure 16. Amplitudes of T phases originating from Monowai Seamount recorded at TBI station on Austral Island (see map in BGVN 28:02), versus time. Courtesy of D. Reymond and O. Hyvernaud, LDG. |
As of early August 2005, volcanic activity, as indicated by T phases recorded by RSP, resumed, though numerous events have not yet been analyzed.
Information Contacts: Dominique Reymond and Olivier Hyvernaud, Laboratoire de Geophysique, CEA/DASE/LDG Tahiti, PO Box 640, Papeete, French Polynesia.
Elevated number of T-waves during 2005-6
According to Dominique Reymond and Olivier Hyvernaud (affiliates of Laboratoire de Geophysique, in Saint Martin d' Heres, France), activity at Monowai from 2005-2006 was remarkable because of the more than 1,650 events recorded as hydroacoustic waves (also called T-phase waves or T-waves) on the Polynesian Seismic Network (Réseau Sismique Polynésien, or RSP). Such waves are generated by submarine earthquakes and/or volcanic eruptions that can be monitored at great distances via seismic stations close to the shore and/or by hydrophones. The amplitudes of T-waves are related to the strength or intensity of submarine volcanism at the seamount.
The T-wave activity after 2002 appeared in two main stages (figure 17). The initial stage extended from early 2003 to August 2004, followed by a period of repose that lasted until March 2005. A second stage of T-wave activity then continued until July 2006, followed by another six months of quiet. Reymond and Hyvernaud noted that individual T-wave swarms typically had durations varying between 1 day and 3 weeks.
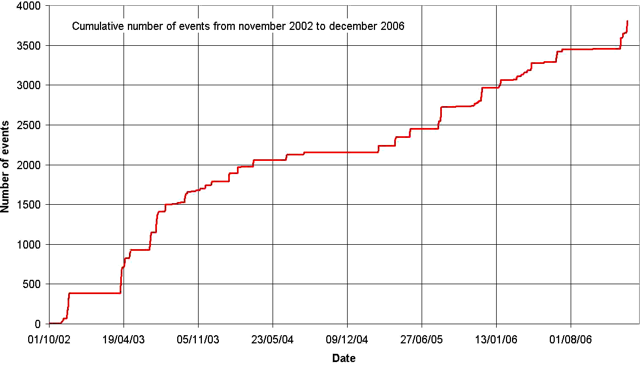 |
Figure 17. Cumulative number of events recorded by the RSP for Monowai from 1 November 2002 to 31 December 2006. Courtesy of Dominique Reymond and Olivier Hyvernaud. |
It appears that another cycle started 12 December 2006 (figure 17), continuing at least until the end of the month. The average number of events from the end of 2002 until the end of 2006 was about 950 per year. In the last two years (2005-2006), a slightly lower rate of 825 events per year was measured (figure 18).
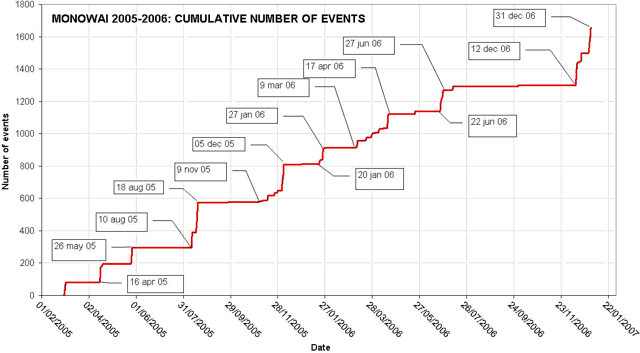 |
Figure 18. Cumulative number of T-waves at Monowai recorded by the RSP over the period 2005-2006, with dates indicating the start and end of each swarm. The duration of the swarms varied between 1 day and 3 weeks. Courtesy of Dominique Reymond and Olivier Hyvernaud. |
The amplitudes of T-waves recorded during 2005-2006 at the TVO seismic station in Tahiti never reached 1/3 of the amplitude that was recorded on 24 May 2002. It was that day when amplitudes of 350 nm were reached (figure 19). The average values for T-wave amplitudes during the period shown in figure 19 are in the 5-50 nm range.
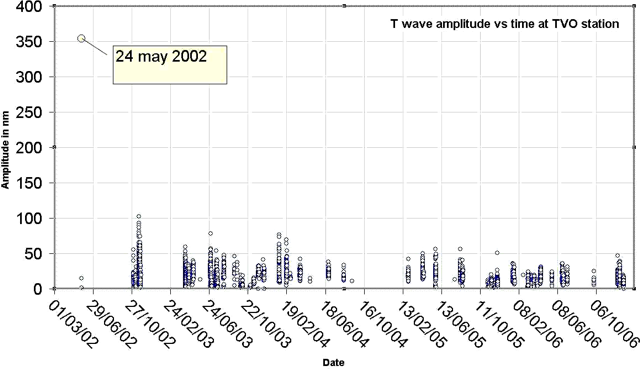 |
Figure 19. Amplitude (in nanometers of ground motion) for Monowai T-waves recorded at the TVO station over the last 4 years (2002-2006). While the average values are in the range of 5- 50 nm, only one exceptional value of 350 nm was recorded on 24 May 2002 (BGVN 27:05). Courtesy of Dominique Reymond and Olivier Hyvernaud. |
Information Contacts: Dominique Reymond and Olivier Hyvernaud, Laboratoire de Géophysique, Commissariat a l'Energie Atomique, CEA/DASE/LDG, PO Box 640, Papeete, Tahiti, French Polynesia.
Eruption recorded on 8 February 2008
On 28 March 2008, reporter Michael Field noted that an eruption of the submarine volcano Monowai was taking place. Olivier Hyvernaud was quoted in the article as saying that they recorded on the Polynesian Seismic Network (Réseau Sismique Polynésien, or RSP) a "big acoustic event" on 8 February. [He also noted that the volcano was in an eruptive phase, but it was not clear if it was a strong eruption.] The news article went on to say that, according to geologist Cornel de Ronde, the French Polynesian RSP currently receives submarine hydrophone signals from Monowai eruptions more easily than stations in New Zealand. The article concluded that this activity went unnoticed as its location is off the main shipping routes.
Ian Wright of the New Zealand National Institute of Water and Atmospheric Research (NIWA) informed us about new volcano discoveries along the S-central Kermadec arc and some recent mapping results from Monowai. In recent years, New Zealand scientists have mapped, using soundings made by multibeam acoustic arrays, most of the Kermadec arc, with the consequent discovery and naming of a number of 'new' arc volcanoes. Some of the more recent work for the 30°-35°S latitude sector was published in Wright and others (2006). A second manuscript detailing the 25°-30°S latitude sector will be completed soon for publication by Graham and others.
Wright and his colleagues mapped Monowai using the multibeam system in 1998 and again in 2004, identifying drastic changes in morphology during that 6-year period. They found edifice collapse and cone regrowth. They interpreted these changes in morphology in the context of T-wave data recorded by Hyvernaud and his colleague Dominique Reymond [Wright and others, 2008 (in press); BGVN 32:01].
As indicated on figures 20 and 21, the group subsequently re-mapped Monowai in mid-2007 for a third time, again finding drastic changes coinciding with a period of ongoing and high T-wave activity. They are currently preparing a manuscript detailing these latter changes (Chadwick and others, in preparation). According to Bill Chadwick, while the research ship was on site conducting the 2007 survey and attempting some remotely operated vehicle (ROV) dives, scientists heard booming sounds and saw slicks and bubbles on the surface.
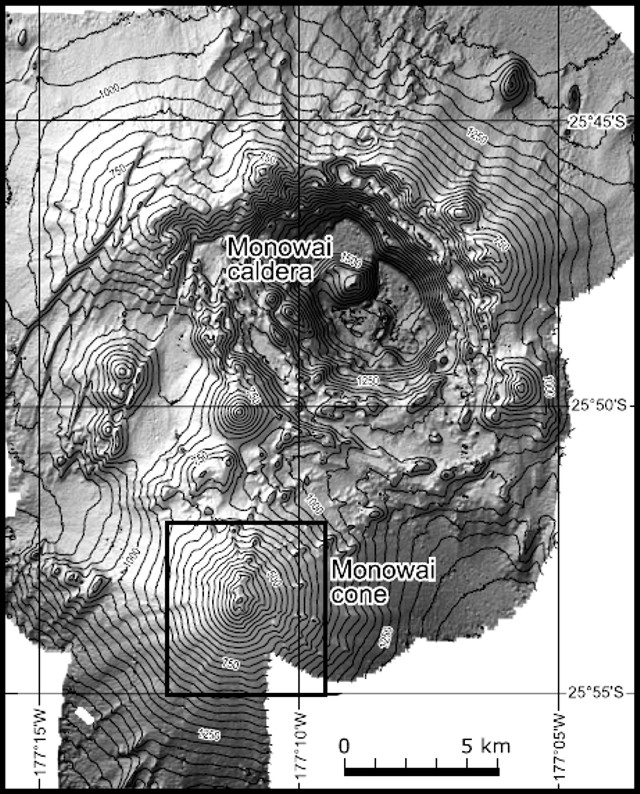 |
Figure 20. Multibeam bathymetry and shaded terrain model of the Monowai volcanic complex, including its caldera and cone. Isobaths are shown at 50 m intervals. Courtesy of Wright and others, 2008 (in press). |
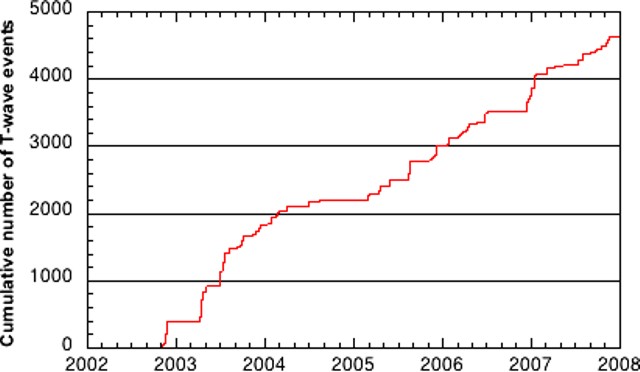 |
Figure 21. Cumulative number of T-wave events centered at Monowai during the latter half of 2002 through 2007 from monitoring data at RSP (covering the times of the September 2004 and May 2007 bathymetric surveys, and the anomalous 24 May 2002 swarm, as reported in BGVN 27:05 and 32:01). Courtesy of Hyvernaud and Reymond, Laboratoire de Geophysique (LDG); from Chadwick and others (in preparation). |
Bob Dziak of NOAA informed the Bulletin staff that Monowai T-phases are recorded on the NOAA East Pacific Rise hydrophone arrays, but analysis of data from those arrays await their retrieval of recording packages from ocean deployment sites. (In contrast, Hyvernaud of LDG in French Polynesia recovers data in real-time.) Dziak also mentioned that, from time to time, T-phase events from what is likely volcanic activity in the Izu-Bonin Mariana region are recorded by the NOAA real-time system in the North Pacific. He offered to provide a later Bulletin report.
A recent paper by de Rhonde and others (2008) noted that all the major submarine volcanic centers on the Kermadec intraoceanic arc NE of New Zealand (including Monowai) are hydrothermally active. The Monowai volcanic complex has two separate and extensive hydrothermal fields associated with the Monowai caldera and the Monowai cone, respectively.
References. Wright, I.C., Worthington, T.J., and Gamble, J.A., 2006, New multibeam mapping and geochemistry of the 30°-35°S sector, and overview, of southern Kermadec arc volcanism, Journal of Volcanology and Geothermal Research, v. 149, p. 263-296.
Wright, I. C., Chadwick, W., de Ronde, C. E. J., Reymond, D., Hyvernaud, O., Gennerich, H., Stoffers, P., Mackay, K., Dunkin, M., and Bannister, S., 2008 (in press), Collapse and reconstruction of Monowai submarine volcano, Kermadec arc, 1998-2004, Journal of Geophysical Research, doi:10.1029/2007JB005138.
de Ronde, C.E.J., Baker, E.T., Lupton, J.L., Sprovieri, M., Bruno, P.P., Faure, K., Leybourne, M.I., Walker, S.L., Italiano, F., Embley, R.W., Graham, I., Greene, R.R., Wright, I.C., and NZAPLUME III & Aeolian'07 shipboard parties, 2008, Contrasting examples of submarine hydrothermal venting along the Kermadec intraoceanic arc and the Aeolian island arc, Geophysical Research Abstracts, v. 10, EGU2008-A-05597, 2008 (SRef-ID: 1607-7962/gra/EGU2008-A-05597).
Information Contacts: Ian Wright, New Zealand National Institute of Water and Atmospheric Research (NIWA), Private Bag 14-901, Wellington, 6003, New Zealand; Cornel de Ronde, GNS Science, Lower Hutt, 5040 New Zealand; Olivier Hyvernaud and Dominique Reymond, Laboratoire de Géophysique, Commissariat a l'Energie Atomique (CEA/DASE/LDG), PO Box 640, Papeete, Tahiti, French Polynesia; GNS Science, Wairakei Research Center, Private Bag 2000, Taupo 3352, New Zealand (URL: http://www.gns.cri.nz/); Michael Field, Fairfax Media, Auckland, New Zealand; William Chadwick and Robert Dziak, NOAA and Cooperative Institute for Marine Resources Studies at Oregon State University, 2115 SE OSU Drive, Newport, OR 97365.
Eruption causes summit depth change of 18.8 m over 14 days
Monowai volcano, located 1,000 km NE of New Zealand's North Island, is one of the most active submarine volcanoes identified in the Tonga-Kermadec arc, a 2,500-km-long chain of submarine volcanoes stretching from New Zealand to just N of Tonga (figure 22). Bradley Scott, a volcanologist at New Zealand's GNS Science, reported that seismic activity recorded by GeoNet on the seismograph at Rarotonga, Cook Islands, had shown there were several days of eruptive activity at Monowai starting on 3 August 2012. A large pumice raft, first spotted on 19 July 2012, was suspected to have a source in Monowai; however, that was later discounted (see a report on Havre seamount in a subsequent issue). The most recent previous eruptions of Monowai began on 8 February 2008 and 14 May 2011.
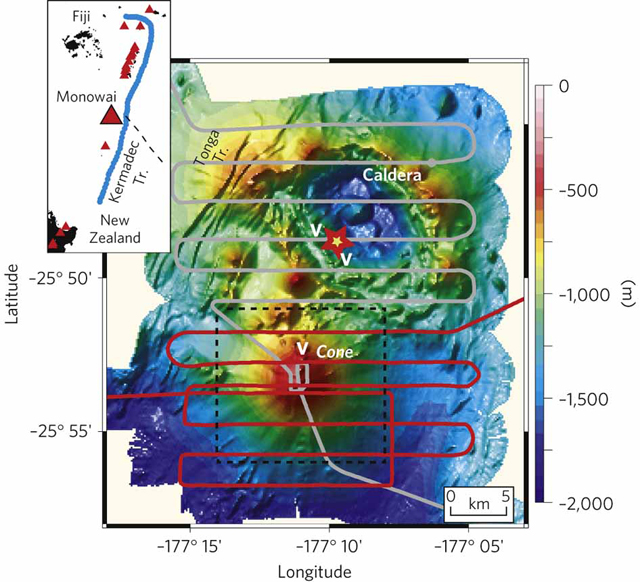 |
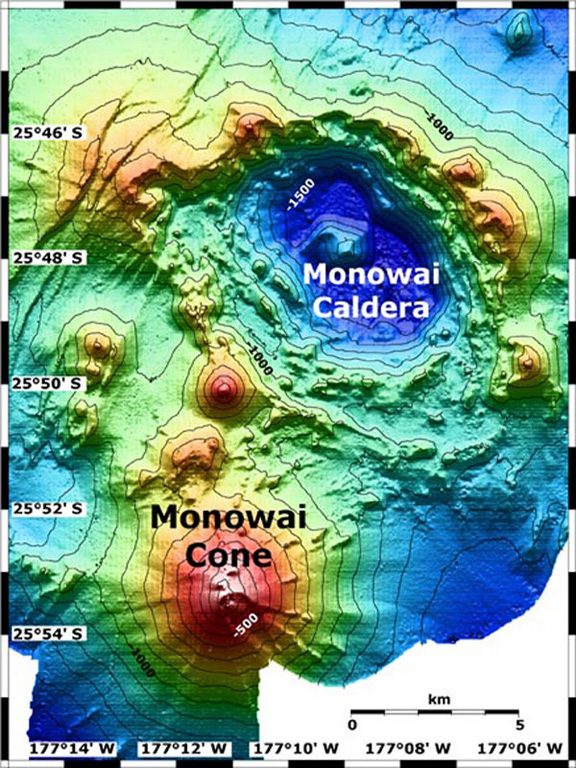
Figure 22. Regional bathymetric map of the Monowai Volcanic Centre (MVC), comprising the Monowai cone to the SW and the 10-km-wide Monowai caldera to the NE. Grey and red lines show the tracks of R/V Sonne on 14 May and during 1-2 June 2011, respectively. The yellow star with the red border shows the SW caldera hydrothermal site (from Leybourne and others, 2010). The letter 'V' indicates regions of active venting. The dashed black square around the cone shows the location of the maps in figure 23. The inset shows the location of the MVC in relation to historically active volcanoes in the Kermadec Trench area (red triangles; from Smithsonian Global Volcanism Program web site), Tonga and Kermadec Trench (blue lines), and the Louisville Ridge seamount chain (dashed black line). The depth scale along the right-hand side of the figure keys the colors in the figure to the appropriate depths, in meters. Courtesy of Watts and others (2012). |
All previous Bulletin reports on Monowai, including most of the latest one in 2008 (BGVN 33:03), describe eruptive activity as measured remotely by the Polynesian Seismic Network (Réseau Sismique Polynésien, or RSP). In contrast, this report will emphasize recent oceanographic surveys conducted over the volcanic complex that help define the features of the area.
Background. According to a recent publication by Leybourne and others (2010), the MVC comprises a large, elongate caldera (7.9 x 5.7 km; 35 km2; floor depth = 1,590 m) to the NE, formed within an older caldera (84 km2). Associated is a large active stratovolcano to the SW, which rises to within ~100 m of the sea surface. Mafic rocks dominate MVC, with only rare andesites. Plume mapping shows at least four hydrothermal systems with venting from the summit of Monowai cone and its N flank. Monowai caldera has a major hydrothermal vent system associated with the SW wall of the caldera (figure 22).
Wright and others (2008) wrote that "The first recorded eruptions at Monowai date from between 1877 and 1928 (Mastin and Witter, 2000), and subsequently reported as a shoal in 1944 (Royal Australian Navy, written communication, 1944). More recent eruptions were first observed by maritime aircraft patrols in October 1977 (Davey, 1980). A bathymetric survey undertaken in July, 1978, and towed-sonar array surveys, undertaken in March and July 1978 and March, April, and June 1979, recorded periods of volcanic activity that included discolored water and vigorous gas emissions at the sea surface (Davey, 1980). A single-beam bathymetric survey recorded a conical edifice with a summit shoal of 117 m (velocity uncorrected) in September 1978 (Davey, 1980). A reconnaissance multibeam survey in 1986 by R/V Thomas Washington identified a shoal at a depth of 115 ± 5 m (Scripps Institute of Oceanography, unpublished data, 1986)."
Bathymetry. Multibeam surveys by RV Sonne in 1998 (SO-135 voyage) and RV Tangaroa in 2004 showed the Monowai stratovolcano cone (10-12 km in diameter, rising 965 m from the 1,100-m isobath) to be the largest of a number of postcollapse cones sited around the rim of the newly discovered Monowai caldera (part of the larger volcanic complex; Graham and others, 2008). The elongate caldera was 11 x 8.5 km in size and showed evidence of at least two phases of caldera formation. Monowai cone forms a relatively simple edifice on the S caldera rim, with near constant 13-18° slopes that were interpreted by the investigators of these cruises as angles of repose of volcaniclastic deposits generated at the summit. Prominent radial dikes and small aligned vents protruded up to 50 m above the edifice slopes, especially on the N and W flanks. The S flank showed evidence of repeated sector collapse. A single video-grab transect during the 1998 RV Sonne survey across the then-shallowest vent showed that it comprised coarse scoriaceous blocks with a lapilli sand matrix. Sampled rocks from Monowai cone comprise highly vesicular, plagioclase-clinopyroxene basalts (Brothers and others, 1980; Haase and othres, 2002).
Table 2 shows the various depths of the summit of the Monowai cone as measured by multiple bathymetyric surveys conducted since 1978. Figures 23 and 24 show regions of bathymetric changes.
Table 2. Summit depth measurements of Monowai cone since 1978. Courtesy of Watts and others (2012) and references listed.
| Date | Summit depth, m | Reference |
| Sep 1978 | 117 | Davey (1980) |
| Jun 1979 | less than 120 | Brothers and others (1980) |
| 1986 | ~120 | Wright and others (2008) |
| 1990 | ~100 | BGVN 15:08 |
| 1998 | 42 ± 3 | Wright and others (2008) |
| 2004 | 132 ± 2 | Wright and others (2008) |
| 2007 | less than 69 | Chadwick and others (2008) |
| May/Jun 2011 | 60.1 | Watts and others (2012) |
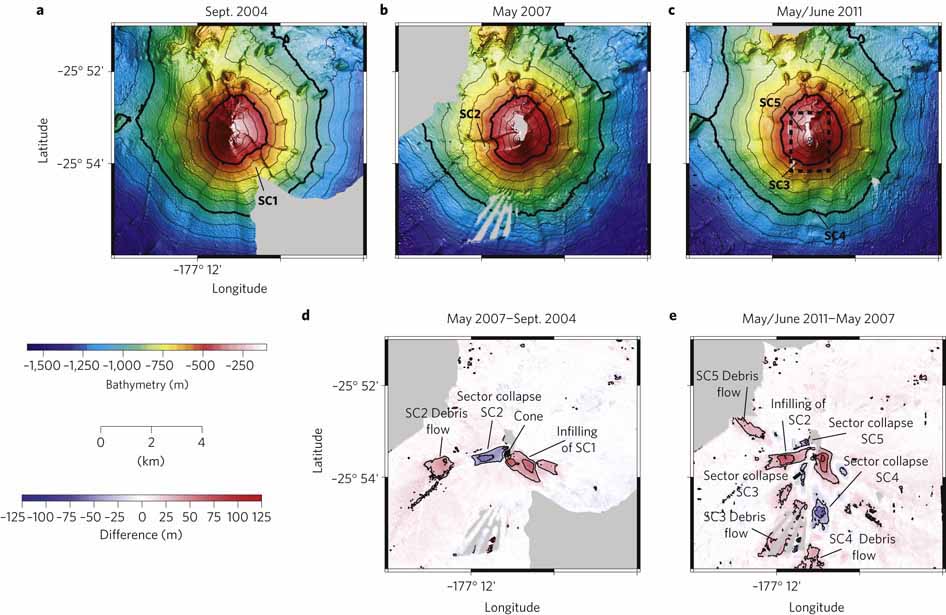 |
Figure 23. Detailed bathymetric maps of Monowai cone as it appeared in September 2004, May 2007 and May-June 2011. The map area is outlined in figure 22 (dashed black square). 'SC' denotes sector collapses. (a) Swath bathymetry acquired by R/V Tangaroa in September 2004, contoured at 100 m intervals, with thick contours at 500 m intervals. (b) Swath bathymetry, R/V Sonne, May 2007. (c) Swath bathymetry, R/V Sonne, 14 May and 1-2 June 2011 merged into a single grid. The dashed black rectangle shows the view area in figure 24. (d) Difference in bathymetry between the 2007 and 2004 surveys colored to indicate depth changes from -125 to +125 m. Shades of blue indicate depth increase (collapse), and shades of red, depth decrease (growth). (e) Difference in bathymetry between the 2011 and 2007 surveys. Colors as in (d). Colored scales indicate depths as in (a)-(c) and differences in bathymetry (as in (e) and (f)) between two dated surveys. Courtesy of Watts and others (2012). |
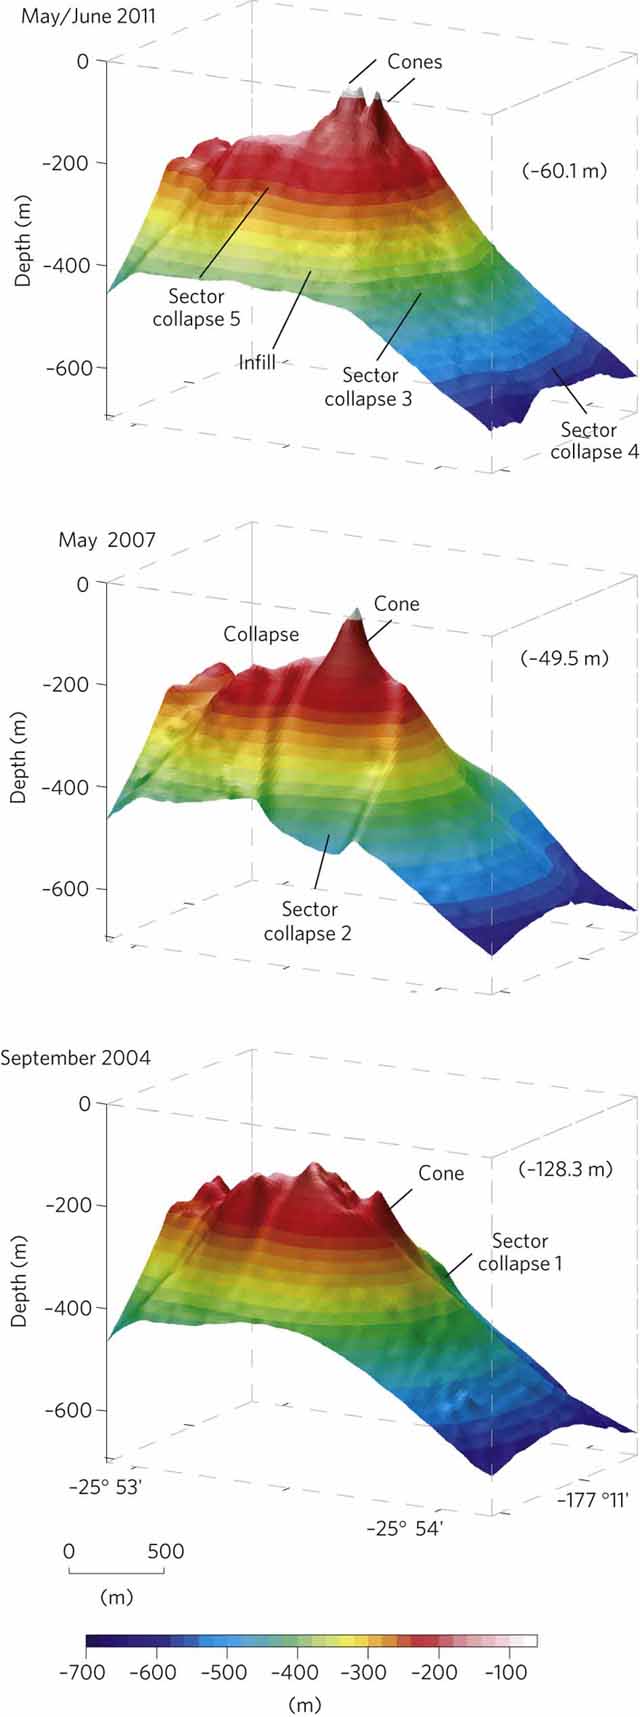 |
Figure 24. Perspective view from the SW (azimuth 240°, view angle 14° above horizontal) showing the bathymetry of the summit of Monowai cone in September 2004, May 2007, and May-June 2011. The view area is outlined by the dashed black rectangle in figure 23c. The bathymetry data have been artificially shaded by a sun located in the NW to enhance topography. The negative numbers in brackets to the right of each profile indicate the depth below sea level of the shallowest point on the summit. Colored scale shows key for bathymetry. Courtesy of Watts and others (2012). |
Mid-May to early June 2011. Watts and others (2012) reported the results of two recent bathymetric surveys of MVC conducted within a period of 14 days (14 May and 1-2 June 2011). They found marked differences in bathymetry between the surveys. New growth structures, probably due to new lava cones and debris flows, caused decreases in depth of up to 71.9 m, while collapse of the volcano summit region caused increases in depth of up to 18.8 m.
Hydro-acoustic T-wave data revealed a 5-day-long swarm of seismic events with unusually high amplitude between the two 2011 surveys, which link the depth changes to explosive activity (figures MON4, MON5, and MON6). [Note: According to NOAA (Chadwick, 2001), "A 'T-phase' or 'T-wave' is an acoustic phase from an earthquake that travels through the ocean. The 'T' stands for 'tertiary', as in: P-waves are 'primary', S-waves are 'secondary', and T-waves are 'tertiary', because they travel the slowest and so arrive third. Basically, when an earthquake occurs in the earth's crust under the ocean, the usual crustal phases are generated (P and S waves), but in addition part of the energy goes into the ocean as acoustic energy, and that is the T-wave. Not all earthquakes generate T-waves (since they need to be near water)...T-waves are typically recorded by hydrophones, but on some islands seismometers sometimes record T-wave signals that have been converted to crustal phases when they hit the island."]
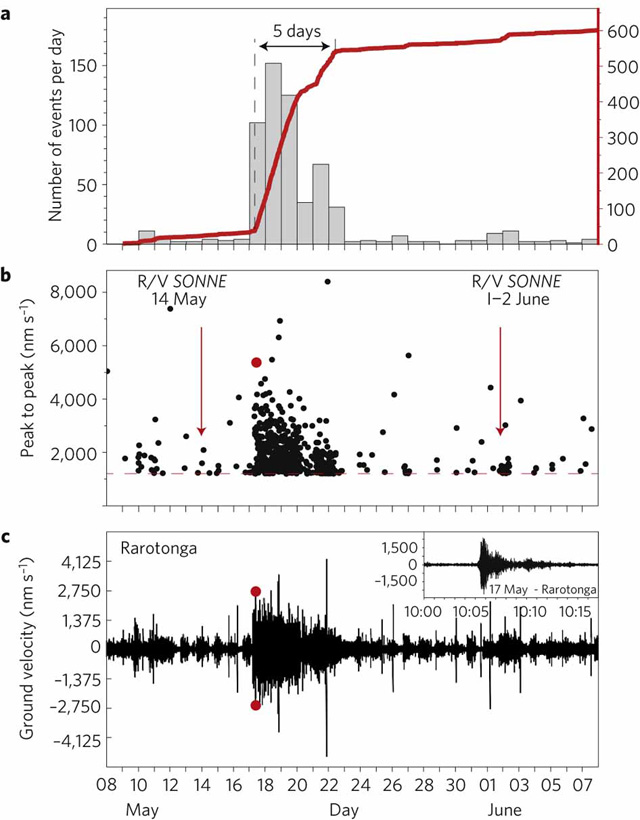 |
Figure 25. Time-series plots of hydro-acoustic T-wave data recorded at Rarotonga (IRIS station RAR, IU network) spanning the R/V Sonne repeat swath bathymetric surveys of 14 May and 1-2 June 2011. (a) Number of T-wave events per day (gray bars, left axis) and cumulative number of events (red line, right axis) versus time. An event is defined as one with a peak-to-peak amplitude in ground velocity >1,200 nm/s that is separated from another event by at least 1 min of quiescence. Note the abrupt increase in the number of events observed during the 5-day-long period between 17 to 22 May. (b) Peak-to-peak amplitude of individual events versus time. Red arrows mark the time of the 14 May and 1-2 June swath surveys. The full waveform of the event highlighted by the red circle is shown in the inset in (c). (c) Plot of ground velocity versus time. Courtesy of Watts and others (2012). |
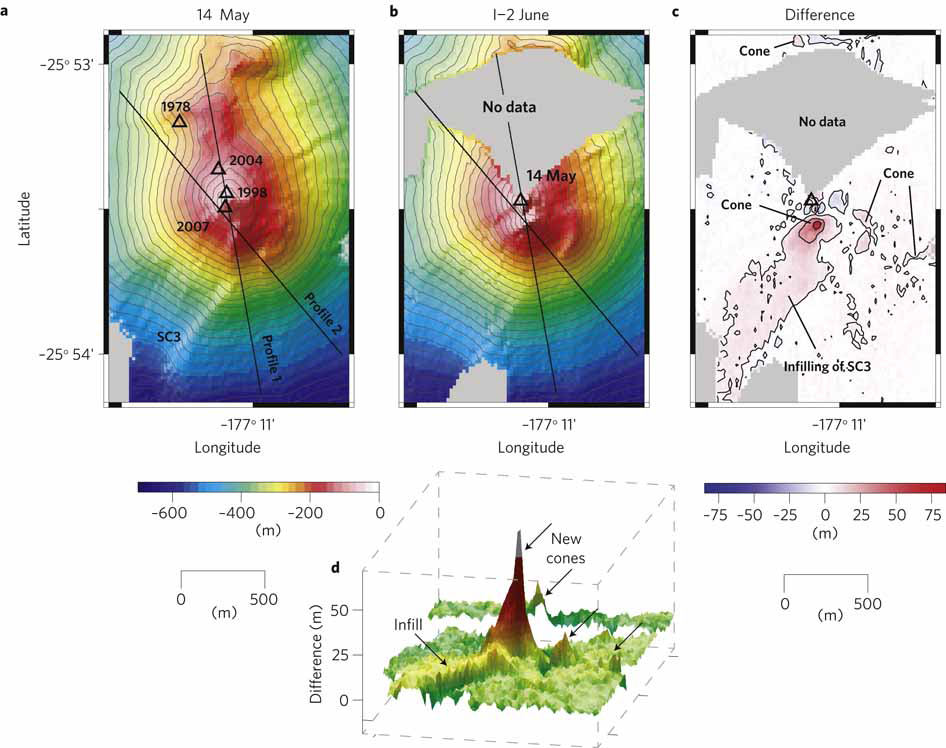 |
Figure 26. Swath bathymetry of the summit of Monowai cone as it appeared on 14 May and 1-2 June 2011. (a and b) Swath bathymetry acquired on R/V Sonne on 14 May (a) and 1-2 June (b) 2011. Open triangles with dates show the sequential position of the summit at selected times since 1978. 'SC3' indicates sector collapse 3 (see figures 23 and 24). Solid black lines show the profiles plotted in figure 27. The contour interval is 20 m. (c) Difference in the swath bathymetry between 14 May and 1-2 June colored to show depth decreases (blue) and increases (red). (d) Perspective view from the SSE (azimuth 168°, view angle 16° above horizontal) of the difference in swath bathymetry between 14 May and 1-2 June. Colored scales indicate depth (a, b, and d) and depth differences (c) in bathymetry between two dated surveys. Courtesy of Watts and others (2012). |
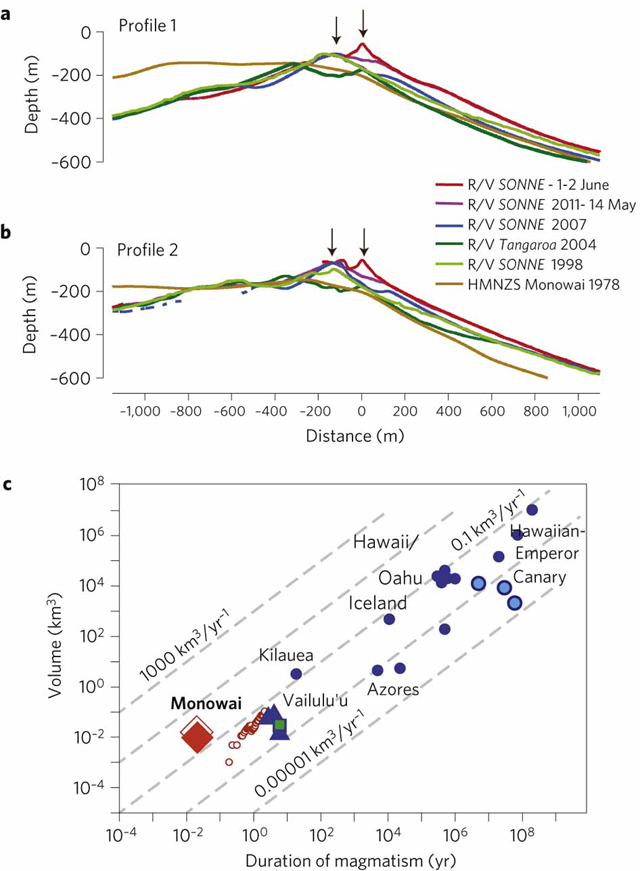 |
Figure 27. Progressive southward growth of the S flank of Monowai cone and the rate of volcanism. (a and b) Bathymetry profiles 1 (a) and 2 (b) from figure 26 of the summit of Monowai cone, shown with no vertical exaggeration. Black arrows highlight the 14 May and 1-2 June summits. The S flank shows progressive southward growth since 1977, contrasting with the more stable N flank. (c) Plot of eruptive volume versus duration of magmatism at Monowai, compared to other selected oceanic volcanoes. Symbols: red/orange diamond, 2011 survey (filled, cone only; unfilled, all data); blue triangles, previous repeat surveys in 1998, 2004 and 2007; small blue filled circles, selected seamounts and ocean islands from Chrisp (1984); green square, Vailulu'u (Staudigel and others, 2006); large light blue circles, data from >9,000 seamounts (Watts and others, 2006) that formed during 0-30 Myr, 95-125 Myr, and 105-110 Myr; small open brown circles, Montserrat (Sparks and others, 1998). Courtesy of Watts and others (2012). |
References. Brothers, R.N., Heming, R.F., Hawke, M.M., and Davey, F.J., 1980, Tholeiitic basalt from the Monowai seamount, Tonga-Kermadec ridge, New Zealand Journal of Geology and Geophysics, v. 23, no. 4, p. 537-539.
Chadwick, W.W., Jr., 2001, What is a T-phase?, URL: http://www.pmel.noaa.gov/vents/geology/tphase.html; posted 9 November 2001, accessed 14 August 2012.
Chadwick, W.W., Jr., Wright, I.C., Schwarz-Schampera, U., Hyvernaud O., Reymond, D., and de Ronde, C.E.J., 2008, Cyclic eruptions and sector collapses at Monowai submarine volcano, Kermadec arc: 1998-2007, GeochemistryGeophysicsGeosystemsG3, v. 9, p. 1-17 (DOI: 10.1029/2008GC002113).
Chrisp, J.A., 1984, Rates of magma emplacement and volcanic output, Journal of Volcanology and Geothermal Research, v. 20, pp. 177-211.
Davey, F.J., 1980, The Monowai seamount: An active submarine volcanic centre on the Tonga-Kermadec ridge (note), New Zealand Journal of Geology and Geophysics, v. 23, no. 4, p. 533-536.
Haase, K.M., Worthington, T.J., Stoffers, P., G-Schonberg, D., and Wright, I., 2002, Mantle dynamics, element recycling, and magma genesis beneath the Kermadec Arc-Havre Trough, GeochemistryGeophysicsGeosystemsG3, v. 3, no. 11. p. 1071 (DOI: 10.1029/2002GC000335).
Leybourne, M.I., de Ronde, C.E.J., Baker, E.T., Faure, K., Walker, S.L., Resing, J., and Massoth, G.J., 2010, Submarine magmatic-hydrothermal systems at the Monowai Volcanic Centre, Kermadec Arc, Goldschmidt Conference Abstracts 2010, Abstract A587.
Sparks, R.S.J., Young, S.R., Barclay, J., Calder, E.S., Cole, P., Darroux, B., Davies, M.A., Druitt, T.H., Harford, C., Herd, R., James, M., Lejeune, A.M., Loughlin, S., Norton, G., Skerrit, G., Stasiuk, M.V., Stevens, N.S., Toothill, J., Wadge, G., and Watts, R., 1998, Magma production and growth of the lava dome of the Soufriére Hills volcano, Montserrat, West Indies: November 1995 to December 1997, Geophysical Research Letters, v. 25, no. 18, pp. 3421-3424 (DOI: 10.1029/98GL00639).
Staudigel, H., Hart, S.R., Pile, A., Bailey, B.E., Baker, E.T., Brooke, S., Connelly, D.P., Haucke, L., German, C.R., Hudson, I., Jones, D., Koppers, A.A.P., Konter, J., Lee, R., Pietsch, T.W., Tebo, B.M., Templeton, A.S., Zierenberg, R., and Young, C.M., 2006, Vailulu'u Seamount, Samoa: Life and death of an active submarine volcano, Procedures of the National Academy of Science, USA, v. 103, pp. 6448-6453 (DOI: 10.1073/pnas.0600830103).
Watts, A.B., Sandwell, D.T., Smith, W.H.F., and Wessel, P., 2006, Global gravity, bathymetry, and the distribution of submarine volcanism through space and time, Journal of Geophysical Research, v. 111 (DOI: 10.1029/2005JB004083).
Watts, A.B., Peirce, C., Grevemeyer, I., Paulatto, M., Stratford, W., Bassett, D., Hunter, J.A., Kalnins, L.M., and de Ronde, C.E.J., 2012 (13 May), Rapid rates of growth and collapse of Monowai submarine volcano in the Kermadec Arc, Nature Geoscience, v. 5, p. 510-515 (DOI: 10.1038/ngeo1473).
Wright I.C., Chadwick, W.W., Jr, de Ronde, C.E.J., Reymond, D., Hyvernaud, O., Gennerich, H., Stoffers, P., Mackay, K., Dunkin, M.A., and Bannister, S.C., 2008, Collapse and reconstruction of Monowai submarine volcano, Kermadec arc, 1998-2004, Journal of Geophysical Research, v. 113, p. 1-13 (DOI: 10.1029/2007JB005138).
Information Contacts: Bradley J. Scott, GNS Science, Wainakel Research Centre, Taupo, New Zealand (URL: http://www.gns.cn.nz); GeoNet, New Zealand (URL: http://www.geonet.org.nz)
Frequent submarine eruptions through November 2016; discolored water observations
Evidence of submarine volcanism at Monowai has been frequently observed since October 1977, when the Royal New Zealand Air Force (RNZAF) noted a plume of discolored water above the seamount. Most subsequent eruptions have been determined based on additional observations of discolored water or the seismic detection of acoustic waves (T waves or T phases) caused by explosive activity. Monitoring reports are provided by New Zealand's GeoNet through their website and other publications. The hydro-acoustic signals are most frequently detected by seismometers in Rarotonga (Cook Islands) or by the Polynesian Seismic Network (Réseau Sismique Polynésien, or RSP) in Tahiti. Research visits over the past 20 years have resulted in many detailed analyses of morphological changes due to volcanism and subsequent collapses.
Some of those results have been reviewed in previous Bulletin reports. This issue will focus on reviewing eruptive episodes after a sector-collapse event on 24 May 2002, which caused anomalous seismic signals originally thought to be explosive in nature. Following the May 2002 event, no activity was detected until T phases were recorded during 1-24 November 2002 (figure 28 and see BGVN 28:02). The next eruptive period began on 10 April 2003 (figure 28 and see BGVN 28:05) and continued until a seismic swarm on 14 August 2004 (BGVN 28:11, 30:07), which included the building of a new cone and ended just prior to a bathymetric survey from the R/V Tangaroa in September 2004. Another sequence of swarms began on 2 March 2005 and continued until 27 June 2006. Although there appear to have been small signals in September 2006, scientists at the Laboratoire de Géophysique, Commissariat à l'Energie Atomique (CEA/DASE/LDG) reported that there were 6 months of quiet after the June 2006 swarms (BGVN 32:01).
|
Figure 28. Monitoring data from the Polynesian Seismic Network showing T wave swarms at Monowai throughout January 2002-December 2007. The times of the September 2004 and May 2007 bathymetric surveys (dashed vertical lines), and the time of the anomalous 24 May 2002 swarm (arrows) are shown. (top) Number of T wave events per day. (bottom) Amplitudes of T wave events, in nanometers as recorded at station TVO in Tahiti. Note unusually high amplitude of the 24 May 2002 event, interpreted as the sector collapse between the 1998 and 2004 surveys. Modified from Chadwick et al. (2008). |
While the R/V Sonne was on site conducting a bathymetric survey during 1-4 May 2007 (Chadwick et al, 2008), scientists heard booming sounds and saw slicks and bubbles on the surface (BGVN 33:03). That activity was part of an eruptive period that began on 12 December 2006 and continued into at least early November 2007 (figure 29 and see BGVN 32:01). A "big acoustic event" was detected by the Polynesian Seismic Network (Réseau Sismique Polynésien, or RSP) on 8 February 2008 (BGVN 33:03).
|
Figure 29. Monitoring data from the Polynesian Seismic Network showing the T wave swarms at Monowai in December 2006 and January 2007. (top) Number of events per day, (bottom) amplitude at station TVO in nanometers. Modified from Chadwick et al. (2008). |
A network of 23 ocean-bottom seismometers (OBS) and hydrophones was deployed in July 2007 over the fore-arc just to the E of Monowai at distances of 70-250 km to acquire data about local seismicity associated with subduction (Grevemeyer et al., 2016). The instruments also detected T waves and direct wave signals from the ongoing explosive activity. Analysis by Grevemeyer et al. (2016) showed that between deployment and recovery at the end of January 2008 there had been more than 2,000 events associated with Monowai, clustered into 13-15 major sequences that each lasted between several hours to about two days. Quiet periods between the event sequences varied between 1 and 70 days.
Intermittent activity during 2009 was described in a GeoNet posting from 6 January 2010. Activity was noted in early and mid-May, early July, mid-September (figure 30), late October (figure 31), mid-November, late November to early December, and mid-December 2009 based on seismic data recorded in Rarotonga, Cook Islands. On 27 October the RNZAF overflew the area and confirmed the activity, observing discolored sea water related to suspended sediment and precipitates. Another flight in May 2010 did not show similar activity. A summary of 2010 activity in New Zealand by GeoNet noted continued evidence of small-scale eruptive activity on the Rarotonga seismic record during the year (no dates given), but no activity was confirmed by surface observations.
|
Figure 30. Seismic data from Rarotonga showing an eruption at Monowai during 13-17 September 2009. Courtesy of GNS. |
|
Figure 31. Aerial photo of discolored water near Monowai on 27 October 2009. Photo taken by Royal New Zealand Air Force, courtesy of GeoNet. |
[Discolored water with gas bubbles and a sulfurous odor was observed during a planned swath mapping visit by the R/V Sonne on 14 May 2011 (Peirce and Watts, 2011).] According to Metz et al. (2016), explosive eruptions took place over [17-22 May] as detected by T phase waves recorded at broadband seismic stations on Rarotonga (Cook Islands), Papeete (Tahiti), and the Marquesas Islands. Signals were also received at an International Monitoring System hydrophone array (maintained by the Comprehensive Nuclear-Test-Ban Treaty Organization) near Ascension Island, ~15,800 km from the seamount in the equatorial South Atlantic Ocean. A second round of mapping by R/V Sonne on the return transit was accomplished on 1-2 June, [following the explosive activity]. Watts et al. (2012) showed that there had been a depth change to the summit of 18.8 m between two surveys (BGVN 37:06), which was attributed to the growth of a cone or lava spine during the intervening eruption. There was an additional visual confirmation of activity in August 2011, and GeoNet stated that activity was continuing in September. The 2011 volcanic summary by GeoNet again noted undated evidence of small-scale activity seen in the Rarotonga seismic data.
Seismicity during 1-4 June 2012 indicated another period of significant activity, which was confirmed by discolored seawater in the area observed from an RNZAF flight on 3 June. Seismographs in Rarotonga recorded eruptive activity during 3-19 August 2012 (figure 32). A posting from GeoNet on 2 October noted that Monowai had "not been active recently."
|
Figure 32. Seismic data from Rarotonga showing an eruption at Monowai during 3-19 August 2012. Courtesy of GNS. |
There were no GeoNet reports of activity during 2013. However, the R/V Sonne was planning to add to the time series of maps of Monowai while making a final transit to Auckland (Werner et al., 2013). While they were approaching the seamount on 1 January 2014, with a summit estimated to be ~60 m below the surface based on 2011 bathymetry data, scientists noticed a light yellowish water discoloration and a faint rumble. The cruise report further noted that during profiling close to the summit a "sudden and significant increase in volcanic activity with explosive hydroclastic eruptions was accompanied by thunder and shock waves rapidly spreading out on the water surface." Pumice was also collected in the vicinity, but the source volcano was not known.
In a GeoNet volcanic activity update on 10 November 2014, Brad Scott observed that there had been eruptions detected during approximately 16-22 and 23-27 October, and 1-5 November (figure 33) based on T phase waves measured at Rarotonga, but the activity appeared to be weaker than that seen in 2009 and 2012. Confirming these observations was material seen floating on the ocean surface over the seamount by a RNZAF airplane on 31 October 2014 (figure 34). GeoNet noted that volcanic activity regularly occurs about 3-10 days a month; the yearly summary said the seamount erupted often in 2014.
|
Figure 33. Eruptive activity at Monowai during October-November 2014 identified on a seismic amplitude plot recorded from the Rarotonga T phase seismic monitoring site. Courtesy of GeoNet. |
|
Figure 34. Aerial view from a RNZAF airplane of the ocean over Monowai showing floating debris (pumice) on 31 October 2014. Courtesy of GeoNet. |
There were no reports of activity during 2015, but a plume of discolored water was once again seen by the RNZAF on 19 May 2016. According to a 16 November 2016 GeoNet update by Brad Scott, activity was recorded for about 24 hours over 11-12 November. The report noted that this type of activity is seen a few days every month.
References: Chadwick, W.W., Jr., Wright, I.C., Schwarz-Schampera, U., Hyvernaud O., Reymond, D., and de Ronde, C.E.J., 2008, Cyclic eruptions and sector collapses at Monowai submarine volcano, Kermadec arc: 1998-2007, GeochemistryGeophysicsGeosystemsG3, v. 9, p. 1-17 (DOI: 10.1029/2008GC002113).
Grevemeyer, I., Metz, D., and Watts, A., 2016, Submarine explosive activity and ocean noise generation at Monowai Volcano, Kermadec Arc: constraints from hydroacoustic T-waves: EGU General Assembly 2016.
Peirce C, Watts A, 2011, R/V Sonne SO 215 - Cruise Report, The Louisville Ridge - Tonga Trench collision: Implications for subduction zone dynamics: Durham, Department of Earth Sciences, Durham University.
Metz, D., Watts, A.B., Grevemeyer, I., Rodgers, M., and Paulatto, M., 2016 (22 February), Ultra-long-range hydroacoustic observations of submarine volcanic activity at Monowai, Kermadec Arc, Geophysical Research Letters, v. 43, no. 4, p. 1529-1536.
Watts, A.B., Peirce, C., Grevemeyer, I., Paulatto, M., Stratford, W., Bassett, D., Hunter, J.A., Kalnins, L.M., and de Ronde, C.E.J., 2012 (13 May), Rapid rates of growth and collapse of Monowai submarine volcano in the Kermadec Arc, Nature Geoscience, v. 5, p. 510-515 (DOI: 10.1038/ngeo1473).
Werner, R., D. Nürnberg, and F. Hauff, 2013, RV SONNE — Cruise report SO 225, Helmholtz-Zentrum fur Ozeanforschung Kiel (GEOMAR) (DOI: 10.3289/GEOMAR_REP_NS_5_2012).
Information Contacts: New Zealand GeoNet Project, a collaboration between the Earthquake Commission and GNS Science, Wairakei Research Centre, Private Bag 2000, Taupo 3352, New Zealand (URL: http://www.geonet.org.nz/).
|
|
||||||||||||||||||||||||||
There is data available for 25 confirmed eruptive periods.
[ 2016 Nov 11 - 2016 Nov 12 ] Uncertain Eruption
| Episode 1 | Uncertain | |||||||||||||||||||
|---|---|---|---|---|---|---|---|---|---|---|---|---|---|---|---|---|---|---|---|
| 2016 Nov 11 - 2016 Nov 12 | Evidence from Unknown | ||||||||||||||||||
|
List of 2 Events for Episode 1
|
|||||||||||||||||||
2014 Oct 16 - 2014 Nov 5 Confirmed Eruption (Explosive / Effusive) VEI: 0
| Episode 1 | Eruption (Explosive / Effusive) | Submarine | |||||||||||||||||||||||
|---|---|---|---|---|---|---|---|---|---|---|---|---|---|---|---|---|---|---|---|---|---|---|---|---|
| 2014 Oct 16 - 2014 Nov 5 | Evidence from Observations: Hydrophonic | |||||||||||||||||||||||
|
List of 3 Events for Episode 1 at Submarine
|
||||||||||||||||||||||||
2014 Jan 1 - 2014 Jan 1 Confirmed Eruption (Explosive / Effusive) VEI: 1
| Episode 1 | Eruption (Explosive / Effusive) | Summit | ||||||||||||||||||||||||||||
|---|---|---|---|---|---|---|---|---|---|---|---|---|---|---|---|---|---|---|---|---|---|---|---|---|---|---|---|---|---|
| 2014 Jan 1 - 2014 Jan 1 | Evidence from Observations: Hydrophonic | ||||||||||||||||||||||||||||
|
List of 4 Events for Episode 1 at Summit
|
|||||||||||||||||||||||||||||
2012 Aug 3 - 2012 Aug 19 Confirmed Eruption (Explosive / Effusive) VEI: 0
| Episode 1 | Eruption (Explosive / Effusive) | Submarine | |||||||||||||||||||||||
|---|---|---|---|---|---|---|---|---|---|---|---|---|---|---|---|---|---|---|---|---|---|---|---|---|
| 2012 Aug 3 - 2012 Aug 19 | Evidence from Observations: Hydrophonic | |||||||||||||||||||||||
|
List of 3 Events for Episode 1 at Submarine
|
||||||||||||||||||||||||
2011 May 17 - 2011 May 22 Confirmed Eruption (Explosive / Effusive) VEI: 0
| Episode 1 | Eruption (Explosive / Effusive) | Summit Crater | ||||||||||||||||||||||||||||||||||||||
|---|---|---|---|---|---|---|---|---|---|---|---|---|---|---|---|---|---|---|---|---|---|---|---|---|---|---|---|---|---|---|---|---|---|---|---|---|---|---|---|
| 2011 May 17 - 2011 May 22 | Evidence from Observations: Hydrophonic | ||||||||||||||||||||||||||||||||||||||
|
List of 6 Events for Episode 1 at Summit Crater
|
|||||||||||||||||||||||||||||||||||||||
2009 May 4 ± 3 days - 2009 Dec 16 ± 4 days Confirmed Eruption (Explosive / Effusive) VEI: 0
| Episode 1 | Eruption (Explosive / Effusive) | |||||||||||||||||||
|---|---|---|---|---|---|---|---|---|---|---|---|---|---|---|---|---|---|---|---|
| 2009 May 4 ± 3 days - 2009 Dec 16 ± 4 days | Evidence from Observations: Hydrophonic | ||||||||||||||||||
|
List of 2 Events for Episode 1
|
|||||||||||||||||||
2008 Feb 8 (?) - 2008 Feb 8 (?) Confirmed Eruption (Explosive / Effusive) VEI: 0
| Episode 1 | Eruption (Explosive / Effusive) | ||||||||||||||
|---|---|---|---|---|---|---|---|---|---|---|---|---|---|---|
| 2008 Feb 8 (?) - 2008 Feb 8 (?) | Evidence from Observations: Hydrophonic | |||||||||||||
|
List of 1 Events for Episode 1
|
||||||||||||||
2006 Dec 12 - 2007 Nov 4 ± 3 days Confirmed Eruption (Explosive / Effusive) VEI: 0
| Episode 1 | Eruption (Explosive / Effusive) | ||||||||||||||||||||||||
|---|---|---|---|---|---|---|---|---|---|---|---|---|---|---|---|---|---|---|---|---|---|---|---|---|
| 2006 Dec 12 - 2007 Nov 4 ± 3 days | Evidence from Observations: Hydrophonic | |||||||||||||||||||||||
|
List of 3 Events for Episode 1
|
||||||||||||||||||||||||
2005 Mar 2 - 2006 Jun 27 Confirmed Eruption (Explosive / Effusive) VEI: 0
| Episode 1 | Eruption (Explosive / Effusive) | ||||||||||||||||||||||||
|---|---|---|---|---|---|---|---|---|---|---|---|---|---|---|---|---|---|---|---|---|---|---|---|---|
| 2005 Mar 2 - 2006 Jun 27 | Evidence from Observations: Hydrophonic | |||||||||||||||||||||||
|
List of 3 Events for Episode 1
|
||||||||||||||||||||||||
2003 Apr 10 - 2004 Sep 16 ± 15 days Confirmed Eruption (Explosive / Effusive) VEI: 0
| Episode 1 | Eruption (Explosive / Effusive) | |||||||||||||||||||||||||||||
|---|---|---|---|---|---|---|---|---|---|---|---|---|---|---|---|---|---|---|---|---|---|---|---|---|---|---|---|---|---|
| 2003 Apr 10 - 2004 Sep 16 ± 15 days | Evidence from Observations: Hydrophonic | ||||||||||||||||||||||||||||
|
List of 4 Events for Episode 1
|
|||||||||||||||||||||||||||||
2002 Nov 1 - 2002 Nov 24 Confirmed Eruption (Explosive / Effusive) VEI: 0
| Episode 1 | Eruption (Explosive / Effusive) | ||||||||||||||||||||||||
|---|---|---|---|---|---|---|---|---|---|---|---|---|---|---|---|---|---|---|---|---|---|---|---|---|
| 2002 Nov 1 - 2002 Nov 24 | Evidence from Observations: Hydrophonic | |||||||||||||||||||||||
|
List of 3 Events for Episode 1
|
||||||||||||||||||||||||
2002 May 24 - 2002 May 24 Confirmed Eruption (Explosive / Effusive) VEI: 0
| Episode 1 | Eruption (Explosive / Effusive) | |||||||||||||||||||||||||||||
|---|---|---|---|---|---|---|---|---|---|---|---|---|---|---|---|---|---|---|---|---|---|---|---|---|---|---|---|---|---|
| 2002 May 24 - 2002 May 24 | Evidence from Observations: Hydrophonic | ||||||||||||||||||||||||||||
|
List of 4 Events for Episode 1
|
|||||||||||||||||||||||||||||
1999 Jun 6 - 1999 Jun 11 Confirmed Eruption (Explosive / Effusive) VEI: 0
| Episode 1 | Eruption (Explosive / Effusive) | ||||||||||||||||||||||||
|---|---|---|---|---|---|---|---|---|---|---|---|---|---|---|---|---|---|---|---|---|---|---|---|---|
| 1999 Jun 6 - 1999 Jun 11 | Evidence from Observations: Hydrophonic | |||||||||||||||||||||||
|
List of 3 Events for Episode 1
|
||||||||||||||||||||||||
1997 Dec 15 - 1998 Feb 4 (?) Confirmed Eruption (Explosive / Effusive) VEI: 0
| Episode 1 | Eruption (Explosive / Effusive) | ||||||||||||||||||||||||
|---|---|---|---|---|---|---|---|---|---|---|---|---|---|---|---|---|---|---|---|---|---|---|---|---|
| 1997 Dec 15 - 1998 Feb 4 (?) | Evidence from Observations: Hydrophonic | |||||||||||||||||||||||
|
List of 3 Events for Episode 1
|
||||||||||||||||||||||||
1997 Apr 18 - 1997 Apr 21 Confirmed Eruption (Explosive / Effusive) VEI: 0
| Episode 1 | Eruption (Explosive / Effusive) | ||||||||||||||||||||||||
|---|---|---|---|---|---|---|---|---|---|---|---|---|---|---|---|---|---|---|---|---|---|---|---|---|
| 1997 Apr 18 - 1997 Apr 21 | Evidence from Observations: Hydrophonic | |||||||||||||||||||||||
|
List of 3 Events for Episode 1
|
||||||||||||||||||||||||
1996 Sep 20 - 1996 Sep 22 Confirmed Eruption (Explosive / Effusive) VEI: 0
| Episode 1 | Eruption (Explosive / Effusive) | ||||||||||||||||||||||||
|---|---|---|---|---|---|---|---|---|---|---|---|---|---|---|---|---|---|---|---|---|---|---|---|---|
| 1996 Sep 20 - 1996 Sep 22 | Evidence from Observations: Hydrophonic | |||||||||||||||||||||||
|
List of 3 Events for Episode 1
|
||||||||||||||||||||||||
1995 Nov 27 - 1995 Nov 30 Confirmed Eruption (Explosive / Effusive) VEI: 0
| Episode 1 | Eruption (Explosive / Effusive) | ||||||||||||||||||||||||
|---|---|---|---|---|---|---|---|---|---|---|---|---|---|---|---|---|---|---|---|---|---|---|---|---|
| 1995 Nov 27 - 1995 Nov 30 | Evidence from Observations: Hydrophonic | |||||||||||||||||||||||
|
List of 3 Events for Episode 1
|
||||||||||||||||||||||||
1990 May 30 - 1991 Mar 25 Confirmed Eruption (Explosive / Effusive) VEI: 0
| Episode 1 | Eruption (Explosive / Effusive) | ||||||||||||||||||||||||
|---|---|---|---|---|---|---|---|---|---|---|---|---|---|---|---|---|---|---|---|---|---|---|---|---|
| 1990 May 30 - 1991 Mar 25 | Evidence from Observations: Hydrophonic | |||||||||||||||||||||||
|
List of 3 Events for Episode 1
|
||||||||||||||||||||||||
1988 Sep 8 - 1988 Sep 8 Confirmed Eruption (Explosive / Effusive) VEI: 0
| Episode 1 | Eruption (Explosive / Effusive) | |||||||||||||||||||
|---|---|---|---|---|---|---|---|---|---|---|---|---|---|---|---|---|---|---|---|
| 1988 Sep 8 - 1988 Sep 8 | Evidence from Observations: Hydrophonic | ||||||||||||||||||
|
List of 2 Events for Episode 1
|
|||||||||||||||||||
1986 Jun 16 ± 15 days - 1986 Jun 16 ± 15 days Confirmed Eruption (Explosive / Effusive) VEI: 0
| Episode 1 | Eruption (Explosive / Effusive) | ||||||||||||||
|---|---|---|---|---|---|---|---|---|---|---|---|---|---|---|
| 1986 Jun 16 ± 15 days - 1986 Jun 16 ± 15 days | Evidence from Observations: Hydrophonic | |||||||||||||
|
List of 1 Events for Episode 1
|
||||||||||||||
1982 May 16 ± 15 days - 1982 May 16 ± 15 days Confirmed Eruption (Explosive / Effusive) VEI: 0
| Episode 1 | Eruption (Explosive / Effusive) | ||||||||||||||
|---|---|---|---|---|---|---|---|---|---|---|---|---|---|---|
| 1982 May 16 ± 15 days - 1982 May 16 ± 15 days | Evidence from Observations: Hydrophonic | |||||||||||||
|
List of 1 Events for Episode 1
|
||||||||||||||
1980 Jan 16 ± 15 days - 1980 Jan 16 ± 15 days Confirmed Eruption (Explosive / Effusive) VEI: 0
| Episode 1 | Eruption (Explosive / Effusive) | ||||||||||||||
|---|---|---|---|---|---|---|---|---|---|---|---|---|---|---|
| 1980 Jan 16 ± 15 days - 1980 Jan 16 ± 15 days | Evidence from Observations: Hydrophonic | |||||||||||||
|
List of 1 Events for Episode 1
|
||||||||||||||
1979 Feb 16 (?) ± 15 days - 1979 Apr 19 (?) Confirmed Eruption (Explosive / Effusive) VEI: 1
| Episode 1 | Eruption (Explosive / Effusive) | |||||||||||||||||||
|---|---|---|---|---|---|---|---|---|---|---|---|---|---|---|---|---|---|---|---|
| 1979 Feb 16 (?) ± 15 days - 1979 Apr 19 (?) | Evidence from Observations: Hydrophonic | ||||||||||||||||||
|
List of 2 Events for Episode 1
|
|||||||||||||||||||
1978 Feb 16 ± 15 days - 1978 Jul 16 ± 15 days Confirmed Eruption (Explosive / Effusive) VEI: 0
| Episode 1 | Eruption (Explosive / Effusive) | |||||||||||||||||||
|---|---|---|---|---|---|---|---|---|---|---|---|---|---|---|---|---|---|---|---|
| 1978 Feb 16 ± 15 days - 1978 Jul 16 ± 15 days | Evidence from Observations: Hydrophonic | ||||||||||||||||||
|
List of 2 Events for Episode 1
|
|||||||||||||||||||
1977 Oct 17 - 1977 Oct 27 (?) Confirmed Eruption (Explosive / Effusive) VEI: 0
| Episode 1 | Eruption (Explosive / Effusive) | ||||||||||||||||||||||||
|---|---|---|---|---|---|---|---|---|---|---|---|---|---|---|---|---|---|---|---|---|---|---|---|---|
| 1977 Oct 17 - 1977 Oct 27 (?) | Evidence from Observations: Reported | |||||||||||||||||||||||
|
List of 3 Events for Episode 1
|
||||||||||||||||||||||||
1977 Apr 16 ± 15 days - 1977 Apr 16 ± 15 days Confirmed Eruption (Explosive / Effusive) VEI: 0
| Episode 1 | Eruption (Explosive / Effusive) | ||||||||||||||
|---|---|---|---|---|---|---|---|---|---|---|---|---|---|---|
| 1977 Apr 16 ± 15 days - 1977 Apr 16 ± 15 days | Evidence from Observations: Hydrophonic | |||||||||||||
|
List of 1 Events for Episode 1
|
||||||||||||||
[ 1944 ] Uncertain Eruption
| Episode 1 | Eruption (Explosive / Effusive) | ||||||||||||||
|---|---|---|---|---|---|---|---|---|---|---|---|---|---|---|
| 1944 - Unknown | Evidence from Unknown | |||||||||||||
|
List of 1 Events for Episode 1
|
||||||||||||||
This compilation of synonyms and subsidiary features may not be comprehensive. Features are organized into four major categories: Cones, Craters, Domes, and Thermal Features. Synonyms of features appear indented below the primary name. In some cases additional feature type, elevation, or location details are provided.
Synonyms |
| Orion Seamount |
There are no samples for Monowai in the Smithsonian's NMNH Department of Mineral Sciences Rock and Ore collection.
| Copernicus Browser | The Copernicus Browser replaced the Sentinel Hub Playground browser in 2023, to provide access to Earth observation archives from the Copernicus Data Space Ecosystem, the main distribution platform for data from the EU Copernicus missions. |
| MIROVA | Middle InfraRed Observation of Volcanic Activity (MIROVA) is a near real time volcanic hot-spot detection system based on the analysis of MODIS (Moderate Resolution Imaging Spectroradiometer) data. In particular, MIROVA uses the Middle InfraRed Radiation (MIR), measured over target volcanoes, in order to detect, locate and measure the heat radiation sourced from volcanic activity. |
| MODVOLC Thermal Alerts | Using infrared satellite Moderate Resolution Imaging Spectroradiometer (MODIS) data, scientists at the Hawai'i Institute of Geophysics and Planetology, University of Hawai'i, developed an automated system called MODVOLC to map thermal hot-spots in near real time. For each MODIS image, the algorithm automatically scans each 1 km pixel within it to check for high-temperature hot-spots. When one is found the date, time, location, and intensity are recorded. MODIS looks at every square km of the Earth every 48 hours, once during the day and once during the night, and the presence of two MODIS sensors in space allows at least four hot-spot observations every two days. Each day updated global maps are compiled to display the locations of all hot spots detected in the previous 24 hours. There is a drop-down list with volcano names which allow users to 'zoom-in' and examine the distribution of hot-spots at a variety of spatial scales. |
|
WOVOdat
Single Volcano View Temporal Evolution of Unrest Side by Side Volcanoes |
WOVOdat is a database of volcanic unrest; instrumentally and visually recorded changes in seismicity, ground deformation, gas emission, and other parameters from their normal baselines. It is sponsored by the World Organization of Volcano Observatories (WOVO) and presently hosted at the Earth Observatory of Singapore.
GVMID Data on Volcano Monitoring Infrastructure The Global Volcano Monitoring Infrastructure Database GVMID, is aimed at documenting and improving capabilities of volcano monitoring from the ground and space. GVMID should provide a snapshot and baseline view of the techniques and instrumentation that are in place at various volcanoes, which can be use by volcano observatories as reference to setup new monitoring system or improving networks at a specific volcano. These data will allow identification of what monitoring gaps exist, which can be then targeted by remote sensing infrastructure and future instrument deployments. |
| Volcanic Hazard Maps | The IAVCEI Commission on Volcanic Hazards and Risk has a Volcanic Hazard Maps database designed to serve as a resource for hazard mappers (or other interested parties) to explore how common issues in hazard map development have been addressed at different volcanoes, in different countries, for different hazards, and for different intended audiences. In addition to the comprehensive, searchable Volcanic Hazard Maps Database, this website contains information about diversity of volcanic hazard maps, illustrated using examples from the database. This site is for educational purposes related to volcanic hazard maps. Hazard maps found on this website should not be used for emergency purposes. For the most recent, official hazard map for a particular volcano, please seek out the proper institutional authorities on the matter. |
| IRIS seismic stations/networks | Incorporated Research Institutions for Seismology (IRIS) Data Services map showing the location of seismic stations from all available networks (permanent or temporary) within a radius of 0.18° (about 20 km at mid-latitudes) from the given location of Monowai. Users can customize a variety of filters and options in the left panel. Note that if there are no stations are known the map will default to show the entire world with a "No data matched request" error notice. |
| UNAVCO GPS/GNSS stations | Geodetic Data Services map from UNAVCO showing the location of GPS/GNSS stations from all available networks (permanent or temporary) within a radius of 20 km from the given location of Monowai. Users can customize the data search based on station or network names, location, and time window. Requires Adobe Flash Player. |
| DECADE Data | The DECADE portal, still in the developmental stage, serves as an example of the proposed interoperability between The Smithsonian Institution's Global Volcanism Program, the Mapping Gas Emissions (MaGa) Database, and the EarthChem Geochemical Portal. The Deep Earth Carbon Degassing (DECADE) initiative seeks to use new and established technologies to determine accurate global fluxes of volcanic CO2 to the atmosphere, but installing CO2 monitoring networks on 20 of the world's 150 most actively degassing volcanoes. The group uses related laboratory-based studies (direct gas sampling and analysis, melt inclusions) to provide new data for direct degassing of deep earth carbon to the atmosphere. |
| Large Eruptions of Monowai | Information about large Quaternary eruptions (VEI >= 4) is cataloged in the Large Magnitude Explosive Volcanic Eruptions (LaMEVE) database of the Volcano Global Risk Identification and Analysis Project (VOGRIPA). |
| EarthChem | EarthChem develops and maintains databases, software, and services that support the preservation, discovery, access and analysis of geochemical data, and facilitate their integration with the broad array of other available earth science parameters. EarthChem is operated by a joint team of disciplinary scientists, data scientists, data managers and information technology developers who are part of the NSF-funded data facility Integrated Earth Data Applications (IEDA). IEDA is a collaborative effort of EarthChem and the Marine Geoscience Data System (MGDS). |


 Map view shows Monowai submarine volcano at the lower left, with subsidiary cones on its N flank. A large submarine caldera lies to the NE at the top-right. The contour interval is 100 m and the resolution of the bathymetry data is 25 m. The proprietary bathymetry data were obtained by scientists of the New Zealand National Institute of Water and Atmospheric Research (NIWA) during a 2005 New Zealand-American NOAA Ocean Explorer research expedition to the Kermadec-Tonga Arc.