
The Balai Penyelidikan dan Pengembangan Teknologi Kebencanaan Geologi (BPPTKG) reported that the eruption at Merapi (on Java) continued during 29 August-4 September. Earthquakes were less intense compared to the previous week. The SW lava dome produced nine lava avalanches that traveled as far as 1.9 km SW down the Bebeng drainage, 19 that traveled as far as 1.8 km SW down the Krasak drainage, and 39 that traveled as far as 2 km W down the Sat/Putih drainage. Small morphological changes to the SW lava dome resulted from lava effusion and minor collapses. The Alert Level remained at 3 (on a scale of 1-4), and the public was warned to stay 3-7 km away from the summit, based on location.
Source: Balai Penyelidikan dan Pengembangan Teknologi Kebencanaan Geologi (BPPTKG)
Frequent incandescent avalanches during April-September 2023
Merapi, located just north of the major city of Yogyakarta in central Java, Indonesia, has had activity within the last 20 years characterized by pyroclastic flows and lahars accompanying growth and collapse of the steep-sided active summit lava dome. The current eruption period began in late December 2020 and has more recently consisted of ash plumes, intermittent incandescent avalanches of material, and pyroclastic flows (BGVN 48:04). This report covers activity during April through September 2023, based on information from Balai Penyelidikan dan Pengembangan Teknologi Kebencanaan Geologi (BPPTKG), the Center for Research and Development of Geological Disaster Technology, a branch of PVMBG which specifically monitors Merapi. Additional information comes from the Pusat Vulkanologi dan Mitigasi Bencana Geologi (PVMBG, also known as Indonesian Center for Volcanology and Geological Hazard Mitigation, CVGHM), MAGMA Indonesia, the Darwin Volcanic Ash Advisory Centre (VAAC), and various satellite data.
Activity during April through September 2023 primarily consisted of incandescent avalanches of material that mainly affected the SW and W flanks and traveled as far as 2.3 km from the summit (table 25) and white gas-and-steam emissions that rose 10-1,000 m above the crater.
Table 25. Monthly summary of avalanches and avalanche distances recorded at Merapi during April through September 2023. The number of reported avalanches does not include instances where possible avalanches were heard but could not be visually confirmed as a result of inclement weather. Data courtesy of BPPTKG (April-September 2023 daily reports).
| Month | Average number of avalanches per day | Distance avalanches traveled (m) |
| Apr 2023 | 19 | 1,200-2,000 |
| May 2023 | 22 | 500-2,000 |
| Jun 2023 | 18 | 1,200-2,000 |
| Jul 2023 | 30 | 300-2,000 |
| Aug 2023 | 25 | 400-2,300 |
| Sep 2023 | 23 | 600-2,000 |
BPPTKG reported that during April and May white gas-and-steam emissions rose 10-750 m above the crater, incandescent avalanches descended 500-2,000 m on the SW and W flanks (figure 135). Cloudy weather often prevented clear views of the summit, and sometimes avalanches could not be confirmed. According to a webcam image, a pyroclastic flow was visible on 17 April at 0531. During the week of 28 April and 4 May a pyroclastic flow was reported on the SW flank, traveling up to 2.5 km. According to a drone overflight taken on 17 May the SW lava dome volume was an estimated 2,372,800 cubic meters and the dome in the main crater was an estimated 2,337,300 cubic meters.
 |
Figure 135. Photo showing an incandescent avalanche affecting the flank of Merapi on 8 April 2023. Courtesy of Øystein Lund Andersen. |
During June and July similar activity persisted with white gas-and-steam emissions rising 10-350 m above the crater and frequent incandescent avalanches that traveled 300-2,000 m down the SW, W, and S flanks (figure 136). Based on an analysis of aerial photos taken on 24 June the volume of the SW lava dome was approximately 2.5 million cubic meters. A pyroclastic flow was observed on 5 July that traveled 2.7 km on the SW flank. According to the Darwin VAAC multiple minor ash plumes were identified in satellite images on 19 July that rose to 3.7 km altitude and drifted S and SW. During 22, 25, and 26 July a total of 17 avalanches descended as far as 1.8 km on the S flank.
 |
Figure 136. Photo showing an incandescent avalanche descending the flank of Merapi on 23 July 2023. Courtesy of Øystein Lund Andersen. |
Frequent white gas-and-steam emissions continued during August and September, rising 10-450 m above the crater. Incandescent avalanches mainly affected the SW and W flanks and traveled 400-2,300 m from the vent (figure 137). An aerial survey conducted on 10 August was analyzed and reported that estimates of the SW dome volume was 2,764,300 cubic meters and the dome in the main crater was 2,369,800 cubic meters.
 |
Figure 137. Photo showing a strong incandescent avalanche descending the flank of Merapi on 23 September 2023. Courtesy of Øystein Lund Andersen. |
Frequent and moderate-power thermal activity continued throughout the reporting period, according to a MIROVA (Middle InfraRed Observation of Volcanic Activity) analysis of MODIS satellite data (figure 138). There was an increase in the number of detected anomalies during mid-May. The MODVOLC thermal algorithm recorded a total of 47 thermal hotspots: six during April, nine during May, eight during June, 15 during July, four during August, and five during September. Some of this activity was captured in infrared satellite imagery on clear weather days, sometimes accompanied by incandescent material on the SW flank (figure 139).
 |
Figure 138. Frequent and moderate-power thermal anomalies were detected at Merapi during April through September 2023, as shown on this MIROVA plot (Log Radiative Power). There was an increase in the number of anomalies recorded during mid-May. Courtesy of MIROVA. |
 |
Figure 139. Infrared (bands B12, B11, B4) satellite images showed a consistent thermal anomaly (bright yellow-orange) at the summit crater of Merapi on 8 April 2023 (top left), 18 May 2023 (top right), 17 June 2023 (middle left), 17 July 2023 (middle right), 11 August 2023 (bottom left), and 20 September 2023 (bottom right). Incandescent material was occasionally visible descending the SW flank, as shown in each of these images. Courtesy of Copernicus Browser. |
Information Contacts: Balai Penyelidikan dan Pengembangan Teknologi Kebencanaan Geologi (BPPTKG), Center for Research and Development of Geological Disaster Technology (URL: http://merapi.bgl.esdm.go.id/, Twitter: @BPPTKG); MAGMA Indonesia, Kementerian Energi dan Sumber Daya Mineral (URL: https://magma.esdm.go.id/v1); Pusat Vulkanologi dan Mitigasi Bencana Geologi (PVMBG, also known as Indonesian Center for Volcanology and Geological Hazard Mitigation, CVGHM), Jalan Diponegoro 57, Bandung 40122, Indonesia (URL: http://www.vsi.esdm.go.id/); Darwin Volcanic Ash Advisory Centre (VAAC), Bureau of Meteorology, Northern Territory Regional Office, PO Box 40050, Casuarina, NT 0811, Australia (URL: http://www.bom.gov.au/info/vaac/); MIROVA (Middle InfraRed Observation of Volcanic Activity), a collaborative project between the Universities of Turin and Florence (Italy) supported by the Centre for Volcanic Risk of the Italian Civil Protection Department (URL: http://www.mirovaweb.it/); Hawai'i Institute of Geophysics and Planetology (HIGP) - MODVOLC Thermal Alerts System, School of Ocean and Earth Science and Technology (SOEST), Univ. of Hawai'i, 2525 Correa Road, Honolulu, HI 96822, USA (URL: http://modis.higp.hawaii.edu/); Copernicus Browser, Copernicus Data Space Ecosystem, European Space Agency (URL: https://dataspace.copernicus.eu/browser/); Øystein Lund Andersen (URL: https://www.oysteinlundandersen.com/, https://twitter.com/oysteinvolcano).
2025: January
| February
| March
| April
| May
| June
| July
| August
| September
2024: January
| February
| March
| April
| May
| June
| July
| August
| September
| October
| November
| December
2023: January
| February
| March
| April
| May
| June
| July
| August
| September
| October
| November
| December
2022: January
| February
| March
| April
| May
| June
| July
| August
| September
| October
| November
| December
2021: January
| February
| March
| April
| May
| June
| July
| August
| September
| October
| November
| December
2020: January
| February
| March
| April
| June
| November
| December
2019: January
| February
| March
| April
| May
| June
| July
| August
| September
| October
| November
2018: May
| August
| September
| October
| November
| December
2016: October
2014: March
| April
| May
| June
| July
2013: July
| November
2011: January
| March
| September
2010: September
| October
| November
| December
2008: May
2007: March
| May
| August
2006: March
| April
| May
| June
| July
| August
2005: July
2002: January
| February
| March
| April
| May
| June
| July
| August
| September
2001: January
| February
| March
| April
| May
| July
| August
| September
| October
| November
| December
2000: November
The Balai Penyelidikan dan Pengembangan Teknologi Kebencanaan Geologi (BPPTKG) reported that the eruption at Merapi (on Java) continued during 29 August-4 September. Earthquakes were less intense compared to the previous week. The SW lava dome produced nine lava avalanches that traveled as far as 1.9 km SW down the Bebeng drainage, 19 that traveled as far as 1.8 km SW down the Krasak drainage, and 39 that traveled as far as 2 km W down the Sat/Putih drainage. Small morphological changes to the SW lava dome resulted from lava effusion and minor collapses. The Alert Level remained at 3 (on a scale of 1-4), and the public was warned to stay 3-7 km away from the summit, based on location.
Source: Balai Penyelidikan dan Pengembangan Teknologi Kebencanaan Geologi (BPPTKG)
The Balai Penyelidikan dan Pengembangan Teknologi Kebencanaan Geologi (BPPTKG) reported that the eruption at Merapi (on Java) continued during 8-14 August. Earthquakes were about the same intensity compared to the previous week. The SW lava dome produced 15 lava avalanches that traveled as far as 2 km SW down the Bebeng drainage, 13 that traveled as far as 2 km SW down the Krasak drainage, and 58 that traveled as far as 2 km W down the Sat/Putih drainage. Small morphological changes to the SW lava dome resulted from lava effusion and minor collapses. The Alert Level remained at 3 (on a scale of 1-4), and the public was warned to stay 3-7 km away from the summit, based on location.
Source: Balai Penyelidikan dan Pengembangan Teknologi Kebencanaan Geologi (BPPTKG)
The Balai Penyelidikan dan Pengembangan Teknologi Kebencanaan Geologi (BPPTKG) reported that the eruption at Merapi (on Java) continued during 1-7 August. Earthquakes were about the same intensity compared to the previous week. The SW lava dome produced 14 lava avalanches that traveled as far as 1.8 km SW down the Bebeng drainage, 31 that traveled as far as 1.8 km SW down the Krasak drainage, 64 that traveled as far as 2 km W down the Sat/Putih drainage, and one that descended the Boyong drainage on the S flank as far as 1.8 km. One pyroclastic flow traveled 800 m down the Krasak drainage. Small morphological changes to the SW lava dome resulted from lava effusion and minor collapses. The volume of the SW dome increased by 90,500 cubic meters to an estimated 4,101,500 cubic meters, based on webcam images and a 7 August drone survey. The temperature of the dome had increased by 2.5 degrees Celsius (degrees C) to 247.4 degrees C. The volume and temperature of the central dome were unchanged. The Alert Level remained at 3 (on a scale of 1-4), and the public was warned to stay 3-7 km away from the summit, based on location.
Source: Balai Penyelidikan dan Pengembangan Teknologi Kebencanaan Geologi (BPPTKG)
The Balai Penyelidikan dan Pengembangan Teknologi Kebencanaan Geologi (BPPTKG) reported that the eruption at Merapi (on Java) continued during 25-31 July. During that 19 avalanches were observed descending into the upper reaches of the Krasak River and reaching as far as 2 km from the summit. There were six avalanches in the upper reaches of the Bebeng River that traveled as far as 1.9 km. Fifty avalanches descended into the upper Sat/Putih River, extending a maximum of 2 km. Based on analysis of aerial photos from 17 July, the volume of the SW lava dome and the central dome were 4,011,000 cubic meters and 2,368,900 cubic meters, respectively. Small morphological changes to the SW lava dome resulted from continuing effusion and minor collapses. The Alert Level remained at 3 (on a scale of 1-4), and the public was warned to stay 3-7 km away from the summit, based on location.
Source: Balai Penyelidikan dan Pengembangan Teknologi Kebencanaan Geologi (BPPTKG)
The Balai Penyelidikan dan Pengembangan Teknologi Kebencanaan Geologi (BPPTKG) reported that the eruption at Merapi (on Java) continued during 18-24 July. Earthquakes were more intense compared to the previous week. The SW lava dome produced 15 lava avalanches that traveled as far as 1.8 km SW down the Bebeng drainage, 24 that traveled as far as 2 km SW down the Krasak drainage, 70 that traveled as far as 2 km W down the Sat/Putih drainage, and one that descended the Boyong drainage on the S flank as far as 1.5 km. Small morphological changes to the SW lava dome resulted from minor collapses. The volume of the SW dome decreased by 66,700 cubic meters to an estimated 4,011,000 cubic meters, based on webcam images and a 17 July drone survey and webcam images. The temperature of the dome had increased by 2.8 degrees Celsius (degrees C) to 244.9 degrees C. The volume of the central dome increased by about 1,600 cubic meters to an estimated 2,368,900 cubic meters, though no morphological changes were observed. The temperature increased by 3.5 degrees C to 218.6 degrees C. The Alert Level remained at 3 (on a scale of 1-4), and the public was warned to stay 3-7 km away from the summit, based on location.
Source: Balai Penyelidikan dan Pengembangan Teknologi Kebencanaan Geologi (BPPTKG)
The Balai Penyelidikan dan Pengembangan Teknologi Kebencanaan Geologi (BPPTKG) reported that the eruption at Merapi (on Java) continued during 11-17 July. Earthquakes were around the same intensity compared to the previous week. The SW lava dome produced seven lava avalanches that traveled as far as 1.5 km SW down the Bebeng drainage, 18 that traveled as far as 1.8 km SW down the Krasak drainage, 44 that traveled as far as 2 km W down the Sat/Putih drainage, and one traveled 1.8 km W down the Batang drainage. Small morphological changes to the SW lava dome resulted from continuing effusion and minor collapses. The Alert Level remained at 3 (on a scale of 1-4), and the public was warned to stay 3-7 km away from the summit, based on location.
Source: Balai Penyelidikan dan Pengembangan Teknologi Kebencanaan Geologi (BPPTKG)
The Balai Penyelidikan dan Pengembangan Teknologi Kebencanaan Geologi (BPPTKG) reported that the eruption at Merapi (on Java) continued during 4-10 July. Earthquake activity was more intense than the previous week. The SW lava dome produced 19 lava avalanches that traveled as far as 2 km SW down the Bebeng drainage, 22 that traveled as far as 1.8 km SW down the Krasak drainage, and 76 that traveled as far as 2 km W down the Sat/Putih drainage. One pyroclastic flow descended the Krasak drainage as far as 2.5 km and afterward minor ashfall was reported in Tunggularum (8 km SW) of Sleman Regency and Ngori (11 kmSW) of Magelang Regency. Small morphological changes to the SW lava dome resulted from continuing effusion and minor collapses. The Alert Level remained at 3 (on a scale of 1-4), and the public was warned to stay 3-7 km away from the summit, based on location.
Source: Balai Penyelidikan dan Pengembangan Teknologi Kebencanaan Geologi (BPPTKG)
The Balai Penyelidikan dan Pengembangan Teknologi Kebencanaan Geologi (BPPTKG) reported that the eruption at Merapi (on Java) continued during 27 June-3 July. Seismic levels were similar to the previous week. The SW lava dome produced eight lava avalanches that traveled as far as 2 km SW down the Bebeng drainage, five that traveled as far as 1.5 km SW down the Krasak drainage, and 56 that traveled as far as 2 km W down the Sat/Putih drainage. Small morphological changes to the SW lava dome resulted from continuing effusion and minor collapses. The Alert Level remained at 3 (on a scale of 1-4), and the public was warned to stay 3-7 km away from the summit, based on location.
Source: Balai Penyelidikan dan Pengembangan Teknologi Kebencanaan Geologi (BPPTKG)
The Balai Penyelidikan dan Pengembangan Teknologi Kebencanaan Geologi (BPPTKG) reported that the eruption at Merapi (on Java) continued during 13-19 June. Seismicity was less intense than the previous week. The SW lava dome produced 26 lava avalanches that traveled as far as 1.9 km SW down the Bebeng drainage, 20 that traveled as far as 2 km SW down the Krasak drainage, and 56 that traveled as far as 1.9 km W down the Sat/Putih drainage. Small morphological changes to the SW lava dome resulted from continuing effusion and minor collapses. The volume of the SW dome increased by 84,500 cubic meters to an estimated 4,133,800 cubic meters, based on webcam images and a 13 June drone survey. The size of the central dome had not changed. The Alert Level remained at 3 (on a scale of 1-4), and the public was warned to stay 3-7 km away from the summit, based on location.
Source: Balai Penyelidikan dan Pengembangan Teknologi Kebencanaan Geologi (BPPTKG)
The Balai Penyelidikan dan Pengembangan Teknologi Kebencanaan Geologi (BPPTKG) reported that the eruption at Merapi (on Java) continued during 11-17 June. The SW lava dome produced 27 lava avalanches that traveled as far as 2.km SW down the Bebeng drainage, 19 that traveled as far as 1.8 km SW down the Krasak drainage, and 18 that traveled as far as 2 km W down the Sat/Putih drainage. Seismicity increased relative to last week. The Alert Level remained at 3 (on a scale of 1-4), and the public was warned to stay 3-7 km away from the summit, based on location.
Source: Balai Penyelidikan dan Pengembangan Teknologi Kebencanaan Geologi (BPPTKG)
The Balai Penyelidikan dan Pengembangan Teknologi Kebencanaan Geologi (BPPTKG) reported that the eruption at Merapi (on Java) continued during 30 May-5 June. Seismicity remained at high levels, similar to the previous week. The SW lava dome produced 20 lava avalanches that traveled as far as 1.9 km SW down the Bebeng drainage, 14 that traveled as far as 2 km SW down the Krasak drainage, and 39 that traveled as far as 2 km W down the Sat/Putih drainage. Small morphological changes to the SW lava dome resulted from continuing effusion and minor collapses. The hottest temperature at the SW dome was 247.4 degrees Celsius, the same as the previous measurement, and the volume of the dome increased by 52,500 cubic meters to an estimated 4,049,300 cubic meters, based on webcam images and a 30 May drone survey. The size of the central dome had not changed, and the highest temperature remained relatively stable at 217.9 degrees Celsius. The Alert Level remained at 3 (on a scale of 1-4), and the public was warned to stay 3-7 km away from the summit, based on location.
Source: Balai Penyelidikan dan Pengembangan Teknologi Kebencanaan Geologi (BPPTKG)
The Balai Penyelidikan dan Pengembangan Teknologi Kebencanaan Geologi (BPPTKG) reported that the eruption at Merapi (on Java) continued during 23-29 May. Seismicity remained at high levels. The SW lava dome produced 30 lava avalanches that traveled as far as 1.8 km SW down the Bebeng drainage, 12 that traveled as far as 1.8 km SW down the Krasak drainage, and 33 that traveled as far as 2 km W down the Sat/Putih drainage. Small morphological changes to the SW lava dome resulted from continuing effusion and minor collapses. The Alert Level remained at 3 (on a scale of 1-4), and the public was warned to stay 3-7 km away from the summit, based on location.
Source: Balai Penyelidikan dan Pengembangan Teknologi Kebencanaan Geologi (BPPTKG)
The Balai Penyelidikan dan Pengembangan Teknologi Kebencanaan Geologi (BPPTKG) reported that the eruption at Merapi (on Java) continued during 16-22 May. Seismicity remained at high levels. The SW lava dome produced 41 lava avalanches that traveled as far as 2 km SW down the Bebeng drainage, 10 that traveled as far as 1.8 km SW down the Krasak drainage, and 73 that traveled as far as 2 km W down the Sat/Putih drainage. Small morphological changes to the SW lava dome resulted from continuing effusion and minor collapses. The Alert Level remained at 3 (on a scale of 1-4), and the public was warned to stay 3-7 km away from the summit, based on location.
Source: Balai Penyelidikan dan Pengembangan Teknologi Kebencanaan Geologi (BPPTKG)
The Balai Penyelidikan dan Pengembangan Teknologi Kebencanaan Geologi (BPPTKG) reported that the eruption at Merapi (on Java) continued during 9-15 May. Seismicity remained at high levels. The SW lava dome produced 43 lava avalanches that traveled as far as 2 km SW down the Bebeng drainage, 18 that traveled as far as 2 km SW down the Krasak drainage, and 32 that traveled as far as 2 km W down the Sat/Putih drainage. Small morphological changes to the SW lava dome resulted from continuing effusion and minor collapses of material. The hottest temperature was 247.4 degrees Celsius, and the volume of the dome increased by 71,200 cubic meters to an estimated 3,996,800 cubic meters, based on webcam images and a 12 May drone survey. The size of the central dome had not changed; the highest temperature decreased three degrees to 218 degrees Celsius. The Alert Level remained at 3 (on a scale of 1-4), and the public was warned to stay 3-7 km away from the summit, based on location.
Source: Balai Penyelidikan dan Pengembangan Teknologi Kebencanaan Geologi (BPPTKG)
The Balai Penyelidikan dan Pengembangan Teknologi Kebencanaan Geologi (BPPTKG) reported that the eruption at Merapi (on Java) continued during 2-8 May. Seismicity remained at high levels. The SW lava dome produced 41 lava avalanches that traveled as far as 2 km SW down the Bebeng drainage, 10 that traveled as far as 1.8 km SW down the Krasak drainage, and 73 that traveled as far as 2 km W down the Sat/Putih drainage. Small morphological changes to the SW lava dome resulted from continuing effusion and minor collapses of material. The Alert Level remained at 3 (on a scale of 1-4), and the public was warned to stay 3-7 km away from the summit, based on location.
Source: Balai Penyelidikan dan Pengembangan Teknologi Kebencanaan Geologi (BPPTKG)
The Balai Penyelidikan dan Pengembangan Teknologi Kebencanaan Geologi (BPPTKG) reported that the eruption at Merapi (on Java) continued during 25 April-1 May. Seismicity remained at high levels. The SW lava dome produced 62 lava avalanches that traveled as far as 2 km SW down the Bebeng drainage, 47 that traveled as far as 2 km SW down the Krasak drainage, and 148 that traveled as far as 2 km W down the Sat/Putih drainage. Small morphological changes to the SW lava dome resulted from continuing effusion and minor collapses of material. The hottest temperature was 249.3 degrees Celsius, and the volume of the dome had grown to an estimated 3,925,200 cubic meters, based on webcam images and a 26 April drone survey. The Alert Level remained at 3 (on a scale of 1-4), and the public was warned to stay 3-7 km away from the summit, based on location.
Source: Balai Penyelidikan dan Pengembangan Teknologi Kebencanaan Geologi (BPPTKG)
The Balai Penyelidikan dan Pengembangan Teknologi Kebencanaan Geologi (BPPTKG) reported that the eruption at Merapi (on Java) continued during 11-17 April. Seismicity remained at high levels. The SW lava dome produced 46 lava avalanches that traveled as far as 2 km SW down the Bebeng drainage, 30 that traveled as far as 2 km SW down the Krasak drainage, and 46 that traveled as far as 2 km W down the Sat/Putih drainage. Small morphological changes to the SW lava dome resulted from continuing effusion and minor collapses of material. The Alert Level remained at 3 (on a scale of 1-4), and the public was warned to stay 3-7 km away from the summit, based on location.
Source: Balai Penyelidikan dan Pengembangan Teknologi Kebencanaan Geologi (BPPTKG)
The Balai Penyelidikan dan Pengembangan Teknologi Kebencanaan Geologi (BPPTKG) reported that the eruption at Merapi (on Java) continued during 4-10 April. Seismicity remained at high levels. The SW lava dome produced 31 lava avalanches that traveled as far as 2 km SW down the Bebeng drainage, 18 that traveled as far as 1.8 km SW down the Krasak drainage, 37 that traveled as far as 1.9 km W down the Sat/Putih drainage, and one that descended the Boyong drainage on the S flank as far as 1.5 km. Small morphological changes to the SW lava dome resulted from minor collapses of material. The Alert Level remained at 3 (on a scale of 1-4), and the public was warned to stay 3-7 km away from the summit, based on location.
Source: Balai Penyelidikan dan Pengembangan Teknologi Kebencanaan Geologi (BPPTKG)
The Balai Penyelidikan dan Pengembangan Teknologi Kebencanaan Geologi (BPPTKG) reported that the eruption at Merapi (on Java) continued during 28 March-4 April. Seismicity was at higher levels than the previous week. The SW lava dome produced 28 lava avalanches that traveled as far as 1.8 km SW down the Bebeng drainage, 50 that traveled as far as 1.8 km SW down the Krasak drainage, and 37 that traveled as far as 1.8 km W down the Sat/Putih drainage. Slight morphological changes to the SW lava dome resulted from minor collapses of material. The Alert Level remained at 3 (on a scale of 1-4), and the public was warned to stay 3-7 km away from the summit, based on location.
Source: Balai Penyelidikan dan Pengembangan Teknologi Kebencanaan Geologi (BPPTKG)
The Balai Penyelidikan dan Pengembangan Teknologi Kebencanaan Geologi (BPPTKG) reported that the eruption at Merapi (on Java) continued during 21-27 March. Seismicity was at higher levels than the previous week. The SW lava dome produced 23 lava avalanches that traveled as far as 1.9 km SW down the Bebeng drainage, 20 that traveled as far as 2 km SW down the Krasak drainage, and 26 that traveled as far as 2 km W down the Sat/Putih drainage. Slight morphological changes to the SW lava dome resulted from minor collapses of material. The Alert Level remained at 3 (on a scale of 1-4), and the public was warned to stay 3-7 km away from the summit, based on location.
Source: Balai Penyelidikan dan Pengembangan Teknologi Kebencanaan Geologi (BPPTKG)
The Balai Penyelidikan dan Pengembangan Teknologi Kebencanaan Geologi (BPPTKG) reported that the eruption at Merapi (on Java) continued during 14-20 March. Seismicity remained at high levels. The SW lava dome produced 31 lava avalanches that traveled as far as 1.8 km SW down the Bebeng drainage, 29 that traveled as far as 1.8 km SW down the Krasak drainage, 29 that traveled as far as 1.9 km W down the Sat/Putih drainage, and one that descended the Boyong drainage on the S flank as far as 1.2 km. Two pyroclastic flows descended the Krasak drainage as far as 1.8 km. Slight morphological changes to the SW lava dome resulted from continuing effusion and collapses of material. The Alert Level remained at 3 (on a scale of 1-4), and the public was warned to stay 3-7 km away from the summit, based on location.
Source: Balai Penyelidikan dan Pengembangan Teknologi Kebencanaan Geologi (BPPTKG)
The Balai Penyelidikan dan Pengembangan Teknologi Kebencanaan Geologi (BPPTKG) reported that the eruption at Merapi (on Java) continued during 7-13 March. Seismicity remained at high levels. The SW lava dome produced 54 lava avalanches that traveled as far as 2 km SW down the Bebeng drainage, 33 that traveled as far as 2 km SW down the Krasak drainage, and 31 that traveled as far as 2 km W down the Sat/Putih drainage. Slight morphological changes to the SW lava dome resulted from minor collapses of material. The hottest temperature was 248.5 degrees Celsius, and the volume was an estimated 3,626,200 cubic meters, based on webcam images and an 11 March drone survey. The Alert Level remained at 3 (on a scale of 1-4), and the public was warned to stay 3-7 km away from the summit, based on location.
Source: Balai Penyelidikan dan Pengembangan Teknologi Kebencanaan Geologi (BPPTKG)
The Balai Penyelidikan dan Pengembangan Teknologi Kebencanaan Geologi (BPPTKG) reported that the eruption at Merapi (on Java) continued during 28 February-6 March. Seismicity was at higher levels that the previous week. The SW lava dome produced 57 lava avalanches that traveled as far as 2 km SW down the Bebeng drainage, 43 that traveled as far as 2 km SW down the Krasak drainage, and 34 that traveled as far as 2 km SW down the Sat/Putih drainage. Slight morphological changes to the SW lava dome resulting from continuing effusion and collapses of material. The Alert Level remained at 3 (on a scale of 1-4), and the public was warned to stay 3-7 km away from the summit, based on location.
Source: Balai Penyelidikan dan Pengembangan Teknologi Kebencanaan Geologi (BPPTKG)
The Balai Penyelidikan dan Pengembangan Teknologi Kebencanaan Geologi (BPPTKG) reported that the eruption at Merapi (on Java) continued during 21-27 February. Seismicity was at higher levels that the previous week. The SW lava dome produced 53 lava avalanches that traveled as far as 2 km SW down the Bebeng drainage, 48 that traveled as far as 2 km SW down the Krasak drainage, 82 that traveled as far as 1.6 km SW down the Sat/Putih drainage, and one that descended the Boyong drainage on the S flank as far as 1.6 km. Morphological changes to the SW lava dome resulting from continuing effusion and collapses of material. The Alert Level remained at 3 (on a scale of 1-4), and the public was warned to stay 3-7 km away from the summit, based on location.
Source: Balai Penyelidikan dan Pengembangan Teknologi Kebencanaan Geologi (BPPTKG)
The Balai Penyelidikan dan Pengembangan Teknologi Kebencanaan Geologi (BPPTKG) reported that the eruption at Merapi (on Java) continued during 14-20 February. Seismicity remained at high levels. The SW lava dome produced 64 lava avalanches that traveled as far as 1.9 km SW down the Bebeng drainage, 17 that traveled as far as 1.7 km SW down the Krasak drainage, and 57 that traveled as far as 1.9 km SW down the Sat/Putih drainage. Morphological changes to the SW lava dome resulting from continuing effusion and collapses of material. The volume of the SW dome had increased in size to an estimated 3,546,200 cubic meters based a 20 February drone survey. The hottest temperature was around 247.4 degrees Celsius, higher than the previous measurement. No significant morphological changes at the summit dome were visible and the highest temperature was around 228 degrees Celsius, similar to the previous measurement. The Alert Level remained at 3 (on a scale of 1-4), and the public was warned to stay 3-7 km away from the summit, based on location.
Source: Balai Penyelidikan dan Pengembangan Teknologi Kebencanaan Geologi (BPPTKG)
The Balai Penyelidikan dan Pengembangan Teknologi Kebencanaan Geologi (BPPTKG) reported that the eruption at Merapi (on Java) continued during 7-13 February. Seismicity remained at high levels. The SW lava dome produced 59 lava avalanches that traveled as far as 2 km SW down the Bebeng drainage, 12 that traveled as far as 1.8 km SW down the Krasak drainage, and 24 that traveled as far as 1.8 km SW down the Sat/Putih drainage. Morphological changes at the SW dome were caused by continuing effusion and collapses of material. No significant morphological changes at the summit dome were visible. The Alert Level remained at 3 (on a scale of 1-4), and the public was warned to stay 3-7 km away from the summit, based on location.
Source: Balai Penyelidikan dan Pengembangan Teknologi Kebencanaan Geologi (BPPTKG)
The Balai Penyelidikan dan Pengembangan Teknologi Kebencanaan Geologi (BPPTKG) reported that the eruption at Merapi (on Java) continued during 31 January-6 February. Seismicity remained at high levels. The SW lava dome produced 88 lava avalanches that traveled as far as 2 km SW down the Bebeng drainage, 31 that traveled as far as 2 km SW down the Krasak drainage, and 13 that traveled as far as 1.8 km SW down the Sat/Putih drainage. Morphological changes at the SW dome were caused by continuing effusion and collapses of material; the dome had an estimated volume of 3,315,900 cubic meters based on an analysis of 4 February aerial photos. No significant morphological changes at the summit dome were visible. The Alert Level remained at 3 (on a scale of 1-4), and the public was warned to stay 3-7 km away from the summit, based on location.
Source: Balai Penyelidikan dan Pengembangan Teknologi Kebencanaan Geologi (BPPTKG)
The Balai Penyelidikan dan Pengembangan Teknologi Kebencanaan Geologi (BPPTKG) reported that the eruption at Merapi (on Java) continued during 24-30 January. Seismicity was less intense than the previous week. The SW lava dome produced 57 lava avalanches that traveled as far as 1.8 km SW down the Bebeng drainage, 18 that traveled as far as 1.8 km SW down the Krasak drainage, and 31 that traveled as far as 2 km SW down the Sat/Putih drainage. Morphological changes at the SW dome were caused by continuing effusion and collapses of material. No significant morphological changes at the summit dome were visible. The Alert Level remained at 3 (on a scale of 1-4), and the public was warned to stay 3-7 km away from the summit, based on location.
Source: Balai Penyelidikan dan Pengembangan Teknologi Kebencanaan Geologi (BPPTKG)
The Balai Penyelidikan dan Pengembangan Teknologi Kebencanaan Geologi (BPPTKG) reported that the eruption at Merapi (on Java) continued during 17-23 January. Seismicity was less intense than the previous week. The SW lava dome produced 28 lava avalanches that traveled as far as 2 km SW down the Bebeng drainage, 19 that traveled as far as 1.7 km SW down the Krasak drainage, and 19 that traveled as far as 1.6 km SW down the Sat/Putih drainage. Morphological changes at the SW dome were caused by continuing effusion and collapses of material. No significant morphological changes at the summit dome were visible. The Alert Level remained at 3 (on a scale of 1-4), and the public was warned to stay 3-7 km away from the summit, based on location.
Source: Balai Penyelidikan dan Pengembangan Teknologi Kebencanaan Geologi (BPPTKG)
The Balai Penyelidikan dan Pengembangan Teknologi Kebencanaan Geologi (BPPTKG) reported that the eruption at Merapi (on Java) continued during 10-16 January. Seismicity was less intense than the previous week. The SW lava dome produced 29 lava avalanches that traveled as far as 1.9 km SW down the Bebeng drainage, 12 that traveled as far as 1.9 km SW down the Krasak drainage, and 13 that traveled as far as 1.7 km SW down the Sat/Putih drainage. Morphological changes at the SW dome were caused by continuing effusion and collapses of material. No significant morphological changes at the summit dome were visible. The Alert Level remained at 3 (on a scale of 1-4), and the public was warned to stay 3-7 km away from the summit, based on location.
Source: Balai Penyelidikan dan Pengembangan Teknologi Kebencanaan Geologi (BPPTKG)
The Balai Penyelidikan dan Pengembangan Teknologi Kebencanaan Geologi (BPPTKG) reported that the eruption at Merapi (on Java) continued during 3-9 January. Seismicity remained at high levels. The SW lava dome produced 84 lava avalanches that traveled as far as 2 km SW down the Bebeng drainage, 29 that traveled as far as 2 km SW down the Krasak drainage, and nine that traveled as far as 1.5 km SW down the Sat/Putih drainage. Morphological changes at the SW dome were caused by continuing effusion and collapses of material. No significant morphological changes at the summit dome were visible. The Alert Level remained at 3 (on a scale of 1-4), and the public was warned to stay 3-7 km away from the summit, based on location.
Source: Balai Penyelidikan dan Pengembangan Teknologi Kebencanaan Geologi (BPPTKG)
The Balai Penyelidikan dan Pengembangan Teknologi Kebencanaan Geologi (BPPTKG) reported that the eruption at Merapi (on Java) continued during 27 December 2024-2 January 2025. Seismicity remained at high levels. The SW lava dome produced 62 lava avalanches that traveled as far as 1.9 km SW down the Bebeng drainage, 10 that traveled as far as 1.8 km SW down the Krasak drainage, and six that traveled as far as 1.5 km SW down the Sat/Putih drainage. The SW dome had an estimated volume of 3,315,900 cubic meters based on an analysis of webcam images, with morphological changes caused by continuing effusion and collapses of material. No significant morphological changes at the summit dome were visible. The Alert Level remained at 3 (on a scale of 1-4), and the public was warned to stay 3-7 km away from the summit, based on location.
Source: Balai Penyelidikan dan Pengembangan Teknologi Kebencanaan Geologi (BPPTKG)
The Balai Penyelidikan dan Pengembangan Teknologi Kebencanaan Geologi (BPPTKG) reported that the eruption at Merapi (on Java) continued during 20-26 December. Seismicity remained at high levels. The SW lava dome produced 99 lava avalanches that traveled as far as 1.8 km SW down the Bebeng drainage, 24 that traveled as far as 1.8 km SW down the Krasak drainage, and six that traveled as far as 1.5 km SW down the Sat/Putih drainage. No significant morphological changes to either the SW lava dome or the summit dome were visible. The SW dome was an estimated 3,342,300 cubic meters based on an analysis of webcam images. The Alert Level remained at 3 (on a scale of 1-4), and the public was warned to stay 3-7 km away from the summit, based on location.
Source: Balai Penyelidikan dan Pengembangan Teknologi Kebencanaan Geologi (BPPTKG)
The Pusat Vulkanologi dan Mitigasi Bencana Geologi (PVMBG, also known as CVGHM) reported the eruption at Merapi (on Java) continued during 18-24 December. Seismicity remained high. Lava avalanches from the SW dome were observed 50 times and traveled as far as 1.7 km SW down the Bebeng and Krasak drainages. White emissions rose 25-150 m above the summit and drifted E and W, but weather often prevented observation. The Alert Level remained at 3 (on a scale of 1-4), and the public was warned to stay 3-7 km away from the summit, based on location.
Source: Pusat Vulkanologi dan Mitigasi Bencana Geologi (PVMBG, also known as CVGHM)
The Balai Penyelidikan dan Pengembangan Teknologi Kebencanaan Geologi (BPPTKG) reported that the eruption at Merapi (on Java) continued during 6-12 December. Seismicity remained at high levels. The SW lava dome produced 113 lava avalanches that traveled as far as 1.8 km SW down the Bebeng drainage and 43 that traveled SW down the Krasak drainage. Morphological changes to the SW lava dome resulted from continuing effusion and collapses of material. The SW dome grew larger and was an estimated 3,315,200 cubic meters based on an analysis of webcam images. The volume of the main crater was stable at an estimated 2,361,800 cubic meters. The Alert Level remained at 3 (on a scale of 1-4), and the public was warned to stay 3-7 km away from the summit, based on location.
Source: Balai Penyelidikan dan Pengembangan Teknologi Kebencanaan Geologi (BPPTKG)
The Balai Penyelidikan dan Pengembangan Teknologi Kebencanaan Geologi (BPPTKG) reported that the eruption at Merapi (on Java) continued during 29 November-5 December. Seismicity remained at high levels. The SW lava dome produced 84 lava avalanches that traveled as far as 1.8 km SW down the Bebeng drainage, eight that traveled SW down the Krasak drainage, and one that traveled 500 m W down the Senowo drainage. At 1642 on 5 December a pyroclastic flow descended 1.4 km along the Krasak drainage for nearly two minutes. Morphological changes to the SW lava dome resulted from continuing effusion and collapses of material. The SW dome grew larger and was an estimated 3,272,300 cubic meters based on an analysis of webcam images. The volume of the main crater was stable at an estimated 2,361,800 cubic meters. The Alert Level remained at 3 (on a scale of 1-4), and the public was warned to stay 3-7 km away from the summit, based on location.
Source: Balai Penyelidikan dan Pengembangan Teknologi Kebencanaan Geologi (BPPTKG)
The Balai Penyelidikan dan Pengembangan Teknologi Kebencanaan Geologi (BPPTKG) reported that the eruption at Merapi (on Java) continued during 22-28 November. Seismicity was higher compared to the previous week. The SW lava dome produced 105 lava avalanches that traveled as far as 1.7 km down the Bebeng drainage on the SW flank. Morphological changes to the SW lava dome resulted from continuing effusion and collapses of material. The volume of the SW dome was an estimated 3,177,100 cubic meters based a 21 November analysis of webcam images. The volume of the main crater was stable at an estimated 2,361,800 cubic meters. The Alert Level remained at 3 (on a scale of 1-4), and the public was warned to stay 3-7 km away from the summit, based on location.
Source: Balai Penyelidikan dan Pengembangan Teknologi Kebencanaan Geologi (BPPTKG)
The Balai Penyelidikan dan Pengembangan Teknologi Kebencanaan Geologi (BPPTKG) reported that the eruption at Merapi (on Java) continued during 15-21 November. Seismicity was higher compared to the previous week. The SW lava dome produced 196 lava avalanches that traveled as far as 2 km down the Bebeng drainage on the SW flank. Morphological changes to the SW lava dome resulted from continuing effusion and collapses of material. The Alert Level remained at 3 (on a scale of 1-4), and the public was warned to stay 3-7 km away from the summit, based on location.
Source: Balai Penyelidikan dan Pengembangan Teknologi Kebencanaan Geologi (BPPTKG)
The Balai Penyelidikan dan Pengembangan Teknologi Kebencanaan Geologi (BPPTKG) reported that the eruption at Merapi (on Java) continued during 1-7 November. Seismicity was higher compared to the previous week. The SW lava dome produced 271 lava avalanches that traveled as far as 2 km down the Bebeng drainage on the SW flank. On 3 November one pyroclastic flow descended the Bebeng as far as 1 km. Morphological changes to the SW lava dome resulted from continuing effusion and collapses of material. The Alert Level remained at 3 (on a scale of 1-4), and the public was warned to stay 3-7 km away from the summit, based on location.
Source: Balai Penyelidikan dan Pengembangan Teknologi Kebencanaan Geologi (BPPTKG)
The Pusat Vulkanologi dan Mitigasi Bencana Geologi (PVMBG) reported that the eruption at Merapi (on Java) continued during 30 October-5 November. The SW lava dome produced 99 lava avalanches that traveled as far as 2.0 km down the Bebeng drainage on the SW flank. On 3 November one pyroclastic flow was recorded by the seismic network. The Alert Level remained at 3 (on a scale of 1-4), and the public was warned to stay 3-7 km away from the summit, based on location.
Source: Pusat Vulkanologi dan Mitigasi Bencana Geologi (PVMBG, also known as CVGHM)
The Balai Penyelidikan dan Pengembangan Teknologi Kebencanaan Geologi (BPPTKG) reported that the eruption at Merapi (on Java) continued during 18-24 October. Seismicity was more intense compared to the previous week. The SW lava dome produced 206 lava avalanches that traveled as far as 1.8 km down the Bebeng drainage on the SW flank. Two pyroclastic flows descended the Bebeng as far as 1.5 km. Morphological changes to the SW lava dome resulting from continuing effusion and collapses of material. The volume of the SW dome was an estimated 3,077,000 cubic meters based a 24 October drone survey. The hottest temperature was around 243 degrees Celsius, similar to the previous measurement. The Alert Level remained at 3 (on a scale of 1-4), and the public was warned to stay 3-7 km away from the summit, based on location.
Source: Balai Penyelidikan dan Pengembangan Teknologi Kebencanaan Geologi (BPPTKG)
The Balai Penyelidikan dan Pengembangan Teknologi Kegunungapian (BPPTK) reported that the eruption at Merapi (on Java) continued during 11-17 October. The number of multiple-phase and low-frequency earthquakes increased while the number of avalanche earthquakes decreased. The SW lava dome produced 302 lava avalanches that traveled as far as 1.9 km down the Bebeng drainage on the SW flank. There were morphological changes to the SW lava dome resulting from continuing effusion and collapses of material. The Alert Level remained at 3 (on a scale of 1-4), and the public was warned to stay 3-7 km away from the summit, based on location.
Source: Balai Penyelidikan dan Pengembangan Teknologi Kegunungapian (BPPTK)
The Balai Penyelidikan dan Pengembangan Teknologi Kebencanaan Geologi (BPPTKG) reported that the eruption at Merapi (on Java) continued during 4-10 October. Seismicity was less intense compared to the previous week. The SW lava dome produced 200 lava avalanches that traveled as far as 1.7 km down the Bebeng drainage on the SW flank. Morphological changes to the SW lava dome resulting from continuing effusion and collapses of material. The Alert Level remained at 3 (on a scale of 1-4), and the public was warned to stay 3-7 km away from the summit, based on location.
Source: Balai Penyelidikan dan Pengembangan Teknologi Kebencanaan Geologi (BPPTKG)
Balai Penyelidikan dan Pengembangan Teknologi Kebencanaan Geologi (BPPTKG) reported that the eruption at Merapi (on Java) continued during 27 September-3 October. Seismicity was more intense compared to the previous week. The SW lava dome produced 256 lava avalanches that traveled as far as 1.8 km down the Bebeng drainage on the SW flank. Morphological changes to the SW lava dome resulting from continuing effusion and collapses of material. The Alert Level remained at 3 (on a scale of 1-4), and the public was warned to stay 3-7 km away from the summit, based on location.
Source: Balai Penyelidikan dan Pengembangan Teknologi Kegunungapian (BPPTK)
Balai Penyelidikan dan Pengembangan Teknologi Kebencanaan Geologi (BPPTKG) reported that the eruption at Merapi (on Java) continued during 20-26 September. Seismicity was less intense compared to the previous week. The SW lava dome produced 204 lava avalanches that traveled as far as 1.8 km down the Bebeng drainage on the SW flank. Five pyroclastic flows descended the Bebeng as far as 1.2 km. Morphological changes to the SW lava dome were due to continuing effusion and collapses of material. The Alert Level remained at 3 (on a scale of 1-4), and the public was warned to stay 3-7 km away from the summit, based on location.
Source: Balai Penyelidikan dan Pengembangan Teknologi Kebencanaan Geologi (BPPTKG)
Balai Penyelidikan dan Pengembangan Teknologi Kebencanaan Geologi (BPPTKG) reported that the eruption at Merapi (on Java) continued during 13-19 September. Seismicity was slightly less intense compared to the previous week. The SW lava dome produced 426 lava avalanches that traveled as far as 1.9 km down the Bebeng drainage on the SW flank. Nine pyroclastic flows descended the Bebeng as far as 1.3 km. Morphological changes to the SW lava dome were due to continuing effusion and collapses of material. The Alert Level remained at 3 (on a scale of 1-4), and the public was warned to stay 3-7 km away from the summit, based on location.
Source: Balai Penyelidikan dan Pengembangan Teknologi Kebencanaan Geologi (BPPTKG)
BPPTKG reported that the eruption at Merapi (on Java) continued during 6-12 September. Seismicity was slightly more intense compared to the previous week. The SW lava dome produced 167 lava avalanches that traveled as far as 1.8 km down the Bebeng drainage on the SW flank. Three pyroclastic flows descended the Bebeng as far as 1.5 km. Morphological changes to the SW lava dome were due to continuing effusion and collapses of material. The Alert Level remained at 3 (on a scale of 1-4), and the public was warned to stay 3-7 km away from the summit, based on location.
Source: Balai Penyelidikan dan Pengembangan Teknologi Kebencanaan Geologi (BPPTKG)
BPPTKG reported that the eruption at Merapi (on Java) continued during 30 August-5 September. Seismicity was less intense compared to the previous week. The SW lava dome produced 232 lava avalanches that traveled as far as 1.8 km down the Bebeng drainage on the SW flank. Morphological changes to the SW lava dome were due to continuing effusion and collapses of material. The Alert Level remained at 3 (on a scale of 1-4), and the public was warned to stay 3-7 km away from the summit, based on location.
Source: Balai Penyelidikan dan Pengembangan Teknologi Kebencanaan Geologi (BPPTKG)
BPPTKG reported that the eruption at Merapi (on Java) continued during 23-29 August. Earthquakes were less intense compared to the previous week. The SW lava dome produced lava avalanches that descended the S and SW flanks; 327 traveled as far as 2 km SW down the upper part of the Sat/Putih drainage and two traveled as far as 1.3 km S down the Boyong drainage. Eight pyroclastic flows descended the Bebeng drainage as far as 1.5 km. Morphological changes to the SW lava dome were due to continuing effusion and collapses of material. The hottest temperature was around 243 degrees Celsius on 25 August, similar to the previous measurement. The Alert Level remained at 3 (on a scale of 1-4), and the public was warned to stay 3-7 km away from the summit, based on location.
Source: Balai Penyelidikan dan Pengembangan Teknologi Kebencanaan Geologi (BPPTKG)
BPPTKG reported that the eruption at Merapi (on Java) continued during 16-22 August. Earthquakes were more intense compared to the previous week. The SW lava dome produced lava avalanches that descended the S and SW flanks; 314 traveled as far as 1.9 km SW down the upper part of the Bebeng drainage, two traveled 1 km S down the Boyong drainage, one traveled 1 km W down the Batang drainage, and one traveled 500 m W down the Apu drainage. Morphological changes to the SW lava dome were due to continuing effusion and collapses of material. The volume of the SW dome was an estimated 2,777,900 cubic meters based on webcam images and a 21 August drone survey. The hottest temperature was around 243 degrees Celsius, similar to the previous measurement. The Alert Level remained at 3 (on a scale of 1-4), and the public was warned to stay 3-7 km away from the summit, based on location.
Source: Balai Penyelidikan dan Pengembangan Teknologi Kebencanaan Geologi (BPPTKG)
BPPTKG reported that the eruption at Merapi (on Java) continued during 9-15 August. Earthquakes were around the same intensity compared to the previous week. The SW lava dome produced 289 lava avalanches that traveled as far as 1.9 km SW down the upper part of the Bebeng drainage, one that traveled 1 km S down the Boyong drainage, and one that traveled 1.5 km W down the Batang drainage. Morphological changes to the SW lava dome were due to continuing effusion and collapses of material. The Alert Level remained at 3 (on a scale of 1-4), and the public was warned to stay 3-7 km away from the summit, based on location.
Source: Balai Penyelidikan dan Pengembangan Teknologi Kebencanaan Geologi (BPPTKG)
BPPTKG reported that the eruption at Merapi (on Java) continued during 2-8 August. Earthquakes were less intense compared to the previous week. The SW lava dome produced 223 lava avalanches that traveled as far as 1.9 km down the upper part of the Bebeng drainage. Morphological changes to the SW lava dome were due to continuing effusion and collapses of material, and slight changes were detected at the dome in the main crater. The volume of the SW dome was an estimated 2,628,300 cubic meters and the dome in the main crater was stable at an estimated 2,360,700 cubic meters based on webcam images and a 2 August drone survey. The hottest temperature at the SW dome was around 249 degrees Celsius, higher than the previous measurement. The Alert Level remained at 3 (on a scale of 1-4), and the public was warned to stay 3-7 km away from the summit, based on location.
Source: Balai Penyelidikan dan Pengembangan Teknologi Kebencanaan Geologi (BPPTKG)
BPPTKG reported that the eruption at Merapi (on Java) continued during 26 July-2 August. The SW lava dome generated 148 lava avalanches that traveled as far as 1.8 km down the upper part of the Bebeng drainage. One pyroclastic flow also traveled as far as 1 km down the Bebeng drainage. Ten times the lava avalanches were heard from the Kaliurang and Babadan observation posts. Morphological changes to the SW lava dome were due to continuing effusion and collapses of material, but the dome at the main crater remained mostly unchanged. The volume estimates of the two domes did not change from the previous week at 2,538,700 cubic meters (SW dome) and 2,360,700 cubic meters (main dome). The Alert Level remained at 3 (on a scale of 1-4), and the public was warned to stay 3-7 km away from the summit, based on location.
Source: Balai Penyelidikan dan Pengembangan Teknologi Kebencanaan Geologi (BPPTKG)
BPPTKG reported that the eruption at Merapi (on Java) continued during 19-25 July. Earthquakes were less intense compared to the previous week. The SW lava dome produced 126 lava avalanches that traveled as far as 1.9 km down the upper part of the Bebeng drainage. Five pyroclastic flows traveled as far as 1.2 km down the Bebeng drainage. Morphological changes to the SW lava dome were due to continuing effusion and collapses of material and slight changes were detected at the dome in the main crater. The volume of the SW dome was an estimated 2,538,700 cubic meters and the dome in the main crater was stable at an estimated 2,360,700 cubic meters based on webcam images and a 23 July drone survey. The hottest temperature at the SW dome was around 219 degrees Celsius, similar to the previous measurement. The Alert Level remained at 3 (on a scale of 1-4), and the public was warned to stay 3-7 km away from the summit, based on location.
Source: Balai Penyelidikan dan Pengembangan Teknologi Kebencanaan Geologi (BPPTKG)
BPPTKG reported that the eruption at Merapi (on Java) continued during 12-18 July. Earthquakes were less intense compared to the previous week. The SW lava dome produced 177 lava avalanches that traveled as far as 2 km down the upper part of the Bebeng drainage on the SW flank and 1.1 km down the Bedog drainage on the SSW flank. Morphological changes to the SW lava dome were due to continuing effusion and collapses of material. The volume of the SW dome was an estimated 2,516,600 cubic meters and the dome in the main crater was stable at an estimated 2,360,700 cubic meters based on an 18 July drone survey and webcam images. The highest temperature of the SW dome was around 245 degrees Celsius, higher than the previous measurement. The Alert Level remained at 3 (on a scale of 1-4), and the public was warned to stay 3-7 km away from the summit, based on location.
Source: Balai Penyelidikan dan Pengembangan Teknologi Kebencanaan Geologi (BPPTKG)
Balai Penyelidikan dan Pengembangan Teknologi Kebencanaan Geologi (BPPTKG) reported that the eruption at Merapi (on Java) continued during 5-11 July. On 7 July white emissions rose 700 m above the summit. The SW lava dome produced 131 lava avalanches that traveled as far as 2.0 km down the upper part of the Bebeng drainage on the SW flank and as far as 900 m down the Boyong drainage on the S flank. One pyroclastic flow descended the SW flank as far as 1.3 km. Morphological changes to the SW lava dome were due to continuing effusion and collapses of material. Seismicity increased in intensity compared to the previous week. The Alert Level remained at 3 (on a scale of 1-4), and the public was warned to stay 3-7 km away from the summit, based on location.
Source: Balai Penyelidikan dan Pengembangan Teknologi Kebencanaan Geologi (BPPTKG)
BPPTKG reported that the eruption at Merapi (on Java) continued during 28 June-4 July. Seismicity had increased compared to the previous week. The SW lava dome produced 94 lava avalanches that traveled as far as 1.8 km down the upper part of the Bebeng drainage on the SW flank. One pyroclastic flow descended the SW flank as far as 1 km. Morphological changes to the SW lava dome were due to continuing effusion and collapses of material. The Alert Level remained at 3 (on a scale of 1-4), and the public was warned to stay 3-7 km away from the summit, based on location.
Source: Balai Penyelidikan dan Pengembangan Teknologi Kebencanaan Geologi (BPPTKG)
BPPTKG reported that the eruption at Merapi (on Java) continued during 21-27 June. Seismicity had decreased compared to the previous week. The SW lava dome produced 86 lava avalanches that traveled as far as 2 km down the upper part of the Bebeng drainage on the SW flank. Morphological changes to the SW lava dome were due to continuing effusion and collapses of material. The Alert Level remained at 3 (on a scale of 1-4), and the public was warned to stay 3-7 km away from the summit, based on location.
Source: Balai Penyelidikan dan Pengembangan Teknologi Kebencanaan Geologi (BPPTKG)
BPPTKG reported that the eruption at Merapi (on Java) continued during 14-20 June. Seismicity had decreased compared to the previous week. The SW lava dome produced 122 lava avalanches that traveled as far as 1.7 km down the upper part of the Bebeng drainage on the SW flank. Two pyroclastic flows descended the Bebeng, traveling as far as 1.5 km. Morphological changes to the SW lava dome were due to continuing effusion and collapses of material. The Alert Level remained at 3 (on a scale of 1-4), and the public was warned to stay 3-7 km away from the summit, based on location.
Source: Balai Penyelidikan dan Pengembangan Teknologi Kebencanaan Geologi (BPPTKG)
BPPTKG reported that the eruption at Merapi (on Java) continued during 7-13 June. Seismicity had decreased compared to the previous week. The SW lava dome produced 122 lava avalanches that traveled as far as 1.8 km down the upper part of the Bebeng drainage on the SW flank. Two pyroclastic flows descended the Bebeng, traveling as far as 1 km, at 2025 on 8 June and at 0406 on 9 June; the 8 June pyroclastic flow produced minor ashfall at the Merapi Observation Post in Kaliurang (8 km S). Morphological changes to the SW lava dome were due to continuing effusion and collapses of material. The volume of the SW dome was an estimated 2,265,200 cubic meters and the dome in the main crater was stable at an estimated 2,362,800 cubic meters based on a 13 June drone survey and webcam images. The highest temperature of the SW dome was around 245 degrees Celsius, two degrees higher than the 6 June measurement. The Alert Level remained at 3 (on a scale of 1-4), and the public was warned to stay 3-7 km away from the summit, based on location.
Source: Balai Penyelidikan dan Pengembangan Teknologi Kebencanaan Geologi (BPPTKG)
BPPTKG reported that the eruption at Merapi (on Java) continued during 31 May-6 June. Seismicity had decreased compared to the previous week. The SW lava dome produced 141 lava avalanches that traveled as far as 1.9 km down the upper part of the Bebeng drainage on the SW flank. Three pyroclastic flows also descended the Bebeng, traveling as far as 1 km. Morphological changes to the SW lava dome were due to continuing effusion and collapses of material. The volume of the SW dome was an estimated 2,335,200 cubic meters and the dome in the main crater was stable at an estimated 2,362,800 cubic meters based on a 6 June drone survey. The highest temperature of the SW dome was around 243 degrees Celsius, lower than the previous measurement. The Alert Level remained at 3 (on a scale of 1-4), and the public was warned to stay 3-7 km away from the summit, based on location.
Source: Balai Penyelidikan dan Pengembangan Teknologi Kebencanaan Geologi (BPPTKG)
BPPTKG reported that the eruption at Merapi (on Java) continued during 17-23 May. Seismicity had decreased compared to the previous week. The SW lava dome produced 138 lava avalanches that traveled as far as 1.9 km down the Bebeng drainage on the SW flank. Morphological changes to the SW lava dome were due to continuing effusion and collapses of material. The Alert Level remained at 3 (on a scale of 1-4), and the public was warned to stay 3-7 km away from the summit, based on location.
Source: Balai Penyelidikan dan Pengembangan Teknologi Kebencanaan Geologi (BPPTKG)
BPPTKG reported that the eruption at Merapi (on Java) continued during 10-16 May. Seismicity had decreased compared to the previous week. The SW lava dome produced 68 lava avalanches that traveled as far as 2.1 km down the Bebeng drainage on the SW flank. Morphological changes to the SW lava dome were due to continuing effusion and collapses of material. The Alert Level remained at 3 (on a scale of 1-4), and the public was warned to stay 3-7 km away from the summit, based on location.
Source: Balai Penyelidikan dan Pengembangan Teknologi Kebencanaan Geologi (BPPTKG)
BPPTKG reported that the eruption at Merapi (on Java) continued during 3-9 May. Seismicity had intensified compared to the previous week. The SW lava dome produced 176 lava avalanches that traveled as far as 2 km down the Bebeng drainage on the SW flank. Morphological changes to the SW lava dome were due to continuing effusion and collapses of material. The volume of the SW dome was an estimated 2,299,600 cubic meters and the dome in the main crater was stable at an estimated 2,360,000 cubic meters based on a 9 May drone survey and webcam images. The Alert Level remained at 3 (on a scale of 1-4), and the public was warned to stay 3-7 km away from the summit, based on location.
Source: Balai Penyelidikan dan Pengembangan Teknologi Kebencanaan Geologi (BPPTKG)
BPPTKG reported that the eruption at Merapi (on Java) continued during 26 April-2 May. Seismicity had declined compared to the previous week. The SW lava dome produced 113 lava avalanches that traveled as far as 2 km down the SW flank. Morphological changes to the SW lava dome were due to continuing effusion and collapses of material. The volume of the SW dome was an estimated 2,171,300 cubic meters and the dome in the main crater was stable at an estimated 2,358,200 cubic meters based on a 24 April drone survey and webcam images. The highest temperature of the SW dome was around 215 degrees Celsius, higher than the previous measurement. The Alert Level remained at 3 (on a scale of 1-4), and the public was warned to stay 3-7 km away from the summit, based on location.
Source: Balai Penyelidikan dan Pengembangan Teknologi Kebencanaan Geologi (BPPTKG)
BPPTKG reported that the eruption at Merapi (on Java) continued during 19-25 April. Seismicity remained at high levels. The SW lava dome produced 152 lava avalanches that traveled as far as 2 km down the SW flank. Morphological changes to the SW lava dome were due to continuing effusion and collapses of material. The Alert Level remained at 3 (on a scale of 1-4), and the public was warned to stay 3-7 km away from the summit, based on location.
Source: Balai Penyelidikan dan Pengembangan Teknologi Kebencanaan Geologi (BPPTKG)
BPPTKG reported that the eruption at Merapi (on Java) continued during 12-18 April. Seismicity remained at high levels. The SW lava dome produced 111 lava avalanches that traveled as far as 1.7 km down the SW flank. One pyroclastic flow traveled 1 km SW down the upper part of the Bebeng drainage. Morphological changes to the SW lava dome were due to continuing effusion and collapses of material. The Alert Level remained at 3 (on a scale of 1-4), and the public was warned to stay 3-7 km away from the summit, based on location.
Source: Balai Penyelidikan dan Pengembangan Teknologi Kebencanaan Geologi (BPPTKG)
BPPTKG reported that the eruption at Merapi (on Java) continued during 5-11 April. Seismicity remained at high levels and was more intense than the previous week. The SW lava dome produced 103 lava avalanches that traveled as far as 1.8 km down the SW flank. One pyroclastic flow traveled 1.1 km SW down the upper part of the Bebeng drainage. Morphological changes to the SW lava dome were due to continuing effusion and collapses of material. The Alert Level remained at 3 (on a scale of 1-4), and the public was warned to stay 3-7 km away from the summit, based on location.
Source: Balai Penyelidikan dan Pengembangan Teknologi Kebencanaan Geologi (BPPTKG)
BPPTKG reported that the eruption at Merapi (on Java) continued during 29 March-4 April. Seismicity remained at high levels. The SW lava dome produced 49 lava avalanches that traveled as far as 1.8 km down the SW flank. One pyroclastic flow traveled 1.7 km SW down the upper part of the Bebeng drainage. Morphological changes to the SW lava dome were due to continuing effusion and collapses of material. The volume of the SW dome was an estimated 2,054,600 cubic meters and the dome in the main crater was an estimated 2,358,200 cubic meters based on a 30 March drone survey and webcam images. The highest temperature of the SW dome was 243 degrees Celsius, lower than the previous measurement. The Alert Level remained at 3 (on a scale of 1-4), and the public was warned to stay 3-7 km away from the summit, based on location.
Source: Balai Penyelidikan dan Pengembangan Teknologi Kebencanaan Geologi (BPPTKG)
BPPTKG reported that the eruption at Merapi (on Java) continued during 22-28 March. Seismicity remained at high levels. The SW lava dome produced 46 lava avalanches that descended the S and SW flanks; two traveled S as far as 800 m down the upper part of the Boyong drainage and 44 traveled SW as far as 1.5 km down the upper part of the Bebeng drainage. Morphological changes to the SW lava dome were due to continuing effusion and collapses of material. The volume of the SW dome was an estimated 2,066,400 cubic meters and the dome in the main crater was an estimated 2,358,000 cubic meters based on 21 March aerial photos. The Alert Level remained at 3 (on a scale of 1-4), and the public was warned to stay 3-7 km away from the summit, based on location.
Source: Balai Penyelidikan dan Pengembangan Teknologi Kebencanaan Geologi (BPPTKG)
BPPTKG reported that the eruption at Merapi (on Java) continued during 15-21 March. Seismicity remained at high levels. The SW lava dome produced 59 lava avalanches that descended the SW flank as far as 1.8 km. Morphological changes to the SW lava dome caused by lava avalanches were identified in images from a drone survey on 21 March. The Alert Level remained at 3 (on a scale of 1-4), and the public was warned to stay 3-7 km away from the summit, based on location.
Source: Balai Penyelidikan dan Pengembangan Teknologi Kebencanaan Geologi (BPPTKG)
BPPTKG reported that the eruption at Merapi (on Java) continued during 8-14 March. Seismicity remained at high levels. The SW lava dome produced 91 lava avalanches that descended the SW flank as far as 1.8 km. Morphological changes to the SW lava dome identified in webcam images were due to continuing effusion and collapses of material. The Alert Level remained at 3 (on a scale of 1-4), and the public was warned to stay 3-7 km away from the summit, based on location.
Source: Balai Penyelidikan dan Pengembangan Teknologi Kebencanaan Geologi (BPPTKG)
BPPTKG reported that the eruption at Merapi (on Java) continued during 1-7 March. Seismicity remained at high levels. The SW lava dome produced 123 lava avalanches that descended the S and SW flanks; one traveled S as far as 1 km down the upper part of the Boyong drainage and 122 traveled SW as far as 2 km down the upper part of the Bebeng drainage. A series of eight pyroclastic flows traveled as far as 2.6 km down the SW flank on 4 March; ashfall was reported at the Pasarbubar station, 800 m N, and minor ashfall was reported in Selo (6 km NNW) and Cepogo (4 km NE). Morphological changes to the SW lava dome identified in webcam images were due to continuing effusion and collapses of material. The Alert Level remained at 3 (on a scale of 1-4), and the public was warned to stay 3-7 km away from the summit, based on location.
Source: Balai Penyelidikan dan Pengembangan Teknologi Kebencanaan Geologi (BPPTKG)
BPPTKG reported that the eruption at Merapi (on Java) continued during 23-29 February. Seismicity remained at high levels and was slightly higher than the previous week. The SW lava dome produced 139 lava avalanches that descended the S and SW flanks as far as 1.6 km. Morphological changes to the SW lava dome identified in webcam images were due to continuing effusion and collapses of material. A series of pyroclastic flows traveled 1.2-2.4 km down the SW flank during 1603-1837 on 4 March. The Alert Level remained at 3 (on a scale of 1-4), and the public was warned to stay 3-7 km away from the summit, based on location.
Source: Balai Penyelidikan dan Pengembangan Teknologi Kebencanaan Geologi (BPPTKG)
BPPTKG reported that the eruption at Merapi (on Java) continued during 16-22 February. Seismicity remained at high levels. The SW lava dome produced 145 lava avalanches that descended the S and SW flanks; three traveled S as far as 1 km down the upper part of the Boyong drainage and 142 traveled SW as far as 1.7 km down the upper part of the Bebeng drainage. Two pyroclastic flows traveled as far as 1.6 km down the SW flank. Morphological changes to the SW lava dome identified in webcam images were due to continuing effusion and collapses of material. The Alert Level remained at 3 (on a scale of 1-4), and the public was warned to stay 3-7 km away from the summit, based on location.
Source: Balai Penyelidikan dan Pengembangan Teknologi Kebencanaan Geologi (BPPTKG)
BPPTKG reported that the eruption at Merapi (on Java) continued during 9-15 February. Seismicity remained at high levels. The SW lava dome produced 189 lava avalanches, three times the number from the previous week, that descended the S and SW flanks; two traveled S as far as 1.4 km down the upper part of the Boyong drainage and 187 traveled SW as far as 1.7 km down the upper part of the Bebeng drainage. Two pyroclastic flows descended the Bebeng drainage, traveling as far as 1.5 km. Morphological changes to the SW lava dome identified in webcam images and during a 15 February drone overflight were due to continuing effusion and collapses of material. The highest temperature on the dome was 254.3 degrees Celsius, lower than the previous highest temperature. The Alert Level remained at 3 (on a scale of 1-4), and the public was warned to stay 3-7 km away from the summit, based on location.
Source: Balai Penyelidikan dan Pengembangan Teknologi Kebencanaan Geologi (BPPTKG)
BPPTKG reported that the eruption at Merapi (on Java) continued during 2-8 February. Seismicity remained at high levels. The SW lava dome produced 184 lava avalanches that descended the S and SW flanks: one traveled S as far as 1.5 km down the upper part of the Boyong drainage and 183 traveled SW as far as 1.7 km down the upper part of the Bebeng drainage. One pyroclastic flow descended the Bebeng drainage, traveling as far as 1.6 km. Morphological changes to the SW lava dome identified in webcam images were due to continuing effusion and collapses of material. The Alert Level remained at 3 (on a scale of 1-4), and the public was warned to stay 3-7 km away from the summit, based on location.
Source: Balai Penyelidikan dan Pengembangan Teknologi Kebencanaan Geologi (BPPTKG)
BPPTKG reported that the eruption at Merapi (on Java) continued during 26 January-1 February. Seismicity remained at high levels. The SW lava dome produced 143 lava avalanches, triple in number compared to the previous week, that descended the S and SW flanks: three traveled S as far as 1 km down the upper part of the Boyong drainage and 140 traveled SW as far as 1.7 km down the upper part of the Bebeng drainage. A total of 10 pyroclastic flows descended the Bebeng drainage, traveling as far as 2.4 km. Morphological changes to the SW lava dome identified in webcam images were due to continuing effusion and collapses of material. The Alert Level remained at 3 (on a scale of 1-4), and the public was warned to stay 3-7 km away from the summit, based on location.
Sources: Balai Penyelidikan dan Pengembangan Teknologi Kebencanaan Geologi (BPPTKG); Antara News
BPPTKG reported that the eruption at Merapi (on Java) continued during 19-25 January. Seismicity remained at high levels. The SW lava dome produced a total of 47 lava avalanches that traveled as far as 1.5 km SW down the upper part of the Bebeng drainage. A total of 19 pyroclastic flows descended the Bebeng drainage as far as 3 km. The pyroclastic flows removed material from the upper parts of the Bebeng and Krasak drainages. According to news articles, minor ashfall was reported in Jelok Village (40 km S) at around 0845 on 21 January. An eruptive event with pyroclastic flows at 1355 that same day produced an ash plume that rose 1 km above the summit and caused ashfall in areas within 17 km SE, E, and NE, though some of the villages were located at greater distances. Minor amounts of ash fell in areas downwind, including Kemalang (15 km SE), Klaten (32 km SE), Selo Districts, Musuk, Boyolali (17 km E), Cepogo (4 km NE), Musuk (11 km ESE), Tamansari, Boyolali Kota, Teras (22 km E), Mojosongo (45 km E), and Sambi (28 ENE) at around 1430. The ash was washed away quickly due to rain. BPPTKG noted that morphological changes to the SW lava dome identified in webcam images were due to continuing collapses of material. The Alert Level remained at 3 (on a scale of 1-4), and the public was warned to stay 3-7 km away from the summit, based on location.
Sources: Balai Penyelidikan dan Pengembangan Teknologi Kebencanaan Geologi (BPPTKG); Antara News; Antara News
BPPTKG reported that the eruption at Merapi (on Java) continued during 12-18 January. Seismicity remained at high levels. The SW lava dome produced a total of 88 lava avalanches that descended the S and SW flanks; five traveled S as far as 1.2 km down the upper part of the Boyong drainage and 83 traveled SW as far as 1.6 km down the upper part of the Bebeng drainage. Four pyroclastic flows descended the Bebeng drainage as far as 2.4 km. Morphological changes to the SW lava dome identified in webcam images were due to continuing collapses of material. The Alert Level remained at 3 (on a scale of 1-4), and the public was warned to stay 3-7 km away from the summit, based on location.
Source: Balai Penyelidikan dan Pengembangan Teknologi Kebencanaan Geologi (BPPTKG)
BPPTKG reported that the eruption at Merapi (on Java) continued during 5-11 January. The SW lava dome produced a total of 189 lava avalanches that descended the S, SW, and W flanks; eight traveled S as far as 1.5 km down the upper part of the Boyong drainage, 178 traveled SW as far as 1.8 km down the upper part of the Bebeng drainage, and three traveled as far as 1.5 km down the Sat/Putih drainage. Four pyroclastic flows descended the Boyong and Bebeng drainages as far as 1.5 km. Morphological changes to the SW lava dome identified in webcam images were due to continuing collapses of material. The Alert Level remained at 3 (on a scale of 1-4), and the public was warned to stay 3-7 km away from the summit, based on location.
Source: Balai Penyelidikan dan Pengembangan Teknologi Kebencanaan Geologi (BPPTKG)
BPPTKG reported that the eruption at Merapi (on Java) continued during 29 December 2023-4 January 2024. The SW lava dome produced a total of 83 lava avalanches that descended the S and SW flanks; six traveled S as far as 1.4 km down the upper part of the Boyong drainage and the other 77 traveled SW as far as 2 km down the upper part of the Bebeng drainage. Two pyroclastic flows descended the Bebeng, traveling as far as 1.8 km. Morphological changes to the SW lava dome identified in webcam images were due to continuing collapses of material. The Alert Level remained at 3 (on a scale of 1-4), and the public was warned to stay 3-7 km away from the summit, based on location.
Source: Balai Penyelidikan dan Pengembangan Teknologi Kebencanaan Geologi (BPPTKG)
BPPTKG reported that the eruption at Merapi (on Java) continued during 22-28 December. The SW lava dome produced a total of 102 lava avalanches that descended the S and SW flanks; 16 traveled S as far as 1.5 km down the upper part of the Boyong drainage and the other 86 traveled SW as far as 1.9 km down the upper part of the Bebeng drainage. Morphological changes to the SW lava dome identified in webcam images were due to continuing collapses of material. The volume of the SW dome was an estimated 2,948,100 cubic meters and the dome in the main crater was an estimated 2,358,400 cubic meters based on 20 December aerial photos. The Alert Level remained at 3 (on a scale of 1-4), and the public was warned to stay 3-7 km away from the summit, based on location.
Source: Balai Penyelidikan dan Pengembangan Teknologi Kebencanaan Geologi (BPPTKG)
BPPTKG reported that the eruption at Merapi (on Java) continued during 15-21 December. The SW lava dome produced a total of 147 lava avalanches that descended the S and SW flanks; 26 traveled S as far as 1.6 km down the upper part of the Boyong drainage, 120 traveled SW as far as 1.7 km down the upper part of the Bebeng drainage, and one traveled 1.2 km down the Putih/Sat drainage on the WSW flank. Morphological changes to the SW lava dome were identified in webcam images due to continuing collapses of material. The intensity of earthquakes indicating avalanches and hybrid events significantly decreased during the week. The Alert Level remained at 3 (on a scale of 1-4), and the public was warned to stay 3-7 km away from the summit, based on location.
Source: Balai Penyelidikan dan Pengembangan Teknologi Kebencanaan Geologi (BPPTKG)
BPPTKG reported that the eruption at Merapi (on Java) continued during 8-14 December. A series of pyroclastic flows traveled 3.8 km SW down the Bebeng and Krasak drainages on 8 December. Minor amounts of ash fell in the districts of Dukun, Sawangan, Magelang, and Selo. During the week the SW lava dome produced a total of 243 lava avalanches; 22 traveled as far as 2 km down the Boyong drainage and 221 traveled as far as 1.9 km down the Bebeng drainage. Minor morphological changes to the SW lava dome were identified in webcam images due to continuing lava effusion and collapses of material. Both the number and intensity of shallow volcanic earthquakes and hybrid events significantly decreased during the week. The Alert Level remained at 3 (on a scale of 1-4), and the public was warned to stay 3-7 km away from the summit, based on location.
Source: Balai Penyelidikan dan Pengembangan Teknologi Kebencanaan Geologi (BPPTKG)
BPPTKG reported that the eruption at Merapi (on Java) continued during 1-8 December. Two pyroclastic flows traveled S as far as 1.3 km down the upper part of the Boyong drainage and four pyroclastic flows traveled SW as far as 3 km down the upper parts of the Bebeng and Krasak drainages during 1-7 December. Minor ashfall occurred in the Sawangan District (15 km W), Magelang, and the Selo District (5 km NNE), Boyolali. The SW lava dome produced a total of 192 lava avalanches; 23 traveled as far as 1.5 km down the Boyong drainage and 169 traveled as far as 1.7 km down the Bebeng drainage. According to BNPB several dark gray pyroclastic flows were detected by the seismic network starting at 1449 on 8 December and traveled as far as 3.5 km down the Krasak drainage on the SW flank. Ash mixed with rain fell in Krinjing (5 km WNW) and Paten (9 km WNW) villages, Dukun District in the Magelang Regency, as well as in the Stabelan (4 km NW), Klakah (4 km NW), and Tlogolele (5 km NW) villages in the Selo District, Boyolali Regency. BPPTKG noted that minor morphological changes to the SW lava dome were identified in webcam images due to continuing lava effusion and collapses of material. Seismicity remained at high levels during the week. The Alert Level remained at 3 (on a scale of 1-4), and the public was warned to stay 3-7 km away from the summit, based on location.
Sources: Balai Penyelidikan dan Pengembangan Teknologi Kebencanaan Geologi (BPPTKG); Badan Nacional Penanggulangan Bencana (BNPB)
BPPTKG reported that the eruption at Merapi (on Java) continued during 24-30 November. The SW lava dome produced a total of 97 lava avalanches that descended the S and SW flanks; 20 traveled S as far as 1.5 km down the upper part of the Boyong drainage and 77 traveled SW as far as 1.8 km down the upper part of the Bebeng drainage. Two pyroclastic density currents (PDC’s, or pyroclastic flows) traveled down the Boyong drainage as far as 1.5 km and down the Bebeng drainage as far as 2 km. Variable white emissions rose 75 m above the summit. Minor morphological changes to the SW lava dome were identified in webcam images due to continuing lava effusion and collapses of material. The Alert Level remained at 3 (on a scale of 1-4), and the public was warned to stay 3-7 km away from the summit, based on location.
Source: Balai Penyelidikan dan Pengembangan Teknologi Kebencanaan Geologi (BPPTKG)
BPPTKG reported that the eruption at Merapi (on Java) continued during 17-23 November. The SW lava dome produced a total of 91 lava avalanches that descended the flanks; three traveled as far as 1.3 km down the upper part of the Boyong drainage and 88 traveled as far as 1.8 km down the upper Bebeng drainage. Minor morphological changes to the SW lava dome were identified in webcam images due to continuing lava effusion and collapses of material. The Alert Level remained at 3 (on a scale of 1-4), and the public was warned to stay 3-7 km away from the summit, based on location.
Source: Balai Penyelidikan dan Pengembangan Teknologi Kebencanaan Geologi (BPPTKG)
BPPTKG reported that the eruption at Merapi (on Java) continued during 10-16 November. The SW lava dome produced a total of 69 lava avalanches that descended the flanks; 10 traveled as far as 1.5 km down the upper part of the Boyong drainage and 59 traveled as far as 1.7 km down the upper Bebeng drainage. Minor morphological changes to the SW lava dome detected in webcam images and during a 16 November drone survey were due to continuing lava effusion and collapses of material. The highest temperature measured at the SW dome during the drone overflight was 292 degrees Celsius, lower than previous measurements. The volume of the SW dome was an estimated 3,348,600 cubic meters and the dome in the main crater was an estimated 2,358,000 cubic meters. Seismicity remained at elevated levels. The Alert Level remained at 3 (on a scale of 1-4), and the public was warned to stay 3-7 km away from the summit, based on location.
Source: Balai Penyelidikan dan Pengembangan Teknologi Kebencanaan Geologi (BPPTKG)
BPPTKG reported that the eruption at Merapi (on Java) continued during 3-9 November. The SW lava dome produced a total of 79 lava avalanches that descended the flanks; 74 traveled as far as 2 km down the upper Bebeng drainage, with another four going up to 1.5 km down the upper part of the Boyong drainage and one reaching 1.5 km down the upper Sat/Putih drainage. Morphological changes to the SW lava dome were due to continuous collapses of material. Seismicity remained at elevated levels. The Alert Level remained at 3 (on a scale of 1-4), and the public was warned to stay 3-7 km away from the summit, based on location.
Source: Balai Penyelidikan dan Pengembangan Teknologi Kebencanaan Geologi (BPPTKG)
BPPTKG reported that the eruption at Merapi (on Java) continued during 27 October-2 November. The SW lava dome produced a total of 135 lava avalanches that descended the S and SW flanks; 16 traveled as far as 1.6 km down the upper part of the Boyong drainage and 119 traveled as far as 1.9 km down the upper Bebeng drainage. Morphological changes to the SW lava dome were due to continuous collapses of material. Seismicity remained at elevated levels. The Alert Level remained at 3 (on a scale of 1-4), and the public was warned to stay 3-7 km away from the summit, based on location.
Source: Balai Penyelidikan dan Pengembangan Teknologi Kebencanaan Geologi (BPPTKG)
BPPTKG reported that the eruption at Merapi (on Java) continued during 13-19 October. The SW lava dome produced a total of 207 lava avalanches that descended the S and SW flanks; 54 traveled as far as 1.6 km down the upper part of the Boyong drainage, 151 traveled as far as 1.8 km down the upper Bebeng drainage, one traveled 1.5 km down the Sat/Putih drainage, and one traveled 800 m down the Senowo drainage. Morphological changes to the SW lava dome were due to continuous collapses of material. Seismicity remained at elevated levels and indicated increased magmatic activity at depths of less than 1.5 km below the summit. The Alert Level remained at 3 (on a scale of 1-4), and the public was warned to stay 3-7 km away from the summit, based on location.
Source: Balai Penyelidikan dan Pengembangan Teknologi Kebencanaan Geologi (BPPTKG)
BPPTKG reported that the eruption at Merapi (on Java) continued during 6-12 October and seismicity remained at elevated levels. The SW lava dome produced a total of 163 lava avalanches that descended the S and SW flanks; 18 traveled as far as 1.6 km down the upper part of the Boyong drainage and 145 traveled as far as 2 km down the upper Bebeng drainage. Morphological changes to the SW lava dome were due to continuous collapses of material. The Alert Level remained at 3 (on a scale of 1-4), and the public was warned to stay 3-7 km away from the summit based on location.
Source: Balai Penyelidikan dan Pengembangan Teknologi Kebencanaan Geologi (BPPTKG)
BPPTKG reported that the eruption at Merapi (on Java) continued during 29 September-5 October and seismicity remained at elevated levels. The SW lava dome produced a total of 177 lava avalanches that descended the S and SW flanks; 21 traveled as far as 1.6 km down the upper part of the Boyong drainage, 155 traveled as far as 2 km down the upper Bebeng drainage, and one traveled 700 m down the Senowo drainage. Morphological changes to the SW lava dome were due to continuing collapses of material; based on webcam images the SW dome had grown slightly taller while the dome in the summit crater remained unchanged. The Alert Level remained at 3 (on a scale of 1-4), and the public was warned to stay 3-7 km away from the summit based on location.
Source: Balai Penyelidikan dan Pengembangan Teknologi Kebencanaan Geologi (BPPTKG)
BPPTKG reported that the eruption at Merapi (on Java) continued during 22-28 September and seismicity remained at elevated levels. The SW lava dome produced a total of 171 lava avalanches that descended the S and SW flanks; 13 traveled as far as 1.5 km down the upper part of the Boyong drainage, 155 traveled as far as 2 km down the upper Bebeng drainage, and two traveled 1.6 km down the Sat/Putih drainage. One lava avalanche traveled 600 m down the Gendol drainage on the SE flank. Morphological changes to the SW lava dome were due to continuing collapses of material; based on thermal photos from 27 September and a drone overflight on 28 September the SW dome had grown slightly taller while the dome in the summit crater remained unchanged. The highest temperature measured at the SW dome was 409 degrees Celsius, lower than the previous measurement. At the central dome the highest temperature was 236 degrees Celsius, or near the temperatures of the surrounding rocks. The Alert Level remained at 3 (on a scale of 1-4), and the public was warned to stay 3-7 km away from the summit based on location.
Source: Balai Penyelidikan dan Pengembangan Teknologi Kebencanaan Geologi (BPPTKG)
BPPTKG reported that the eruption at Merapi (on Java) continued during 15-21 September and seismicity remained at elevated levels. The SW lava dome produced a total of 148 lava avalanches that descended the S and SW flanks; two traveled as far as 1.3 km down the upper part of the Boyong drainage, 145 traveled as far as 2 km down the upper Bebeng drainage, and one traveled 1.4 km down the Sat/Putih drainage. Morphological changes to the SW lava dome were due to continuing collapses of material. The Alert Level remained at 3 (on a scale of 1-4), and the public was warned to stay 3-7 km away from the summit based on location.
Source: Balai Penyelidikan dan Pengembangan Teknologi Kebencanaan Geologi (BPPTKG)
BPPTKG reported that the eruption at Merapi (on Java) continued during 8-14 September and seismicity remained at elevated levels. The SW lava dome produced a total of 162 lava avalanches that descended the S and SW flanks; 10 traveled as far as 1.5 km down the upper part of the Boyong drainage, 151 traveled as far as 2 km down the upper Bebeng drainage, and one traveled 1.2 km down the Sat/Putih drainage. Morphological changes to the SW lava dome were due to continuing collapses of material. The Alert Level remained at 3 (on a scale of 1-4), and the public was warned to stay 3-7 km away from the summit based on location.
Source: Balai Penyelidikan dan Pengembangan Teknologi Kebencanaan Geologi (BPPTKG)
BPPTKG reported that the eruption at Merapi (on Java) continued during 1-7 September and seismicity remained at elevated levels. The SW lava dome produced a total of 154 lava avalanches that descended the S and SW flanks; five traveled as far as 1.5 km down the upper part of the Boyong drainage, 146 traveled as far as 2 km down the upper Bebeng drainage, and three traveled 1.5 km down the Senowo drainage. Morphological changes to the SW lava dome were due to continuing collapses of material. The Alert Level remained at 3 (on a scale of 1-4), and the public was warned to stay 3-7 km away from the summit based on location.
Source: Balai Penyelidikan dan Pengembangan Teknologi Kebencanaan Geologi (BPPTKG)
BPPTKG reported that the eruption at Merapi (on Java) continued during 25-31 August and seismicity remained at elevated levels. The SW lava dome produced a total of 118 lava avalanches that descended the S and SW flanks; two traveled as far as 1 km down the upper part of the Boyong drainage, 115 traveled as far as 2.3 km down the upper Bebeng drainage, and one traveled 500 m down the Senowo drainage. Morphological changes to the SW lava dome were due to continuing collapses of material. No changes were observed at the dome in the main crater. The Alert Level remained at 3 (on a scale of 1-4), and the public was warned to stay 3-7 km away from the summit based on location.
Source: Balai Penyelidikan dan Pengembangan Teknologi Kebencanaan Geologi (BPPTKG)
BPPTKG reported that the eruption at Merapi (on Java) continued during 18-24 August and seismicity remained at elevated levels. The SW lava dome produced a total of 144 lava avalanches that descended the S and SW flanks; six traveled as far as 1.5 km down the upper part of the Boyong drainage and 138 traveled as far as 1.8 km down the upper Bebeng drainage. Morphological changes to the SW lava dome were due to continuing collapses of material. The Alert Level remained at 3 (on a scale of 1-4), and the public was warned to stay 3-7 km away from the summit based on location.
Source: Balai Penyelidikan dan Pengembangan Teknologi Kebencanaan Geologi (BPPTKG)
BPPTKG reported that the eruption at Merapi (on Java) continued during 4-10 August and seismicity remained at elevated levels. The SW lava dome produced a total of 244 lava avalanches that descended the SW flank; 34 traveled as far as 1.6 km down the upper part of the Boyong drainage, 207 traveled as far as 2 km down the upper Bebeng drainage, and 3 traveled as far as 1.4 km down the Senowo drainage. Morphological changes to the SW lava dome were due to continuing collapses of material. The Alert Level remained at 3 (on a scale of 1-4), and the public was warned to stay 3-7 km away from the summit based on location.
Source: Balai Penyelidikan dan Pengembangan Teknologi Kebencanaan Geologi (BPPTKG)
BPPTKG reported that the eruption at Merapi (on Java) continued during 4-10 August and seismicity remained at elevated levels. The SW lava dome produced a total of 198 lava avalanches that descended the SW flank; 15 traveled as far as 1.9 km down the upper part of the Boyong drainage, 180 traveled as far as 2 km down the upper Bebeng drainage, and 3 traveled as far as 1.6 km down the Sat/Putih drainage. Morphological changes to the SW lava dome were due to continuing collapses of material. Temperatures of the SW dome ranged from 180 to 412 degrees Celsius based on analysis of thermal photos acquired on 9 August. Analysis of a 10 August aerial survey estimated that the SW dome volume was 2,764,300 cubic meters and the dome in the main crater was an estimated 2,369,800 cubic meters. The Alert Level remained at 3 (on a scale of 1-4), and the public was warned to stay 3-7 km away from the summit based on location.
Source: Balai Penyelidikan dan Pengembangan Teknologi Kebencanaan Geologi (BPPTKG)
BPPTKG reported that the eruption at Merapi (on Java) continued during 28 July-3 August and seismicity remained at elevated levels. The SW lava dome produced a total of 194 lava avalanches that descended the SW flank; 12 traveled as far as 1.6 km down the upper part of the Boyong drainage and 182 traveled as far as 2 km down the upper Bebeng drainage. One earthquake signal indicating a pyroclastic flow was recorded by the seismic network. Morphological changes to the SW lava dome were due to continuing collapses of material. The Alert Level remained at 3 (on a scale of 1-4), and the public was warned to stay 3-7 km away from the summit based on location.
Source: Balai Penyelidikan dan Pengembangan Teknologi Kebencanaan Geologi (BPPTKG)
BPPTKG reported that the eruption at Merapi (on Java) continued during 21-27 July and seismicity remained at elevated levels. White gas-and-steam emissions rose 350 m above the summit at 0910 on 27 July. The SW lava dome produced a total of 254 lava avalanches that descended the W and S flanks; one avalanche traveled 1.5 km down the Sat/Putih drainage, 30 avalanches traveled a maximum distance of 1.8 km down the SW flank upstream from the Boyong drainage, and 222 traveled as far as 2 km down the Bebeng drainage. Morphological changes to the SW lava dome were due to continuing collapses. Based on analysis of an aerial photo taken on 24 June, the volume of the SW lava dome was approximately 2.5 million cubic meters. The Alert Level remained at 3 (on a scale of 1-4), and the public was warned to stay 3-7 km away from the summit based on location.
Source: Balai Penyelidikan dan Pengembangan Teknologi Kebencanaan Geologi (BPPTKG)
BPPTKG reported that the eruption at Merapi (on Java) continued during 14-20 July and seismicity remained at elevated levels. The SW lava dome produced a total of 281 lava avalanches that descended multiple flanks; one avalanche traveled 1 km down the Sat/Putih drainage, two traveled as far as 500 m down the Senowo drainage, eight traveled a maximum distance of 2 km down the SW flank upstream from the Boyong drainage, and 270 traveled as far as 1.8 km down the Bebeng. Morphological changes to the SW lava dome were due to continuing collapses of material. The Darwin VAAC reported that multiple minor ash plumes were identified in satellite images on 19 July rising to 3.7 km (12,000 ft) a.s.l. and drifting S and SW. The emissions were more diffuse towards the end of the day and at 2350 on 19 July and 0600 on 20 July were only visible in webcam images. The Alert Level remained at 3 (on a scale of 1-4), and the public was warned to stay 3-7 km away from the summit based on location.
Source: Balai Penyelidikan dan Pengembangan Teknologi Kebencanaan Geologi (BPPTKG)
BPPTKG reported that the eruption at Merapi (on Java) continued during 7-13 July and seismicity remained at elevated levels. The SW lava dome produced 152 lava avalanches that traveled as far as 2 km down the SW flank (upstream in the Boyong drainage), three that traveled as far as 800 m down the Boyong drainage, and one that traveled 1.2 km down the Sat/Putih drainage. Morphological changes to the SW lava dome were due to continuing collapses of material. The Alert Level remained at 3 (on a scale of 1-4), and the public was warned to stay 3-7 km away from the summit based on location.
Source: Balai Penyelidikan dan Pengembangan Teknologi Kebencanaan Geologi (BPPTKG)
BPPTKG reported that the eruption at Merapi (on Java) continued during 23-29 June and seismicity remained at elevated levels. The SW lava dome produced 130 lava avalanches that traveled as far as 2 km down the SW flank (upstream in the Boyong drainage) and one that traveled 300 m NW down the Senowo drainage. Morphological changes to the SW lava dome were due to continuing collapses of material. The Alert Level remained at 3 (on a scale of 1-4), and the public was warned to stay 3-7 km away from the summit based on location.
Source: Balai Penyelidikan dan Pengembangan Teknologi Kebencanaan Geologi (BPPTKG)
BPPTKG reported that the eruption at Merapi (on Java) continued during 16-22 June and seismicity remained at elevated levels. The SW lava dome produced 116 lava avalanches that traveled as far as 1.8 km down the SW flank (upstream in the Bebeng and Boyong drainages). Morphological changes to the SW lava dome were due to continuing collapses of material. The Alert Level remained at 3 (on a scale of 1-4), and the public was warned to stay 3-7 km away from the summit based on location.
Source: Balai Penyelidikan dan Pengembangan Teknologi Kebencanaan Geologi (BPPTKG)
BPPTKG reported that the eruption at Merapi (on Java) continued during 9-15 June and seismicity remained at elevated levels. The SW lava dome produced 119 lava avalanches that traveled as far as 2 km down the SW flank (upstream in the Bebeng drainage). Morphological changes to the SW lava dome were due to continuing collapses of material. The Alert Level remained at 3 (on a scale of 1-4), and the public was warned to stay 3-7 km away from the summit based on location.
Source: Balai Penyelidikan dan Pengembangan Teknologi Kebencanaan Geologi (BPPTKG)
BPPTKG reported that the eruption at Merapi (on Java) continued during 2-8 June and seismicity remained at elevated levels. The SW lava dome produced 99 lava avalanches that traveled as far as 2 km down the SW flank (upstream in the Bebeng drainage). Morphological changes to the SW lava dome due to continuing collapses of material were evident in webcam images. The Alert Level remained at 3 (on a scale of 1-4), and the public was warned to stay 3-7 km away from the summit based on location.
Source: Balai Penyelidikan dan Pengembangan Teknologi Kebencanaan Geologi (BPPTKG)
BPPTKG reported that the eruption at Merapi (on Java) continued during 26 May-1 June and seismicity remained at elevated levels. The SW lava dome produced 155 lava avalanches that traveled as far as 2 km down the SW flank (upstream in the Bebeng and Boyong drainages) and one that traveled 500 m NW (upstream of the Senowo River). Morphological changes to the SW lava dome due to continuing collapses of material were evident in webcam images. The Alert Level remained at 3 (on a scale of 1-4), and the public was warned to stay 3-7 km away from the summit based on location.
Source: Balai Penyelidikan dan Pengembangan Teknologi Kebencanaan Geologi (BPPTKG)
BPPTKG reported that the eruption at Merapi (on Java) continued during 19-25 May and seismicity remained at elevated levels. The SW lava dome produced 236 minor lava avalanches that traveled as far as 2 km down the SW flank (upstream in the Bebeng and Boyong drainages). Morphological changes to the SW lava dome due to continuing collapses of material were evident in webcam and drone images. Based on a 17 May drone survey, the SW dome volume was an estimated 2,372,800 cubic meters and the dome in the main crater was an estimated 2,337,300 cubic meters. The Alert Level remained at 3 (on a scale of 1-4), and the public was warned to stay 3-7 km away from the summit based on location.
Source: Balai Penyelidikan dan Pengembangan Teknologi Kebencanaan Geologi (BPPTKG)
BPPTKG reported that the eruption at Merapi (on Java) continued during 12-18 May and seismicity remained at elevated levels. The SW lava dome produced 182 minor lava avalanches that traveled as far as 1.8 km down the SW flank (upstream in the Bebeng and Boyong drainages) and one that traveled 500 m NW (upstream of the Senowo River). Morphological changes to the SW lava dome due to continuing collapses of material were evident in webcam and drone images. The Alert Level remained at 3 (on a scale of 1-4), and the public was warned to stay 3-7 km away from the summit based on location.
Source: Balai Penyelidikan dan Pengembangan Teknologi Kebencanaan Geologi (BPPTKG)
BPPTKG reported that the eruption at Merapi (on Java) continued during 5-11 May and seismicity remained at elevated levels. The SW lava dome produced 106 lava avalanches that traveled as far as 1.8 km down the SW flank (upstream in the Bebeng drainages). Morphological changes to the SW lava dome due to continuing collapses of material were evident in webcam images. The Alert Level remained at 3 (on a scale of 1-4), and the public was warned to stay 3-7 km away from the summit based on location.
Source: Balai Penyelidikan dan Pengembangan Teknologi Kebencanaan Geologi (BPPTKG)
BPPTKG reported that the eruption at Merapi (on Java) continued during 28 April-4 May and seismicity remained at elevated levels. The SW lava dome produced 190 lava avalanches that traveled as far as 2.5 km down the SW flank (upstream in the Bebeng and Boyong drainages). One pyroclastic flow traveled 2.5 km down the Bebeng drainage. Morphological changes to the SW lava dome due to continuing collapses of material were evident in webcam images. The Alert Level remained at 3 (on a scale of 1-4), and the public was warned to stay 3-7 km away from the summit based on location.
Source: Balai Penyelidikan dan Pengembangan Teknologi Kebencanaan Geologi (BPPTKG)
BPPTKG reported that the eruption at Merapi (on Java) continued during 21-27 April and seismicity remained at elevated levels. The SW lava dome produced 148 lava avalanches that traveled as far as 2 km down the SW flank (upstream in the Bebeng and Boyong drainages). Morphological changes to the SW lava dome were evident in webcam images due to continuing collapses of material. The Alert Level remained at 3 (on a scale of 1-4), and the public was warned to stay 3-7 km away from the summit based on location.
Source: Balai Penyelidikan dan Pengembangan Teknologi Kebencanaan Geologi (BPPTKG)
BPPTKG reported that the eruption at Merapi (on Java) continued during 19-25 April and seismicity remained at high levels. The SW lava dome produced more than 80 lava avalanches that traveled as far as 2 km down the SW flank (upstream in the Bebeng and Boyong drainages). Morphological changes to the SW lava dome were evident in webcam images due to continuing collapses of material. The Alert Level remained at 3 (on a scale of 1-4), and the public was warned to stay 3-7 km away from the summit based on location.
Source: Balai Penyelidikan dan Pengembangan Teknologi Kebencanaan Geologi (BPPTKG)
BPPTKG reported that the eruption at Merapi (on Java) continued during 7-13 April and seismicity remained at high levels. The SW lava dome produced 132 lava avalanches that traveled as far as 2 km down the SW flank (upstream in the Bebeng and Boyong drainages). Morphological changes to the SW lava dome were evident in webcam images due to continuing collapses of material. The Alert Level remained at 3 (on a scale of 1-4), and the public was warned to stay 3-7 km away from the summit based on location.
Source: Balai Penyelidikan dan Pengembangan Teknologi Kebencanaan Geologi (BPPTKG)
BPPTKG reported that the eruption at Merapi (on Java) continued during 31 March-6 April and seismicity remained at high levels. The SW lava dome produced 79 lava avalanches that traveled as far as 1.8 km down the SW flank (upstream in the Bebeng and Boyong drainages). One pyroclastic flow traveled 1.1 km down the SW flank, upstream of the Bebeng drainage. Morphological changes to the SW lava dome were evident in webcam images due to continuing collapses of material. The Alert Level remained at 3 (on a scale of 1-4), and the public was warned to stay 3-7 km away from the summit based on location.
Source: Balai Penyelidikan dan Pengembangan Teknologi Kebencanaan Geologi (BPPTKG)
BPPTKG reported that the eruption at Merapi (on Java) continued during 24-30 March and seismicity remained at high levels. The SW lava dome produced 176 lava avalanches that traveled as far as 2 km down the SW flank (upstream in the Bebeng and Boyong drainages). Two pyroclastic flows traveled 1 km down the SW flank, upstream of the Boyong drainage. Morphological changes to the SW lava dome were evident in webcam images due to continuing collapses of material. The Alert Level remained at 3 (on a scale of 1-4), and the public was warned to stay 3-7 km away from the summit based on location.
Source: Balai Penyelidikan dan Pengembangan Teknologi Kebencanaan Geologi (BPPTKG)
BPPTKG reported that the eruption at Merapi (on Java) continued during 17-23 March and seismicity remained at high levels. The SW lava dome produced 160 lava avalanches that traveled as far as 1.8 km down the SW flank (upstream in the Bebeng and Boyong drainages). Two pyroclastic flows traveled 1.3 km down the SW flank, upstream of the Bebeng/Krasak drainage. Morphological changes to the SW lava dome were evident in webcam images due to continuing collapses of material, though the volume remained unchanged at 1,686,200 cubic meters. The Alert Level remained at 3 (on a scale of 1-4), and the public was warned to stay 3-7 km away from the summit based on location.
Source: Balai Penyelidikan dan Pengembangan Teknologi Kebencanaan Geologi (BPPTKG)
BPPTKG summarized the eruption at Merapi (on Java) during 10-16 March, including the collapses at the SW lava dome that began on 11 March and continued through the week. A total of 68 pyroclastic flows traveled as far as 4 km down the Bebeng and Krasak drainages on the SW flank. The largest pyroclastic flows were recorded during 11-12 March, which caused ashfall of varying intensity in areas to the W, NW, and N including in Dukun District, Sawangan, Magelang Regency; Magelang City; Selo District, Boyolali Regency; Ambarawa, Jambu, Sumowono, Pringapus, Banyubiru, Bawen Districts, Semarang Regency. Morphological changes to the SW lava domes were evident in webcam and drone images. The volume of the dome before 11 March was 2,759,100 cubic meters and by 13 March the dome volume had decreased to 1,686,200 cubic meters, with an estimate volume loss of 1,072,800 cubic meters. The volume of the summit dome remained unchanged and was estimated at 2,312,100 cubic meters.
According to the Darwin VAAC ash plumes were visible in webcam images on 15 and 17 March rising as high as 1.2 km above the summit and drifting S and W, respectively. On both days weather conditions prevented satellite image views. During 16-20 March BPPTKG reported 14-38 daily counts of lava avalanches with material descending the SW flank as far as 1.8 km. Daily counts were not available for 17 March, though incandescent avalanches were visible in webcam footage; rainy weather sometimes prevented visual observations. The Alert Level remained at 3 (on a scale of 1-4), and the public was warned to stay 3-7 km away from the summit based on location.
Sources: Balai Penyelidikan dan Pengembangan Teknologi Kebencanaan Geologi (BPPTKG); Darwin Volcanic Ash Advisory Centre (VAAC)
BPPTKG reported that the eruption at Merapi (on Java) continued during 3-9 March and seismicity remained at high levels. The SW lava dome produced 19 lava avalanches that traveled as far as 1.7 km down the SW flank (upstream in the Bebeng, Boyong, and Sat/Putih drainages). No significant morphological changes to the central and SW lava domes were evident in webcam images.
Activity increased on 11 March with collapses of the SW lava dome. During 1212-1500 a series of 21 lava avalanches from the SW lava dome produced pyroclastic flows that traveled less than 4 km down the Bebeng and Krasak drainages. Ash plumes rose from the dome and in dense “curtains” from along the pyroclastic-flow deposits on the SW flank. The ash plumes rose as high as 3 km above the summit during 1212-1306 and drifted W and NW, causing ashfall in several areas downwind, especially in Magelang.
Avalanches and pyroclastic flows from additional collapses continued to be recorded on 12 March. A total of 15 avalanches descended the SW flank as far as 2.5 km and 21 pyroclastic flows traveled a maximum distance of 2 km SW. White-and-gray ash plumes of variable densities rose as high as 2.5 km above the summit and drifted N, NW, W, and E based on Darwin VAAC notices and PVGHM VONAs. A drone was deployed to inspect the SW dome and flank, the deposits, and the summit dome; the end of the pyroclastic-flow deposits in the Bebeng drainage was 3.7 km from the center of the summit crater. By early on 13 March a total of 60 pyroclastic flows had been mainly channeled down the Bebeng.
On 13 March there was a total of 36 lava avalanches; two pyroclastic flows went as far as 1.5 km down the SW flank. The Darwin VAAC reported that at 0100, 0630, and 0900 ash plumes rose as high as 4.3 km (14,000 ft) a.s.l., or 1.4 km above the summit, and drifted NW. A VONA issued on 14 March described a gray-and-brown ash plume that rose 2.5 km above the summit and drifted E and SE. The Alert Level remained at 3 (on a scale of 1-4), and the public was warned to stay 3-7 km away from the summit based on location.
Sources: Balai Penyelidikan dan Pengembangan Teknologi Kebencanaan Geologi (BPPTKG); Pusat Vulkanologi dan Mitigasi Bencana Geologi (PVMBG, also known as CVGHM); Darwin Volcanic Ash Advisory Centre (VAAC)
BPPTKG reported that the eruption at Merapi (on Java) continued during 24 February-2 March and seismicity remained at high levels. The SW lava dome produced two lava avalanches that traveled as far as 1 km down the SW flank (upstream in the Bebeng and Boyong drainages). No significant morphological changes to the central and SW lava domes were evident in webcam images. The Alert Level remained at 3 (on a scale of 1-4), and the public was warned to stay 3-7 km away from the summit based on location.
Source: Balai Penyelidikan dan Pengembangan Teknologi Kebencanaan Geologi (BPPTKG)
BPPTKG reported that the eruption at Merapi (on Java) continued during 17-23 February and seismicity remained at high levels. The SW lava dome produced 11 lava avalanches that traveled as far as 1.7 km down the SW flank (upstream in the Bebeng and Boyong drainages). No significant morphological changes to the central and SW lava domes were evident in webcam images. An avalanche from the weathered and altered 1998 lava wall was visible in webcam images on 10 February. The Alert Level remained at 3 (on a scale of 1-4), and the public was warned to stay 3-7 km away from the summit based on location.
Source: Balai Penyelidikan dan Pengembangan Teknologi Kebencanaan Geologi (BPPTKG)
BPPTKG reported that the eruption at Merapi (on Java) continued during 10-16 February and seismicity remained at high levels. The SW lava dome produced two lava avalanches that traveled as far as 1.7 km down the SW flank (upstream in the Kali Sat drainage). No significant morphological changes to the central and SW lava domes were evident in webcam images. The Alert Level remained at 3 (on a scale of 1-4), and the public was warned to stay 3-7 km away from the summit based on location.
Source: Balai Penyelidikan dan Pengembangan Teknologi Kebencanaan Geologi (BPPTKG)
BPPTKG reported that the eruption at Merapi continued during 3-9 February and seismicity remained at high levels. The SW lava dome produced five lava avalanches that traveled as far as 1.8 km down the SW flank (upstream in the Kali Bebeng drainage) and one pyroclastic flow traveled 1.5 km SW (on 8 February). No significant morphological changes to the central and SW lava domes were evident in webcam images. The Alert Level remained at 3 (on a scale of 1-4), and the public was warned to stay 3-7 km away from the summit based on location.
Source: Balai Penyelidikan dan Pengembangan Teknologi Kebencanaan Geologi (BPPTKG)
BPPTKG reported that the eruption at Merapi continued during 27 January-2 February and seismicity remained at high levels. The SW lava dome produced six lava avalanches that traveled as far as 1.8 km down the SW flank (upstream in the Kali Bebeng drainage); occasional avalanche sounds were recorded. No significant morphological changes to the central and SW lava domes were evident in webcam images. At 0710 on 8 February a pyroclastic flow traveled 1.5 km down the Boyong drainage on the SW flank. Ashfall was reported in areas downwind including Sangup, Musuk, and Mriyan. The Alert Level remained at 3 (on a scale of 1-4), and the public was warned to stay 3-7 km away from the summit based on location.
Source: Balai Penyelidikan dan Pengembangan Teknologi Kebencanaan Geologi (BPPTKG)
BPPTKG reported that the eruption at Merapi continued during 20-26 January and seismicity remained at high levels. The SW lava dome produced 14 lava avalanches that traveled as far as 1.8 km down the SW flank (upstream in the Kali Bebeng drainage). Avalanche sounds were heard on seven occasions. No significant morphological changes at the SW dome were observed but the central dome decreased in height based on webcam images. The Alert Level remained at 3 (on a scale of 1-4), and the public was warned to stay 3-7 km away from the summit based on location.
Source: Balai Penyelidikan dan Pengembangan Teknologi Kebencanaan Geologi (BPPTKG)
BPPTKG reported that the eruption at Merapi continued during 12-19 January and seismicity remained at high levels. The SW lava dome produced three lava avalanches that traveled as far as 1.2 km down the SW flank (upstream in the Kali Bebeng drainage). Avalanche sounds were heard on six occasions. No significant morphological changes to the central and SW lava domes were evident in webcam images. The Alert Level remained at 3 (on a scale of 1-4), and the public was warned to stay 3-7 km away from the summit based on location.
Source: Balai Penyelidikan dan Pengembangan Teknologi Kebencanaan Geologi (BPPTKG)
BPPTKG reported that the eruption at Merapi continued during 6-12 January and seismicity remained at high levels. The SW lava dome produced three lava avalanches that traveled as far as 1.2 km down the SW flank (upstream in the Kali Bebeng drainage). Avalanche sounds were heard on six occasions. No significant morphological changes to the central and SW lava domes were evident in webcam images. The Alert Level remained at 3 (on a scale of 1-4), and the public was warned to stay 3-7 km away from the summit based on location.
Source: Balai Penyelidikan dan Pengembangan Teknologi Kebencanaan Geologi (BPPTKG)
BPPTKG reported that the eruption at Merapi continued during 30 December 2022-5 January 2023 and seismicity remained at high levels. The SW lava dome produced eight lava avalanches that traveled as far as 1.5 km down the SW flank (upstream in the Kali Bebeng drainage). One pyroclastic flow descended 900 m SW. No significant morphological changes to the central and SW lava domes were evident in webcam images. The Alert Level remained at 3 (on a scale of 1-4), and the public was warned to stay 3-7 km away from the summit based on location.
Source: Balai Penyelidikan dan Pengembangan Teknologi Kebencanaan Geologi (BPPTKG)
BPPTKG reported that the eruption at Merapi continued during 23-29 December and seismicity remained at high levels. The SW lava dome produced two lava avalanches that traveled as far as 1.5 km down the SW flank (upstream in the Kali Bebeng drainage) and were heard from the Babadan observation post. No significant morphological changes to the central and SW lava domes were evident. The Alert Level remained at 3 (on a scale of 1-4), and the public was warned to stay 3-7 km away from the summit based on location.
Source: Balai Penyelidikan dan Pengembangan Teknologi Kebencanaan Geologi (BPPTKG)
BPPTKG reported that the eruption at Merapi continued during 16-22 December and seismicity remained at high levels. The SW lava dome produced three lava avalanches that traveled as far as 1.5 km down the SW flank (upstream in the Kali Bebeng drainage). Sounds of falling material were noted four times. No significant morphological changes to the central and SW lava domes were evident. The Alert Level remained at 3 (on a scale of 1-4), and the public was warned to stay 3-7 km away from the summit based on location.
Source: Balai Penyelidikan dan Pengembangan Teknologi Kebencanaan Geologi (BPPTKG)
BPPTKG reported that the eruption at Merapi continued during 9-15 December and seismicity remained at high levels. The SW lava dome produced four lava avalanches that traveled as far as 1.5 km down the SW flank (upstream in the Kali Bebeng drainage). No significant morphological changes to the central and SW lava domes were evident. The Alert Level remained at 3 (on a scale of 1-4), and the public was warned to stay 3-7 km away from the summit based on location.
Source: Balai Penyelidikan dan Pengembangan Teknologi Kebencanaan Geologi (BPPTKG)
BPPTKG reported that the eruption at Merapi continued during 2-8 December and seismicity remained at high levels. The SW lava dome produced two lava avalanches that traveled as far as 1.6 km down the SW flank (upstream in the Kali Bebeng drainage). No significant morphological changes to the central and SW lava domes were evident. The Alert Level remained at 3 (on a scale of 1-4), and the public was warned to stay 3-7 km away from the summit based on location.
Source: Balai Penyelidikan dan Pengembangan Teknologi Kebencanaan Geologi (BPPTKG)
BPPTKG reported that the eruption at Merapi continued during 25 November-1 December and seismicity remained at high levels. The SW lava dome produced five lava avalanches that traveled as far as 1.5 km down the SW flank (upstream in the Kali Bebeng drainage). No significant morphological changes to the central and SW lava domes were evident. The Alert Level remained at 3 (on a scale of 1-4), and the public was warned to stay 3-7 km away from the summit based on location.
Source: Balai Penyelidikan dan Pengembangan Teknologi Kebencanaan Geologi (BPPTKG)
BPPTKG reported that the eruption at Merapi continued during 18-24 November and seismicity remained at high levels. The SW lava dome produced 13 lava avalanches that traveled as far as 1.6 km down the SW flank (upstream in the Kali Bebeng drainage). No significant morphological changes to the central and SW lava domes were evident. According to the Darwin VAAC an ash plume rose to 4.6 km (15,000 ft) a.s.l. and drifted SW on 25 November. The Alert Level remained at 3 (on a scale of 1-4), and the public was warned to stay 3-7 km away from the summit based on location.
Sources: Balai Penyelidikan dan Pengembangan Teknologi Kebencanaan Geologi (BPPTKG); Darwin Volcanic Ash Advisory Centre (VAAC)
BPPTKG reported that the eruption at Merapi continued during 9-15 November and seismicity remained at high levels. Cloudy often prevented clear visuals of the summit. A seismogram detected a pyroclastic flow at 0905 on 11 November that lasted 135 seconds; it descended 1 km down the Boyong drainage (SW), though webcam images were cloudy. A second pyroclastic flow occurred at 1208 on the same day, lasting 104 seconds and descending 1 km down the Boyong drainage (SW). On 12 November a lava avalanche traveled as far as 800 m down the SW flank. Two lava avalanches were observed descending the SW for 1.5 km on 15 November. The Alert Level remained at 3 (on a scale of 1-4), and the public was warned to stay 3-7 km away from the summit based on location.
Source: Balai Penyelidikan dan Pengembangan Teknologi Kebencanaan Geologi (BPPTKG)
BPPTKG reported that the eruption at Merapi continued during 28 October-3 November and seismicity remained at high levels. The SW lava dome produced lava avalanches that traveled as far as 1.2 km down the W flank (upstream in the Kali Sat drainage). No significant morphological changes to the central and SW lava domes were evident in drone photographs. The Alert Level remained at 3 (on a scale of 1-4), and the public was warned to stay 3-7 km away from the summit based on location.
Source: Balai Penyelidikan dan Pengembangan Teknologi Kebencanaan Geologi (BPPTKG)
BPPTKG reported that the eruption at Merapi continued during 21-27 October and seismicity remained at high levels. The SW lava dome produced as many as 14 minor lava avalanches that traveled as far as 1.5 km down the Bebeng drainage on the SW flank. No significant morphological changes to the central and SW lava domes were evident in drone photographs. The Alert Level remained at 3 (on a scale of 1-4), and the public was warned to stay 3-7 km away from the summit based on location.
Source: Balai Penyelidikan dan Pengembangan Teknologi Kebencanaan Geologi (BPPTKG)
BPPTKG reported that the eruption at Merapi continued during 14-20 October and seismicity remained at high levels. The SW lava dome produced as many as five minor lava avalanches that traveled up to 1.8 km down the Bebeng drainage on the SW flank. No significant morphological changes to the central and SW lava domes were evident in drone photographs. The Alert Level remained at 3 (on a scale of 1-4), and the public was warned to stay 3-7 km away from the summit based on location.
Source: Balai Penyelidikan dan Pengembangan Teknologi Kebencanaan Geologi (BPPTKG)
BPPTKG reported that the eruption at Merapi continued during 7-13 October and seismicity remained at high levels. The SW lava dome produced as many as seven lava avalanches that traveled as far as 1.5 km down the Bebeng drainage on the SW flank. No significant morphological changes to the central and SW lava domes were evident in drone photographs. The Alert Level remained at 3 (on a scale of 1-4), and the public was warned to stay 3-7 km away from the summit based on location.
Source: Balai Penyelidikan dan Pengembangan Teknologi Kebencanaan Geologi (BPPTKG)
BPPTKG reported that the eruption at Merapi continued during 30 September-6 October and seismicity remained at high levels. The SW lava dome produced as many as five lava avalanches that traveled as far as 1.8 km down the Bebeng drainage on the SW flank, and one that traveled 800 m down the W flank upstream of upstream of Kali Putih. No significant morphological changes to the central and SW lava domes were evident in drone photographs, though both domes continued to grow. The Alert Level remained at 3 (on a scale of 1-4), and the public was warned to stay 3-7 km away from the summit based on location.
Source: Balai Penyelidikan dan Pengembangan Teknologi Kebencanaan Geologi (BPPTKG)
BPPTKG reported that the eruption at Merapi continued during 23-29 September and seismicity remained at high levels. As many as seven lava avalanches from the SW lava dome traveled down the Bebeng drainage on the SW flank, reaching a maximum distance of 1.8 km. No morphological changes to the central lava domes were evident in photographs, while the SW dome grew about 1 m taller. The Alert Level remained at 3 (on a scale of 1-4), and the public was warned to stay 3-7 km away from the summit based on location.
Source: Balai Penyelidikan dan Pengembangan Teknologi Kebencanaan Geologi (BPPTKG)
BPPTKG reported that the eruption at Merapi continued during 16-22 September and seismicity remained at high levels. As many as 13 lava avalanches from the SW lava dome traveled down the Bebeng drainage on the SW flank, reaching a maximum distance of 1.9 km. No morphological changes to the SW and central lava domes were evident in photographs. The Alert Level remained at 3 (on a scale of 1-4), and the public was warned to stay 3-7 km away from the summit based on location.
Source: Balai Penyelidikan dan Pengembangan Teknologi Kebencanaan Geologi (BPPTKG)
BPPTKG reported that the eruption at Merapi continued during 9-15 September and seismicity remained at high levels. As many as 13 lava avalanches from the SW lava dome traveled down the Bebeng drainage on the SW flank, reaching a maximum distance of 1.8 km. No morphological changes to the SW and central lava domes were evident in photographs. The Alert Level remained at 3 (on a scale of 1-4), and the public was warned to stay 3-7 km away from the summit based on location.
Source: Balai Penyelidikan dan Pengembangan Teknologi Kebencanaan Geologi (BPPTKG)
BPPTKG reported that the eruption at Merapi continued during 2-8 September and seismicity remained at elevated levels. As many as 20 lava avalanches from the SW lava dome traveled down the Bebeng drainage on the SW flank, reaching a maximum distance of 1.7 km. No morphological changes to the SW and central lava domes were evident in photographs. The Alert Level remained at 3 (on a scale of 1-4), and the public was warned to stay 3-7 km away from the summit based on location.
Source: Balai Penyelidikan dan Pengembangan Teknologi Kebencanaan Geologi (BPPTKG)
BPPTKG reported that the eruption at Merapi continued during 26 August-1 September and seismicity remained at elevated levels. As many as 13 lava avalanches from the SW lava dome traveled down the Bebeng drainage on the SW flank, reaching a maximum distance of 2 km. The SW lava dome had continued to grow, and had an estimated volume of 1.62 million cubic meters based on 29 August aerial photographs. The Alert Level remained at 3 (on a scale of 1-4), and the public was warned to stay 3-7 km away from the summit based on location.
Source: Balai Penyelidikan dan Pengembangan Teknologi Kebencanaan Geologi (BPPTKG)
BPPTKG reported that the eruption at Merapi continued during 19-25 August. Seismicity intensified compared to the previous week; in particular the number of deep volcanic earthquakes increased and indicated magmatic activity at depths less than 1.5 km. As many as 19 lava avalanches traveled down the Bebeng drainage on the SW flank, reaching a maximum distance of 1.8 km. Photo analyses showed no height changes at the SW and central lava domes, though some changes at the SW dome were observed due to avalanche activity. The Alert Level remained at 3 (on a scale of 1-4), and the public was warned to stay 3-7 km away from the summit based on location.
Source: Balai Penyelidikan dan Pengembangan Teknologi Kebencanaan Geologi (BPPTKG)
BPPTKG reported that the eruption at Merapi continued during 12-18 August and seismicity remained at high levels. As many as 23 lava avalanches traveled down the Bebeng drainage on the SW flank, reaching a maximum distance of 1.8 km. Photo analyses showed no changes at the SW and central lava domes. The Alert Level remained at 3 (on a scale of 1-4), and the public was warned to stay 3-7 km away from the summit based on location.
Source: Balai Penyelidikan dan Pengembangan Teknologi Kebencanaan Geologi (BPPTKG)
BPPTKG reported that the eruption at Merapi continued during 5-11 August and seismicity remained at high levels. As many as 43 lava avalanches traveled down the Bebeng drainage on the SW flank, reaching a maximum distance of 1.5 km. The Alert Level remained at 3 (on a scale of 1-4), and the public was warned to stay 3-7 km away from the summit based on location.
Source: Balai Penyelidikan dan Pengembangan Teknologi Kebencanaan Geologi (BPPTKG)
BPPTKG reported that the eruption at Merapi continued during 29 July-4 August. Seismicity remained at high levels. As many as 34 lava avalanches traveled down the Bebeng drainage on the SW flank, reaching a maximum distance of 1.8 km. The volumes of both the SW and central lava domes were unchanged based on photo analyses. The Alert Level remained at 3 (on a scale of 1-4), and the public was warned to stay 3-7 km away from the summit based on location.
Source: Balai Penyelidikan dan Pengembangan Teknologi Kebencanaan Geologi (BPPTKG)
BPPTKG reported that the eruption at Merapi continued during 22-28 July. Based on photo analyses, the volumes of both the SW and central lava domes had increased, with recent volume estimates of 1.67 and 2.79 million cubic meters, respectively. Seismicity remained at high levels. As many as 47 lava avalanches traveled down the Bebeng drainage on the SW flank, reaching a maximum distance of 1.8 km. The Alert Level remained at 3 (on a scale of 1-4), and the public was warned to stay 3-7 km away from the summit based on location.
Source: Balai Penyelidikan dan Pengembangan Teknologi Kebencanaan Geologi (BPPTKG)
BPPTKG reported that the eruption at Merapi continued during 15-21 July. The heights and morphologies of the SW and central lava domes were unchanged from the previous week, and seismicity remained at high levels. As many as 22 lava avalanches traveled down the Bebeng drainage on the SW flank, reaching a maximum distance of 1.8 km. The Alert Level remained at 3 (on a scale of 1-4), and the public was warned to stay 3-7 km away from the summit based on location.
Source: Balai Penyelidikan dan Pengembangan Teknologi Kebencanaan Geologi (BPPTKG)
BPPTKG reported that the eruption at Merapi continued during 8-14 July. The heights and morphologies of the SW and central lava domes were unchanged from the previous week, and seismicity remained at high levels. As many as 43 lava avalanches traveled down the Bebeng drainage on the SW flank, reaching a maximum distance of 2 km. The Alert Level remained at 3 (on a scale of 1-4), and the public was warned to stay 3-7 km away from the summit based on location.
Source: Balai Penyelidikan dan Pengembangan Teknologi Kebencanaan Geologi (BPPTKG)
BPPTKG reported that the eruption at Merapi continued during 1-7 July. The heights and morphologies of the SW and central lava domes were unchanged from the previous week, and seismicity remained at high levels. As many as 60 lava avalanches traveled down the Bebeng drainage on the SW flank, reaching a maximum distance of 2 km. The Alert Level remained at 3 (on a scale of 1-4), and the public was warned to stay 3-7 km away from the summit based on location.
Source: Balai Penyelidikan dan Pengembangan Teknologi Kebencanaan Geologi (BPPTKG)
BPPTKG reported that the eruption at Merapi continued during 24-30 June. The heights and morphologies of the SW and central lava domes were unchanged from the previous week, and seismicity remained at high levels. As many as 69 lava avalanches traveled down the Bebeng drainage on the SW flank, reaching a maximum distance of 1.8 km. The Alert Level remained at 3 (on a scale of 1-4), and the public was warned to stay 3-7 km away from the summit based on location.
Source: Balai Penyelidikan dan Pengembangan Teknologi Kebencanaan Geologi (BPPTKG)
BPPTKG reported that the eruption at Merapi continued during 17-23 June. The heights and morphologies of the SW lava dome and the central lava dome were unchanged from the previous week, and seismicity remained at high levels. As many as 70 lava avalanches traveled down the Bebeng drainage on the SW flank, reaching a maximum distance of 1.8 km. Seismicity remained high. The Alert Level remained at 3 (on a scale of 1-4), and the public was warned to stay 3-7 km away from the summit based on location.
Source: Balai Penyelidikan dan Pengembangan Teknologi Kebencanaan Geologi (BPPTKG)
BPPTKG reported that the eruption at Merapi continued during 10-16 June. The heights and morphologies of the SW lava dome and the central lava dome were unchanged from the previous week, and seismicity remained at high levels. As many as 58 lava avalanches traveled down the Bebeng drainage on the SW flank, reaching a maximum distance of 1.8 km. Seismicity remained high. The Alert Level remained at 3 (on a scale of 1-4), and the public was warned to stay 3-7 km away from the summit based on location.
Source: Balai Penyelidikan dan Pengembangan Teknologi Kebencanaan Geologi (BPPTKG)
BPPTKG reported that the eruption at Merapi continued during 3-9 June. The heights and morphologies of the SW lava dome and the central lava dome were unchanged from the previous week, and seismicity remained at high levels. As many as 75 lava avalanches, reaching a maximum distance of 2 km, traveled down the Bebeng drainage on the SW flank. Seismicity remained high. The Alert Level remained at 3 (on a scale of 1-4), and the public was warned to stay 3-7 km away from the summit based on location.
Source: Balai Penyelidikan dan Pengembangan Teknologi Kebencanaan Geologi (BPPTKG)
BPPTKG reported that the eruption at Merapi continued during 27 May-2 June. The heights and morphologies of the SW lava dome and the central lava dome were unchanged from the previous week, and seismicity remained at high levels. As many as 101 lava avalanches, reaching a maximum distance of 1.8 km, traveled down the Bebeng drainage on the SW flank. One pyroclastic flow also traveled 1.8 km down the Bebeng drainage. Seismicity remained high. The Alert Level remained at 3 (on a scale of 1-4), and the public was warned to stay 3-7 km away from the summit based on location.
Source: Balai Penyelidikan dan Pengembangan Teknologi Kebencanaan Geologi (BPPTKG)
BPPTKG reported that the eruption at Merapi continued during 20-26 May. The heights and morphologies of the SW lava dome and the central lava dome were unchanged from the previous week, and seismicity remained at high levels. As many as 144 lava avalanches traveled a maximum of 2 km down the Bebeng drainage on the SW flank. Three pyroclastic flows traveled 2 km down the Bebeng drainage. Seismicity remained high. The Alert Level remained at 3 (on a scale of 1-4), and the public was warned to stay 3-7 km away from the summit based on location.
Source: Balai Penyelidikan dan Pengembangan Teknologi Kebencanaan Geologi (BPPTKG)
BPPTKG reported that the eruption at Merapi continued during 13-19 May. The heights and morphologies of the SW lava dome and the central lava dome were unchanged from the previous week, and seismicity remained at high levels. As many as 82 lava avalanches traveled a maximum of 2 km, mostly down the Bebeng drainage on the SW flank. One pyroclastic flow traveled 2.5 km down the Bebeng drainage. Seismicity remained high. The Alert Level remained at 3 (on a scale of 1-4), and the public was warned to stay 3-7 km away from the summit based on location.
Source: Balai Penyelidikan dan Pengembangan Teknologi Kebencanaan Geologi (BPPTKG)
BPPTKG reported no significant morphological changes at Merapi’s summit lava dome during 6-12 May, though the height of the dome below the SW rim had increased by around 2 m. As many as 92 lava avalanches traveled a maximum of 2 km, mostly down the Bebeng drainage on the SW flank. Two pyroclastic flows traveled 2 km down the Bebeng drainage. Seismicity remained high. The Alert Level remained at 3 (on a scale of 1-4), and the public was warned to stay 3-7 km away from the summit based on location.
Source: Balai Penyelidikan dan Pengembangan Teknologi Kebencanaan Geologi (BPPTKG)
BPPTKG reported no significant morphological changes at Merapi’s summit lava dome during 29 April-5 May, though the height of the dome below the SW rim had decreased by around 3 m. Based on photo analyses, the volume of the SW lava dome had a volume of 1.52 million cubic meters while the central lava dome was 2.58 million cubic meters. As many as 120 lava avalanches traveled a maximum of 2 km, mostly down the Bebeng drainage on the SW flank. Seismicity remained high. The Alert Level remained at 3 (on a scale of 1-4), and the public was warned to stay 3-7 km away from the summit based on location.
Source: Balai Penyelidikan dan Pengembangan Teknologi Kebencanaan Geologi (BPPTKG)
BPPTKG reported that the eruption at Merapi continued during 22-28 April. The heights and morphologies of the SW lava dome and the central lava dome were unchanged from the previous week, and seismicity remained at high levels. As many as 102 lava avalanches traveled a maximum of 2 km, mostly down the Bebeng drainage on the SW flank. The Alert Level remained at 3 (on a scale of 1-4), and the public was warned to stay 3-7 km away from the summit based on location.
Source: Balai Penyelidikan dan Pengembangan Teknologi Kebencanaan Geologi (BPPTKG)
BPPTKG reported that the eruption at Merapi continued during 15-21 April. The heights and morphologies of the SW lava dome and the central lava dome were unchanged from the previous week, and seismicity remained at high levels. As many as 150 lava avalanches traveled a maximum of 2 km mostly down the Bebeng drainage on the SW flank. One pyroclastic flows traveled 2 km SW down the Bebeng. The Alert Level remained at 3 (on a scale of 1-4), and the public was warned to stay 3-7 km away from the summit based on location.
Source: Balai Penyelidikan dan Pengembangan Teknologi Kebencanaan Geologi (BPPTKG)
BPPTKG reported that the eruption at Merapi continued during 8-14 April. The volumes of the SW lava dome and the central lava dome were unchanged from the previous week, and seismicity remained at high levels. As many as 112 lava avalanches originating from two areas on the SW dome traveled a maximum of 2 km down the Bebeng drainage on the SW flank. The Alert Level remained at 3 (on a scale of 1-4), and the public was warned to stay 3-7 km away from the summit based on location.
Source: Balai Penyelidikan dan Pengembangan Teknologi Kebencanaan Geologi (BPPTKG)
BPPTKG reported no significant morphological changes at Merapi’s summit lava dome during 1-7 April. Based on photo analyses, the volume of the SW lava dome was 1.7 million cubic meters while the central lava dome was 2.6 million cubic meters. Seismicity remained at high levels. As many as 144 lava avalanches originating from the SW dome traveled a maximum of 2 km down the Bebeng drainage on the SW flank. A single pyroclastic flow traveled 1.5 km down the SW flank. The Alert Level remained at 3 (on a scale of 1-4), and the public was warned to stay 3-5 km away from the summit based on location.
Source: Balai Penyelidikan dan Pengembangan Teknologi Kebencanaan Geologi (BPPTKG)
BPPTKG reported no significant morphological changes at Merapi’s summit lava dome during 25-31 March, though the height of the dome below the SW rim had increased by 4 m. Based on photo analyses, the volume of the SW lava dome had a volume of 1.7 million cubic meters while the central lava dome was 2.6 million cubic meters. Seismicity remained at high levels. As many as 118 lava avalanches originating from the SW dome traveled a maximum of 2.5 km down the Bebeng drainage on the SW flank. On 28 March two pyroclastic flows were recorded on a seismogram that descended 2.5 km SW, one of which occurred at 1509. On 1 April a pyroclastic flow at 1500 descended 1.5 km down the SW flank. Based webcam, satellite, and wind data, the Darwin VAAC reported re-suspended ash that rose to 100 m (300 ft) a.s.l. As many as 37 avalanches were detected, but the distance and direction were not observed. The Alert Level remained at 3 (on a scale of 1-4), and the public was warned to stay 3-5 km away from the summit based on location.
Sources: Balai Penyelidikan dan Pengembangan Teknologi Kebencanaan Geologi (BPPTKG); Darwin Volcanic Ash Advisory Centre (VAAC)
BPPTKG reported no significant morphological changes at Merapi’s summit lava dome during 18-24 March, but the height of the dome below the SW rim had increased by 4 m. Seismicity remained at high levels; the intensity of the signals had increased compared to the previous week. As many as 51 lava avalanches originating from the SW dome traveled a maximum of 2 km down the Bebeng drainage on the SW flank. Six pyroclastic flows traveled as far as 2.5 km. Minor ashfall was reported in the Selo District. The Alert Level remained at 3 (on a scale of 1-4), and the public was warned to stay 3-5 km away from the summit based on location.
Source: Balai Penyelidikan dan Pengembangan Teknologi Kebencanaan Geologi (BPPTKG)
BPPTKG reported no significant morphological changes at Merapi’s summit lava dome during 11-17 March, but the height of the dome below the SW rim had decreased by 2 m. Seismicity remained at high levels; the intensity of the signals had increased compared to the previous week. As many as 119 lava avalanches originating from the SW dome traveled a maximum of 2 km down the Bebeng drainage on the SW flank. Four avalanches traveled no more than 1 km SE down the Gendol drainage. The Alert Level remained at 3 (on a scale of 1-4), and the public was warned to stay 3-5 km away from the summit based on location.
Source: Balai Penyelidikan dan Pengembangan Teknologi Kebencanaan Geologi (BPPTKG)
BPPTKG reported that parts of Merapi’s summit lava dome collapsed during 9-10 March, sending pyroclastic flows as far as 5 km SE down the Gendol drainage. At around 2318 on 9 March ash plumes rose at least 3 km above the summit and drifted SE. Ashfall was reported in several villages downwind, including in the Kemalang, Sawangan, Dukun, and Selo sub-districts, and 50 people from Bale Rante Village evacuated. The total volume that collapsed was an estimated 646,000 cubic meters, making the volume of the remaining dome material about 2,582,000 cubic meters.
Overall, during 4-10 March, there was a total of 101 lava avalanches and one pyroclastic flow that descended the Bebeng drainage on the SW flank a maximum distance of 2 km. Extrusion at the SW lava dome continued; the volume of the dome was an estimated 1.58 million cubic meters, similar to the previous few weeks. Pyroclastic flows in the Gendol drainage totaled 18 during the week, and there were 17 lava avalanches that traveled as far as 1.5 km. Seismicity remained at high levels with an increase in the intensity of signals. The Alert Level remained at 3 (on a scale of 1-4), and the public was warned to stay 3-5 km away from the summit based on location.
Sources: Balai Penyelidikan dan Pengembangan Teknologi Kebencanaan Geologi (BPPTKG); Badan Nacional Penanggulangan Bencana (BNPB)
BPPTKG reported no significant morphological changes at Merapi’s summit lava dome during 25 February-3 March but there had been collapses at the SW dome, located just below the SW rim. Seismicity remained at high levels. As many as 73 lava avalanches traveled a maximum of 2 km down the Bebeng drainage on the SW flank. The Alert Level remained at 3 (on a scale of 1-4), and the public was warned to stay 3-5 km away from the summit based on location.
Source: Balai Penyelidikan dan Pengembangan Teknologi Kebencanaan Geologi (BPPTKG)
BPPTKG reported that both of Merapi’s two lava domes, situated just below the SW rim and in the summit crater, effused lava during 18-24 February. Based on analysis of drone data the volumes of the SW and central domes were an estimated 1.58 and 3.23 million cubic meters, respectively. Seismicity remained at high levels. In the SW-flank Bebeng drainage there were as many as 173 lava avalanches that traveled a maximum of 2 km and one pyroclastic flow that extended 1.8 km. Minor ashfall was reported in the Pakem District on 18 February. The Alert Level remained at 3 (on a scale of 1-4), and the public was warned to stay 3-5 km away from the summit based on location.
Source: Balai Penyelidikan dan Pengembangan Teknologi Kebencanaan Geologi (BPPTKG)
BPPTKG reported no significant morphological changes at Merapi’s lava domes, located just below the SW rim and in the summit crater, during 11-17 February. Seismicity remained at high levels. In the SW-flank Bebeng drainage there were as many as 105 lava avalanches that traveled a maximum of 2 km and three pyroclastic flows that extended 2.8 km. The Alert Level remained at 3 (on a scale of 1-4), and the public was warned to stay 3-5 km away from the summit based on location.
Source: Balai Penyelidikan dan Pengembangan Teknologi Kebencanaan Geologi (BPPTKG)
BPPTKG reported no significant morphological changes at Merapi’s lava domes, located just below the SW rim and in the summit crater, during 4-10 February. Seismicity remained at high levels. In the SW-flank Bebeng drainage there were as many as 133 lava avalanches that traveled a maximum of 2 km and three pyroclastic flows that extended 2 km. Ashfall was reported in multiple areas within about 20 km to the S, SE, and E including the Cangkringan, Sleman and Musuk districts. The Alert Level remained at 3 (on a scale of 1-4), and the public was warned to stay 3-5 km away from the summit based on location.
Source: Balai Penyelidikan dan Pengembangan Teknologi Kebencanaan Geologi (BPPTKG)
BPPTKG reported no significant morphological changes at Merapi’s lava domes, located just below the SW rim and in the summit crater, during 28 January-3 February. Seismicity remained at high levels and earthquakes were more intense than the previous week. In the SW-flank Bebeng drainage there were as many as 133 lava avalanches that traveled a maximum of 2 km and two pyroclastic flows that extended 2-2.5 km; one lava avalanche also went 300 m NW. The Alert Level remained at 3 (on a scale of 1-4), and the public was warned to stay 3-5 km away from the summit based on location.
Source: Balai Penyelidikan dan Pengembangan Teknologi Kebencanaan Geologi (BPPTKG)
BPPTKG reported no significant morphological changes at Merapi’s lava domes, located just below the SW rim and in the summit crater, during 21-27 January. Seismicity remained at high levels. As many as 30 lava avalanches traveled a maximum of 1.8 km SW down the Bebeng drainage, and two pyroclastic flows traveled 2.5 km SW. The Alert Level remained at 3 (on a scale of 1-4), and the public was warned to stay 3-5 km away from the summit based on location.
Source: Balai Penyelidikan dan Pengembangan Teknologi Kebencanaan Geologi (BPPTKG)
BPPTKG reported no significant morphological changes at Merapi’s lava domes, located just below the SW rim and in the summit crater, during 14-20 January. Seismicity remained at high levels. As many as 91 lava avalanches traveled a maximum of 2 km SW down the Bebeng drainage, and one pyroclastic flow traveled 2 km SW. The Alert Level remained at 3 (on a scale of 1-4), and the public was warned to stay 3-5 km away from the summit based on location.
Source: Balai Penyelidikan dan Pengembangan Teknologi Kebencanaan Geologi (BPPTKG)
BPPTKG reported no significant morphological changes at Merapi’s lava domes, located just below the SW rim and in the summit crater, during 6-13 January. The intensity of the seismic signals remained at high levels. As many as 123 lava avalanches traveled a maximum of 2.2 km SW down the Bebeng drainage, and four pyroclastic flows traveled a maximum of 2.5 km SW. The Alert Level remained at 3 (on a scale of 1-4), and the public was warned to stay 3-5 km away from the summit based on location.
Source: Balai Penyelidikan dan Pengembangan Teknologi Kebencanaan Geologi (BPPTKG)
BPPTKG reported no notable morphological changes to Merapi’s summit lava dome, though the dome just below the SW rim had increased about 2 m in height during 31 December 2021 to 6 January 2022. The estimated dome volumes were over 1.67 million cubic meters for the SW dome and just over 3 million cubic meters for the summit dome. The intensity of the seismic signals remained at high levels. As many as 69 lava avalanches traveled a maximum of 2 km SW down the Bebeng drainage. The Alert Level remained at 3 (on a scale of 1-4), and the public was warned to stay 3-5 km away from the summit based on location.
Source: Balai Penyelidikan dan Pengembangan Teknologi Kebencanaan Geologi (BPPTKG)
BPPTKG reported no notable morphological changes to Merapi’s summit lava dome, though the dome just below the SW rim had decreased about 3 m in height during 24-30 December. The estimated dome volumes were over 1.63 million cubic meters for the SW dome and just over 3 million cubic meters for the summit dome. The intensity of the seismic signals remained at high levels. As many as 175 lava avalanches traveled a maximum of 2 km SW down the Bebeng drainage, and two pyroclastic flows traveled a maximum of 1.8 km SW. The Alert Level remained at 3 (on a scale of 1-4), and the public was warned to stay 3-5 km away from the summit based on location.
Source: Balai Penyelidikan dan Pengembangan Teknologi Kebencanaan Geologi (BPPTKG)
BPPTKG reported no notable morphological changes to Merapi’s summit lava dome, though the dome just below the SW rim had increased about 2 m in height during 17-23 December. The estimated dome volumes were over 1.65 million cubic meters for the SW dome and just over 3 million cubic meters for the summit dome. The intensity of the seismic signals remained at high levels. As many as 112 lava avalanches traveled a maximum of 2 km SW down the Bebeng drainage, and four pyroclastic flows traveled a maximum of 2.5 km SW. The Alert Level remained at 3 (on a scale of 1-4), and the public was warned to stay 3-5 km away from the summit based on location.
Source: Balai Penyelidikan dan Pengembangan Teknologi Kebencanaan Geologi (BPPTKG)
BPPTKG reported no significant morphological changes at Merapi’s lava domes, located just below the SW rim and in the summit crater, during 10-16 December. The estimated dome volumes were almost 1.63 million cubic meters for the SW dome and just over 3 million cubic meters for the summit dome. The intensity of the seismic signals remained at high levels. As many as 116 lava avalanches traveled a maximum of 2 km SW down the Bebeng drainage, and three pyroclastic flows traveled a maximum of 2.2 km SW. At 1643 on 18 December a pyroclastic flow advanced 2 km SW and produced an ash plume that rose 400 m. The Alert Level remained at 3 (on a scale of 1-4), and the public was warned to stay 3-5 km away from the summit based on location.
Source: Balai Penyelidikan dan Pengembangan Teknologi Kebencanaan Geologi (BPPTKG)
BPPTKG reported that Merapi’s lava domes, located just below the SW rim and in the summit crater, had both grown during 3-9 December. The estimated dome volumes were almost 1.63 million cubic meters for the SW dome and just over 3 million cubic meters for the summit dome. The intensity of the seismic signals remained at high levels. As many as 190 lava avalanches traveled a maximum of 2 km SW down the Bebeng drainage. Four pyroclastic flows traveled a maximum of 2.2 km SW. The Alert Level remained at 3 (on a scale of 1-4), and the public was warned to stay 3-5 km away from the summit based on location.
Source: Balai Penyelidikan dan Pengembangan Teknologi Kebencanaan Geologi (BPPTKG)
BPPTKG reported no notable morphological changes to Merapi’s summit lava dome, though the dome just below the SW rim had decreased about 2 m in height during 26 November-2 December. The estimated dome volumes were 1.61 million cubic meters for the SW dome and almost 2.95 million cubic meters for the summit dome. The intensity of the seismic signals was higher than the week before. As many as 170 lava avalanches traveled a maximum of 2 km SW. Two pyroclastic flows traveled a maximum of 3 km SW on 1 December. In a VONA (Volcano Observatory Notice for Aviation), PVMBG stated that at 2104 on 1 December an ash plume rose 1 km above the summit and drifted E. According to BPPTKG a pyroclastic flow traveled 1.8 km down the Bebeng drainage on the SW flank at 1644 on 6 December. The event lasted two minutes and 40 seconds based on seismic data. The Alert Level remained at 3 (on a scale of 1-4), and the public was warned to stay 3-5 km away from the summit based on location.
Sources: Balai Penyelidikan dan Pengembangan Teknologi Kebencanaan Geologi (BPPTKG); Pusat Vulkanologi dan Mitigasi Bencana Geologi (PVMBG, also known as CVGHM)
BPPTKG reported no notable morphological changes to Merapi’s SW lava dome, located just below the SW rim, or the dome in the summit crater during 19-25 November. The estimated dome volumes remained stable at 1.61 million cubic meters for the SW dome and almost 2.93 million cubic meters for the summit dome. As many as 110 lava avalanches traveled a maximum of 2 km SW. One pyroclastic flow traveled 1.8 km SW on 20 November. The Alert Level remained at 3 (on a scale of 1-4), and the public was warned to stay 3-5 km away from the summit based on location.
Source: Balai Penyelidikan dan Pengembangan Teknologi Kebencanaan Geologi (BPPTKG)
BPPTKG reported no notable morphological changes to Merapi’s SW lava dome, located just below the SW rim, or the dome in the summit crater during 12-18 November. The estimated dome volumes remained stable at 1.61 million cubic meters for the SW dome and almost 2.93 million cubic meters for the summit dome. As many as 212 lava avalanches traveled a maximum of 2 km SW. One pyroclastic flow traveled 1.8 km SW on 13 November. The Alert Level remained at 3 (on a scale of 1-4), and the public was warned to stay 3-5 km away from the summit based on location.
Source: Balai Penyelidikan dan Pengembangan Teknologi Kebencanaan Geologi (BPPTKG)
BPPTKG reported no notable morphological changes to Merapi’s SW lava dome, located just below the SW rim, or in the summit crater during 5-11 November. As many as 123 lava avalanches traveled a maximum of 2 km SW. Two pyroclastic flows traveled 1.5-2 km SW. The Alert Level remained at 3 (on a scale of 1-4), and the public was warned to stay 3-5 km away from the summit based on location.
Source: Balai Penyelidikan dan Pengembangan Teknologi Kebencanaan Geologi (BPPTKG)
BPPTKG reported no morphological changes to Merapi’s SW lava dome, located just below the SW rim, and in the summit crater during 29 October-4 November. As many as 106 lava avalanches traveled a maximum of 2 km SW. One pyroclastic flow traveled 2 km SW. The Alert Level remained at 3 (on a scale of 1-4), and the public was warned to stay 3-5 km away from the summit based on location.
Source: Balai Penyelidikan dan Pengembangan Teknologi Kebencanaan Geologi (BPPTKG)
BPPTKG reported no morphological changes to Merapi’s SW lava dome, located just below the SW rim, and in the summit crater during 22-28 October. As many as 30 lava avalanches traveled a maximum of 1.8 km SW. The Alert Level remained at 3 (on a scale of 1-4), and the public was warned to stay 3-5 km away from the summit based on location.
Source: Balai Penyelidikan dan Pengembangan Teknologi Kebencanaan Geologi (BPPTKG)
BPPTKG reported no morphological changes to Merapi’s SW lava dome, located just below the SW rim and in the summit crater, and the summit crater dome during 15-21 October. Two pyroclastic flows traveled 2.5 km down the SW flank and as many as 60 lava avalanches traveled a maximum of 2 km SW. The Alert Level remained at 3 (on a scale of 1-4), and the public was warned to stay 3-5 km away from the summit based on location.
Source: Balai Penyelidikan dan Pengembangan Teknologi Kebencanaan Geologi (BPPTKG)
BPPTKG reported minor morphological changes to Merapi’s SW lava dome, located just below the SW rim, and the dome in the summit crater during 8-14 October. The SW dome grew about 2 m taller and had an estimated volume of 1.61 million cubic meters, while the summit lava dome grew about 4 m taller had an estimated volume of 2.93 million cubic meters. As many as 41 lava avalanches traveled a maximum of 2 km SW. The Alert Level remained at 3 (on a scale of 1-4), and the public was warned to stay 3-5 km away from the summit based on location.
Source: Balai Penyelidikan dan Pengembangan Teknologi Kebencanaan Geologi (BPPTKG)
BPPTKG reported minor morphological changes to Merapi’s SW lava dome, located just below the SW rim and in the summit crater, and no changes to the summit crater dome during 1-7 October. The SW dome grew about 3 m taller had an estimated volume of 1.679 million cubic meters, and the summit lava dome had an estimated volume of 2.854 million cubic meters. As many as 76 lava avalanches traveled a maximum of 2 km SW. The Alert Level remained at 3 (on a scale of 1-4), and the public was warned to stay 3-5 km away from the summit based on location.
Source: Balai Penyelidikan dan Pengembangan Teknologi Kebencanaan Geologi (BPPTKG)
BPPTKG reported minor morphological changes to Merapi’s SW lava dome, located just below the SW rim and in the summit crater, and no changes to the summit crater dome during 24-30 September. The SW dome grew 1 m taller and had an estimated volume of 1.63 million cubic meters; the summit lava dome had an estimated volume of 2.85 million cubic meters. As many as 67 lava avalanches traveled a maximum of 1.8 km SW. The Alert Level remained at 3 (on a scale of 1-4), and the public was warned to stay 3-5 km away from the summit based on location.
Source: Balai Penyelidikan dan Pengembangan Teknologi Kebencanaan Geologi (BPPTKG)
BPPTKG reported minor morphological changes to Merapi’s SW lava dome, located just below the SW rim and in the summit crater, and no changes to the summit crater dome during 17-23 September. The SW dome had an estimated volume of 1.6 million cubic meters and the summit lava dome had an estimated volume of 2.85 million cubic meters. As many as 141 lava avalanches traveled a maximum of 2 km SW. The Alert Level remained at 3 (on a scale of 1-4), and the public was warned to stay 3-5 km away from the summit based on location.
Source: Balai Penyelidikan dan Pengembangan Teknologi Kebencanaan Geologi (BPPTKG)
BPPTKG reported that no morphological changes to Merapi’s two lava domes, situated just below the SW rim and in the summit crater, were detected during 10-16 September. As many as 144 lava avalanches traveled a maximum of 2 km SW. The Alert Level remained at 3 (on a scale of 1-4), and the public was warned to stay 3-5 km away from the summit based on location.
Source: Balai Penyelidikan dan Pengembangan Teknologi Kebencanaan Geologi (BPPTKG)
BPPTKG reported that both of Merapi’s two lava domes, situated just below the SW rim and in the summit crater, continued to grow during 3-9 September. The SW dome grew 5 m taller and had an estimated volume of 1.55 million cubic meters and the summit lava dome grew 1 m wider and had an estimated volume of 2.85 million cubic meters. One pyroclastic flow traveled 2 km down the SW flank and as many as 129 lava avalanches traveled a maximum of 2 km SW. According to the Darwin VAAC ash plumes rose 3 km (10,000 ft) a.s.l. and drifted E on 9 September, based on satellite and webcam views. The Alert Level remained at 3 (on a scale of 1-4), and the public was warned to stay 3-5 km away from the summit based on location.
Sources: Balai Penyelidikan dan Pengembangan Teknologi Kebencanaan Geologi (BPPTKG); Darwin Volcanic Ash Advisory Centre (VAAC)
BPPTKG reported that both of Merapi’s two lava domes, situated just below the SW rim and in the summit crater, continued to grow during 27 August-2 September. The SW dome grew 2 m taller and had an estimated volume of 1.44 million cubic meters and the summit lava dome grew 1 m taller and had an estimated volume of 2.84 million cubic meters. A total of six pyroclastic flows descended the SW flank as far as 2.5 km; as many as 80 lava avalanches traveled a maximum of 2 km SW. The Alert Level remained at 3 (on a scale of 1-4), and the public was warned to stay 3-5 km away from the summit based on location.
Source: Balai Penyelidikan dan Pengembangan Teknologi Kebencanaan Geologi (BPPTKG)
BPPTKG reported that of Merapi’s two lava domes, the dome just below the SW rim was more active than the dome in the summit crater during 20-26 August. The SW dome grew and shed material down the flanks, increasing in height by just 3 m overall. On 25 August the volume of the SW dome was estimated at 1.4 million cubic meters and the summit lava dome was stable at an estimated 2.831 million cubic meters. A total of two pyroclastic flows descended the SW flank as far as 2 km; as many as 211 lava avalanches traveled a maximum of 2 km SW. Based on satellite images the Darwin VAAC noted that during 28-29 August ash plumes rose to 3-3.7 km (10,000-12,000 ft) a.s.l. and drifted SW, W, and NW. The Alert Level remained at 3 (on a scale of 1-4), and the public was warned to stay 3-5 km away from the summit based on location.
Sources: Balai Penyelidikan dan Pengembangan Teknologi Kebencanaan Geologi (BPPTKG); Darwin Volcanic Ash Advisory Centre (VAAC)
BPPTKG reported that both the lava dome just below Merapi’s SW rim and the lava dome in the summit crater remained active during 13-19 August. Webcam images showed some changes in the SW dome due to lava avalanches and pyroclastic flows; there were no significant changes in the central dome. The volume of the SW lava dome was 1.35 million cubic meters. During 13-19 August a total of 20 pyroclastic flows were observed descending the SW flank as far as 3.5 km. Lava avalanches were observed 172 times to the SW, traveling up to 2 km. BNPB noted that ashfall was reported in several areas on 16 August, including Dukun, Sawangan, Tegalrejo, Secang, Gowok, Mertoyudan, Selo, Mojotengah, Temanggung, Kedu, Pringsurat, Bulu, Tlogomulyo, Kranggan, and Parakan.
PVMBG reported that during 18-19 and 23-24 August white plumes rose 20-200 m above the crater and drifted in different directions. As many as 331 lava avalanches traveled a maximum distance of 1.5 km SW. Two pyroclastic flows moved as far as 2 km, though the direction was not observed. The Alert Level remained at a 3 (on a scale of 1-4), and the public was warned to stay 5 km away from the summit.
Sources: Balai Penyelidikan dan Pengembangan Teknologi Kebencanaan Geologi (BPPTKG); Badan Nacional Penanggulangan Bencana (BNPB); Pusat Vulkanologi dan Mitigasi Bencana Geologi (PVMBG, also known as CVGHM)
BPPTKG reported that both the lava dome just below Merapi’s SW rim and the lava dome in the summit crater remained active during 5-12 August. The domes grew and shed material down the flanks, resulting in relatively stable dome volumes. A total of 28 pyroclastic flows descended the SW flank as far as 3 km; as many as 252 lava avalanches traveled a maximum of 2 km SW and one traveled 500 m SE. BNPB noted that ashfall was reported in 19 villages on 10 August and several on 12 August, in the districts of Dukun, Sawangan, Grabag, Pakis, Tegalrejo, Secang, Srumbung, Salam, Muntilan, and Mungkid. Winds played a role in the extensive distribution of ashfall. The Alert Level remained at 3 (on a scale of 1-4), and the public was warned to stay 5 km away from the summit.
Sources: Balai Penyelidikan dan Pengembangan Teknologi Kebencanaan Geologi (BPPTKG); Badan Nacional Penanggulangan Bencana (BNPB)
BPPTKG reported that the lava dome just below Merapi’s SW rim and the lava dome in the summit crater both remained active during 30 July-5 August. The SW rim dome volume was an estimated 1.895 million cubic meters and about 3 m tall. A total of seven pyroclastic flows descended the SW flank as far as 2 km and as many as 84 lava avalanches traveled a maximum of 2 km SW. Multiple pyroclastic flows traveled 2-3 km down the SW flank on 8 August and ash plumes rose 1 km above the summit. According to a news article ashfall was reported in several local communities. Pyroclastic flows traveled up to 3 km down the SW flanks multiple times during 9-10 August. BNPB noted that a small fire on the SW flank, 2.5 km from the crater, was set by ejected incandescent material; the fire burned an area of only 30 square meters during 25-26 August. The Alert Level remained at 3 (on a scale of 1-4), and the public was warned to stay 5 km away from the summit.
Sources: Balai Penyelidikan dan Pengembangan Teknologi Kebencanaan Geologi (BPPTKG); Forbes
BPPTKG reported that the lava dome just below Merapi’s SW rim and the lava dome in the summit crater both remained active during 23-29 July. The SW rim lava-dome volume was an estimated 1.878 million cubic meters and material continued to collapse down the flank. The volume of the summit lava dome was 2.817 million cubic meters. A total of four pyroclastic flows descended the SW flank as far as 2.5 km. Lava avalanches traveled a maximum of 1.2 km SE (29 times), 2 km SW (145 times), 800 m W (four times), and 500 m NW (one time). Avalanches of material that descended the W flank originated from lava emplaced in 1992 and 1998, and material that descended the NW flank is from 1948 lava. The Alert Level remained at 3 (on a scale of 1-4), and the public was warned to stay 5 km away from the summit.
Source: Balai Penyelidikan dan Pengembangan Teknologi Kebencanaan Geologi (BPPTKG)
BPPTKG reported that the lava dome just below Merapi’s SW rim and the lava dome in the summit crater both remained active during 16-22 July. The SW rim lava-dome volume was an estimated 1.88 million cubic meters and material continued to collapse down the flank. The volume of the summit lava dome was 2.808 million cubic meters. Lava avalanches traveled a maximum of 1.2 km SE (62 times), 1.8 km SW (101 times), 1.5 km W (two times), and 1.5 km NW (one time). Avalanches of material that descended the W flank originated from lava emplaced in 1992 and 1998, and material that descended the NW flank is from 1948 lava. According to the Darwin VAAC ash plumes rose to 3 km (10,000 ft) a.s.l. on 24 July and drifted WSW. The Alert Level remained at 3 (on a scale of 1-4), and the public was warned to stay 5 km away from the summit.
Sources: Balai Penyelidikan dan Pengembangan Teknologi Kebencanaan Geologi (BPPTKG); Darwin Volcanic Ash Advisory Centre (VAAC)
BPPTKG reported that the lava dome just below Merapi’s SW rim and the lava dome in the summit crater both remained active during 9-15 July. The SW rim lava-dome volume was an estimated 1.83 million cubic meters and continued to shed material down the flank. One pyroclastic flow traveled 1.1 km down the SW flank and as far as 1.5 km SE. Avalanches traveled a maximum of 1.5 km SE (58 times), 2 km SW (98 times), 1 km W (one time), and 700 m NW (three times). The volume of the summit lava dome was 2.796 million cubic meters. The Alert Level remained at 3 (on a scale of 1-4), and the public was warned to stay 5 km away from the summit.
Source: Balai Penyelidikan dan Pengembangan Teknologi Kebencanaan Geologi (BPPTKG)
BPPTKG reported that the lava dome just below Merapi’s SW rim and the lava dome in the summit crater both remained active during 2-8 July. The SW rim lava-dome volume was an estimated 1.815 million cubic meters by 8 July and continued to shed material down the flank. The volume of the summit lava dome was 2,741 million cubic meters. A total of 17 pyroclastic flows traveled a maximum of 2 km down the SW flank and as far as 1.5 km SE. As many as 125 incandescent avalanches traveled a maximum of 2 km down the SW flank and 1.8 km down the SE flank. The Alert Level remained at 3 (on a scale of 1-4), and the public was warned to stay 5 km away from the summit.
Source: Balai Penyelidikan dan Pengembangan Teknologi Kebencanaan Geologi (BPPTKG)
BPPTKG reported that the lava dome just below Merapi’s SW rim and the lava dome in the summit crater both remained active during 25 June-1 July. The SW rim lava-dome volume was an estimated 1.68 million cubic meters by 1 July, with a growth rate of 11,800 cubic meters per day, and continued to shed material down the flank. The summit lava dome was 0.5 m shorter than the previous week, corresponding to the increasing numbers of incandescent avalanches and pyroclastic flows as more material was shed to the SE. A total of 10 pyroclastic flows traveled a maximum of 2 km down the SW flank and 29 traveled as far as 3 km SE. As many as 100 incandescent avalanches traveled a maximum of 2 km down the SW flank and 26 traveled as far as 1.2 km down the SE flank. Ashfall was reported in several areas to the SE on 25 June. The Alert Level remained at 3 (on a scale of 1-4), and the public was warned to stay 5 km away from the summit.
Source: Balai Penyelidikan dan Pengembangan Teknologi Kebencanaan Geologi (BPPTKG)
BPPTKG reported that the lava dome just below Merapi’s SW rim and the lava dome in the summit crater both continued to grow during 18-24 June. The SW rim lava-dome volume was an estimated 1.59 million cubic meters by 24 June, with a growth rate of 11,400 cubic meters per day, and continued to shed material down the flank. A total of 17 pyroclastic flows traveled a maximum of 2.5 km down the SW flank and five traveled 1.4 km SE. Incandescent avalanches, recorded 206 times, traveled as far as 2 km down the SW flank and 600 m SE. The summit lava dome grew taller by 0.5 m. Beginning at 0443 on 25 June a series of three pyroclastic flows traveled 3 km down the SE flank and produced ash plumes that rose 1 km above the summit and drifted SE. Several towns to the SE reported ashfall. The Alert Level remained at 3 (on a scale of 1-4), and the public was warned to stay 5 km away from the summit.
Source: Balai Penyelidikan dan Pengembangan Teknologi Kebencanaan Geologi (BPPTKG)
BPPTKG reported that the lava dome just below Merapi’s SW rim and the lava dome in the summit crater both continued to be active during 11-17 June. The SW rim lava-dome volume was an estimated 1.39 million cubic meters by 17 June, with a growth rate of 11,300 cubic meters per day, and continued to shed material down the flank. A total of 19 pyroclastic flows traveled a maximum of 2 km down the SW flank and 1 km SE. Incandescent avalanches, recorded 100 times, traveled as far as 2 km down the SW flank and eight times went 1 km SE. The summit lava dome grew taller by 1 m. At 0350 on 20 June a pyroclastic flow traveled 2.5 km down the SW flank. The Alert Level remained at 3 (on a scale of 1-4), and the public was warned to stay 5 km away from the summit.
Source: Balai Penyelidikan dan Pengembangan Teknologi Kebencanaan Geologi (BPPTKG)
BPPTKG reported that the lava domes just below Merapi’s SW rim and in the summit crater remained active during 4-10 June. The SW rim lava-dome volume was an estimated 1.3 million cubic meters on 8 June, and continued to shed material down the flank. A total of 12 pyroclastic flows traveled a maximum of 1.6 km down the SW flank and 1 km SE. Incandescent avalanches, recorded 52 times, traveled as far as 2 km down the SW flank and three times went 600 m SE. The volume of the summit lava dome was 2.1 million cubic meters on 8 June. The Alert Level remained at 3 (on a scale of 1-4), and the public was warned to stay 5 km away from the summit.
Source: Balai Penyelidikan dan Pengembangan Teknologi Kebencanaan Geologi (BPPTKG)
PVMBG reported that the eruption at Merapi continued during 1-8 June. As many as 16 daily incandescent avalanches were recorded, traveling as far as 2 km down the SW flank. Pyroclastic flows traveled as far as 1.6 km down the SW flank during 5-8 June. The Alert Level remained at 2 (on a scale of 1-4), and residents were warned to stay outside of the 3-km exclusion zone.
Source: Pusat Vulkanologi dan Mitigasi Bencana Geologi (PVMBG, also known as CVGHM)
BPPTKG reported that the lava dome just below Merapi’s SW rim and the lava dome in the summit crater both continued to be active during 21-27 May. The SW rim lava-dome volume was an estimated 1.265 million cubic meters, with a growth rate of about 11,600 cubic meters per day, and continued to shed material down the flank. A total of 15 pyroclastic flows traveled a maximum of 2 km down the SW flank. Incandescent avalanches, recorded 70 times, traveled as far as 1.8 km down the SW flank and once went 800 m SE. The summit lava dome had not changed since observations the previous week. The Alert Level remained at 3 (on a scale of 1-4), and the public was warned to stay 5 km away from the summit.
Source: Balai Penyelidikan dan Pengembangan Teknologi Kebencanaan Geologi (BPPTKG)
BPPTKG reported that the lava dome just below Merapi’s SW rim and the lava dome in the summit crater both continued to extrude lava during 14-20 May. The SW rim lava-dome volume was an estimated 1.284 million cubic meters, with a growth rate of about 11,700 cubic meters per day, and continued to shed material down the flank. A total of seven pyroclastic flows traveled a maximum of 2 km down the SW flank. Incandescent avalanches, recorded 58 times, traveled as far as 2 km down the SW flank and once went 800 m SE. The summit lava dome had not changed since the previous week. The Alert Level remained at 3 (on a scale of 1-4), and the public was warned to stay 5 km away from the summit.
Source: Balai Penyelidikan dan Pengembangan Teknologi Kebencanaan Geologi (BPPTKG)
BPPTKG reported that the lava dome just below Merapi’s SW rim and the lava dome in the summit crater both continued to extrude lava during 7-13 May. The SW rim lava-dome volume was an estimated 1.16 million cubic meters on 2 May, with a growth rate of about 11,500 cubic meters per day, and continued to shed material down the flank. A total of four pyroclastic flows traveled a maximum of 1.5 km down the SW flank. Incandescent avalanches, recorded 49 times, traveled as far as 1.8 km down the SW flank and twice went 700 m SE. The summit lava dome grew 2 m taller during 6-16 May. Electronic Distance Measurement (EDM) data showed a distance shortening between points in the NW at a rate of 0.7 cm per day, indicating minor inflation. The Alert Level remained at 3 (on a scale of 1-4), and the public was warned to stay 5 km away from the summit.
Source: Balai Penyelidikan dan Pengembangan Teknologi Kebencanaan Geologi (BPPTKG)
BPPTKG reported that the lava dome just below Merapi’s SW rim and the lava dome in the summit crater both continued to extrude lava during 30 April-6 May. The SW rim lava-dome volume was an estimated 1.1 million cubic meters on 2 May, with a growth rate of about 17,000 cubic meters per day, and continued to shed material down the flank. A total of 12 pyroclastic flows traveled a maximum of 2 km down the SW flank. Incandescent avalanches, recorded 74 times, traveled as far as 2 km down the SW flank and twice went 600 m SE. The volume of the summit lava dome was 1.7 million cubic meters on 2 May, with a growth rate of about 14,000 cubic meters per day. Electronic Distance Measurement (EDM) data showed a distance shortening between points in the NW at a rate of 0.6 cm per day, indicating minor inflation. The Alert Level remained at 3 (on a scale of 1-4), and the public was warned to stay 5 km away from the summit.
Source: Balai Penyelidikan dan Pengembangan Teknologi Kebencanaan Geologi (BPPTKG)
BPPTKG reported that the lava dome just below Merapi’s SW rim and the lava dome in the summit crater both continued to extrude lava during 23-29 April. The SW rim lava dome had an estimated volume of 1,141,850 cubic meters on 28 April, with a growth rate of about 11,900 cubic meters per day, and continued to shed material down the flank. A total of 12 pyroclastic flows traveled a maximum of 2 km down the SW flank. Incandescent avalanches, recorded 113 times, traveled as far as 2 km down the SW flank. The volume of the summit lava dome was 1,794,000 cubic meters on 28 April, unchanged from the previous week. Electronic Distance Measurement (EDM) data showed a distance shortening between points in the NW at a rate of 0.5 cm per day, indicating inflation. The Alert Level remained at 3 (on a scale of 1-4), and the public was warned to stay 5 km away from the summit.
Source: Balai Penyelidikan dan Pengembangan Teknologi Kebencanaan Geologi (BPPTKG)
BPPTKG reported that the lava dome just below Merapi’s SW rim and the lava dome in the summit crater both continued to extrude lava during 16-22 April. The SW rim lava-dome volume was an estimated 1,069,600 cubic meters on 21 April, with a growth rate of about 11,900 cubic meters per day; the dome continued to shed material down the flank. A total of nine pyroclastic flows traveled a maximum of 1.8 km down the SW flank. Incandescent avalanches, recorded 144 times, traveled as far as 1.6 km down the SW flank and twice down the SE flank as far as 400 m. The volume of the summit lava dome was 1,794,000 cubic meters on 22 April. The Alert Level remained at 3 (on a scale of 1-4), and the public was warned to stay 5 km away from the summit.
Source: Balai Penyelidikan dan Pengembangan Teknologi Kebencanaan Geologi (BPPTKG)
BPPTKG reported that the lava dome just below Merapi’s SW rim and the lava dome in the summit crater both continued to extrude lava during 9-15 April. The SW rim lava-dome volume was an estimated 1,024,800 cubic meters on 15 April, with a growth rate of about 12,200 cubic meters per day, and continued to shed material down the flank. A total of six pyroclastic flows traveled a maximum of 1.8 km down the SW flank. Incandescent avalanches, recorded 119 times, traveled as far as 1.5 km down the SW flank. The volume of the summit lava dome was 1,681,000 cubic meters on 14 April. The Alert Level remained at 3 (on a scale of 1-4), and the public was warned to stay 5 km away from the summit.
Source: Balai Penyelidikan dan Pengembangan Teknologi Kebencanaan Geologi (BPPTKG)
BPPTKG reported that the lava dome just below Merapi’s SW rim and the lava dome in the summit crater both continued to grow during 1-8 April. The SW rim lava-dome volume was an estimated 1,098,000 cubic meters on 7 April, with a growth rate of about 12,800 cubic meters per day, and continued to shed material down the flank. A total of 13 pyroclastic flows traveled a maximum of 1.5 km down the SW flank. Incandescent avalanches, recorded 119 times, traveled as far as 1.1 km down the SW flank. The summit lava dome had grown to 75 m tall. Minor ashfall was reported in Ngipiksari (8 km SSW), Klangon (4 km S), and Deles (3 km SE) on 3 April. The Alert Level remained at 3 (on a scale of 1-4), and the public was warned to stay 5 km away from the summit.
Source: Balai Penyelidikan dan Pengembangan Teknologi Kebencanaan Geologi (BPPTKG)
BPPTKG reported that the lava dome just below Merapi’s SW rim and the lava dome in the summit crater both continued to grow during 26 March-1 April. The SW rim lava-dome volume was an estimated 1,060,000 cubic meters on 1 April, with a growth rate of about 13,400 cubic meters per day, and continued to shed material down the flank. A total of 14 pyroclastic flows traveled a maximum of 1.8 km down the SW flank. Incandescent avalanches, recorded 158 times, traveled as far as 1.1 km down the SW flank. The summit lava dome had grown to 70 m tall and produced one incandescent avalanche. Minor ashfall was reported in Ngadirojo, Stabelan (4 km NW), Takeran, Tlogolele (5 km NW), Selo (3 km NNW), Pos Babadan (4 km NW), and Pasar Talun (12 km W). The Alert Level remained at 3 (on a scale of 1-4), and the public was warned to stay 5 km away from the summit.
Source: Balai Penyelidikan dan Pengembangan Teknologi Kebencanaan Geologi (BPPTKG)
BPPTKG reported that the lava dome just below Merapi's SW rim continued to grow and shed material down the flank during 19-25 March. The 2021 lava dome volume was an estimated 949,000 cubic meters on 25 March, with a growth rate of about 13,300 cubic meters per day. The Mount Merapi Selo Observation Post reported a white gas-and-steam plume rose 500 m above the crater on 25 March at 1430. Four pyroclastic flows traveled a maximum of 1.8 km down the SW flank, three of which occurred on 27 March at 0602, 0603, and 0631. An ash plume caused by a pyroclastic flow rose 3.5 km (12,000 ft) a.s.l. and drifted SW for about 1.3 km on 27 March at 1758 on, according to a ground observer. Incandescent avalanches, recorded 104 times, traveled as far as 1.2 km down the SW flank and twice down the SE flank as far as 400 m. The summit lava dome measured 65 m tall, similar to the previous week. On 30 March there were 33 incandescent avalanches observed traveling up to 1 km down the SW flank, one of which continued up to 1.5 km. One incandescent avalanche was observed from the lava dome. The Alert Level remained at 3 (on a scale of 1-4), and the public were warned to stay 5 km away from the summit.
Sources: Pusat Vulkanologi dan Mitigasi Bencana Geologi (PVMBG, also known as CVGHM); Badan Nacional Penanggulangan Bencana (BNPB); Balai Penyelidikan dan Pengembangan Teknologi Kebencanaan Geologi (BPPTKG)
BPPTKG reported that the lava dome just below Merapi’s SW rim and the lava dome in the summit crater both continued to grow during 12-18 March. The 2021 lava-dome volume was an estimated 840,000 cubic meters on 18 March, with a growth rate of about 12,900 cubic meters per day, and continued to shed material down the flank. A total of three pyroclastic flows traveled a maximum of 1 km down the SW flank. Incandescent avalanches, recorded 211 times, traveled as far as 1.2 km down the SW flank. The summit lava dome had grown to 65 m tall and had an estimated volume of 950,000 cubic meters with a growth rate of 12,800 cubic meters per day. The Alert Level remained at 3 (on a scale of 1-4), and the public were warned to stay 5 km away from the summit.
Source: Balai Penyelidikan dan Pengembangan Teknologi Kebencanaan Geologi (BPPTKG)
BPPTKG reported that the 2021 lava dome just below Merapi’s SW rim and the lava dome in the summit crater both continued to grow during 5-11 March. The 2021 lava-dome volume was an estimated 785,600 cubic meters on 11 March, with a growth rate of about 13,500 cubic meters per day, and continued to shed material down the flank. A total of 12 pyroclastic flows traveled a maximum of 1.9 km down the SW flank. Incandescent avalanches, recorded 226 times, traveled as far as 1.3 km down the SW flank. The height of the summit lava dome was relatively steady at 45 m. The Alert Level remained at 3 (on a scale of 1-4), and the public were warned to stay 5 km away from the summit.
Source: Balai Penyelidikan dan Pengembangan Teknologi Kebencanaan Geologi (BPPTKG)
BPPTKG reported that the 2021 lava dome just below Merapi’s SW rim and the new lava dome in the summit crater both continued to grow during 19-25 February. The 2021 lava-dome volume was an estimated 618,700 cubic meters on 25 February, with a growth rate of about 13,600 cubic meters per day. A total of three pyroclastic flows traveled 1.9 km down the SW flank. One of the three, recorded at 1652 on 25 February, was followed by minor ashfall in Kali Tengah Lor, Kali Tengah Kidul, Deles, and Tlukan. The Alert Level remained at 3 (on a scale of 1-4), and the public were warned to stay 5 km away from the summit.
Source: Balai Penyelidikan dan Pengembangan Teknologi Kebencanaan Geologi (BPPTKG)
BPPTKG reported that the 2021 lava dome just below Merapi’s SW rim and the new lava dome in the summit crater both continued to grow during 12-18 February. The 2021 lava dome volume was an estimated 397,500 cubic meters on 17 February, with a growth rate of about 25,200 cubic meters per day; it was 258 m long, 133 m wide, and 30 m high. The summit lava dome was an estimated 426,000 cubic meters, with a growth rate of about 10,000 cubic meters per day; it was 160 m long, 120 m wide, and 50 m high. Seismicity was less intense than the previous week. Electronic Distance Measurement (EDM) data showed no notable deformation. PVMBG noted that foggy conditions often prevented visual observations during 18-23 February, though sometimes white emissions were observed rising up to 400 m above the summit. The Alert Level remained at 3 (on a scale of 1-4), and the public were warned to stay 5 km away from the summit.
Sources: Balai Penyelidikan dan Pengembangan Teknologi Kebencanaan Geologi (BPPTKG); Pusat Vulkanologi dan Mitigasi Bencana Geologi (PVMBG, also known as CVGHM)
BPPTKG reported that the 2021 lava dome continued to grow just below Merapi’s SW rim during 5-11 February. The lava-dome volume was an estimated 295,000 cubic meters on 11 February, with a growth rate of about 48,900 cubic meters per day. Incandescent avalanches of material were occasionally visible; they traveled 700 m SW in the upper parts of the Krasak and Boyong drainages during 9-10 February. Weather conditions prevented visual observations of the lava dome in the summit crater. Seismicity was higher than the previous week. Electronic Distance Measurement (EDM) data showed no notable deformation. The Alert Level remained at 3 (on a scale of 1-4), and the public were warned to stay 5 km away from the summit.
Sources: Balai Penyelidikan dan Pengembangan Teknologi Kebencanaan Geologi (BPPTKG); Pusat Vulkanologi dan Mitigasi Bencana Geologi (PVMBG, also known as CVGHM)
BPPTKG reported that the 2021 lava dome continued to grow just below Merapi’s SW rim during 29 January-4 February. One pyroclastic flow descended the SW flank as far as 600 m. The 2021 lava dome volume was an estimated 117,400 cubic meters on 4 February, with a growth rate of about 12,600 cubic meters per day. A comparison of photos taken on 21 January and 4 February showed that the morphological changes in the summit area were attributed to the growth of the 2021 lava dome as well as from a new dome slowly growing in the summit crater. Electronic Distance Measurement (EDM) data showed no notable deformation. Seismic activity was lower than the previous week. BNPB noted that a total of 537 people remained evacuated (190 people from Sleman Regency and 347 from Klaten) as of 3 February. The Alert Level remained at 3 (on a scale of 1-4), and the public were warned to stay 5 km away from the summit.
Sources: Balai Penyelidikan dan Pengembangan Teknologi Kebencanaan Geologi (BPPTKG); Badan Nacional Penanggulangan Bencana (BNPB); Detik News
BPPTKG reported that the “2021 lava dome” continued to effuse just below Merapi’s SW rim during 22-28 January, producing a total of 230 incandescent lava avalanches that traveled as far as 1.5 km down the Krasak and Boyong river drainages on the SW flank. Pyroclastic flows were recorded 71 times and descended the Boyong drainage as far as 3.5 km. A comparison of photos taken on 21 and 26 January showed that the morphological changes in the summit area were attributed to the emergence of lava domes. The 2021 dome volume was an estimated 157,000 cubic meters on 25 January, but avalanches and pyroclastic flows during 26-27 January reduced the volume to 62,000 cubic meters based on 28 January estimates. Deformation continued, though at a lower rate; Electronic Distance Measurement (EDM) data showed a distance shortening between points in the NW at a rate of 0.4 cm per day.
There were 36 pyroclastic flows recorded during 0000-1400 on 27 January; the longest pyroclastic flow traveled 3 km down the Krasak and Boyong drainages at 1253. The corresponding ash plume rose into low weather clouds that obscured the summit. At 1335 pyroclastic flows traveled 1.5 km SW. Sirens were triggered in Ngrangkah, Umbulharjo, Cangkringan, and Sleman (along the Boyong river drainage), alerting about 150 residents to temporarily evacuate. Ashfall was reported in several villages in the Tamansari and Musuk districts, Boyolali Regency, Boyolali City, and several locations in Klaten. The Alert Level remained at 3 (on a scale of 1-4), and the public were warned to stay 5 km away from the summit.
Sources: Detik News; Balai Penyelidikan dan Pengembangan Teknologi Kebencanaan Geologi (BPPTKG); Detik News; Detik News; Detik News; Detik News
BPPTKG reported that the “2021 lava dome” continued to grow just below Merapi’s SW rim during 15-21 January, producing a total of 282 incandescent lava avalanches that traveled as far as 1 km down the Krasak and Boyong river drainages on the SW flank. Pyroclastic flows were recorded 19 times and descended the SW flanks as far as 1.8 km. A comparison of photos taken on 14 and 21 January showed that the morphological changes in the summit area were attributed to the emergence of new lava domes. The 2021 dome volume was an estimated 104,000 cubic meters on 21 January, with a growth rate of about 8,600 cubic meters per day. Deformation continued, though at a lower rate; Electronic Distance Measurement (EDM) data showed a distance shortening between points in the NW at a rate of 0.8 cm per day. Seismic activity was lower than the previous week. According to news articles ashfall was reported in several villages in the Musuk, Tamansari, and Kemalang districts on 19 January. The Alert Level remained at 3 (on a scale of 1-4), and the public were warned to stay 5 km away from the summit.
Sources: Balai Penyelidikan dan Pengembangan Teknologi Kebencanaan Geologi (BPPTKG); Detik News; Detik News
BPPTKG reported that the “2021 lava dome” continued to emerge just below Merapi’s SW rim during 8-14 January, producing a total of 128 incandescent lava avalanches that traveled as far as 900 m down the Krasak River drainage on the SW flank. A comparison of photos taken on 7 and 14 January showed that the morphological changes in the summit area were attributed to the emergence of new lava domes. The 2021 dome volume was an estimated 46,766 cubic meters on 14 January, with a growth rate of about 8,500 cubic meters per day. Deformation continued, though at a lower rate; Electronic Distance Measurement (EDM) data showed a distance shortening between points in the NW at a rate of 6 cm per day. Seismic activity significantly decreased compared to the previous week.
At around 0400 on 16 January a pyroclastic flow descended 1.5 km down the Krasak drainage and produced an ash plume that rose 500 m. A pyroclastic flow was visible in webcam images around 1700 on 16 January, though somewhat obscured due to weather clouds, and traveled an estimated 1 km. From 1800 on 16 January to 0600 on 17 January there were a total of 56 incandescent lava avalanches that went a maximum distance of 1.5 km SW. During the first six hours of 18 January six incandescent avalanches descended 600 m SW. At 0543 a pyroclastic flow traveled about 1 km down the Krasak drainage and produced an ash plume that rose 50 m above the summit and drifted SE. The Alert Level remained at 3 (on a scale of 1-4), and the public were warned to stay 5 km away from the summit.
Source: Balai Penyelidikan dan Pengembangan Teknologi Kebencanaan Geologi (BPPTKG)
BPPTKG reported that a new lava dome, first observed on 4 January, continued to emerge just below Merapi’s SW rim during 5-12 January. Incandescent avalanches were observed 19 times during 4-7 January with material traveling as far as 800 m down the Krasak River drainage on the SW flank. At 0802 on 7 January a block-and-ash flow traveled down the upper part of the Krasak; the total distance was not observable due to weather clouds, though the seismic data suggested it was small and was not more than 1 km in length. The event also produced a 200-m-high ash plume. Similar events were recorded that same day at 1250, 1315, and 1402. Deformation continued; electronic Distance Measurement (EDM) data continued to measure a distance shortening between points in the NW at a rate of 15 cm per day. On 7 January BNPB noted that 1,342 residents were housed in evacuation centers. The Alert Level remained at 3 (on a scale of 1-4), and the public were warned to stay 5 km away from the summit.
Sources: Balai Penyelidikan dan Pengembangan Teknologi Kebencanaan Geologi (BPPTKG); Badan Nacional Penanggulangan Bencana (BNPB)
BPPTKG reported that during 25-31 December rock avalanches traveled as far as 1.5 km down Merapi’s NW flank in the Senowo drainage. A comparison of photos taken on 24 and 30 December showed minor morphological changes in the summit area. Seismic activity was more intense than the previous week. Electronic Distance Measurement (EDM) data continued to measure a distance shortening between points in the NW at a rate of 14 cm per day. Incandescence from the crater was visible at night on 31 December, possibly signifying the emergence of lava. At 1952 on 4 January avalanches on the SW flank were recorded by webcams and heard at the Merapi Babadan observation post, and were coincident with the appearance of another incandescent area. That same day BNPB noted that 1,115 residents remained in evacuation centers. Descending incandescent material was visible on the upper SW flank during 1847-1911 on 5 January. The Alert Level remained at 3 (on a scale of 1-4), and the public were warned to stay 5 km away from the summit.
Source: Balai Penyelidikan dan Pengembangan Teknologi Kebencanaan Geologi (BPPTKG)
BPPTKG reported that during 12-17 December white emissions from Merapi rose as high as 150 m above the summit. A comparison of photos taken on 11 and 15 December showed some slight morphological changes in the summit area; drone footage from 14 December revealed no new lava dome material in the summit crater. Rock avalanches traveled as far as 1.5 km down the Senowo drainage on the NW flank on 14 December. Seismic activity was less intense than the previous week. Electronic Distance Measurement (EDM) data continued to measure a distance shortening between points in the NW at a rate of 9 cm per day. The Alert Level remained at 3 (on a scale of 1-4).
Source: Balai Penyelidikan dan Pengembangan Teknologi Kebencanaan Geologi (BPPTKG)
BPPTKG reported that during 12-17 December white emissions from Merapi rose as high as 150 m above the summit. Rock avalanches traveled as far as 1.5 km down the Senowo drainage on the NW flank on 14 December. A comparison of photos taken on 11 and 15 December showed minor morphological changes in the summit area; drone video from 14 December revealed no new lava dome material in the summit crater. Seismic activity was less intense than the previous week. Electronic Distance Measurement (EDM) data continued to measure a distance shortening between points in the NW at a rate of 9 cm per day. The Alert Level remained at 3 (on a scale of 1-4).
Source: Balai Penyelidikan dan Pengembangan Teknologi Kebencanaan Geologi (BPPTKG)
BPPTKG reported that during 4-10 December white emissions from Merapi rose as high as 400 m above the summit. Rock avalanches traveled around 200 m down the Lamat drainage on the W flank. A comparison of photos taken on 29 November and 8 December showed some morphological changes in the summit area; drone footage from 5 December revealed no new lava dome material in the summit crater. Seismic activity was less intense than the previous week. Electronic Distance Measurement (EDM) data continued to measure a distance shortening between points in the NW at a rate of 9 cm per day. The Alert Level remained at 3 (on a scale of 1-4).
Source: Balai Penyelidikan dan Pengembangan Teknologi Kebencanaan Geologi (BPPTKG)
BPPTKG and PVMBG reported that during 27 November-8 December white emissions from Merapi rose as high as 600 m above the summit. Rock avalanches were heard, though not visually confirmed due to weather conditions. A comparison of photos taken on 26 and 29 November showed no morphology changes in the summit area. Seismicity was higher than the previous week. Electronic Distance Measurement (EDM) data continued to measure a distance shortening between points in the NW at a rate of 11 cm per day. The Alert Level remained at 3 (on a scale of 1-4).
Sources: Balai Penyelidikan dan Pengembangan Teknologi Kebencanaan Geologi (BPPTKG); Pusat Vulkanologi dan Mitigasi Bencana Geologi (PVMBG, also known as CVGHM)
BPPTKG reported that during 20-26 November white emissions from Merapi rose as high as 750 m above the summit. Avalanches of material traveled down the flanks, as far as 1 km in the Lamat drainage (W flank) at 0648 on 22 November. A comparison of photos taken on 19 and 26 November showed morphology changes in the summit area from a collapse of part of the 1954 dome. Seismicity was higher than the previous week. Electronic Distance Measurement (EDM) data continued to measure a distance shortening between points in the NW at a rate of 11 cm per day. During overflights on 26 and 27 November BNPB and BPPTKG observers noted many new avalanche deposits on the NW, W, and SW flanks. As of 27 November, there were 2,318 people spread across 15 evacuation shelters, according to BNPB. The Alert Level remained at 3 (on a scale of 1-4).
Sources: Balai Penyelidikan dan Pengembangan Teknologi Kebencanaan Geologi (BPPTKG); Pusat Vulkanologi dan Mitigasi Bencana Geologi (PVMBG, also known as CVGHM); Badan Nacional Penanggulangan Bencana (BNPB)
BPPTKG reported that during 13-23 November sometimes dense white emissions from Merapi rose as high as 200 m above the summit. Avalanches of material traveled down the flanks, as far as 2 km in the Lamat drainage (W flank) at 0615 on 14 November. A comparison of photos taken on 11 and 19 November showed morphology changes in the summit area from a collapse of part of the 2018 dome and rockfalls from parts of the crater rim. Seismicity was higher than the previous week. A notable rockfall from the inner N crater rim was recorded by the webcam at 0650 on 22 November. Electronic Distance Measurement (EDM) data continued to measure a distance shortening between points in the NW at a deformation rate of 9 cm per day during 13-19 November, though on 23 November the rate was 11 cm per day. The Alert Level remained at 3 (on a scale of 1-4).
Sources: Balai Penyelidikan dan Pengembangan Teknologi Kebencanaan Geologi (BPPTKG); Pusat Vulkanologi dan Mitigasi Bencana Geologi (PVMBG, also known as CVGHM)
BPPTKG reported that during 6-12 November sometimes dense white emissions from Merapi rose as high as 250 m above the summit. The report noted that the lava-dome volume was an estimated 200,000 cubic meters based on analyses of drone images captured on 3 November. Avalanches of material traveled 3 km down the WSW flank in the Putih/Sat drainage at 1450 on 8 November. Photos from 11 November showed no changed to the morphology of the lava dome in the summit crater. Electronic Distance Measurement (EDM) data continued to detect shortening between points in the NW at a deformation rate of 10 cm per day. Seismicity was higher than the previous week.
On 13 November BPPTKG noted that avalanches had been traveling 1-3 km down the N and NW flanks, indicating summit instability. Authorities recommended no activities within 5 km of the summit. BNPB reported that as of 15 November more than 1,800 residents from the surrounding districts of Boyolali, Magelang, Klaten, and Sleman had been relocated to shelters. Livestock was also being relocated, particularly from three villages within 7 km of the summit. PVMBG noted that less than a dozen rock avalanches were heard at observations posts during 15-17 November. The Alert Level remained at 3 (on a scale of 1-4).
Sources: Balai Penyelidikan dan Pengembangan Teknologi Kebencanaan Geologi (BPPTKG); Badan Nacional Penanggulangan Bencana (BNPB); Pusat Vulkanologi dan Mitigasi Bencana Geologi (PVMBG, also known as CVGHM)
PVMBG and BPPTKG raised the Alert Level for Merapi to 3 (on a scale of 1-4) on 5 November because of increasing evidence of a potential eruption. The report noted that the number of earthquakes began increasing after the 21 June explosive eruption; seismicity intensified in October and continued an upward trend. Electronic Distance Measurement (EDM) data indicated a distance shortening of 4 cm between points in the NW just after the 21 June event, and then continued showing deformation at a rate of 3 mm per day through September. The rate increased to 9 cm per day in late October and reached 11 cm per day on 4 November. The seismicity and deformation rates were higher than the rates leading up to the extrusion of lava domes on 26 April 2006, but remained lower than the 2010 eruption precursory conditions. No morphological changes were visible; the lava-dome volume was an estimated 200,000 cubic meters on 3 November based on analyses of drone images. BPPTKG alerted 12 villages in hazardous areas spread across Yogyakarta and Central Java Province, and recommended that mining in local drainages and tourism around Merapi should cease.
BNPB reported that after the Alert Level was raised 607 vulnerable people (children for example) were evacuated from Krinjing, Paten, and Ngargomulyo villages in Dukun District, Magelang Regency, and emergency supplies were sent to multiple susceptible communities.
Sources: Balai Penyelidikan dan Pengembangan Teknologi Kebencanaan Geologi (BPPTKG); Pusat Vulkanologi dan Mitigasi Bencana Geologi (PVMBG, also known as CVGHM); Badan Nacional Penanggulangan Bencana (BNPB)
BPPTKG reported that during 19-25 June sometimes dense white emissions from Merapi rose as high as 600 m above the summit. The report noted that the lava-dome volume was an estimated 200,000 cubic meters on 13 June based on analyses of drone images. The morphology of the summit crater area had slightly changed after the 21 June eruption. Based on photos taken from the Ngepos Post about 19,000 cubic meters had been removed from the SW part of the summit, likely near or part of the crater rim. The Alert Level remained at 2 (on a scale of 1-4), and residents were warned to stay outside of the 3-km exclusion zone.
Source: Balai Penyelidikan dan Pengembangan Teknologi Kebencanaan Geologi (BPPTKG)
BPPTKG reported that two explosions at Merapi were recorded at 0913 and 0927 on 21 June; the first lasted under six minutes and the second lasted under two minutes. A dense ash plume rose around 6 km above the summit and drifted W, causing ashfall in areas downwind including in the districts of Magelang and Kulonprogo, and as far as the Girimulyo District (45 km). The Alert Level remained at 2 (on a scale of 1-4), and residents were warned to stay outside of the 3-km exclusion zone.
Source: Balai Penyelidikan dan Pengembangan Teknologi Kebencanaan Geologi (BPPTKG)
PVMBG reported relatively quiet conditions at Merapi during 13-19 April. White plumes of variable densities rose as high as 300 m above the crater that had formed on 10 April. The Alert Level remained at 2 (on a scale of 1-4), and residents were warned to stay outside of the 3-km exclusion zone.
Source: Pusat Vulkanologi dan Mitigasi Bencana Geologi (PVMBG, also known as CVGHM)
PVMBG reported that an eruption at Merapi began at 0910 on 10 April and lasted for one minute and 43 seconds. A gray ash plume rose as high as 3 km above the summit and drifted NW. The Alert Level remained at 2 (on a scale of 1-4), and residents were warned to stay outside of the 3-km exclusion zone.
Source: Pusat Vulkanologi dan Mitigasi Bencana Geologi (PVMBG, also known as CVGHM)
PVMBG and BPPTKG reported that incandescence from Merapi’s summit crater was visible at night and in the morning during 30 March-5 April. White plumes with variable densities rose as high as 600 m above the summit. An eruption at 1510 on 2 April generated an ash plume that rose 3 km above the summit. The morphology of the lava dome in the summit crater changed slightly based on a comparison of photos (taken from the DELES 3 station, SW) from 15 March to 2 April. The Alert Level remained at 2 (on a scale of 1-4), and residents were warned to stay outside of the 3-km exclusion zone.
Sources: Balai Penyelidikan dan Pengembangan Teknologi Kebencanaan Geologi (BPPTKG); Pusat Vulkanologi dan Mitigasi Bencana Geologi (PVMBG, also known as CVGHM)
BPPTKG reported that beginning at 1056 on 27 March a seven-minute-long eruption at Merapi produced an ash plume that rose 5 km above the crater rim and pyroclastic flows that descended the SSE flank as far as 2 km. The ash plume drifted mainly SW and caused ashfall within 20 km, particularly in areas to the W and including the Mungkid subdistrict and in Banyubiru Village. The report noted that there were no clear precursors for the eruption. Eruptions at 2146 on 27 March and at 0521 the next day generated ash plumes that rose 1 km and 2 km, respectively. Each lasted about 2 minutes and 40 seconds based on the seismic data. Minor ashfall was noted in areas within 5 km, especially to the W, including Krinjing subdistrict. The Alert Level remained at 2 (on a scale of 1-4), and residents were warned to stay outside of the 3-km exclusion zone.
Source: Balai Penyelidikan dan Pengembangan Teknologi Kebencanaan Geologi (BPPTKG)
BPPTKG reported that at 0522 on 3 March an eruption at Merapi produced an ash plume that rose 6 km above the crater rim and pyroclastic flows that descended the SSE flank less than 2 km. The ash plume drifted mainly NE and caused ashfall within 10 km, particularly in areas to the N including Musuk and Cepogo Boyolali. Video of the event showed incandescent material being ejected above the summit and lightning in the ash cloud. The report noted that there were no clear precursors for the eruption. The Alert Level remained at 2 (on a scale of 1-4), and residents were warned to stay outside of the 3-km exclusion zone.
Source: Balai Penyelidikan dan Pengembangan Teknologi Kebencanaan Geologi (BPPTKG)
PVMBG reported that the volume of Merapi’s summit lava dome decreased after the 13 February eruption which produced a 2-km-tall ash plume, ejected material within 1 km, and caused ashfall within a 10-km radius. The dome volume the day before the event was estimated at 407,000 cubic meters, and afterwards (19 February) was reduced to 291,000 cubic meters. Visual observations during 17-23 February were mostly hindered due to inclement weather conditions, though on 18 February a white plume was seen rising 100 m above the summit. The Alert Level remained at 2 (on a scale of 1-4), and residents were warned to stay outside of the 3-km exclusion zone.
Sources: Balai Penyelidikan dan Pengembangan Teknologi Kebencanaan Geologi (BPPTKG); Pusat Vulkanologi dan Mitigasi Bencana Geologi (PVMBG, also known as CVGHM)
PVMBG reported that during 7-12 February white plumes rose as high as 400 m above Merapi’s summit lava dome. The volume of the dome was an estimated 407,000 cubic meters on 12 February based on drone photos, similar to 19 November 2019 measurements. An eruption at 0516 on 13 February lasted two and a half minutes and produced an ash plume that rose about 2 km above the summit and drifted NW. Ashfall was reported in areas within a 10-km radius especially to the S, including the villages of Hargobinangun, Glagaharjo, and Kepuharjo. Video of the event showed incandescent material being ejected above the lava dome and lightning in the ash cloud. The Alert Level remained at 2 (on a scale of 1-4), and residents were warned to stay outside of the 3-km exclusion zone.
Sources: Balai Penyelidikan dan Pengembangan Teknologi Kebencanaan Geologi (BPPTKG); Pusat Vulkanologi dan Mitigasi Bencana Geologi (PVMBG, also known as CVGHM)
PVMBG reported that a relatively high number of deep volcanic earthquakes were recorded at Merapi during 30 December-5 January. The seismic network recorded a pyroclastic flow that began at 2036 on 4 January and lasted for one minute and 45 seconds. The event was not visually observed due to foggy weather conditions. Minor ashfall was reported in Cepogo (4 km NE) and Boyolali (16 km E). The Alert Level remained at 2 (on a scale of 1-4), and residents were warned to stay outside of the 3-km exclusion zone.
Sources: Pusat Vulkanologi dan Mitigasi Bencana Geologi (PVMBG, also known as CVGHM); Kompas.com; Balai Penyelidikan dan Pengembangan Teknologi Kebencanaan Geologi (BPPTKG)
PVMBG reported that no eruptive events at Merapi were recorded during 18-24 November, though a significant increase in the number of low-frequency earthquakes and increased carbon dioxide emissions were detected on 19 November. The Alert Level remained at 2 (on a scale of 1-4), and residents were warned to stay outside of the 3-km exclusion zone.
Source: Pusat Vulkanologi dan Mitigasi Bencana Geologi (PVMBG, also known as CVGHM)
PVMBG reported that after the eruption at Merapi on 9 November seismicity increased and remained elevated. At 1046 on 17 November an eruption was recorded by the seismic network for two minutes and 35 seconds. An ash plume rose around 1 km above the crater rim and a pyroclastic flow traveled less than 1 km SE down the Gendol drainage. The Alert Level remained at 2 (on a scale of 1-4), and residents were warned to stay outside of the 3-km exclusion zone.
Source: Pusat Vulkanologi dan Mitigasi Bencana Geologi (PVMBG, also known as CVGHM)
PVMBG reported that at 0621 on 9 November an eruption was detected by the seismic network at Merapi and lasted two minutes and 40 seconds. A pyroclastic flow traveled 2 km down the Gendol drainage on the SE flank and an ash plume rose around 1.5 km above the summit. Minor ashfall was reported in areas to the W as far as 15 km away, including Wonolelo, Sawangan, Magelang, and Tlogolele. The event did not notably impact the morphology of the lava dome and the drainage. The Alert Level remained at 2 (on a scale of 1-4), and residents were warned to stay outside of the 3-km exclusion zone.
Source: Pusat Vulkanologi dan Mitigasi Bencana Geologi (PVMBG, also known as CVGHM)
PVMBG reported that an eruption at Merapi at 1631 on 14 October generated an ash plume that rose 3 km above the summit and caused ashfall in areas as far as 25 km SW. A pyroclastic flow traveled 2 km down the Gendol drainage on the SW flank. The event changed the shape of the dome by removing a NE-SW trending section that was 100 m long, 30 m wide, and 20 m deep. Lava continued to extrude during 14-20 October, generating at least two block-and-ash flows that traveled 1 km down the Gendol drainage. Foggy conditions sometimes prevented visual observations. White emissions rose as high as 500 m above the summit. The Alert Level remained at 2 (on a scale of 1-4), and residents were warned to stay outside of the 3-km exclusion zone.
Source: Pusat Vulkanologi dan Mitigasi Bencana Geologi (PVMBG, also known as CVGHM)
PVMBG reported that the lava dome at Merapi slowly grew during 3-10 October and was an estimated 468,000 cubic meters, based on 19 September drone photos. At 1631 on 14 October an eruptive event was recorded by the seismic network for four minutes and 30 seconds. A plume rose 3 km above the summit and drifted SW, causing ashfall 30 minutes after the eruption until 1900 in areas as far as 25 km W. A pyroclastic flow traveled down the SW flank. The Alert Level remained at 2 (on a scale of 1-4), and residents were warned to stay outside of the 3-km exclusion zone.
Source: Pusat Vulkanologi dan Mitigasi Bencana Geologi (PVMBG, also known as CVGHM)
PVMBG reported that the lava dome at Merapi slowly grew during 20-26 September and was an estimated 468,000 cubic meters, based on 19 September measurements based on drone photos. Extruded lava fell into the upper parts of the SE flank, generating three block-and-ash flows that traveled as far as 1.5 km down the Gendol drainage. Diffuse white plumes rose as high as 75 m above the summit. The Alert Level remained at 2 (on a scale of 1-4), and residents were warned to stay outside of the 3-km exclusion zone.
Source: Pusat Vulkanologi dan Mitigasi Bencana Geologi (PVMBG, also known as CVGHM)
PVMBG reported that the lava dome at Merapi slowly grew during 16-22 September and was an estimated 468,000 cubic meters, based on 19 September measurements from drone photos. Extruded lava fell into the upper parts of the SE flank, generating block-and-ash flows that traveled as far as 1.3 km down the Gendol drainage during 17 and 20-21 September. Diffuse white plumes rose as high as 100 m above the summit. At 1136 on 22 September the seismic network began recording signals indicating pyroclastic-flow generation, that lasted two minutes and five seconds; pyroclastic flows traveled 1.2 km down the Gendol drainage. An ash plume rose around 800 m above the summit and caused minor ashfall in areas as far as 15 km SW. Temperature increases at several points on the lava dome were recorded about one hour before the event. The Alert Level remained at 2 (on a scale of 1-4), and residents were warned to stay outside of the 3-km exclusion zone.
Source: Pusat Vulkanologi dan Mitigasi Bencana Geologi (PVMBG, also known as CVGHM)
PVMBG reported that during 9-15 September the lava-dome volume at Merapi did not change and was an estimated 461,000 cubic meters, based on analyses of drone images on 8 August. Extruded lava fell into the upper parts of the SE flank, generating block-and-ash flows that traveled as far as 1.1 km down the Gendol drainage. Diffuse white plumes rose as high as 100 m above the summit. The Alert Level remained at 2 (on a scale of 1-4), and residents were warned to stay outside of the 3-km exclusion zone.
Source: Pusat Vulkanologi dan Mitigasi Bencana Geologi (PVMBG, also known as CVGHM)
PVMBG reported that during 26 August-1 September the lava-dome volume at Merapi did not change and was an estimated 461,000 cubic meters, based on analyses of drone images on 8 August. Extruded lava fell into the upper parts of the SE flank, generating block-and-ash flows that traveled down the Gendol drainage; a block-and-ash flow traveled 2 km on 27 August. Diffuse white plumes rose as high as 80 m above the summit. The Alert Level remained at 2 (on a scale of 1-4), and residents were warned to stay outside of the 3-km exclusion zone.
Source: Pusat Vulkanologi dan Mitigasi Bencana Geologi (PVMBG, also known as CVGHM)
PVMBG reported that during 26 August-1 September the lava-dome volume at Merapi did not change and was an estimated 461,000 cubic meters, based on analyses of drone images on 8 August. Extruded lava fell into the upper parts of the SE flank, generating block-and-ash flows that traveled down the Gendol drainage; one flow traveled 2 km on 27 August. Diffuse white plumes rose as high as 80 m above the summit. The Alert Level remained at 2 (on a scale of 1-4), and residents were warned to stay outside of the 3-km exclusion zone.
Source: Pusat Vulkanologi dan Mitigasi Bencana Geologi (PVMBG, also known as CVGHM)
PVMBG reported that during 19-25 August the lava-dome volume at Merapi did not change and was an estimated 461,000 cubic meters, based on analyses of drone images on 8 August. Extruded lava fell into the upper parts of the SE flank, generating block-and-ash flows that traveled as far as 1.9 km down the Gendol drainage: twice on 20 August, once each on 22 and 24 August, and 16 times during 25-27 August. At 1809 on 27 August a block-and-ash flow traveled 2 km. Diffuse white plumes rose as high as 350 m above the summit. The Alert Level remained at 2 (on a scale of 1-4), and residents were warned to stay outside of the 3-km exclusion zone.
Source: Pusat Vulkanologi dan Mitigasi Bencana Geologi (PVMBG, also known as CVGHM)
PVMBG reported that during 12-18 August the lava-dome volume at Merapi did not change and was an estimated 461,000 cubic meters, based on analyses of drone images. Extruded lava fell into the upper parts of the SE flank, generating a total of two block-and-ash flows that traveled as far as 950 m down the Gendol drainage on 13 and 14 August. Diffuse white plumes rose as high as 100 m above the summit on some days. The Alert Level remained at 2 (on a scale of 1-4), and residents were warned to stay outside of the 3-km exclusion zone.
Source: Pusat Vulkanologi dan Mitigasi Bencana Geologi (PVMBG, also known as CVGHM)
PVMBG reported that during 5-11 August the lava-dome volume at Merapi had decreased compared to the week before and was an estimated 461,000 cubic meters, based on analyses of drone images. Extruded lava fell into the upper parts of the SE-flank, generating a total of two block-and-ash flows that traveled as far as 1.2 km down the Gendol drainage on 4 and 6 August. Diffuse white plumes rose as high as 50 m above the summit on some days. The Alert Level remained at 2 (on a scale of 1-4), and residents were warned to stay outside of the 3-km exclusion zone.
Source: Pusat Vulkanologi dan Mitigasi Bencana Geologi (PVMBG, also known as CVGHM)
PVMBG reported that during 29 July-4 August the lava-dome volume at Merapi did not change and was an estimated 475,000 cubic meters, based on analyses of drone images. Extruded lava fell into the upper parts of the SE-flank, generating a total of four block-and-ash flows that traveled as far as 1 km down the Gendol drainage on 31 July and 4 August. Diffuse white plumes rose as high as 50 m above the summit on some days. The Alert Level remained at 2 (on a scale of 1-4), and residents were warned to stay outside of the 3-km exclusion zone.
Source: Pusat Vulkanologi dan Mitigasi Bencana Geologi (PVMBG, also known as CVGHM)
PVMBG reported that during 22-28 July the lava-dome volume at Merapi did not change and was an estimated 475,000 cubic meters, based on analyses of drone images. Extruded lava fell into the upper parts of the SE-flank, generating two block-and-ash flows that traveled 1,000 m and 950 m down the Gendol drainage on 24 and 27 July, respectively. Diffuse white plumes rose as high as 50 m above the summit on some days. The Alert Level remained at 2 (on a scale of 1-4), and residents were warned to remain outside of the 3-km exclusion zone.
Source: Pusat Vulkanologi dan Mitigasi Bencana Geologi (PVMBG, also known as CVGHM)
PVMBG reported that during 15-21 July the lava-dome volume at Merapi did not change and was an estimated 475,000 cubic meters, based on analyses of drone images. Extruded lava fell into the upper parts of the SE-flank, generating three block-and-ash flows that traveled 1.2 km down the Gendol drainage on 21 July. White plumes rose as high as 50 m above the summit. The Alert Level remained at 2 (on a scale of 1-4), and residents were warned to remain outside of the 3-km exclusion zone.
Source: Pusat Vulkanologi dan Mitigasi Bencana Geologi (PVMBG, also known as CVGHM)
PVMBG reported that during 8-14 July the lava-dome volume at Merapi did not change and was an estimated 475,000 cubic meters, based on analyses of drone images. Extruded lava fell into the upper parts of the SE-flank, generating two block-and-ash flows that traveled 1 km down the Gendol drainage on 13 and 14 July. White plumes rose as high as 300 m above the summit. The Alert Level remained at 2 (on a scale of 1-4), and residents were warned to remain outside of the 3-km exclusion zone.
Source: Pusat Vulkanologi dan Mitigasi Bencana Geologi (PVMBG, also known as CVGHM)
PVMBG reported that during 28 June-4 July the lava-dome volume at Merapi did not significantly change and was an estimated 475,000 cubic meters, based on analyses of drone images taken on 4 July. Extruded lava fell into the upper parts of the SE flank, generating one block-and-ash flow that traveled 1.1 km down the Gendol drainage on 1 July. White plumes rose as high as 200 m above the summit. The Alert Level remained at 2 (on a scale of 1-4), and residents were warned to remain outside of the 3-km exclusion zone.
Source: Pusat Vulkanologi dan Mitigasi Bencana Geologi (PVMBG, also known as CVGHM)
PVMBG reported that during 17-23 June the lava-dome volume at Merapi did not change and was an estimated 458,000 cubic meters, based on analyses of drone images. Extruded lava fell into the upper parts of the SE-flank, generating two block-and-ash flows that traveled 1.2 km down the Gendol drainage on 17 and 20 June. White plumes rose as high as 500 m above the summit. The Alert Level remained at 2 (on a scale of 1-4), and residents were warned to remain outside of the 3-km exclusion zone.
Source: Pusat Vulkanologi dan Mitigasi Bencana Geologi (PVMBG, also known as CVGHM)
PVMBG reported that during 3-10 June the lava-dome volume at Merapi did not change and was an estimated 458,000 cubic meters, based on analyses of drone footage. Extruded lava fell into the upper parts of the SE-flank, generating one block-and-ash flow that traveled 1 km down the Gendol drainage on 9 June. White plumes rose as high as 75 m above the summit. The Alert Level remained at 2 (on a scale of 1-4), and residents were warned to remain outside of the 3-km exclusion zone.
Source: Pusat Vulkanologi dan Mitigasi Bencana Geologi (PVMBG, also known as CVGHM)
PVMBG reported that during 24-30 May the lava-dome volume at Merapi did not change and was an estimated 458,000 cubic meters, based on analyses of drone footage. Extruded lava fell into the upper parts of the SE flank, generating one block-and-ash flow that traveled 1.1 km down the Gendol drainage. White plumes rose as high as 400 m above the summit. A news article stated that block-and-ash flows descended the Gendol drainage during 1-2 June, traveling as far as 1.2 km. In addition, incandescent dome material traveled 750 m on 2 June. The Alert Level remained at 2 (on a scale of 1-4), and residents were warned to remain outside of the 3-km exclusion zone.
Sources: Pusat Vulkanologi dan Mitigasi Bencana Geologi (PVMBG, also known as CVGHM); D News Radio
PVMBG reported that on 11 May the lava dome at Merapi had an estimated volume of 458,000 cubic meters, based on analyses of drone footage, and remained unchanged at least through 26 May. The dome morphology remained relatively unchanged, as most of the extruded lava fell into the upper parts of the SE-flank Gendol River drainage. One block-and-ash flow traveled 1.1 km down the Gendol drainage. The Alert Level remained at 2 (on a scale of 1-4), and residents were warned to remain outside of the 3-km exclusion zone.
Source: Pusat Vulkanologi dan Mitigasi Bencana Geologi (PVMBG, also known as CVGHM)
PVMBG reported that on 11 May the lava dome at Merapi had an estimated volume of 458,000 cubic meters, based on analyses of drone footage. The dome morphology remained relatively unchanged during 12-19 May, as most of the extruded lava fell into the upper parts of the SE-flank Gendol River drainage. Two block-and-ash flows traveled as far as 1.2 km down the Gendol drainage. The Alert Level remained at 2 (on a scale of 1-4), and residents were warned to remain outside of the 3-km exclusion zone.
Source: Pusat Vulkanologi dan Mitigasi Bencana Geologi (PVMBG, also known as CVGHM)
PVMBG reported that during 22-28 April the lava dome at Merapi continued to grow slowly, with any extruded material channeled into the SE-flank Gendol River drainage. White emissions rose 70 m. Five block-and-ash flows traveled as far as 1.2 km in the Gendol drainage on 24 April. The Alert Level remained at 2 (on a scale of 1-4), and residents were warned to remain outside of the 3-km exclusion zone.
Source: Pusat Vulkanologi dan Mitigasi Bencana Geologi (PVMBG, also known as CVGHM)
PVMBG reported that during 15-21 April the lava dome at Merapi continued to grow slowly, with any extruded material channeled into the SE-flank Gendol River drainage. White emissions rose 70 m. Block-and-ash flows traveled as far as 1.5 km in the Gendol drainage on 21 April. The Alert Level remained at 2 (on a scale of 1-4), and residents were warned to remain outside of the 3-km exclusion zone.
Source: Pusat Vulkanologi dan Mitigasi Bencana Geologi (PVMBG, also known as CVGHM)
PVMBG reported that during 5-11 April the lava dome at Merapi continued to grow slowly, with extruded material channeled into the SE-flank Gendol River drainage. The Alert Level remained at 2 (on a scale of 1-4), and residents were warned to remain outside of the 3-km exclusion zone.
Source: Pusat Vulkanologi dan Mitigasi Bencana Geologi (PVMBG, also known as CVGHM)
PVMBG reported that by 21 March the lava dome at Merapi had grown to an estimated volume of 472,000 cubic meters, based on analyses of drone footage. It remained relatively unchanged during 1-7 April, as most of the extruded lava fell into the upper parts of the SE-flank Gendol River drainage. Two block-and-ash flows traveled as far as 1 km down the Gendol drainage. The Alert Level remained at 2 (on a scale of 1-4), and residents were warned to remain outside of the 3-km exclusion zone.
Source: Pusat Vulkanologi dan Mitigasi Bencana Geologi (PVMBG, also known as CVGHM)
PVMBG reported that by 21 March Merapi’s lava dome had grown to an estimated volume of 472,000 cubic meters, based on analyses of drone footage, and remained relatively unchanged during 22-28 March; most of the extruded lava fell into the upper parts of the Gendol River drainage on the SE flank. As many as eight block-and-ash flows traveled up to 1,500 m down the Gendol drainage. The Alert Level remained at 2 (on a scale of 1-4), and residents were warned to remain outside of the 3-km exclusion zone.
Source: Pusat Vulkanologi dan Mitigasi Bencana Geologi (PVMBG, also known as CVGHM)
PVMBG reported that the slow extrusion of a lava dome in Merapi’s summit crater continued during 17-24 March. By 21 March the lava dome had grown to an estimated size of 472,000 cubic meters based on analyses of drone footage. There were no apparent morphological changes; most of the extruded lava fell into the upper parts of the Gendol River drainage on the SE flank. Block-and-ash flows traveled as far as 1,500 m down the Gendol drainage during 18-19 and 23 March. The Alert Level remained at 2 (on a scale of 1-4), and residents were warned to remain outside of the 3-km exclusion zone.
Source: Pusat Vulkanologi dan Mitigasi Bencana Geologi (PVMBG, also known as CVGHM)
PVMBG reported that the slow extrusion of a lava dome in Merapi’s summit crater continued during 11-17 March. The volume of the lava dome had not changed since the last measurement of 470,000 cubic meters estimated on 5 March. There were no apparent morphological changes; most of the extruded lava fell into the upper parts of the Gendol River drainage on the SE flank. Block-and-ash flows traveled as far as 1,500 m down the Gendol drainage on 12, 15, and 17 March. The Alert Level remained at 2 (on a scale of 1-4), and residents were warned to remain outside of the 3-km exclusion zone.
Source: Pusat Vulkanologi dan Mitigasi Bencana Geologi (PVMBG, also known as CVGHM)
PVMBG reported that during 1-12 March white-and-gray emissions of variable density rose as high as 1 km above Merapi’s summit. The volume of the lava dome was 470,000 cubic meters on 5 March, as estimated from drone photographs, and relatively unchanged from the previous weeks. There were no apparent morphological changes; most of the extruded lava fell into the upper parts of the Gendol River drainage on the SE flank. Block-and-ash flows traveled 500-1,900 m down the Gendol drainage on 2, 3, and 7. The Alert Level remained at 2 (on a scale of 1-4), and residents were warned to remain outside of the 3-km exclusion zone.
Source: Pusat Vulkanologi dan Mitigasi Bencana Geologi (PVMBG, also known as CVGHM)
PVMBG reported that during 22 February-5 March the volume of the lava dome in Merapi’s summit crater had not changed since the last measurement of 466,000 cubic meters estimated on 21 February. There were no apparent morphological changes; most of the extruded lava fell into the upper parts of the Gendol River drainage on the SE flank. Block-and-ash flows traveled 600-1,100 m down the Gendol drainage on 25 and 27 February, and on 2 March as many as 10 traveled as far as 2 km. Incandescent avalanches were visible at night. The Alert Level remained at 2 (on a scale of 1-4), and residents were warned to remain outside of the 3-km exclusion zone.
Source: Pusat Vulkanologi dan Mitigasi Bencana Geologi (PVMBG, also known as CVGHM)
PVMBG reported that during 15-21 February the volume of the lava dome in Merapi’s summit crater was unchanged from the previous few weeks. There were no apparent morphological changes; most of the extruded lava fell into the upper parts of the Gendol River drainage on the SE flank. White emissions rose as high as 375 m above the crater rim. On 18 February multiple block-and-ash flows traveled at most 1 km down the Gendol drainage. The Alert Level remained at 2 (on a scale of 1-4), and residents were warned to remain outside of the 3-km exclusion zone.
Source: Pusat Vulkanologi dan Mitigasi Bencana Geologi (PVMBG, also known as CVGHM)
PVMBG reported that during 8-17 February the volume of the lava dome in Merapi’s summit crater was about the same as the previous week, and there were no apparent morphological changes. Most of the extruded lava did not add to the dome volume but instead fell into the upper parts of the Gendol River drainage and the SE flank. Incandescent avalanches traveling down the SE flank were visible at night. At 0858 on 11 February a pyroclastic flow traveled 400 m down the Gendol drainage. The Alert Level remained at 2 (on a scale of 1-4), and residents were warned to remain outside of the 3-km exclusion zone.
Source: Pusat Vulkanologi dan Mitigasi Bencana Geologi (PVMBG, also known as CVGHM)
PVMBG reported that during 1-11 February the volume of the lava dome in Merapi’s summit crater was about the same as the previous week’s estimate of 461,000 cubic meters, and there were no apparent morphological changes. Most of the extruded lava fell into the upper parts of the Gendol River drainage and the SE flank. On 7 February a pyroclastic flow traveled 2 km down the Gendol drainage. The Alert Level remained at 2 (on a scale of 1-4), and residents were warned to remain outside of the 3-km exclusion zone.
Source: Pusat Vulkanologi dan Mitigasi Bencana Geologi (PVMBG, also known as CVGHM)
PVMBG reported that during 25-31 January the volume of the lava dome in Merapi’s summit crater was 461,000 cubic meters, relatively unchanged from the previous week. During 0000-2000 on 29 January as many as nine incandescent rockfall events were recorded, with material traveling 200-700 m SE in the Gendol River drainage. Three pyroclastic flows, recorded at 2017, 2053, and 2141, traveled 1.1-1.4 km down the Gendol drainage, and produced minor ashfall in areas E including Boyolali (17 km E), Mriyan (5 km E), and Mojosongo (44 km E). The Alert Level remained at 2 (on a scale of 1-4), and residents were warned to remain outside of the 3-km exclusion zone.
Source: Pusat Vulkanologi dan Mitigasi Bencana Geologi (PVMBG, also known as CVGHM)
PVMBG reported that during 7-13 December the lava dome in Merapi’s summit crater grew at a rate of 2,200 cubic meters per day. By 13 December the volume of the dome, based on photos taken from the SE, was an estimated 359,000 cubic meters. White emissions of variable density rose a maximum of 200 m above the summit. The Alert Level remained at 2 (on a scale of 1-4), and residents were warned to remain outside of the 3-km exclusion zone.
Source: Pusat Vulkanologi dan Mitigasi Bencana Geologi (PVMBG, also known as CVGHM)
PVMBG reported that during 30 November-6 December the lava dome in Merapi’s summit crater grew at a rate of 2,200 cubic meters per day. By 6 December the volume of the dome, based on photos taken from the SE, was an estimated 344,000 cubic meters. White emissions of variable density rose a maximum of 150 m above the summit. The Alert Level remained at 2 (on a scale of 1-4), and residents were warned to remain outside of the 3-km exclusion zone.
Source: Pusat Vulkanologi dan Mitigasi Bencana Geologi (PVMBG, also known as CVGHM)
PVMBG reported that during 23-29 November the lava dome in Merapi’s summit crater grew at a rate of 2,500 cubic meters per day. By 29 November the volume of the dome, based on photos taken from the SE, was an estimated 329,000 cubic meters. White emissions of variable density rose a maximum of 400 m above the summit. The Alert Level remained at 2 (on a scale of 1-4), and residents were warned to remain outside of the 3-km exclusion zone.
Source: Pusat Vulkanologi dan Mitigasi Bencana Geologi (PVMBG, also known as CVGHM)
PVMBG reported that during 16-22 November the lava dome in Merapi’s summit crater grew at a rate of 2,600 cubic meters per day, slower than the previous week. By 21 November the volume of the dome, based on photos taken from the SE, was an estimated 308,000 cubic meters. White emissions of variable density rose a maximum of 125 m above the summit. The Alert Level remained at 2 (on a scale of 1-4), and residents were warned to remain outside of the 3-km exclusion zone.
Source: Pusat Vulkanologi dan Mitigasi Bencana Geologi (PVMBG, also known as CVGHM)
PVMBG reported that during 9-15 November the lava dome in Merapi’s summit crater grew at a rate of 2,400 cubic meters per day, slower than the previous week. By 14 November the volume of the dome, based on photos from the SE sector, was an estimated 290,000 cubic meters. White emissions of variable density rose a maximum of 200 m above the summit. The Alert Level remained at 2 (on a scale of 1-4), and residents were warned to remain outside of the 3-km exclusion zone.
Source: Pusat Vulkanologi dan Mitigasi Bencana Geologi (PVMBG, also known as CVGHM)
PVMBG reported that during 2-8 November the lava dome in Merapi’s summit crater grew slowly at a rate of 3,500 cubic meters per day, faster than the previous week. By 7 November the volume of the dome, based on photos from the SE sector, was an estimated 273,000 cubic meters. White emissions of variable density rose a maximum of 100 m above the summit. The Alert Level remained at 2 (on a scale of 1-4), and residents were warned to remain outside of the 3-km exclusion zone.
Source: Pusat Vulkanologi dan Mitigasi Bencana Geologi (PVMBG, also known as CVGHM)
PVMBG reported that during 26 October-1 November the lava dome in Merapi’s summit crater grew slowly at a rate of 2,900 cubic meters per day, slower than the previous week. By 31 October the volume of the dome, based on photos from the SE sector, was an estimated 248,000 cubic meters. White emissions of variable density rose a maximum of 50 m above the summit. The Alert Level remained at 2 (on a scale of 1-4), and residents were warned to remain outside of the 3-km exclusion zone.
Source: Pusat Vulkanologi dan Mitigasi Bencana Geologi (PVMBG, also known as CVGHM)
PVMBG reported that during 19-25 October the lava dome in Merapi’s summit crater grew slowly at a rate of 6,100 cubic meters per day, similar to the previous week. By 21 October the volume of the dome, based on photos from the SE sector, was an estimated 219,000 cubic meters. White emissions of variable density rose a maximum of 50 m above the summit. The Alert Level remained at 2 (on a scale of 1-4), and residents were warned to remain outside of the 3-km exclusion zone.
Source: Pusat Vulkanologi dan Mitigasi Bencana Geologi (PVMBG, also known as CVGHM)
PVMBG reported that during 12-18 October the lava dome in Merapi’s summit crater grew at a rate of 6,200 cubic meters per day, faster than the previous week. By 18 October the volume of the dome, based on photos from the SE sector, was an estimated 201,000 cubic meters. White emissions of variable density rose a maximum of 100 m above the summit. The Alert Level remained at 2 (on a scale of 1-4), and residents were warned to remain outside of the 3-km exclusion zone.
Source: Pusat Vulkanologi dan Mitigasi Bencana Geologi (PVMBG, also known as CVGHM)
PVMBG reported that during 5-11 October the lava dome in Merapi’s summit crater grew slowly at a rate of 3,100 cubic meters per day, though faster than the previous week. By 11 October the volume of the dome was an estimated 160,000 cubic meters. White emissions of variable density rose a maximum of 75 m above the summit. The Alert Level remained at 2 (on a scale of 1-4), and residents were warned to remain outside of the 3-km exclusion zone.
Source: Pusat Vulkanologi dan Mitigasi Bencana Geologi (PVMBG, also known as CVGHM)
PVMBG reported that during 28 September-4 October the lava dome in Merapi’s summit crater continued to slowly grow. By 4 October the volume of the lava dome was an estimated 135,000 cubic meters, and the growth rate was 1,000 cubic meters per day (similar to the previous week). White emissions of variable density rose a maximum of 75 m above the summit. The Alert Level remained at 2 (on a scale of 1-4), and resident were warned to remain outside of the 3-km exclusion zone.
Source: Pusat Vulkanologi dan Mitigasi Bencana Geologi (PVMBG, also known as CVGHM)
PVMBG reported that during 21-27 September the new lava dome in Merapi’s summit crater continued to slowly grow. By 27 September the volume of the lava dome was an estimated 129,000 cubic meters, and the growth rate was 1,000 cubic meters per day (slower than the previous week). White emissions of variable density rose a maximum of 450 m above the summit. The Alert Level remained at 2 (on a scale of 1-4), and resident were warned to remain outside of the 3-km exclusion zone.
Source: Pusat Vulkanologi dan Mitigasi Bencana Geologi (PVMBG, also known as CVGHM)
PVMBG reported that during 17-23 September the new lava dome in Merapi’s summit crater continued to slowly grow. By 22 September the volume of the lava dome was an estimated 113,000 cubic meters, and the growth rate was 3,000 cubic meters per day. White emissions of variable density rose 100 m above the summit. The Alert Level remained at 2 (on a scale of 1-4), and resident were warned to remain outside of the 3-km exclusion zone.
Source: Pusat Vulkanologi dan Mitigasi Bencana Geologi (PVMBG, also known as CVGHM)
PVMBG reported that during 10-16 September the new lava dome in Merapi’s summit crater continued to slowly grow. By 16 September the volume of the lava dome was an estimated 112,000 cubic meters, and the growth rate was 1,600 cubic meters per day. White emissions of variable density rose 20 m above the summit. The Alert Level remained at 2 (on a scale of 1-4), and resident were warned to remain outside of the 3-km exclusion zone.
Source: Pusat Vulkanologi dan Mitigasi Bencana Geologi (PVMBG, also known as CVGHM)
PVMBG reported that the new lava dome within the fracture of Merapi’s 2010 dome grew at a rate of 4,300 cubic meters per day during 18-28 August, and by 28 August the volume of the lava dome was an estimated 44,000 cubic meters. The Alert Level remained at 2 (on a scale of 1-4), and resident were warned to remain outside of the 3-km exclusion zone.
Source: Pusat Vulkanologi dan Mitigasi Bencana Geologi (PVMBG, also known as CVGHM)
PVMBG reported that seismicity at Merapi increased on 18 July, and again on 29 July. On 11 August a large earthquake was detected, and coupled with rumbling heard by Deles residents, possibly signaled new lava-dome effusion. Drone photos on 12 August showed a new lava dome growing within the fracture of the 2010 dome. By 18 August the new dome was 55 m long and 25 m wide, and about 5 m below the 2010 dome surface. The Alert Level remained at 2 (on a scale of 1-4), and resident were warned to remain outside of the 3-km exclusion zone.
Source: Pusat Vulkanologi dan Mitigasi Bencana Geologi (PVMBG, also known as CVGHM)
PVMBG reported that at 0820 on 1 June an event at Merapi generated an ash plume that rose at least 6 km above the crater rim and drifted NW, but then winds changed to the SW. Ashfall was reported at the Selo observation post. Observers noted white smoke rising from a forested area 1.5 km NW, possibly indicating burning vegetation. The report noted that volcano-tectonic events were occurring at about 3 km below the crater. Later that day at 2024 an ash plume from a 1.5-minute-long event rose 2.5 km above the crater rim and drifted NE and W. At 2100 an ash plume rose 1 km and drifted NW. The Alert Level remained at 2 (on a scale of 1-4), and PVMBG noted that all people within 3 km of the summit should be evacuated.
Source: Pusat Vulkanologi dan Mitigasi Bencana Geologi (PVMBG, also known as CVGHM)
PVMBG reported that a two-minute-long phreatic eruption at Merapi which began at 1349 on 23 May was heard from the Babadan observation post. A plume was not visible due to inclement weather, though minor ashfall was reported in Ngepos post. On 24 May an event at 0256 generated an ash plume that rose 6 km above the crater rim and drifted W. Roaring was heard from all of the Merapi observation posts. A two-minute-long event at 1048 produced an ash plume that rose 1.5 km and drifted W. The Alert Level remained at 2 (on a scale of 1-4), and PVMBG noted that all people within 3 km of the summit should be evacuated.
Source: Pusat Vulkanologi dan Mitigasi Bencana Geologi (PVMBG, also known as CVGHM)
PVMBG reported that a phreatic eruption at Merapi began at 0125 on 21 May and lasted for 19 minutes, generating an ash plume that rose 700 m above the crater and drifted W. A six-minute-long phreatic eruption began at 0938 and produced an ash plume that rose 1.2 km above the crater. Ashfall from both events was reported in areas 15 km downwind. A third event, detected at 1750, lasted three minutes and produced a plume of unknown height. After the events one volcano-tectonic earthquake and one tremor event were recorded. The seismicity along with increased phreatic events prompted PVMBG to raise the Alert Level to 2 (on a scale of 1-4).
Source: Pusat Vulkanologi dan Mitigasi Bencana Geologi (PVMBG, also known as CVGHM)
PVMBG reported that an explosive eruption occurred at 0740 on 11 May. The eruption began with a small roar and vibrations that were felt at the observation post for 10 minutes. The eruption plume rose to 5.5 km (18,000 ft) above the peak. There was no seismic precursor and no seismic activity continued after the event. PVMBG did not change the alert level from Green/Normal; they interpreted the event as a minor eruption triggered by the accumulation of volcanic gases unlikely to be followed by further eruptions.
Sources: Pusat Vulkanologi dan Mitigasi Bencana Geologi (PVMBG, also known as CVGHM); Jakarta Post
BNPB reported that a lahar induced by moderate to heavy rain swept nine sand mining trucks down the Bebeng River on Merapi's SW flank; at least one truck was buried and six were severely damaged. There were no fatalities as the miners and other people at the scene escaped. Material at the summit and on the flanks produced during the October-November 2010 eruption was an estimated 20-25 million cubic meters, contributing to the continuing high potential of lahars during heavy rain. BNPB recommended that the public remain vigilant during rainy weather because a lahar formed on the upper flanks of Merapi can reach the bottom in less than 30 minutes. The Alert Level remained at 1 (on a scale of 1-4).
Source: Badan Nacional Penanggulangan Bencana (BNPB)
PVMBG reported that during 4-10 July seismicity at Merapi fluctuated at normal levels. Deformation measurements showed general inflation. Solfatara plumes rose 450 m above the summit on 4 July. The Alert Level remained at 1 (on a scale of 1-4).
Source: Pusat Vulkanologi dan Mitigasi Bencana Geologi (PVMBG, also known as CVGHM)
PVMBG reported that during 30 May-5 June seismicity at Merapi fluctuated at normal levels and declined as compared to the previous two weeks. Deformation measurements showed no significant changes. Solfatara plumes rose 400 m and drifted W on 31 May. The Alert Level remained at 1 (on a scale of 1-4).
Source: Pusat Vulkanologi dan Mitigasi Bencana Geologi (PVMBG, also known as CVGHM)
PVMBG reported that during 16-22 May seismicity at Merapi fluctuated at normal levels and deformation measurements showed no significant changes. Solfatara plumes rose 300 m and drifted W on 27 May. The Alert Level remained at 1 (on a scale of 1-4) on 23 May.
Source: Pusat Vulkanologi dan Mitigasi Bencana Geologi (PVMBG, also known as CVGHM)
PVMBG reported that seismicity at Merapi decreased during 16-22 May, as compared to the previous week. No deformation was detected. The Alert Level was lowered to 1 (on a scale of 1-4) on 23 May.
Source: Pusat Vulkanologi dan Mitigasi Bencana Geologi (PVMBG, also known as CVGHM)
PVMBG reported that seismicity at Merapi decreased during 9-15 May, as compared to the previous week. Thumping noises continued to be reported from multiple observation posts, and on 12 May fumarolic plumes rose 350 m. The Alert Level remained at 2 (on a scale of 1-4) on 29 April.
Source: Pusat Vulkanologi dan Mitigasi Bencana Geologi (PVMBG, also known as CVGHM)
PVMBG reported that during 2-8 May white plumes rose as high as 650 m above Merapi. Thumping noises continued to be reported from multiple observation posts. Seismicity fluctuated but remained above background levels. The Alert Level remained at 2 (on a scale of 1-4) on 29 April.
Source: Pusat Vulkanologi dan Mitigasi Bencana Geologi (PVMBG, also known as CVGHM)
PVMBG reported that during 20-29 April seismicity at Merapi increased and thumping sounds were heard within an 8 km radius. On 25 April white fumarolic plumes rose 450 m and drifted W. The Alert Level was raised to 2 (on a scale of 1-4) on 29 April.
Source: Pusat Vulkanologi dan Mitigasi Bencana Geologi (PVMBG, also known as CVGHM)
PVMBG reported that field observations of Merapi conducted two days after the explosion on 20 April revealed that a fracture in the dome had widened 70 m to the W, and new material had been deposited in the W part of the crater. The Alert Level remained at 1 (on a scale of 1-4).
Source: Pusat Vulkanologi dan Mitigasi Bencana Geologi (PVMBG, also known as CVGHM)
PVMBG reported that Merapi observers at the Ngepos post noted white plumes rising 300 m above the lava dome on 15 April. Seismicity increased during 18-20 April. During 0426-0440 on 20 April an explosion occurred and rumbling was heard in areas as far as 8 km away. Ash plumes were observed from some observations posts, but foggy conditions prevented views from others. Based on satellite images and wind data, the Darwin VAAC reported that an ash plume rose to an altitude of 10.7 km (35,000 ft) a.s.l. and drifted 260 km WNW. PVMBG noted that ashfall was reported in areas within 15 km S, SW, and W. The Alert Level remained at 1 (on a scale of 1-4).
Sources: Pusat Vulkanologi dan Mitigasi Bencana Geologi (PVMBG, also known as CVGHM); Darwin Volcanic Ash Advisory Centre (VAAC)
PVMBG reported explosions from Merapi on 9 March. An explosion detected at 0654 was followed by a plume observed on CCTV from Pasarbubar that drifted W. Two Explosions were also recorded at 0655. At 0708 a volcanic earthquake occurred and CCTV in Market Bubar recorded brown plumes that rose 1.5 km above the crater. At 0730 ash fell in the villages of Umbulharjo (30 km S), Kepuharjo, Sidorejo (27 km NNE), and Balerante (6 km SSE). During 14-20 March dense gas plumes rose 600 m. Seismicity was at normal levels. The Alert Level remained at 1 (on a scale of 1-4).
Based on analysis of satellite images, the Darwin VAAC reported that on 27 March an ash plume rose to an altitude of 9.8 km (32,000 ft) a.s.l. and drifted SE. The VAAC noted that an eruption occurred around 0630, confirmed by a news article. Ash had dissipated the next day. Another news article noted that the increased activity lasted only four minutes, from 0112 to 0116, and that ashfall occurred on the S and SE flanks.
Sources: Pusat Vulkanologi dan Mitigasi Bencana Geologi (PVMBG, also known as CVGHM); Darwin Volcanic Ash Advisory Centre (VAAC); The Jakarta Post; The Jakarta Post
According to news articles, a phreatic eruption at Merapi on 18 November produced an ash plume that rose 2 km above the crater and caused ashfall in areas as far as 60 km E. About 600 families from the Glagaharjo village gathered at evacuation assembly points, while others on the W flank evacuated then returned to their homes hours later.
Source: Jakarta Post
Balai Penyelidikan dan Pengembangan Teknologi Kegunungapian (BPPTK) reported that at 0415 on 22 July a booming sound from Merapi was followed by a rising plume observed from multiple observation posts. Ashfall was reported in areas S, including Kaliurang and Balerante. The Alert Level remained at 1 (on a scale from 0-4).
According to news articles, the eruption lasted until about 0530, and generated a dense black plume that rose 1 km. A booming sound was heard 30 km away. Ashfall affected the district of Deles, Tlogowatu, Kemalang, Balerante, Klaten, and Jawa Tengah. Hundreds of residents evacuated but returned to their homes later that day.
Sources: Balai Penyelidikan dan Pengembangan Teknologi Kegunungapian (BPPTK); Bernama; Associated Press
CVGHM reported that during 29 August-4 September white solfatara plumes rose at most 350 m above Merapi and drifted W. On 4 September small avalanches traveled 700 m SW. The Alert Level remained at 2 (on a scale of 1-4). Based on a pilot observation, the Darwin VAAC reported that on 8 September an ash plume rose to an altitude of 3.7 km (12,000 ft) a.s.l. and drifted almost 30 km N.
Sources: Pusat Vulkanologi dan Mitigasi Bencana Geologi (PVMBG, also known as CVGHM); Darwin Volcanic Ash Advisory Centre (VAAC)
According to news articles, on 21 March a lahar traveled through the village of Sleman, approximately 20 km SW of Merapi, burying 21 homes in addition to vehicles and livestock. At least 200 residents were evacuated.
Source: The Jakarta Post
CVGHM reported that gas plumes rose from Merapi during 28 February-6 March. The highest plume which rose 100 m and drifted E was observed on 5 March from the Babadan post on the NW flank. The number of multi-phase (MP) earthquakes was slightly lower compared to the previous week. The Alert Level remained at 2 (on a scale of 1-4).
Source: Pusat Vulkanologi dan Mitigasi Bencana Geologi (PVMBG, also known as CVGHM)
CVGHM reported that the Alert Level for Merapi was lowered to 2 (on a scale of 1-4) on 9 January. During 10-16 January seismicity had decreased compared to the previous week. Gas plumes rose from the crater; on 11 January gas plumes rose to a maximum height of 80 m above the crater. On 12 January avalanches descended the Krasak drainage, traveling 1.5 km SW. Lahars and high water during 15-23 January damaged infrastructure and caused temporary road closures. On 22 January plumes rose 175 m above the crater and drifted E.
Source: Pusat Vulkanologi dan Mitigasi Bencana Geologi (PVMBG, also known as CVGHM)
According to a news article, lahars on Merapi's flanks that occurred on 3 and 9 January caused damage to houses, farms, and infrastructure in multiple villages in the Magelang district, 26 km WNW of Merapi. One death and one injury were reported. On 9 January, the Red Cross evacuated people trapped in their homes in the Sirihan village. An estimated 3,000 people live in the flooded area, but the number of people evacuated was unknown.
Source: IRIN News
CVGHM reported that activity at Merapi declined during 1-3 December. Seismic data showed a decrease in the number of earthquakes as well as amplitude of the events. Deformation measurements did not show any significant changes. Although fog often prevented visual observations or views through webcams, gas plumes were seen rising 500 m above the crater and drifting W. Sulfur dioxide plumes were no longer detected in satellite imagery. CVGHM noted that lahar deposits were seen in multiple drainages and that several bridges had been recently damaged by lahar activity. On 4 December, the Alert Level was lowered to 3 (on a scale of 1-4).
Source: Pusat Vulkanologi dan Mitigasi Bencana Geologi (PVMBG, also known as CVGHM)
CVGHM reported that avalanches on Merapi's flanks were detected by the seismic network during 25-30 November. Although fog often prevented observations, white and brown plumes rising 100 m above the crater drifted SW on 25 November, and brownish plumes rose 300 m above the crater on 27 November. During 27-30 November, white plumes rose 100-800 m above the crater and drifted W, SW, N, and E. Incandescence from the crater was observed through cameras installed at the Merapi museum. According to news articles, a lahar in the Code River that runs through Yogyakarta, 30 km SSW, flooded streets and damaged bridges, and caused about 1,000 residents to evacuate. The Alert Level remained at 4, the highest level, on a scale of 1-4.
Sources: Pusat Vulkanologi dan Mitigasi Bencana Geologi (PVMBG, also known as CVGHM); BNO News
CVGHM reported that on 15 November no pyroclastic flows descended Merapi's flanks and few avalanches were detected compared to the previous day. During 16-18 November, the number of seismic signals and the number of avalanches both continued to decrease. Although fog often prevented observations, a gas-and-ash plume was observed rising 1.5 km above the crater and drifting SW. A steam plume rose 250 m above the crater and drifted W. On 18 November a pyroclastic flow occurred with low intensity. Lahar deposits were seen in multiple drainages. CVGHM noted areas that remained within a 10-20 km danger zone. On 21 November one pyroclastic flow was detected and five were recorded the next day. During 21-23 November avalanches continued to occur. Lahars traveling S on 23 November carried material up to 100 cm in diameter. According to news articles, the Yogyakarta airport resumed operations on 20 November. The death toll from the eruption reached 322 and more than 130,000 people continued to live in temporary shelters.
Based on analysis of satellite imagery, the Darwin VAAC reported that during 16-21 November ash plumes rose to altitudes of 4.6-6.1 km (15,000-20,000 ft) a.s.l. and drifted 55-165 km W and NW.
Sources: Pusat Vulkanologi dan Mitigasi Bencana Geologi (PVMBG, also known as CVGHM); Agence France-Presse (AFP); Darwin Volcanic Ash Advisory Centre (VAAC); Agence France-Presse (AFP)
CVGHM reported that during 10-11 November seismicity from Merapi along with the number of avalanches and pyroclastic flows decreased compared to the previous two days. Lahar deposits were seen in multiple drainages around Merapi at a maximum distance of 16.5 km from the summit.
On 10 November, plumes generally rose 800 m above the crater, but at about 2200 a brownish plume rose to a height of 1.5 km. Heavy ashfall was reported in areas to the WSW and WNW. A 3.5-km-long pyroclastic flow and a 200-m-long avalanche both traveled S in the Gendol drainage. Incandescence from the crater was observed through a closed-circuit television (CCTV) system installed at the Merapi museum. On 11 November, roaring was followed by light ashfall at the Ketep observation post. Plumes, brownish-black at times, rose 800 m above the crater and drifted W and NW. Avalanches again traveled S in the Gendol drainage. One pyroclastic flow was observed through the CCTV traveling 3 km S. A brownish plume rose 1.5 km above the crater. The Alert Level remained at 4 (on a scale of 1-4).
Based on analysis of satellite imagery, the Darwin VAAC reported that during 12-14 November ash plumes drifted 185-280 km SW at an altitude of 7.6 km (25,000 ft) a.s.l. High-altitude sulfur dioxide clouds detected over the Indian Ocean possibly contained ash. In the latter part of 14 November and during 15-16 November, ash plumes rose to altitude of 6.1-7.6 km (20,000-25,000 ft) a.s.l. and drifted 110-130 km S, SW, and W. The sulfur dioxide concentration in the high-level clouds had decreased; the clouds were not thought to contain ash.
During 14-15 November, news articles stated that the death toll from the eruption was over 250, and the Yogyakarta airport had remained closed. About 390,000 residents also began to return home after the "danger zones" were reduced in some areas due to decreased activity during the previous few days.
Sources: Pusat Vulkanologi dan Mitigasi Bencana Geologi (PVMBG, also known as CVGHM); Darwin Volcanic Ash Advisory Centre (VAAC); RTT News; The Jakarta Post; Associated Press
CVGHM reported that during 3-8 November the eruption from Merapi continued at a high level, characterized by incandescent avalanches from the lava dome, pyroclastic flows, ash plumes, and occasional explosions. Visual observations were often difficult due to inclement weather and gas-and-ash plumes from the eruption. On 7 November, a news article stated that since the eruption began on 26 October approximately156 people have died and more that 200,000 people have been displaced.
On 3 November observers stationed at multiple posts reported ash plumes from pyroclastic flows. One pyroclastic flow traveled 10 km, prompting CVGHM to extend the hazard zone to a 15-km-radius and recommend evacuations from several more communities. Another pyroclastic flow traveled 9 km SE later that day. The Darwin VAAC reported that an ash plume rose to an altitude of 18.3 km (60,000 ft) a.s.l. and drifted 110 km W. Ground observers noted a significant eruption, but could not confirm the plume altitude. On 4 November an ash-and-gas plume rose to an altitude of 11 km (36,100 ft) a.s.l., and pyroclastic flows descended the NW, NNW, and N flanks as far as 3 km. Based on analyses of satellite imagery, the Darwin VAAC reported that ash plumes rose to altitudes of 10.7-11.9 km (35,000-39,000 ft) a.s.l. and drifted W. On 5 November, rumbling sounds were heard in areas 30 km away. Pyroclastic flows continued to descend the flanks. Ash fell in Yogyakarta, 30 km SSW, and "sand"-sized tephra fell within 15 km. CVGHM recommended evacuations from several more towns within a 20-km radius.
Activity remained very intense on 6 November. Pyroclastic flows descended the flanks; one traveled 4 km W. Incandescent avalanches traveled 2 km down multiple drainages to the SSE, S, and SSW. Ash plumes rose to an altitude of 7 km (23,000 ft) a.s.l. Flashes from the lava dome were reported from observations posts and incandescent material was ejected above the crater. A subsequent pyroclastic flow sent an ash plume to an altitude of 6 km (19,700 ft) a.s.l. that drifted W, N, and E. Throughout the day, ashfall was heavy on Merapi's flanks, and was observed in surrounding areas including Selo (6 km NNW) and Magelang (26 km WNW). In Muntilan (18 km WSW) tephra and ash depths reached 4 cm. On 5 and 6 November, the Darwin VAAC reported that ash plumes observed in satellite imagery rose to an altitude of 16.8 km (55,000 ft) a.s.l. News articles stated that three airlines cancelled flights to Jakarta due to the ash-induced aviation hazard.
On 7 November, the number of seismic signals indicating pyroclastic flows increased from the previous day. An explosion was heard and ash plumes rose 6 km and drifted W. Lightning was seen from Yogyakarta and ash fell within 10 km. Pyroclastic flows traveled 5 km and lava avalanches moved 600 m S and SW. High-altitude ash plumes drifted SW. According to the Darwin VAAC, during 7-8 November satellite imagery revealed ash plumes drifting 165-220 km W and SW at an altitude of 7.6 km (25,000 ft) a.s.l. On 8 November an SO2 cloud was seen over the Indian Ocean at altitudes of 12.2-15.2 km (40,000-50,000 ft) a.s.l. The airport in Yogyakarta closed. CVGHM reported that incandescent avalanches were sometimes seen through a closed-circuit television system. Ash plumes rose to an altitude of 4.5 km (14,800 ft) a.s.l. and drifted NE.
On 9 November CVGHM noted a reduction in intensity of activity from Merapi; one pyroclastic flow occurred in a 6-hour period. Rumbling sounds were accompanied by an ash plume that rose to an altitude of 4.5 km (14,800 ft) a.s.l. and lava-dome incandescence. Ashfall was reported in Selo and lava avalanches traveled 800 m SSE.
Sources: Pusat Vulkanologi dan Mitigasi Bencana Geologi (PVMBG, also known as CVGHM); Daily Mail; Darwin Volcanic Ash Advisory Centre (VAAC); Jakarta Globe; CNN
According to the Darwin VAAC, ground-based reports indicated an eruption from Merapi on 28 October. Cloud cover prevented satellite observations. CVGHM reported that two pyroclastic flows occurred on 30 October. According to a news article, ash fell in Yogyakarta, 30 km SSW, causing low visibility. CVGHM noted four pyroclastic flows the next day.
On 1 November an eruption began mid-morning with a low-frequency earthquake and avalanches. About seven pyroclastic flows occurred during the next few hours, traveling SSE a maximum distance of 4 km. A gas-and-ash plume rose 1.5 km above the crater and drifted E and N. CVGHM recommended that evacuees from several communities within a 10-km radius should continue to stay in shelters or safe areas. The Darwin VAAC reported that a possible eruption on 1 November produced an ash plume that rose to an altitude of 6.1 km (20,000 ft) a.s.l., according to ground-based reports, analyses of satellite imagery, and web camera views. On 2 November an ash plume was seen in satellite imagery drifting 75 km N at an altitude of 6.1 km (20,000 ft) a.s.l. News outlets noted diversions and cancellations of flights in and out of the Solo (40 km E) and Yogyakarta airports. The Alert Level remained at 4 (on a scale of 1-4).
CVGHM reported 26 pyroclastic flows on 2 November. A mid-day report on 3 November stated that 38 pyroclastic flows occurred during the first 12 hours of the day. An observer from the Kaliurang post saw 19 of those 38 flows travel 4 km S. Plumes from the pyroclastic flows rose 1.2 km, although dense fog made visual observations difficult. Ashfall was noted in some nearby areas.
Sources: Pusat Vulkanologi dan Mitigasi Bencana Geologi (PVMBG, also known as CVGHM); BBC News; Darwin Volcanic Ash Advisory Centre (VAAC); CNN
CVGHM reported that from the end of September to 20 October the rate of inflation at Merapi was 0.6 cm per day. On 21 October the rate increased to 10.5 cm per day, and incidents of incandescence from the lava dome increased. CVGHM raised the Alert Level to 3 (on a scale of 1-4). The rate of inflation increased sharply on 24 October to a rate of 42 cm per day. The next day, CVGHM raised the Alert Level to 4, and recommended immediate evacuation for several communities (news reports estimated 11,000-19,000 people) within a 10-km radius.
An eruption began at about 1700 on 26 October that was characterized by explosions along with pyroclastic flows that traveled WSW and SE. CVGHM reported that multiple pyroclastic flows occurred until 1854, when the pyroclastic flow activity started to subside. Most of the pyroclastic flows lasted 2 to 9 minutes, except for two that lasted 33 minutes each. Booming noises were heard, and incandescence from the crater was seen from the Selo observation post to the N. An ash plume was also observed rising 1.5 km above the crater.
According to news articles, officials noted that about 15,000 people had not yet evacuated, even though several minor eruptions had already occurred prior to 26 October. Reports on 27 October noted that about 25 people died and several were injured.
Sources: Pusat Vulkanologi dan Mitigasi Bencana Geologi (PVMBG, also known as CVGHM); Associated Press; Jakarta Globe; BBC News; Associated Press
CVGHM reported that a pattern of increasing seismicity from Merapi began in to emerge in early September. Observers at Babadan (7 km W) and Kaliurang (8 km S) heard an avalanche on 12 September. On 13 September white plumes rose 800 m above the crater. Inflation, detected since March, increased from background levels of 0.1 to 0.3 mm per day to a rate of 11 mm per day on 16 September. On 19 September earthquakes continued to be numerous, and the next day CVGHM raised the Alert Level to 2 (on a scale of 1-4).
Source: Pusat Vulkanologi dan Mitigasi Bencana Geologi (PVMBG, also known as CVGHM)
Based on a pilot observation, the Darwin VAAC reported that an ash plume from Merapi rose to an altitude of 11.6 km (38,000 ft) a.s.l. on 19 May. Ash was not identified on satellite imagery.
Source: Darwin Volcanic Ash Advisory Centre (VAAC)
Based on a pilot observation, the Darwin VAAC reported that an ash plume from Merapi rose to an altitude of 4.6 km (15,000 ft) a.s.l. and drifted W on 9 August. Ash was not identified on satellite imagery.
Source: Darwin Volcanic Ash Advisory Centre (VAAC)
According to a news article, "hot clouds" and incandescent material from Merapi traveled a distance of 1 km SE down the Gendol River on 23 May. People in the nearby village of Muntilan, about 16 km W, reported "hot clouds" and ashfall.
Source: Antara News
Based on pilot reports, the Darwin VAAC reported that an eruption plume from Merapi reached an altitude of 6.1 km (20,000 ft) a.s.l. and drifted NE on 19 March.
Source: Darwin Volcanic Ash Advisory Centre (VAAC)
Based on pilot reports, the Darwin VAAC reported that eruption plumes from Merapi on 2 and 3 August reached altitudes of ~6.1 km (~20,000 ft) a.s.l. and drifted W. According to CVGHM, during 2-4 August rockfalls traveled 1 km SE toward the Gendol river and gas plumes reached a maximum of 400 m above the summit (10,900 ft a.s.l.). On 3 August, the Alert Level was lowered to 2 (on a scale of 1-4).
Sources: Pusat Vulkanologi dan Mitigasi Bencana Geologi (PVMBG, also known as CVGHM); Darwin Volcanic Ash Advisory Centre (VAAC)
Incandescent rock avalanches from Merapi were observed almost daily during 26 July-1 August, advancing at a maximum distance of 2 km SE toward the Gendol River. On 29 July, gas plumes reached maximum heights of 430 m above the summit (11,000 ft a.s.l.). Pyroclastic flows were not observed during the reporting period. The Alert Level remained at 3 (on a scale of 1-4).
Source: Pusat Vulkanologi dan Mitigasi Bencana Geologi (PVMBG, also known as CVGHM)
During 19-25 July, gas plumes at Merapi reached maximum heights of 400 m above the summit (11,000 ft a.s.l.). Lava flows were observed daily, advancing at a maximum distance of 1.5 km SE toward the Gendol River. Pyroclastic flows were not observed during the reporting period. The Alert Level remained at 3 (on a scale of 1-4).
Source: Pusat Vulkanologi dan Mitigasi Bencana Geologi (PVMBG, also known as CVGHM)
During 12-18 July, lava flows at Merapi were observed and reached a maximum distance of 2 km SE along the Gendol River. Gas plumes were also observed daily and reached heights of 1 km above the crater (12,800 ft a.s.l.). On 17 July, CVGHM reported that the Alert Level was lowered one level to 3 (on a scale of 1-4) in all remaining areas previously at Alert Level 4 (S slopes). Pyroclastic flows were not observed during the reporting period.
Source: Pusat Vulkanologi dan Mitigasi Bencana Geologi (PVMBG, also known as CVGHM)
Gas plumes were observed during 5-11 July at Merapi and reached a maximum height of 1.2 km above the summit (3,600 ft a.s.l.) on 6 July. Due to a decrease in activity, on 10 July the Alert Level was lowered one level to 3 (on a scale of 1-4) in all areas except the S slope.
Sources: Pusat Vulkanologi dan Mitigasi Bencana Geologi (PVMBG, also known as CVGHM); Agence France-Presse (AFP)
According to CVGHM, pyroclastic flows and rockfalls at Merapi decreased in frequency and intensity during 28 June-4 July. Pyroclastic flows were observed during 28-30 June and reached a maximum distance of 3 km SE along the Gendol River. Gas plumes were observed during 28 June-1 July and reached a maximum height of 1 km above the summit (12,800 ft a.s.l.) on 28 June.
Source: Pusat Vulkanologi dan Mitigasi Bencana Geologi (PVMBG, also known as CVGHM)
During 21-25 June, seismic signals at Merapi indicated almost daily occurrence of rockfalls and pyroclastic flows. Due to inclement weather, pyroclastic flows were only observed on 24 June and reached a maximum distance of 4 km SE along the Gendol River and 2.5 km SW along the Krasak River. Gas plumes were observed during 22-25 June and reached a maximum height of 1.5 km above the summit (14,600 ft a.s.l.) on 24 June.
Source: Pusat Vulkanologi dan Mitigasi Bencana Geologi (PVMBG, also known as CVGHM)
Gas plumes were emitted from Merapi on 14 and 15 June and reached a maximum height of 900 m above the summit (12,500 ft a.s.l.). On 14 June, a dome-collapse event, lasting approximately 3.5 hours, produced pyroclastic flows that reached a maximum distance of 7 km SE along the Gendol River. Two people assisting with evacuation efforts were trapped an underground shelter in Kaliadem village and died, the first fatalities of the current eruption. On 15 June, pyroclastic flows reached a maximum distance of 4.5 km SE along the Gendol River. According to news reports, pyroclastic flows continued during 16-19 June as a new dome grew. On 19 June, water shortages were reported. The Alert Level remained at 4, the highest level.
Sources: Pusat Vulkanologi dan Mitigasi Bencana Geologi (PVMBG, also known as CVGHM); The Jakarta Post; Deutsche Presse-Agentur; Reuters; Associated Press
On 8 June, according to a CVGHM report, the lava-dome growth rate at Merapi was an estimated 100 thousand cubic meters per day and the estimated volume was approximately 4 million cubic meters. An estimated volume loss of 400 thousand cubic meters on 4 June was due to a partial dome collapse of the S part of the Geger Buaya crater wall (constructed from 1910 lava flows).
Gas plumes were observed almost daily during 7-13 June and reached a maximum height of 1.2 km above the summit (13,600 ft a.s.l.) on 10 June. During 8-10 June, the Darwin VAAC reported that small ash plumes were visible on satellite imagery and minor ashfall was reported to the S at the Merapi Volcano Observatory and in Yogyakarta, about 32 km (19.9 miles) away. On 8 June a pyroclastic flow, lasting 12 minutes, reached a maximum distance of 5 km SE toward the Gendol River, the predominate travel direction since the 27 May earthquake (M 6.2). According to a news report, the 8 June event prompted approximately 15,500 people to evacuate from the Sleman district to the S and the Magelang district to the W. On 13 June, the Alert Level was lowered from 4 to 3 but renewed pyroclastic-flow activity the next day again prompted a return to Alert Level 4, the highest level.
Sources: Pusat Vulkanologi dan Mitigasi Bencana Geologi (PVMBG, also known as CVGHM); Darwin Volcanic Ash Advisory Centre (VAAC); Reuters; AFX News; Associated Press
The Alert Level at Merapi remained at 4, the highest level, during 31 May to 6 June. Sulfur-dioxide plumes were observed daily during this period and reached a height of 1.3 km above the summit (13,900 ft a.s.l.) on 1 June. According to the Darwin VAAC, low-level emissions were visible on satellite imagery on 1 and 6 June. Multiple pyroclastic flows reached a maximum distance of 4 km SE toward the Gendol River and 3.5 km SW toward the Krasak and Boyong Rivers. CVGHM reported on 31 May that lava avalanches moved towards the W for the first time during the recent eruption.
According to a volcanologist in Yogyakarta, lava-flow distances and lava-dome volume had both approximately doubled since the 27 May M 6.2 earthquake. The lava-dome volume was estimated at 4 million cubic meters. On 6 June, groups living near the base of the volcano began to move into temporary shelters. Activities remain restricted within a 7 km radius from the volcano's summit and within 300 m of the banks of Krasak/Bebeng, Bedog, and Boyong Rivers to the SW, and Gendol River to the SE.
Sources: Pusat Vulkanologi dan Mitigasi Bencana Geologi (PVMBG, also known as CVGHM); Agence France-Presse (AFP); Darwin Volcanic Ash Advisory Centre (VAAC); Associated Press
The Alert Level at Merapi remained at 4, the highest level, during 24-30 May. On 24-25 May, lava flows were observed moving SW towards the Krasak River and SE towards the Gendol River. According to news reports, on 27 May an M 6.3 earthquake that killed about 5,400 resulted in a three-fold increase in activity at Merapi. According to CVGHM, an M 5.9 earthquake coincided with pyroclastic flows of unknown origin that extended 3.8 km SW toward the Krasak River. During 28-30 May, multiple pyroclastic flows reached a maximum of 3 km SE toward the Gendol River and 4 km SW toward the Krasak and Boyong Rivers. Gas plumes reached a height above the volcano of 500 m (11,300 ft a.s.l.) on 25 May, 1,200 m (13,600 ft a.s.l.) on 26 May, 100 m (10,000 ft a.s.l.) on 29 May, and 900 m (12,600 ft a.s.l.) on 30 May.
Residents remained evacuated from villages within a 7 km radius from the volcano's summit and within 300 m of the banks of Krasak/Bebeng, Bedog, and Boyong Rivers to the SW, and Gendol River to the SE.
Sources: The Canadian Press; Pusat Vulkanologi dan Mitigasi Bencana Geologi (PVMBG, also known as CVGHM)
The Alert Level at Merapi remained at 4, the highest level, during 17-22 May. Incandescence and sulfur-dioxide plumes were observed. Pyroclastic flows to the SW and SE reached 4 km on 19 May and 3 km on 20 May. On 22 May, the lava dome volume was estimated at ~ 2.3 million cubic meters. The Darwin VAAC reported that low-level emissions continued during 18-19 and 23 May. CVGHM recommended that residents who live in valleys on the NNW flanks near Sat, Lamat, Senowo, Trising, and Apu Rivers and on the SE flank near Woro River be allowed to return to their homes. Residents remained evacuated from villages within a 7 km radius from the volcano's summit and within 300 m of the banks of the Krasak/Bebeng, Bedog, and Boyong Rivers to the SW, and the Gendol River to the SE.
According to news reports, an eruption producing a cloud of hot gas and ash was witnessed on 17 May. Witnesses said the size of the plume was smaller than ash-and-gas plumes on 15 May. On 18 May, a representative for Merapi from the Center for Volcanological Research and Technology Development (part of CVGHM), reported new ashfall.
Sources: Pusat Vulkanologi dan Mitigasi Bencana Geologi (PVMBG, also known as CVGHM); Agence France-Presse (AFP); Darwin Volcanic Ash Advisory Centre (VAAC); Reuters; Associated Press
CVGHM reported that on 11 May, gas plumes rose to ~600 m above Merapi (or 11,600 ft a.s.l.). Avalanches of incandescent material extended 200 m SE towards the Gendol River, and 1.5 km SW towards the Krasak River. Several small incandescent avalanches of volcanic material were visible from observatory posts. The new lava dome at the volcano's summit had grown to fill the gap between the 2001 lava flows and the 1997 lava flows on the W side of the summit. The lava dome reached a height above that of the 1997 lava flows. Seismicity was dominated by multi-phase earthquakes and signals associated with avalanches. On 13 May at 0940, the Alert Level was raised from 3 to 4, the highest level.
The Darwin VAAC reported that on 11 May an ash plume was visible on satellite imagery below 3.7 km (12,000 ft) a.s.l. An ash plume at an unknown height was visible on satellite imagery on 15 May.
According to news reports, after the Alert Level was raised to 4 on 13 May, about 4,500 people living near the volcano were evacuated. Intense activity occurred on 15 May, with pyroclastic flows traveling as far as 4 km to the W. By 16 May a total of about 22,000 people were evacuated; according to figures posted at the district disaster task force center about 16,870 people were evacuated from three districts in Central Java Province, and more than 5,600 others were evacuated from the Slemen district, a part of Yogyakarta Province. Activity decreased on 16 May. On 17 May pyroclastic flows traveled as far as 3 km. Local volcanologists reported that the lava dome continued to grow, but at a slower rate than during previous days.
Sources: Pusat Vulkanologi dan Mitigasi Bencana Geologi (PVMBG, also known as CVGHM); Agence France-Presse (AFP); Darwin Volcanic Ash Advisory Centre (VAAC); Reuters; Associated Press
CVGHM reported that on 6 May, gas plumes rose to 800 m above Merapi (or 12,300 ft a.s.l.) and 18 incandescent avalanches of volcanic material were observed. On 7 May, 26 incandescent avalanches that extended about 100 m were seen during the morning. Incandescence was seen at the summit ten times. On 6 and 7 May, the lava dome continued to grow and seismicity was dominated by multi-phase earthquakes. Shallow volcanic earthquakes and signals from landslides and rockfalls were also recorded. On 8 May, the Darwin VAAC reported that CVGHM warned of a plume rising to ~3.7 km (12,000 ft) a.s.l. No ash was visible on satellite imagery. Merapi remained at Alert Level 3 (on a scale of 1-4), as it has since 12 April.
Sources: Pusat Vulkanologi dan Mitigasi Bencana Geologi (PVMBG, also known as CVGHM); Darwin Volcanic Ash Advisory Centre (VAAC)
On 28 April, CVGHM observed a lava flow from Merapi traveling ~1.5 km SW to the Lamat River. On the 28th, seismicity was dominated by multiphase earthquakes. Signals from landslides, rockfalls, and low-frequency events were also recorded. According to news reports, around 27 April nearly 2,000 villagers were evacuated from Sidorejo and Tegalmulyo villages on the volcano's flanks. On the 27th, small amounts of ash fell in Gemer village about 5 km from Merapi's summit. Merapi remained at Alert Level 3 (on a scale of 1-4).
Sources: Pusat Vulkanologi dan Mitigasi Bencana Geologi (PVMBG, also known as CVGHM); Reuters; People's Daily Online (China)
During 21-25 April seismicity at Merapi remained at high levels, with several seismic signals recorded that were associated with rockfalls. The sulfur-dioxide flux from the volcano was 175 metric tons on 22 April. On 22 and 23 April, fumarolic emissions reached a maximum height of 400 m above the volcano (or 11,000 ft a.s.l.). On the 25th, two rockslides from lava-flow fronts were heard from nearby observatories. According to news reports, about 600 of the approximately 14,000 people living near the volcano had been evacuated by the 24th. Merapi remained at Alert Level 3 (on a scale of 1-4).
Sources: Reuters; Pusat Vulkanologi dan Mitigasi Bencana Geologi (PVMBG, also known as CVGHM); Associated Press
According to CVGHM, volcanic activity began to increase at Merapi on 11 April, and on 12 April at 1500 they raised the Alert level from 2 to 3 (on a scale of 1-4). They reported that an eruption could occur at any time and no one was permitted within 8 km of the summit. According to news reports, authorities informed people living in villages near the volcano to be prepared for possible evacuations.
Sources: Pusat Vulkanologi dan Mitigasi Bencana Geologi (PVMBG, also known as CVGHM); Associated Press; Reuters
According to a news article, authorities banned mountain climbing on 10 April at Merapi due to increased activity. There were reports that the amount of tremor had increased and that lava was seen flowing near Pasar Bubar village, ~350 m from the volcano's crater.
Source: Deutsche Presse-Agentur
Increased seismicity at Merapi led CVGHM to raise the Alert Level from 1 to 2 (on a scale of 1-4) around 20 March. According to a news articles, small earthquakes were recorded at the volcano on 19 March and more than 200 were recorded during the week. Around 10,000 residents near the volcano were warned to prepare for possible evacuations if activity escalates.
Sources: Pusat Vulkanologi dan Mitigasi Bencana Geologi (PVMBG, also known as CVGHM); Agence France-Presse (AFP)
An increase in the number of volcanic earthquakes at Merapi during 7-11 July led DVGHM to increase the Alert Level at the volcano to 2 (on a scale of 1-4) on 9 July.
Source: Pusat Vulkanologi dan Mitigasi Bencana Geologi (PVMBG, also known as CVGHM)
During 26 August-1 September, observers saw incandescent lava avalanches travel predominately down Merapi's SW flank into the upstream portions of the Sat, Lamat, and Senowo rivers. The avalanches reached a maximum run-out distance of ~2.5 km. Seismicity was dominated by 311 lava avalanches. Merapi remained at Alert Level 2 (on a scale of 1-4).
Source: Pusat Vulkanologi dan Mitigasi Bencana Geologi (PVMBG, also known as CVGHM)
During 19-25 August, observers saw 16 incandescent lava avalanches travel predominately down Merapi's SW flank into the upstream portions of the Sat, Lamat, and Senowo rivers. The avalanches reached a maximum run-out distance of ~2.5 km. Seismicity was dominated by 187 lava avalanches. Merapi remained at Alert Level 2 (on a scale of 1-4).
Source: Pusat Vulkanologi dan Mitigasi Bencana Geologi (PVMBG, also known as CVGHM)
During 5-18 August, incandescent lava avalanches traveled predominately down Merapi's SW flank into the upstream portions of the Sat, Lamat, and Senowo rivers. The avalanches reached a maximum run-out distance of ~2.5 km. Merapi remained at Alert Level 2 (on a scale of 1-4).
Source: Pusat Vulkanologi dan Mitigasi Bencana Geologi (PVMBG, also known as CVGHM)
During 29 July-4 August, incandescent lava avalanches traveled predominately down Merapi's SW flank into the upstream portions of the Sat, Lamat, Senowo, and Bebeng rivers. The avalanches reached a maximum run-out distance of ~2.6 km. A thin white plume rose ~400 m above the summit. Seismicity was dominated by signals from 237 lava avalanches. No pyroclastic flows were reported. Merapi remained at Alert Level 2 (on a scale of 1-4).
Source: Pusat Vulkanologi dan Mitigasi Bencana Geologi (PVMBG, also known as CVGHM)
During 15-21 July, incandescent lava avalanches traveled predominately down Merapi's SW flank into the upstream portions of the Sat, Lamat, Senowo, and Bebeng rivers. The avalanches reached a maximum run-out distance of ~2.5 km. Seismicity was dominated by signals from 201 lava avalanches. Merapi remained at Alert Level 2 (on a scale of 1-4).
Source: Pusat Vulkanologi dan Mitigasi Bencana Geologi (PVMBG, also known as CVGHM)
During 8-14 July, incandescent lava avalanches traveled predominately down Merapi's SW flank into the upstream portions of Sat, Lamat, Senowo, and Bebeng rivers. The avalanches reached a maximum run-out distance of ~2.5 km. Seismicity was dominated by signals from 180 lava avalanches. Merapi remained at Alert Level 2 (on a scale of 1-4).
Source: Pusat Vulkanologi dan Mitigasi Bencana Geologi (PVMBG, also known as CVGHM)
During 1-7 July, observers noted 60 incandescent lava avalanches traveling predominately down Merapi's SW flank into the upstream portions of Sat, Lamat, Senowo, and Bebeng rivers. The avalanches reached a maximum run-out distance of ~2.6 km. On 2 July two pyroclastic flows traveled toward the upstream portion of Sat River, reaching a maximum run-out distance of 0.5 km. Merapi remained at Alert Level 2 (on a scale of 1-4).
Source: Pusat Vulkanologi dan Mitigasi Bencana Geologi (PVMBG, also known as CVGHM)
During 24-30 June, observers noted 68 incandescent lava avalanches flowing predominately down Merapi's SW flank into the upstream portions of the Sat, Lamat, and Senowo rivers. The avalanches reached a maximum run-out distance of ~2.5 km. Seismicity appeared to decrease in comparison to the previous week and no low-frequency earthquakes were recorded. Merapi remained at Alert Level 2 (on a scale of 1-4).
Source: Pusat Vulkanologi dan Mitigasi Bencana Geologi (PVMBG, also known as CVGHM)
During 17-23 June, observers noted 65 incandescent lava avalanches flowing predominately down Merapi's SW flank into the upstream portions of the Sat, Lamat, and Senowo rivers. The avalanches reached a maximum run-out distance of ~2.5 km. Seismicity decreased in comparison to the previous week. Merapi remained at Alert Level 2 (on a scale of 1-4).
Source: Pusat Vulkanologi dan Mitigasi Bencana Geologi (PVMBG, also known as CVGHM)
During 10-16 June, incandescent lava avalanches flowed predominately down Merapi's SW flank to the upstream portions of the Sat, Lamat, and Senowo rivers to a maximum run-out distance of ~2.5 km. Seismicity decreased in comparison to the previous week. Merapi remained at Alert Level 2 (on a scale of 1-4).
Source: Pusat Vulkanologi dan Mitigasi Bencana Geologi (PVMBG, also known as CVGHM)
VSI reported that activity at Merapi was generally decreasing. During 3-9 June, incandescent lava avalanches flowed predominately down Merapi's SW flank to the upstream portions of the Sat, Lamat, and Senowo rivers to a maximum run-out distance of ~2.5 km. Merapi remained at Alert Level 2 (on a scale of 1-4).
Source: Pusat Vulkanologi dan Mitigasi Bencana Geologi (PVMBG, also known as CVGHM)
During 27 May-2 June, seismicity generally decreased at Merapi in comparison to the previous week. Incandescent lava avalanches flowed predominately down Merapi's SW flank to the upstream portions of the Sat, Lamat, and Senowo rivers to a maximum run-out distance of ~2.5 km. Merapi remained at Alert Level 2 (on a scale of 1-4).
Source: Pusat Vulkanologi dan Mitigasi Bencana Geologi (PVMBG, also known as CVGHM)
During 22 April-26 May incandescent lava avalanches flowed down Merapi's flanks, predominately SW to the upstream portions of the Sat, Lamat, and Senowo rivers. They reached a maximum run-out distance of ~2.75 km. Merapi remained at Alert Level 2 (on a scale of 1-4).
Source: Pusat Vulkanologi dan Mitigasi Bencana Geologi (PVMBG, also known as CVGHM)
During 15-21 April, several incandescent lava avalanches were observed traveling down Merapi's flanks, predominately SW to the upstream portions of the Lamat, Sat, and Senowo rivers, reaching a maximum run-out distance of ~2.5 km. Two minor pyroclastic flows traveled up to 1.8 km on 14 April. Seismicity decreased in comparison to the previous week, SO2 emission rates were average, and the lava dome showed no signs of deformation. Merapi remained at Alert Level 2 (on a scale of 1-4).
Source: Pusat Vulkanologi dan Mitigasi Bencana Geologi (PVMBG, also known as CVGHM)
During 18-24 March, several incandescent lava avalanches were observed traveling down Merapi's flanks, predominately SW to the upstream portions of the Lamat, Sat, and Senowo rivers and partly in a more southerly direction towards Bebeng River. The maximum run-out distance was ~2.5 km. No pyroclastic flows occurred during the report period. Merapi remained at Alert Level 2 (on a scale of 1-4).
Source: Pusat Vulkanologi dan Mitigasi Bencana Geologi (PVMBG, also known as CVGHM)
During 11-17 March, 69 incandescent lava avalanches were observed traveling down Merapi's flanks, predominately SW to the upstream portions of the Lamat, Sat, and Senowo rivers and partly in a more southerly direction towards Bebeng River. The maximum run-out distance was ~2.5 km. No pyroclastic flows occurred during the report period. Merapi remained at Alert Level 2 (on a scale of 1-4).
Source: Pusat Vulkanologi dan Mitigasi Bencana Geologi (PVMBG, also known as CVGHM)
During 25 February-3 March 88 incandescent lava avalanches were observed traveling down Merapi's flanks, predominately SW to the upstream portions of the Lamat, Sat, and Senowo rivers and partly in a more southerly direction towards Bebeng River. The maximum run-out distance was ~2.5 km. Four minor pyroclastic flows were observed during the report period; three occurred on 25 February and one on 3 March. The flows traveled SSW as far as 1 km to the upstream portion of the Bebeng River. Seismicity at the volcano was similar to the previous week. Merapi remained at Alert Level 2 (on a scale of 1-4).
Source: Pusat Vulkanologi dan Mitigasi Bencana Geologi (PVMBG, also known as CVGHM)
During 18-24 February there were 67 incandescent lava avalanches observed traveling down Merapi's flanks, predominately WSW to the upstream portions of the Lamat and Senowo rivers and partly SW toward the Sat and Bebeng rivers. The maximum run-out distance was ~2.2 km. One minor pyroclastic flow was observed; it traveled 2.2 km down the Senowo River. Seismicity was dominated by avalanche earthquakes (607), which slightly increased in comparison to the previous week (600). Merapi remained at Alert Level 2 (on a scale of 1-4).
Source: Pusat Vulkanologi dan Mitigasi Bencana Geologi (PVMBG, also known as CVGHM)
During 11-17 February there were 65 incandescent lava avalanches observed traveling down Merapi's flanks, predominately WSW to the upstream portions of Lamat and Senowo rivers and partly SW toward the Sat and Bebeng rivers. The maximum run-out distance was ~2.5 km. During the report period, six minor pyroclastic flows traveled up to 2.5 km to the upstream portions of the Lamat and Senowo rivers. According to news reports, Volcanology Development and Investigation Agency staff stated that intense rain during the current rainy season could cause landslides around the volcano's crater. Merapi remained at Alert Level 2 (on a scale of 1-4).
Sources: The Jakarta Post; Pusat Vulkanologi dan Mitigasi Bencana Geologi (PVMBG, also known as CVGHM); The Jakarta Post
During 28 January-3 February 194 lava avalanches were observed traveling down Merapi's flanks, predominately SW toward the upstream portions of the Sat and Bebeng rivers, and partly WSW to the Lamat and Senowo rivers. The maximum run-out distance was ~2.7 km. There were no major observed changes in seismicity; 855 lava avalanche signals dominated the seismicity. The volcano remained at Alert Level 2 (on a scale of 1-4).
Source: Pusat Vulkanologi dan Mitigasi Bencana Geologi (PVMBG, also known as CVGHM)
During 21-27 January, 979 lava avalanches traveled down Merapi's flanks, predominately SW toward the upstream portions of the Sat and Bebeng rivers, and partly WSW to the Lamat and Senowo rivers. The maximum run-out distance was ~2.75 km. Several small pyroclastic flows traveled up to ~1.5 km to the upstream portions of the Sat and Bebeng rivers; two on the 23rd, one on the 24th, and two on the 25th. The volcano remained at Alert Level 2 (on a scale of 1-4).
Source: Pusat Vulkanologi dan Mitigasi Bencana Geologi (PVMBG, also known as CVGHM)
During 14-20 January lava avalanches continued to travel down the flanks of Merapi, predominately SW toward the upstream portions of Sat and Bebeng rivers, and partly WSW to the Lamat and Senowo rivers. The maximum run-out distance was ~2.75 km. On 17 January, five small pyroclastic flows traveled 1.2 km to the upstream portions of the Sat and Bebeng rivers. Seismicity increased compared to the previous week and was dominated by 853 lava avalanches. Merapi remained at Alert Level 2 (on a scale of 1-4).
Source: Pusat Vulkanologi dan Mitigasi Bencana Geologi (PVMBG, also known as CVGHM)
During 7-13 January lava avalanches continued to travel down the flanks of Merapi, predominately SW toward the upstream portions of the Sat and Bebeng rivers and partly WSW to the Lamat and Senowo rivers. The maximum run-out distance was about 2.5 km. On 7 January a small pyroclastic flow traveled ~2 km to the upstream portion of Bebeng River. Merapi remained at Alert Level 2 (on a scale of 1-4).
Source: Pusat Vulkanologi dan Mitigasi Bencana Geologi (PVMBG, also known as CVGHM)
Visual observations during 17-20 December revealed that 109 lava avalanches traveled predominately toward the upstream portion of the Sat River, and to a lesser extent to the Lamat and Senowo rivers. The maximum run-out distance was ~2.5 km. A pyroclastic flow on 18 December traveled ~1 km to the upstream portion of the Bebeng River. During the report period, seismicity was dominated by avalanche earthquakes that were similar in frequency and magnitude to those of previous weeks. Merapi remained at Alert Level 2 (on a scale of 1-4).
Source: Pusat Vulkanologi dan Mitigasi Bencana Geologi (PVMBG, also known as CVGHM)
During 19 November- 2 December VSI personnel observed 90 incandescent lava avalanches traveling SW, predominately to the upstream portion of the Sat River, and to a lesser extent to the Lamat and Senowo rivers. The maximum run-out distance was 2.5 km. During the report period, seismicity was dominated by avalanche earthquakes that were similar in frequency and magnitude to those of the previous week. Merapi remained at Alert Level 2 (on a scale of 1-4).
Source: Pusat Vulkanologi dan Mitigasi Bencana Geologi (PVMBG, also known as CVGHM)
During 5-18 November VSI personnel observed 192 incandescent lava avalanches traveling SW, predominately to the upstream portion of the Sat River, and to a lesser extent to the Lamat and Senowo rivers. The maximum run-out distance was 3 km. During the report period, seismicity was dominated by avalanche earthquakes. Merapi remained at Alert Level 2 (on a scale of 1-4).
Source: Pusat Vulkanologi dan Mitigasi Bencana Geologi (PVMBG, also known as CVGHM)
During 22-28 October, VSI personnel observed 121 incandescent lava avalanches traveling SW predominately to the upstream portion of the Sat River, and to a lesser extent to the Lamat and Senow rivers. The maximum run-out distance was 2.75 km. On 24 October four minor pyroclastic flows were observed travelling a maximum distance of 2 km to the upstream portions of the Sat and Senowo rivers. Seismicity was dominated by avalanche earthquakes similar in magnitude and frequency to earthquakes the previous week. Merapi remained at Alert Level 2 (on a scale of 1-4).
Source: Pusat Vulkanologi dan Mitigasi Bencana Geologi (PVMBG, also known as CVGHM)
During 15-21 October, VSI personnel observed 103 incandescent lava avalanches traveling SW predominately to the upstream portion of the Sat River, and to a lesser extent to the Lamat and Senow rivers. The maximum run-out distance was 2.75 km. Seismic activity was dominated by avalanche earthquakes similar in magnitude and frequency to earthquakes the previous week. Merapi remained at Alert Level 2 (on a scale of 1-4).
Source: Pusat Vulkanologi dan Mitigasi Bencana Geologi (PVMBG, also known as CVGHM)
During 8-14 October, VSI personnel observed 53 incandescent lava avalanches traveling SW predominately to the upstream portion of the Sat River, and to a lesser extent to the Lamat and Senow rivers to a maximum run-out distance of ~2 km. On 8 October at 1729 a minor pyroclastic flow traveled ~2 km down the Sat River. Seismicity was dominated by 692 lava avalanche events. The volcano remained at Alert Level 2 (on a scale of 1-4).
Source: Pusat Vulkanologi dan Mitigasi Bencana Geologi (PVMBG, also known as CVGHM)
During 1-7 October 59 incandescent lava avalanches were observed travelling SW. The avalanches predominately traveled to the upstream portions of the Sat River, and to a lesser extent down the Lamat and Senowo rivers to a maximum run-out distance of 2.5 km. Seismicity was dominated by approximately the same number and intensity of avalanche earthquakes as the previous week. An average of 80 tons per day of SO2 was measured. The Alert Level remained at 2.
Source: Pusat Vulkanologi dan Mitigasi Bencana Geologi (PVMBG, also known as CVGHM)
During 17-30 September incandescent lava avalanches traveled SW primarily down the Lamat, Senowo, and Bebeng rivers to a maximum run-out distance of 2.5 km. During 17-23 September 51 lava avalanches were observed. Temperatures at Gendol Crater increased from 590-595 ºC the previous week to 602-617 ºC during 17-23 September and to 598-618 ºC during 24-30 September. Avalanche earthquakes, which dominated the seismicity, increased in comparison to the previous week.
Source: Pusat Vulkanologi dan Mitigasi Bencana Geologi (PVMBG, also known as CVGHM)
According to VSI, during 10-16 September volcanic activity at Merapi decreased in comparison to the previous week. Incandescent lava avalanches continued to travel SW as far as 2.5 km to reach the upstream portions of the Lamat and Senowo rivers. Seismographs recorded 588 lava-avalanche events during the report period. The volcano remained at Alert Level 2 (on a scale of 1-4).
Source: Pusat Vulkanologi dan Mitigasi Bencana Geologi (PVMBG, also known as CVGHM)
During 13-26 August approximately 380 lava avalanches were observed travelling SW, extending a maximum distance of 2.8 km mainly down the Sat and Lamat rivers, and to a lesser extent towards the Senowo and Bebeng rivers. Seismic activity consisted primarily of avalanche earthquakes, as it had for the previous 2 weeks. The volcano remained at Alert Level 2 (on a scale of 1-4).
Source: Pusat Vulkanologi dan Mitigasi Bencana Geologi (PVMBG, also known as CVGHM)
During 30 July-12 August lava avalanches traveled towards the SW, extending a maximum distance of 2.8 km down the Sat, Senowo, Lamat, and Bebeng Rivers. Seismic activity was dominated by avalanche earthquakes. The volcano remained at Alert Level 2 (on a scale of 1-4).
Source: Pusat Vulkanologi dan Mitigasi Bencana Geologi (PVMBG, also known as CVGHM)
During 9-15 July volcanic activity at Merapi was similar to the previous week. A total of 52 lava avalanches traveled SW to a maximum distance of 2.5 km down the Sat, Senowo, and Lamat rivers. Emissions from low-pressure fumaroles rose to 755 m above the summit. The volcano remained at Alert Level 2 (on a scale of 1-4).
Source: Pusat Vulkanologi dan Mitigasi Bencana Geologi (PVMBG, also known as CVGHM)
During 2-8 July low-pressure emissions from fumaroles rose 700 m above the volcano. During the same interval lava avalanches traveled SW to a maximum distance of 2.5 km into the upper reaches of the Sat, Senowo, and Lamat rivers. The volcano was at Alert Level 2.
Source: Pusat Vulkanologi dan Mitigasi Bencana Geologi (PVMBG, also known as CVGHM)
Activity at Merapi increased during 23-29 April, with reports of several medium-sized pyroclastic flows. Four pyroclastic flows were observed traveling into the upper reaches of the Sat, Senowo, Lamat, and Bebeng rivers, with a maximum runout distance of 1.8 km in the Sat River. Lava avalanches traveled up to 2.5 km down the Sat River. Superficial earthquakes continued to dominate the seismicity. Merapi remained at Alert Level 2 (on a scale of 1-4).
Source: Pusat Vulkanologi dan Mitigasi Bencana Geologi (PVMBG, also known as CVGHM)
During 16-23 April lava avalanches continued to flow down the Sat, Senowo, Lamat, and Bebeng rivers, with a maximum runout distance of 2 km. Fumaroles emitted gas that rose up to 500 m above the summit. Seismic activity continued to be dominated by avalanche earthquakes. Merapi remained at Alert Level 2 (on a scale of 1-4).
Source: Pusat Vulkanologi dan Mitigasi Bencana Geologi (PVMBG, also known as CVGHM)
VSI reported that during 9-15 April lava avalanches continued to fill the upstream areas of the Sat, Senowo, Lamat, and Bebeng rivers, with a maximum runout distance of 2 km in the Sat River. In addition, eleven pyroclastic flows entered the Sat and Lamat rivers, reaching as far as 3 km. Avalanche earthquakes continued to dominate the seismicity, but their amplitude and frequency decreased in comparison to the previous week. An observer reported that on 13 April a small amount of ash fell around the Babadan Post Observatory ~7 km W of the volcano. Merapi remained at Alert Level 2 (on a scale of 1-4).
Source: Pusat Vulkanologi dan Mitigasi Bencana Geologi (PVMBG, also known as CVGHM)
Visual and instrumental monitoring by VSI personnel during 2-9 April revealed that volcanic activity continued at Merapi. Lava avalanches continued to enter upstream areas of the Sat, Senowo, Lamat, and Bebeng rivers, with a maximum runout distance of 2.5 km in the Sat River. An observer reported that ten pyroclastic flows traveled down the Sat, Senowo, and Bebeng rivers, reaching as far as 2.3 km in the Sat River. Fumaroles emitted steam and gas up to 950 m above the volcano's summit. Both the number and amplitude of earthquakes was high, but less than previously recorded. Seismic activity was dominated by avalanche earthquakes. The volcano remained at Alert Level 2 (on a scale of 1-4).
Source: Pusat Vulkanologi dan Mitigasi Bencana Geologi (PVMBG, also known as CVGHM)
Visual and instrumental monitoring by VSI personnel through 18 March revealed that volcanic activity continued at Merapi. Hot lava avalanches continued to enter the Sat, Senowo, Bebeng, and Lamat rivers, with a maximum runout distance of 3 km in the Sat River. Pyroclastic flows traveled up to 1 km down the Sat, Senowo, and Bebeng rivers. Superficial earthquakes dominated the seismicity, though the number and amplitude decreased from the previous week. Observations during a summit visit on 17 March revealed that high-pressure fumaroles remained on most of the dome's surface. The volcano remained at Alert Level 2 (on a scale of 1-4).
Source: Pusat Vulkanologi dan Mitigasi Bencana Geologi (PVMBG, also known as CVGHM)
Visual and instrumental monitoring by VSI personnel revealed that volcanic activity continued at Merapi. Hot lava avalanches continued to enter the Sat, Senowo, Bebeng, and Lamat rivers, with a maximum runout distance of 2.5 km in the Sat River. Pyroclastic flows traveled up to 2.75 km down the Sat, Senowo, and Bebeng rivers. Superficial earthquakes dominated the seismicity, though fewer occurred than in the previous week. Observations on 10 March revealed that high-pressure fumaroles appeared on most of the dome's surface. The volcano remained at Alert Level 2 (on a scale of 1-4).
Source: Pusat Vulkanologi dan Mitigasi Bencana Geologi (PVMBG, also known as CVGHM)
Visual and instrumental monitoring conducted by VSI personnel revealed that volcanic activity at Merapi had decreased; therefore on 7 March the Alert Level was reduced from 3 to 2 (on a scale of 1-4). During 27 February- 5 March, volcanic activity was dominated by an average of 100 lava avalanches per day. The avalanche material traveled to the SW, entering the Sat and Senowo rivers with runout distances of 2.3-2.5 km. On 6 March a pyroclastic flow deposited material up to 1.5 km down the Sat River.
Source: Pusat Vulkanologi dan Mitigasi Bencana Geologi (PVMBG, also known as CVGHM)
Based on reports from the VSI, the Darwin VAAC stated that the Alert Level at Merapi was downgraded on 25 February from 4, the highest level, to 3.
Source: Darwin Volcanic Ash Advisory Centre (VAAC)
Based on reports from the VSI, the Darwin VAAC stated that during 15-21 February volcanic activity decreased at Merapi. According to the Meteorological and Geophysical Agency of Indonesia, during 11-18 February daily ash emissions rose up to ~150 m above the summit. The volcano remained at Alert Level 4, the highest level.
Source: Darwin Volcanic Ash Advisory Centre (VAAC)
VSI reported that after the large 10 February eruption volcanic activity decreased in intensity. Lava avalanches and pyroclastic flows continued, but were smaller than they were the previous week. During 10 to 13 February pyroclastic flows entered the Sat, Lamat, Senowo, and Bebeng rivers to a maximum runout distance of 2-3 km, in comparison to ~4.5 km the previous week. After 13 February lava avalanches and pyroclastic flows traveled 1.5-2.5 km to the WSW and lasted 1-2 hours. According to the VSI, high temperatures around Merapi indicate that magma is near the surface. The W and S sides of "lava dome 2001" grew and covered "lava dome 1997" to the S. Several fumaroles appeared to mark a fracture along the area where the 10 February eruption occurred. Fractures formed in a similar matter prior to the November 1994 eruption. The volcano remained at Alert Level 4, the highest level.
Sources: Pusat Vulkanologi dan Mitigasi Bencana Geologi (PVMBG, also known as CVGHM); Darwin Volcanic Ash Advisory Centre (VAAC)
Intense and dangerous volcanic activity continued at Merapi with hot lava avalanches, near-continuous pyroclastic flows, and an eruption on 10 February that deposited ash on many cities out to 60 km E of the volcano. During 30 January to 5 February, continuous hot lava avalanches and pyroclastic flows traveled down the SW flank of the volcano along the Sat, Senowo, and Bebeng rivers to a maximum runout distance of ~4.5 km. Lava avalanches also traveled down the Lamat River, a drainage that avalanches had not previously traveled down during the current period of volcanic activity. Approximately 25 pyroclastic flows occurred daily. Ash associated with the pyroclastic flows fell around Merapi. During 0430 to 0630 on 3 February heavy rain mixed with ash and produced minor lahars. On 6 February the dome was reported as being 1 million cubic meters in volume and growing at 45 cubic meters per day.
Pyroclastic-flow activity began at 2100 on 9 February and lasted up to 1 hour. At 0200 on 10 February, a medium-sized pyroclastic flow lasted for ~30 minutes. At 0330 the same day "lava dome 1998," which was under the new lava dome ("lava dome 2001"), partially collapsed. The collapse triggered a large and continuous pyroclastic flow that lasted as long as 2.5 hours. The pyroclastic flow traveled up to 7 km SW of the summit towards the Sat River, and 4.5 WSW to the Lamat River. The resultant ash cloud rose up to 5-8 km above the summit, spread ~60 km towards the E, and deposited ash on the towns of Klaten, Solo, Sukoharjo, and Boyolali. The greatest ash thickness was ~1 cm, reported within a 5 km radius around the volcano. At 0530 the Alert Level at the volcano was raised from 3 to 4, the highest level. News articles reported that ~12,000 residents near the volcano were evacuated on 10 February, though many people returned to their property the next day despite the evacuation order. By 11 February, lava dome 2001 was estimated to be 1.4 million cubic meters in volume and unstable, especially after the 10 February collapse of "lava dome 1998."
Sources: Pusat Vulkanologi dan Mitigasi Bencana Geologi (PVMBG, also known as CVGHM); Associated Press; Darwin Volcanic Ash Advisory Centre (VAAC); ABC News - Australian Broadcasting Corporation
The VSI reported that activity continued to increase during 23 January-1 February. At 0000 on 27 January an eruption produced continuous pyroclastic flows and molten lava avalanches that lasted as long as 2 hours. The eruption also produced a thick ash plume that rose 2 km above the volcano's summit and was accompanied by a strong sulfurous smell. On 28 January, "lava dome 2001" partially collapsed, resulting in pyroclastic flows and molten lava avalanches that occurred at 2-5 minute intervals. The avalanche and pyroclastic-flow material traveled down the Sat and Bebeng rivers to the SW, and Senowo River to the W. The maximum runout distance of 4.5 km occurred in the Sat River. Ash fell in 5 districts within a 15-20 km radius around the volcano; Dukun, Srumbung, Salam, Ngluwar, and Muntilan. On 31 January, pyroclastic flows continuously entered the Sat River, and to a lesser extent the Senowo and Bebeng rivers. The maximum runout distance was ~3.5 km. Again, ash fell on the towns within a ~15 km radius around the volcano. Visual observations and photographic analysis revealed that the dome became higher and larger than it was during the previous report period, and that there was a new active point at the summit that may have been a fumarole or a hot spot. The volcano remained at Alert Level 3 (on a scale of 1-4).
Sources: Pusat Vulkanologi dan Mitigasi Bencana Geologi (PVMBG, also known as CVGHM); Associated Press; Agence France-Presse (AFP)
An Associated Press article from 25 January reported that ash mixed with rain fell on the village of Deres on the flanks of the volcano. Activity reportedly increased slightly on 25 January.
Source: Associated Press
The VSI reported that during 16-22 January visual and instrumental monitoring revealed a continued increase of volcanic activity at Merapi. Activity consisted of several pyroclastic flows, small ash eruptions, glowing lava flows, lava avalanches, and an increase in seismicity, especially in avalanche and multi-phase earthquakes. More than 20 pyroclastic flows per day traveled continuously to the Sat (upstream of River Putih), Senowo, and Bebeng rivers. The number of glowing lava avalanches also increased since last reported, with more than 150 events per day observed. The avalanches traveled down to the Sat, Senowo, and Bebeng rivers extending as far as 3,500 m. The new lava dome, "lava dome 2001," grew at the volcano's summit over the preexisting "lava dome 1998." The Darwin VAAC reported that an ash cloud that was not visible on satellite imagery reached 500 m above the summit on 19 January. The VSI reported that during the report period ash fell in the towns of Babadan, Ngepos, and Kaliurang. An average of 95 tons/day of SO2 was measured. The volcano remained at Alert Level 3 (on a scale of 1-4).
Sources: Pusat Vulkanologi dan Mitigasi Bencana Geologi (PVMBG, also known as CVGHM); Darwin Volcanic Ash Advisory Centre (VAAC); Associated Press
The VSI report for 9-15 January noted that activity increased at Merapi, prompting the hazard status to be raised to Alert Level 3 at 0600 on 10 January. Observers frequently noted a weak white plume that rose 500 m above the summit. Glowing lava avalanches continued into the upstream areas of the Sat, Lamat, and Senowo rivers to a runout distance of 2,000 m. On 14 January there were 29 pyroclastic-flow events, which filled the Sat, Lamat, and Senowo rivers out to a maximum distance of ~4,000 m. During this week there were continuous glowing lava avalanches and pyroclastic flows at intervals of 30-60 minutes. The Associated Press reported on 11 January that authorities had ordered people living around the mountain to be on high alert and prepare to leave at short notice.
Sources: Pusat Vulkanologi dan Mitigasi Bencana Geologi (PVMBG, also known as CVGHM); Associated Press
During 21-27 November small explosions occurred at Merapi, with the largest producing an ash plume that rose up to 800 m above the summit. Seismicity was high and dominated by multi-phase earthquakes. The volcano remained at Alert Level 2 (ranging from 1 to 4).
Source: Pusat Vulkanologi dan Mitigasi Bencana Geologi (PVMBG, also known as CVGHM)
The VSI reported that during the week small explosions produced ash plumes that rose up to 430 m above Merapi's summit. High rains during 7 to 13 November caused landslides to occur in the upstream portion of Boyong river, Kaliurang. The river is on the S flank of Merapi and extends ~28 km map distance from the summit. The landslides killed one person and more landslides or lahars are expected during the current rainy season. The volcano is at Alert Level 2 (ranging from 1 to 4).
Source: Pusat Vulkanologi dan Mitigasi Bencana Geologi (PVMBG, also known as CVGHM)
Reports are organized chronologically and indexed below by Month/Year (Publication Volume:Number), and include a one-line summary. Click on the index link or scroll down to read the reports.
Nuee ardentes travel down SW-flank valleys; more dome growth
Card 0331 (10 January 1969) Eruption destroys 60 homes; three people missing
Sixty homes have been destroyed and at least three persons are missing in a volcanic eruption in Indonesia. Lava flowed down the mountainside into the town of Magerang and the village of Muntilam. A larger eruption is predicted.
Card 0332 (13 January 1969) Nuee ardentes travel 11-12 km down SW flank river valleys
Djajadi Hadikusumo provided the following report dated 9 January. "Activity of Merapi volcano increased since 8 January. From 0230 on nuee ardente d'avalanches, accompanied by lightning, continuously went down into rivers of Blongkeng, Batang, Bebeng, and Krasak (SW slope) reaching a distance of about 11 or 12 km from the summit, approximately until the village of Nganggrung on the SW slope, situated inside the prohibited zone. All of 'lava 1967' tumbled down and on its place now glare could be observed. The seismograph at Plawangan Observatory (~5.5 km S of the summit) still records volcanic tremors in high amount. At this observatory the ash layer was 2 cm thick."
Card 0333 (13 January 1969) New lava emerges at location of 8 January dome collapse
K. Fredriksson provided the following report by telephone 13 January concerning conversations with D. Hadikusumo on 11 January. Seismic acitivity has calmed down. Mt. Merapi covered by cloud since 8 January. Paroxysm on 8 January at 0230 hours. Nuee ardente of avalanche to village of Pakel, 13 km SW. Main direction of avalanche to the rivers Blongkeng and Bebeng. New lava emerged on the same spot where the lava dome has collapsed. Evacuation of people taking place in Magelang area and around the villages of Kamongan and Djombang.
Card 0334 (14 January 1969) Volcanic materials extend 13 km W of the summit
Mt. Merapi . . . is currently producing nuee ardente blasts in the direction of the Borobudur Temples near Muntilan, 35 km NW of Jogdjakarta. The status of the temples and archaeological sites is not known but volcano blasts of incandescent lava materials were ejected from the Merapi volcano in a westerly direction up to a distance of 13 km from the summit toward the towns of Magelang, Kamongan, and Djombang.
Card 0343-0344 (20 January 1969) Minor lava avalanches from new dome
The following was received from Kurt Fredriksson in Djakarta on 20 January 1969. "Herjono took me to the still hot ash flow area around Kaligesik as high as considered safe. I photographed and collected a few samples. Climbed to the Blawangan Observation Station at 1,290 m altitude. During night and early morning observed and photographed several lava avalanches. Good conditions between 0200 and 0800. The lava avalanches appear to consist of blocks or clusters of blocks, incandescent, which break loose from the growing lava dome at various places and tumble down 1-2 km or 400-500 m below summit. The material apparently accumulates in certain places and gives rise to secondary steam explosions. At approximately 0730 rather strong disturbance was observed on seismograph, not felt however, followed in few minutes by emission of dark smoke in SW of crater above new lava dome. Most steam, white continuous, seems otherwise to originate in N side of summit crater. Shock could have been caused by collapse?
"Major phase pf eruption is over. Lava avalanches from new dome appear minor. The ash flow deposit ~10 m. In the Kaligesik area (sampled) and still hot (secondary steam explosions) indicates that this is more like real 'nuee ardente' type than Mt. Mayon. No welding ocurs and channel higher up on steep slope appears to be swept clean like at Mayon."
Information Contacts:
Card 0331 (10 January 1969) George Beauchamp, U.S.A.I.D. Disaster Relief.
Card 0332 (13 January 1969) Djajadi Hadikusumo, Geological Survey of Indonesia.
Card 0333 (13 January 1969) Kurt Fredriksson, Smithsonian Institution.
Card 0334 (14 January 1969) American Embassy, Djakarta, Indonesia.
Card 0343-0344 (20 January 1969) Kurt Fredriksson, Smithsonian Institution.
Lava avalanches cause extensive damage, leaving many homeless
Card 0370-0371 (05 February 1969) January avalanches leave 2,000 people homeless
13 January 1969. Latest reports from Java said that up until Wednesday afternoon the volcano was still emitting hot air which went down the Blongkeng and Batang rivers along a stretch of 7.5 km. An observation post at Krindjing reported major and minor avalanches and ash rains to the accompaniment of thunder and lightning. Observation posts in Jogjakarta said activites of Merapi had increased in violence on 9 January. Hot air spouted from the summit of the volcano, reaching a distance of about 12 kilometers. Three officials at the Plawang post, nearest to Merapi, were said to be in excellent condition despite violent seismic activities, rains and ash rains.
Reports of the Jogjakarta municipality said thus far a total of about 180 houses had been seriously damaged. The interior of some of the houses was filled with mud, at several points as thick as 1.5 m. Most of the houses were located along the bank of the Tjode river in the center of Jogjakarta. At present a total of about 2,000 citizens have been rendered homeless. The majority came from the Prawiro dirdjan, Sajidan, Djeties, and Bintara villages. Meanwhile, drinking water supplies in Jogjakarta have now been reduced by ~50% as a result of damages to some of the vital local installations. Likewise, streets in the vicinity of the Sjuhada Mosque were cracked at several points.
Card 0372 (05 February 1969) New lava emission on 25 January; serious road damage
25 January 1969. Merapi started emitting new lava again recently after having been quiet for some time according to the latest reports of the volcanological station. The lava was estimated at 250 m in length and 150 m in width. It is called the 1969 lava.
27 January 1969. Traffic communications between Magelang and Jogjakarta have been cut off since 22 January due to serious road damages along a stretch of 200 m linking Muntilan and Tempel. Torrential rains in the vicinity of the Merapi volcano last Wednesday flooded several rivers which later swept away rocks, pebbles and sand, rendering serious damages to roads linking Muntilan and Tempel. A market in the Tulan subregency was inundated by swollen waters of the rivers. Meanwhile panic has gripped villagers at Srumbung, Dukuh, Salam, and Muntilan.
Card 0407 (17 February 1969) Three known victims of the January avalanches, but 3,800 refugees
"The eruption which took place in the summit region recently, on the night of 7-8 January 1969, resulted in avalanches of the lava dome reaching distances of 13 km down the crater rim. Since 11 January a lava flow has come down in the vicinity of Geger Buaja in the direction of Jogjakarta. Until now there are only three registered victims of the kampongs Gimbal and Ngangrang, however the number of refugees in the Jogjakarta region amounts to about 3,800 people. It seems that the activity of the volcano has quieted down since 25 January."
Information Contacts:
Card 0370-0371 (05 February 1969) Otto Soemarwoto, Antara News Agency, The Djakarta Times, Djakarta, Indonesia.
Card 0372 (05 February 1969) Otto Soemarwoto, Antara News Agency, The Djakarta Times, Djakarta, Indonesia.
Card 0407 (17 February 1969) G.A. De Neve, Universtas Padjadjaran, Bandung, Indonesia.
Summit explosion on 6 October
Card 1468 (18 October 1972) Summit explosion on 6 October
Babadan Volcano Observatory, some 4.2 km WNW of Mt. Merapi summit.
06 October 1972. 0720: Strong emission of whitish smoke in the upper part of Batang breach. 0729: Gas explosions; ash cloud rose to 3,000 m above summit. 0730: Rumblings of avalanches which went down into Batang River (SW) 3km distant; rock falls (of explosion) went into Trising and Apu rivers (NW). 0742: Shower of large-grain sand at the observatory; also in Telogolele village some 7 km distance from summit. 0745: Sand shower stopped; thin sand deposit at the observatory.
Some volcanic quakes were recorded about 3.5 minutes before the explosion took place and thereafter tremors of avalanches were recorded for about 8 minutes. After this Mt. Merapi was hidden by clouds. All other observatories around the volcano were unable to observe the activity due to thick clouds; only rumblings could be heard. The center of activity was located in the upper part of "1969 lava" in the Batang breach. A small part of the upper part thereof was blown off in the eruption cloud. During the following week no abnormal phenomena were observed (up to 11 October).
Information Contacts: Djajadi Hadikusumo, Geological Survey of Indonesia.
Increases in seismicity, lava dome height, and incandescent spots on dome
Activity increased in February compared to the previous month. The number of volcanic earthquakes increased, the lava dome grew higher, and red glares were observed at 2 points on the dome. The number of glowing avalanches decreased from January, however, and there was only one nuée ardente, on 4 February, that traveled about 750 m SW into the Batang River.
On 5 March at 1503, reddish white smoke emitted with strong gas pressure was observed to about 350 m above the summit. The volcano was hidden behind clouds. On 6 March, small avalanches took place continuously from 0135 until 0348, then the volcano was covered by clouds. At 1702, three avalanches were observed. From 1733 on, bigger nuées ardentes took place, interspersed with minor ones, until 13 March (table 1).
Table 1. Daily number of nuées ardentes and maximum distances traveled from the vent, 6-13 March 1976.
| Date | Large | Small | Maximum Distance (km) |
| 06 Mar 1976 | 10 | 19 | 4 |
| 07 Mar 1976 | 17 | 16 | 5.5 |
| 08 Mar 1976 | 5 | 2 | 3.5 |
| 09 Mar 1976 | 5 | 6 | 6 |
| 10 Mar 1976 | 1 | 4 | 2.75 |
| 11 Mar 1976 | 1 | 9 | 5.5 |
| 12 Mar 1976 | -- | 6 | 1.5 |
| 13 Mar 1976 | -- | 3 | 1.5 |
From the evening of 8 March until the evening of 9 March, when the volcano became visible from the Ngepos Volcano Observatory 11 km SW of the summit, it could be observed that the lower part of the lava dome, estimated to be about 400,000 m3, or almost 1/3 of its volume (1.4 x 10⁶ m3), had slid away. During the events on 6 and 7 March nuées ardentes moved SW, entering a tributary of the Batang River and continuing much further down stream into the rivers Sat, Blongkeng, and Bebeng. The prevailing wind blew E, depositing finer volcanic products on the E and SE flanks to a maximum distance of 37.5 km. Thickest ash falls were on the ESE flank. At 6 km from the summit the deposit apparently measured 5 mm and temporarily panicked the villagers.
Nuées ardentes caused forest fires on the upper SW flank near the tributaries of the rivers Sat, Blongkeng, and Bebeng. Roughly 580,000 m3 of ash were deposited on the E flank, and around 300,000 m3 of avalanche material were deposited on the upper SW flank.
Information Contacts: D. Hadikusumo, Volcanology Division, GSI.
Ash clouds rising 3 km; nuées ardentes down the SW flank
Merapi was unusually active on 6 and 7 November, emitting 3,000-m ash clouds, and nuées ardentes that moved 2.5 km down the SW flank. No casualties or serious property damage were reported. The new dome, which began growing after the March activity, had an estimated volume of 20,000 m3 in June.
Information Contacts: D. Hadikusumo, Volcanology Division, GSI; D. Shackelford, Villa Park, CA; UPI.
Lava dome growth continues; frequent avalanches
The new lava dome, had increased in volume from about 2 x 10³ m3 in June, 1976 to about 2.5 x l06 m3 in late February, 1977. Avalanches continued to occur at intervals of 15 minutes or more; sometimes, but not every day, nuées ardentes accompanied the avalanches, especially after a heavy rainfall.
Information Contacts: J. Matahelumual, Volcanology Division, GSI; D. Shackelford, Villa Park, CA.
980°C fumaroles on N flank; increased seismicity
Merapi was visited by Haroun Tazieff in July. No eruption was occurring, but seismicity was increasing, and fumarole temperatures on the N flank reached 980°C, as compared to 400-500°C during previous periods of quiescence.
Information Contacts: H. Tazieff, CNRS, Gif-sur-Yvette; P. Jezek, SI.
Fumarole temperatures and gas analyses
Franois Le Guern and Haroun Tazieff provided the following fumarole temperatures and gas compositions (table 2), obtained during their July visit to Merapi. Gases were analyzed with a field gas chromatograph.
Table 2. Fumarole temperatures (maximum and analyzed with a gas chromatograph) and gas compositions (in volume %) at Merapi, July 1978. "Crater" is the crater near the active dome. Courtesy of Franois LeGuern and Haroun Tazieff.
| Location | Gendol(1) | Gendol(2) | Gendol(3) | Crater | Woro |
| Max Temp °C | 820 | -- | -- | 901 | 760 |
| Analysis Temp °C | 720 | 720 | 819 | 744 | 580 |
| CH4 | 0.013 | 0.017 | less than 0.001 | 0.06 | -- |
| CO2 | 3.28 | 4.02 | 4.57 | 5.26 | 3.21 |
| H2O | 94.37 | 93.08 | 93.71 | 90.75 | 94.27 |
| H2S | 0.24 | 0.30 | 0.47 | 1.15 | 0.12 |
| SO2 | 0.25 | 0.31 | 0.51 | 1.14 | 0.06 |
| H2 | 1.12 | 1.36 | 0.56 | 1.46 | Tr |
| O2+Ar | 0.15 | 0.19 | 0.005 | 0.02 | Tr |
| N | 0.55 | 0.68 | 0.13 | 0.12 | 2.34 |
| CO | 0.03 | 0.03 | 0.01 | 0.02 | 0.02 |
Information Contacts: F. LeGuern and H. Tazieff, CNRS, Gif-sur-Yvette.
Hot avalanches decline; dome growth continues
Newspaper reports state that hot avalanches from the lava dome decreased in frequency during May, after as many as 40/day had occurred in April. The May avalanches traveled as much as 1.75 km. Growth continued at the new dome, which first appeared in January 1979 and now covers the remnants of the 1973 and 1978 domes.
Information Contacts: Kompas, Jakarta; M. Krafft, Cernay.
Dome growth continues
Lava dome extrusion continued through 1979 from a SW flank vent ~200 m below the summit. A lobe of lava extending a short distance down the upper SW flank gave the dome an asymmetrical form and occasionally spawned nuées ardentes d'avalanche. The last significant nuée ardente traveled ~6 km in August 1979, but remained within the forbidden zone, where human access is prohibited. The maximum thickness of the active dome was ~100 m in October. In November, VSI estimated its volume at 1.14 x 10⁶ m3 and its extrusion rate at ~105 m3/month.
Information Contacts: A. Sudradjat and L. Pardyanto, VSI.
Lava dome growth; hot avalanches
The lava dome that began to emerge at the summit in 1979 was still growing in February and had reached an altitude of 2947 m. Lava fragments from the E and central part of the cone had moved 2.0 km toward the Batang River, and 250-500 m farther in December. Personnel at the Ngepos Observatory have counted 34 larger and 468 smaller lava avalanches in recent months; the time interval was not reported. Nuées ardentes d'avalanche occurred in November and December but were confined to the summit area. Two Minakami A-type earthquakes, the first in several months, were recently recorded by the seismograph at the Babadan Observatory (4 km from the summit). No important lahars have occurred along the Putih, Bebeng, and Krasak Rivers since the beginning of this year's rainy season.
Further Reference. Tazieff, H., 1983, Monitoring and interpretation of activity on Mt. Merapi, Indonesia, 1977-80: a practical example, Civil Defense, in Tazieff, H. and Sabroux, J.C. (eds.): Forecasting Volcanic Events, Elsevier, Amsterdam, p. 485-494.
Information Contacts: A. Sudradjat and L. Pardyanto, VSI.
Sixty percent of the summit dome destroyed; hot avalanches
Landsliding on the summit lava dome 29 November was followed by a nuée ardente d'avalanche that flowed 3-4 km down the Batang River valley. Ash fell 15-20 km to the NW. An avalanche of incandescent lava from the dome set fire to 15 hectares of tropical mixed forest. On 1 December approximately 3/5 of the lava dome slid down the upper flank, flooding the Krasak and Batang Rivers and adding 1.2 x 10⁶ m3 to the deposits from previous debris flows. As of early December, there were about 6.9 x 10⁶ m3 of unstable material in the summit area. Authorities feared that monsoon rains could cause large cold lahars, and officials of Magelang District, W of Merapi, remained on constant alert in early December. AFP reported that the volcano continued to emit ash in mid-December.
A tripartite electro-seismometer at Babadan Observatory and two single-detector seismographs near the volcano recorded continuous trains of tremors and very shallow earthquakes that may have been landslide events. Continuous records of magnetic values showed no significant changes. No sharp variations in CO2 and H2S emissions were detected. Tilt measurements showed deformation of 10-20 µrad, within the normal variation.
Information Contacts: A. Sudradjat, VSI; AFP; Jakarta DRS.
Heavy ashfall
Heavy ashfall that began 6 February damaged crops and halted traffic in the nearby Boyolai region, according to a press report dated 8 February.
Information Contacts: AFP.
Explosions, nuées ardentes, lahars; 1,000 evacuated
The quoted material is a report from Adjat Sudradjat.
"Merapi erupted 15 June between 0215 and 0600, accompanied by nuées ardentes that extended 7 km down rivers (the Batang, Bebeng, and Krasak) on the SW side of the volcano. An eruption plume rose to 6 km height and caused ashfall in Muntilan, Ambarawa, and Semarang, approximately 60 km N of the volcano. The eruption was accompanied by detonations. The first explosion was followed by a milder eruption producing a plume to 2 km height and a nuée ardente to 6 km distance at noon. The frequency of nues ardentes progressively decreased until the morning of 16 June. No eruptions were observed the following day. Lahar material estimated to exceed 4 x 10⁶ m3 along the Bedeng, Krasak, and Putih Rivers may threaten Magelang city (population about 125,000)."
An image from the NOAA 7 polar orbiting satellite on 15 June at 1441 showed a hazy area that did not seem to be weather-related extending from 7°S to 5°S and from 110°E to the edge of the image at 106°E. The hazy area did not extend back to Merapi, nor was any tephra emission apparent at the volcano. No evidence of activity could be seen on the image returned the next day at about the same time.
Newspapers reported ashfalls at Magelang (30 km NW of Merapi) and Salatiga (35 km NE of the volcano). Visibility near Salatiga was limited to 10 m and more than a cm of ash covered roads, slowing traffic. More than 2 cm of ash fell at Solo (45 km E of the volcano) and ashfall was reported at Cilacap, on the coast 160 km SW of Merapi.
"Seismographs detected a progressive increase in seismicity from 4 counts/day on 8 June to 59 on 12 June. A warning was issued 13 June, and the evacuation of 1000 persons from forbidden zone section VI (Kemiren village) was immediately implemented. The tong-tong warning system was tested again to be sure that it was operational. The eruption was preceded by an intense lava avalanche on 13 June that caused a nuée ardente d'avalanche (nuée ardente of Merapi type)."
"As of 22 June, no volcanic A-type earthquakes had been recorded. The dominant seismicity has been continuous tremors, very shallow volcanic earthquakes, and avalanche events with multiphase signatures. Judging from this evidence, two possibilities are: (1) the 15 June eruption is the final phase of the 1969-1984 lava dome growth (effusive stage-see below); or (2) the 15 June eruption is evidence of the gas phase of a new cycle. Both possibilities would show quiescence of A-type earthquakes. The rate of dome growth, which was reported to have sharply increased 20-21 June, may tend to support the latter hypothesis if it continues."
"After the 1969 gas explosion, Merapi continued to build a lava dome in its summit crater. Since the orifice is not symmetrical, the lava dome becomes unstable as it grows, and portions slide away, producing avalanches and nuées ardentes d'avalanche. The maximum growth of the dome was 3.6 x 10⁶ m3 and the rate of growth was seemingly constant at about 0.1 x 10⁶ m3/month. Intensive sliding usually occurs in rainy seasons, in November annually, and removes 20-30% of the dome's total volume. The lava blocks that slide away from the dome may originate lahars, affecting a large area of the SW sector of the volcano."
Further References. Bardintzeff, J.M., 1984, Merapi volcano (Java) and Merapi-type nuée ardente: BV, v. 47, p. 433-46.
Zen, M.T., Siswowidjoyo, S., Djoharman, L., and Harto, S., 1980, Type and characteristics of the Merapi eruption: Buletin Dept. Teknik Geologi, Inst. Teknologi Bandung, v. I, p. 34-46.
Information Contacts: A. Sudradjat, VSI; M. Matson, NOAA/NESDIS; Jakarta Times.
Rockfall seismicity suggests increased lava dome growth
Between 13 and 17 October, seismographs recorded numerous local rockfall events at rates that reached 300-400/day on the 15th and 16th, suggesting possible increased growth of the lava dome. No A- or B-type shocks were detected. Seismicity declined to background after 17 October. Geologists climbed the volcano 15 October. Heavy steaming was occurring from the lava dome, but rates of SO2 emission had declined slightly to 70 t/d, from typical rates of 100-200 t/d. Temperatures at Woro and Gendol fumaroles remained at ~600 and 800°C.
Information Contacts: I. Bahar, MVO; T. Casadevall, VSI.
Summit lava dome growth
Renewed growth of the summit lava dome began in early October and continued into November. As of mid-Nov, the lava dome volume was 3 x 10⁶ m3. Several hundred rockfalls/day have been occurring since mid-Oct.
Information Contacts: VSI; ANS.
Lava flow from October-November dome advances onto SW flank
Aerial observations 6-7 January revealed no evidence of major new dome growth since Oct-Nov 1986. The volume of the summit crater lava dome was > 4 x 10⁶ m3. From the SW base of the Oct-Nov dome, a lava flow extended through the breach in the crater wall onto the volcano's SW flank, where it continued to advance slowly. Incandescent rockfalls from the toe of the flow, and from the area where the flow emerged from the dome, were observed at night in early January. The number of earthquakes has declined since peaking in late October and early November.
Information Contacts: VSI.
Rockfall seismicity ends; dome growth probably stops
Seismic instruments recorded a significant decrease in the number of rockfall events in late January and early February, suggesting that growth of the October-November lobe of the lava dome had ceased. Rockfall seismicity remained weak through early March.
Information Contacts: VSI.
Lava dome, largest since 1973, appears stable
Merapi was inspected on 9 May. The September 1986-January 1987 lava dome remained stable and was not growing [but see 12:8]. A robust whitish gas plume containing SO2 continued to be emitted from fumaroles on the E side of the lava dome and from the Gendol and Woro fumarole fields. The volume of the new lava dome measured on 9 May was slightly in excess of 4 x 10⁶ m3, the largest since 1973. No rockfall avalanches were noted during April, although several earthquakes/day were recorded.
Information Contacts: T. Casadevall, USGS & VSI.
Lava dome growth, but nuées ardentes de avalanche stop
Comparison of photographs taken during visits to the summit in May, July, and on 8 August, showed that the lava dome continued to increase in volume. Most of the growth seems to have occurred by addition of material to the top of the dome and in its NE sector. No perceptible new growth has occurred on the SW part of the dome. . . .
Information Contacts: VSI.
No lava dome growth from August to November
The volcano was visited by a VSI/USGS team on 19 November. Comparison of photos taken in August and November indicated no significant additional growth of the lava dome.
Information Contacts: VSI.
Large summit dome; fumaroles to 800°C; lahar alert
The volume of the summit lava dome has remained constant since January at ~6.4 x 10⁶ m3. Two active solfataric vents fed a plume that rose to as much as 500 m above the summit. May 1989 temperatures at the vents were [813°C] (Gendol) and [575°C] (Woro). The number of earthquakes recorded . . . near Merapi [is shown in table 3]. No lahars occurred in February, although rainfall was increasing on the volcano's NW sector (while decreasing on the SW sector). An increased lahar alert notification has been released, especially for areas along SW-sector river valleys (K. Putih, K. Blongkeng, K. Krasak).
Information Contacts: VSI.
Large lava dome growing slowly in summit crater
The slowly growing lava dome in the summit crater reached 6.6 x 10⁶ m3 by late 1989, a size described as "critical" for the collapse-prone dome. A white plume rose as much as 250 m from the crater's solfatara field, but under little pressure. COSPEC measurements showed an average SO2 flux of 73 t/d, up slightly from August. No lahar occurred during September, but alert status has been increased with the coming rainy season. Seismicity generally increased in September from August values (table 3). No A-type events were recorded.
Table 3. Seismicity recorded at Merapi, January-February and August-September 1989.
| Month | Collapse | Multiphase volcanic | B-type | Tectonic |
| Jan 1989 | 416 | 11 | 2 | 70 |
| Feb 1989 | 208 | 24 | 0 | 65 |
| Aug 1989 | 430 | 50 | 2 | 64 |
| Sep 1989 | 609 | 34 | 2 | 279 |
Information Contacts: VSI.
Slight increase in seismicity; lava dome volume stable
The number of volcanic earthquakes at Merapi increased slightly during July, with six recorded events/week, compared to 4-5/week in June. During the first week of August, five earthquakes were recorded. Earthquakes associated with collapse episodes on the lava dome were recorded an average of 32 times/week. More than 36 volcanic events were recorded during a swarm in the 24 hours beginning 4 August at 0000. The volume of the lava dome was stable at 6.8 x 10⁶ m3, up from 6.6 x 10⁶ m3 in late 1989. Fumarole temperatures on the dome were measured at 555 and 820°C.
Information Contacts: VSI.
Slight increase in seismicity; no apparent dome growth
Seismic activity increased slightly in early March, from two events/week to an average of 9/week. A swarm of small-amplitude (plus three large-amplitude) shallow volcanic earthquakes occurred on 10 March. The lava dome volume was stable at 6.8 x 10⁶ m3, the same as reported in August 1990 (15:07).
Information Contacts: W. Modjo, VSI; AP.
High-temperature fumaroles; no changes evident to summit dome
No changes were visible at the summit dome, whose volume remained at ~6.8 x 10⁶ m3. Diffuse to dense gas plumes rose to 450 m above the summit. Temperatures of 832 and 543°C were measured at the dome's Gendol and Woro solfataras, respectively. The temperature measured through cracks in the 1956 lava was 86°C on 20 April. There was no significant change in seismicity, although the weekly number of volcanic earthquakes briefly rose to 17 during the second week in April from the long-term average of 1-4. One multiphase event and 3-10 tectonic earthquakes were recorded/week.
Information Contacts: W. Modjo, VSI.
Continued seismicity but lava dome unchanged
Seismic activity remained unchanged, with three volcanic earthquakes recorded during the first week in May, and seven during the last week in May. No changes were visible at the summit dome.
Information Contacts: W. Modjo, VSI.
Gas plumes and seismicity
Diffuse to dense gas plumes rose 475 m in June, with SO2 fluxes averaging 80 t/d. The weekly number of volcanic earthquakes fluctuated, briefly rising to 33 during the third week in June, of which 28 were recorded on the 22nd. Three volcanic earthquakes were recorded below the crater at 3.0-3.5 km depth. An average of two multiphase events and 10-12 tectonic earthquakes were recorded weekly.
Information Contacts: W. Modjo, VSI.
Degassing but no apparent lava dome growth; deformation data from 1988-90 and seismicity from 1990-91
The volume of the lava dome apparently remained stable at 6.8 x 10⁶ m3, and the temperature of the nearby solfatara was 806°C in early December, about the same as in November. Degassing continued, with the vapor column reaching 300 m height. December COSPEC measurements yielded SO2 emission rates of 73 t/d during the first week and 87 t/d the second week. Average plume velocity was 0.9-3.4 m/second. December is generally a rainy month at Merapi, and geologists were closely monitoring lahar hazards. Moderate seismicity continued to be recorded by nearby instruments (table 4).
Table 4. Local seismicity at Merapi during the first two weeks of December 1991. Courtesy of VSI.
| Dates | Volcanic | Multiphase volcanic | Avalanche | Tectonic |
| Dec 1991 - Week 1 | 3 | 5 | 10 | 13 |
| Dec 1991 - Week 2 | 13 | 4 | 6 | 4 |
[The following seismicity and deformation data were excerpted from 17:3] Comparison of distance measurements across the summit in June-July 1988 and September 1990, during to shortly after the later stages of the previous dome-building eruption, showed expansions that reached nearly 1 m (figure 1). Seismic data from 1990-91 show a strong increase in B-type events during the August 1990 crisis. B-type seismicity remained at increased levels through 1991 (figure 2).
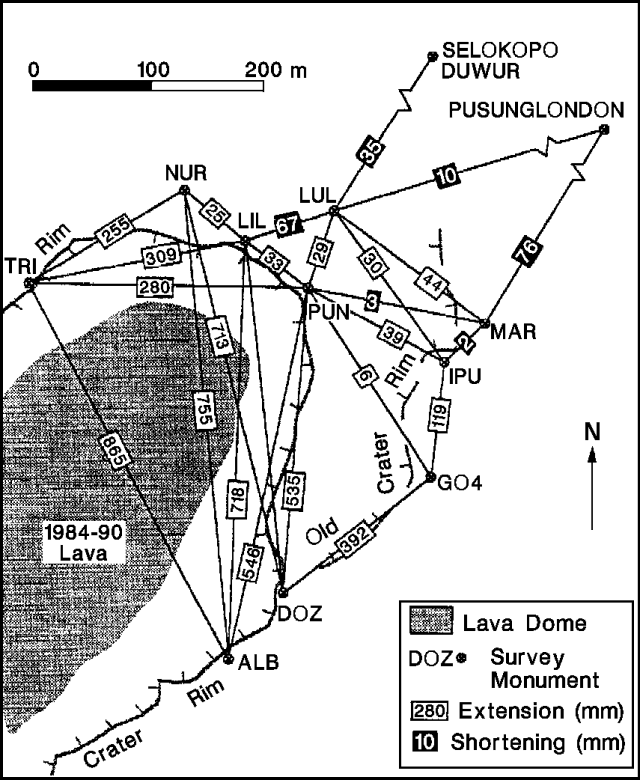 |
Figure 1. Distance changes (in mm) at Merapi, between measurements in June-July 1988 and September 1990. Data collected by B. Voight, K. Young, and staff of the Merapi Volcano Observatory. Courtesy of B. Voight. |
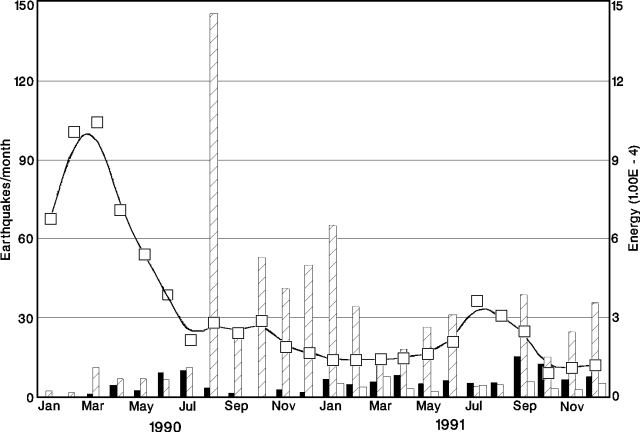 |
Figure 2. Monthly number of volcanic earthquakes (bars) and the inverse of seismic energy release (calculated after Voight, 1988), at Merapi, 1990-91. Courtesy of B. Voight. |
Reference: Voight, B., 1988, A model for prediction of volcanic eruptions: Nature, v. 332, p. 125-130.
Information Contacts: VSI; UPI; B. Voight, Pennsylvania State Univ.
Hot material moves down flanks
The press reported that hot "lava" began moving down Merapi's flanks on 21 January at about midnight. There were unconfirmed descriptions of damage to plantations in one area, but officials reported no evacuations.
Information Contacts: UPI.
Ash ejection; hot flows destroy crops
At about midnight on 21 January, an eruption reportedly began with explosive ash ejection. Accompanying flows of hot "lava" traveled 1.5 km down the flanks of the volcano, destroying rice fields and other crops. A Space Shuttle photograph taken at 0700 on 24 January showed a steam plume, and apparent dusty deposits on the summit area and to the SE. Press information indicated that the volcano continued to erupt on 7 February, with reports of ashfall to ~30 km and additional hot "lava" flows. The estimated 5,000 residents living within a 14-km radius of the volcano were warned by local authorities to be ready to evacuate at any time.
Information Contacts: C. Evans, NASA-SSEOP; UPI; The Jakarta Post.
Lava dome growth and pyroclastic flows
The following supersedes [16:12 and 17:1].
Increased seismicity preceded the start of summit-area lava extrusion that was first observed on 20 January. Deep (A type, 3.1-3.7 km depth) and shallow (B type,
Glowing rockfalls were first seen on 20 January between 1800 and 2000, emerging from a narrow opening between the NW crater rim (formed by the 1957 lava dome) and the 1984 dome. The rockfalls initially traveled an estimated 125 m from the summit, but they extended farther with time, to ~1,500 m on 31 January (figures 3 and 4). A new lava dome was covering the NW part of the 1984 dome when geologists from the MVO climbed the volcano on 31 January. The 1992 lava was ~50 m higher than the 1984 dome.
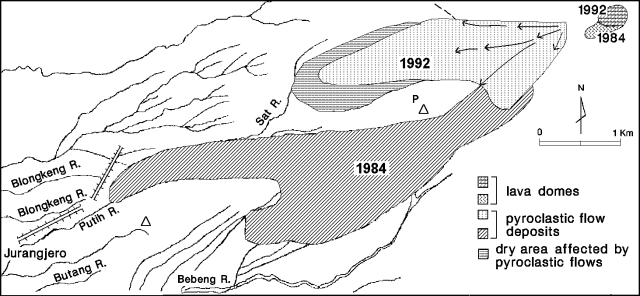 |
Figure 3. Sketch map of Merapi's 1992 lava dome, and the distribution of avalanche-generated, pyroclastic-flow deposits as of 18 February. Courtesy of MVO. |
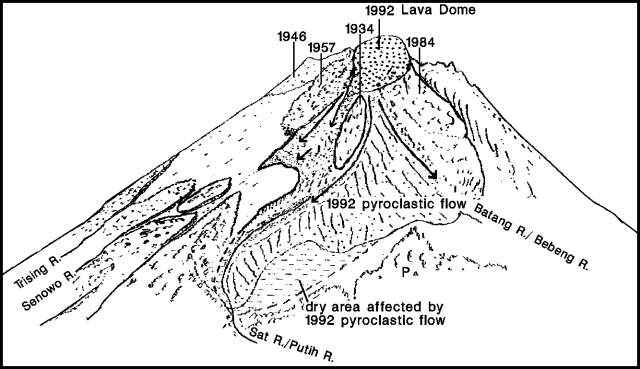 |
Figure 4. View of Merapi at 0630 on 3 March 1992, drawn by Sadjiman from Jurangjero, ~ 8 km WSW of the summit. Courtesy of MVO. |
The first avalanche-generated pyroclastic flow occurred on 31 January at 1535, and three more were detected the next day (table 5).
Table 5. Number of avalanche-generated pyroclastic flows at Merapi, 31 January-2 March 1992. Courtesy of MVO.
| Date | Pyroclastic Flows | Distance from summit (m) |
| 31 Jan 1992 | 1 | 800 |
| 01 Feb 1992 | 3 | 850-900 |
| 02 Feb 1992 | 3 | up to 4000 |
| 04 Feb 1992 | 9 | 800-1500 |
| 05 Feb 1992 | 7 | up to 1500 |
| 06 Feb 1992 | 2 | up to 2000 |
| 07 Feb 1992 | 6 | up to 3500 |
| 10 Feb 1992 | 3 | 1000-1750 |
| 12 Feb 1992 | 1 | 800 |
| 17 Feb 1992 | 20 | 1500-2500 |
| 18 Feb 1992 | 3 | 1500-2000 |
| 20 Feb 1992 | 5 | 600-1000 |
| 21 Feb 1992 | 1 | 1750 |
| 25 Feb 1992 | 1 | 800 |
| 29 Feb 1992 | 1 | 2000 |
| 01 Mar 1992 | 1 | 2000 |
The most vigorous pyroclastic-flow activity was on 2 February, when 33 were observed between 1220 and 2221, extending a maximum of 4 km from the summit. These were accompanied by small explosions that were heard 4 km NW of the summit (at Babadan Observatory). Ash rose to 2,600 m above the summit. Sulfur odors were also noted. Volcanic earthquakes were very rare during the eruption.
Pyroclastic-flow intensity then decreased; none have occurred since 2 March, but the lava dome continued to grow as of mid-March. Glowing rockfalls were nearly continuous (>1,000/day since 2 March), but relatively small, extending
Four alert levels have been established by VSI at Merapi: 1) Notifies residents of increased activity and the need for awareness and caution: 2) More serious precursors require increased awareness; local authorities are requested to prepare for hazard prevention and evacuation: 3) All persons living in the danger zone must pack valuables and items that would supply basic needs during an evacuation: 4) Evacuation required because of explosive eruption and the approach of pyroclastic flows toward inhabited areas.
During the 1992 eruption, Alert Level 1 was announced on 24 January, increasing to Level 2 on 1 February at 2215, and to Level 3 the next day at 1430. As the eruption intensity decreased, the alert level was lowered to 2 on 12 February and to 1 on 2 March.
Information Contacts: S. Bronto, MVO.
Continued lava extrusion; small rockfalls and avalanche-generated pyroclastic flows
Glowing rockfalls continued from Merapi's 1992 dome. They were channeled into the headwaters of rivers on the NW (Senowo), W (Putih), and SW (Bebeng) flanks, extending 300-2,000 m from the dome. The number of rockfalls and multiphase earthquakes generally decreased after late February, although they still dominated seismic records (figure 5). Occasional avalanche-generated pyroclastic flows remained relatively small and traveled a maximum of 2,000 m downslope. The plume was low (to 550 m height), relatively thin, and white. The average SO2 flux measured by COSPEC (figure 6) was 324 t/d through mid-April, with individual measurements ranging from 32 to 419 t/d, the highest on 2 April. As of mid-April, Merapi remained at a Level-1 Alert (see 17:2 for details of the alert system), with summit climbs by the public prohibited.
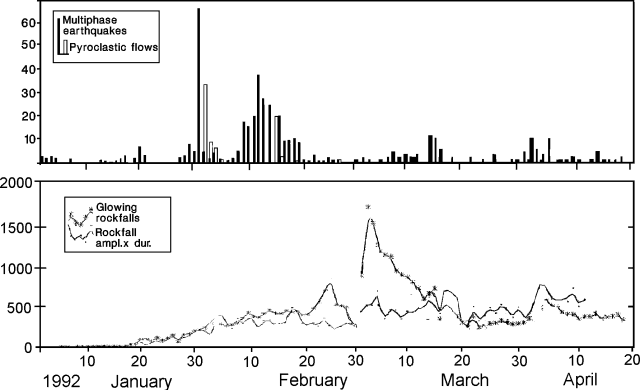 |
Figure 5. Merapi's daily number of glowing rockfalls, multiphase earthquakes, and pyroclastic flow events, with amplitudes x durations of glowing rockfalls, January-April 1992. Courtesy of MVO. |
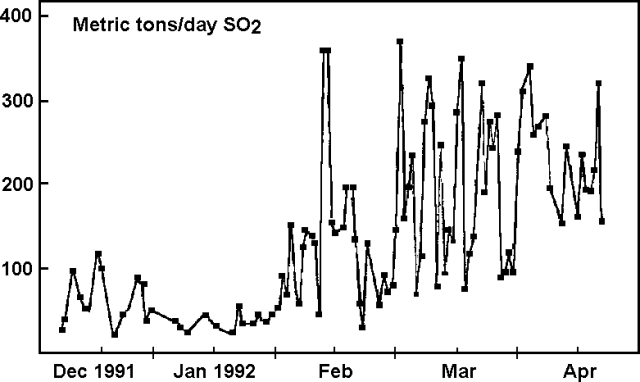 |
Figure 6. Daily average SO2 flux measured by COSPEC at Merapi, December 1991-early April 1992. Courtesy of MVO. |
[1988 and 1990-91 seismicity and deformation data were moved to follow 15:7]
Information Contacts: B. Voight, Pennsylvania State Univ.
Continued lava dome growth and rockfalls
Dome growth continued through early May, reaching an estimated volume of 4 x 10⁶ m3. Combined rockfall and pyroclastic-flow volumes were estimated to be <106 m3. The 1992 dome covered the remnant of the 1957 lava dome that had formed the NW crater rim, causing a shift in the primary direction of glowing rockfalls from W to NW, down the upper Senowo River valley. No pyroclastic flows have been observed since mid-Apr (17:03).
Information Contacts: S. Bronto, MVO.
Growing lava dome spawns avalanches; summit gas data
The volume of the lava dome at the end of July was calculated at ~10.5 x 10⁶ m3, of which 2.8 x 10⁶ m3 were pyroclastic-flow and avalanche deposits. Glow from rockfalls tended to become less bright in late July, but the distance traveled by avalanches remained relatively constant, at up to 1,500 m (to the WNW). Gases at the Gendol solfatara field, in the S part of the summit crater, were sampled for analysis (table 6).
Table 6.Gas concentrations (in volume %) and temperatures (in °C) measured at Merapi's Gendol solfatara field, May-December 1992. Courtesy of S. Bronto.
| Gas | 06 May | 27 Jun | 09 Jul | 23 Jul | 08 Sep | 22 Oct | 03 Dec |
| H2 | 0.63 | 1.19 | 1.33 | 1.72 | 1.03 | 1.09 | 0.91 |
| O2+Ar | 0.015 | 0.05 | 0.09 | 3.05 | 0.04 | 0.02 | 0.005 |
| N2 | 0.11 | 0.27 | 0.77 | 28.23 | 0.27 | 0.15 | 0.23 |
| CO | 0.03 | 0.04 | 0.06 | 0.09 | 0.05 | 0.05 | 0.06 |
| CO2 | 4.57 | 8.48 | 11.17 | 29.09 | 4.46 | 3.21 | 4.48 |
| SO2 | 0.79 | 1.57 | 1.77 | 10.86 | 0.71 | 2.20 | 0.95 |
| H2S | 0.44 | 1.35 | 1.10 | 1.66 | 0.32 | 0.40 | 1.08 |
| HCl | 0.11 | 0.29 | 0.42 | 6.37 | 0.17 | 0.40 | 0.51 |
| H2O | 93.31 | 86.76 | 83.29 | 18.95 | 92.96 | 92.18 | 91.76 |
| Temp | 802 | 818 | 820 | 813 | 816 | 807 | 824 |
Information Contacts: S. Bronto, MVO.
Pyroclastic flows follow earthquakes and rainfall; gas data
Gas at the Gendol solfatara field, on the S part of the summit, has been sampled since May 1992 (table 6). The gas analysis from 23 July shows a sharp increase in O2 + Ar, N2, CO2, SO2, and HCl, and a decrease in H2O. Concentrations had returned to previous values by the 8 September sampling. VSI geologists noted that the increase in volcanic gases may have been related to pyroclastic flows generated by dome collapse. Blue sublimates were observed around the Gendol G.13 solfatara field during fieldwork at the summit on 8 September.
Shallow earthquakes (1.8 km depth) occurred beneath Merapi on 26 August at 1314 and 1325, with magnitudes of 1.1 and 1.5, respectively. Pyroclastic flows started at 1331, 1335, and 1341, flowing 2.5 km WNW down the upper Senowo River. Volcano observation stations at Selo (~5 km NNE) and Babadan (~4.5 km NW) reported 21 and 14 mm of rainfall, respectively, in the 2 hours before the pyroclastic flows. There were additional smaller pyroclastic flows on 28 August at 1715, 1909, and 1929. Geologists believe that the pyroclastic flows may correlate with rainfall, volcanic gas activity, and seismicity.
Information Contacts: S. Bronto, MVO.
Pyroclastic flows from growing summit lava dome
The growing 1992 lava dome continued to generate incandescent pyroclastic flows. These advanced down the SW-W flank (along the upper Senowo, Sat, and Bebeng Rivers) to a maximum of 1 km from the base of the dome. White vapor rose 450 m above the dome's summit. SO2 emission measured by COSPEC (from Plawangan Observatory) was 120-230 t/d. No lahars were reported, although rainfall recorded at five volcano observatories around Merapi totaled 160-191 mm/week (in 10-17 episodes/week totaling 1,082-1,580 minutes) during the period ending in early December. No A- or B-type earthquakes have been detected at Merapi for the past 3 months. Multiphase events occurred at rates of 40-50/week, and avalanche tremors at 966-1,108 times a week.
Information Contacts: W. Modjo, VSI.
Pyroclastic flows from growing summit lava dome; highest plume rises 1500 m
Incandescent pyroclastic flows generated by the growing 1992 lava dome continued to advance down the Bebang river in late 1992 and early 1993. Some of the larger rockfalls overflowed into the Bedog and Boyong rivers on the S flank. Pyroclastic flows were visually observed between the end of December and 6 February 1993. On 3 February, the longest pyroclastic flow of this period traveled 4 km WNW down the Senowo and Sat rivers, and the highest plume, rising 1,500 m, occurred at 2200-2206. Rainfall recorded between 1515 and 2310 that same day at five volcano observatories around Merapi totalled 58-94 mm. There has been no increase in seismicity of volcanic gas concentrations (table 6). Blue sublimates are no longer seen around the G.13 solfatara field.
Information Contacts: S. Bronto, MVO.
Avalanches decrease; and seismic spectra for tremor and avalanches
Seismic and visual activity have decreased since the beginning of 1993. In the interval from May-Nov VSI staff reported only 3-10 avalanches/month, as compared to 10 avalanches/day during dome growth in 1992 and early 1993. Some specific cases of tremor, and tremor with avalanche, are depicted on figures 7 and 8.
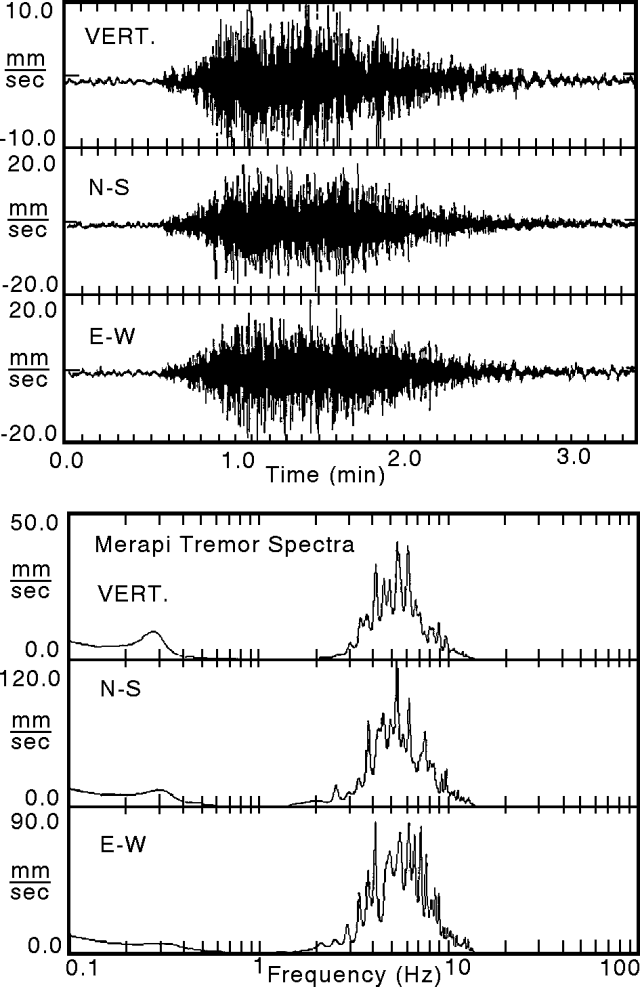 |
Figure 7. Three-component seismic record for Merapi during a large tremor (top). Recorded at Klathakan on 3 June 1993, starting at 1542. Three-component maximum entropy spectral analysis for the seismic record above (bottom). Courtesy of A. Brodscholl and K. Brotopuspito, GMU. |
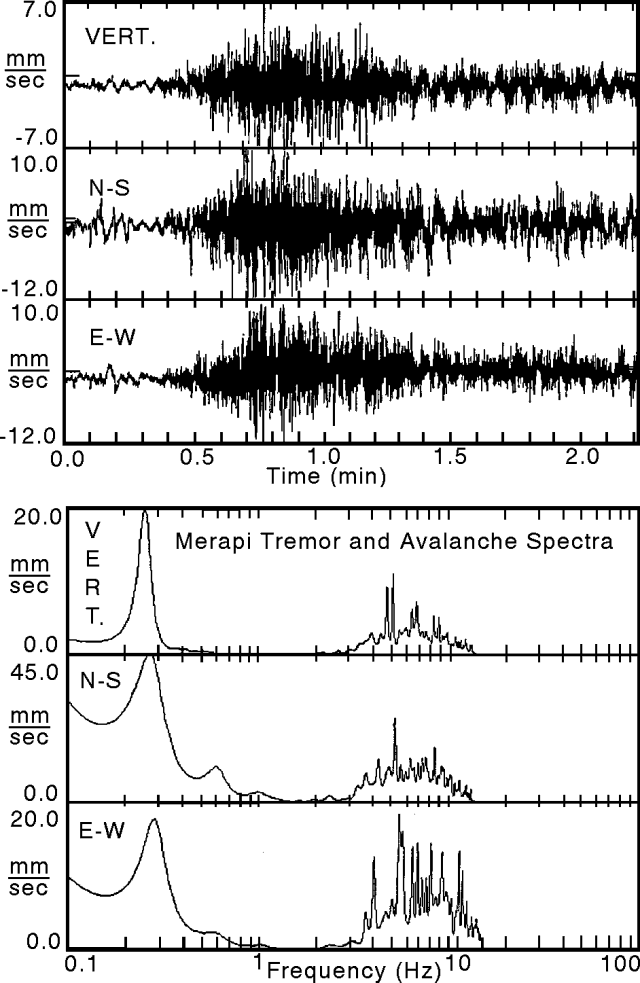 |
Figure 8. Three-component seismic record for Merapi during a tremor and coincident avalanche down the W flank (top). Recorded at Klathakan on 3 June 1993, starting at 1430. Three-component maximum entropy spectral analysis for the seismic record above (bottom). Courtesy of A. Brodscholl and K.S. Brotopuspito, GMU. |
About a week after the rainy season began at the end of November 1993, both the tremor rate and the volume of released gas increased. In early December the amplitudes of volcanic tremor rose to 2-3x higher than in previous months.
As of November the VSI supported seven seismic receiver stations at Merapi and the Geophysical Laboratory of GMU supported three. Most of the stations consisted of a vertical-component seismograph with a 1.0 Hz natural frequency. Starting in April 1993 GMU also studied Merapi using a portable 3-component system with a 0.2 Hz cut-off frequency. The portable system collected good quality data at two sites on Merapi: a) Klathakan, 1.8 km WNW of the summit between 1,200-1,300 m elevation (in the interval 1240-1600, 3 June 1993) and b) At Puncak, 0.5 km N of the summit (in the interval 0730-1530, 14 October 1993).
At Puncak, particle analysis on multiple tremor records revealed azimuths that ranged WSW-SW, occasionally swinging to ESE. From these results researchers suggested two possible tremor sources may lie at depth beneath the summit region: one offset slightly toward the W, another toward the E.
At Klathan the seismic record included intervals with tremor and little other noise (figure 7, top). The seismic record also included an interval of tremor coincident with an avalanche, which tumbled and bounced down the W flanks (figure 8, top). These two different signal sources were characterized using spectral response (figures 7 and 8, bottom); both produced spectra with a broad peak centered near 6 Hz. The broad 6 Hz peak is largest for the case of the tremor. But the case of the coincident tremor and avalanche yielded substantial peaks in the low-frequency range (centered near 0.25 Hz and at or below 0.1 Hz).
On the broad 6-Hz peaks the three components differ slightly, particularly with respect to individual spikes on the peaks. For the case of the tremor without the avalanche (figure 7, bottom), the spikes often correspond between the vertical and N-S horizontal (approximately radial), but the spikes of these components often differ from those on the E-W horizontal (approximately tangential). For the case of the tremor and avalanche, the largest spikes occur mainly to the low-frequency side of the broad peak (figure 8, bottom).
These results suggest that for some cases at Merapi an avalanche accompanied by tremor can be discriminated from tremor alone by looking at the low-frequency content of the signal. Other cases, such as typical earthquakes at Merapi, are not discussed here, but it is conceivable that advancing avalanches can be detected seismically as one means of early warning.
Information Contacts: A. Brodscholl and K. Brotopuspito, GMU; S. Bronto, MVO.
Hazard status up: sharp increases in pyroclastic flows, glowing rock falls, and tilt
The number of pyroclastic flows, glowing rock falls, and tilt increased sharply in the past several months (table 7). Both pyroclastic flows and rockfalls with substantial incandescent components traveled as far as 1.8 km (more typically, 0.5-1.0 km) down the SW slopes. In March, the number of these falls increased 1,550-fold over the background value at an undisclosed time (table 7).
Table 7. Merapi activity during 1 November 1993-23 March 1994. Pyroclastic flows have a background level ("bkgd.") of ~60-120 flows/month. In 1994 they ranged from 5-47x the background level. The background level for rockfalls was undisclosed. The RSAM curve refers to a measure of seismic power output.
| Date | Pyroclastic Flows | Rockfalls | SO2 flux variation | SO2 flux average | RSAM background | RSAM maximum |
| Nov 1993 | bkgd. | 297x | 31-188 | 91 | ~13 | ~13 |
| Dec 1993 | bkgd. | 409x | 41-108 | 66 | ~14 | ~22 (1) |
| Jan 1994 | 5x | 599x | 37-151 | 81 | ~16 | ~18 |
| Feb 1994 | 9x | 827x | 64-162 | 73 | ~17 | ~18 |
| 1-23 Mar 1994 | 47x | 1550x | 65-197 | 123 | ~16 | greater than 24 (2) |
Tiltmeters were installed in November 1992 on the crater rim near the contact with the 1992 dome. Beginning in July 1993 they showed a consistent outward rotation of ~5 µrad/day, achieving a change of 1,200 µrad overall through the end of March 1994. A measure of seismic power output (RSAM) also showed cumulative increases during November 1993-Mar 1994, indicating heightened seismic activity (table 7). During this interval the SO2 flux data were less compelling, but also showed both overall and generally progressive increases in the smallest values measured for any one interval (table 7).
Based on these monitoring data VSI proposed a shift in the hazard status, from "Normal Activity" to "First Alert Level."
Information Contacts: W. Tjetjep and R. Sukhyar, VSI; S. Bronto, MVO; UPI.
Increased deformation precedes a nuee ardente
A nuée ardente erupted around 1400 on 16 July 1994, an event preceded by a clear increase in tilt several days before the eruption. Figure 9 shows tilt measurements during the interval 1-18 July. One set of measurements came from a site on Merapi's summit (Goa Jepang, ~2,900 m elevation); the other set of measurements came from a cave on Merapi's S flank (~1,000 m elevation).
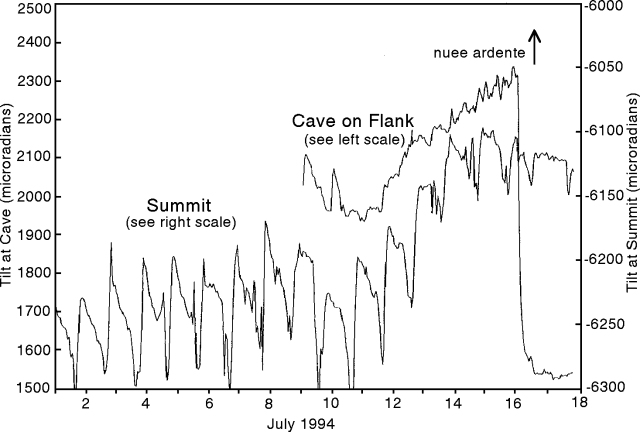 |
Figure 9. Tilt at Merapi recorded at both the summit and in a cave on the S flank, 1-18 July 1994. Courtesy of Arnold Brodscholl. |
The daily temperature variation in the cave is
Tilt began increasing at both sites roughly five days prior to the eruption. During this interval the tilt at both sites correlated consistently overall, and moderately at the finer-scale. Tilt ceased to track consistently near the end of the eruption, when the flank site underwent a dramatic decrease, a turn-around that began prior to the end of the eruption. Summit tilt measurements in January 1993 were similar to those presented here but then measurements at the cave site were a rarity, leaving the increased tilt without confirmation.
Information Contacts: A. Brodscholl, GMU; Subandryo, VSI; B. Voight, Pennsylvania State Univ.
Two new broad-band seismometers detect long-period pulses and tremor
Two STS2 broad-band seismometers were deployed on 27-29 July by collaborators of the Geophysical Laboratory of GMU and Martin Beisser of GFZ-Potsdam. The researchers investigated signal coherency at different points on the volcano to find suitable sites for a multi-station seismic array that will make permanent records at a 50-Hz sampling rate. The researchers measured Merapi seismicity at a base station located at Klathakan (1.8 km WNW of the summit between 1,200-1,300 m elev), the site of a seismic station for the last eight years. The second station was mobile and GPS-equipped; however, for the following comparisons and discussion the mobile site remained 400 m N of the base station.
Figure 10 shows amplitude data for three components of volcanic shock from the mobile station. The volcanic shock event that began at 1750 and 37 seconds on 27 July is here termed Event A. Figure 11 shows the arriving signals and allows for a visual comparison of the coherency in the vertical component (top two plots), and two orthogonal horizontal components (lower four plots). From visual inspection, the best coherency appeared in the vertical-component data. Some other types of events received appeared to show less coherency between the two sites.
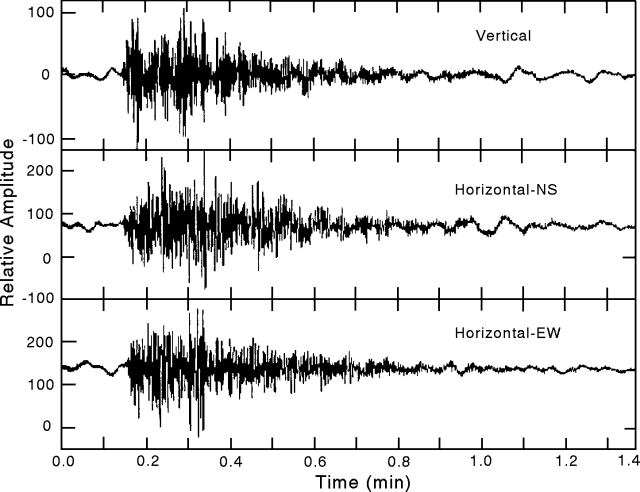 |
Figure 10. A seismic event on Merapi received at the mobile station showing 3-component amplitude data. The event shown began at 1750 and 37 seconds on 27 July 1994 and is termed "Event A." Courtesy of A. Brodscholl. |
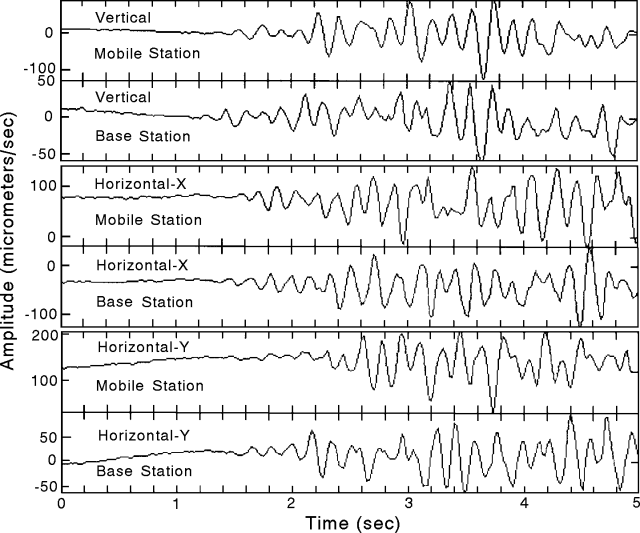 |
Figure 11. The first five seconds of Event A on Merapi (27 July 1994) as received at the broadband base and mobile stations (400-m separation). The records show considerable coherency. Courtesy of A. Brodscholl. |
Figure 12 shows three components of a previously undetected tremor type, a tremor preceded by or superimposed on a long-period pulse. On the record, the interval of greatest short-period amplitude came after the pulse's maximum. Examples of this kind of tremor were seen three times in 12 hours. Whether these events are common on Merapi and elsewhere still remains uncertain.
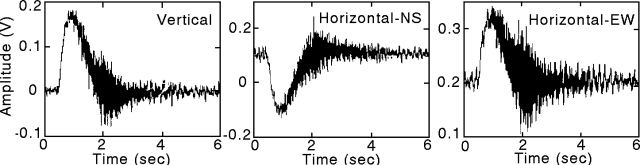 |
Figure 12. Merapi seismic record from the mobile station showing an example of tremor coming after the maximum of a long-period pulse. These pulses and temporally associated tremors were seen three times in a 12-hour period and were not previously detected. Courtesy of A. Brodscholl. |
[The reported low-frequency signal was later found to be caused by instrumental problems not recognized at the time of submission.]
Information Contacts: M. Beisser, GFZ-Potsdam, Germany; A. Brodscholl, GMU.
Pyroclastic flows on 22 November kill at least 41 people on the SSW flank
Collapse of the active summit dome on 22 November produced pyroclastic block-and-ash flows and glowing surges that traveled SSW up to 7.5 km from the summit (figure 13). As of 28 November, 41 people had died and another 43 were at hospitals in serious condition. All of the victims lived in areas near the banks of the Boyong River. That river flows off Merapi's S flanks and, at ~28 km map distance from the summit, passes through the city of Yogyakarta (population ~50,000). The threats to areas on Merapi's S flank were noted in February 1994, when rockfalls were first observed and reported along the Boyong River. Every month since March, the possibility of SW-flank destruction had been mentioned in Berita Merapi (Merapi News) informing local governments, including Sleman Regency (where this disaster took place), of hazards posed by nuées ardentes. Rockfalls from the dome have recently traveled down the Boyong and other rivers for distances of 500-1,500 m.
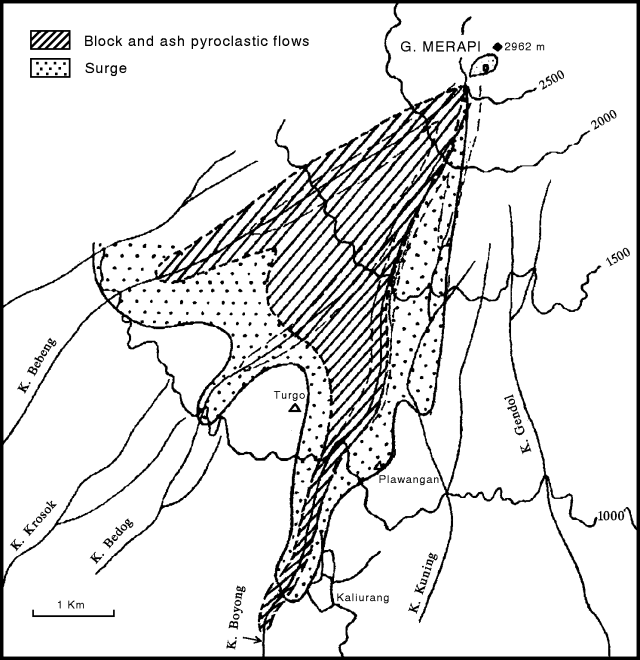 |
Figure 13. Deposits of the Merapi eruption of 22 November 1994 shown on a 500-m-contour base map of the SW quadrant with the primary drainages and some towns labeled. Courtesy of Sukhyar, MVO. |
The eruption was preceded by low-frequency earthquakes on 20 October. Multiphase seismic events and rockfalls continued to be recorded at normal levels, with occasional low-frequency events, but one tremor episode occurred on 3 November. On 4 November this change in seismic behavior was reported to the Chief of Regencies. During 21-22 November, a team from MVO climbed to the summit to observe dome development and to install an extensometer station to measure the offset along cracks.
The first nuée ardente was recorded instrumentally at 1014 on 22 November, and was observed visually from the Plawangan, Ngepos, Babadan, and Jrakah observation posts. The team at the summit saw a vertical plume that originated from a location somewhere on the S part of the dome.
The intensity of the nuées ardentes increased at 1020, prompting the observer at Plawangan to send a warning to the forestry officer at Kaliurang (figure 13), a well-known tourist resort. The officer then yelled a warning to the local people. Five minutes later (1025) MVO instructed all observation posts and radio stations of the Regional Task Force that the alert status had been raised to the highest level (Level 4), and that evacuations should begin. At 1045 the observer at Plawangan sent a message to the Chief of Pakem District, but he was already in the field, probably because he had heard the previous warning. Another evacuation warning was radioed to regional task forces at 1100. By 1215 the first victim had been discovered. The Plawangan observation post was abandoned at 1508 and the personnel temporarily moved to Kaliurang. The nuées ardentes had diminished by 1720 that evening.
A NOAA/NESDIS volcano hazards alert stated that at 1346 on 22 November a plume rose to ~10 km. At that time winds aloft were toward the W at 18 km/hour. These same points were repeated in an aviation safety alert (NOTAM).
A UNDHA report on 23 November stated that 25 of 40 employees building a water treatment facility were still missing, while 15 were found dead. Evacuees totalled 6,026 from the neighboring villages in the subdistrict of Pakem. Evacuation and emergency response measures had been undertaken by the local authorities and community members. The UNDHA reported that local volcanology officials advised authorities and local people to remain on alert for seven days.
A 23 November Tokyo Kyodo broadcast (in English) reported "Indonesia's team for disaster safety in Yogjakarta said ash rain has reached Temanggung, ~45 km NW of Merapi." A UPI news report stated that, on the morning of 23 November, an official of the natural disasters office in Sleman said that 118 people were in three hospitals suffering from serious burns. The report further stated that "hundreds of homes have collapsed and thousands of cattle were buried by ash." On 26 November UPI reported that >4,700 people remained in evacuation centers.
According to press accounts and other information collected by the U.S. Embassy and issued on 23 and 25 November, most of the casualties occurred when superheated gases swept through two small villages (Desa Purwobinangun and Desa Hargobinangun in the Sleman district). The eruption ignited ~500 hectares of rainforest near Kaliurang, which press reports said had been damaged by ashfall. Embassy reports on 25 November stated that an estimated 34-200 people were still missing (there had been no communication with some affected villages on the slopes of the volcano). Well over 500 injured persons had been treated at local hospitals. The 25 November Embassy report said that "Local authorities are now concerned about an accumulation of volcanic material [on Merapi's flanks]. It is feared that the approaching rainy season could dislodge this material (estimated in the range of 11 million m3) causing dangerous [mudflows] in the villages below. City officials in Yogyakarta . . . are reported to be constructing a third catchment dam to regulate volcanic material entering the Code river, which runs through the city."
A 23 November Reuters press report stated that "The official Antara news agency said that despite warnings, local people were reluctant to leave the area, regarding the volcano as sacred and likely to offer some supernatural signs if it were to cause a major disaster."
Information Contacts: Sukhyar, MVO; SAB; UNDHA; AP; Reuters; UPI; ANS.
Pyroclastic flows continue through 7 December
Collapse of the active summit dome on 22 November sent pyroclastic flows down the SW flank (19:10), overrunning several villages. Although no eruption column was described by VSI observers, aviation warnings on the 22nd stated that ash rose to 10 km; satellite analysis the next day indicated that the plume was a low-level feature well below 6 km. As of 7 December, the UNDHA had confirmed 58 deaths; an Antara news report on 19 December placed the number at 60. Indonesian and Japanese medical teams conducted life-saving plastic surgery on 22 critically injured burn victims.
Continuing small eruptions through 7 December sent pyroclastic flows up to 1.5 km down the Boyong River. An estimated 1 x 10⁶ m3 of pyroclastic sediment has been deposited along the Boyong River, while another 12 x 106 m3 remains on the slopes near the crater. Geochemical analysis in late November indicated increased SO2 emissions of up to 44 t/d.
Most of the >6,000 evacuees were allowed to return home in early December. However, local authorities decided that 2,700 evacuees from five villages within 5 km of the summit in Sleman District (Turgo, Kinahredjo, Kaliadem, Tritis, and Ngandong) would be resettled locally. Although pyroclastic flows had damaged the spring-water source that supplies clean water to the Kaliurang Hill Resort, part of it was reopened on 19 December; the W part was not reopened because it was still considered dangerous.
Residents along the Code River (15,000 people in 11 villages) in Yogyakarta were alerted to the possibility of evacuation, because heavy rainfall in the Boyong River drainage could trigger cold lahars. Existing lahar control works and sabo dams have been constructed on the W side of the volcano in the Magelang District. The Boyong River has only two sabo dams with a capacity of 400,000 m3. The Indonesian government plans to construct three sabo dams of 350,000 m3 capacity each, downstream from the Boyong River.
Information Contacts: UNDHA; Reuters; ANS; BOM Darwin, Australia.
Seismic data associated with the 22 November 1994 dome collapse
Workers at the GMU Geophysical Laboratory and Martin Beisser of GFZ-Potsdam recorded seismic data during the [summit lava dome] collapse from their station at Klathakan, 1.8 km WNW of the summit. Their broad-band seismic instrument showed the associated disturbance beginning on 22 November at 1007 and 32 seconds (radial-component data shown on figure 14). So far as the GMU and GFZ workers know, the wide dynamic range of their broad-band instrument preserved the event with a minimal amount of high-amplitude signal "clipping." Also, in their interpretation, the collapse and seismic disturbance began simultaneously. In other words, the initial displacement at the beginning of the seismic record is thought to correspond to the arrival of signals from the inception of the collapse.
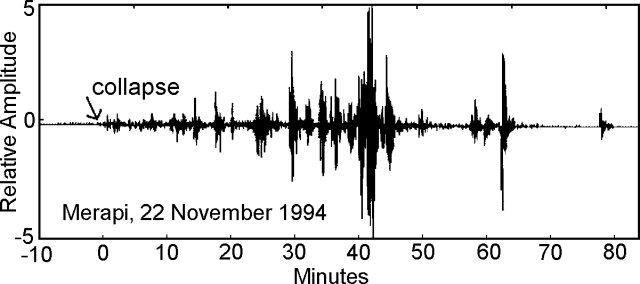 |
Figure 14. Seismic record for the Merapi 22 November 1994 dome collapse. The component shown is horizontal, radial to the edifice; amplitude scale is arbitrary. The data were recorded on a data logger connected to a Streckeisen STS2 seismometer (with a 50 Hz sampling rate, a 8.33 mHz to 50 Hz linear response, and a 32-bit analog-to-digital converter). Courtesy of A. Brodscholl and K. Brotopuspito. |
The collapse-related seismic event lasted for almost an hour (figure 14). The initial signals were set against a moderately quiet background, and maximum amplitude generally increased with time. Highest-amplitude signals were received ~40 minutes after the event began. These largest signals had amplitudes that reached approximately 30 mm/second, whereas at the beginning of the collapse the maximum amplitudes were only ~0.05 mm/second. Thus, on the seismic records, amplitudes ultimately grew to 600x as large as the initial signals.
The eruption and collapse also appear in a 200-hour time window showing measured seismic amplitude in specified wavelengths (figure 15). The figure was prepared using signal processing techniques, which for the high frequency (0.1-1.0 Hz) data involved significant averaging of the maximum values (to once an hour). These depictions show that one or two noteworthy seismic disturbances took place at ~150 and 180 hours prior to the collapse (cause unknown). Compared to the other seismic disturbances on these records, the collapse and eruption induced larger amplitude and much more sustained signals. The post-collapse signals were also followed by an interval of at least 10 hours of elevated background (most noticeable in the 1-12 Hz range).
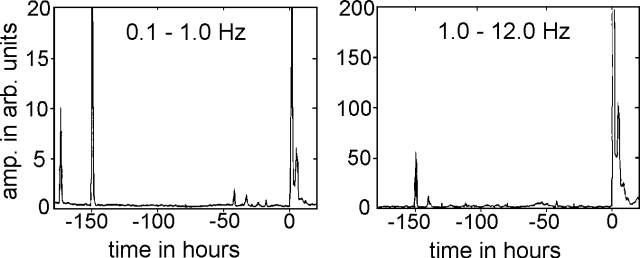 |
Figure 15. Radial component of the Merapi 22 November 1994 dome collapse showing a seismic amplitude (arbitrary scale) versus time for stated wavelength ranges. The inception of the collapse lies at the zero point of the time scale. Courtesy of A. Brodscholl and K. Brotopuspito. |
Using the available data, the investigators failed to find any clearly related premonitory seismic signals for the collapse. Sufficient collateral data (for example, teleseismic and meteorological data) might help constrain detected collapse and eruption earthquakes, or shed light on the cause of the pre-collapse seismic disturbances.
Since our last report (19:12), continued dome building occurred at Merapi. On 5 January another collapse brought 1 x 10⁶ m3 of debris downslope. This collapse produced a small pyroclastic flow on the S slope.
Information Contacts: A. Brodscholl and K. Brotopuspito, GMU; M. Beisser, GFZ-Potsdam, Germany; W. Tjetjep, VSI.
Pyroclastic flows travel down two river drainages
During August-October 1995 pyroclastic flows ("glowing avalanches") continued flowing down the Boyong River; others entered the Krasak River and reached ~1-1.5 km from the source. Seismic activity was dominated by multiphase and lava-avalanche (rockfall) earthquakes. The number of multiphase earthquakes increased in October to 793 events, compared to 186 in September. Earthquakes associated with lava avalanches or rock falls gradually decreased from 1,195 events in August to 806 in September and 605 in October (figure 16). Shallow volcanic (B-type) earthquakes (~1 km depth) were recorded on 25 October and a deep volcanic (A-type) earthquake (2.7 km depth) was detected on 30 October. Observations in October indicated an inflation associated with 40 µrad of tilt. Measurement of SO2 by COSPEC indicated that the emission rate during October fluctuated between 18 and 112 t/d (average 63).
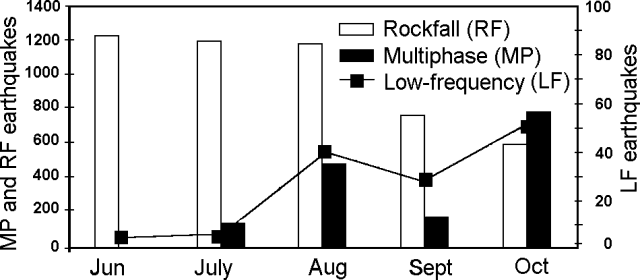 |
Figure 16. Seismicity at Merapi, June-October 1995. Courtesy of VSI. |
Information Contacts: W. Tjetjep, VSI.
Increased seismicity related to lava avalanches and rockfalls
During November-December 1995 glowing avalanches down the Boyong, Krasak, and Bebeng rivers reached up to 2.5 km from the source. Seismic activity was dominated by multiphase earthquakes, low-frequency earthquakes, and lava avalanches (rockfalls). The number of multiphase earthquakes decreased from 924 in November to 152 in December; low-frequency earthquakes also decreased from 74 in November to 42 in December. Seismicity associated with lava avalanches and rock falls increased from 816 events in November to 1,078 in December (figure 17). A deep volcanic earthquake (A- type) and two tremor events were recorded in November, three shallow volcanic earthquakes (B-type) occurred in December.
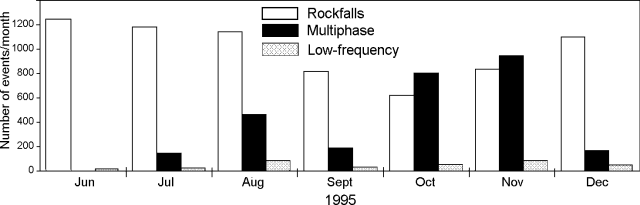 |
Figure 17. Monthly number of rockfall, multiphase, and low-frequency earthquakes at Merapi, June-December 1995. Courtesy of VSI. |
Inflation increased since 17 November from 2.5 to 10.8 µrad/day. Tilt data collected at two stations in the summit area during November and December indicated inflation of 60 and 320 µrad, respectively. The geomagnetic intensity in early December was -14.5 nTs; it then decreased to -1.5 nTs by the end of the month. The emission rate of SO2 during November fluctuated between 27 and 275 t/d, averaging 95 t/d, and the plume velocity was ~3.2-3.5 m/s. In December the emission rate decreased to 70 t/d, fluctuating between 18 and 156 t/d; plume speed was slightly higher at 3.3-3.6 m/s.
Information Contacts: Wimpy S. Tjetjep (Director), Volcanological Survey of Indonesia (VSI), Jalan Diponegoro 57, Bandung, Indonesia; Steve O'Meara, PO Box 218, Volcano, HI 96785, USA .
Increasing eruptive activity prompts preparations for evacuation
A news report in early August noted that emission of thick clouds from the crater had increased significantly. Emitted clouds and "glowing lavas" reportedly blackened the peak of the mountain. Villagers living on the slope of Merapi were apparently told to make preparations for possible evacuation.
On 13 September a pilot report from Qantas Airlines stated that an ash cloud had been observed above Merapi to ~6 km altitude. In a communication with the Darwin Volcanic Ash Advisory Center, the Merapi Volcano Observatory reported no significant change in the eruptive status, consisting of small ash clouds being produced. No plume was evident on satellite imagery.
Information Contacts: Xinhua News Agency, 5 Sharp Street West, Wanchai, Hong Kong; Bureau of Meteorology, Northern Territory Regional Office, P.O. Box 735, Darwin NT 0801, Australia.
Peak in volcanism on 31 October results in over 15 pyroclastic flows
Sometime between 1417 and 1930 on 9 August, a pyroclastic flow traveled 3.5 km from the summit down the SSW flank, reaching the upper parts of the Krasak and Boyong rivers. No casualties were reported, and neither A- nor B-type volcanic earthquakes were recorded.
During September white plumes rose above the summit solfarata field. From the second week of September, multiphase volcanic earthquakes, which are dominant at Merapi, rose sharply to 1,398 events/day. This seismic increase accompanied growth of the lava dome. After the 9 August pyroclastic flow, the volume of the remaining lava dome was ~100,000 m3. The dome volume was estimated at 4.5 x 10⁵ and 7.5 x 10⁵ m3 on 24 September and 11 October, respectively, based on Celestron photographs. The growth rate of the lava dome was estimated at 17,050 m3/day on 11 October, much higher than usual (3,000-5,000 m3/day).
Multiphase earthquakes again increased with 3,804 events registered on 24 October. These earthquakes showed harmonic patterns, which had never been recorded before at Merapi. At 1533 on 24 October, four pyroclastic flows descended toward the upper reaches of the Krasak and Boyong rivers, and traveled a maximum of 2.5 km from the summit. No casualties were reported.
Between 0000 and 1800 on 27 October, multiphase earthquakes suddenly decreased with only 32 events recorded. However, multiphase earthquakes increased again on 30 October with 693 events during a period of six hours. From Celestron photographs on 29 October, it was estimated that the lava dome was 11 x 105 m3 in volume with a daily growth of 17,500 m3. The height of the dome also increased from 42 to 48 m during 11-29 October. At 1813 on 28 October, a pyroclastic flow descended into the upper part of the Krasak River, and the next day (0133 and 1633 on 29 October) two more pyroclastic flows followed. At 0714 on 30 October one pyroclastic flow was observed to move down toward the upper part of the Sat River from the 1992 lava dome. The tiltmeter at Station 2 indicated increasing deformation (>310 µrad) from 9 August to late October, consistent with increasing seismic and eruptive activity.
Volcanic activity reached a peak on 31 October. At 1544 a series of pyroclastic flows began to be observed. They traveled from the summit to the upper reaches of the Bebeng, Krasak, Boyong, and Kuning rivers. From 1544 to 1650, seventeen pyroclastic flows were recorded. The biggest ones occurred at 1637 and 1640, respectively, with a maximum runout of 3 km. Between 1718 and 2117, dense clouds hampered direct observations, but seismic information indicated nine small pyroclastic flows. During 2125-2155 thin ashfall (0.5 mm in thickness) was reported at Babadan Observatory (4 km W of Merapi). From 2130 to 2352 seven pyroclastic flows descended into the Krasak, Bebeng, and Boyong rivers, with a maximum runout of 3 km.
Pyroclastic flows decreased the next day (1 November) and ceased on 2 November. Five pyroclastic flows were observed to travel 1 km from the summit between 0000 and 0514 on 1 November. From 2 November, the lava dome showed no signs of significant growth, and the number and released energy of multiphase earthquakes also declined. However, rock-fall avalanches slowly increased.
Information Contacts: Mas Atje Purbawinata, Director, Merapi Volcano Observatory, Jalan Cendana 15, Yogyakarta 55166, Indonesia; Wimpy S. Tjetjep, Director, Volcanological Survey of Indonesia, Jalan Diponegoro 57, Bandung 40122, Indonesia.
Pyroclastic flows and vigorous plumes noted in first half of 1997
The Societe Volcanologique de Geneve (SVG) reported that on 11 January a member of the Volcanological Survey of Indonesia (VSI) noticed the emplacement of ~ 400,000 m3 of material on the dome. On 14 January, at 0930 the first of many pyroclastic flows was observed. During the following 10 hours 81 pyroclastic flows ran down the flanks, reaching as far as 4 km. Tremors and volcano-tectonic earthquakes were recorded. On 17 January a strong explosion threw a 4,000-m-high column above the crater and another pyroclastic flow raced down the slopes at 1040.
The National Coordinating Board for Disaster Management (BAKORNAS PB) of the Indonesian Government later announced that an eruption took place at 1035 on 17 January. Heavy rains on 17 and 18 January in surrounding areas could have caused mudflows. Reuters reported that about 5,000 people living near Merapi were evacuated from their villages after the volcano started spewing burning ash and hot lava. By 18 January the volcanic activity started decreasing. On 24 January the volcano began spewing hot clouds again; many of the evacuees returned home despite the warnings. According to local newspapers, six people were missing, several were injured, and many had been blinded by the heat clouds, but none were dead. Damage included hundreds of hectares of crops burned.
SVG also reported that a new crater had formed within the 1992 lavas and the early- 1997 lavas. A new dome was growing inside this crater; its volume was estimated to be 160,000 m3. On 22 March and 29 June 1997 Qantas flights over Merapi reported ash at ~ 6.1 and 10 km altitude, respectively. In both cases, however, satellite imagery failed to confirm the plumes because of high clouds.
From 12 to 15 April a field party from the European Volcanological Society (SVE) observed the volcano, from Kaliungarang village, ~6 km from the dome; later they moved to closer positions. They reported pyroclastic flows and rockfalls with frequencies of 5-10 events/hour; the longest runout distances were 2 km from the summit. Of these rockfalls, only a few were made of incandescent materials, indicating that the others involved remobilized older material. A plume was almost always present at the summit.
Information Contacts: M. Vigny and P. Vetsch, Societe de Volcanologie Geneve (SVG), B.P. 298, CH-1225, Chenebourg, Switzerland; Reuters; Department of Humanitarian Affairs, United Nations, Palais de Nations 1211 Geneva, Switzerland; Henry Gaudru and Patrick Barons, European Volcanological Society (SVE), C.P. 1, 1211 Geneva 17, Switzerland; Bureau of Meteorology, Northern Territory Regional Office, P.O. Box 735, Darwin NT 0801, Australia.
Intermediate hazard status posted during September 1997
The following summary from the Merapi Volcano Observatory (MVO) describes the situation in September 1997. The alert status was "Waspada Merapi," the second of four progressive stages of alert, for all of September.
Visual accounts of activity were made from five observation posts surrounding Merapi, usually in the morning. A thin, white plume rising under low pressure was seen consistently. The plume rose 400 m above the summit in the first part of the month but attained heights of up to 1,000 m later in September. Low- and moderate- energy rockfalls containing glowing material occurred on the SW flanks, in the Sat, Krasak, Bebeng, Boyong, and Senowo river valleys, running to a maximum of 2.5 km from the summit. A persistent red glow was observed at the dome. No pyroclastic flows were reported in September.
Seismicity decreased in frequency in early September compared to August (table 8). Shallow earthquakes, such as multi-phase and rockfall types were most common. Data from tiltmeters indicated inflation in most areas in the first week of September. No significant changes were seen later in the month. Photographic evidence suggested no major change in the dome volume.
Table 8. Earthquake activity at Merapi during 11 August-21 September 1997. Courtesy MVO.
| Dates | Low-frequency | Multiphase | Rockfall | Tectonic |
| 11-17 Aug 1997 | 4 | 132 | 289 | 26 |
| 18-24 Aug 1997 | 1 | 136 | 330 | 3 |
| 25-31 Aug 1997 | 1 | 112 | 295 | 4 |
| 01-07 Sep 1997 | -- | 102 | 262 | 4 |
| 15-21 Sep 1997 | -- | 67 | 298 | 2 |
On 9 January 1998 the Associated Press reported a warning of potentially dangerous eruptive activity at Merapi. The warning followed observation of a significant amount of fresh lava at the summit. Local experts warned nearby residents to prepare for quick evacuation to avoid the effects of nuées ardentes and of the danger of debris slides following heavy rain.
Information Contacts: Mas Atje Purbawinata, Director, Merapi Volcano Observatory, Jalan Cendana 15, Yogyakarta 55166, Indonesia (URL: http://www.vsi.esdm.go.id/).
Increasing activity culminates in mid-July pyroclastic flows
Seismic activity and avalanches increased significantly at Merapi beginning in June, and reached a climax in mid-July. According to Xinhua News Agency reports, pyroclastic flows and ashfall near populated areas caused concern among Volcanological Survey of Indonesia (VSI) scientists and civil authorities; evacuations were considered. VSI ranks alert status as follows, in increasing level of concern: Normal, Waspada, Siap, and Awas.
Increasing eruptive activity during the last week of June prompted officials to increase the alert level to Waspada on 2 July. As activity progressed to more dangerous levels, the alert status increased to Siaga at 0500 on 8 July, eventually reaching Awas at 0438 on 11 July, before returning to Siaga at 1200 on 12 July. A solfatara plume was observed during late June and early July; gases escaped with varying pressure to form a thin (or sometimes thick) white cloud attaining maximum heights of 1,400 m above the summit in the first week of July, and 2,000 m by 11 July. Avalanches extending as long as 1.5 km coursed through the upper portions of the Senowo river, and others were seen in the Lamat, Krasak/Bebeng and Boyong rivers (figure 18). Glowing at the summit resumed in late June. During the reporting interval seismic activity showed a significant increase; specifically, the number of shallow volcanic (B-type), multi-phase (MP), low-frequency (LF), and rockfall events increased sharply (table 9).
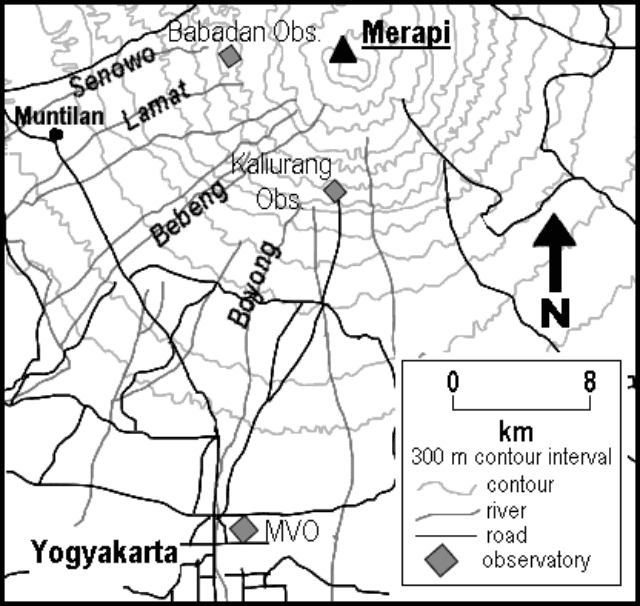 |
Figure 18. Contour map of Merapi's southern segment indicating locations referred to in the text. Courtesy of Merapi Volcano Observatory. |
Table 9. The number of daily seismic events of various types at Merapi as recorded from mid-June to mid-July 1998. Data courtesy of VSI's Merapi Volcano Observatory.
| Dates | B-type | Low-frequency | Multiphase | Rockfalls | Tremor | Tectonic |
| 15 Jun-21 Jun 1998 | 4 | -- | 33 | 5 | -- | 4 |
| 22 Jun-28 Jun 1998 | 3 | -- | 45 | 15 | -- | 3 |
| 29 Jun-06 Jul 1998 | 47 | 3 | 925 | 142 | -- | 5 |
| 07 Jul-12 Jul 1998 | 21 | 1 | 2029 | 613 | -- | 2 |
| 17 Jul-21 Jul 1998 | 19 | 2 | 605 | 860 | 2 | 1 |
The amount of measured deformation also increased (although the summit tiltmeter station was rendered inoperative after 8 July). Explosions on 11 July could be heard as far away as 20 km S in the city of Yogyakarta. VSI noted, "lava was seen ejecting from the crater." In addition, and presumably with undue exaggeration, Xinhua news reporters claimed that some areas near the volcano were under 1.5 m of ash that blanketed crops and plantations.
On 19 July, Babadan Observatory located 4 km W of the summit reported three 'guguran' (pyroclastic flows resulting from dome collapse in the crater). These occurred between midnight and 0600, some reaching as far as 2,500 m down the Lamat River. VSI also noted a "thick white solfataric ash plume"; it stood 50 m in height and was observed from Kaliurang beginning at 0545. Pyroclastic flows during the remaining morning ran 5,000 m down the Lamat River valley, and an eruptive column rose up to 4,500 m above the summit. Between 0600 and 1313, seismic stations recorded 347 multiphase (MP) events. Tremor occurred between 1325 and 1503 and was accompanied by five pyroclastic flows that reached 2,000-5,000 m from the summit. At 1330 VSI ordered workers on the W sector of the volcano to leave the area. At 1501 Merapi erupted violently; several pyroclastic flows traveled 5,500 m down Lamat River and an eruptive column rose up to 6,000 m above the summit by 1507. At about 1615 ash showered the W side of the volcano, accumulating up to 2 mm in Muntilan. Ash also fell in Purworejo (42 km W of Yogyakarta) and Temanggung (35 km NW of the crater). Shallow volcanic earthquakes at 1625 were followed by small tremor. As many as 25 pyroclastic flows continued until 1800, some causing ash showers in nearby villages. There were B-type events (16), MP events ( 399 ), pyroclastic flows (119), and some glowing rockfalls throughout the afternoon.
Activity had subsided by 21 June, although fog obscured the summit area. Thick white ash rose to 460 m. Glowing rockfalls sometimes ran 1,250 m down the Lamat River valley.
This hazardous stratovolcano is located 70 km SE of Dieng and immediately N of Yogyakarta, a city of half a million people. In 32 of its 67 historical eruptions, nuées ardentes took place-more than known at any other volcano in the world-and 11 of them have caused fatalities. The volcano is carefully watched by several VSI observatories and heavily monitored instrumentally.
Information Contacts: Mas Atje Purbawinata, Director, Merapi Volcano Observatory, Volcanological Survey of Indonesia, Jalan Cendana 15 Yogyakarta 55166 (URL: http://www.vsi.esdm.go.id/); Xinhua News Agency, 5 Sharp Street West, Wanchai, Hong Kong.
Details of July eruptions, new monitoring equipment
The relative calm in seismic, gas, and rockfall activity at Merapi ended in late June (BGVN 23:07). Activity since November 1994 had been concentrated on the S of the volcano, but activity in July occurred mainly on the W slopes. Further details of the July eruptions are reported below, followed by an account of new monitoring equipment.
Changes in the measured tilt began in early June on the W flank, forecasting an increase in activity. Tilt increased at the end of June and an extension of 1 m was detected by electronic distance measurement during the first week of July. Also, the tilt measured by station ST3, located at the crater rim near the active dome, showed strong inflation at extraordinarily high rates of up to 200 µrad/hour. This high tilt rate was likely influenced by heat radiated from the new dome; an accurate estimate of tilt with this effect removed remains problematic. After the nuée ardente of 8 July, no further signals from ST3 were recorded and an early August field trip failed to find any remnants of the station.
Increases in accumulated seismic energy indicated an approaching change in the eruption regime. Soon after a small explosion on 30 June a plume emerged from the summit and a glowing avalanche rushed down the W slope. The explosion opened at least one hole on the W slope close to the summit. New lava was squeezed out of the opening "like toothpaste" without friction or pressure; the volcano seemed to be partially open. During the next week, avalanches connected to new dome building were observed from Babadan on the W slope. Based on observation of these avalanches, the nuée ardente on 8 July was expected. The daily number of rockfalls increased strongly from a few, to dozens, and then to more than 100; some rockfalls were glowing.
Seismicity (especially multi-phase events) strongly increased in early July (figure 19) before peaking on 11 July when 37 nuées ardentes occurred between midnight and 0500. The most powerful eruption that day happened at 0445; volcanic material flowed 4 km from the summit. The plume reached a height of ~4 km and ash was distributed 15-20 km away. During 11-19 July, 128 nuées ardentes were seen, including a final strong pyroclastic ash-and-block flow at 1500 on 19 July. Seismic activity, except the number of rock falls, decreased after 19 July. Four episodes of volcanic tremor were recorded in July (usually during vigorous eruptive activity), indicating magma movement. The dome grew briskly without special seismic activity, although much of the new lava collapsed, causing hundreds of daily avalanches. Many local residents watched huge glowing rockfalls at night on the W slope.
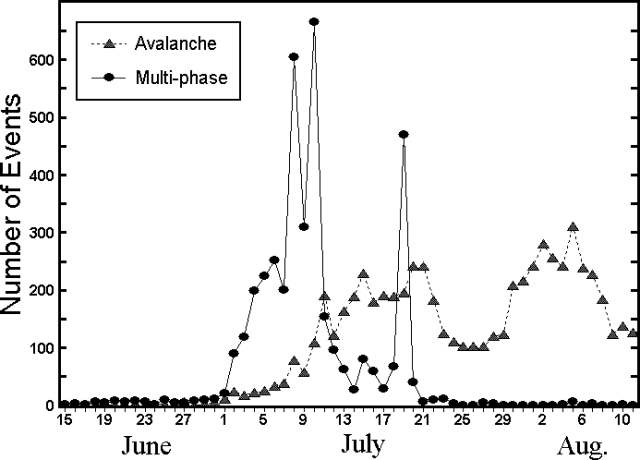 |
Figure 19. A graph of rockfall (avalanche) and multi-phase seismicity recorded at Merapi during 15 June-12 August 1998. Data courtesy of MVO. |
Explosion sounds were heard only close to the dome (for example, in Klatakan but not in Babadan). On 30 June a seismologist working on the W slope in Klatakan on an active seismic experiment heard a sharp noise at about 1130 that preceded both a plume and pyroclastic flows.
Some W-side stations were covered with more than 2.5 cm of ash. Pyroclastic-flow deposits filled parts of a valley on the W slope, almost reaching the town of Jerung Jeru, 7 km from the summit. The total amount of material erupted during July was estimated to be 8.8 x 10⁶ m3. The huge amount of ash released during July suggested an explosive process rather than gravity collapse, as happened in November 1994 when far less ash was emitted.
New seismic warning installations. German scientists Joachim Wassermann and Juergen Gossler installed an infrasonic network at Babadan on the W slope. Three clusters, each with four microphones installed in tubes directed at the summit, collect infrasonic noise.
Infrasonic noise was recorded beginning three days before the events of 19 July. The data showed a good correlation between seismicity and infrasonic signals during avalanche and lahar activity. A signal recorded before the main pyroclastic flow could have been a precursory event. A volcanic explosion was recorded before 19 July by a member of the active seismic experiment group during fieldwork at Klatakan. No event was heard in Babadan at that time, but the subsequent avalanche was recorded. A few explosions may have occurred earlier in the month, but no acoustic signals were detected, probably because Babadan is too far from the source.
A broad-band seismic station was installed on Pasar Bubar, on a plateau just below the summit, to complement the three stations on the slopes of Merapi. A program is under development that would select different signals automatically and thus enable a "quasi-online calculation" for the hypocenters and epicenters of volcanic events. Infrasonic data together with seismic data could be sent to the Volcano Technical Research Center (Balai Penyelidikan dan Pengembangan Teknologi Kegunungapian, "BPPTK") of VSI to improve the early warning system. Combined data from the same site would help in locating volcanic events and could provide information about source mechanics.
Information Contacts: Volcanological Survey of Indonesia (VSI), Bandung, Indonesia (URL: http://www.vsi.esdm.go.id/); Mas Atje Purbowinata, Merapi Volcano Observatory, Jalan Cendana 15 Yogyakarta 55166, Indonesia (URL: http://www.vsi.esdm.go.id/); A. Brodscholl, BPPTK, Volcanological Survey of Indonesia, Bandung, Indonesia; J. Gossler, GeoForschungs Zentrum (GFZ), Potsdam, Germany; J. Wassermann, University of Potsdam, Potsdam, Germany.
Frequent lahars, lava avalanches, and pyroclastic flows during March-May
Merapi remained active throughout the reporting period of 9 March through 24 May. Although no deaths were reported, the volcano continually threatened surrounding populated areas with lahars, lava avalanches, and pyroclastic flows. Throughout the period, Merapi exhibited weakly pressured, thick, white, sulfur-tinted ash plumes extending 100-700 m above the summit.
During the week of 9-15 March a vigorous "white ash plume" was observed, weakly pressured, with 550 m maximum height above the summit. Observers additionally identified lava glowing along the SW flank, in the direction of the Blongkeng, Lamat, and Sat drainages (the maximum run-out distance was 0.8 km). On 11 March a small pyroclastic flow was noted traveling SW with 0.8 km of run-out distance. During this week multiphase events dominated seismic activity, presumably resulting from the emission of lava and glowing debris. A small lahar traveled down the Sat drainage on 13 March.
During 16-22 March, ash emissions and lava avalanches continued. Avalanches again traveled SW, with maximum run-out distances of 0.4 km. Glow at the lava dome was weak. Surface shocks (assumed to be from lava avalanches) dominated seismicity. From 23 to 29 March the lava avalanches continued in the direction of the SW-flank rivers with 1.8 km maximum run-out distances. These drainages glowed at night. On 24 March a small pyroclastic flow started at the edge of the lava dome, moved in the direction of the Sat River, and attained a 0.6 km run-out distance; no glow was observed at the dome. Seismicity was dominated by surface events mostly interpreted as lava avalanches.
During the week of 27 April to 3 May, sulfur-tinted ash plumes reached their highest point during the recording period, 700 m above the summit. Lava avalanches continued in the direction of Blongkeng, Sat, and Lamat with 0.9 km run-out distances; again night glow was observed in these drainages. In contrast, the body of the lava dome lacked glowing areas. A small pyroclastic flow from the edge of the 1998 lava moved downslope SW for a distance of 1.3 km. Surface events continued to dominate seismicity. A small lahar buried two trucks and a digging machine at Putih on 1 May; no injuries were reported.
Lava avalanches during 4-17 May continued towards the SW-flank drainages with 1-km maximum distances each week. There was a weak glow on the lava dome during the first week and none the second. There was one small pyroclastic flow each week from the edge of the 1998 lava, which again moved SW out to 1 km distance. From 18 to 24 May lava avalanches had 1.8 km run-out distances. Glow within cracks on the lava dome was weak. Seismicity during May continued to be dominated by multiphase shocks and surface events identified as lava avalanches.
Information Contacts: Volcanological Survey of Indonesia (VSI), Jalan Diponegoro No. 57, Bandung 40122, Indonesia (URL: http://www.vsi.esdm.go.id/).
Consistent gas plume; lava avalanches and landslide; new lava dome and fractures
During June 1999-July 2000, Merapi consistently emitted a low-density, sulfur-rich, light-colored gas plume that ranged from 150 to 1,500 m above the summit. Frequent lava avalanches toward the nearby Blongkeng, Lamat, Sat, and Senowo River drainages reached maximum distances of 2 km. Lava avalanches glowed at night, although no incandescence could be observed inside the summit's lava dome. Tiltmeters lacked significant deformational changes, although a summit visit on 13 May 2000 revealed that the 1998 lava dome was growing. Lava avalanches and multi-phase earthquakes dominated seismicity. No lahars were observed during the period.
At the end of July 2000 low-intensity glow from the lava dome was observed. Seismicity increased in the first week of August with a few deep (A-type) and shallow (B-type) earthquakes. Emissions remained similar in consistency to those of the previous months, and rose 160 m above the summit. The hazard level was raised from 1 to 2 (on a 1-4 scale). The following week seismicity continued to increase, exemplified by a M 2.8 B-type event. Gas emissions rose up to 385 m above the summit. During the third week of August, volcanic and seismic activity continued to increase with gas emissions rising 460 m and greater numbers of A- and B-type earthquakes. Surficial events still dominated the overall seismicity. Plumes rose up to 700 m in the final week of August.
Activity remained similar to the previous weeks during September-October. Emissions continued to rise from 250 to 650 m high. The volume of emitted material was estimated to be 169 tons/day at the end of September. Seismicity changed little until late October, when volcanic tremor was recorded.
On 31 October a team from the Merapi Volcano Observatory (MVO) performed summit observations. The team noted that lava avalanches from the 1957 dome had filled the upper stream beds of the Senowo and Trising Rivers. The active 1998 lava dome was lifted on its W side and split in half. A newly formed dome between the two older sides had an elongated E-W-trending shape. Concentric and radial fractures were observed on the N and SW portions of the summit crater, and some fractures showed significant dilation. Radial fractures N of the summit crater and on the floor of Puncak Garuda appeared to have been sutured and then redeveloped to form a normal fault with a total offset of 30 cm. A fracture located between the 1957 and 1948 domes opened 20.5 cm during 14 May-1 November 2000.
High rainfall during the second week in November caused a landslide at the source of the Boyong River near Kaliurang, causing one death. At the end of November, Merapi still emitted a gaseous plume from its summit. Seismographs continued to register A- and B-type earthquakes, although multi-phase earthquakes dominated the record. The volcano remained at Hazard Level 2.
Information Contacts: Dali Ahmad, Volcanological Survey of Indonesia (VSI), Jalan Diponegoro No. 57, Bandung 40122, Indonesia (URL: http://www.vsi.esdm.go.id/).
Dome failure and growth during January 2001; over 30 pyroclastic flows
Eruptive activity increased markedly at Merapi during the period of 26 December 2000-22 January 2001. Instrumental monitoring first recorded a significant increase in seismicity, expressed in both shallow and deep volcanic earthquakes, during 26 December-1 January. Visual observations were hindered during this time because of hazy conditions, and VSI maintained a hazard status of 2 (on a scale of 1-4) for Merapi.
Activity continued to increase during 2-8 January. Atmospheric conditions were clearer, allowing observation of a 1,500-m-high plume above the summit. Lava avalanches flowed ~1 km from the summit down to the Sat River. Seismicity remained high, again with a significant number of shallow and deep volcanic earthquakes, and was dominated by multi-phase and avalanche earthquakes.
During 9-15 January, activity again increased with respect to the previous week. Accordingly, VSI elevated Merapi's hazard status to 3. Observers noted a light-colored, variable-density, low-pressure ash plume that rose 500 m above the summit. Glowing lava avalanches flowed into the headwaters of the Lamat, Sat, and Senowo Rivers, up to 2 km from the summit. On 14 January, 29 pyroclastic flows traveled down the volcano's flanks into the three above-mentioned rivers and reached up to 4 km from their source. During the week, lava avalanches and pyroclastic flows occurred with an average interval of 0.5-1 hours.
Visual observations from several post observatories during 16-22 January revealed ash eruptions, glowing lava flows and avalanches, and pyroclastic flows. Merapi ejected a dense, light-colored ash plume under medium to high pressure. Ash rose 850-1,300 m above the summit, with an estimated emission volume of 95 metric tons/day. Ashfall occurred on the surrounding areas of Babadan, Kaliurang, and Ngepos. Glowing lava avalanches, with more than 150 occurring per day, reached as far as 3.5 km from the summit into the Bebeng, Sat, and Senowo Rivers. Observers suggested more than one source vent for these flows. More than 20 pyroclastic flows occurred daily during the week, sending ash and gas a maximum of 3 km down the Bebeng River, 4.5 km down the Sat River, and an unreported distance down the Senowo River.
The Darwin VAAC issued an ash advisory on 19 January to advise pilots of ash emanating from Merapi. The advisory reported an ash plume up to an altitude of ~3,400 m. Prevailing winds were projected to carry ash to the E or SE; cloud cover prevented any further descriptions.
A new lava dome, termed "2001," grew on top of the 1998 dome that had collapsed around 16 January. Growth appeared continuous with the glowing dome visible at night. Researchers speculated that the failure of the 1998 dome and the instability of the new dome accounted for the high frequency and volume of pyroclastic flows.
Information Contacts: Dali Ahmad, Volcanological Survey of Indonesia (VSI), Jalan Diponegoro No. 57, Bandung 40122, Indonesia (URL: http://www.vsi.esdm.go.id/); Darwin Volcanic Ash Advisory Centre (VAAC), Bureau of Meteorology, Northern Territory Regional Office, PO Box 40050, Casuarina, NT 0811, Australia (URL: http://www.bom.gov.au/info/vaac/).
Failure of 1998 lava dome on 10 February causes major eruption
Renewed unrest began on the night of 27 January with continuous pyroclastic flows and hot lava avalanches, which lasted up to two hours. Since mid-January a Level 3 hazard status has remained in effect for the volcano. The Volcanological Society of Indonesia (VSI) reported that on 28 January 2001 Merapi's "2001" lava dome (BGVN 25:12) partially collapsed resulting in pyroclastic flows and hot lava avalanches with recurrence intervals of ~2-5 minutes. Pyroclastic material flowed down to the Sat, Bebeng, and Senowo Rivers, to the SW, SW, and W of Merapi, respectively. Their maximum runout distance occurred in the Sat River drainage, where flows reached ~4.5 km from the source. A plume, thick with sulfurous ash, rose 2 km above the summit. The eruption generated ashfalls within a radius of 15-20 km; ash fell on the Dukun, Srumbung, Salam, Ngluwar, and Muntilan Districts surrounding Merapi.
VSI geophysicist Ratdomopurbo reported that the unstable lava dome was actively growing taller and larger; continued magma chamber injection had caused the pyroclastic flows and lava avalanches at the surface. Magma migration was indicated by increased deep volcanic (A-type) and shallow volcanic (B-type) earthquakes since August 2000. On 31 January pyroclastic flows occurred continuously, reaching up to ~3.5 km from the summit and flowing mainly into the Sat River, but also into the Senowo and Bebeng Rivers. At Babadan Observatory, located 4 km from the summit, a seismograph recorded earthquakes related to pyroclastic flows that exceeded the instrument's scale for up to 60 seconds during the interval of 1601-1822. Ashfall continued within 15 km of Merapi. A recent photograph showed a new active vent on Merapi's summit. VSI scientists engaged in Merapi research remained uncertain whether the vent in the photo had only emitted gases or had also emitted lava and tephra.
Pyroclastic flows and lava avalanches continued through 5 February (figures 20 and 21). Approximately 25 pyroclastic flows occurred daily and moved down the flanks to the Sat, Bebeng, and Senowo Rivers with a maximum runout distance of 4.5 km. Lava avalanches flowed down to the Lamat River, W of the volcano, in addition to the three above-mentioned rivers; lava avalanches reached a distance of 3.5 km from Merapi's summit, falling 1 km short of flows from the previous week. Ashfalls continued, and heavy rain on 3 February caused a minor lahar that initiated at 0430. Summarizing observations, Syamsul Rizal Wittiri stated that Merapi's lava dome continued to grow larger with the addition of ~45,000 cubic meters of material per day; lava dome volume as of 6 February was 1 million cubic meters. On 9 February at 2100 a continuous pyroclastic flow occurred for ~1 hour.
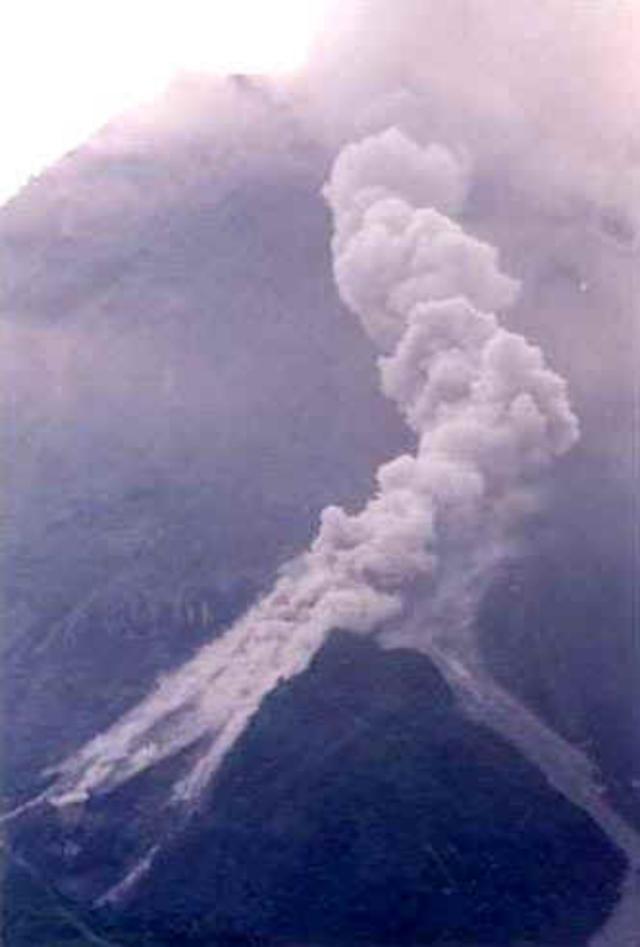 |
Figure 20. A west-flank pyroclastic flow travels down Merapi. Photo taken during the week of 30 January-5 February. Courtesy of VSI. |
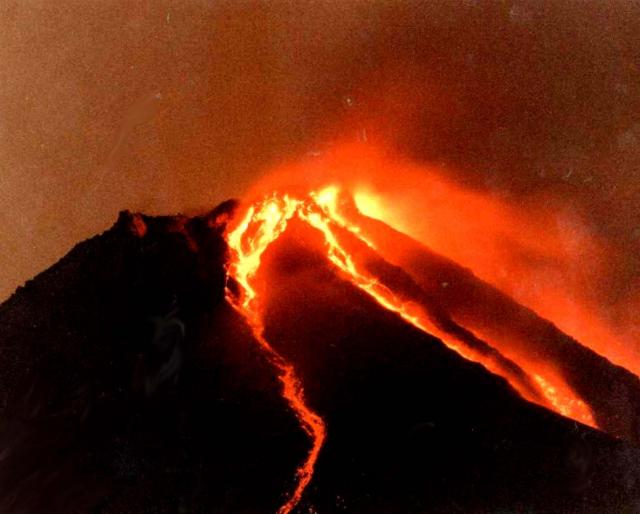 |
Figure 21. Night view of Merapi shows incandescent lava avalanches down several flanks. Photo taken during the week of 30 January-5 February. Courtesy of VSI. |
A major eruptive episode occurred on 10 February (figure 22). At 0200 purported magma migration toward the surface was associated with a medium-sized, 30-minute-long pyroclastic flow. At 0330 failure of the 1998 lava dome sent an ash cloud billowing 5 km above the summit and generated sizable pyroclastic flows that extended up to 7 km from Merapi in the direction of the Sat River and 4.5 km in the direction of the Lamat River. At 0530 Merapi's alert was raised from 3 to 4, the highest level, for the first time since July 1998 (BGVN 23:07). The ash plume from the eruption spread 60 km toward the E over the communities of Klaten, Solo, Sukoharjo, and Boyolali. Ashfall produced an ash layer with a maximum thickness of 1 cm at a 5 km radius from the volcano. Stations recorded high seismicity accompanying the eruption. Instrumentation detected decreasing magnetic intensity near the summit, indicating high heat and magma near the surface.
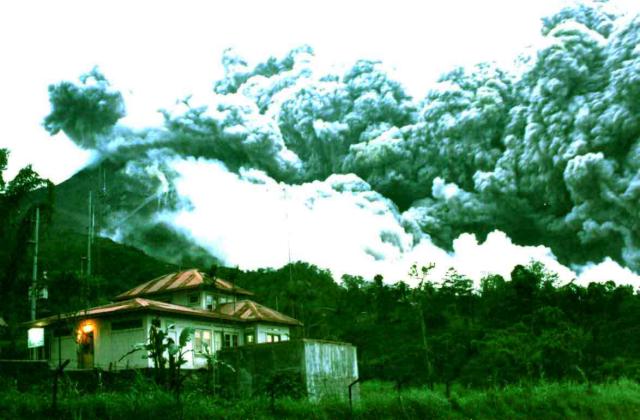 |
Figure 22. A pyroclastic flow on 10 February 2001 sweeping down Merapi's W flanks. Only a small ash cloud rises sub-vertically from the summit. In the left foreground lies the Babadan Observatory Post; it sits on the mid-flanks ~ 7 km W of the summit. Courtesy of VSI. |
Syamsul Rizal Wittiri predicted that Merapi's activity will continue and potentially increase because the 2001 lava dome, which attained a volume of 1.4 million cubic meters, is unstable due to the collapse of the 1998 dome. Merapi's alert level remained at 4 as of 14 February.
Information Contacts: Dali Ahmad, Volcanological Survey of Indonesia (VSI), Jalan Diponegoro No. 57, Bandung 40122, Indonesia (URL: http://www.vsi.esdm.go.id/); Darwin Volcanic Ash Advisory Centre (VAAC), Bureau of Meteorology, Northern Territory Regional Office, PO Box 40050, Casuarina, NT 0811, Australia (URL: http://www.bom.gov.au/info/vaac/).
Volcanism continues at decreased intensity; Alert reduced from 4 to 2
After the large 10 February eruption (see BGVN 26:01), volcanic activity, including lava avalanches and pyroclastic flows, continued but decreased in intensity. Pyroclastic flows entered the Sat, Lamat, Senowo, and Bebeng rivers to a maximum runout distance of 2-3 km. High fumarole temperatures around the summit indicated that magma remained near the surface. The W and S sides of "lava dome 2001" grew and covered "lava dome 1997" to the S. Several fumaroles appeared to mark a fracture in the area of the 10 February eruption. Fractures formed in a similar manner prior to the November 1994 eruption.
The hazard status was at its highest level, 4 (on a scale of 1-4), through the week of 21-27 February 2001. The Alert Level was reduced to 3 the following week, and then to 2 during 7-13 March, where it remained through August.
Over the interval 14 February to 28 August, ash emissions rose up to ~150 m above the summit, and fumaroles emitted gas that rose up to ~950 m above the summit. Superficial earthquakes dominated the seismicity, though over time they continued to decrease in number and amplitude. Observations on 10 and 17 March revealed that high-pressure fumaroles appeared on most of the dome's surface. An observer reported that on 13 April a small amount of ash fell around the Babadan Post Observatory ~7 km W of the volcano. Activity at Merapi increased during 23-29 April, with reports of several medium-sized pyroclastic flows. Table 10 provides a more detailed description of weekly activity at Mt. Merapi from 14 February through 28 August.
Table 10. Summary of activity at Merapi from 14 February through 28 August 2001. Courtesy of VSI.
| Interval | Description of Activity |
| 14 Feb-20 Feb 2001 | Lava and pyroclastic flows continued but decreased in intensity, pyroclastic flows entered the Sat, Lamat, Senowo, and Bebung rivers. Maximum runut 2-3 km. Flows traveled 1.5-2.5 km to the WSW for 1-2 hours. High temperatures around Merapi indicated that magma was near the surface; the W and S sides of "lava dome bgvn_2001" grew and covered "lava dome 1997" to the S; several fumaroles appeared to mark a fracture along where the 10 February eruption occurred. |
| 21 Feb-27 Feb 2001 | Volcanic activity decreased. Daily ash emissions rose to ~150 m above the summit. |
| 07 Mar-13 Mar 2001 | Volcanic activity decreased, 100 avalanches per day. Maximum runout of 2.3-2.5 km SW. On 6 March a pyroclastic flow deposited material up to 1.5 km down the Sat river. |
| 14 Mar-20 Mar 2001 | Volcanic activity continued, hot avalanches continued to enter the Sat, Senowo, Bebeng, and Lamat rivers. Maximum runout of 2.5 km in the Sat river, pyroclastic flows up to 2.75 km down the Sat, Senowo, and Bebeng rivers. Superficial earthquakes dominated the seismicity but decreased. On 19 March high-pressure fumaroles appeared on most of the dome's surface. |
| 21 Mar-27 Mar 2001 | Volcanic activity continued. hot avalanches continued to enter the Sat, Senowo, Bebeng, and Lamat rivers. Maximum runout of 3 km in the Sat river. Pyroclastic flows traveled up to 1 km down the Sat, Senowo, and Bebeng rivers. Superficial earthquakes dominated the seismicity but decreased. On 17 March a summit visit revealed that high-pressure fumaroles remained on most of the dome's surface. |
| 11 Apr-17 Apr 2001 | Volcanic activity continued. Lava avalanches continued to enter upstream areas of the Sat, Senowo, Lamat, and Bebeng rivers. Maximum runout of 2.5 km in the Sat river; an observer reported that 10 pyroclastic flows traveled down the Sat, Senowo, and Bebeng rivers, reaching as far as 2.3 km in the Sat river. Fumaroles emitted steam and gas up to 950 m above the volcano's summit; number and amplitude of earthquakes was high but decreasing, seismic activity was dominated by avalanche earthquakes. |
| 18 Apr-24 Apr 2001 | Lava avalanches continued to fill the upstream areas of the Sat, Senowo, Lamat, and Bebeng rivers. Maximum runout of 2 km in the Sat river; 11 pyroclastic flows entered the Sat and Lamat rivers, reaching as far as 3 km. Avalanche earthquakes dominated the seismicity but their amplitude and frequency decreased; on 13 April a small amount of ash fell around the Babadan Post Observatory ~7 km W of the volcano. |
| 25 Apr-1 May 2001 | Lava avalanches continued to flow down the Sat, Senowo, Lamat, and Bebeng rivers. Maximum runout of 2 km. Fumaroles emitted gas that rose up to 500 m above the summit, seismic activity dominated by earthquakes. |
| 02 May-08 May 2001 | Activity increased, with reports of several medium-sized pyroclastic flows. Four pyroclastic flows were observed traveling into the upper reaches of the Sat, Senowo, Lamat, and Bebeng rivers. Maximum runout of 1.8 km in the Sat river; lava avalanches traveled up to 2.5 km down the Sat river. Superficial earthquakes dominated the seismicity. |
| 11 Jul-17 Jul 2001 | Lava avalanches. Maximum runout of 2.5 km SW. Low-pressure emissions from fumaroles rose 700 m above the volcano. |
| 18 Jul-25 Jul 2001 | 52 lava avalanches. Maximum runout of 2.8 km SW. Emissions from low-pressure fumaroles rose to 755 m above the summit. |
| 22 Aug-28 Aug 2001 | Lava avalanches. Maximum runout of 2.8 km to the SW. Seismic activity dominated by avalanche earthquakes. |
Information Contacts: Dali Ahmad, Volcanological Survey of Indonesia (VSI), Jalan Diponegoro No. 57, Bandung 40122, Indonesia (URL: http://www.vsi.esdm.go.id/); Darwin VAAC, Bureau of Meteorology, Northern Territory Regional Office, PO Box 40050, Casuarina, Northern Territory 0811, Australia; Australian Broadcasting Company; Associated Press; Meteorological and Geophysical Agency of Indonesia (Badan Meteorologi dan Geofisika, BMG), Jalan Angkasa I/2 Kemayoran, Jakarta Pusat 10720, Indonesia (URL: http://www.bmg.go.id/).
Dome collapses and lava avalanches August-November; two unconfirmed deaths
Our last report (BGVN 26:07) covered activity from 14 February through 28 August 2001. The first portion of this report was provided by John Seach, who visited Merapi during 17-20 August 2001. The latter portion came from the Volcanological Survey of Indonesia (VSI); their reports discussed activity during late August through early November 2001.
Unconfirmed reports from volcano guides encountered at Babadan Observatory stated that two tourists were killed by dome collapse phenomena in early August after walking into the S-flank danger zone.
Activity was dominated by regular dome collapse and lava avalanches. On 17 August at 0735 an eruption of Merapi occurred, visible from the city of Yogyakarta. A dark brown plume was observed above the summit followed by a lava avalanche down the S side of the volcano. During the evening of 18 August, glowing avalanches were observed flowing down the SW side of the volcano at regular intervals. Runout distances were ~5 km.
On 19 August, observations were made from a location 220 m below the N-flank summit. Ascent to the summit area above the lava dome was not possible due to the continuing explosions of the dome. During the climb glowing avalanches continued down the SW flank. After dawn a white plume was continuously emitted to 200 m above the lava dome. About every 30 minutes there was an emission of light brown ash, indicating dome collapse. At 0930 burning vegetation was observed on the SW flank at an elevation of 1,400 m, presumably set alight by lava.
That evening, observations were made from Babadan Observatory on the SSW side of the volcano, 4 km from the summit (elevation 1,300 m). Between 2130 and 2330 there were 25 lava dome collapses. Lava was observed to extrude from the dome vertically and then collapse, producing thousands of glowing boulders that rolled 4 km down the flank (figure 23). The larger eruptions were accompanied by rumbling noises and earthquakes.
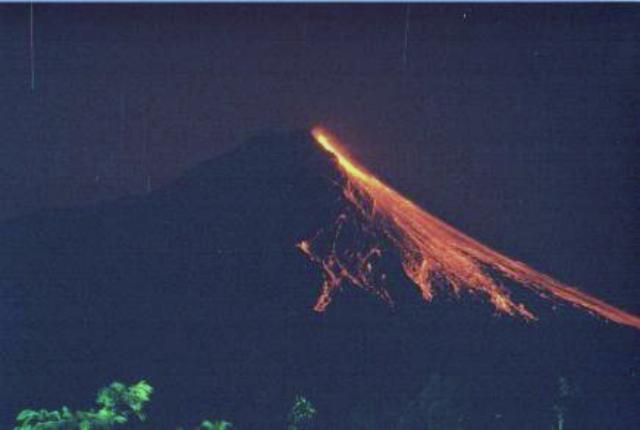 |
Figure 23. A night view of the incandescence seen after lava-dome collapse at Merapi on 19 August 2001. Photo taken from the Babadan Observatory on the SSW side of the volcano 4 km from the summit. Courtesy of John Seach. |
On the morning of 20 August a dense white plume was visible rising 300 m above the summit. Occasional brown emissions rolled down the SW slope indicating continuing dome collapse.
The Volcanological Survey of Indonesia (VSI) reported that during late August through at least 4 November seismic activity at Merapi was dominated by avalanche earthquakes (table 11). During the week of 27 August-2 September, one low-frequency earthquake was registered. Table 11 also summarizes a white, thin, low-pressure fumarolic plume reported at various heights above the volcano throughout the report period. Lava avalanches were ongoing, traveling mainly in the headwaters upstream of the Lamat river, with a maximum runout distance of 2.75 km (see table 11). On 8 October at 1729 a minor pyroclastic flow traveled ~2 km toward the Sat river; on 24 October, four minor pyroclastic flows again traveled 2 km toward the Sat and Senowo rivers. Despite heavy rain at times, no lahars were reported. Merapi remained at Alert Level 2 (on a scale of 1-4) throughout the 27 August-4 November report period. Fumarolic temperatures at the Gendel and Woro craters varied by ten's of degrees Celsius during 27 August through 4 November (table 12).
Table 11. A summary describing Merapi's volcanic seismicity, typical plumes, and lava avalanches during 27 August-4 November 2001. Courtesy of VSI.
| Date | Avalanche Earthquakes | Multiphase Earthquakes | Plume height above summit | Details of lava avalanches |
| 27 Aug-02 Sep 2001 | 588 | 10 | 50 m | Flowed down Senowo, Sat, Lamat, and Bebeng rivers with a maximum distance of 2.5 km towards the Sat and Lamat. |
| 03 Sep-09 Sep 2001 | 652 | 11 | 300 m | Ongoing, observed 36 times, dominantly traveled upstream of Sat and Lamat rivers, partly filling Senowo and Bebeng rivers. |
| 10 Sep-16 Sep 2001 | 588 | 2 | 450 m | Ongoing, dominantly traveled upstream of Lamat and Senowo rivers, reaching as far as 2.5 km away. |
| 17 Sep-23 Sep 2001 | 684 | 1 | 750 m | Ongoing, observed 51 times, dominantly upstream of Sat river but lesser parts traveled to Lamat, Senowo, and Bebeng rivers (maximum distance of 2.5 km). |
| 24 Sep-30 Sep 2001 | 756 | 3 | 350 m | Ongoing, traveled down to Sat, Lamat, and Senowo rivers (maximum distance of 2.5 km). |
| 01 Oct-07 Oct 2001 | 702 | 8 | 425 m | Ongoing, observed 59 times, dominantly to the upstream of Sat river, with a lesser part flowing down to Lamat and Senowo rivers (maximum distance of 2.5 km). |
| 08 Oct-14 Oct 2001 | 692 | 5 | 170 m | Ongoing, observed 53 times, dominantly to the upstream of Sat river, partly to Lamat and Senowo rivers (maximum distance of 2 km). |
| 15 Oct-21 Oct 2001 | 800 | 7 | 575 m | Ongoing, observed 103 times, dominantly towards the upstream of Sat river, and partly to the Lamat and Senowo rivers (maximum distance of 2.75 km). |
| 22 Oct-28 Oct 2001 | 790 | -- | 750 m | Ongoing, observed 121 times, dominantly towards the upstream of Sat river, and partly to the upstream of Lamat and Senowo rivers (maximum distance of 2.75 km). |
| 29 Oct-04 Nov 2001 | 786 | -- | 480 m | Ongoing, observed 124 times, dominantly towards the upstream of Sat river and partly to the upstream of Lamat and Senowo rivers (maximum distance of ~2.8 km). |
Table 12. Temperatures reported at Gendel and Woro craters of Merapi during 27 August through 28 October. No data collected during 1-14 October. Courtesy of VSI.
| Date | Gendol crater | Woro crater |
| 03-09 Sep 2001 | 590-595°C | 461-465°C |
| 10-16 Sep 2001 | 589-606°C | -- |
| 17-23 Sep 2001 | 602-617°C | -- |
| 24-30 Sep 2001 | 598-618°C | -- |
| 15-21 Oct 2001 | 566-571°C | 612°C |
| 22-28 Oct 2001 | 561-575°C | -- |
Information Contacts: John Seach, PO Box 16, Chatsworth Island, NSW, 2469, Australia (URL: http://www.volcanolive.com/); Dali Ahmad, Volcanological Survey of Indonesia (VSI), Jalan Diponegoro No.57, Bandung 40122, Indonesia (URL: http://www.vsi.esdm.go.id/).
Heightened lava dome activity from August 2001 through at least February 2002
During November 2001 through at least February 2002, seismic activity at Merapi was dominated by avalanche earthquakes. Generally white, thin, low-pressure plumes rose as high as 1.3 km above the summit. COSPEC-measured SO2 emission rates ranged from 66 to 225 ton/day (table 13).
Table 13. Seismicity, plume heights (in meters above the summit), and average SO2 fluxes at Merapi during 29 October 2001 through 24 February 2002. Courtesy VSI.
| Date | Avalanche signals | Tectonic earthquakes | Multiphase earthquakes | Plume height (above summit) | Average SO2 flux (tons/day) |
| 29 Oct-04 Nov 2001 | 786 | 1 | -- | 480 | 78-121 |
| 05 Nov-11 Nov 2001 | 823 | -- | -- | 520 | -- |
| 12 Nov-18 Nov 2001 | 783 | 1 | 4 | 520 | 67-143 |
| 19 Nov-25 Nov 2001 | 737 | 1 | 3 | 625 | 66-98 |
| 26 Nov-02 Dec 2001 | 865 | 1 | 5 | 60 | -- |
| 03 Dec-09 Dec 2001 | -- | -- | -- | 779 | -- |
| 17 Dec-30 Dec 2001 | 1568 | 1 | 1 | 1100 | 66-118 |
| 30 Dec-06 Jan 2002 | 695 | 4 | 2 | 300 | 65-140 |
| 07 Jan-13 Jan 2002 | 851 | 1 | 7 | 500 | -- |
| 14 Jan-20 Jan 2002 | 853 | 4 | 3 | 750 | 120-225 |
| 21 Jan-27 Jan 2002 | 979 | 5 | 7 | 1300 | 83-218 |
| 28 Jan-03 Feb 2002 | 855 | 3 | 8 | 650 | 92-187 |
| 04 Feb-10 Feb 2002 | 703 | 1 | 120 | 200 | -- |
| 11 Feb-17 Feb 2002 | 600 | 4 | 31 | 100 | -- |
Rainfall was heavy at times; during early and late November the maximum weekly rainfall rate was 44 mm/hour, and during 12-18 November the maximum rainfall rate was 78 mm/hour. Despite the heavy rainfall, no lahars were reported. Fumarole temperatures in the Gendol crater during November ranged from 430-570°C.
Incandescent lava avalanches traveled distances of 2.5 to 3 km and flowed toward the headwaters of the Sat and Bebeng rivers and, to a lesser extent, the headwaters of the Lamar and Senowo rivers. During 28 January-3 February 194 of these avalanches occurred.
A pyroclastic flow on 18 December traveled ~1 km toward the headwaters of the Bebeng river. Minor pyroclastic flows were reported throughout the remainder of the report period. During 4-10 February, 7 pyroclastic flows traveled 2.7 km to the Sat river and 2.5 km to the Bebeng river. During 11-17 February, 7 low-frequency earthquakes were recorded and the following week 1 low-frequency event was recorded. Merapi remained at Alert Level 2 throughout the report period.
Information Contacts: Dali Ahmad, Volcanological Survey of Indonesia (VSI), Jalan Diponegoro No. 57, Bandung 40122, Indonesia (URL: http://www.vsi.esdm.go.id/).
Pyroclastic flows and lava avalanches occur during February-June 2002
From 25 February through 16 June 2002 a generally white, variably dense, low-pressure plume rose 150-820 m above the summit of Merapi. Seismicity was dominated by avalanche earthquakes (table 14). During the week of 25-31 March, one shallow volcanic earthquake was reported. The Volcanological Survey of Indonesia (VSI) reported that Merapi emitted varying amounts of SO2 (table 15).
Table 14. Seismicity (low-frequency, avalanche, and multiphase) and crater characteristics at Merapi during 25 February-16 June 2002. Magnetic field strength was measured at Pusang-Lempong and is reported in nanoteslas (nT). "--" indicates that the information was not reported. Courtesy VSI.
| Date | Low-frequency events | Avalanche events | Multiphase events | Magnetic field strength | Gendol crater | Woro crater |
| 25 Feb-03 Mar 2002 | -- | -- | -- | -- | -- | 571°C |
| 04 Mar-10 Mar 2002 | -- | 666 | -- | -- | -- | -- |
| 11 Mar-17 Mar 2002 | 5 | 652 | -- | -- | -- | -- |
| 18 Mar-24 Mar 2002 | 1 | 609 | -- | -- | -- | -- |
| 25 Mar-31 Mar 2002 | 60 | 575 | -- | -- | -- | -- |
| 01 Apr-07 Apr 2002 | 135 | 539 | 1 | -- | -- | -- |
| 15 Apr-21 Apr 2002 | 46 | 364 | -- | 3.09 nT | -- | -- |
| 22 Apr-28 Apr 2002 | 19 | 367 | 1 | 0.32 nT | -- | -- |
| 29 Apr-05 May 2002 | 9 | 383 | 13 | -3.22 nT | 737-742°C | 421-434°C |
| 06 May-12 May 2002 | 13 | 353 | -- | 4.64 nT | 737-746°C | 398-431°C |
| 13 May-19 May 2002 | 2 | 345 | 2 | 8.28 nT | 734-748°C | 406-430°C |
| 20 May-26 May 2002 | -- | 308 | 15 | -1.02 nT | 734-749°C | 421-431°C |
| 27 May-02 Jun 2002 | 8 | 310 | 6 | -1.47 nT | 620-750°C | 354-430°C |
| 03 Jun-09 Jun 2002 | 9 | 268 | 6 | -1.65 nT | 741-756°C | 423-435°C |
| 10 Jun-16 Jun 2002 | -- | 281 | 5 | 1.65 nT | 736-755°C | 423-434°C |
Table 15. COSPEC-measured SO2 gas emission at Merapi during 3 March-16 June 2002. "--" indicates that the information was not reported. Courtesy VSI.
| Date | Average SO2 emission (ton/day) | Range (ton/day) | Max. avg. (ton/day) |
| 03 Mar-10 Mar 2002 | 156 | 96-254 | 196 |
| 11 Mar-17 Mar 2002 | 131 | 87-173 | 138 |
| 18 Mar-24 Mar 2002 | 146 | 103-206 | -- |
| 25 Mar-31 Mar 2002 | 133 | 74-172 | 136 |
| 01 Apr-07 Apr 2002 | 107 | 73-145 | 108 |
| 15 Apr-21 Apr 2002 | 124 | 105-167 | -- |
| 22 Apr-28 Apr 2002 | 155 | 97-219 | 182 |
| 29 Apr-05 May 2002 | 156 | 109-245 | 173 |
| 06 May-12 May 2002 | 166 | 123-210 | 169 |
| 13 May-19 May 2002 | 90 | 43-182 | 145 |
| 20 May-26 May 2002 | 140 | 64-206 | 160 |
| 27 May-02 Jun 2002 | 131 | 62-216 | 167 |
| 03 Jun-09 Jun 2002 | 141 | 85-196 | 167 |
| 10 Jun-16 Ju 2002 | 125 | 42-218 | 161 |
In total, 69-108 lava avalanches per week were observed during mid-February through late March. The avalanches generally traveled 2.5-2.75 km towards the upstream ends of the Senowo, Sat, and Lamat rivers, and partly to the Bebeng river. During 25 February-3 March, a total of four minor pyroclastic flows traveled to the upstream part of the Bebeng river to a maximum distance of 1.0 km (3 on 25 February and 1 on 3 March). Field observations of the summit on 28 February revealed very thin solfatara sublimation at Gendol and Woro craters. Temperatures at the craters were 354-755°C (table 14). No further pyroclastic flows occurred until 29 and 30 March, when 7 and 2 flows, respectively, traveled 1.8 km down to the upstream ends of the Sat and Senowo rivers. Low-frequency (LF) earthquakes, which had been recorded during the previous few weeks, increased (table 14), and high-intensity rain fell but did not trigger lahars.
Table 15 shows Merapi's SO2 fluxes. The molar concentrations of volcanic gases from Gendol crater on 28 February were as follows: 0.21% H2, 0.02% (O2 + Ar), 0.54% N2, 3.87% CO2, 0.01% CO, 1.00% H2S, 5.49% HCl, 88.86% H2O. One pyroclastic flow was reported during 25-31 March.
During early April, two minor pyroclastic flows traveled 1.3 km toward the Sat river. Activity at Merapi increased significantly; LF earthquakes reached 135 events within the week. The most intense rain was ~65 mm/hour near the Babadan post observatory on 4 April, but it did not trigger lahars. On 14 April, two minor pyroclastic flows reached 1.8 km maximum distance. Seismicity began to decrease but was still higher than normal. Deformation data from Reflector 4 at the Babadan post observatory indicated 7 mm of deflation, and the lava dome morphology did not change.
No further pyroclastic flows were reported through at least mid-June. Seismicity and general activity at Merapi was reportedly decreasing. Merapi remained at Alert Level 2 throughout the report period.
Information Contacts: Volcanological Survey of Indonesia (VSI), Jalan Diponegoro No. 57, Bandung 40122, Indonesia (URL: http://www.vsi.esdm.go.id/).
Frequent lava avalanches; plumes up to 550 m above summit
During 17 July-1 September, seismicity at Merapi was dominated by avalanche earthquakes. SO2 emissions varied, and generally white, thin, low-pressure plumes rose up to 550 m above the summit. Glowing avalanches traveled 2.6 km, moving towards headwaters of the Sat, Lamat, Senowo, and Bebeng rivers (table 16). On 2 July two pyroclastic flows traveled 0.5 km toward the upstream of the Sat river. One low-frequency earthquake occurred during late August. The temperature of Gendol crater was 734-755°C, and the Woro crater was 418-435°C. Merapi remained at Alert Level 2.
Table 16. Seismicity, SO2 emissions, plume and lava-avalanche observations at Merapi during 17 June-1 September 2002. Courtesy VSI.
| Date | Avalanche | Multiphase | Tectonic | SO2* | MI | Plumes (heights are above the summit) and lava avalanches |
| 17 Jun-23 Jun 2002 | 247 | 6 | 7 | 107, 56-197, 174 | +0.76 | White, thin, low-pressure plume rose 400 m; 65 glowing lava avalanches traveled 2.5 km to the Sat, Lamat and Senowo rivers. |
| 24 Jun-30 Jun 2002 | 318 | 3 | 16 | 87, 56-172, 134 | -- | White, thin, low-pressure plume rose 500 m; 68 glowing lava avalanches traveled 2.5 km to the Sat, Lamat and Senowo rivers. |
| 01 Jul-07 Jul 2002 | 226 | 4 | 6 | 113, 73-167, 134 on 6 July | +0.59 | White, thin, low-pressure plume rose 550 m; 60 glowing lava avalanches traveled 2.6 km to the Sat, Lamat, Senowo, and Bebeng rivers. |
| 08 Jul-14 Jul 2002 | 180 | -- | 12 | 85, 65-118, 86 on 11 July | +2.56 | White, thin, low-pressure plume rose 550 m; glowing lava avalanches traveled 2.6 km to the Sat, Lamat, Senowo, and Bebeng rivers. |
| 15 Jul-21 Jul 2002 | 201 | 2 | 4 | 117, 76-143, 122 on 16 July | -1.15 | White, thick low-pressure plume rose 390 m; glowing lava avalanches traveled 2.5 km to the Sat, Lamat, Senowo, and Bebeng rivers. |
| 22 Jul-28 Jul 2002 | 220 | -- | 10 | 80, 46-167, 135 on 28 July | -1.69 | White, thick low-pressure plume rose 350 m; 92 glowing lava avalanches traveled 2.5 km to the Sat, Lamat, Senowo, and Bebeng rivers. |
| 29 Jul-04 Aug 2002 | 237 | 3 | 7 | 145, 62-210, 162 on 4 August | +1.68 | White, thin medium-pressure plume rose 394 m; 42 glowing lava avalanches traveled 2.6 km to the Sat, Lamat, Senowo, and Bebeng rivers. |
| 05 Aug-11 Aug 2002 | 184 | 1 | 4 | 106, 56-123, 155 on 5 August | -1.89 | White, thick, low-pressure plume rose 525 m; 53 glowing lava avalanches traveled 2.5 km to the Sat, Lamat, Senowo, and Bebeng rivers. |
| 12 Aug-18 Aug 2002 | 191 | -- | 6 | 87, 61-115, 93 on 14 August | +0.13 | White, thin, low-pressure plume rose 300 m; 40 glowing lava avalanches traveled 2.5 km to the Sat, Lamat, and Senowo rivers. |
| 19 Aug-25 Aug 2002 | 187 | 15 | 11 | 129, 92-154, 137 on 24 August | +0.13 | White, thin, low-pressure plume rose 350 m; 16 glowing lava avalanches traveled 2.5 km to the Sat, Lamat, and Senowo rivers. |
| 26 Aug-01 Sep 2002 | 311 | 4 | 3 | 127, 85-190, 157 on 26 August | -0.22 | White, thin, low-pressure plume rose 400 m; glowing lava avalanches traveled 2.5 km to the Sat, Lamat, and Senowo rivers. |
Information Contacts: Volcanological Survey of Indonesia (VSI), Jalan Diponegoro No. 57, Bandung 40122, Indonesia (URL: http://www.vsi.esdm.go.id/).
Infrared satellite data show continuous activity through mid-January 2002
During late July-1 September 2002, the Volcanological Survey of Indonesia (VSI) reported frequent lava avalanches and plumes up to 550 m above the summit of Merapi (BGVN 27:09). No further reports were issued by VSI through at least March 2003.
MODIS thermal alerts during 2001 and 2002 indicated continuous activity through mid-January 2002 (figures 24 and 25). This period was characterized by dome collapse and hot avalanches (BGVN 26:01, 26:07, 26:10, and 27:02). Pyroclastic flows occurred too frequently to correlate them with the MODIS alerts, for which data are collected only about once per day (weather permitting). There were no alerts detected during the rest of 2002 except for late March-late May, which corresponded to a temporary renewal of pyroclastic flows before a quieter second half of the year (BGVN 27:06 and 27:09).
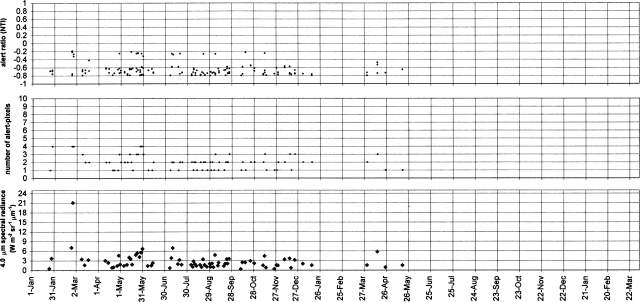 |
Figure 24. MODIS-detected alerts on Merapi during 2001-2002. Thermal alerts collated by Diego Coppola and David Rothery; data courtesy of the Hawaii Institute of Geophysics and Planetology's MODIS Thermal Alert Team. |
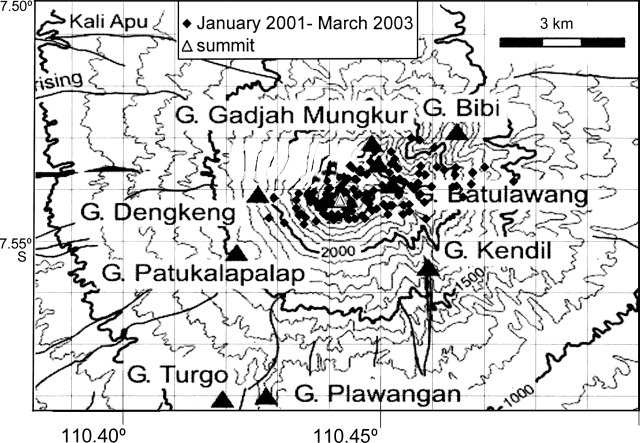 |
Figure 25. Center coordinates of alert-pixels on Merapi, relative to the published summit location. Grid squares are 1 km. Thermal alerts collated by Diego Coppola and David Rothery; data courtesy of the Hawaii Institute of Geophysics and Planetology's MODIS Thermal Alert Team. |
Information Contacts: Dali Ahmad, Volcanological Survey of Indonesia (VSI), Jalan Diponegoro No. 57, Bandung 40122, Indonesia (URL: http://www.vsi.esdm.go.id/); Diego Coppola and David A. Rothery, Department of Earth Sciences, The Open University, Milton Keynes, MK7 6AA, UK. Thermal alerts courtesy of the HIGP MODIS Thermal Alerts Team (URL: http://modis.higp.hawaii.edu/).
Mid-2006 brings multiple pyroclastic flows that kill two, and travel up to 7 km
Seismic activity at Merapi began to increase on 19 March 2006, leading the Center of Volcanology and Geological Hazard Mitigation (CVGHM) to raise the Alert Level from 1 to 2 (on a scale of 1-4). Ten thousand residents were warned to prepare for possible evacuation.
On 10 April, authorities banned mountain climbing due to reports of increased tremor. Unverified preliminary reports indicated "lava" reportedly flowing near Pasar Bubar village, ~ 350 m from the volcano's crater. At 1500 on 12 April, CVGHM raised the Alert Level from 2 to 3. No one was permitted within 8 km of the summit.
During 21-25 April, seismicity remained elevated; several seismic signals associated with rockfalls were recorded. The SO2 flux measured from Merapi was 175 metric tons on 22 April. On 22 and 23 April, fumarolic emissions rose 400 m above the summit. On 25 April, two rockslides from lava-flow fronts were heard from nearby observatories. According to news reports, about 600 of the approximately 14,000 people living near the volcano had been evacuated by 24 April.
According to news reports, on 27 April nearly 2,000 villagers were evacuated from Sidorejo and Tegalmulyo villages. That day, small amounts of ash fell in Gemer village about 5 km from the summit.
On 28 April, CVGHM reported volcanic material traveling ~ 1.5 km SW to the Lamat River. Seismicity that day was dominated by multi-phase earthquakes; but signals from landslides, rockfalls, and low-frequency events were also recorded.
On 6 May, gas plumes rose to 800 m above the summit and eighteen incandescent avalanches of volcanic material were observed. On 7 May, 26 incandescent avalanches that extended ~ 100 m were seen during the morning. On 6 and 7 May, the lava dome continued to grow and seismicity was dominated by multi-phase earthquakes. Shallow volcanic earthquakes and signals from landslides and rockfalls were also recorded. On 8 May, the Darwin VAAC reported that CVGHM warned of a plume rising to ~ 3.7 km, but no ash was visible on satellite imagery.
According to the Darwin VAAC, gas plumes that rose ~ 600 m above the summit were visible on satellite imagery on 11 May. Avalanches of incandescent material extended 200 m SE towards the Gendol River, and 1.5 km SW towards the Krasak River. Several small incandescent avalanches of volcanic material were visible from observatory posts. The new lava dome at the volcano's summit had grown to fill the gap between the 1997 and 2001 lava flows on the W side of the summit, and had reached a height about the same as the 1997 lava flows. Seismicity was dominated by multi-phase earthquakes and signals associated with avalanches.
At 0940 on 13 May, the Alert Level was raised from 3 to 4, the highest level, and ~ 4,500 people living near the volcano were evacuated.
On 15 May pyroclastic flows traveled as far as 4 km to the W. By 16 May, more than 22,000 people had been evacuated, according to figures posted at the district disaster center; about 16,870 people were evacuated from three districts in Central Java Province, and more than 5,600 others were evacuated from the Slemen district. On 17 May, pyroclastic flows traveled as far as 3 km. Local volcanologists reported that the lava dome continued to grow, but at a slower rate than during previous days.
Pyroclastic flows to the SW and SE reached 4 km on 19 May and 3 km on 20 May. On 22 May, the lava dome volume was estimated at ~ 2.3 million cubic meters. The Darwin VAAC reported that low-level emissions continued during 18-19 and 23 May. CVGHM recommended that residents who lived in valleys on the NNW flanks near Sat, Lamat, Senowo, Trising, and Apu Rivers and on the SE flank near Woro River be allowed to return to their homes. Residents remained evacuated from villages within a 7 km radius from the volcano's summit and within 300 m of the banks of the Krasak/Bebeng, Bedog, and Boyong Rivers to the SW, and the Gendol River to the SE.
According to news reports, an eruption produced a cloud of hot gas and ash on 17 May. Witnesses said the size of the plume was smaller than ash-and-gas plumes seen on 15 May. On 18 May, a representative for Merapi from the Center for Volcanological Research and Technology Development (part of CVGHM), reported new ashfall.
On 24-25 May, lava flows were observed moving SW towards the Krasak River and SE towards the Gendol River. News reports indicated that on 27 May a M 6.3 earthquake that killed about 5,400 people resulted in a three-fold increase in activity at Merapi. A M 5.9 earthquake coincided with pyroclastic flows of unknown origin that extended 3.8 km SW. During 28-30 May, multiple pyroclastic flows reached 3 km SE and 4 km SW. Gas plumes reached 500 m above the summit on 25 May, 1,200 m on 26 May, 100 m on 29 May, and 900 m on 30 May.
From 31 May to 6 June, SO2-bearing plumes were observed daily; on 1 June they reached 1.3 km above the summit. According to the Darwin VAAC, low-level emissions were visible on satellite imagery on 1 and 6 June. Multiple pyroclastic flows reached ~ 4 km SE toward the Gendol River and 3.5 km SW toward the Krasak and Boyong Rivers. CVGHM reported on 31 May that lava avalanches moved W for the first time during the recent eruption.
According to a volcanologist in Yogyakarta, lava-flow distances and dome volume had both approximately doubled since the 27 May M 6.2 earthquake. On 6 June, people living near the base of the volcano began to move into temporary shelters. Activities remain restricted within a 7 km radius from the volcano's summit and within 300 m of the banks of Krasak/Bebeng, Bedog, and Boyong Rivers to the SW, and Gendol River to the SE.
On 8 June, the lava-dome growth rate at Merapi was an estimated 100,000 cubic meters per day and the estimated volume was then ~ 4 million cubic meters. An estimated volume loss of 400,000 cubic meters on 4 June had been due to a partial collapse of the S part of the Geger Buaya crater wall, which was constructed from 1910 lava flows.
On 8 June, a pyroclastic flow, lasting 12 minutes, reached a distance of ~ 5 km SE toward the Gendol River, the predominant travel direction since the M 6.2 earthquake on 27 May. According to a news report, this event prompted approximately 15,500 people to evacuate from the Sleman district to the S and the Magelang district to the W. On 13 June, the Alert Level was lowered from 4 to 3 but renewed pyroclastic-flow activity the next day prompted a return to Alert Level 4.
Gas plumes were observed almost daily during 7-13 June and reached ~ 1.2 km above the summit on 10 June. The Darwin VAAC reported small ash plumes visible on satellite imagery; minor ashfall was reported to the S at an observatory outpost, and in Yogyakarta, about 32 km away.
Gas plumes emitted on 14 and 15 June reached 900 m above the summit. On 14 June a dome collapse lasting ~ 3.5 hours produced pyroclastic flows that reached 7 km SE. Two volunteers on a search-and-rescue team assisting with evacuation efforts were trapped in an underground refuge in Kaliadem village and died, the first fatalities of the current eruption. Stone (2006) wrote that the volunteers had ". . . sought refuge in a bunker, one of several on the mountain built for that contingency. The blast door was slightly ajar when rescuers dug down to the bunker the next day. The men had burned to death."
On 15 June, pyroclastic flows reached a distance of 4.5 km SE along the Gendol River. Pyroclastic flows continued during 16-19 June as a new dome grew. The Alert Level remained at 4.
During 21-25 June, seismic signals at Merapi indicated almost daily occurrences of rockfalls and pyroclastic flows. Due to inclement weather, pyroclastic flows were only observed on 24 June and reached a distance of 4 km SE along the Gendol River and 2.5 km SW along the Krasak River. Gas plumes were observed during 22-25 June and reached 1.5 km above the summit on 24 June.
Reference. Stone, Richard, 2006, Volcanology?Scientists steal a daring look at Merapi's explosive potential; Science, American Association for the Advancement of Science (AAAS), v. 312, pp. 1724-6.
Information Contacts: Center of Volcanology and Geological Hazard Mitigation (CVGHM), Jalan Diponegoro 57, Bandung 40122, Indonesia (URL: http://www.vsi.esdm.go.id/); Associated Press (URL: http://news.yahoo.com/s/ap/indonesia_volcano); Reuters (URL: http://news.yahoo.com/s/nm/20060418/wl_nm/indonesia_volcano_dc_2).
Fewer pyroclastic flows during July; ASTER thermal data
During mid-March through July 2006, scientists at Merapi noted variations in seismicity, the number and size of explosions, and the abundance of pyroclastic flows and incandescent rockfalls. This led to changes in Alert Levels and, during April and May, thousands of evacuations. The source of in-situ information for this report was Merapi Volcano Observatory and the Center of Volcanology and Geological Hazard Mitigation (CVGHM; formerly VSI, the Volcanological Survey of Indonesia, and still informally referred to in that way). Satellite images collected by the Advanced Spaceborne Thermal Infrared and Reflection Radiometer (ASTER) complemented the ground observations.
Although events of 28 April to 22 June 2006 were previously discussed in more detail (BGVN 31:05), they are presented here in the context of ASTER and summaries of CVGHM field reports. CVGHM observations from 28 June to 25 July revealed an interval of limited significant rockfalls, sparse pyroclastic flows (only one was reported, to 3 km runout distance), and modest gas plumes.
Activity during 28 April to 22 June 2006. About eight images from 28 April to 22 June were collected over Merapi by the ASTER satellite and processed by Michael Ramsey. Temperatures over the lava dome and flanks were extracted from daytime and nighttime images; in some cases the contents of plumes were assessed. The temperature and distribution of thermal anomalies were consistently in agreement with ground observations from CVGHM.
ASTER consists of three instrument sub-systems covering fourteen bands over three wavelength regions with various spatial (pixel) resolutions. Three visible and near-infrared (VNIR) bands cover 0.52-0.86 ?m at 15 m spatial resolution. Six short-wavelength infrared (SWIR) bands cover 1.60-2.45 ?m at 30 m resolution. Five thermal infrared (TIR) bands cover 8.125-11.65 ?m at 90 m resolution.
A temperature data point from a pixel is the average temperature for that 30 x 30 m (SWIR) or 90 x 90 m (TIR) pixel area. Temperature data are extracted from the TIR region, unless the pixels are saturated (temperatures greater than 100°C over the 90 m pixel). In those cases, temperatures are extracted from SWIR images. Cross-track pointing of the sensors ? 116 km from nadir allows for repeat times of less than sixteen days. For a target near the equator at a 24° pointing angle, repeat times can average four days. During the Merapi crisis, investigators tasked the satellite to collect more frequent images.
A nighttime TIR image from 28 April showed a weak thermal anomaly over the summit. Approximately 8 pixels were thermally elevated above background, to a maximum temperature of ~ 25.9°C. Further processing of the emissivity spectra from the hottest pixels demonstrated that over 5% of the sub-pixel temperatures may be on the order of 100's of degrees C. SWIR data from the same time showed temperature of no more than ~ 200°C. One small anomaly was visible ~ 650 m SW from the summit. CVGHM reported that volcanic material traveled ~ 1.5 km SW towards the Lamat River on 28 April.
On 12 May, a daytime SWIR image demonstrated increased activity with a larger thermal anomaly than the 28 April image and a pixel average maximum temperature of 213°C. Emissivity spectra collected in the TIR region corroborated the temperature data in the SWIR region. On 11 May, CVGHM reported a sharp increase in eruptive activity and on 13 May, raised the Alert Level from 3 to 4 (the highest level). As noted in BGVN (31:05), about 4,500 people living near the volcano were evacuated.
A significant thermal anomaly was present in the 14 May TIR and SWIR nighttime images. Three pixels in the SWIR region had a maximum average pixel temperature of 442°C. An area of elevated temperature to the SW was interpreted as a pyroclastic flow. On 15 May, CVGHM reported that pyroclastic flows had traveled as far as 4 km W.
A clear nighttime SWIR image acquired on 30 May showed a maximum derived temperature of 447°C and 11 pixels with temperatures greater than 400°C. Two zones of thermally elevated pixels were evident about 600 m SE of the dome and 2 km SW of the summit. Consistent with the imagery, CVGHM reported that during 28-30 May, multiple pyroclastic flows reached a maximum of 3 km SE toward the Gendol River and 4 km SW toward the Krasak and Boyong Rivers.
On 6 June, daytime VNIR, nighttime SWIR, and TIR images were collected. The daytime image shows a large ash-rich plume extending SW over 40 km from the summit (figure 26). Preliminary analysis of the plume by Vince Realmuto (using a decorrelation stretch of the daytime TIR data) indicated a mixture of ash and steam, and low SO2 content. Thermal anomalies over the summit and on the flanks (outlined in white), interpreted as possible pyroclastic flows, extended~ 3 km SE and SW, and ~ 1 km NW. SWIR temperature data showed a maximum average pixel temperature of 420°C and two summit pixels over 400°C. According to CVGHM, on 6 June lava avalanches and two pyroclastic flows reached ~ 2 km SE and lava avalanches traveled 2 km SW.
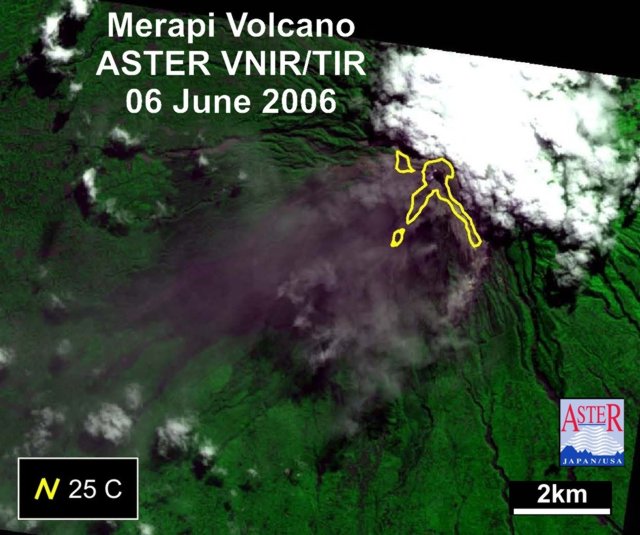 |
Figure 26. Composite ASTER image of Merapi acquired on 6 June 2006. A large ash-rich plume drifting over 40 km SW of the summit is evident in this visible near-infrared ASTER image (15 m pixel size) taken during daylight hours. Temperature data from a nighttime thermal infra-red image acquired 12 hours later is superimposed on the image as contour lines. Those on and around the summit represent the minimum extent of elevated temperatures (~ 25°C) from hot material such as pyroclastic flows. Courtesy Michael Ramsey, University of Pittsburgh. |
A thermal anomaly, interpreted as cooling pyroclastic flows, that extended ~ 6.4 km S of the summit region was evident on a TIR and SWIR image set acquired on 22 June. The SWIR data showed two pixels greater than 425°C over the summit similar to the 6 June data. Based on interpretation of seismic data, CVGHM reported almost daily occurrences of rockfalls and pyroclastic flows during 21-25 June. Visual observations were mostly inhibited by cloud cover.
Activity during 28 June-25 July 2006. Pyroclastic flows and rockfalls decreased in frequency and intensity during 28 June-4 July. Pyroclastic flows were observed during 28-30 June and reached a maximum distance of 3 km SE along the Gendol River. Gas plumes were observed during 28 June-1 July and reached a maximum height of 1 km above the summit (~ 4 km altitude) on 28 June.
During 5-11 July, gas plumes reached a maximum height of 1.2 km above the summit on 6 July. Due to a decrease in activity, on 10 July the Alert Level was lowered one level to 3 in all areas except the S slope.
Incandescent material reached a maximum distance of 2 km SE along the Gendol River from 12 to 18 July. Gas plumes were also observed daily and reached heights of 1 km above the crater (~ 4 km altitude) On 17 July, CVGHM lowered the Alert Level to 3 for the S slope. During 19-25 July, gas plumes reached maximum heights of 400 m above the summit (~ 3.3 km altitude). Flows of incandescent material were observed daily, advancing at a maximum distance of 1.5 km SE toward the Gendol River. Pyroclastic flows were not observed during 12-25 July.
Information Contacts: Center of Volcanology and Geological Hazard Mitigation (CVGHM), Jalan Diponegoro 57, Bandung 40122, Indonesia (URL: http://www.vsi.esdm.go.id/); Michael Ramsey and the Image Visualization and Infrared Spectroscopy (IVIS) laboratory, University of Pittsburgh, 200 SRCC Building, Pittsburgh, PA 15260, USA (URL: http://ivis.eps.pitt.edu/); Vince Realmuto, Jet Propulsion Laboratory, Mail Stop 168-514, 4800 Oak Grove Drive, Pasadena, CA 91109, USA; Advanced Spaceborne Thermal Infrared and Reflection Radiometer satellite (URL: http://asterweb.jpl.nasa.gov/).
March-July 2006 volcanic crisis; May earthquake killed ~5,800
Merapi, one of the most dangerous volcanoes in the world owing to its perched lava dome and location in populous central Java, underwent vigorous dome growth during early to mid-2006, and its increasingly unstable summit dome released numerous pyroclastic flows and incandescent avalanches. Thousands of residents evacuated and the volcano became prominent in international news. The longest pyroclastic flows of mid-2006 took place on 8 and 14 June, with respective run-out distances from the summit area of ~ 5 and 7 km. Merapi's summit lies 32 km N of the large city of Yogyakarta.
This report contains summary notes on activity during 7 March to 1 July 2006. These notes were assembled and reported by scientists from the Merapi Volcano Observatory and the Center of Volcanology and Geological Hazard Mitigation (CVGHM), formerly the Volcanological Survey of Indonesia, and augments material presented previously (BGVN 31:05 and 31:06).
The USGS provided a satellite image with labels showing key drainages and features near the summit (figure 27). The dome's instability leads to pyroclastic flows and various kinds of rockfalls and other mass wasting episodes down the labeled drainages. During the 7 March to 1 July reporting interval, pyroclastic flows followed the headwaters of the Gendol , Krasak, Boyong, and Sat rivers, which trend to the SE, SW, SSW, and W, respectively.
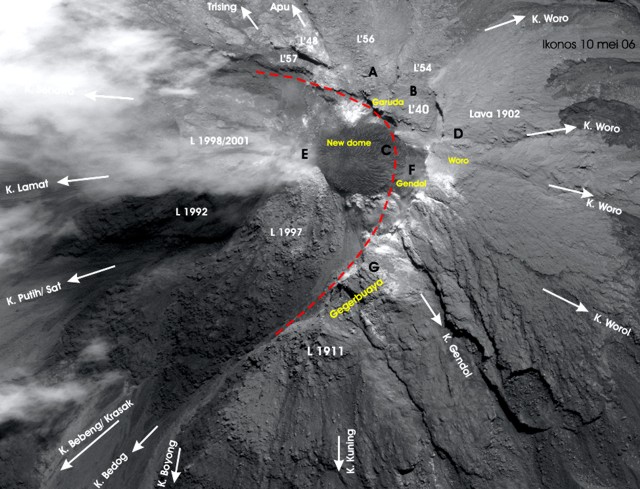 |
Figure 27. An annotated Ikonos satellite image of Merapi taken 10 May 2006. Image resolution is 2 m; N is to the top, and the scale is such that the entire distance N-S on the image is approximately 1 km. The labeled arrows indicate key rivers into which upslope avalanche shoots drain. Multiple drainage names are separated by a slash, and many western headwaters descend into the Woro river. The "K." stands for Kali, Indonesian for stream. Lava domes and viscous flows ("L") are labeled with the year of extrusion. The Gegerbuaya ridge was formed by 1911 lavas. Garuda, Woro, and Gendol identify headwaters. Letters reference locations used by scientists to facilitate communication. The Kaliurang Observatory lies ~ 4 km to the SE of the summit. The labeled image was a collaborative effort provided here courtesy of John Pallister, USGS. Image copyright 2006, GeoEye. |
Tectonic earthquake on 27 May 2006. The tectonics of Java are dominated by the subduction of the Australia plate to the NNE beneath the Sunda plate with a relative velocity of ~ 6 cm/year. The Australia plate dips NNE from the Java trench, attaining depths of 100-200 km beneath the island of Java, and depths of 600 km to the N of the island. The earthquake of 27 May 2006 occurred at shallow depth in the overriding Sunda plate, well above the dipping Australia plate.
The pace of volcanism and the intensity of the regional crisis increased after 27 May 2006. At 0553 that day, a destructive Mw 6.3 earthquake occurred leaving damage across central Java's southern coastal and inland areas (figure 28). The earthquake occurred at 10 km focal depth. The epicenter (at 7.962°S, 110.458°E) was 20 km SSE of Yogyakarta (population, 511,000; 6 million in the larger metro area). Some initial estimates put the earthquake at MR 5.9; this was later revised and even the newer (above-stated) seismic parameters are preliminary.
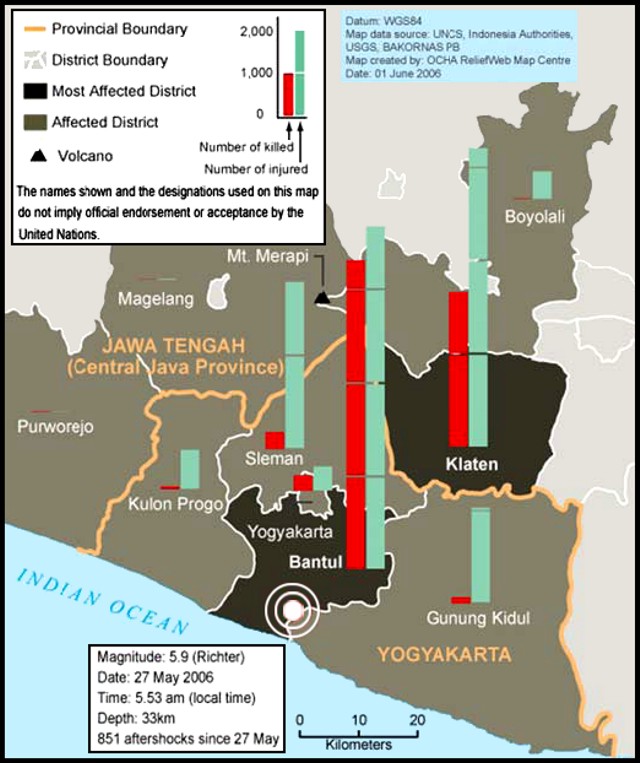 |
Figure 28. Epicenter of the 27 May 2006 earthquake in Central Java, including impact on regions around Merapi. The histograms show numbers of people killed (on left bar) and injured (right bar). As mentioned in text, some of the seismic parameters stated were later revised. Modified from a UN OCHA ReliefWeb Map Centre (1 June 2006) map in a 2006 United Nations report (see References). |
A US Geological Survey (USGS) summary stated that the earthquake caused 5,749 deaths, 38,568 injuries, and led to as many as 600,000 people displaced in the Bantul-Yogyakarta area. The shaking left more than 127,000 houses destroyed and an additional 451,000 houses damaged in the area, with the total loss estimated at ~3.1 billion US dollars. Modified Mercalli intensities were as follows: at Bantul and Klaten, IX; at Sleman and Yogyakarta, VIII; at Surakarta, V; at Salatiga and Blitar, IV; and at Surabaya, II. The earthquake was felt in much of Java and at Denpasar, Bali. The website of the US Geological Survey's Earthquake Hazards Program features a large number of photos (captioned in English) depicting various aspects of the earthquake.
Events during 7 March-1 July 2006. Tables 17 and 18 summarize some of the details during the reporting interval. Merapi's activity had increased to include volcanic earthquakes and deformation of the summit area a year earlier (in July 2005). Although the number of daily lava avalanches and pyroclastic flows had increased almost a week earlier, a tectonic earthquake, MR 6.3 (Richter scale magnitude), at 0555 (local time, WIB) on 27 May was followed by another significant increase in those events for another week (tables 17 and 18). Pyroclastic flows and lava avalanches between 10 May and 30 June were rare in the W-flank Sat drainage (31 May, 2 June, and 10 June), and did not descend into the Boyong drainage (SSW) after 4 June (table 18). The Krasak river drainage (SW) had material entering it on an almost daily basis after 27 May, except for a brief time during 14-19 June, with maximum run-out distances of 4 km. The Gendol drainage (SE) also experienced daily pyroclastic flows and lava avalanches starting on 28 May. Most of these flows to the SE did not extend more than 5 km, but on 14 June a pyroclastic flow descended 7 km.
Table 17. A compilation of seismic events at Merapi during 7 March to 1 July 2006. In creating this table Bulletin editors merged the category "landslides" with the category "lava avalanches". Similarly, the category "hot cloud reports" was interpreted to be equivalent to "pyroclastic flow" and those were also merged. Those mergers were driven by sudden shifts in terminology found in CVGHM reports. No data was available for 26-27 April, 29 April-5 May, 8 May, 12-21 May, 24-26 May, 9 June, or 16-18 June. * Earthquake, MR 6.3 (Richter scale magnitude) recorded at 0555 (local time, WIB). ** Incomplete data only 0000-0600 (local time). All data courtesy of CVGHM.
| Date | Plume seen to (meters above summit) | Lava avalanche signals | Multiphase earthquakes | Pyroclastic flow signals | Tectonic earthquakes |
| 07-12 Mar 2006 | -- | -- | 198 | -- | -- |
| 13-19 Mar 2006 | -- | -- | 239 | -- | -- |
| 21 Apr 2006 | -- | 13 | 162 | -- | 1 |
| 22 Apr 2006 | -- | 12 | 95 | -- | -- |
| 23 Apr 2006 | -- | 5 | 60 | -- | 1 |
| 24 Apr 2006 | -- | 21 | 178 | -- | 1 |
| 25 Apr 2006 | 200 | 6 | 25 | -- | -- |
| 28 Apr 2006 | -- | 20 | 126 | -- | -- |
| 06 May 2006 | -- | 82 | 95 | -- | -- |
| 07 May 2006 | -- | 59 | 104 | -- | -- |
| 10 May 2006 | -- | 133 | 153 | -- | -- |
| 11 May 2006 | 600 | 88 | 115 | -- | -- |
| 22 May 2006 | -- | 309 | 56 | 25 | -- |
| 23 May 2006 | 700 | 243 | 60 | 31 | -- |
| 27 May 2006 * | 100 | 279 | -- | 54 | 138 |
| 28 May 2006 | 1600 | 237 | 43 | 159 | 95 |
| 29 May 2006 | 500 | 332 | 18 | 88 | 57 |
| 30 May 2006 | 800 | 337 | 19 | 56 | 40 |
| 31 May 2006 | 800 | 276 | 36 | 127 | 24 |
| 01 Jun 2006 | 1300 | 315 | 35 | 144 | 13 |
| 02 Jun 2006 | 650 | 338 | 25 | 163 | 24 |
| 03 Jun 2006 | 800 | 488 | 79 | 107 | 16 |
| 04 Jun 2006 | 900 | 397 | 54 | 118 | 25 |
| 05 Jun 2006 | 400 | 300 | 9 | 157 | 17 |
| 06 Jun 2006 | 300 | 212 | 10 | 78 | 14 |
| 07 Jun 2006 | 275 | 256 | 12 | 66 | 8 |
| 08 Jun 2006 | 300 | 210 | 28 | 67 | 10 |
| 10 Jun 2006 | 900 | 337 | 37 | 34 | 4 |
| 11 Jun 2006 | 800 | 299 | 20 | 20 | 10 |
| 12 Jun 2006 | 350 | 264 | 31 | 22 | 8 |
| 13 Jun 2006 | 1200 | 273 | 88 | 28 | 5 |
| 14 Jun 2006 | 500 | 371 | 29 | 61 | 2 |
| 15 Jun 2006 | 900 | 260 | 100 | 27 | 6 |
| 19 Jun 2006 | 600 | 272 | 88 | 21 | 7 |
| 20 Jun 2006 | 1250 | 312 | 136 | 38 | 4 |
| 21 Jun 2006 | -- | 256 | 65 | 15 | 4 |
| 22 Jun 2006 | 1200 | 319 | 39 | 4 | 5 |
| 23 Jun 2006 ** | 600 | 78 | 5 | 4 | 5 |
| 24 Jun 2006 | 1500 | 338 | 48 | 21 | 6 |
| 25 Jun 2006 | 800 | 321 | 32 | 18 | 17 |
| 26 Jun 2006 | 800 | 372 | 27 | 17 | 11 |
| 27 Jun 2006 | 1000 | 251 | 16 | 23 | 11 |
| 28 Jun 2006 | 1000 | 308 | 16 | 19 | 1 |
| 29 Jun 2006 | 700 | 290 | 11 | 15 | 12 |
| 30 Jun 2006 | 500 | 74 | 0 | 9 | 3 |
| 01 Jul 2006 ** | 350 | 250 | 4 | 13 | 4 |
Table 18. Record of run out distances (km) of pyroclastic flows and lava avalanches (the latter, in parentheses) toward river drainages on Merapi from 10 May to 30 June 2006. No data was reported for 16-18 June, and weather obscured views on21-22 June. Courtesy of CVGHM.
| Date | Gendal (km) | Krasak (km) | Boyong (km) | Sat (km) |
| 10 May 2006 | 0.2 | 1.5 | -- | -- |
| 20 May 2006 | 3.0 | 3.0 | 3.0 | -- |
| 22 May 2006 | -- | 3.5 | -- | -- |
| 27 May 2006 | -- | 3.8 (2.0) | (2.0) | -- |
| 28 May 2006 | 3.0 (1.0) | (2.5) | (2.5) | -- |
| 29 May 2006 | 1.0 (1.0) | 3.5 (2.0) | (2.0) | -- |
| 30 May 2006 | 2.0 (1.0) | 3.5 (2.0) | (2.0) | -- |
| 31 May 2006 | 2.0 (1.5) | 3.5 (2.5) | 3.5 (2.5) | (2.5) |
| 01 Jun 2006 | 1.5 (1.5) | 2.0 (3.0) | 2.0 (3.0) | -- |
| 02 Jun 2006 | 1.0 (1.0) | 3.0 | 3.0 | (1.0) |
| 03 Jun 2006 | 4.0 (1.0) | 2.0 (1.0) | 2.0 (2.0) | -- |
| 04 Jun 2006 | 4.0 (1.0) | 1.5 (2.0) | 1.5 (2.0) | -- |
| 05 Jun 2006 | 3.0 (1.0) | 1.5 (2.0) | -- | -- |
| 06 Jun 2006 | 2.0 (1.0) | (2.0) | -- | -- |
| 07 Jun 2006 | 3.0 (1.0) | 1.5 (2.0) | -- | -- |
| 08 Jun 2006 | 5.0 (1.0) | 4.0 (2.0) | -- | -- |
| 09 Jun 2006 | 4.0 | -- | -- | -- |
| 10 Jun 2006 | 3.5 (1.0) | (2.0) | -- | (3.0) |
| 11 Jun 2006 | 4.0 | (3.0) | -- | -- |
| 12 Jun 2006 | 1.5 | (3.0) | -- | -- |
| 13 Jun 2006 | 3.0 (1.0) | (2.0) | -- | -- |
| 14 Jun 2006 | 7.0 | -- | -- | -- |
| 15 Jun 2006 | 4.5 | -- | -- | -- |
| 19 Jun 2006 | 3.0 (1.0) | -- | -- | -- |
| 20 Jun 2006 | 3.5 (1.0) | (2.0) | -- | -- |
| 23 Jun 2006 | (1.0) | (2.0) | -- | -- |
| 24 Jun 2006 | 4.0 (1.0) | 2.5 (2.5) | -- | -- |
| 25 Jun 2006 | 3.0 (1.0) | (3.0) | -- | -- |
| 26 Jun 2006 | 4.5 (1.0) | 4.0 (3.0) | -- | -- |
| 28 Jun 2006 | 3.0 (1.0) | (2.5) | -- | -- |
| 29 Jun 2006 | 2.0 (1.0) | (2.5) | -- | -- |
| 30 Jun 2006 | 3.0 (1.0) | (2.0) | -- | -- |
Because of the vigor of activity, the Alert Level rose in several steps as follows: 19 March (Green to Yellow), 12 April (Yellow to Orange), and 13 May (Orange to Red). The step to Red (which is the highest alert level, and sometimes also referred to as Level 4) followed clear deformation at the dome during elevated seismicity. On 28 April, a new lava dome emerged. By 20 May, pyroclastic flows several kilometers long were regularly seen passing down several key drainages (table 18). Figure 29 shows a 15 May pyroclastic flow (seen two days after the alert status rose to red).
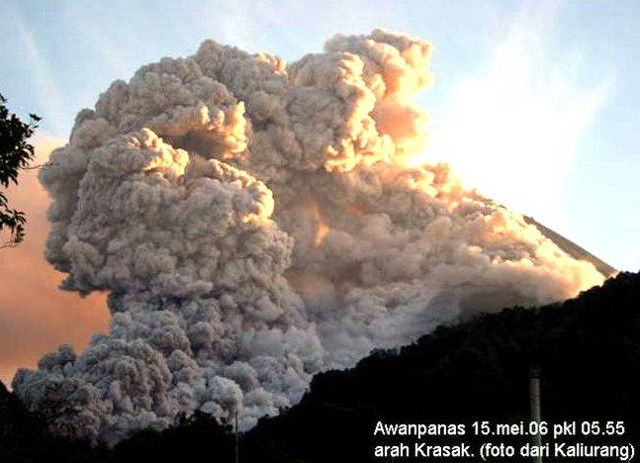 |
Figure 29. A photo taken on 15 May 2006 (0555 local time) of a pyroclastic flow traveling down the W flank of Merapi (the Krasak headwaters). Photo taken from the Kaliurang Observatory; courtesy of CVGHM. |
Volcano enthusiasts and photographers Martin Rietze and Tom Pfeiffer viewed Merapi on the morning of 27 May, during the destructive earthquake, from a high-elevation parking area ~ 4 km S of the summit. Prior to the earthquake, Rietze took several spectacular photos of incandescent avalanches pouring down avalanche shoots (figure 30 A-B). During the earthquake, he described horizontal swinging motion and dull rumbling sounds lasting perhaps 20 seconds. Dust rose from the volcano. Plants rubbing together also produced a rustling noise. Cries and engine noises in the background came from distant residents responding to the earthquake. At ~1-minute intervals, Merapi emitted about six pyroclastic flows and a substantial ash cloud grew overhead, reaching several kilometers in altitude above them. The photo in figure 30 C depicts the scene on Merapi around that time (which Rietze lists as 0555 on 27 May). His companion, Tom Pfeiffer, also took photos just after the large earthquake (e.g., figure 30 D).
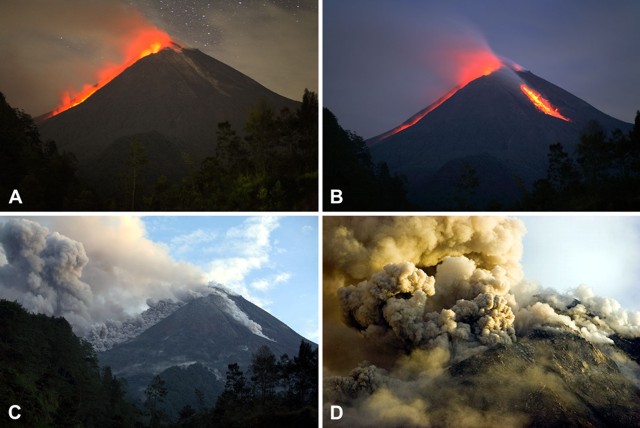 |
Figure 30. (A and B) Pre-dawn shots of incandescent material traveling down S-flank avalanche shoot(s) at Merapi on 27 May 2006 (prior to the M ~ 6 earthquake). (C) A photo of Merapi's response at 0555 on 27 May during or just after the M ~ 6 earthquake, with several pyroclastic flows clearly visible. (D) A second photo of the scene on Merapi during or just after the earthquake. This photo captured the chaotic scene at the summit and upper slopes, including a complex array of billowing ash clouds seemingly from multiple sources, and suspended dust hanging over many parts of the volcano (particularly distinguishable along the photo's lower central and right-hand areas). Copyrighted photos; those labeled A-C, used with permission of Martin Rietze; the one labeled D, with permission of Tom Pfeiffer. |
During early June the activity level of Merapi remained at red and on 4 June, the increase in volume of the new lava dome had caused the southern part of the crater wall called Gegerbuaya (1910 lavas) to collapse. Prior to its collapse, Gegerbuaya had functioned as a barrier to prevent pyroclastic flows moving southward from entering the Gendol River, which they did later in June.
On 8 June, multiple pyroclastic flows reached 4 km from the Krasak and Boyong Rivers and up to 4.5 km down the Gendol River. On 9 June, ash drifted W and NW and accumulated as ashfall ~ 1.5 mm thick. Pyroclastic flows traveled as far as 4 km toward the Gendol River. Figures 31 and 32 show pyroclastic flows on 7 and 10 June.
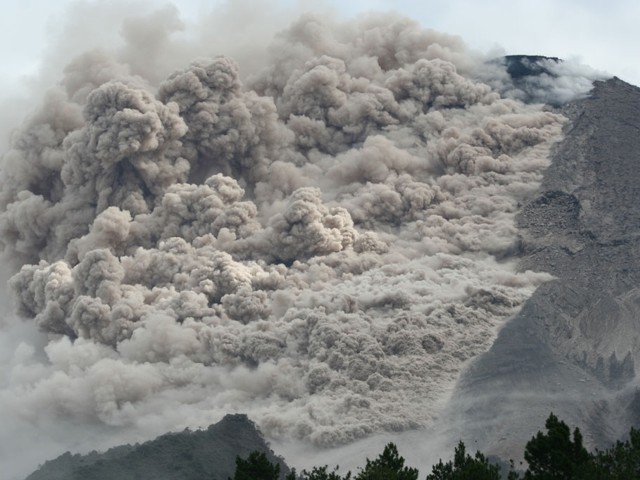 |
Figure 31. A pyroclastic flow at Merapi at 08:54:37 on 7 June 2006 shown traveling down Merapi's upslope region in a generally SE direction. Photo credit to BPPTK (The Research and Technology Development Agency for Volcanology, Yogyakarta). Provided courtesy of CVGHM. |
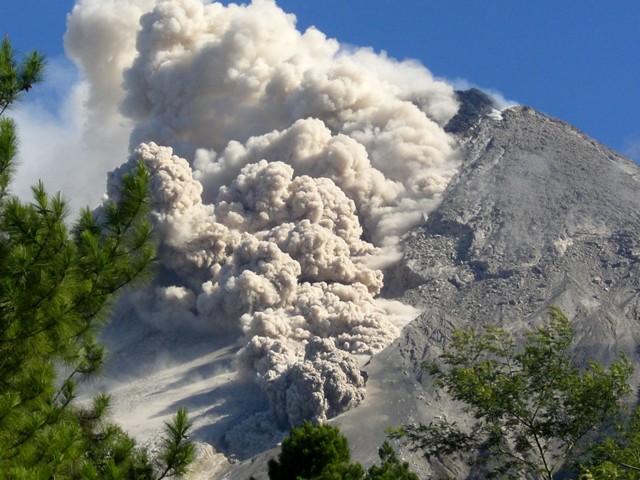 |
Figure 32. A Merapi pyroclastic flow in its early stages as seen at 08:50:53 on 10 June 2006. Photo credit to BPPTK; provided courtesy of CVGHM. |
In the period after the hazard level was raised to red, the lava dome grew and by 22 May its volume was ~ 2.3 million cubic meters. The M 6.3 earthquake in S-Central Java on 27 May triggered additional activity at Merapi. The dome's growth rate increased from the previous rate of around 100,000 cubic meters/day, leading to a lava dome volume on 8 June 2006 of ~4.3 million cubic meters. That lava dome stood 116 m above the nominal summit elevation of Merapi's peak (Garuda peak).
Dome collapse created the longest pyroclastic flow of the reporting interval, which took place on 14 June 2006. That pyroclastic flow attained a run-out distance of 7.0 km (table 18, figures 33 and 34, and previously reported in BGVN 31:05).
 |
Figure 33. Deserted houses and dislodged lumber amid ash and volcanic rocks from Merapi (left-background) as seen in the village of Kaliadem (E of Kinahrejo near Bebeng, on the SE flank ~ 5 km from the summit) shortly after the 14 June 2006 pyroclastic flows passed through the settlement. Courtesy of Agence France Presse (photo by Tarko Sudiarno). |
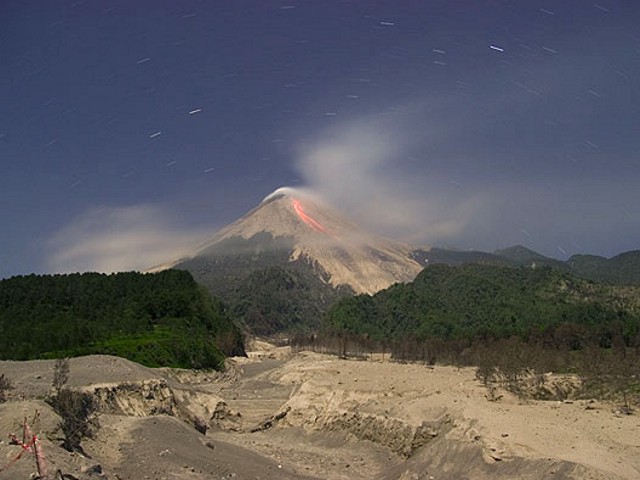 |
Figure 34. Night photo of Merapi (unknown date) showing incandescence on the slopes and, in the foreground, the large pyroclastic flow deposited on 14 June 2006. This photo is taken from nearly the same spot as the photos of 27 May (figure 30, above). Copyrighted photo used with permission of Tom Pfeiffer. |
At least in part owing to loss of topographic relief at the Gegerbuaya ridge along the S crater wall (figure 27), the 14 June pyroclastic flow took a different path. It crossed the former barrier and descended the Gendol drainage. As previously noted (BGVN 31:05), the 14 June pyroclastic flow took two lives when the underground bunker where the victims sought refuge was buried by the pyroclastic flow.
The bunker overridden on 14 June resides in Kaliadem village (~ 5 km SE of the summit). News stories showed pictures of the rescue attempt with initial digging commencing using picks and shovels, with the excavation by soldiers wearing dust masks and standing on boards or wooden platforms, presumably to reduce the heat flow from the fresh deposit. The article also noted that the soldiers wore heat-retardant clothes. A report from the Taipei Times of 16 June 2006 and credited to the Associated Press said that "The fierce heat melted the troops' shovels and the tires on a mechanical digger brought in to plow through more than 2 m of volcanic debris covering the bunker, built for protection from volcanic eruption . . .." Later news reports noted that authorities unearthed the bunker, which lay beneath more than 2 m of steaming pyroclastic flow deposit. The two bodies had suffered burns and the facility's door was ajar. A BBC report showed deeper portions of the hole being excavated by a large backhoe. They also noted that upon deeper excavation a probe into the deposit with a hand-held digital thermometer apparently indicated temperatures reached ~ 400°C. Several grim photographs circulated in the press showing the excavated entrance of the bunker and a team in the process of removing the victim's bodies. No report has been found discussing the exact reason for the bunker's failure, although several comments in the press suggested it was not designed to withstand burial by a pyroclastic flow.
Prior to that, on 13 June, the alert status dropped to orange, but it rose back to red again the next day after the pyroclastic flow and increases in multi-phased earthquakes. Activity remained stable but high through June 29 but began to decrease after 30 June. During July the intensity and frequency of pyroclastic flows and rock falls decreased. On 10 July, authorities reduced the alert status to orange on all but the S slopes. By the end of July 2006, pyroclastic flows had ceased.
Merapi's long-term dome growth continued at low to modest levels during the rest of 2006 and early 2007. The Darwin Volcanic Ash Advisory Center noted a plume to 6.1 km altitude drifting NE on 19 March 2007. These later incidents will be discussed in more detail in a forthcoming issue of the Bulletin.
MODVOLC Thermal Alerts. The Hawai'i Institute of Geophysics and Planetology MODIS Thermal Alert System web site lacked any thermal alerts for over a year preceding May 2006. Thermal alerts over Merapi began 14 May 2006 and extended through early September 2006 on nearly a daily basis. The alerts continued intermittently into 2007.
Reference. United Nations, 2006, Indonesia Earthquake 2006 Response Plan: United Nations, OCHA Situation Report No. 5, Issued 31 May 2006, GUDE EQ-2006-000064-IDN, 42 p.
Information Contacts: Center of Volcanology and Geological Hazard Mitigation (CVGHM), Jalan Diponegoro 57, Bandung 40122, Indonesia (URL: http://vsi.esdm.go.id/); United Nations-Office for the Coordination of Humanitarian Affairs (OCHA), United Nations, New York, NY 10017, USA; National Earthquake Information Center, US Geological Survey, PO Box 25046, Denver Federal Center MS967, Denver, CO 80225, USA (URL: http://earthquake.usgs.gov/); Darwin Volcanic Ash Advisory Centre (VAAC), Bureau of Meteorology, Northern Territory Regional Office, PO Box 40050, Casuarina, Northern Territory 0811, Australia (URL: http://www.bom.gov.au/info/vaac/advisories/); John Pallister, Volcano Disaster Assistance Program, USGS Cascades Volcano Observatory, 1300 SE Cardinal Court, Suite 100, Vancouver, WA 98683-9589, USA (URL: http://volcanoes.usgs.gov/); Tom Pfeiffer and Martin Rietze, Volcano Discovery (URL: http://www.decadevolcano.net/), http://www.tboeckel.de/); Tarko Sudiarno, Agence France Presse (AFP) (URL: http://www.afp.com/english/home/); Taipei Times (URL: http://www.taipeitimes.com/); Associated Press (URL: http://www.ap.org/); Hawai'i Institute of Geophysics and Planetology (HIGP) Thermal Alerts System, School of Ocean and Earth Science and Technology (SOEST), Univ. of Hawai'i, 2525 Correa Road, Honolulu, HI 96822, USA (URL: http://modis.higp.hawaii.edu/).
Lava dome growth with intermittent ash plumes and rock avalanches
Our last report on Merapi (BGVN 32:02) described vigorous dome growth during March-July 2006. The increasingly unstable summit was the scene of numerous pyroclastic flows, avalanches, and volcanic earthquakes. According to the Center of Volcanology and Geological Hazard Mitigation (CVGHM), Merapi's long-term dome growth continued at low to modest levels during the rest of 2006 and early 2007.
Activity in May 2006 included dome growth (figures 35 and 36) and pyroclastic flows (figure 37). According to CVGHM, as a result of decreasing activity, the Alert Level was lowered to 3 (on a scale of 1-4) for all areas on 17 July 2006 and to Level 2 on 3 August 2006. Nearly continuous thermal anomalies were measured by the MODIS/MODVOLC satellite system during the period 14 May-5 September 2006, and small anomalies were noted on 29 November 2006 and 5 January 2007. No thermal anomalies for Merapi have been measured by MODIS since 5 January 2007. The Darwin Volcanic Ash Advisory Center (VAAC) noted a plume to 6.1 km altitude drifting NE on 19 March 2007 (table 19).
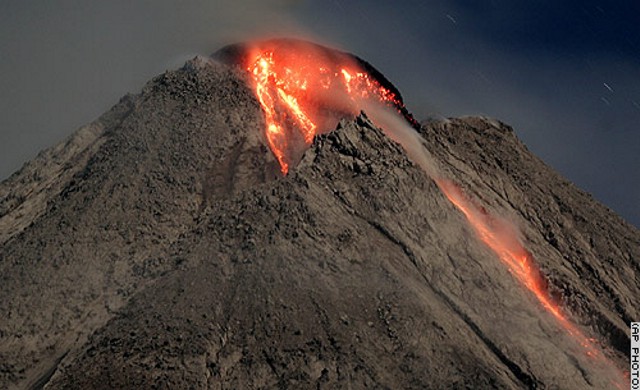 |
Figure 35. Incandescent blocks stream down the growing lava dome on 15 May 2006. Courtesy of Discover Indonesia Online (Associated Press photo). |
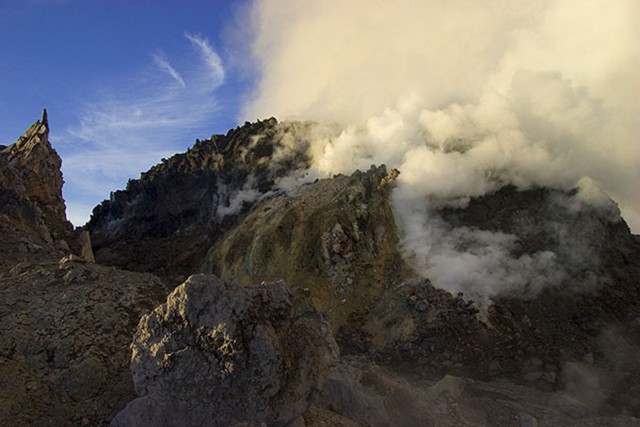 |
Figure 36. Newly extruded dome lava on the summit of Merapi seen from the N side on 21 May 2006. Courtesy of Tom Pfeiffer (Volcano Discovery). |
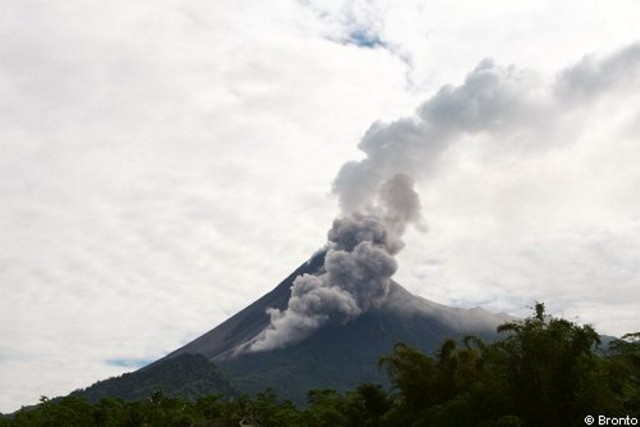 |
Figure 37. Merapi erupting on 23 May 2006 as seen from Cangkringan, near Yogyakarta. The image captured a pyroclastic flow. Courtesy of Discover Indonesia Online. |
Table 19. Ash plumes and other events associated with Merapi between 5 July 2006 and 15 November 2008. Distances given under "Other events" represent maximum distances observed. Plume altitudes through 1 August 2006 were calculated from CVGHM information; subsequent plume altitudes were reported by the Darwin VAAC. Courtesy of CVGHM, Darwin VAAC, and various newspaper articles.
| Date | Plume altitude | Other events |
| 05 Jul-11 Jul 2006 | 4 km | -- |
| 12 Jul-18 Jul 2006 | 4 km | Lava flows, 2 km SE |
| 19 Jul-25 Jul 2006 | 3.4 km | Daily lava flows, 1.5 km SE. |
| 26 Jul-01 Aug 2006 | 3.4 km | Incandescent rock avalanches, 2 km SE. |
| 02 Aug-04 Aug 2006 | 6.1 km | Rockfalls, 1 km SE. |
| 10 Oct 2006 | -- | Incandescent material, 1 km. |
| 20 Nov 2006 | -- | "Hot clouds," 3 km. |
| 19 Mar 2007 | 6.1 km | -- |
| 23 May-29 May 2007 | -- | Incandescent material and "hot clouds," 1 km SE. Ashfall 16 km W. |
| 09 Aug 2007 | 4.6 km | -- |
| 19 May 2008 | 11.6 km | -- |
Information Contacts: Center of Volcanology and Geological Hazard Mitigation (CVGHM), Jalan Diponegoro 57, Bandung 40122, Indonesia (URL: http://vsi.esdm.go.id/); Darwin Volcanic Ash Advisory Centre (VAAC), Bureau of Meteorology, Northern Territory Regional Office, PO Box 40050, Casuarina, NT 0811, Australia (URL: http://www.bom.gov.au/info/vaac/); Hawai'i Institute of Geophysics and Planetology (HIGP) Thermal Alerts System, School of Ocean and Earth Science and Technology (SOEST), University of Hawai'i, 2525 Correa Road, Honolulu, HI (URL: http://hotspot.higp,hawaii.edu); Discover Indonesia Online (URL: http://www.indahnesia.com/); Tom Pfeiffer, Volcano Discovery (URL: http://decadevolcano.net/).
Eruption started 26 October 2010; 386 deaths, more than 300,000 evacuated
This report represents a preliminary discussion of the deadly eruption at Merapi that started on 26 October 2010. That eruption included weeks of instability that generated pyroclastic (block-and-ash) flows, which became particularly vigorous and numerous in early November, with at least one surge reportedly traveling along the Gendol drainage to 15-16 km from the summit dome. Of particular note from a hazards perspective, the path of some of these deposits differed at times from those of the recent past (but we have yet to find maps showing the flow directions and associated dates). An abstract by Lavigne and others (2011) reported the volume of tephra erupted in the 2010 eruption at over 100 x 106 m3, ~10-fold higher than similar deposits after typical eruptions in the past few decades, and among the factors why ongoing lahars are likely to be a hazard.
Our summary covers events into late 2010, with recognition of ongoing seismicity, weaker emissions, and repeated lahars in early 2011. The bulk of this report is based on those from the Indonesian Center of Volcanology and Geological Hazard Mitigation (CVGHM) and their observatory dedicated to Merapi (MVO). According to CVGHM, the 2010 eruption was the biggest since the 1872 eruption. Eruptions in 1930 killed around 1,300 people. The last eruption of Merapi occurred during March 2006-August 2007 (BGVN 31:05, 31:06, 32:02, and 33:10). A table appears near the end of this report summarizing some key events and observations. Fatalities and scale of evacuations are discussed in a separate subsection below. Another subsection notes that at least one commercial airliner sustained serious in-flight engine damage.
Regional background and prior eruptive patterns. Merapi (figures 38, 39, and 40) is located in the central part of Java, and this region and the island as a whole have extremely high population density (roughly double that of Japan or Thailand). Substantial numbers of people live or vacation on the mountain. The most densely settled part of the mountain is the dangerous S side (figure 39).
 |
Figure 38. (Bottom) Two maps showing Merapi's location and (on the larger map) the distribution of block-and-ash flows that took place during 1954-1998. During that interval, these deposits went to the NW, W, and SW. From Hort and others (2006). |
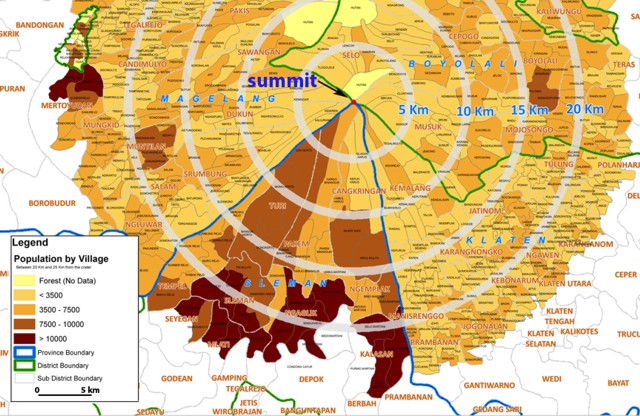 |
Figure 39. A map of the S portion of Merapi showing population data in shaded patterns with key at left. The segments of circles depict distances from the summit. The 2010 eruptions sent pyroclastic flows through Merapi's SE quadrant, thus passing areas of elevated population. Taken from OCHA (8 November 2010). |
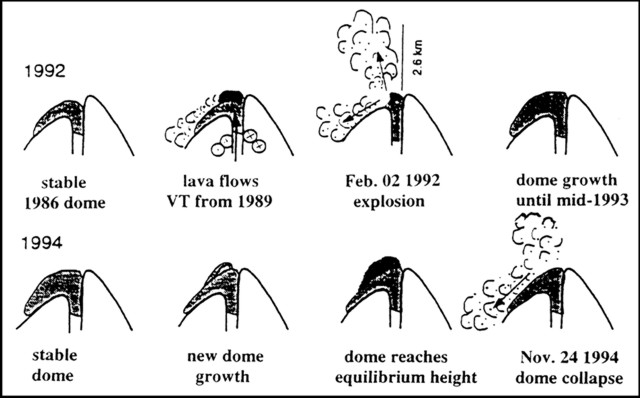 |
Figure 40. A set of simple diagrams illustrating Merapi in cross section (looking W; S is to the left) summarizing behavior that occurred during 1986-1994 (such a diagram has yet to be published for the 2010 eruption). The 1989 case shows VT earthquakes in the edifice (circles containing crosses). Taken from Ratdomopurbo and Poupinet (2000). |
Figure 38 provides a summary of block-and ash-flow deposits from 1954-1998 (Hort and others, 2006; Schwarzkopf, 2001). The eruptions starting in October 2010 sent pyroclastic flows and possible surges at least 15 km in the volcano's W to S quadrant. Block-and-ash flows are pyroclastic flows formed by dome collapse and containing a substantial amount of broken dome fragments.
The inset map at the lower left shows Merapi with respect to the city of Yogyakarta (30 km SSW). Although the metro area of that city has a population of 1.6 million residents, the Indonesian statistical bureau estimated the 2010 populations of the ~30 km2 city of Yogyakarta at ~396,000 residents, and the broader region at ~3.5 million residents.
Figure 39 shows the summit and S part of Merapi, plotting population data by village at distances up to 20-25 km from the summit. This side of the volcano is by far the most densely populated, and was also crossed by numerous pyroclastic flows both historically and in the 2010 eruptions.
Figure 40 illustrates critical processes in Merapi's mode of eruption in the recent past. A significant portion of the dome is unconfined by the summit crater and the S side is free to descend the volcano's upper slopes endangering residents below. In the recent episode, CVGHM benefitted from daily access to satellite radar imagery that reliably depicted dome morphology despite weather and steam clouds. Vöge and Hort (2008) and Hort and others (2006) discuss monitoring dome instability using Doppler radar.
Monitoring and lead-up to the 26 October 2010 eruption. Since 2007, short swarms of volcanic earthquakes occurred (eg., on 31 October 2009, 6 December 2009, and 10 June 2010). Monitored parameters, including earthquakes, deformation, and gas emmisions increased significantly during September 2010. Steeper increases in seismicity appeared during 15-26 October with the main ramp-up during 20-26 October.
Figure 41 shows several histograms that depict Merapi seismic data and summarize the variations in hazard status. The CVGHM scale, which stretches from 1 (low) to 4 (high), makes a complete ascent and partial descent through the full range of those levels during the date range shown. The heavy vertical line between Alert Levels 3 and 4 took place on 25 October, slightly before the onset of the major eruption on 26 October.
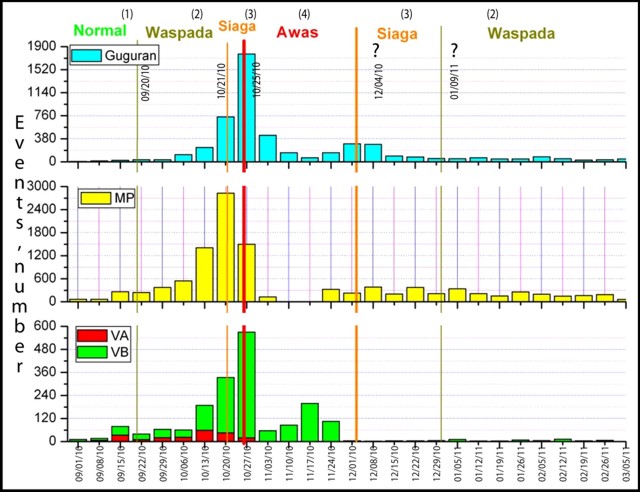 |
Figure 41. Three histograms describing Merapi seismicity during 1 September 2010 to 6 March 2011. Horizontal scale marked in weeks and extends from 1 September 2010 to 5 March 2011. Words along the top line show hazard status (on an increasing scale starting from 1 [Normal] and extending to 2 [Waspada]), to 3 [Siaga]), and finally to 4 [Awas] and then declining). The top panel contains seismically inferred rockfalls and avalanches (guguran in Indonesian). The middle panel shows multiphase (MP) earthquakes (shallow source, dominant frequency ~1.5 Hz). The bottom panel shows volcanic earthquakes of both A- and B-type (where VTA represents deep volcano-tectonic earthquakes, 2.5-5 km below the summit; VTB represents shallow volcano-tectonic earthquakes, less than ~1.5 km below the summit). Taken from CVGHM report of 7 March, with minor revisions by Bulletin editors. |
Figure 42 presents typical waveforms for various types of earthquakes and tremor signals previously recorded at Merapi (Ratdomopurbo and Poupinet, 2000). Both multiphase (MP) and volcanic type-A (VTA) showed strong peaks in seismicity prior to the 26 October eruption's onset. Rockfalls on upper panel (labeled guguran) and type-b events on bottom panel both peaked on or near 26 October.
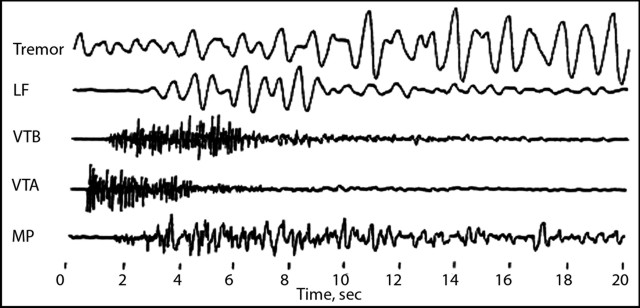 |
Figure 42. Typical waveforms, tremor signals, and descriptive seismic terminology in use at Merapi. These include tremor, LF-low frequency (earthquakes nominally from shallow sources, dominant frequency between 3 and 4 Hz), VTA and VTB (volcano-tectonic A and B, where VTA represents deeper volcano-tectonic earthquakes, 2.5-5 km below the summit; and VTB represents shallower volcano-tectonic earthquake, less than ~1.5 km below the summit), and MP-multiphase earthquakes. Records are from Station PUS (~0.5 km E of summit), shown in the upper part of the figure, and from Station DEL (~3 km SE of the summit), in the lower part. From Ratdomopurbo and Poupinet (2000). |
The onset of the 26 October explosion occurred ~19 hours after an M 7.7 tectonic earthquake along the trench near the Mentawai islands adjacent to Central Sumatra, 1,200 km NW of Merapi. This earthquake was followed by several aftershocks, including two prior to the eruption (M 6.1 and 6.2) and one after the eruption (M 5.8). One or more of these earthquakes triggered tsunamis that hit the remote Mentawai islands, sweeping entire villages to sea and killing at least 428 people. There, too, thousands of people were displaced. The two near-simultaneous crises taxed authorities, NGOs, and the natural hazards community (figure 43).
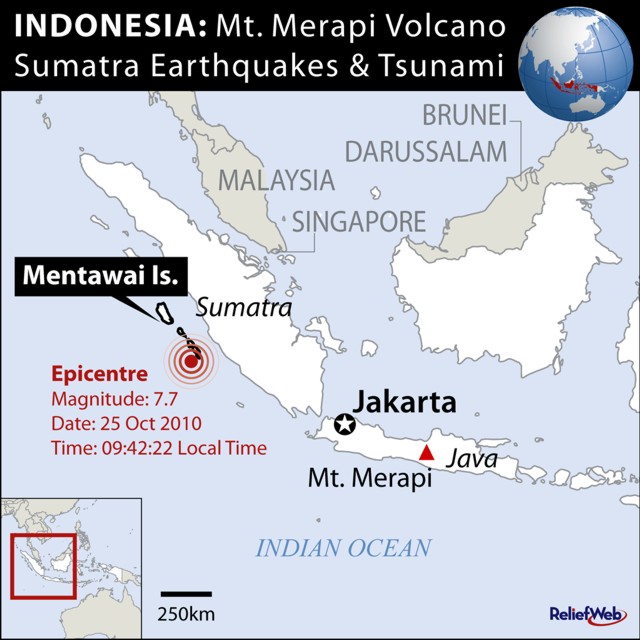 |
Figure 43. A map emphasizing the locations of the M 7.7 tsunamigenic (tsunami-generating) earthquake and the eruption onset at Merapi, events of 25 and 26 October, respectively. (The earthquake time stated is incorrect—according to USGS cataloging, it registered at 1442 UTC on the 25th, which corresponds to 2142 local time that day. The eruption began at 1002 UTC on the 26th). Jakarta is Indonesia's capital. Courtesy of Relief Web. |
Except for the close timing and regional proximity, the linkage between the M 7.7 earthquake and the eruption remains ambiguous. However, many researchers have noted that tectonic earthquakes can seemingly trigger volcanic responses (eg., Delle Donne and others, 2010; Lowenstern, JB, Smith, RB, and Hill, DP, 2006; Manga and Brodsky, 2006).
In early September 2010, the pattern of increased volcanic seismicity began to appear with MP earthquakes averaging 10/day and VTA and VTB averaging 3/day, with a total daily seismic energy of 603 x 1012 erg.
Gas analyses in August 2010 showed concentrations of HCl of 0.8 % mol and H2O of 80 % mol. Declining levels of H2O (less than 90 %) and increased levels of HCl (>0.5 %) were interpreted to indicate increased activity.
In September, summit inflation increased markedly. Seismicity also increased beginning on 12 September, when an M 2.5 VTA earthquake and pyroclastic flows/avalanches occurred. On 13 September, VTA earthquakes occurred twice, and white plumes rose 800 m above the crater.
During 23-26 October, there were small steam-and-ash emissions. Inflation increased sharply on 24 October to a rate of 420 mm/day. The next day, CVGHM raised the Alert Level to 4, and recommended immediate evacuation for several communities within a 10-km radius. A Reuters photo by Dwi Oblo taken at sunrise on 26 October looking up at the dome and the prominent S-trending avalanche channel revealed comparatively calm conditions, with emissions consisting of a thick white steam plume blowing W from the dome.
Initial October eruptions. The first eruption occurred at 1702 on 26 October 2010, an event characterized by explosions and multiple pyroclastic flows that traveled S ~8 km down the Gendol and Kuning drainages, and to some extent WSW down the Bedog drainage. Most of the pyroclastic flows lasted 2-9 minutes, but the eruptions associated with the final two each lasted 35 minutes. The event killed 35 people including the renowned mystical guardian of Merapi, Mbah Mbahmarijan, at 7 km distance.
Figure 44 shows an exposed ridge affected by pyroclastic flows in a photo taken on 27 October.
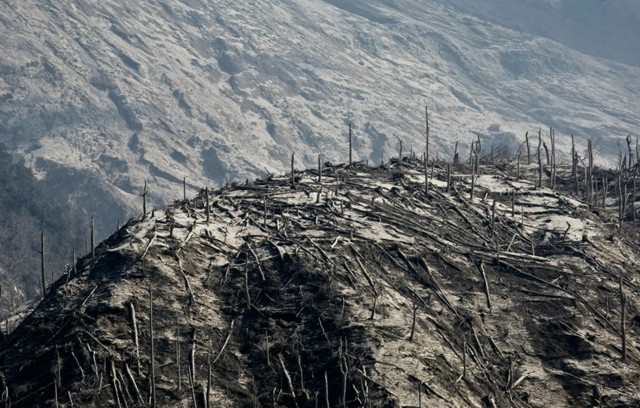 |
Figure 44. An exposed ridge at Merapi as it appeared the day after the 26 October eruption. Pyroclastic flows had reduced forest to stumps, leaving stripped and fallen trees. Courtesy of The Boston Globe website of Merapi photos (Ulet Ifansasti/Getty Images). |
According to the Darwin Volcanic Ash Advisory Center (VAAC), an ash plume rose to an altitude of 18 km, followed by extrusion of lava in the summit crater.
By 27 October the lava dome had sustained damage and a new 200-m-diameter crater had formed at the summit. After that, lava extrusions built a small dome in the crater. A space-based estimate made from the ozone monitoring instrument (OMI) indicated the eruption on the 26th vented at least 3,000 metric tons of SO2 gas. According to the Darwin VAAC, ground-based reports indicated that another explosion occurred on 28 October 2010. Cloud cover prevented satellite observations.
Following the eruption and continuing through 4 November, intense tremor took place. It was felt by people up to 20 km from the volcano.
CVGHM reported that two pyroclastic flows occurred on 30 October following an early morning explosion, the third since 26 October. According to a news article, ash fell in Yogyakarta, 30 km SSW, causing low visibility. CVGHM noted four pyroclastic flows on 31 October.
Stronger eruptions in November. According to CVGHM, during 31 October-4 November, a lava dome grew rapidly within Merapi's summit crater. Collapses from the S side of the dome fed minor pyroclastic flows that extended several hundred meters into the upper part of the Gendol valley.
On 1 November, an explosion began mid-morning with a low-frequency earthquake, and avalanches occurred. About seven pyroclastic flows occurred during the next few hours (figure 45), traveling SSE a maximum runout distance of 4 km, and in another (possibly later) case that day, 9 km. The Darwin VAAC reported that the explosion produced an ash plume that rose to an altitude of 6.1 km. News reports noted flight diversions and cancellations in and out of the airports serving Solo (40 km E) and Yogyakarta.
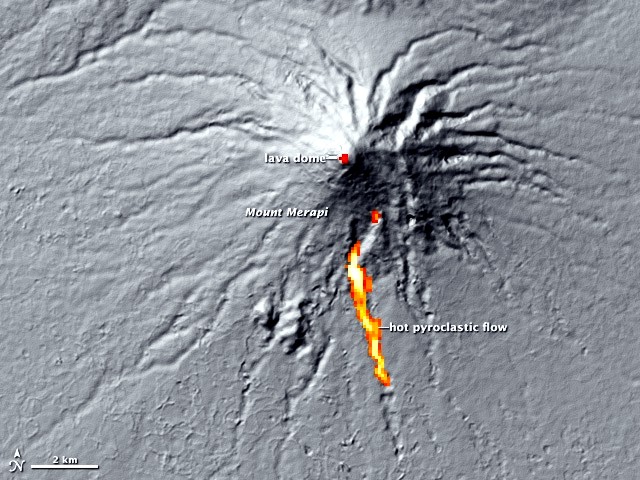 |
Figure 45. On 1 November 2010, the Advanced Spaceborne Thermal Emission and Reflection Radiometer (ASTER) on NASA's Terra satellite captured this thermal signature of Merapi's lava dome and hot pyroclastic flows. The thermal information is overlaid on a three-dimensional map of the volcano to show the approximate location of the pyroclastic flow. The three-dimensional data is from a global topographic model created using ASTER stereo observations. Courtesy of NASA Earth Observatory website (credit to Robert Simmon and Jesse Allen and NASA/GSFC/METI/ERSDAC/JAROS, and the U.S./Japan ASTER Science Team). Original caption by Holli Riebeek. |
On 2 November, an ash plume was seen in satellite imagery drifting 75 km N at an altitude of 6.1 km. On the same day, CVGHM reported 26 pyroclastic flows. On 3 November, observers stationed at multiple posts reported ash plumes from pyroclastic flows. One pyroclastic flow traveled 10 km, prompting CVGHM to extend the hazard zone from a radius of 10 km to 15 km, and they recommended evacuations from several more communities. Another pyroclastic flow traveled 9 km SE later that day. Figure 46 shows a 2 November view of Merapi.
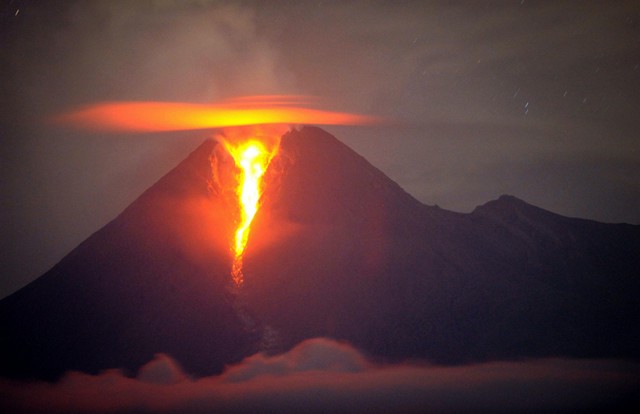 |
Figure 46. Incandescent material spilled from Merapi's dome glows orange-red in colored versions of this long-exposure photograph taken on 2 November 2010 from ~25 km SSE of the summit (Klaten district). Condensate droplets in the thin (lenticular) clouds over the summit also reflect considerable light. Courtesy of The Boston Globe (Boston.com website); photo credit to Sonny Timbelaka (AFP/Getty Images). |
CVGHM reported that, during 3-8 November, the eruption from Merapi continued at a vigorous pace, characterized by incandescent avalanches from the lava dome, pyroclastic flows, ash plumes, and occasional explosions.
Visual observations were often difficult due to inclement weather and eruption plumes. To overcome these challenges, people working on the crisis gained regular access to satellite radar data of high resolution (RADARSAT2). That data was made available 25 October through an agreement called the International Charter Space and Major Disasters.
According to the NASA Earth Observatory website, the strongest explosion during the 2010 eruption took place on 4-5 November, lasting more than 24 hours, when plumes rose to ~18 km altitude and drifted 110 km W. They claimed that some surges of pyroclastic material reached an 18 km runout distance (direction and damage unstated and several kilometers longer than some other observations). They also said that, according to local geologists, this explosion was the most violent one at Merapi since the 1870's. They noted that, by some estimates, the 4-5 November eruption was five times more intense than the one on 26 October.
A CVGHM report on the 4-5 November eruption stated that 38 pyroclastic flows had occurred before it ended. Although dense fog hampered visual observations, a CVGHM observer from Kaliurang post (~7 km S of the summit) saw 19 of those 38 flows travel ~4 km S. Another traveled 9 km SE. Ashfall was noted in some nearby areas. Satellite data indicated this explosion released much more SO2 than previous recent Merapi eruptions, ~300,000 metric tons.
Residents in towns up to 240 km away reported that 'heavy gray ash' blanketed trees, cars, and roads. On 5 November, rumbling sounds were heard in areas 30 km away, and pyroclastic flows continued to descend the flanks. Ash fell in Yogyakarta and "sand"-sized tephra fell within 15 km. CVGHM recommended evacuations from several more towns within a 20-km radius. Observations shortly after the 5 November eruption showed that the large lava dome of the previous week had been destroyed, and the summit crater had enlarged to a diameter of 300-400 m. However, by 6 November, another lava dome had grown, amassing, according to RADARSAT images 11 hours apart, at a rate of ~35 m3 per second.
Activity remained very intense on 6 November. Pyroclastic flows continued to descend the flanks; one flow traveled 4 km down the Senowo drainage to the W. Incandescent flashes from the lava dome were reported from observations posts, and incandescent material was ejected above the crater. Incandescent avalanches traveled 2 km down multiple drainages to the SSE, S, and SSW. The Darwin VAAC reported that ash plumes seen in satellite imagery rose to an altitude of 16.8 km on 5 and 6 November.
During this period, ashfall was heavy on Merapi's flanks, and was observed in multiple surrounding areas, including the villages of Selo (~5 km NNE) and Magelang (26 km WNW). In Muntilan village (18 km WSW), tephra and ash accumulated up to 4 cm. At the volcano, a new dome formed during 6-7 November 2010; it stood ~240 m in a NW-SE orientation, 140 m wide, and 40-50 m high.
On 7 November, the number of pyroclastic flows increased from the previous day. An explosion was heard, and ash plumes rose 6 km and drifted W. Lightning was seen from Yogyakarta. Pyroclastic flows traveled 5 km, and lava avalanches moved 600 m S and SW. The next day, ash plumes rose to altitudes of 6-7 km and were accompanied by rumbling sounds. According to the Darwin VAAC, satellite imagery during 7-8 November showed ash plumes at an altitude of 7.6 km drifting 165-220 km W and SW.
Figure 47 shows Merapi's erupted SO2 in the atmosphere during 4-8 November 2010. On 9 November, an SO2 cloud was seen over the Indian Ocean at altitudes of 12-15 km.
 |
Figure 47. SO2 concentration-pathlength (in Dobson units, with 100 DU as darkest colors) during 4-8 November 2010, as observed by the OMI on NASA's Aura spacecraft. OMI data provided courtesy of Simon Carn (Michigan Technical University). Courtesy of Natural Hazards NASA Earth Observatory website (image by Jesse Allen, and original caption by Michon Scott). |
The European Space Agency (ESA) has created updates on SO2 gas retrieval from their Envisat, Eumetsat's MetOp, and NASA's Aura satellites. For the interval 4-13 November 2010, the peak atmospheric loading of SO2 appeared on 8 November at 227 kT SO2. The estimates can be seen presented as animations that depict complex rotating dispersal patterns. As seen in figure 47, significant portions of the gas blew over Western Australia. In Norwegian Institute for Air Research models shown in the article, many of the Merapi plumes centered around 15 km altitude, with tops and bottoms ~5 km above and below that height.
ESA (2010) quoted Andrew Tupper as saying, "The updates from ESA have been very useful to Darwin VAAC [Volcanic Ash Advisory Center] when received in real time, and we expect that in the post-event analysis we'll be able to show lots more potential value." The SO2 maps can help the aviation community avoid dangerous emissions from volcanoes.
ESA (2010) noted that they send SO2 email alerts in near-real time. The alerts link to a web page with a map showing the location of the sulphur dioxide peak.
Reduced eruptive vigor; lahars. Eruptions and seismicity generally dropped during mid-November 2010 into March 2011, but lahars became a problem. On 9 November, CVGHM noted a reduction in the intensity of activity; a single pyroclastic flow occurred in a 6-hour period. Rumbling sounds were accompanied by an ash plume that rose to an altitude of 4.5 km, and ashfall was reported in Selo (~5 km NNE). Lava-dome incandescence was again observed, and lava avalanches moved 800 m SSE.
During 10-11 November, seismicity continued to decrease. Lahar deposits were seen in multiple drainages, at a maximum distance of 16.5 km from the summit. On 10 November, plumes generally rose 0.8-1.5 km above the crater. Heavy ashfall was reported in areas to the WSW and WNW. A 3.5-km-long pyroclastic flow and a 200-m-long avalanche both traveled S in the Gendol drainage. Incandescence from the crater was observed through a closed-circuit television system at the Merapi museum (in the village of Kaliurang, ~7 km S of the summit). On 11 November, roaring was followed by light ashfall at the Ketep Merapi observation post, ~9 km NW of the summit. Plumes, brownish-black at times, rose 800 m above the crater and drifted W and NW, and one plume rose 1.5 km. Avalanches again proceeded S in the Gendol drainage.
According to the Darwin VAAC, during 12-21 November, ash plumes rose as high as 7.6 km and drifted in multiple directions. The SO2 concentration at high altitudes decreased. About 300,000 residents also began to return home after the "danger zone" was reduced in some areas due to decreased activity.
Between 10 November and 1 December, lahar deposits were seen in multiple drainages and in all rivers flowing from Merapi. CVGHM noted that several bridges had been damaged. On 29 November, a narrow tongue of lava was observed, and light-colored flow deposits extended S down several narrow channels (Gendol and Kuning drainages) at least 5 km from the summit.
According to CVGHM, seismicity declined further during 1-3 December, in number of volcanic earthquakes and their associated energy. Deformation measurements were either stable or did not show significant changes. Although fog often prevented visual observations, gas plumes were seen rising 500 m above the crater and drifting W. SO2 plumes were no longer detected in satellite imagery. On 4 December, the Alert Level was lowered to 3.
On 9 January, as seismicity continued to decrease, CVGHM lowered the Alert Level to 2. Plumes continued to rise above the crater and, on 12 January, avalanches descended the Krasak drainage, traveling 1.5 km SW. Lahars and high water during 15-23 January damaged infrastructure and caused temporary road closures. On 22 January, plumes rose 175 m above the crater and drifted E.
According to a news account (vivanews.com), Merapi spewed thick white plumes as of the first week of February 2011. CVGHM reported that gas plumes rose from Merapi during 28 February-6 March. The highest plume, on 5 March, rose 100 m and drifted E. The number of MP earthquakes was slightly lower compared to the previous week.
Analysis of the lahar problem emerged as this issue went to press. According to Lavigne and others (2011) the volume of pyroclastic debris from the 2010 eruptive episode was in excess of 100 x 106 m3, ~10-fold higher than similar deposits after more conventional eruptions. These deposits and subsequent lahars filled most of the protective Sabo-dam structures. The eruption coincided with the onset of the rainy season, an interval that usually brings 4 m of rain but due to La Niña conditions, is predicted to bring more rain than usual. The 50-year absence of lahars in Kuning and Woro drainages altered the perception of risk in residents there. Thousands of sand miners work in the riverbed of all lahar-prone channels.
Fatalities and scale of evacuations. As previously noted, on 26 October, pyroclastic flows killed ~35 people who 7 km from the summit. They had refused to evacuate the village of Kinahejo (Kinahrejo).
According to the U.S. Agency for International Development (USAID) (quoting the Government of Indonesia's National Disaster Management Agency-Badan Nasional Penanggulangan Bencana or BNPB), the 2010 eruptions killed 386 people, injured 131 people, and displaced initially more than 300,000 residents (USAID, 2011). According to Relief Web, the 11,000 displaced remained unable to return to their homes at least as late as January 2011.
Lahars followed the eruptive processes and caused at least one additional death and one injury. An 11 January IRIN News article stated that " . . . more than 300,000 people have been able to return home, another 11,000 remain displaced, living with family or in camps, according to the government's National Disaster Management Agency."
According to the UN's Integrated Regional Information Networks (IRIN News), a source of humanitarian news and analysis, rainfall triggered lahars on Merapi's flanks on 3 and 9 January 2011. This caused damage to houses, farms, and infrastructure in multiple villages in the Magelang district, 26 km WNW of Merapi. One death and an injury were reported. The flooded area reportedly affected an estimated 3,000 residents but the number evacuated was unstated. The flooding on 9 January was more intense and, according to IRIN News, the Red Cross evacuated dozens of people trapped in their homes.
Referring to the larger 2010 eruption and evacuees, the same 11 January IRIN article stated that " . . . more than 300,000 people have been able to return home, another 11,000 remain displaced, living with family or in camps, according to the government's National Disaster Management Agency." This article also quoted the same agency with regard to the 386 reported deaths and the 131 injuries from the 2010 eruption.
Airlines affected. According the Jakarta Post, a total of 13 international carriers stopped their flights to Jakarta on 6 November, citing concerns about volcanic ash in the air that could cause damage to their aircraft and engines, and thus jeopardize safety. They included Malaysia Airlines, Air Asia, Singapore Airlines, Emirate, Ethihad, Turkish Air, Japan Airlines, Lufthansa, and KLM.
Andrew Tupper at the Australian Bureau of Meteorology notified us that Indonesian media reported that a plane encountered a volcanic cloud N of Java ascribed to Merapi on 28 October 2010. The suspected ash-plume encounter occurred at altitudes in the range 9.1-11.6 km. An engine stall message alerted the crew, who also noted a strong burning odor that disappeared as the plane descended from 9.1 to 6.1 km altitude.
According to another news account (Kompas.com), possibly reporting the same incident, on 28 October, a Garuda Indonesia airplane with 383 passengers from Solo, Central Java, landed safely at Hang Nadim Airport, Batam, a scheduled refueling stop. Enroute, volcanic ash from Merapi had been sucked into the left engine of the Airbus 330 aircraft, disrupting the engine. Richard Wijaya, Operational Duty Manager of Garuda Indonesia in Batam, explained that the pilot had notified ground staff of the disruption before landing, and as soon as they landed in Batam, the engine was checked. The crew cancelled the next leg of the scheduled flight to Jeddah, Saudi Arabia.
On 2 November, an unspecified number of international airlines had to cancel flights to airports at Solo and Yogyakarta, as plumes blackened the sky. Poor visibility and heavy ash on the runway caused the cancellations. According to an ABC news report, Yogyakarta airport reopened on 20 November after being closed for ~2 weeks.
Data table. Table 20 summarizes currently available CVGHM reports on Merapi's behavior during September to 1 December 2010. In the first row, it presents some background values commonly seen at Merapi during non-eruption conditions. Seismic terminology in the table is equivalent to that seen in figure 42 (Ratdomopurbo and Poupinet, 2000). Note the rise in seismic energy on 19 September, various changes in Alert Level, and major events in bolded type. Comparative calm prevailed after early November, but lahars became a problem (see text). The table is intended to give readers an overview of the eruption rather than capture all the details.
Table 20. Preliminary summary of pyroclastic flows as well as some collateral observations, and hazard status changes relating to Merapi during early September through 22 November 2010. Pyroclastic flows (locally termed AP for awan panas, hot clouds) here are tallied both from seismic detection and visual observations, along with direction of travel. The table omits seismic data shown in figure 41. The "ber" (beruntun) refers to episodes of densely spaced signals indistinguishable from each other. Those signals were common beginning 4 November and complicated assessments of tremor (not shown). The pre-eruption seismic energy was less than 342 x 1012 erg (normal, non-eruptive conditions). Courtesy of CVGHM and A. Ratdomopurbo (personal communication).
| Date | Pyroclastic flows | Related comments |
| Early Sep 2010 | -- | Seismic energy, 603 x 1012 ergs |
| 19 Sep 2010 | -- | Seismic energy, ~6,000 x 1012 erg |
| 20 Sep 2010 | -- | Alert Level raised to 2 |
| 21 Oct 2010 | -- | Alert Level raised to 3 |
| 25 Oct 2010 | -- | Regional M 7.7 earthquake; Alert Level raised to 4 |
| 26 Oct 2010 | 8 [Multiple (WSW, SE)] | Initial eruption at 1702 LT |
| 30 Oct 2010 | 2 | Second explosive eruption; ashfall in city of Yogyakarta |
| 31 Oct 2010 | 4 | Eruption |
| 01 Nov 2010 | 7 during several hr | -- |
| 02 Nov 2010 | 26 | Eruption; 9 and 10 km runout distances |
| 03 Nov 2010 | 38 [At least 19 (S)] | Eruption |
| 04 Nov 2010 | ber [Multiple] | Eruption (over 24 hours) |
| 05 Nov 2010 | ber [Multiple] | 4-5 Nov. eruption was largest 2010 eruption (ash plume to 16.8 km asl); runout distances of ~18 km(?); widespread ash fall; dome destruction |
| 06 Nov 2010 | 5 [Multiple] | Eruption, rapid dome extrusion |
| 07 Nov 2010 | ber [Multiple] | Eruption |
| 08 Nov 2010 | 7 | Eruption |
| 09 Nov 2010 | 2 [1 in 6 hr period] | Weaker eruption |
| 10 Nov 2010 | 1 [At least 1 (S)] | Weaker eruption |
| 11 Nov 2010 | 1 [At least 1 (S)] | Weaker eruption |
| 14 Nov 2010 | 2 [0 (none)] | Weaker eruption |
| 15 Nov 2010 | [1] | Weaker eruption |
| 16 Nov 2010 | [1] | Weaker eruption |
| 22 Nov 2010 | [5] | Eruption |
References. Delle Donne, D., Harris, AJL, Ripepe, M, and Wright, R., 2010, Earthquake-induced thermal anomalies at active volcanoes, Geology, Sept. 2010; v. 38; pp. 771-774 [DOI: 10.1130/G30984.1].
European Space Agency (ESA), 2010, Satellites tracking Mt Merapi volcanic ash clouds, ESA News (online; 15 November 2010) (URL: http://www.esa.int/esaCP/SEMY0Y46JGG_index_0.html).
Hort, M, Vöge, FM., Seyfried, R, and Ratdomopurbo, A, 2006, In situ observation of dome instabilities at Merapi volcano, Indonesia: A new tool for volcanic hazard mitigation, Journal of Volcanology and Geothermal Research, v. 154, no. 3-4, p. 301-312.
Lavigne,F, de Bélizal, E, Cholik, N, Aisyah, N, Picquout, A, and Wulan Mei, ET, 2011, Lahar hazards and risks following the 2010 eruption of Merapi volcano, Indonesia, Geophysical Research Abstracts, v. 13, EGU2011-4400, 2011, EGU General Assembly 2011.
Lowenstern, JB, Smith, RB, and Hill, DP, 2006, Monitoring super-volcanoes: geophysical and geochemical signals at Yellowstone and other large caldera systems, Phil. Trans. R. Soc. A, 15 August 2006, v. 364, no. 1845, p. 2055-2072.
Manga, M. and Brodsky, E, 2006, Seismic triggering of eruptions in the far field: volcanoes and geysers, Annual Review of Earth and Planetary Sciences, v. 34, p. 263-291 [DOI: 10.1146/annurev.earth.34.031405.125125].
Ratdomopurbo, A, and Poupinet, G, 2000, An overview of the seismicity of Merapi volcano (Java, Indonesia), 1983-1994, Journal of Volcanology and Geothermal Research, v. 100, no. 1-4, p.193-214 (DOI: 10.1016/S0377-0273(00)00137-2).
Schwarzkopf, L, 2001, The 1995 and 1998 block and ash flow deposits at Merapi volcano, Central Java, Indonesia: implications for emplacement mechanisms and hazard mitigation. Ph.D. Thesis, University at Kiel, Kiel, Germany.
USAID (U.S. Agency for International Development), 2011 (February 4), Indonesia - Tsunami and Volcano, Fact Sheet 2, Fiscal Year 2011.
Vöge, FM, and Hort, M, 2008, Automatic classification of dome instabilities based on Doppler radar measurements at Merapi volcano, Indonesia: Part I. Geophysical Journal International, v. 172, no. 3, p. 1188-1206 (DOI: 10.1111/j.1365-246X.2007.03605.x).
Information Contacts: Center of Volcanology and Geological Hazard Mitigation (CVGHM), Jalan Diponegoro 57, Bandung 40122, Indonesia (URL: http://vsi.esdm.go.id/); Merapi Volcano Observatory (MVO); Darwin Volcanic Ash Advisory Centre (VAAC), Bureau of Meteorology, Northern Territory Regional Office, PO Box 40050, Casuarina, NT 0811, Australia (URL: http://www.bom.gov.au/info/vaac/); NASA Earth Observatory (URL: http://earthobservatory.nasa.gov/); U.S. Agency for International Development (USAID) (URL: https://www.usaid.gov/); Antonius Ratdomopurbo, Nanyang Technological University, Earth Observatory of Singapore, Nanyang Avenue, Singapore (URL: http://www.earthobservatory.sg/); Andrew Tupper, Australian Bureau of Meteorology (URL: http://www.bom.gov.au/); European Geosciences Union (URL: http://www.egu.eu/); Badan Nasional Penanggulangan Bencana (BNPB - Indonesian National Disaster Management Agency) (URL: http://dibi.bnpb.go.id/); Relief Web (URL: https://reliefweb.int/); Kompas News, Jakarta, Indonesia (URL: http://www.Kompas.com); The Jakarta Post (URL: http://www.thejakartapost.com/); Reuters (URL: http://www.reuters.com/); Vivanews.com (URL: http://vivanews.com/); ABC News (Australia) (URL: http://www.abc.net.au/); The Boston Globe (URL: http://www.boston.com/bigpicture/2010/11/mount_merapis_eruptions.html); IRIN News (URL: http://www.IRINnews.org/).
Recovery; intermittent activity; damaging lahars
A VEI 4 (Volcanic Explosivity Index) eruption began at Merapi volcano on 26 October 2010. Within the last 100 years, this volcano had not produced such large-magnitude explosions (Surono and others, in review; Andreastuti and others, 2011). The eruption and secondary events affected areas in all directions around the volcano; pyroclastic flows reached 4 km to the N, 11.5 km to the W, 7 km to the E, and ~15 km to the S, and explosive bombs reached 4 km from the summit in all directions (Jousset, 2010). These events included explosive central vent eruptions that caused significant changes in the summit morphology (figure 48) and according to Act Forum Indonesia, triggered evacuations of communities within a 20 km radius of the summit. In BGVN 36:1/2 we reported on preliminary damage assessments that included significant fatalities and damaged infrastructure.
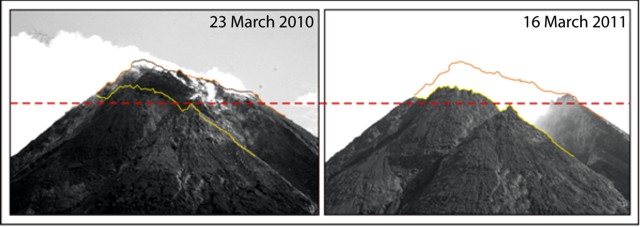 |
Figure 48. A photo comparison of Merapi's morphological changes on 23 March 2010 and 16 March 2011. Viewed from the S flank, these photos focus on the summit dome. Non-juvenile material was excavated during two episodes of explosive activity. During 26-29 October ~1.4 x 10⁶ m3 was excavated from the crater and from 4-5 November ~10 x 106 m3 was removed (Surono and others, in review). Photo courtesy of the Volcano Technical Research Center (Balai Penyelidikan dan Pengembangan Teknologi Kegunungapian, "BPPK") from their report covering 14-20 March 2011. |
The explosive events of 2010 represent a break in Merapi's iconic style of activity (Surono and others, in review). "Merapian" is a term often assigned to volcanic events characterized by hot pyroclastic block flows generated during the collapse of growing viscous lava domes (Schmincke, 2004). Standard eruptive activity at Merapi includes "continuous degassing and extrusion of andesitic lava domes whose collapses generate block avalanches and gravitational pyroclastic flows" (Allard and others, 2011).
At least 17 VEI = 2 events have occurred since the catastrophic 15 April 1872 eruption (Siebert and others, 2010). While explosive activity is characteristic of past behavior, assessments of data from 2010 confirm that the 26 October eruptive sequence did not begin with lava extrusion (typical of past eruptions). Instead, intense explosions initiated activity that lasted for ~5 weeks (Surono and others, in review).
During the Merapi special session at the EGU General Assembly held in April 2011, Andreastuti and others (2011) concluded that "the rate of magma extrusion [during the peak of Merapi's 2010 activity] was as much as 17-to 21-times higher [than] the 2006 eruption and the distance of pyroclastic flows in the same drainage (Gendol River) reached 15 km in 2010 and only 7 km in 2006."
This assessment and others (e.g. Alder and others, 2011) linked the highly explosive eruptions of October-November 2010 to elevated and variable gas emissions.
On 4 December 2010, after 40 days of maintaining the highest alert, the Indonesian Center of Volcanology and Geological Hazard Mitigation (CVGHM) downgraded the hazard Alert Level from 4 to 3 ("Awas," Red Alert to "Siaga," Watch). The Alert Level was reduced again on 19 January 2011 from 3 to 2 (to "Waspada," Advisory). The Alert Level remained at Level 2 into June 2011.
In this report we review the recovery efforts, Merapi's intermittent activity, and the long-term lahar crisis from March to June 2011. We also include a review of intervals of gas geochemistry data recorded prior to the 26 October 2010 disaster that recently became available.
Recovery efforts. Since October 2010, of the ~300,000 people evacuated, 11,000 were still displaced as of January 2011 (Jakarta Post and IRIN). Authorities had set up nine camps within the city of Yogyakarta and ~70 camps were located farther away within Central Java. On 2 May 2011 the head of Badan Nasional Penanggulangan Bencana (BNPB), Indonesia's National Disaster Management Agency, reported: "With almost all the displaced having moved to temporary shelters, our focus now is how to rebuild communities affected by the disaster" (IRIN, 2011).
In May 2011 the Indonesian government sought international aid (including the International Red Cross and United Nations) and international non-governmental organizations were working in Indonesia for relief efforts. The Jakarta Post reported on 12 May 2011 that Australia had agreed to help Indonesia establish a Disaster Relief Center for disaster management training; the location will be in Sentul, West Java and will serve members of the Association of Southeast Asian Nations (ten countries currently belong to ASEAN). BNPB had called upon the World Bank to begin a Risk Transfer scheme, allowing the local government to focus aid specifically on reconstruction programs.
According to reports from the Jakarta Globe in April 2011, the recent disaster and long history of volcanism at Merapi prompted the Indonesian government to implement an extensive recovery plan for the Yogyakarta province. They prioritized the development of spatial planning maps, expansion of the Merapi National Park, large-scale reforestation (approximately 1,300 hectares), and allocation of 1.35 trillion Rupiah ($155 million) to improve housing, infrastructure, social efforts, and economic stimulation plans. New mapping in the province will reassign land-use and designate relocation sites for former residents. In general, residential areas lying within 10 km of the summit will remain off limits (Sayudi and others, 2010). The Jakarta Post noted these maps also highlight where reforestation will occur. Impacts were substantial to Merapi National Park which lost up to 2,800 hectares out of 6,410 hectares of forest due to the recent eruptions. The Volcano Technical Research Center (BPPTK) reassessed zones in the Sleman region, the area hardest hit by volcanic activity, and will release a map indicating hazard zones. "[These maps] will show which areas are safe, unsafe and suitable for habitation," stated Sleman administration spokeswoman Endah Sri Widiastuti (Jakarta Post).
A controversial location within the 10 km exclusion zone is the village of Kinahrejo, the former home of spiritual leader Mbah Maridjan, called the guardian of Merapi. Working with a team of 17 respected community members, he preserved traditional ceremonies and local culture for Merapi residents. Pyroclastic flows covered the village on 26 October 2010, taking the life of the guardian and other inhabitants who did not evacuate.
The new guardian is Mbah Maridjian's son, Asihono (his new name: Mas Lurah Suraksosihono). During Merapi's disastrous eruptions of October and November, Asihono cooperated with the local government and agencies including the Volcanology and Geological Disaster Mitigation Agency (PVMBG) and BPPTK. On 4 April 2011 Sultan Hamengku Buwono X elected Asihono from a group of eight candidates. In an interview with Jakarta Globe on 5 April 2011, the new guardian explained: "I'm not just going to take a cultural approach based on the dreams or guidance from the spirits, but I will also coordinate with the authorities to protect human life and the environment on Mount Merapi and anticipate the fall of victims to future eruptions."
New dome growth. Seismicity was variable and intermittent explosions were observed at Merapi at least every month through June 2011 since the main eruptive events of October and November 2010. This activity kept local residents vigilant and caused some alarm when incandescence suddenly appeared on Merapi's summit on 25 March and 13 April (figure 49). On these two occasions, a bright glow on the crater's E side was recorded on closed circuit television (CCTV).
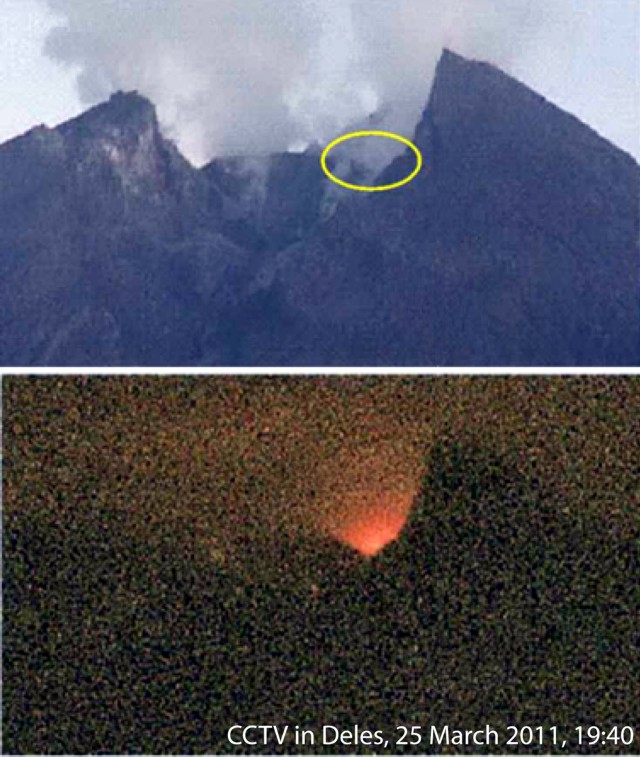 |
Figure 49. Bright incandescence visible on the E side of Merapi's crater was observed at 1940 on 25 March 2011. Courtesy of Volcano Technical Research Center (BPPTK Activity Report 21-27 March 2011). |
The point of incandescence was a location of concentrated degassing. In the aftermath of the eruption in 2010, fumaroles became well established and BPPTK intends to resume gas monitoring. They reported that a new dome was growing in the crater: "The final phase is usually marked by eruption of lava dome growth. However, we won't lower the [alert] status as long as the condition of Merapi is still volatile," reported Subandriyo of BPPTK on 11 April 2011 (Kompas News). Since 19 January 2011, the Alert Level was at 2, Advisory.
Gas monitoring. From ultraviolet correlation spectrometer (COSPEC) measurements, BPPTK reported continuous SO2 emissions for both 1992 through early 2009 (BPPTK, 2011b) and January 2005-January 2010 (figure 50). Other data resulted from sampling with Giggenbach bottles; a method of condensate retrieval requiring evacuated alkaline-solution-filled bottles (Williams-Jones and Rymer, 2000). Gas species such as CO2, SO2, H2S, and HCL were analyzed during June 2003-June 2010 (figure 51).
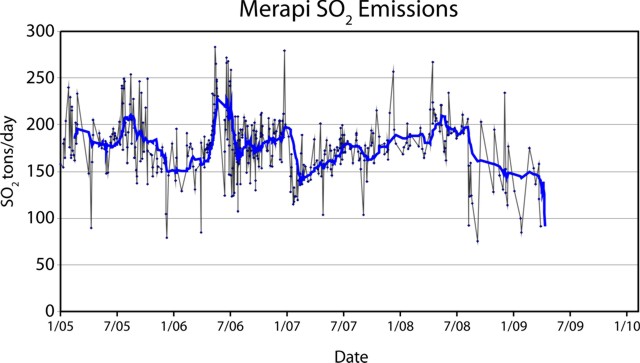 |
Figure 50. Merapi SO2 fluxes measured from January 2005 to roughly April 2009 using COSPEC (sulfur dioxide in metric tons per day). The curve shown displays an undisclosed averaging function on the data. Modified from BPPTK, 2011a. |
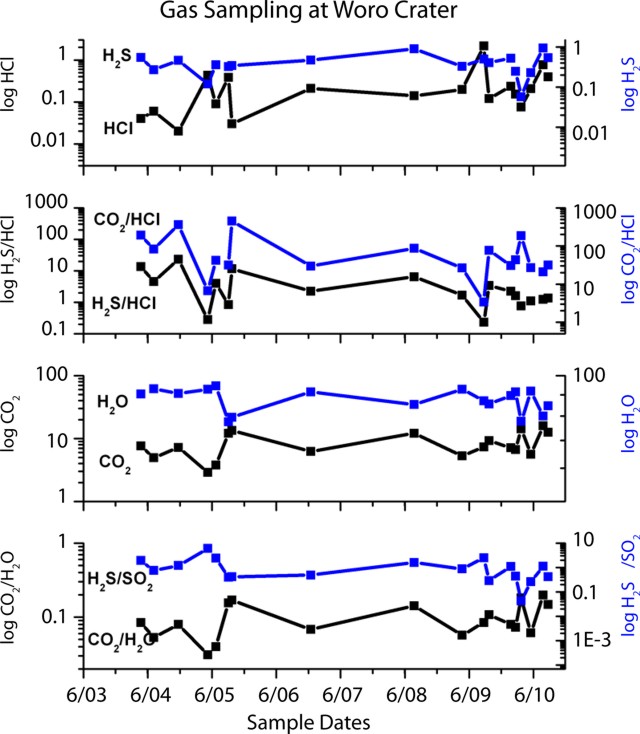 |
Figure 51. Gas sampling at Merapi's Woro Crater (a location map is posted in BGVN 32:02) conducted during June 2003-January 2011. Results from Giggenbach bottle collection and lab analysis for gas species are plotted on log scales. Right-hand vertical axis corresponds to upper (blue) data and trendlines. Left-hand vertical axis corresponds to the lower (black) data trendlines and data. Original concentration units were undisclosed (but Bulletin editors hope to clarify these units in later discussions on Merapi). Modified from BPPTK, 2011a. |
SO2 ranged from ~75 metric tons/day (t/d) to ~285 t/d and appeared to peak mid-year in 2005 and 2006 (figure 50). A sudden decrease of 50 t/d in January 2007 preceded an increasing trend that ended in mid-2008. These fluxes also had fewer sustained peaks around March 2008 and declined until the available record ends around March 2009.
The SO2 peak of ~200 t/d generally correlated with the 2005 mid-year episode of elevated seismicity that prompted the BPPTK (at that time called the Directorate of Volcanology and Geological Hazard Mitigation, "DVGHM") to raise the Alert Level from Normal to Advisory (from 1 to 2). However, there were no additional reports of plumes or increased dome activity then (BGVN 32:02).
In 2006, the Alert Level was raised to the highest level on 13 May due to intense dome growth and earthquake activity (BGVN 31:05), a time when SO2 reached ~225 t/d.
According to information recorded in Bulletin reports, the abrupt decrease of SO2 in late 2006-early 2007 did not appear to correlate with significant volcanism in that time interval. The gradual increasing-and-decreasing trend in SO2 flux from 2007 until the end of the record was marked by rare ash plumes (e.g. 19 March 2007, 9 Aug 2007, and 19 May 2008), and modest dome growth (BGVN 32:02). Bulletin reports also noted incandescence and ashfall had continued during 23 May-29 May 2007. MODVOLC thermal anomalies became rare after 5 September 2006 (BGVN 33:10).
Intermittent activity during 18 April-1 May 2011. Unrest at Merapi since the 2010 crisis was characterized by intermittent increases in seismicity as observed from 18 to 24 April 2011 (figure 52). Over the course of that week, rockfall signals doubled from the previous observation period and 39 multiphase events were recorded.
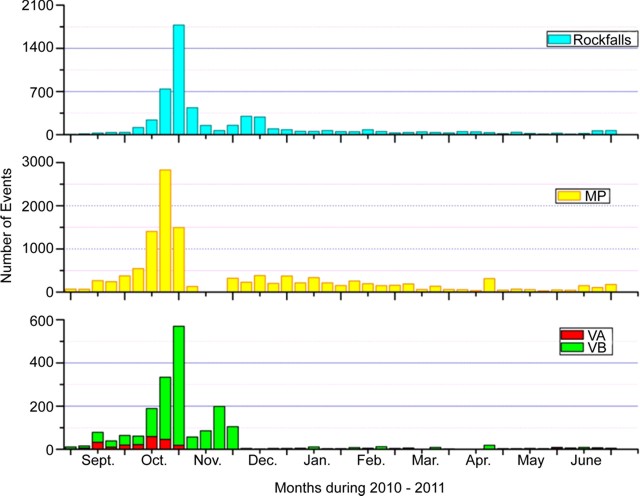 |
Figure 52. Histograms from September 2010 to June 2011 summarize the number of seismic events from four categories is summarized for Merapi. Events shown are rockfalls; MP, multiphase (shallow source, dominant frequency ~1.5 Hz); VA, deep volcano-tectonic earthquakes, 2.5-5 km below the summit; VB, shallow volcano-tectonic earthquakes, less than ~1.5 km below the summit. Tremor episodes were infrequent and thus excluded. Courtesy of BPPTK (Activity Report 6-12 June 2011). (A figure in BGVN 36:1/2 presented representative samples of these various waveforms.) |
BPPTK also reported that ground deformation was variable throughout this time period as EDM (Electronic Distance Meter) measurements were recorded across the summit. Measurements made on 18 April 2011 compared with those recorded on 25 April 2011 from the monitoring post of Selo showed the following changes: a difference in distance amounting to +8 mm (R1) and a change in movement amounting to 0.1 mm per day.
Measurements carried out on 18 April 2011 compared to those of 24 April 2011 from Jrakah monitoring post indicated the following changes: a difference in distance amounting to -4 mm (R1) with a change in movement amounting to 0.5 mm per day, and a difference in distance of +6 mm (R2) with a movement of 0.7 mm per day.
Plumes of ash and gas reached an altitude of ~800 m on 24 and 25 April. Communities near Merapi's flanks reported ashfall on 29 April, 30 April, and 1 May 2011. (BPPTK Activity Report 25 April-1 May 2011).
Ongoing hazards. The recent weekly report by BPPTK (20 March to 12 June 2011), described plumes of gas and ash that occurred regularly. As measured from above the summit, the average height of these plumes was ~500 m; a maximum height of 900 m was recorded on 20 April. The tallest plume was accompanied by a ramping up of earthquakes and the regular occurrence of lahars, some hot enough to steam while racing through river drainages (figure 53).
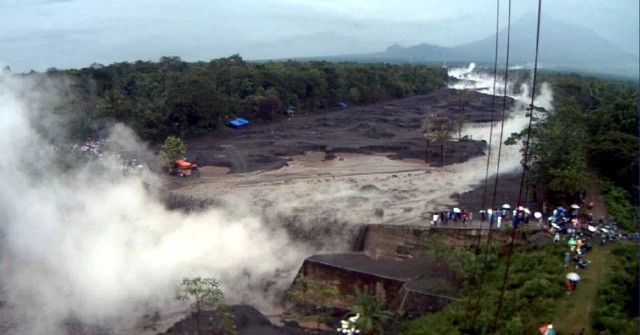 |
Figure 53. On 21 March 2011 and 14 April 2011 steaming lahars descended Merapi's flanks. This photo was taken on 14 April 2011from a CCTV camera installed in Pencar village, less than 20 km S of Merapi in the Desa Bimomartani region. Note Merapi volcano in upper right-hand area of the photo. Courtesy of BPPTK (Activity Report discussing 11-17 April 2011). |
A large amount of volcanic ash fell from Merapi's explosive eruptions in 2010; this has aggravated slope stability and led to increased lahar hazards. In an interview on 11 April 2011 for Kompas News, Subandriyo, the Head of the BPPTK explained that "only about 30 percent" of the material that fell on Merapi's flanks has been remobilized by erosion. "Therefore, the threat of [lahars] will occur two to three years ahead."
As of June 2011, 15 major lahars had occurred since November 2010. The worst occurred on 23 January 2011 along the eroded banks of the Putih river. The major highway between Magelang and Yogyakarta was cut off when a 60 m wide section of blacktop was torn away by torrential mudflows. As a result, hundreds of homes within 12 different villages near the river were inundated forcing 5,000 people to flee. There were three fatalities.
Major infrastructure was also affected; 52 levees were damaged and 14 bridges were destroyed. Intense lahar damage was also reported along the SE rivers: Blongkeng, Batang, Progo, Code, and Gendol.
References. Allard, P., Métrich, N., and Sabroux, J.-C., 2011, Volatile and magma supply to standard eruptive 549 activity at Merapi volcano, Indonesia. EGU General Assembly 2011, Geophysical 550 Research Abstracts 13, EGU 2011-13522 (2011).
Andreastuti, S., Costa, F., Pallister, J.,Sumarti., S., Subandini, S., Heriwaseso, A., Kurniadi, Y. , Petrology and pre-eruptive conditions of the 2010 Merapi magma. EGU General Assembly 2011, Geophysical 550 Research Abstracts 13, EGU2011-5150 (2011).
BPPTK, Volcano Technical Research Center, 2011a, Geochemistry of Merapi. (URL: http://www.merapi.bgl.esdm.go.id/aktivitas_merapi.php?page=aktivitas-merapi&subpage=geokimia)BPPTK, Volcano Technical Research Center, 2011b, Monitoring of Geochemical and Temperature of Merapi. (URL: http://www.merapi.bgl.esdm.go.id/pages.php?page=geokimia-dan-suhu)
Schmincke, H.-U, 2004, Volcanism, Berlin:Springer, 324 pp.
Jousset, P., 12/6/10, Centennial Eruption at Merapi volcano: October/November 2010, MIAVITA, European Commission. (URL: http://miavita.brgm.fr/Documents/MIAVITA-Merapi-eruption.pdf)
Sayudi, D.S., Nurnaning, A., Juliani, DJ., Muzani, M.; 2010, "Peta Kawasan Rawan Bencana Gunungapi Merapi, Jawa Tengah Dan Daerah Istimewa Yogyakarta 2010," (The map of the Rawan Bencana Gunungapi Merapi Region, Central Java: Yogyakarta Special District 2010), Volcano Technical Research Center (Balai Penyelidikan dan Pengembangan Teknologi Kegunungapian, "BPPTK"). (URL: http://www.merapi.bgl.esdm.go.id/peta/2011/04/KRBGMerapi2010FINALcopyright_78a74b.jpg)
Siebert L., Simkin T., and Kimberly P., 2010, Volcanoes of the World, 3rd edition, University of California Press, Berkeley, 558 p.
Surono, Jousset, P., Pallister, J., Boichu, M., Buongiorno, M.F., Budisantoso, A., Costa, F., Andreastuti, S., Prata, F., Schneider, D., Clarisse, L., Humaida, H., Sumarti, S., Bignami, C., Griswold, J., Carn, S., Oppenheimer, C., (in review), 100-year explosive eruption of Java's Merapi volcano, Journal of Volcanology and Geothermal Research.
Williams-Jones, G. and Rymer, H., 2000, Hazards of Volcanic Gases, in Sigurdsson, H., ed., Encyclopedia of Volcanoes: San Diego, California, Academic Press, p. 997-1004.
Information Contacts: Volcano Technical Research Center (Balai Penyelidikan dan Pengembangan Teknologi Kegunungapian, "BPPTK") (URL: http://www.merapi.bgl.esdm.go.id/index.php); Badan Nasional Penanggulangan Bencana (BNPB- Indonesian National Disaster Management Agency) (URL: http://dibi.bnpb.go.id); Center of Volcanology and Geological Hazard Mitigation (CVGHM), Jalan Diponegoro 57, Bandung 40122, Indonesia (URL: http://vsi.esdm.go.id/); IRIN News (URL: http://www.IRINnews.org); Jakarta Globe (URL: http://www.thejakartaglobe.com); The Jakarta Post (URL: http://www.thejakartapost.com); KompasNews, Jakarta, Indonesia (URL: http://www.Kompas.com); Mitigate and Assess risk from Volcanic Impact on Terrain and human Activities project (MIAVITA) (URL: http://miavita.brgm.fr/default.aspx); Act Forum Indonesia (URL: http://www.actalliance.org/); Relief Web (URL: https://reliefweb.int/).
During June 2011 to December 2014, several eruptions and elevated seismicity
This report details activity and monitoring at Merapi from 13 June 2011 through December 2014.
The last major eruption at Merapi was in 2010 as discussed in the previous two reports. As noted in BGVN 36:01 (covering 26 October 2010 to January 2011), Merapi began to erupt on 26 October 2010 and continued erupting throughout the interval, causing ~400 fatalities. BGVN 36:05 (26 October 2010 to 12 June 2011) further discussed this eruption detailing new dome growth and how lahars damaged infrastructure.
During the current reporting interval (13 June 2011 through December 2014), Merapi erupted regularly amid elevated seismicity. This report chiefly derives from three sources: (1) Balai Penyelidikan dan Pengembangan Teknologi Kegunungapian (BPPTK), (2) Pusat Vulkanologi dan Mitigasi Bencana Geologi (PVMBG; here referenced as CVGHM which stands for Center for Volcanology and Geological Hazard Mitigation), and (3) the Darwin Volcanic Ash Advisory Center (VAAC).
Activity during 2011.The hazard status for Merapi from 13 June 2011 onwards was Alert, Level II (on a scale of I–IV), before it decreased during 12–18 September 2011 and remained at Normal, Level I. Several minor avalanches occurred, with noted incidents on 2, 4, 6, 7, 14, and 25 July; 2, 7, and 15 August; and 4 and 8 September. Merapi also released several plumes, most of which consisted of white, thin or thin-to-thick clouds that rose to a maximum of only a few hundred meters above the summit (table 21).
Table 21. From 13 June to 31 December 2011, the plumes released by Merapi were generally described as thin or thin-to-thick and white in color. The only exception was apparent puffing associated with the plume on 10 July 2011, which lasted ~3 hours. Courtesy of BPPTK weekly reports from 2011.
| Date | Time (Local Time) | Max. height above the crater(m) |
| 19 Jun 2011 | 2100 | 200 |
| 03 Jul 2011 | 2015 | 600 |
| 04 Jul 2011 | 2043 | 600 |
| 10 Jul 2011 | 2100-2400 | 200 |
| 16 Jul 2011 | 2115 | 400 |
| 18 Jul 2011 | 1750 | 350 |
| 25 Jul 2011 | 1510 | 400 |
| 07 Aug 2011 | 2150 | 400 |
| 10 Aug 2011 | 2028 | 600 |
| 18 Aug 2011 | 2015 | 200 |
| 03 Sep 2011 | 3002 | 350 |
| 08 Sep 2011 | 1950 | 100 |
| 16 Sep 2011 | 1650 | 200 |
| 10 Oct 2011 | 1805 | 150 |
| 23 Oct 2011 | 1740 | 125 |
| 26 Oct 2011 | 1840 | 100 |
| 06 Nov 2011 | 1456 | 400 |
| 09 Nov 2011 | 1720 | 400 |
| 02 Dec 2011 | 1740 | 150 |
| 05 Dec 2011 | 1700 | 200 |
| 14 Dec 2011 | 1929 | 900 |
| 31 Dec 2011 | 2110 | 90 |
The non-tremor seismicity at Merapi in 2011 (figure 54) was categorized into four types of earthquakes, each of which had different patterns on the time-series plots. The seismicity was also described in terms of Real-time Seismic Amplitude Measurement (RSAM), (not shown here). In 2011, avalanche earthquakes and multiphase earthquakes dominated the record.
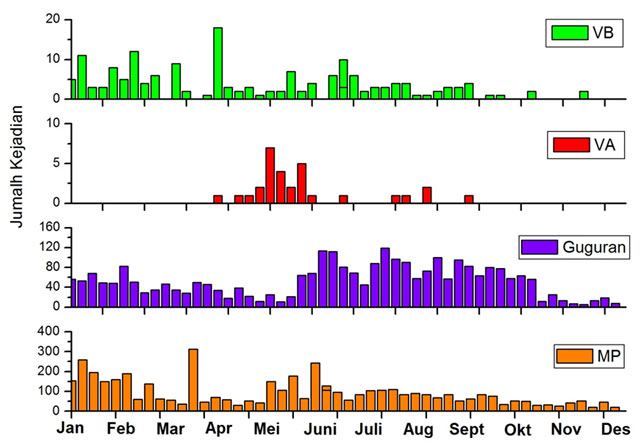 |
Figure 54. Number of earthquakes ("Jumlah Kejadian" in Indonesian) recorded at Merapi for 2011 with shallow volcanic (VB, green), deep volcanic (VA, red), avalanche ("Guguran," purple), and multiphase (MP, orange) earthquakes. The terms shallow and deep were not quantified. Note that the y-axis scales vary such that the most numerous earthquakes were MP and avalanche, and the least numerous were VB and VA. Courtesy of BPPTK (taken from their 2–8 January 2012 weekly report). |
A key means of measuring changes in linear length at Merapi consisted of surveys employing Electronic Distance Measurement (EDM) instruments (figure 55). The instruments computed the distance from several reflectors positioned on Merapi's slopes to fixed points at surrounding observatory posts. Figure 56 (below) provides the location of the posts and reflectors mentioned. Length changes were generally in the range of a few centimeters.
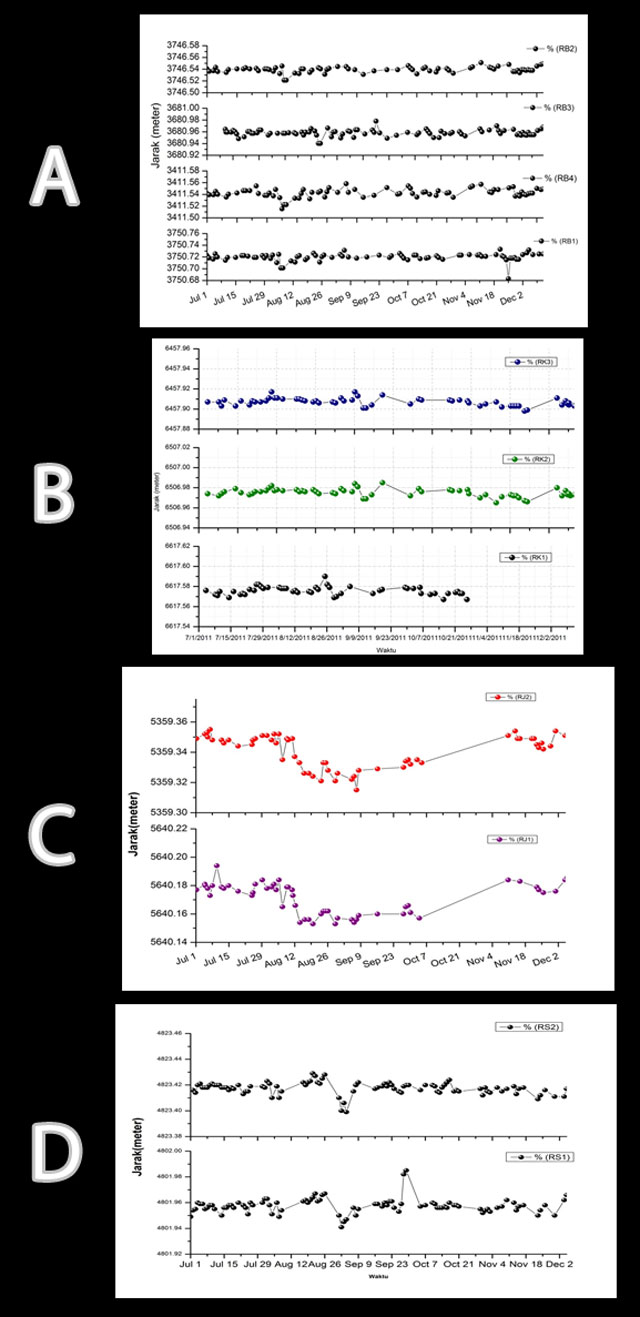 |
Figure 55. EDM linear length at Merapi in 2011, based on the distances from specified reflectors to various fixed locations. "Jarak" signifies distance (in meters). (A) 1 July to 30 December, recorded by Post Babadan. (B) 1 July to 9 December, recorded by Post Kaliurang. (C) 1 July to 5 December, recorded by Post Jrakah. The EDM linear lengths between the Post and both reflectors were broadly similar. (D) 1 July to 5 December, recorded by Post Selo. Courtesy of BPPTK (26 December 2011–1 January 2012 report). |
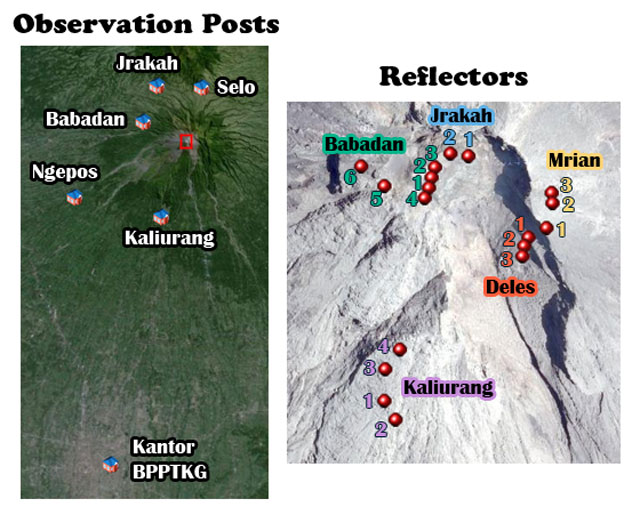 |
Figure 56. Images highlighting the locations of Merapi's observation posts (left) and reflectors (right). The right image is a zoomed-in version of the summit area (approximate red rectangle on the left image). To provide scales, the distance (in the image at left) from the summit to Kantor BPPTKG is ~30 km and the distance (in the image at right) from Jrakah 1 to Deles 3 is ~300 m. Courtesy of BPPTK (page titled Aktivitas Merapi), image captioned by Bulletin editors. |
Activity during 2012. A thin, white plume rose to a maximum of 150 m above the crater at 1910 on 6 January, and storms and heavy clouds covered Merapi's summit. On 9 January at an unstated time, a photo from CCTV Deles (discussed by BPPTK) showed Merapi amid clear weather with a white billowing cloud rising from the crater area. A few days later, at 1835 on 15 January, Merapi ejected a thin, white plume, rising to a maximum of 100 m above the summit, heading W. Thin, white plumes were also observed above the crater to 50 m, heading E on 1 February at 1720; to 500 m at 1745 on 11 February; and to 400 m at 1800 on 13 February. During 30 July to 5 August 2012, BPPTK referred to thick, white plumes drifting from the volcano. One plume reached a maximum of 600 m above the crater at an unstated date around this time. For the intervals in 2012 discussed above, the hazard status remained constantly at Normal (I). Furthermore, during 2012, the BPPTK recorded the seismicity (figure 57) and the EDM linear length (figure 58).
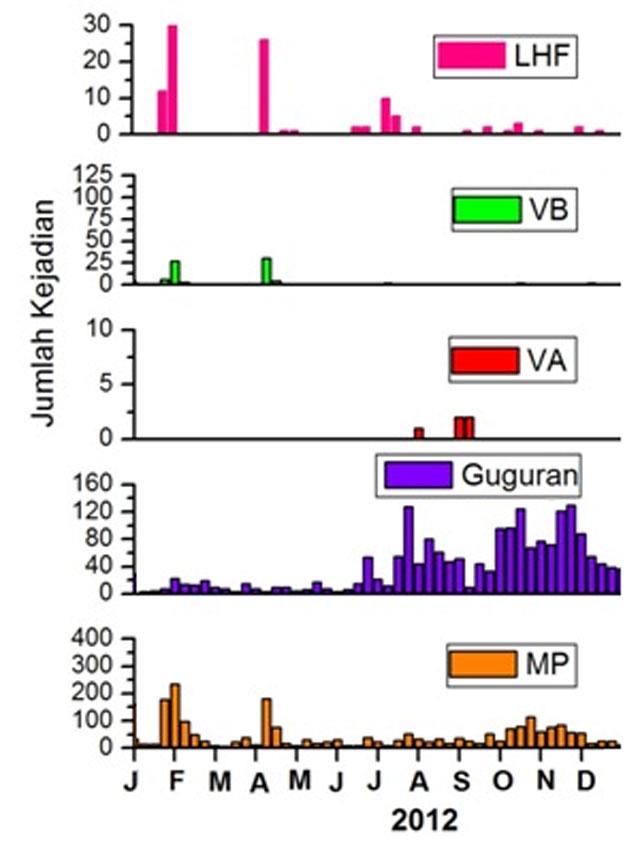 |
Figure 57. Number of earthquakes ("Jumlah Kejadian" in Indonesian) at Merapi for 2012 with low-high frequency (LHF, pink), shallow volcanic (VB, green), deep volcanic (VA, red), avalanche ("Guguran," purple), and multiphase (MP, orange) earthquakes. The numbers/peaks for each type of earthquake did not follow the same pattern. Note that the numbered scales on the left side vary. Courtesy of BPPTK (28 January–3 February 2013 report). |
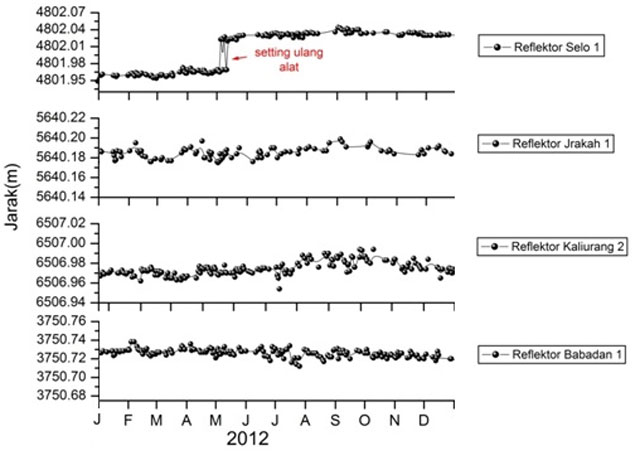 |
Figure 58. Merapi's EDM linear length in 2012, based on the distances from reflectors to various fixed locations. "Jarak" signifies distance (in meters). The measurements were recorded by Selo, Jrakah, Kaliurang, and Babadan stations (top to bottom). The sudden shift in the trend and the words "Setting ulang alat" (red words on the topmost graph) refer to technicians resetting the scale at that time (the instrument remained stable). Courtesy of BPPTK (28 January–3 February 2013 report). |
Activity during 2013. A thick plume blew W and reached a maximum of 450 m above the crater at 1750 on 3 February. The hazard status was at Normal (I).
On 22 July at 0415, BPPTK observed an ash eruption with brown-to-black color, reaching 1 km above the crater. A roar was heard within a radius of 6–7 km around Merapi, and ash fell to the SE, S, and SW. The hazard status remained at Normal (I); the Aviation Color Code was at Orange. According to a news article (Yahya, 2013), the eruption caused hundreds to temporarily evacuate; they returned to their homes later the same day. On 29 October 2013, BPPTK observed a white, thin-to-thick plume that reached 150 m above the summit, heading W.
On 18 November 2013, Merapi erupted. A news article in the Jakarta Post discussed the event extensively quoting BPPTK staff (Muryanto and Ayuningtyas, 2013). The article said that the eruption began at 0453 LT forming a plume that rose to 2 km above the crater. Ash fell until about 1000 that day, with noticeable amounts found up to 60 km to the E. The news report also noted that ~600 families "in Kalitengah Lor, Kalitengah Kidul and Srune hamlets, and in Glagaharjo village, Sleman regency, Yogyakarta, had immediately gathered to be evacuated" and that "villagers in Turgo village, Turi district, Sleman, located on the western flank of Mount Merapi, also fled their homes, [returning] a few hours later as the situation returned to normal." The eruption followed an M 4.7 tectonic earthquake detected in Ciamis, West Java earlier that day and was more powerful than a previous eruption on 22 July 2013 (Muryanto and Ayuningtyas, 2013).
Based on a Darwin VAAC report at 2025 LT on the same day (18 Nov), the eruption formed a plume that reached ~12.2 km altitude. The Aviation Color Code was increased to Red. By 2104 on the 18th, VAAC satellite analysis no longer detected the high altitude volcanic plume, but the VAAC reported a lower plume at ~4.6 km altitude. At 0300 on 19 November, the low level plume had extended to ~46 km E. However, by 0735, the plume had completely dissipated, and the Aviation Color Code returned to Orange.
BPPTK noted the seismicity (figure 59), the EDM linear length (figure 60), and the tilt (figure 61). In 2013, seismicity was dominated by avalanche earthquakes (figure 59). The only major change in linear length was the distance to Kaliurang 2 which had a gradual upward trend for most of the year, before a comparatively rapid downward trend in mid-October (figure 60). The two tiltmeter records showed broad consistency, with mild increases in the middle to late part of the year that reverted near to the original tilt (figure 61). The temperature graph had a broad peak in August 2013 that could account for some of the increase in tilt, but the BPPTK report did not discuss this in any detail. (For the location of the tiltmeter stations mentioned, see figure 62.)
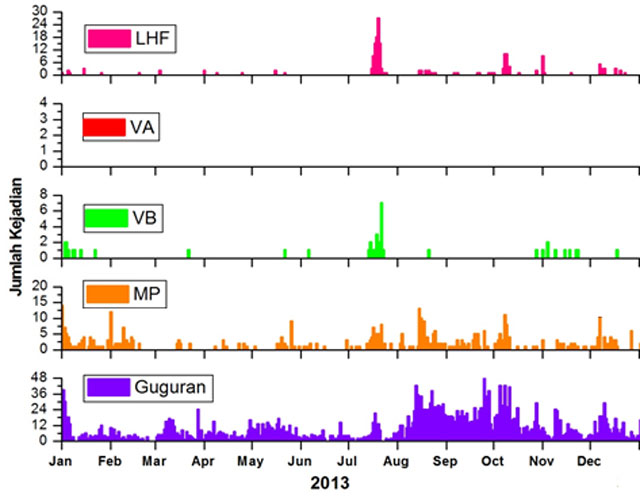 |
Figure 59. Number of earthquakes ("Jumlah Kejadian" in Indonesian) in 2013 at Merapi for low-to-high frequency (LHF, pink), deep volcanic (VA, red), shallow volcanic (VB, green), multiphase (MP, orange), and avalanche ("Guguran," purple) earthquakes. Y-axis scales vary. Courtesy of BPPTK (17–23 January 2014 report). |
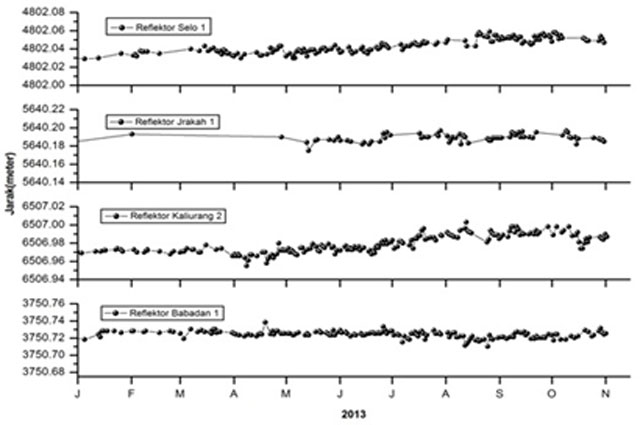 |
Figure 60. Merapi EDM linear length recorded during 2013, based on the distances from reflectors to various fixed locations. "Jarak" signifies distance (in meters). The measurements were recorded using reflectors Selo 1, Jrakah 1, Kaliurang 2, and Babadan 1 (top to bottom). Courtesy of BPPTK (25–31 October 2013 report). |
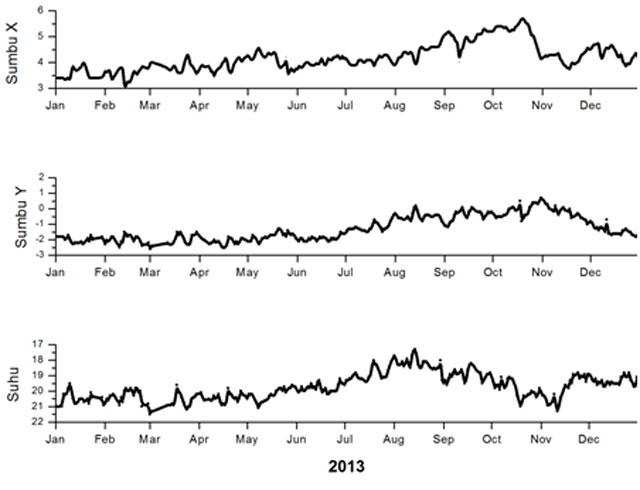 |
Figure 61. Tilt recorded at Merapi's station Plawangan. Y-axis units for the upper two tilt plots are microradians (arbitrary values). "Sumbu X" refers to tilt along a line running E-W and "Sumbu Y" to tilt along a line running N-S. The bottom plot is "Suhu" or temperature in degrees Celsius, which CVGHM noted may have a strong impact on the tilt measurements. Courtesy of BPPTK (17–23 January 2014 report). |
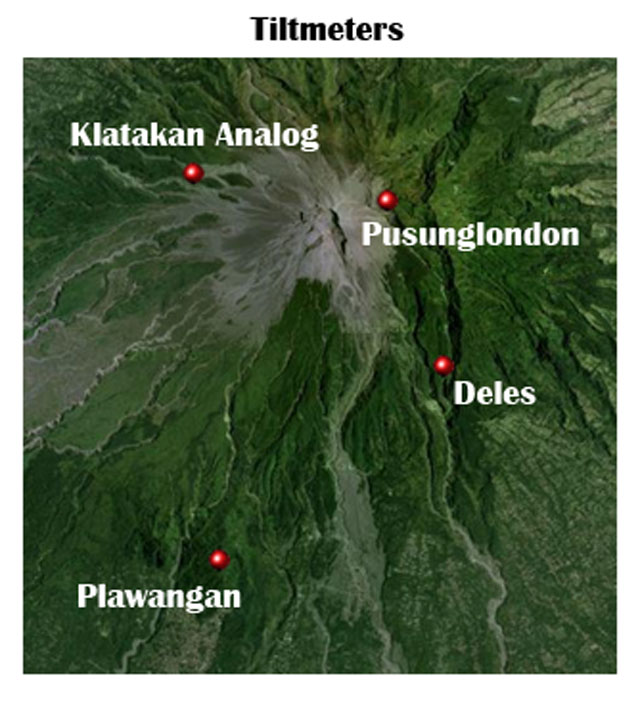 |
Figure 62. The location of the tiltmeter stations. To provide a scale, the distance from Klatakan Analog to Pusunglondon is ~0.9 km. Courtesy of BPPTK (Aktivitas Merapi). |
Activity during 2014. BPPTK noted that on 17 January at 1615, a white plume rose to 50 m above the summit, heading E.
At 1854 LT on 10 March 2014, Merapi erupted forming an ash plume that blew W. The event was captured on an automated closed-circuit video (CCTV Pasarbubar) and was followed by two more blasts within a minute (the first at 1855). At 1908, BPPTK noted a volcanic earthquake (with a maximum amplitude of 20 cm). Another video monitor (CCTV Bubar) recorded brown eruptive columns that rose straight up, reaching up to ~1.5 km above the summit. During 1925 to 1930, the eruption gradually stopped. Around this time, ash fell on several villages including Umbulharjo, Kepuharjo, Sidorejo, and Balerante, areas located ~6–7 km to the S of Merapi.
During 14-20 March 2014, thick gas plumes rose to ~600 m above the summit. On 17 March, the BPPTK recorded one such event at 0530.
On 27 March 2014, an eruption lasted from 1312 to 1316 LT. The VAAC detected volcanic ash to ~9.8 km altitude, using multi-spectral MTSAT-2 imagery, and the Aviation Color Code was raised to Red. A pilot reported that the "large ash cloud [was] moving NW." Darwin VAAC received a SACS SO2 alert at 2150 for the plume, and atmospheric SO2 gas was detected SE of Merapi. By 2232, the volcanic ash appeared to be dissipating; the advisory was terminated at 0830 on 28 March.
The 27 March eruption was the subject of a Jakarta Post news article by Muryanto and Ayuningtyas (2014), who indicated that ash fell in the Kemalang and Balerante Klaten regency and that it was 1 mm thick in some areas. The article also noted an M 5.4 tectonic earthquake that struck ~115 km SE of Malang regency, East Java on 23 March. The ash discharge had apparently been occurring regularly since the 2010 eruption but authorities had not taken this as a sign of an escalation in activity, and they urged locals to remain calm. However, according to the article, Sukiman, a resident of the nearby Deles district, said villagers responded to half an hour of ash falling by hitting "kentongan [bamboo drums] to warn others of the danger."
On 15 April, BPPTK reported that a thick white plume rose to a maximum of 300 m above the summit.
Several tectonic earthquakes occurred in April 2014. On 18 April at 2033, BPPTK recorded tectonic earthquakes 151 km SW of Merapi at a depth of 10 km. On 19 April, four more tectonic earthquakes occurred between 0800 and 2000, and an earthquake lasting 20 minutes was recorded at 0421 from a station on the peak of Merapi. On 20 April from 0426 to 0440, rumbling could be heard within a radius of 8 km around the volcano.
The BPPTK reported that on 20 April at 1600, an ash plume traveled W towards the village of Sewukan, amid foggy conditions. The associated eruption was followed by a widely heard roar and a later thin-to-thick plume rose to 400 m above the summit at 1800. The activity ultimately led to ashfall in Sewukan and in sectors to the SE, S, and SW, up to 15 km away from Merapi's summit.
The ash from this eruption was also detected by Darwin VAAC, who stated that the ash plume rose to ~10.7 km and extended ~260 km W to NW. The ash was difficult to distinguish from meteorological clouds, and at 1004 LT on 21 April, the VAAC terminated the advisory. In a news article, Minggu (2014) added further details on the eruption omitted here.
The BPPTK conducted a field expedition on 22 April to Merapi's crater. The expedition found that the eruption on 20 April had changed the summit crater morphology (figure 63). The slit that cut through the lava dome trending NE had widened by 70 m to the W, and reddish material that the team judged as indicative of oxidation was visible around the center of the lava dome. They also found new eruptive products along the crater's W side and evidence of new growth at the lava dome.
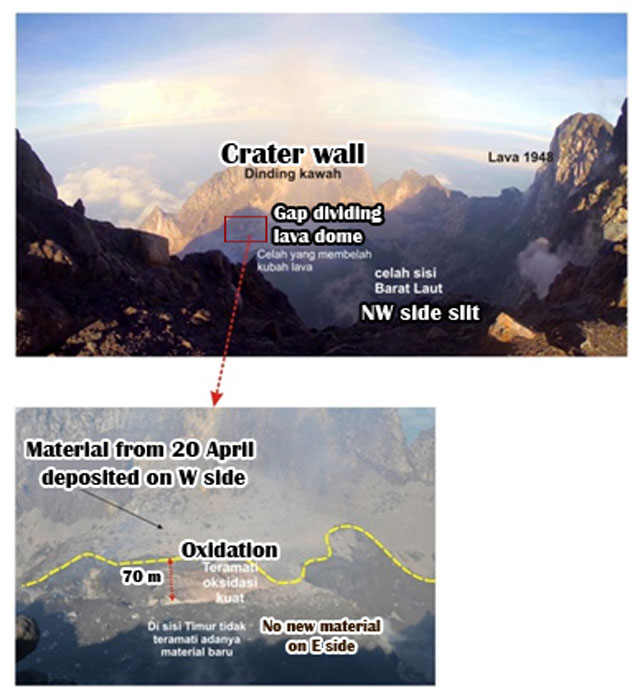 |
Figure 63. Field observations made on 22 April 2014 of Merapi's crater, assessing the aftermath of the 20 April eruption. (Top) View through the NW slit in the dome's crater. The crater wall appears in the background. (Bottom) Blowup of region depicted by base of red arrow. A wall in the summit crater area shifted W by ~70 m. New deposits were found in the area on the far side of the yellow dashed line. Courtesy of BPPTK (18–24 April 2014 report), image re-captioned in English by Bulletin editors. |
The BPPTK reported that monitoring outposts heard as many as 47 thumping sounds between 25 April and 1 May 2014, 20 sounds between 2 and 8 May, and 22 sounds between 9 and 15 May. On 25 April at 0740, a white, fumarolic plume rose to a maximum of 450 m above the summit, heading W, and the hazard status was raised to Alert (II). White, thin-to-thick plumes rose above the summit to 650 m on 2 May at 0700; to 350 m on 12 May at 0606; to 450 m on 22 May at 1924; to 300 m, heading W, on 27 May at 1854; and to 400 m on 31 May at 2010. The hazard status was lowered to Normal (I) during 21–27 May.
On 4 July 2014 at 1754, BPPTK observed thin-to-thick white plumes rising to 450 m above the summit.
On 10 September at 2008, thin, white plumes rose to 200 m above the summit, according to BPPTK.
During 10 to 16 October, Merapi released a thin white plume to ~200 m above the summit. The Darwin VAAC noted that small rock avalanches extended for ~1 km.
For 2014, BPPTK noted the seismicity (figure 64), EDM linear length (figure 65), and tilt (figure 66).
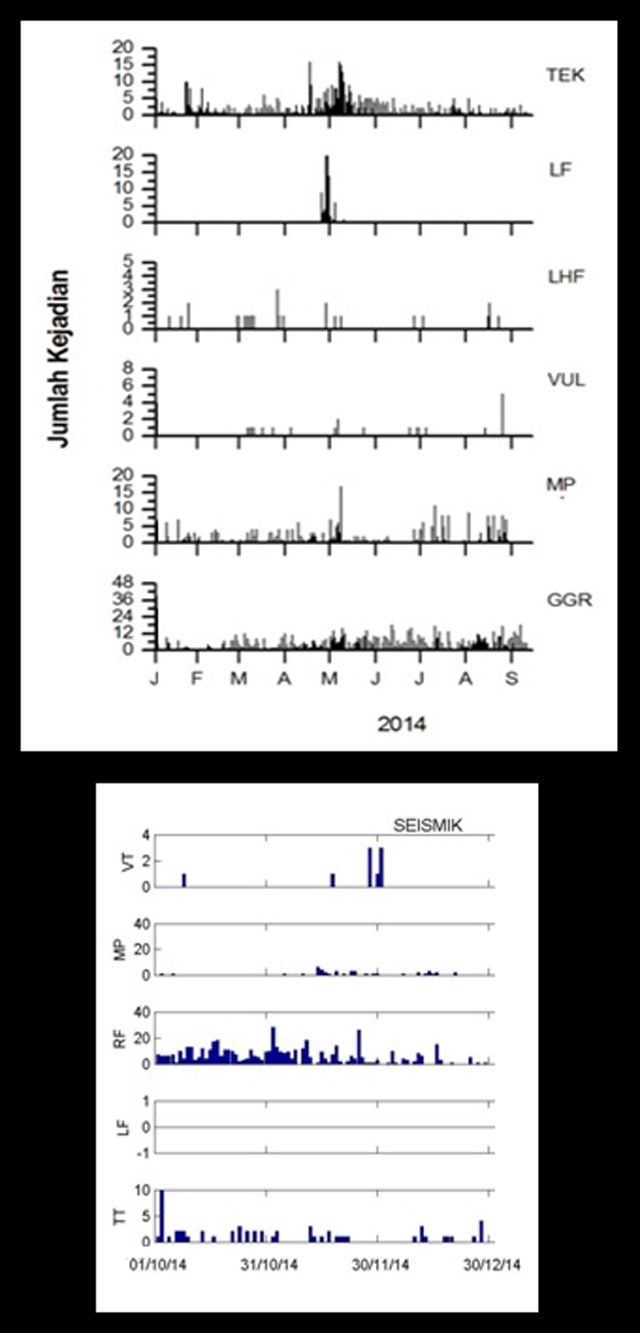 |
Figure 64. Number of earthquakes ("Jumlah Kejadian" in Indonesian) registered at Merapi for 2014. Note that the y-axis scales vary. (Top) Chart covers from January to September 2014 and consists of earthquakes: volcano-tectonic (TEK), low frequency (LF), low-to-high frequency (LHF), volcanic (VUL), multiphase (MP), and avalanche (GGR). (Bottom) Chart covers from October to December 2014 and consists of tremors (VT) and earthquakes: multiphase (MP), rock fall signals (RF), and tectonic (TT). Courtesy of BPPTK (5–11 September 2014 and 20–26 March 2015 reports). |
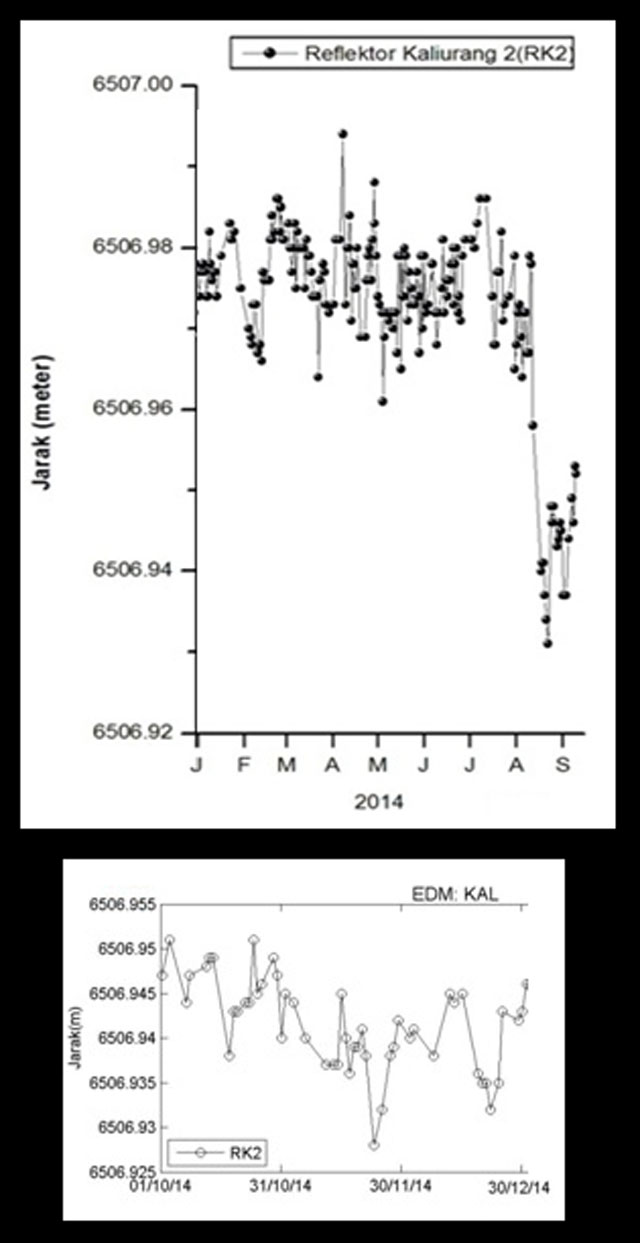 |
Figure 65. Merapi EDM linear length in 2014, based on the distances from reflectors to Post Kaliurang. "Jarak" signifies distance (in meters). The top chart covers from January to September and the bottom from October to December. (Date format for bottom is day/month/year.) Courtesy of BPPTK (5-11 September 2014 and 20–26 March 2015 reports). |
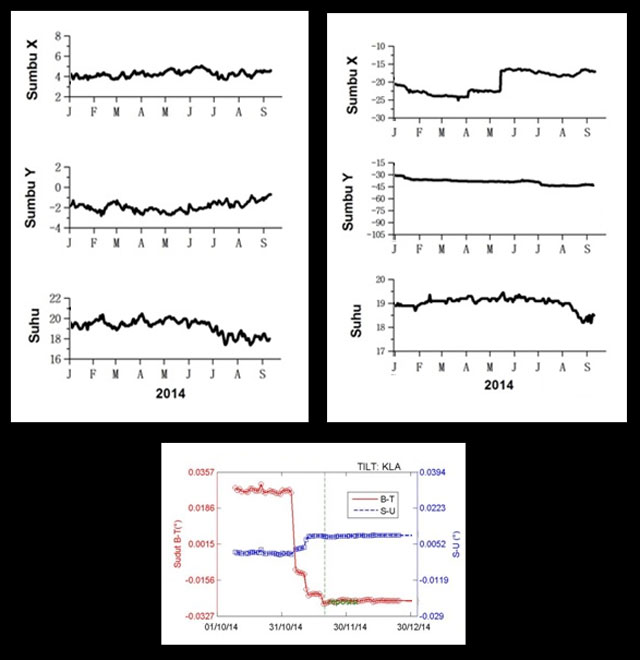 |
Figure 66. Tilt registered at Merapi in 2014 (y-axis/microradians with arbitrary values). (Top) January to September 2014, based on recordings made at stations Plawangan (left) and Babadan (right). "Sumbu X" portrays tilt along an E-W direction and "Sumbu Y", tilt along a N-S direction. The last plot ("Suhu") in each of these two cases shows the temperature in degrees Celsius. (Bottom) October to December, based on recordings made by station Klatakan Analog. The red line represents (tangential) tilt in an E-W direction ("Sudut B-T"). The blue line represents (radial) tilt in a N-S direction ("S-U"). The sudden changes in the red and blue lines were caused by repositioning. Courtesy of BPPTK (5–11 September 2014 and 20–26 March 2015 reports). |
Background. Several detailed maps of Merapi have been published by various sources. Handisantono and others (2002) contains a topographic hazard map of Merapi. The map includes the location of several villages mentioned in this report, as wells as rivers and other geological landmarks. BNPB also published a map of Merapi (figure 67). The map highlights the location of the W/SW/S-flank drainage systems, which have the potential to funnel lahars to local infrastructure such as bridges and into inhabited areas.
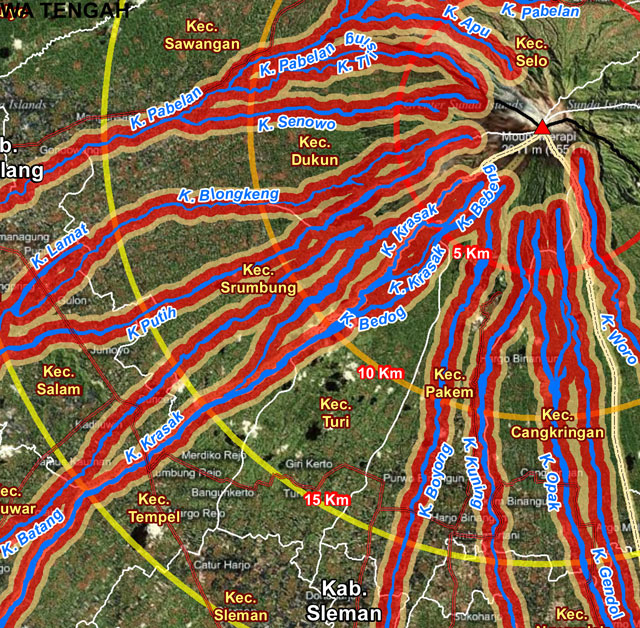 |
Figure 67. A section of a map of Merapi detailing lahars and related drainage systems (blue lines). The bounding color areas around the lahars represent associated hazard zones with risk levels ranging from yellow to red (least risk to most). Portions of concentric red, orange, and yellow circles mark the radial distance from Merapi's summit in kilometers. Courtesy of BNPB (date unknown). |
A detailed analysis of Merapi's history and periods of activity is documented by CVGHM (2014). The ongoing magmatism and volcanism at Merapi are considered consistent with documented copper, zinc, and lead enrichment as well as zonation there (Nadeau and others, 2013).
References.
Badan Nasional Penanggulangan Bencana (BNPB), date unknown, Peta Zonasi Ancaman Banjir Laha Dingin, Relief Web (URL: http://reliefweb.int/sites/reliefweb.int/files/resources/E0676C85D7612CE1852578340054FD68-map.pdf) [accessed in April 2015]
CVGHM, 2014, G. Merapi, Jawa Tengah, 03 June 2014, Center for Volcanology and Geological Hazard Mitigation (URL: http://www.vsi.esdm.go.id/index.php/gunungapi/data-dasar-gunungapi/542-g-merapi) [accessed in April 2015]
Hadisantono, R.D., Andreastuti, M.CH.S.D., Abdurachman, E.K., Sayudi, D.S., Nurnusanto, I., Martono, A., Sumpena, A.D., Muzani, M., 2002, Peta Kawasan Rawan Bencana Gunungapi Merapi, Jawa Tengah Dan Daerah Istimewa Yogayakarta (Volcanic Hazard Map of Merapi Volcano, Central Java and Yogyakarta Special Province), Center for Volcanology and Geological Hazard Mitigation (URL: http://www.vsi.esdm.go.id/galeri/index.php/Peta-Kawasan-Rawan-Bencana-Gunungapi-01/Wilayah-Jawa/KRB-G_-Merapi) [accessed in April 2015]
Minggu, 2014, Mt. Merapi rumbles spewing volcanic material to nearby areas, 20 April 2014, Antara News (URL: http://www.antaranews.com/en/news/93713/mt-merapi-rumbles-spewing-volcanic-material-to-nearby-areas) [accessed in April 2015]
Muryanto, B., Ayuningtyas, K., 2013, Hundreds of villagers flee Mount Merapi eruptions, 19 November 2013, The Jakarta Post (URL: www.thejakartapost.com/news/2013/11/19/hundreds-villagers-flee-mount-merapi-eruptions.html) [accessed in April 2015]
Muryanto, B., Ayuningtyas, K., 2014, Mount Merapi spews sulfuric gas, ash, 11 March 2014, The Jakarta Post (URL: www.thejakartapost.com/news/2014/03/11/mt-merapi-spews-sulfuric-gas-ash.html) [accessed in April 2015]
Nadeau, O., Stix, J., Williams-Jones, A.E., 2013, The behavior of Cu, Zn and Pb during magmatic–hydrothermal activity at Merapi volcano, Indonesia, 29 March 2013, Chemical Geology Volume 342 (URL: www.sciencedirect.com/science/article/pii/S0009254113000466)
Yahya, A., 2013, Mount Merapi Status Remains Normal Despite Weak Eruptions, 22 July 2013, Bernama (URL: http://www.bernama.com/bernama/v7/ge/newsgeneral.php?id=965338) [accessed in April 2015]
Information Contacts: Balai Penyelidikan dan Pengembangan Teknologi Kegunungapian (BPPTK), Pusat Vulkanologi dan Mitigasi Bencana Geologi (PVMBG) (URL: http://merapi.bgl.esdm.go.id/); Darwin Volcanic Ash Advisory Centre (VAAC) (URL: http://www.bom.gov.au/info/vaac/); and Center for Volcanology and Geological Hazard Mitigation (CVGHM, Pusat Vulkanologi dan Mitigasi Bencana Geologi), Badan Geologi, Kementerian Energi dan Sumber Daya Mineral (ESDM), Yogyakarta 55166, Indonesia (URL: http://www.vsi.esdm.go.id/).
Lahar in October 2016; phreatic explosions May-June 2018
After a major eruption on 26 October 2010 that subsided in early December of that year, Merapi erupted regularly amid elevated seismicity between 13 June 2011 and April 2014; seismicity returned to normal levels in May 2014 (BGVN 39:10). Renewed activity in the form of phreatic explosions took place during May-June 2018.
Lahar in October 2016. According to the Badan Nasional Penanggulangan Bencana (BNPB) (National Disaster Management Agency), a lahar on 27 October 2016 induced by moderate to heavy rain swept nine sand mining trucks down the Bebeng River on the SW flank; at least one truck was buried and six were severely damaged. There were no fatalities as the miners and other people at the scene escaped. Material at the summit and on the flanks produced during the October-November 2010 eruption was an estimated 20-25 million cubic meters, contributing to the continuing high potential of lahars during heavy rain. BNPB recommended that the public remain vigilant during rainy weather because a lahar formed on the upper flanks of Merapi can reach the bottom in less than 30 minutes. The Alert Level remained at 1 (on a scale of 1-4).
Phreatic explosions during May-June 2018. The volcano was apparently quiet between November 2016 and April 2018. According to the Pusat Vulkanologi dan Mitigasi Bencana Geologi (PVMBG, also known as CVGHM), an explosion occurred at 0740 on 11 May 2018. The eruption began with a small roar and vibrations that were felt at the observation post for 10 minutes. A plume rose to 5.5 km above the summit. There was no seismic precursor and no subsequent seismic activity. According to a news account (The Jakarta Post) on 11 May, the increased activity caused Yogyakarta's Adisutjipto International Airport (27 km S) to close, resulting in the cancellation of eight Garuda Indonesia flights. PVMBG did not increase the alert level from Green/Normal; they interpreted the explosion as being a minor event triggered by the accumulation of volcanic gases, and unlikely to result in subsequent explosions. High levels of sulfur dioxide in the vicinity of the volcano were detected by the satellite-based Ozone Monitoring Instrument (OMI) on 11 May; concentrations reached as high as 2.0 Dobson Units.
On 21 May a phreatic explosion began at 0125 and lasted for 19 minutes, generating an ash plume that rose 700 m above the crater and drifted W. At 0938, another phreatic explosion began that lasted six minutes and produced an ash plume that rose 1.2 km above the crater. Ashfall from both events was reported in areas 15 km downwind. A third event, detected at 1750, lasted three minutes and produced a plume of unknown height. After these events, one volcano-tectonic (VT) earthquake and one tremor event were recorded. The seismicity along with increased phreatic events prompted PVMBG to raise the Alert Level to 2.
According to PVMBG, on 23 May, at 1349 the Babadan observation post heard a two-minute-long phreatic explosion. A plume was not visible due to inclement weather, though minor ashfall was reported at the Ngepos observation post. On 24 May an event at 0256 generated an ash plume that rose 6 km above the crater rim and drifted W. Roaring was heard at all the Merapi observation posts. A two-minute-long event at 1048 produced an ash plume that rose 1.5 km and drifted W. PVMBG recommended the evacuation of everyone within 3 km of the summit.
PVMBG reported that on 1 June, at 0820, an event generated an ash plume that rose at least 6 km above the crater rim and drifted NW, then SW (figure 68). Ashfall was reported at the Selo observation post. Observers noted white smoke rising from a forested area 1.5 km NW, possibly indicating burning vegetation. PVMBG indicated that VT events were occurring at about 3 km below the crater. Later that day at 2024, an ash plume from a 1.5-minute-long event rose 2.5 km above the crater rim and drifted NE and W. At 2100, an ash plume rose 1 km and drifted NW. The Alert Level remained at 2.
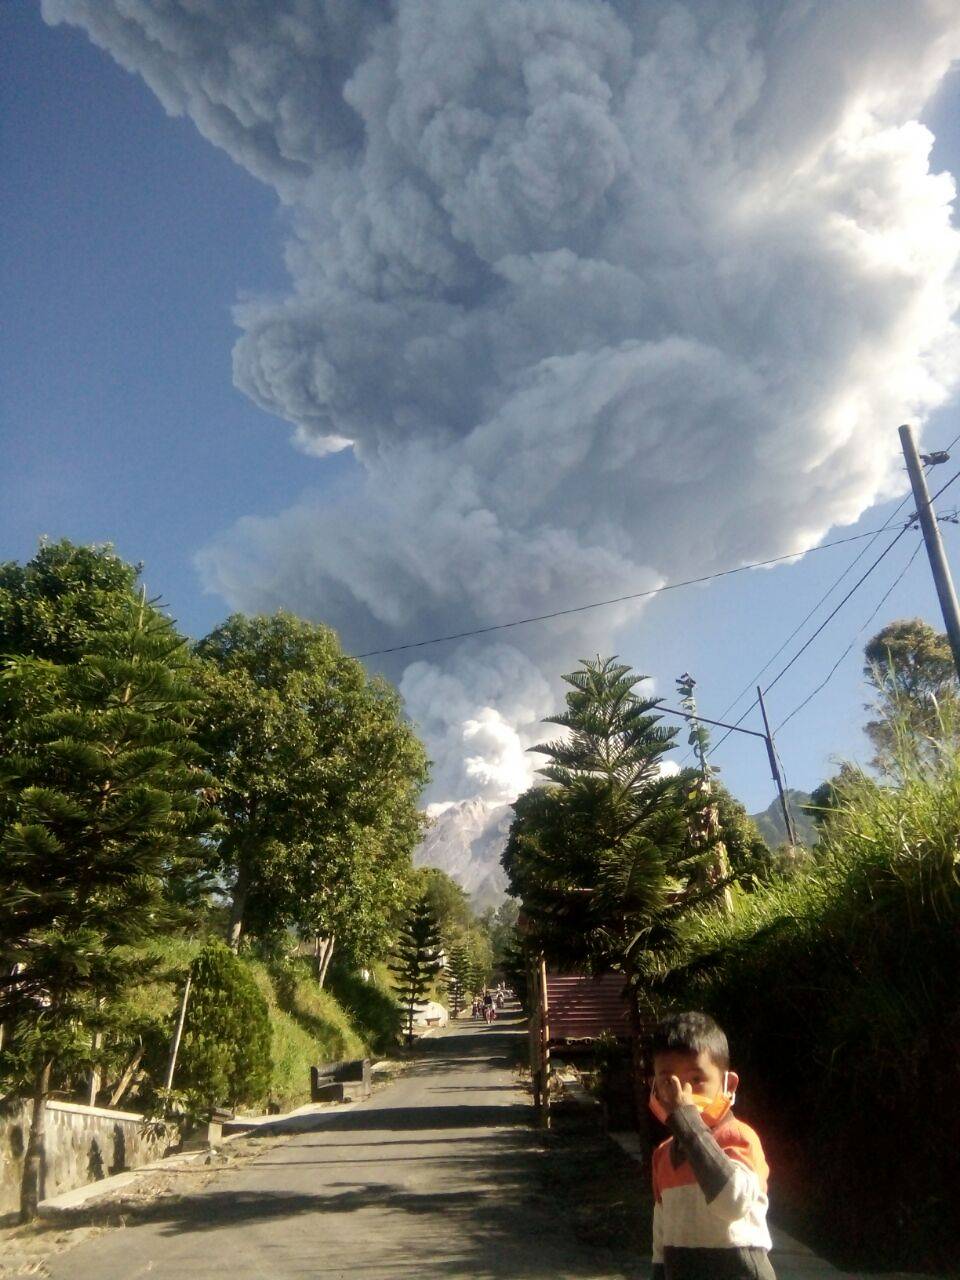 |
Figure 68. Photo of an explosion at Merapi on 1 June 2018. Courtesy of Badan Nasional Penanggulangan Bencana (BNPB), National Disaster Management Agency. |
Information Contacts: Pusat Vulkanologi dan Mitigasi Bencana Geologi (PVMBG, also known as Indonesian Center for Volcanology and Geological Hazard Mitigation, CVGHM), Jalan Diponegoro 57, Bandung 40122, Indonesia (URL: http://www.vsi.esdm.go.id/); Badan Nasional Penanggulangan Bencana (BNPB), National Disaster Management Agency, Graha BNPB - Jl. Scout Kav.38, East Jakarta 13120, Indonesia (URL: http://www.bnpb.go.id/); The Jakarta Post (URL: http://www.thejakartapost.com/); NASA Goddard Space Flight Center (NASA/GSFC), Global Sulfur Dioxide Monitoring Page, Atmospheric Chemistry and Dynamics Laboratory, 8800 Greenbelt Road, Goddard, Maryland, USA (URL: https://so2.gsfc.nasa.gov/).
Dome appears at summit on 12 August 2018; grows to 447,000 m3 by late March 2019
Merapi volcano in central Java, Indonesia (figure 69), has a lengthy history of major eruptive episodes. Activity has included lava flows, pyroclastic flows, lahars, Plinian explosions with heavy ashfall, incandescent block avalanches, and dome growth and destruction. Fatalities from these events were reported in 1994, 2006, and during a major event in 2010 (BGVN 36:01) where hundreds were killed and hundreds of thousands of people were evacuated. Renewed phreatic explosions in May 2018 cancelled airline fights and generated significant SO2 plumes in the atmosphere. The volcano then remained quiet until an explosion on 11 August 2018 marked the beginning of the growth of a new lava dome. The period June 2018 through March 2019 is covered in this report with information provided primarily by Balai Penyelidikan dan Pengembangan Teknologi Kebencanaan Geologi (BPPTKG), the Center for Research and Development of Geological Disaster Technology, a branch of PVMBG, which monitors activity specifically at Merapi.
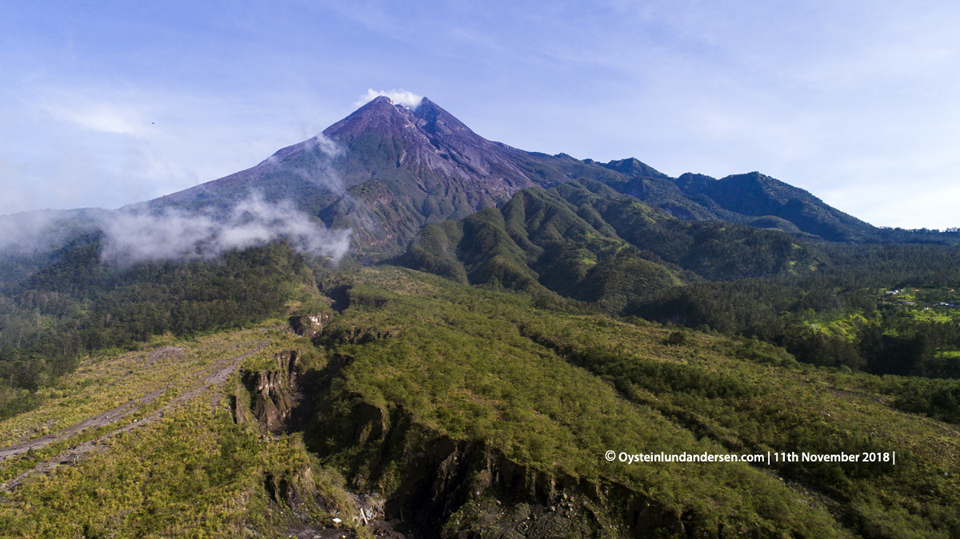 |
Figure 69. A drone aerial photo of Merapi taken on 11 November 2018 shows the Gendol river drainage in the foreground and the upper part that is often referred to as Bebeng. Pyroclastic flows descended through this drainage in both 2006 and 2010. Courtesy of Øystein Lund Andersen. |
The first sign of renewed activity at Merapi came with an explosion and the appearance of a lava dome at the summit on 12 August 2018. The growth rate of the dome fluctuated between August 2018 and January 2019, with a low rate of 1,000 m3/day in late September to a high of 6,200 m3/day in mid-October. By mid-December the dome was large enough to send block avalanches down the Kali Gendol ravine on the SSE flank. The rate of dome growth declined rapidly during January 2019, when most of the new lava moved down the ravine in numerous block avalanches. By late March 2019 the dome had reached 472,000 m3 in volume and block avalanches were occurring every few days.
After the eruptive events between 11 May and 1 June 2018, seismicity fluctuated at levels slightly above normal during June and July, with the highest levels recorded on 18 and 29 July. A VONA on 3 June reported a plume of steam that rose 800 m above the summit; for the rest of June the plume heights gradually decreased to a maximum of 400 m by the third week. During July steam plume heights varied from 30 to 350 m above the summit.
On 1 August 2018 an explosion was heard at the Babadan Post. An explosion on 11 August was heard by residents of Deles on the SE flank. Photos taken in a survey by drone the following day indicated the presence of new material in the middle of the 2010 dome fracture (figure 70). The presence of a new lava dome was confirmed with a site visit on 18 August 2018. The dome was 55 m long and 25 m wide, and about 5 m below the 2010 dome surface (figure 71). As of 23 August, the volume of the dome was 23,000 m3, growing at an average rate of 2,700 m3/day. By the end of the month the volume was estimated to be 54,000 m3 with a growth rate of 4,000 m3/day (figure 72). Throughout the month, persistent steam plumes rose 50-200 m above the summit.
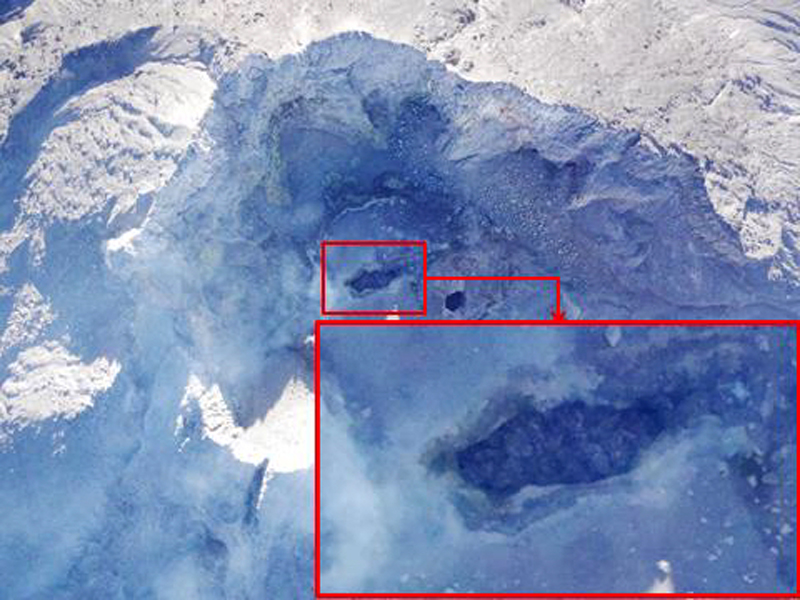 |
Figure 70. The first sign of new dome growth at Merapi appeared in this drone photo taken on 12 August 2018. Courtesy of BPPTKG (Siaran Pers 18 Agustus 2018 Pukul 17:00 WIB, Press Release 18 August 2018, 1700 local time). |
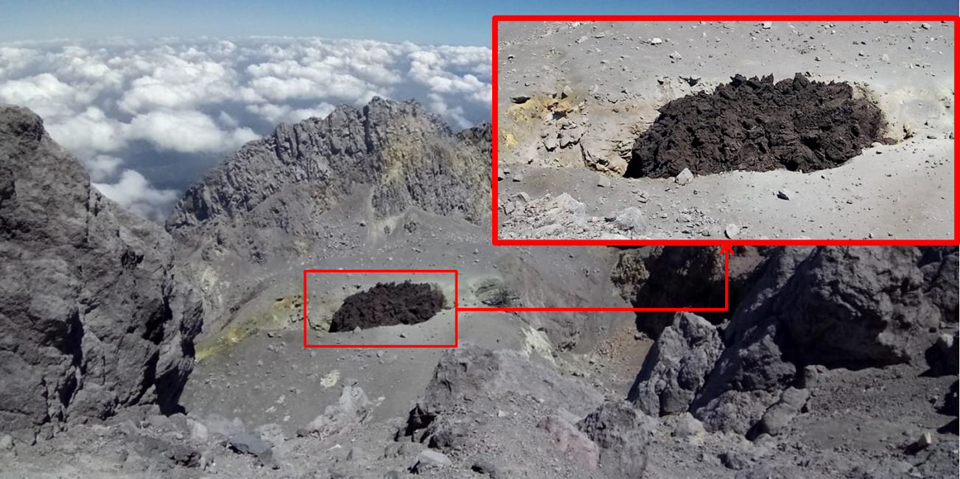 |
Figure 71. The new dome at the summit of Merapi on 18 August 2018. Courtesy of BPPTKG (Siaran Pers 18 Agustus 2018 Pukul 17:00 WIB, Press Release 18 August 2018, 1700 local time). |
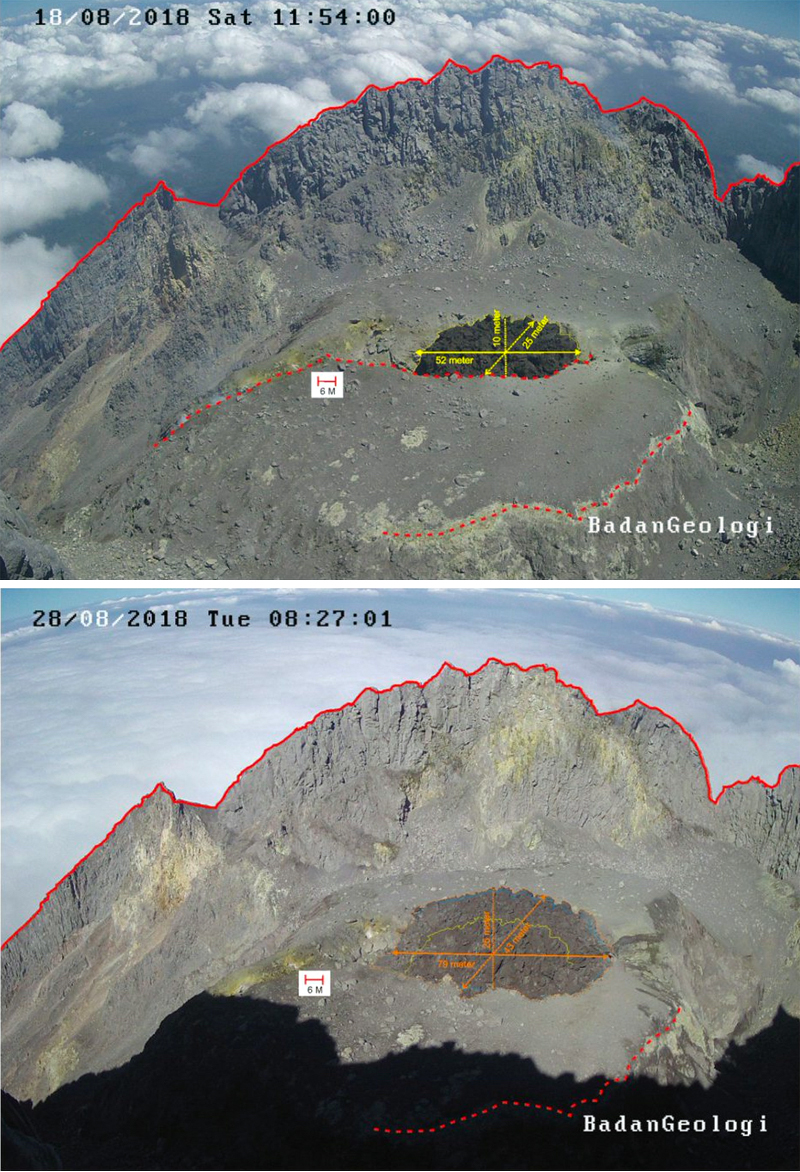 |
Figure 72. A comparison of the dome on 18 (top) and 28 (bottom) August 2018 at Merapi taken from the Puncak webcam on the N flank. By the end of August 2018, the dome size was about 54,000 m3. Courtesy of BPPTKG (posted via Twitter on 27 August 2018). |
During September-November 2018 the summit dome grew at varying rates from 1,000 to 6,200 m3/day (table 22). At the beginning of September its volume was 54,000 m3; it had reached 329,000 m3 by the end of November (figure 73). Steam plumes in September rose from 100 to 450 m above the summit. They were lower in October, rising only 50-100 m high. During November they rose 100 to400 m above the summit. Intermittent seismic activity remained above background levels. By mid-November, the growth of the dome was clearly visible from the ground 4.5 km S of the summit (figure 74).
Table 22. The volume and growth rate of the lava dome at Merapi was measured weekly from late August 2018 through January 2019. Data courtesy of BPPTKG Merapi weekly reports.
| Date | Size (m3) | Rate (m3 / day) |
| 23 Aug 2018 | 23,000 | 2,700 |
| 30 Aug 2018 | 54,000 | 4,000 |
| 06 Sep 2018 | 82,000 | 3,900 |
| 13 Sep 2018 | 103,000 | 3,000 |
| 20 Sep 2018 | 122,000 | 3,000 |
| 27 Sep 2018 | 129,000 | 1,000 |
| 04 Oct 2018 | 135,000 | 1,000 |
| 11 Oct 2018 | 160,000 | 3,100 |
| 18 Oct 2018 | 201,000 | 6,200 |
| 21 Oct 2018 | 219,000 | 6,100 |
| 31 Oct 2018 | 248,000 | 2,900 |
| 07 Nov 2018 | 273,000 | 3,500 |
| 14 Nov 2018 | 290,000 | 2,400 |
| 21 Nov 2018 | 308,000 | 2,600 |
| 29 Nov 2018 | 329,000 | 2,500 |
| 06 Dec 2018 | 344,000 | 2,200 |
| 13 Dec 2018 | 359,000 | 2,200 |
| 19 Dec 2018 | 370,000 | 2,000 |
| 27 Dec 2018 | 389,000 | 2,300 |
| 03 Jan 2019 | 415,000 | 3,800 |
| 10 Jan 2019 | 439,000 | 3,400 |
| 16 Jan 2019 | 453,000 | 2,300 |
| 22 Jan 2019 | 461,000 | 1,300 |
| 29 Jan 2019 | 461,000 | -- |
| 07 Feb 2019 | 461,000 | -- |
| 14 Feb 2019 | 461,000 | -- |
| 21 Feb 2019 | 466,000 | -- |
| 05 Mar 2019 | 470,000 | -- |
| 21 Mar 2019 | 472,000 | -- |
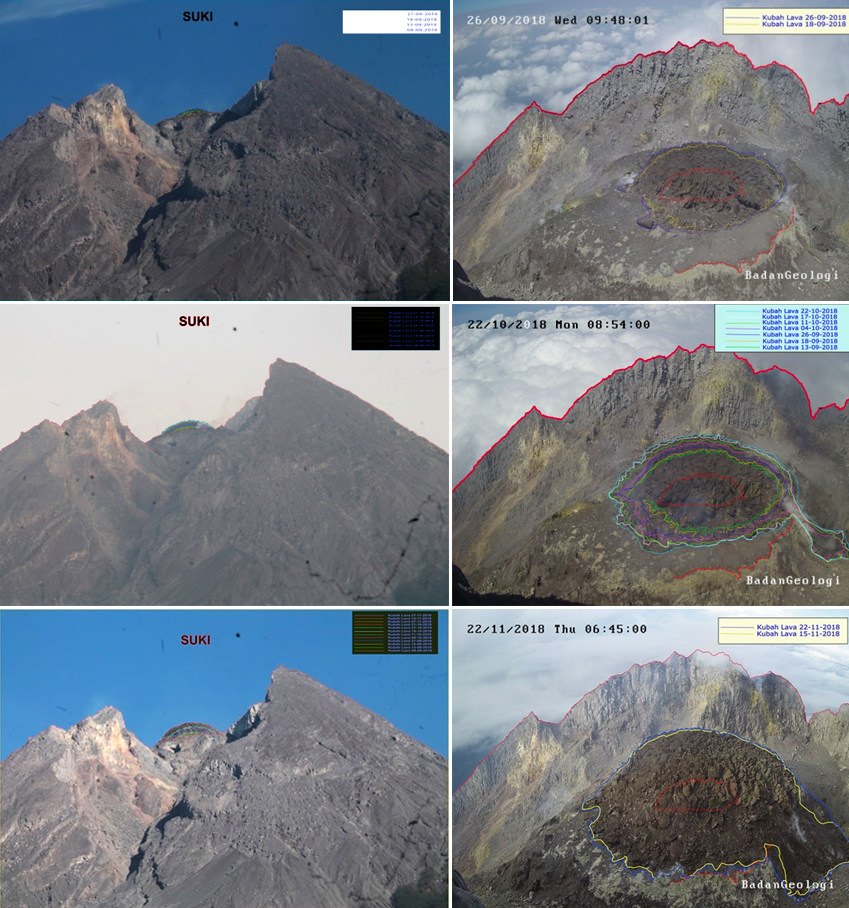 |
Figure 73. Images from September-November 2018 show the growth of the lava dome at the summit of Merapi. In each pair the left image is from the Deles webcam, and the right image is from the Puncak webcam on the same date. Top: 26 September 2018, left growth lines show change from 8 to 27 September, from 18 to 26 September on right; Middle: 22 October 2018, both sets of growth lines are from 13 September to 22 October; Bottom: 22 November 2018, left growth lines are from mid-September to 21 November and right growth lines are 15 and 22 November. In each Puncak image the red outline at the center is the dome outline on 18 August 2018. Courtesy of BPPTKG, from weekly reports of Merapi activity, 21-27 September, 19-25 October, and 16-22 November 2018. |
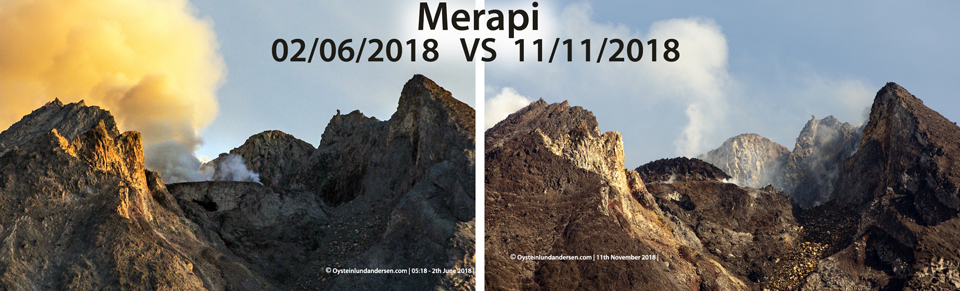 |
Figure 74. A comparison of the crater area of Merapi on 2 June 2018 (left) and 11 November 2018 (right). The new dome is clearly visible in the later photo. The images were taken about 4.5 km S of the summit. Persistent gas emissions rose from both the new dome and around the summit crater. Courtesy of Øystein Lund Andersen. |
The lava dome continued to grow during December 2018, producing steam plumes that rose 50-200 m. As the height of the dome increased, block avalanches began descending into the upper reaches of Kali Gendol ravine on the SSE flank. Avalanches on 16 and 19 December reached 300 m down the drainage; on 21 December a larger avalanche lasted for 129 seconds and traveled 1 km based on the duration of the seismic data (figure 75). By the end of December BPPTKG measured the volume of the dome as 389,000 m3.
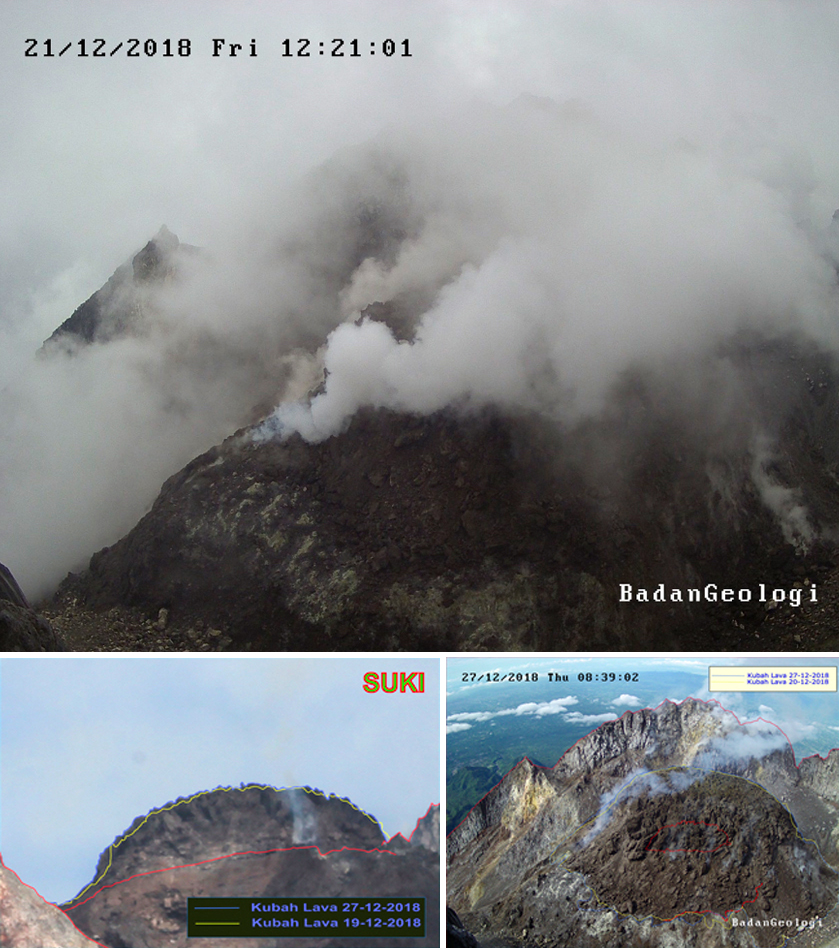 |
Figure 75. Steam and gas from a recent block avalanche rose from the edge of the new dome at Merapi on 21 December 2018 (top). By the end of December BPPTKG measured the volume of the dome as 389,000 m3. Top image from BPPTKG press release of 21 December 2018; bottom images from the weekly Merapi Mountain activities report of 21-27 December. Courtesy of BPPTKG. |
The rate of dome growth declined steadily during January 2019, and by the third week most of the lava extrusion was collapsing as block avalanches into the upper part of Kali Gendol, and dome growth had slowed. Steam plumes rose 50-450 m during the month. In spite of slowing growth, a comparison of the dome size between 11 November 2018 and 13 January 2019 indicated an increase in volume of over 150,000 m3 of material (figure 76). Incandescence at the dome and in the block avalanches was visible at night when the summit was clear (figures 77 and 78). Three block avalanches occurred during the evening of 29 January; the first traveled 1.4 km, the second 1.35 km, and the third 1.1 km down the ravine; each one lasted for about two minutes. By the end of January the size of the dome was reported by BPPTKG to be about 461,000 m3.
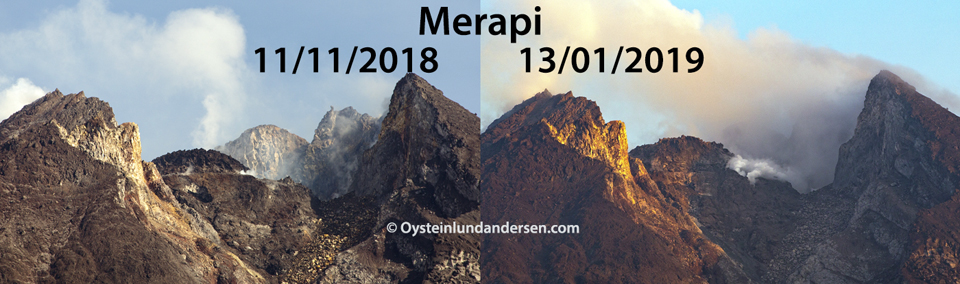 |
Figure 76. A comparison of the dome growth at Merapi from 11 November 2018 to 13 January 2019 showed an increase in volume of over 150,000 m3 according to Indonesian authorities (BPPTKG), as well as the accumulation of debris as material fell down the ravine. Courtesy of Øystein Lund Andersen. |
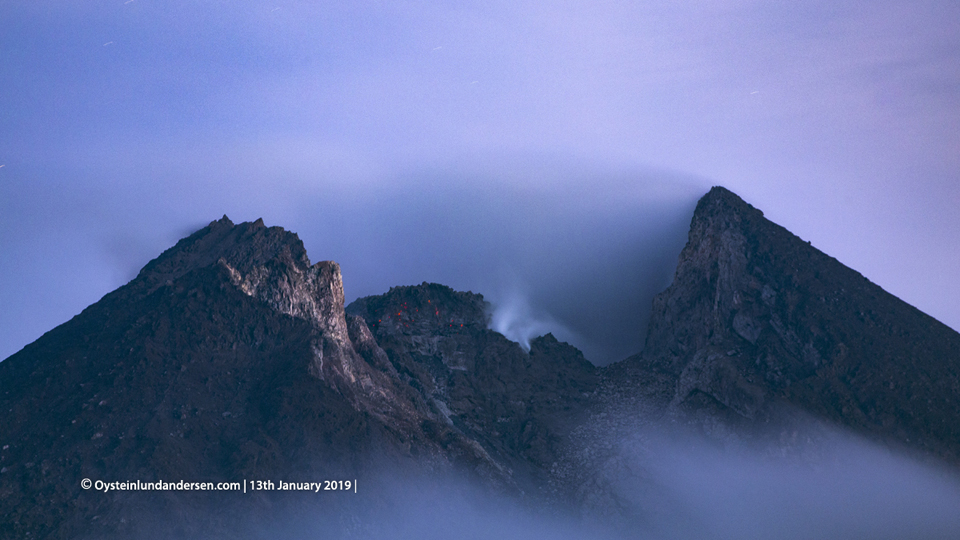 |
Figure 77. Incandescence appeared at the growing dome at the summit of Merapi late on 13 January 2019. Courtesy of Øystein Lund Andersen. |
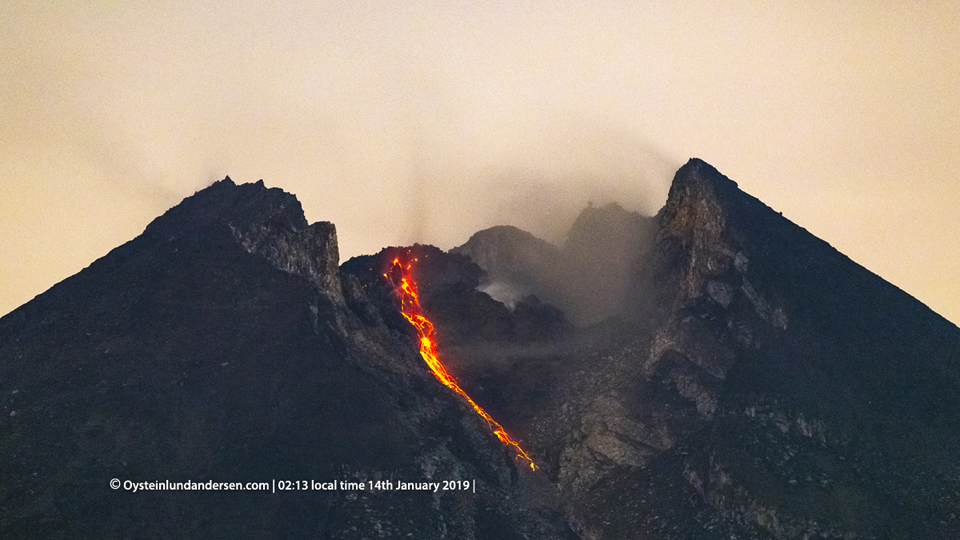 |
Figure 78. Incandescent blocks from the growing dome at Merapi traveled several hundred meters down Kali Gendol on 14 January 2019. Courtesy of Øystein Lund Andersen. |
Numerous block avalanches were observed during February 2019 as almost all of the lava extrusion was moving down the slope. Multiple avalanches were reported on 7, 11, 18, 25, and 27 February, with traveling distances ranging from 200 to 2,000 m. Steam plumes did not rise more than 375 m during the month. By the end of February, the dome had only grown slightly to 466,000 m3. Seventeen block avalanches were reported during March 2019; they traveled distances ranging from 500 to 1,900 m down the Kali Gendol ravine. A drone measurement on 5 March determined the volume of the dome to be 470,000 m3; it was only 2,000 m3 larger when measured again on 21 March.
Information Contacts: Balai Penyelidikan dan Pengembangan Teknologi Kebencanaan Geologi (BPPTKG), Center for Research and Development of Geological Disaster Technology (URL: http://merapi.bgl.esdm.go.id/, Twitter: @BPPTKG); Pusat Vulkanologi dan Mitigasi Bencana Geologi (PVMBG, also known as Indonesian Center for Volcanology and Geological Hazard Mitigation, CVGHM), Jalan Diponegoro 57, Bandung 40122, Indonesia (URL: http://www.vsi.esdm.go.id/); Øystein Lund Andersen (Twitter: @OysteinLAnderse, https://twitter.com/OysteinLAnderse, URL: https://www.oysteinlundandersen.com/).
Low-volume dome growth continues during April-September 2019 with rockfalls and small block-and-ash flows
Merapi is an active volcano north of the city of Yogyakarta (figure 79) that has a recent history of dome growth and collapse, resulting in block-and-ash flows that killed over 400 in 2010, while an estimated 10,000-20,000 lives were saved by evacuations. The edifice contains an active dome at the summit, above the Gendol drainage down the SE flank (figure 80). The current eruption episode began in May 2018 and dome growth was observed from 11 August 2018-onwards. This Bulletin summarizes activity during April through September 2019 and is based on information from Balai Penyelidikan dan Pengembangan Teknologi Kebencanaan Geologi (BPPTKG, the Center for Research and Development of Geological Disaster Technology, a branch of PVMBG), Sutopo of Badan Nasional Penanggulangan Bencana (BNPB), MAGMA Indonesia, along with observations by Øystein Lund Andersen and Brett Carr of the Lamont-Doherty Earth Observatory.
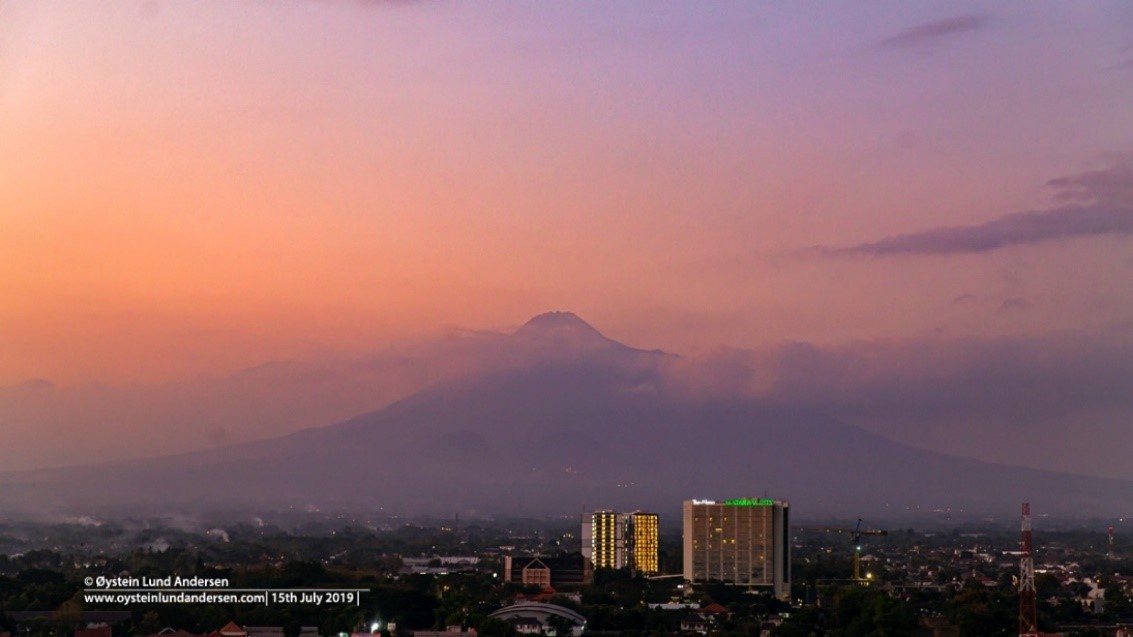 |
Figure 79. Merapi volcano is located north of Yogyakarta in Central Java. Photo courtesy of Øystein Lund Andersen. |
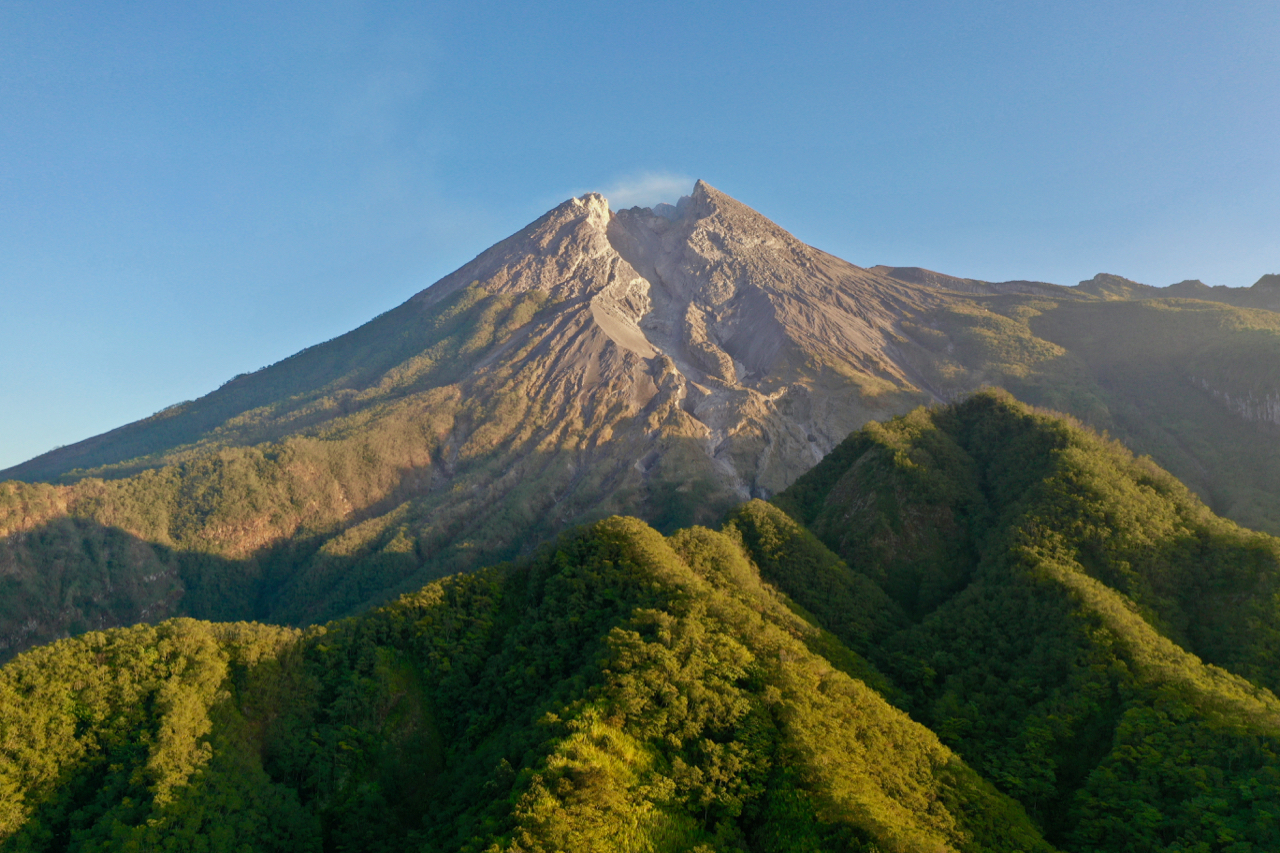 |
Figure 80. A view of the Gendol drainage where avalanches and block-and-ash flows are channeled from the active Merapi lava dome. The Gendol drainage is approximately 400 m wide at the summit. Courtesy of Brett Carr, Lamont-Doherty Earth Observatory. |
At the beginning of April the rate of dome growth was relatively low, with little morphological change since January, but the overall activity of Merapi was considered high. Magma extrusion above the upper Gendol drainage resulted in rockfalls and block-and-ash flows out to 1.5 km from the dome, which were incandescent and visible at night. Five block-and-ash flows were recorded on 24 April, reaching as far as 1.2 km down the Gendol drainage. The volume of the dome was calculated to be 466,000 m3 on 9 April, a slight decrease from the previous week. Weak gas plumes reached a maximum of 500 m above the dome throughout April.
Six block-and-ash flows were generated on 5 May, lasting up to 77 seconds. Throughout May there were no significant changes to the dome morphology but the volume had decreased to 458,000 by 4 May according to drome imagery analysis. Lava extrusion continued above the Gendol drainage, producing rockfalls and small block-and-ash flows out to 1.2 km (figure 81). Gas plumes were observed to reach 400 m above the top of the crater.
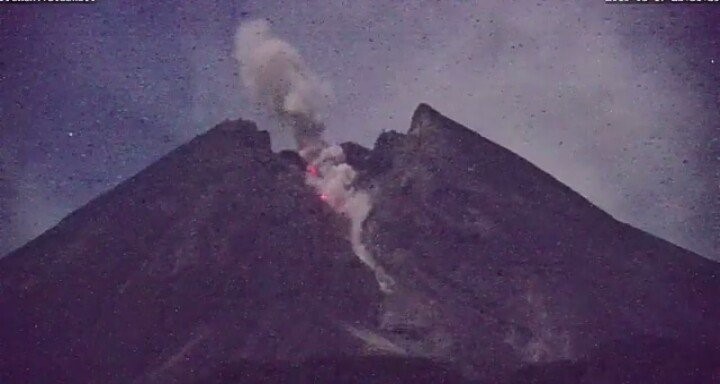 |
Figure 81. An avalanche from the Merapi summit dome on 17 May 2019. The incandescent blocks traveled down to 850 m away from the dome. Courtesy of Sutopo, BNPB. |
There were a total of 72 avalanches and block-and-ash flows from 29 January to 1 June, with an average distance of 1 km and a maximum of 2 km down the Gendol drainage. Photographs taken by Øystein Lund Andersen show the morphological change to the lava dome due to the collapse of rock and extruding lava down the Gendol drainage (figures 82 and 83). Block-and-ash flows were recorded on 17 and 20 June to a distance of 1.2 km, and a webcam image showed an incandescent flow on 26 June (figure 84). Throughout June gas plumes reached a maximum of 250 m above the top of the crater
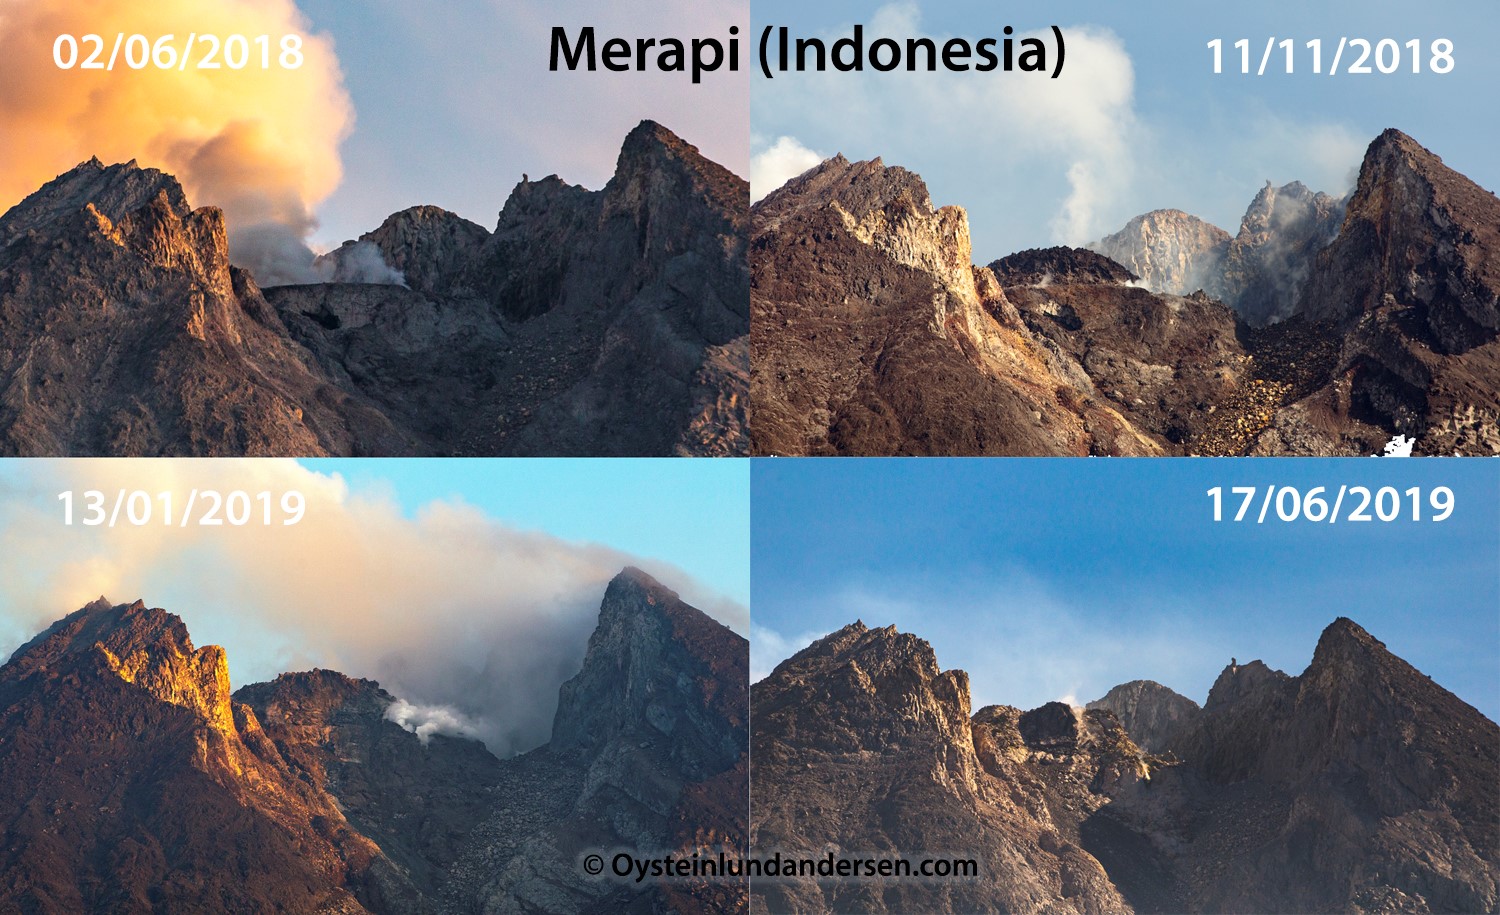 |
Figure 82. The development of the Merapi summit dome from 2 June 2018 to 17 June 2019. Courtesy of Øystein Lund Andersen. |
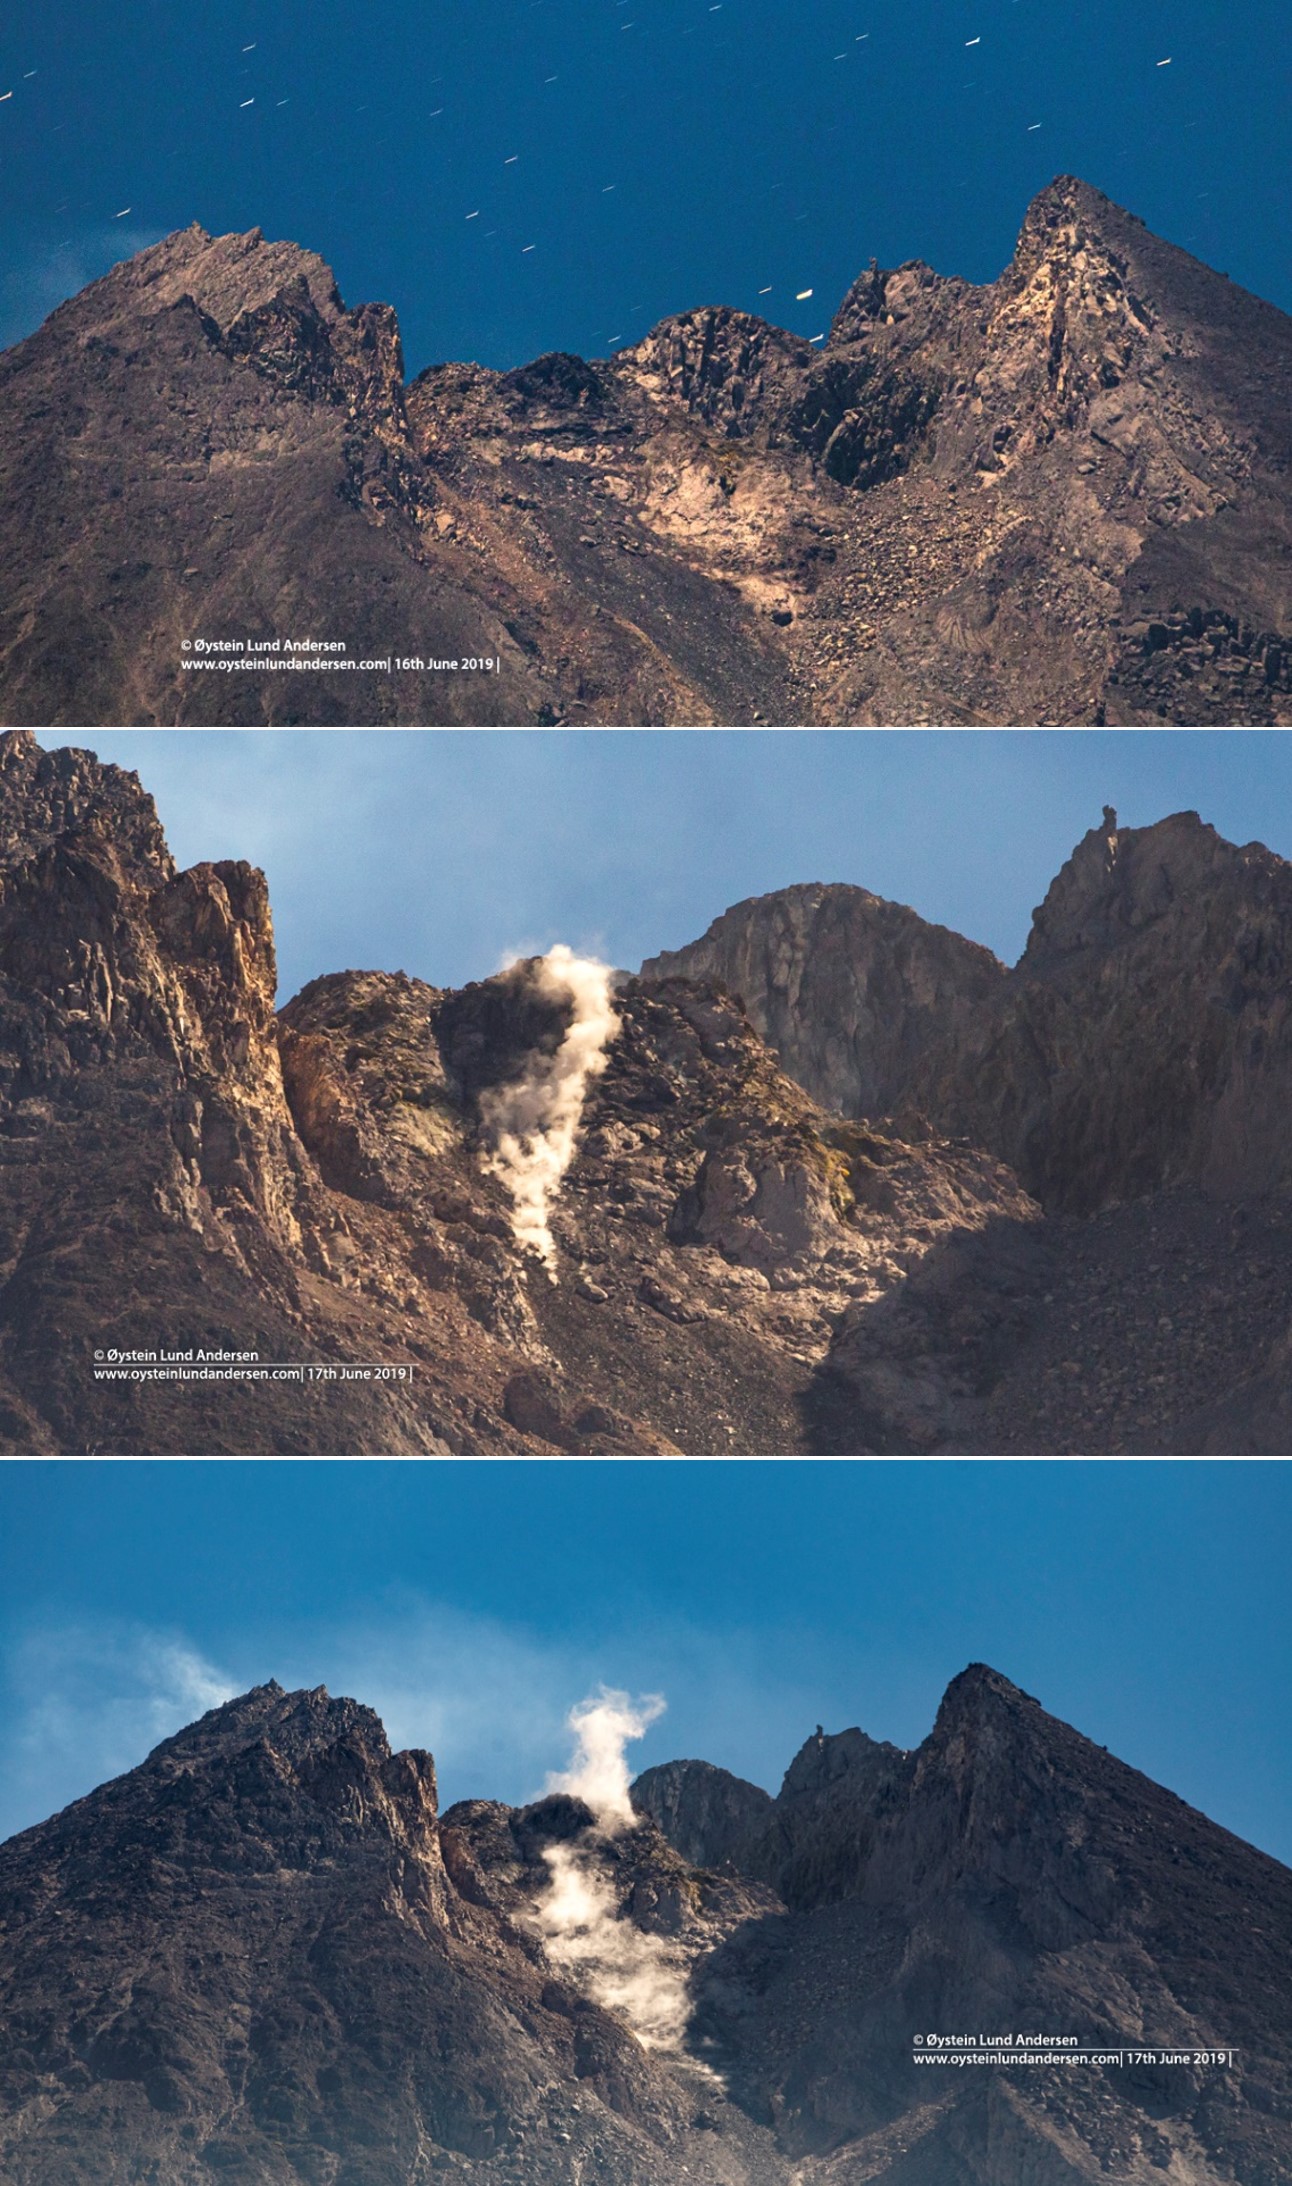 |
Figure 83. Photos taken of the Merapi summit lava dome in June 2019. Top: This nighttime time-lapse photograph shows incandescence at the south-facing side of the dome on the 16 June. Middle: A closeup of a small rockfall from the dome on 17 June. Bottom: A gas plume accompanying a small rockfall on 17 June. Courtesy of Øystein Lund Andersen. |
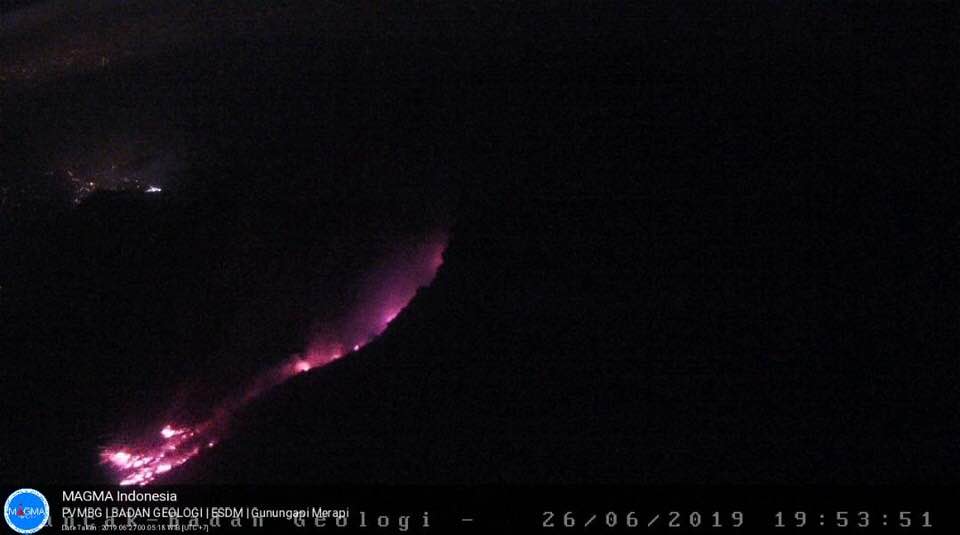 |
Figure 84. Blocks from an incandescent rockfall off the Merapi dome reached out to 1 km down the Gendol drainage on 26 June 2019. Courtesy of MAGMA Indonesia. |
Analysis of drone images taken on 4 July gave an updated dome volume of 475,000 m3, a slight increase but with little change in the morphology (figure 85). Block-and-ash flows traveled 1.1 km down the Gendol drainage on 1 July, 1 km on the 13th, and 1.1 km on the 14th, some of which were seen at night as incandescent blocks fell from the dome (figure 86). During the week of 19-25 July there were four recorded block-and-ash flows reaching 1.1 km, and flows traveled out to around 1 km on the 24th, 27th, and 31st. The morphology of the dome continued to be relatively stable due to the extruding lava falling into the Gendol drainage. Gas plumes reached 300 m above the top of the crater during July.
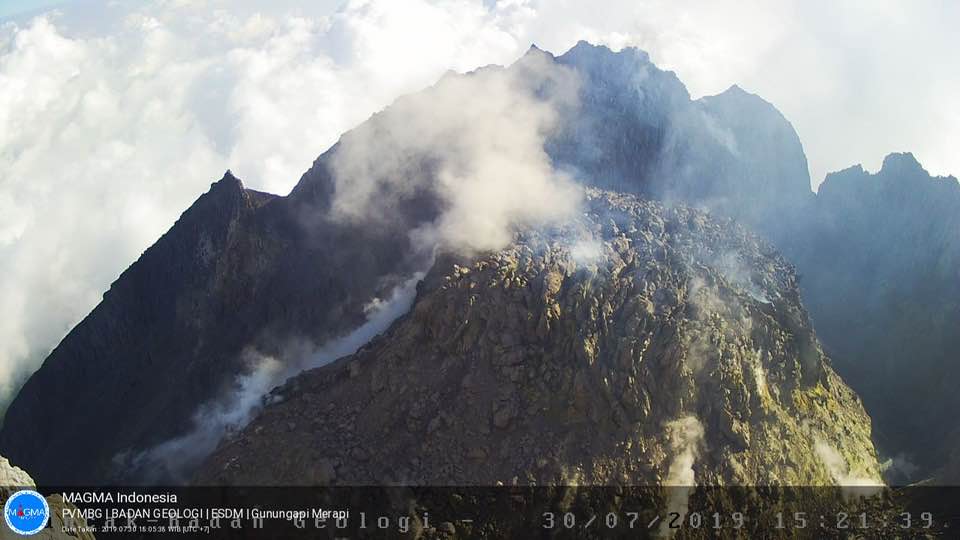 |
Figure 85. The Merapi dome on 30 July 2019 producing a weak plume. Courtesy of MAGMA Indonesia. |
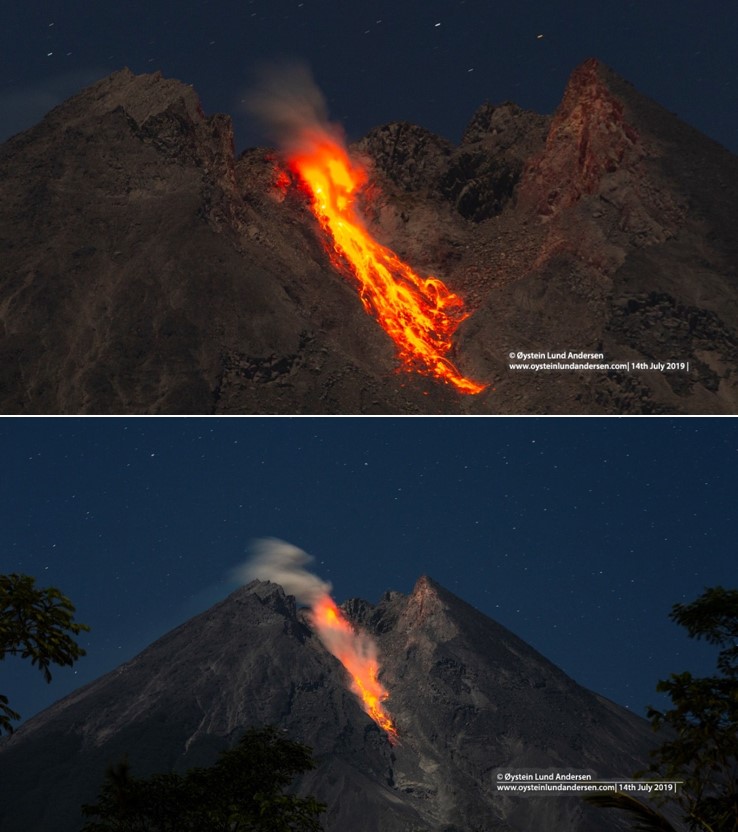 |
Figure 86. Incandescent rocks from the hot lava dome at the summit of Merapi form rockfalls down the Gendol drainage on 14 July 2019. Courtesy of Øystein Lund Andersen. |
During the week of 5-11 August the dome volume was calculated to be 461,000 m3, a slight decrease from the week before with little morphological changes due to the continued lava extrusion collapsing into the Gendol drainage. There were five block-and-ash flows reaching a maximum of 1.2 km during 2-8 August. Two flows were observed on the 13th and 14th reaching 950 m, out to 1.9 km on the 20th and 22nd, and to 550 m on the 24th. There were 16 observed flows that reached 500-1,000 m on 25-27 August, with an additional flow out to 2 km at 1807 on the 27th (figure 87). Gas plumes reached a maximum of 350 m through the month.
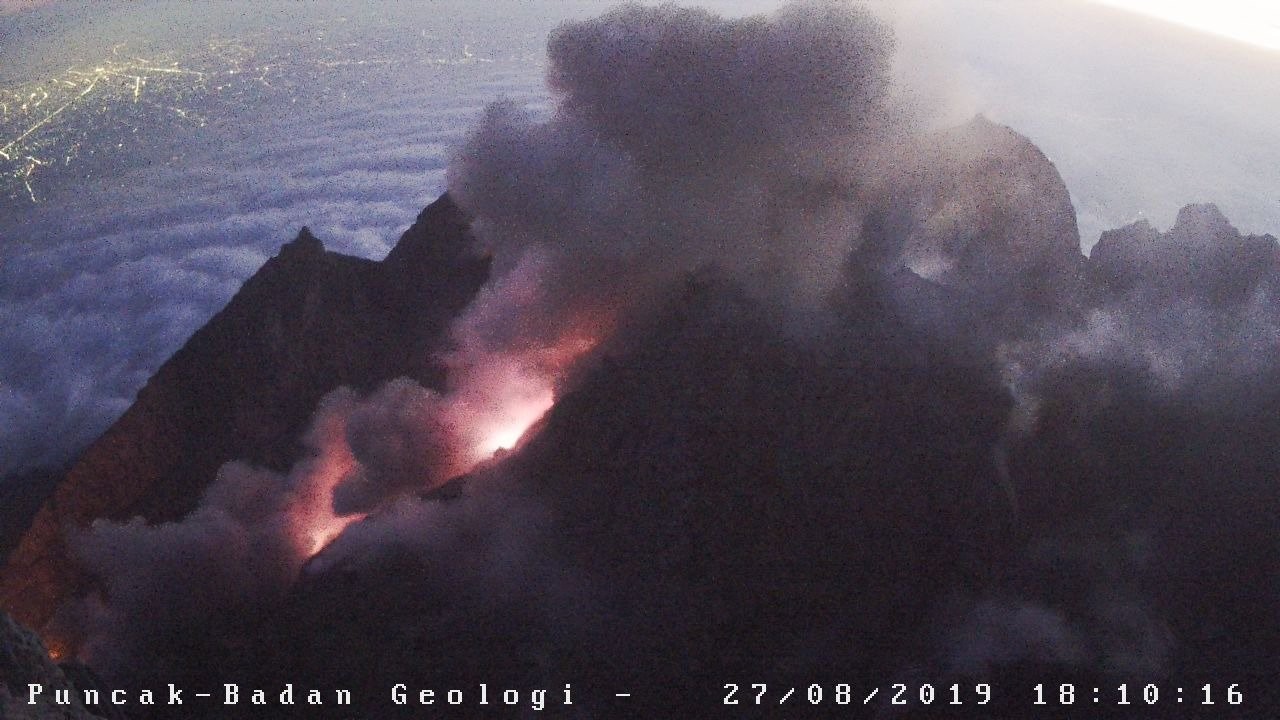 |
Figure 87. An incandescent rockfall from the Merapi dome that reached 2 km down the Gendol drainage on 27 August 2019. Courtesy of BPPTKG. |
Brett Carr was conducting field work at Merapi during 12-26 September. During this time the lava extrusion was low (below 1 m3 per second). He observed small rockfalls with blocks a couple of meters in size, traveling about 50-200 m down the drainage every hour or so, producing small plumes as they descended and resulting in incandescence on the dome at night. Small dome collapse events produced block-and-ash flows down the drainage once or twice per day (figure 88) and slightly larger flows just over 1 km long a couple of times per week.
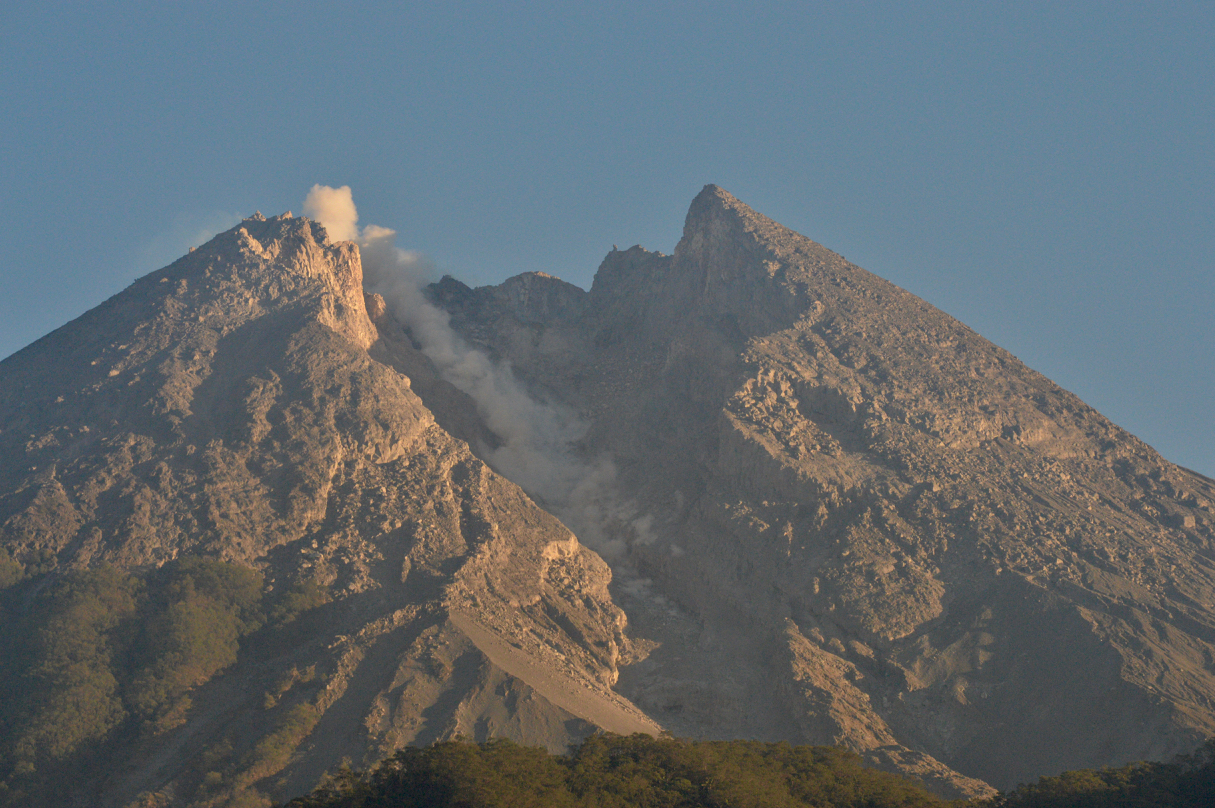 |
Figure 88. A rockfall on the Merapi dome, towards the Gendol drainage at 0551 on 20 September 2019. Courtesy of Brett Carr, Lamont-Doherty Earth Observatory. |
The dome volume was 468,000 m3 by 19 September, a slight increase from the previous calculation but again with little morphological change. Two block-and-ash flows were observed out to 600 m on 9 September and seven occurred on the 9th out to 500-1,100 m. Two occurred on the 14th down to 750-900 m, three occurred on 17, 20, and 21 September to a maximum distance of 1.2 km, and three more out to 1.5 km through the 26th. A VONA (Volcano Observatory Notice for Aviation) was issued on the 22nd due to a small explosion producing an ash plume up to approximately 3.8 km altitude (about 800 m above the summit) and minor ashfall to 15 km SW. This was followed by a block-and-ash flow reaching as far as 1.2 km and lasting for 125 seconds (figure 89). Preceding the explosion there was an increase in temperature at several locations on the dome. Weak gas plumes were observed up to 100 m above the crater throughout the month.
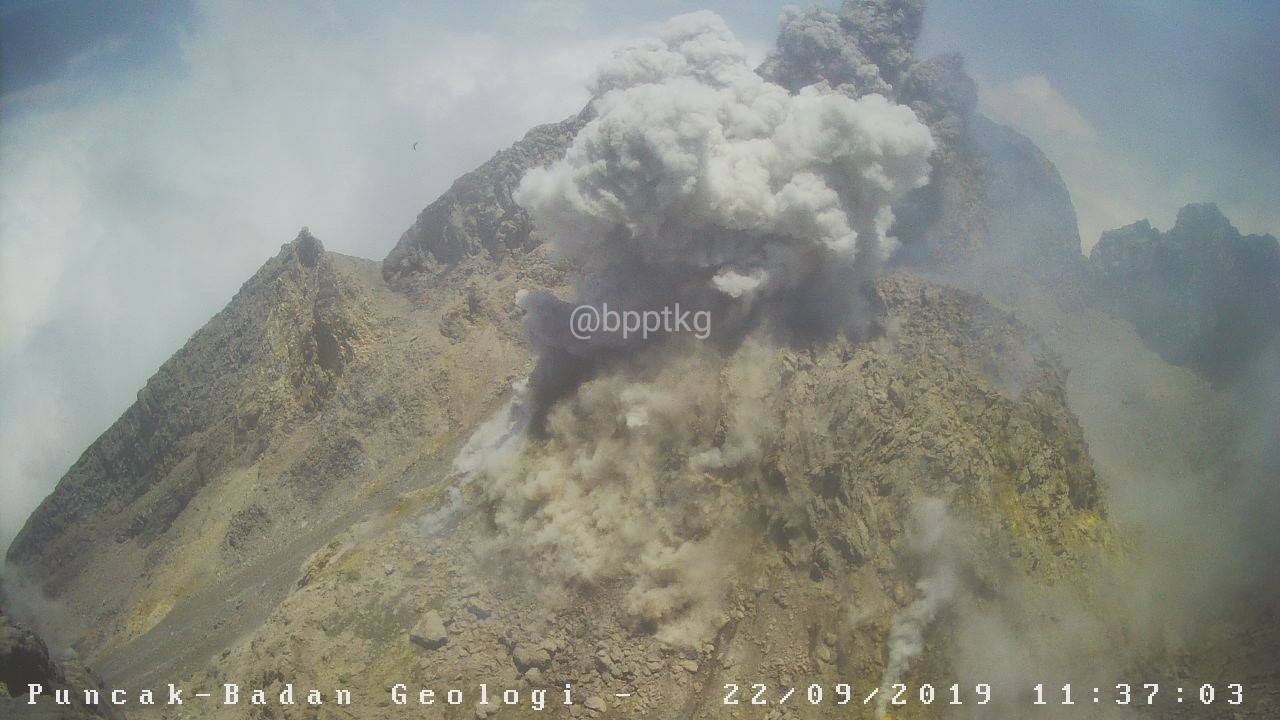 |
Figure 89. An explosion at Merapi on 22 September 2019 was followed by a block-and-ash flow that reached 1.2 km down the Gendol drainage. Courtesy of BPPTKG. |
Information Contacts: Balai Penyelidikan dan Pengembangan Teknologi Kebencanaan Geologi (BPPTKG), Center for Research and Development of Geological Disaster Technology (URL: http://merapi.bgl.esdm.go.id/, Twitter: @BPPTKG); Pusat Vulkanologi dan Mitigasi Bencana Geologi (PVMBG, also known as Indonesian Center for Volcanology and Geological Hazard Mitigation, CVGHM), Jalan Diponegoro 57, Bandung 40122, Indonesia (URL: http://www.vsi.esdm.go.id/); MAGMA Indonesia, Kementerian Energi dan Sumber Daya Mineral (URL: https://magma.vsi.esdm.go.id/); Badan Nasional Penanggulangan Bencana (BNPB), National Disaster Management Agency, Graha BNPB - Jl. Scout Kav.38, East Jakarta 13120, Indonesia (URL: http://www.bnpb.go.id/, Twitter: https://twitter.com/BNPB_Indonesia); Øystein Lund Andersen (Twitter: @OysteinLAnderse, URL: http://www.oysteinlundandersen.com); Sutopo Purwo Nugroho, BNPB (Twitter: @Sutopo_PN, URL: https://twitter.com/Sutopo_PN); Brett Carr, Lamont-Doherty Earth Observatory, Columbia University, 61 Route 9W, Palisades, NY, USA (URL: https://www.ldeo.columbia.edu/user/bcarr).
Explosions produced ash plumes, ashfall, and pyroclastic flows during October 2019-March 2020
Merapi is a highly active stratovolcano located in Indonesia, just north of the city of Yogyakarta. The current eruption episode began in May 2018 and was characterized by phreatic explosions, ash plumes, block avalanches, and a newly active lava dome at the summit. This reporting period updates information from October 2019-March 2020 that includes explosions, pyroclastic flows, ash plumes, and ashfall. The primary reporting source of activity comes from Balai Penyelidikan dan Pengembangan Teknologi Kebencanaan Geologi (BPPTKG, the Center for Research and Development of Geological Disaster Technology, a branch of PVMBG) and Pusat Vulkanologi dan Mitigasi Bencana Geologi (PVMBG, also known as Indonesian Center for Volcanology and Geological Hazard Mitigation, CVGHM).
Some ongoing lava dome growth continued in October 2019 in the NE-SW direction measuring 100 m in length, 30 m in width, and 20 m in depth. Gas-and-steam emissions were frequent, reaching a maximum height of 700 m above the crater on 31 October. An explosion at 1631 on 14 October removed the NE-SW trending section of the lava dome and produced an ash plume that rose 3 km above the crater and extended SW for about 2 km (figures 90 and 91). The plume resulted in ashfall as far as 25 km to the SW. According to a Darwin VAAC notice, a thermal hotspot was detected in HIMAWARI-8 satellite imagery. A pyroclastic flow associated with the eruption traveled down the SW flank in the Gendol drainage. During 14-20 October lava flows from the crater generated block-and-ash flows that traveled 1 km SW, according to BPPTKG.
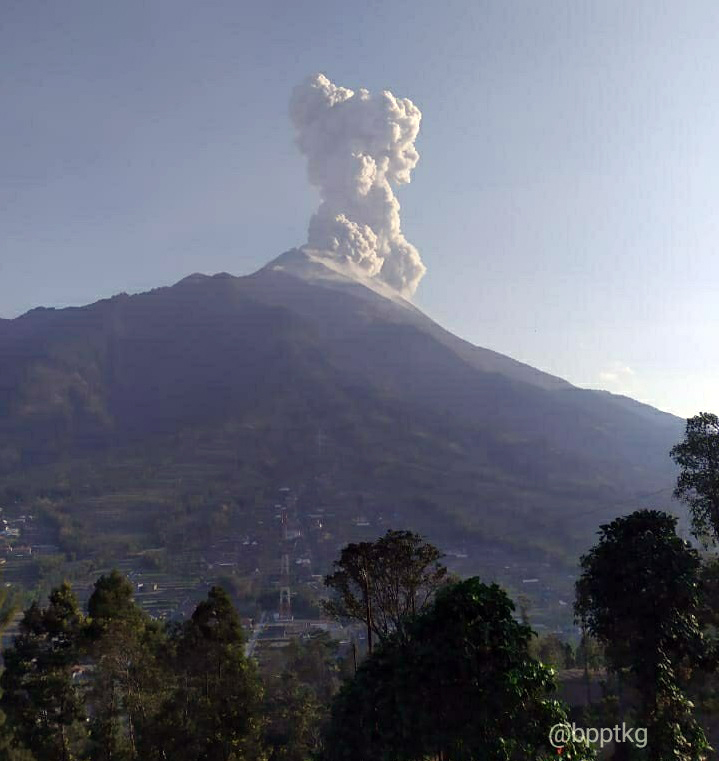 |
Figure 90. An ash plume rising 3 km above Merapi on 14 October 2019. Courtesy of BPPTKG. |
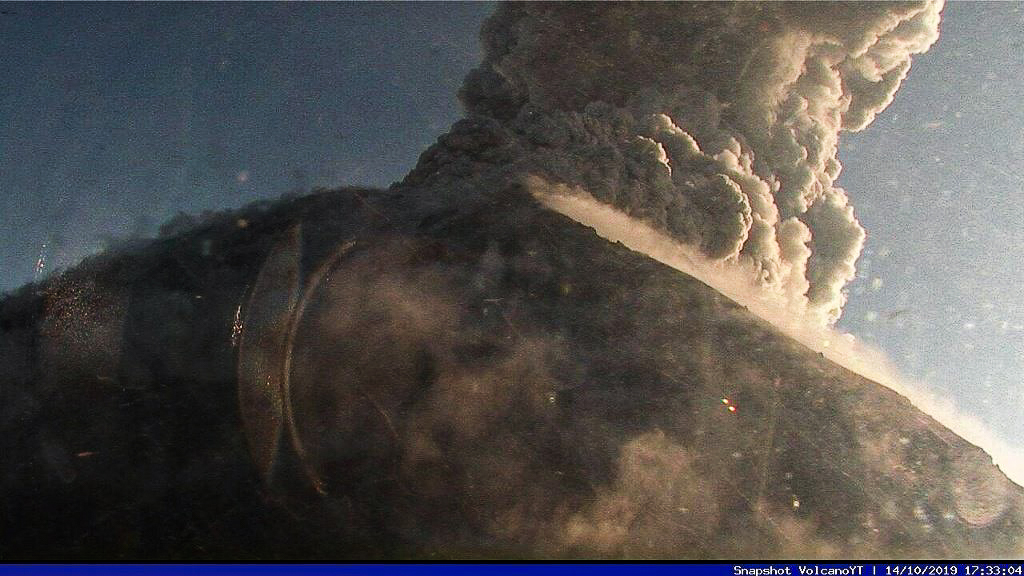 |
Figure 91. Webcam image of an ash plume rising above Merapi at 1733 on 14 October 2019. Courtesy of BPPTKG via Jaime S. Sincioco. |
At 0621 on 9 November 2019, an eruption produced an ash plume that rose 1.5 km above the crater and drifted W. Ashfall was observed in the W region as far as 15 km from the summit in Wonolelo and Sawangan in Magelang Regency, as well as Tlogolele and Selo in Boyolali Regency. An associated pyroclastic flow traveled 2 km down the Gendol drainage on the SE flank. On 12 November aerial drone photographs were used to measure the volume of the lava dome, which was 407,000 m3. On 17 November, an eruption produced an ash plume that rose 1 km above the crater, resulting in ashfall as far as 15 km W from the summit in the Dukun District, Magelang Regency (figure 92). A pyroclastic flow accompanying the eruption traveled 1 km down the SE flank in the Gendol drainage. By 30 November low-frequency earthquakes and CO2 gas emissions had increased.
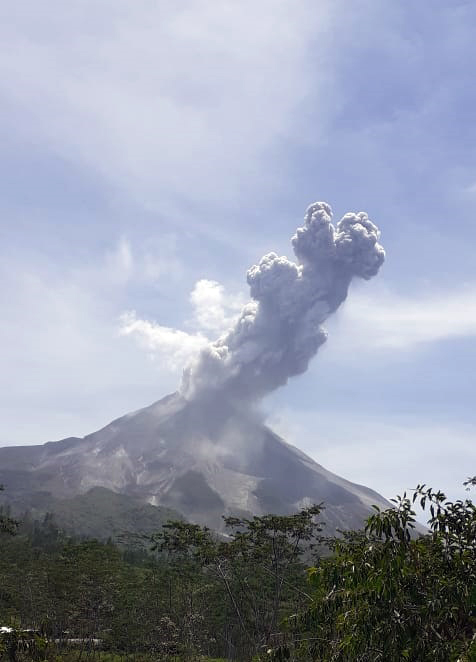 |
Figure 92. An ash plume rising 1 km above Merapi on 17 November 2019. Courtesy of BPPTKG. |
Volcanism was relatively low from 18 November 2019 through 12 February 2020, characterized primarily by gas-and-steam emissions and intermittent volcanic earthquakes. On 4 January a pyroclastic flow was recorded by the seismic network at 2036, but it wasn’t observed due to weather conditions. On 13 February an explosion was detected at 0516, which ejected incandescent material within a 1-km radius from the summit (figure 93). Ash plumes rose 2 km above the crater and drifted NW, resulting in ashfall within 10 km, primarily S of the summit; lightning was also seen in the plume. Ash was observed in Hargobinangun, Glagaharjo, and Kepuharjo. On 19 February aerial drone photographs were used to measure the change in the lava dome after the eruption; the volume of the lava had decreased, measuring 291,000 m3.
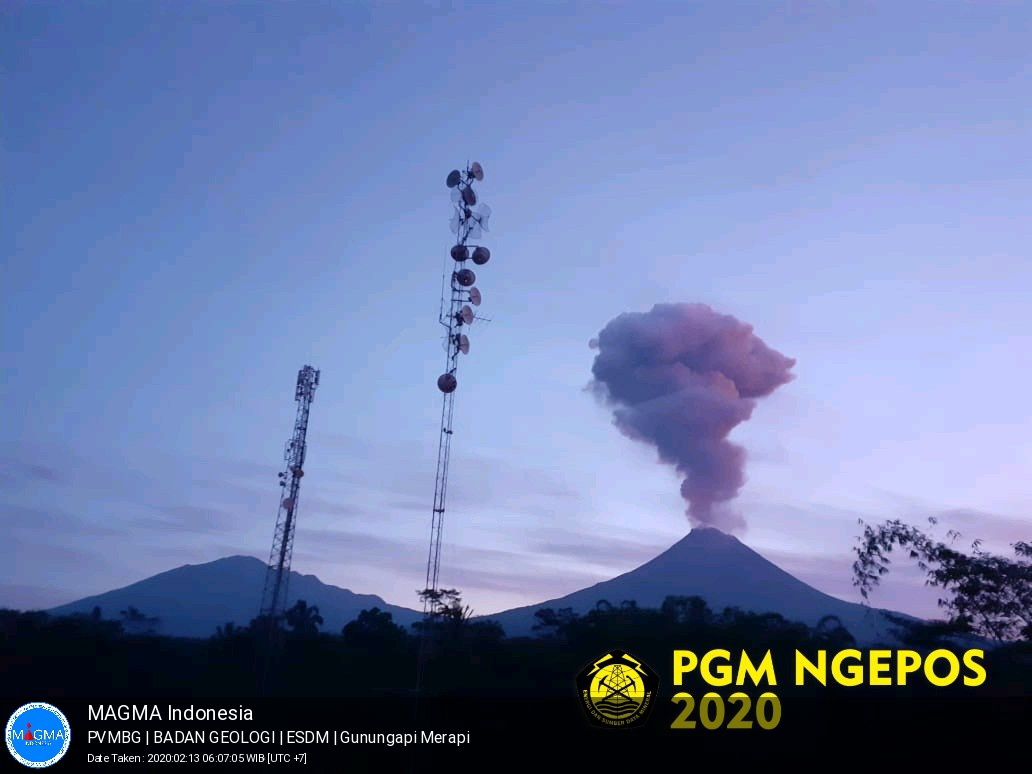 |
Figure 93. Webcam image of an ash plume rising from Merapi at 0516 on 13 February 2020. Courtesy of MAGMA Indonesia and PVMBG. |
An explosion on 3 March at 0522 produced an ash plume that rose 6 km above the crater (figure 94), resulting in ashfall within 10 km of the summit, primarily to the NE in the Musuk and Cepogo Boyolali sub-districts and Mriyan Village, Boyolali (3 km from the summit). A pyroclastic flow accompanied this eruption, traveling down the SSE flank less than 2 km. Explosions continued to be detected on 25 and 27-28 March, resulting in ash plumes. The eruption on 27 March at 0530 produced an ash plume that rose 5 km above the crater, causing ashfall as far as 20 km to the W in the Mungkid subdistrict, Magelang Regency, and Banyubiru Village, Dukun District, Magelang Regency. An associated pyroclastic flow descended the SSE flank, traveling as far as 2 km. The ash plume from the 28 March eruption rose 2 km above the crater, causing ashfall within 5 km from the summit in the Krinjing subdistrict primarily to the W (figure 94).
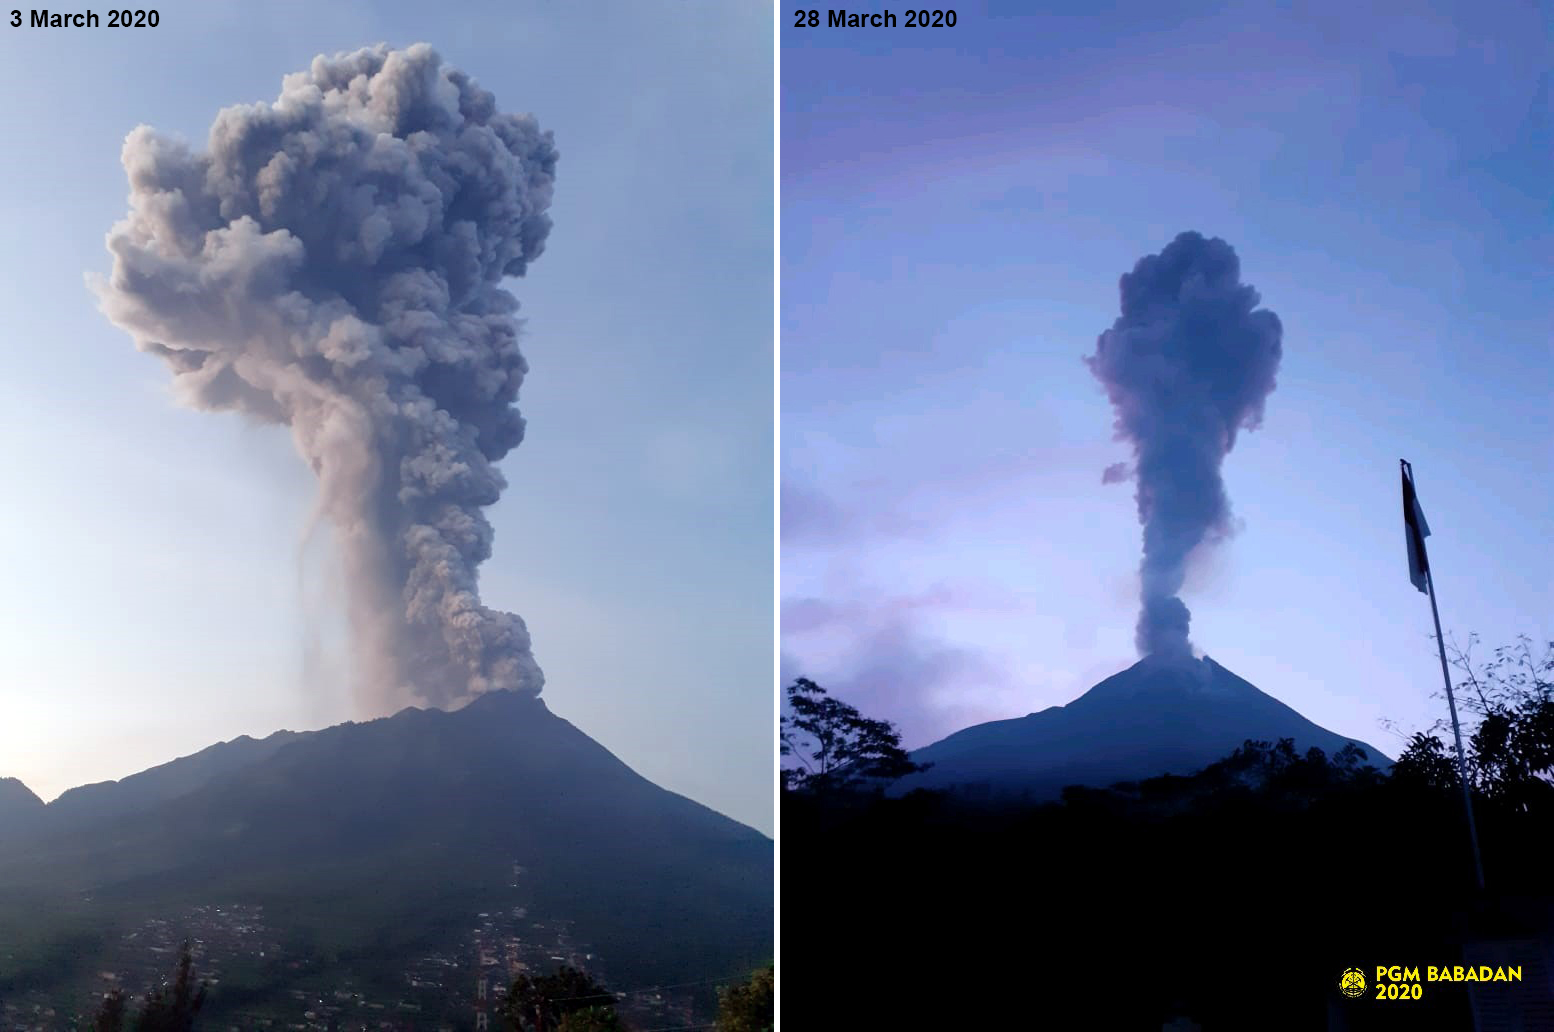 |
Figure 94. Images of ash plumes rising from Merapi during 3 March (left) and 28 March 2020 (right). Images courtesy of BPPTKG (left) and PVMBG (right). |
Information Contacts: Balai Penyelidikan dan Pengembangan Teknologi Kebencanaan Geologi (BPPTKG), Center for Research and Development of Geological Disaster Technology (URL: http://merapi.bgl.esdm.go.id/, Twitter: @BPPTKG); Pusat Vulkanologi dan Mitigasi Bencana Geologi (PVMBG, also known as Indonesian Center for Volcanology and Geological Hazard Mitigation, CVGHM), Jalan Diponegoro 57, Bandung 40122, Indonesia (URL: http://www.vsi.esdm.go.id/); Badan Nasional Penanggulangan Bencana (BNPB), National Disaster Management Agency, Graha BNPB - Jl. Scout Kav.38, East Jakarta 13120, Indonesia (URL: http://www.bnpb.go.id/, Twitter: https://twitter.com/BNPB_Indonesia); MAGMA Indonesia, Kementerian Energi dan Sumber Daya Mineral (URL: https://magma.vsi.esdm.go.id/); Darwin Volcanic Ash Advisory Centre (VAAC), Bureau of Meteorology, Northern Territory Regional Office, PO Box 40050, Casuarina, NT 0811, Australia (URL: http://www.bom.gov.au/info/vaac/); Jamie S. Sincioco, Phillipines (Twitter: @jaimessincioco, Image at https://twitter.com/jaimessincioco/status/1227966075519635456/photo/1).
Eruptions in April and June 2020 produced ash plumes and ashfall
Merapi, located just north of the city of Yogyakarta, Indonesia, is a highly active stratovolcano; the current eruption began in May 2018. Volcanism has recently been characterized by lava dome growth and collapse, small block-and-ash flows, explosions, ash plumes, ashfall, and pyroclastic flows (BGVN 44:10 and 45:04). Activity has recently consisted of three large eruptions in April and June, producing dense gray ash plumes and ashfall in June. Dominantly, white gas-and-steam emissions have been reported during April-September 2020. The primary reporting source of activity comes from Balai Penyelidikan dan Pengembangan Teknologi Kebencanaan Geologi (BPPTKG, the Center for Research and Development of Geological Disaster Technology, a branch of PVMBG), the Pusat Vulkanologi dan Mitigasi Bencana Geologi (PVMBG, also known as Indonesian Center for Volcanology and Geological Hazard Mitigation, CVGHM), and the Darwin Volcanic Ash Advisory Centre (VAAC).
Activity at Merapi dominantly consisted of frequent white gas-and-steam emissions that generally rose 20-600 m above the crater (figure 95). On 2 April an eruption occurred at 1510, producing a gray ash plume that rose 3 km above the crater, and accompanied by white gas-and-steam emissions up to 600 m above the crater. A second explosion on 10 April at 0910 generated a gray ash plume rising 3 km above the crater and drifting NW, accompanied by white gas-and-steam emissions rising 300 m above the crater (figure 96). Activity over the next six weeks consisted primarily of gas-and-steam emissions.
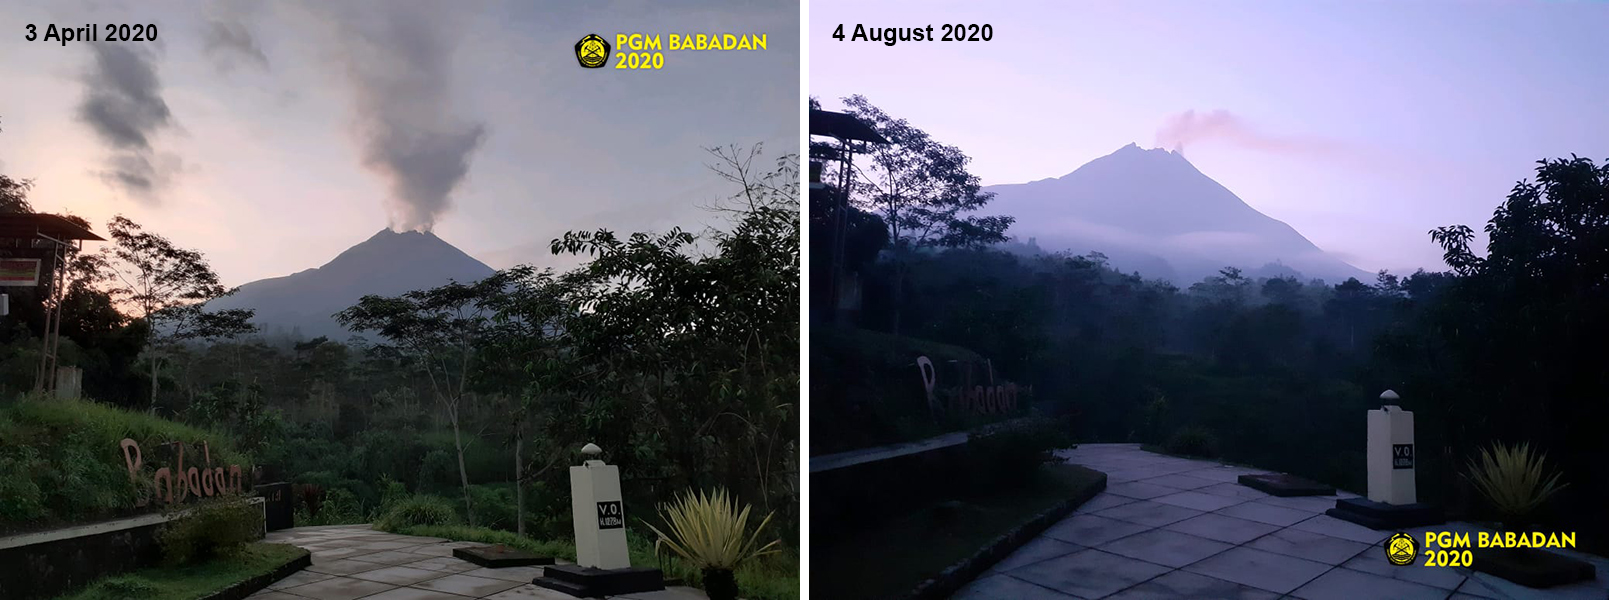 |
Figure 95. Gas-and-steam emissions were frequently observed rising from Merapi as seen on 3 April (left) and 4 August (right) 2020. Courtesy of BPPTKG. |
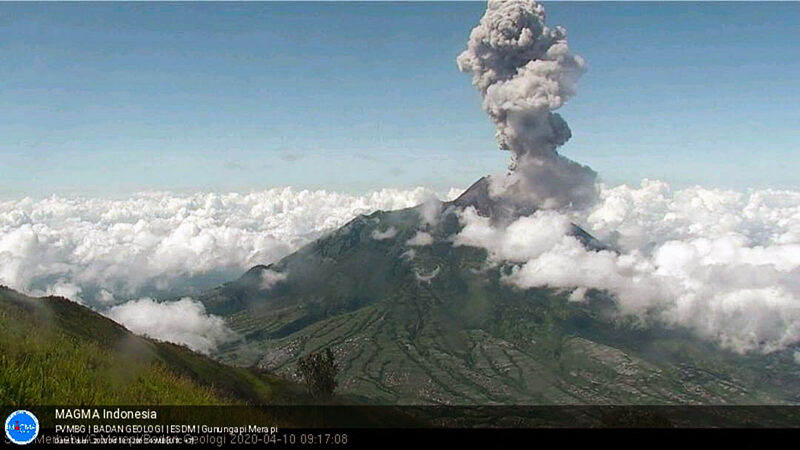 |
Figure 96. Webcam image showed an ash plume rising 3 km above the crater of Merapi at 0917 on 10 April 2020. Courtesy of BPPTKG and MAGMA Indonesia. |
On 8 June PVMBG reported an increase in seismicity. Aerial photos from 13 June taken using drones were used to measure the lava dome, which had decreased in volume to 200,000 m3, compared to measurements from 19 February 2020 (291,000 m3). On 21 June two explosions were recorded at 0913 and 0927; the first explosion lasted less than six minutes while the second was less than two minutes. A dense, gray ash plume reached 6 km above the crater drifting S, W, and SW according to the Darwin VAAC notice and CCTV station (figure 97), which resulted in ashfall in the districts of Magelang, Kulonprogo, and as far as the Girimulyo District (45 km). During 21-22 June the gas-and-steam emissions rose to a maximum height of 6 km above the crater. The morphology of the summit crater had slightly changed by 22 June. Based on photos from the Ngepos Post, about 19,000 m3 of material had been removed from the SW part of the summit, likely near or as part of the crater rim. On 11 and 26 July new measurements of the lava dome were taken, measuring 200,000 m3 on both days, based on aerial photos using drones. Gas-and-steam emissions continued through September.
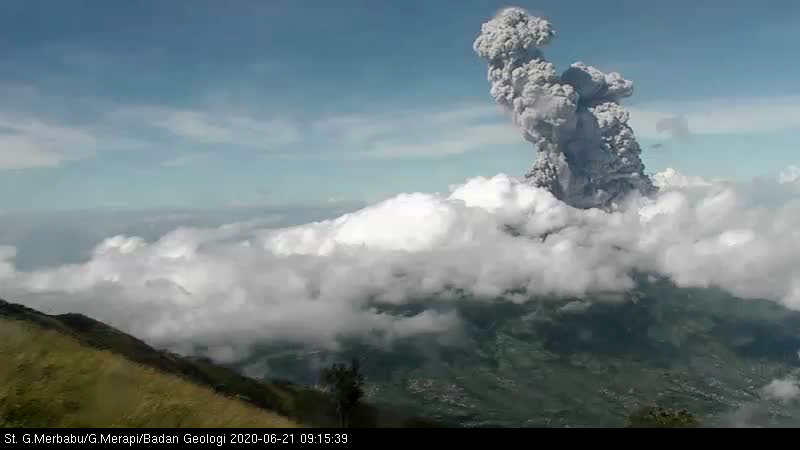 |
Figure 97. Webcam image showed an ash plume rising 6 km above the crater of Merapi at 0915 on 21 June 2020. Courtesy of BPPTKG. |
Information Contacts: Balai Penyelidikan dan Pengembangan Teknologi Kebencanaan Geologi (BPPTKG), Center for Research and Development of Geological Disaster Technology (URL: http://merapi.bgl.esdm.go.id/, Twitter: @BPPTKG); Pusat Vulkanologi dan Mitigasi Bencana Geologi (PVMBG, also known as Indonesian Center for Volcanology and Geological Hazard Mitigation, CVGHM), Jalan Diponegoro 57, Bandung 40122, Indonesia (URL: http://www.vsi.esdm.go.id/); MAGMA Indonesia, Kementerian Energi dan Sumber Daya Mineral (URL: https://magma.vsi.esdm.go.id/); Darwin Volcanic Ash Advisory Centre (VAAC), Bureau of Meteorology, Northern Territory Regional Office, PO Box 40050, Casuarina, NT 0811, Australia (URL: http://www.bom.gov.au/info/vaac/).
New domes appear in January and February 2021; large explosion on 27 January
Merapi volcano in central Java, Indonesia, has a lengthy history of major eruptive episodes. Activity has included lava flows, pyroclastic flows, lahars, Plinian explosions with heavy ashfall, incandescent block avalanches, block-and-ash flows, and dome growth and destruction. Fatalities from these events were reported in 1994, 2006, and in 2010 when hundreds of thousands of people were evacuated. Renewed phreatic explosions in May 2018 cancelled airline fights and generated significant SO2 plumes. A new lava dome appeared in early August 2018; gradual dome growth and then destruction was accompanied by rockfalls, block-and-ash flows, periodic explosions, and pyroclastic flows through June 2020. The period from October 2020 through February 2021 is covered in this report and includes the growth of two new domes in early 2021. Information is provided primarily by Balai Penyelidikan dan Pengembangan Teknologi Kebencanaan Geologi (BPPTKG), the Center for Research and Development of Geological Disaster Technology, a branch of PVMBG, which monitors activity specifically at Merapi, the Pusat Vulkanologi dan Mitigasi Bencana Geologi (PVMBG, also known as Indonesian Center for Volcanology and Geological Hazard Mitigation, CVGHM), and the Darwin Volcanic Ash Advisory Centre (VAAC).
Measurements in late July 2020 showed no change in the dome (BGVN 45:10), though satellite evidence for weak thermal activity near the NW crater rim persisted during August-October 2020 (figure 98). A significant increase in the deformation rate and the appearance of numerous rock avalanches at the end of October led PVMBG to raise the Alert Level from II to III and evacuate hundreds of local residents. During November and December 2020 the deformation rate continued to increase and numerous rock avalanches were reported. Incandescent block avalanches were first reported on 4 January 2021. Block-and-ash flows began on 7 January and increased in frequency throughout the month; a new dome was confirmed that day. The deformation rate decreased significantly as the dome grew in size during January. Hundreds of incandescent block avalanches were recorded through the end of the month. A large explosion on 27 January produced a 12.2-km-high ash plume and a large pyroclastic flow; ashfall was reported in numerous communities. Incandescent block avalanches and block-and-ash flows continued frequently during February 2021; a second dome was reported growing near the center of the summit crater on 17 February.
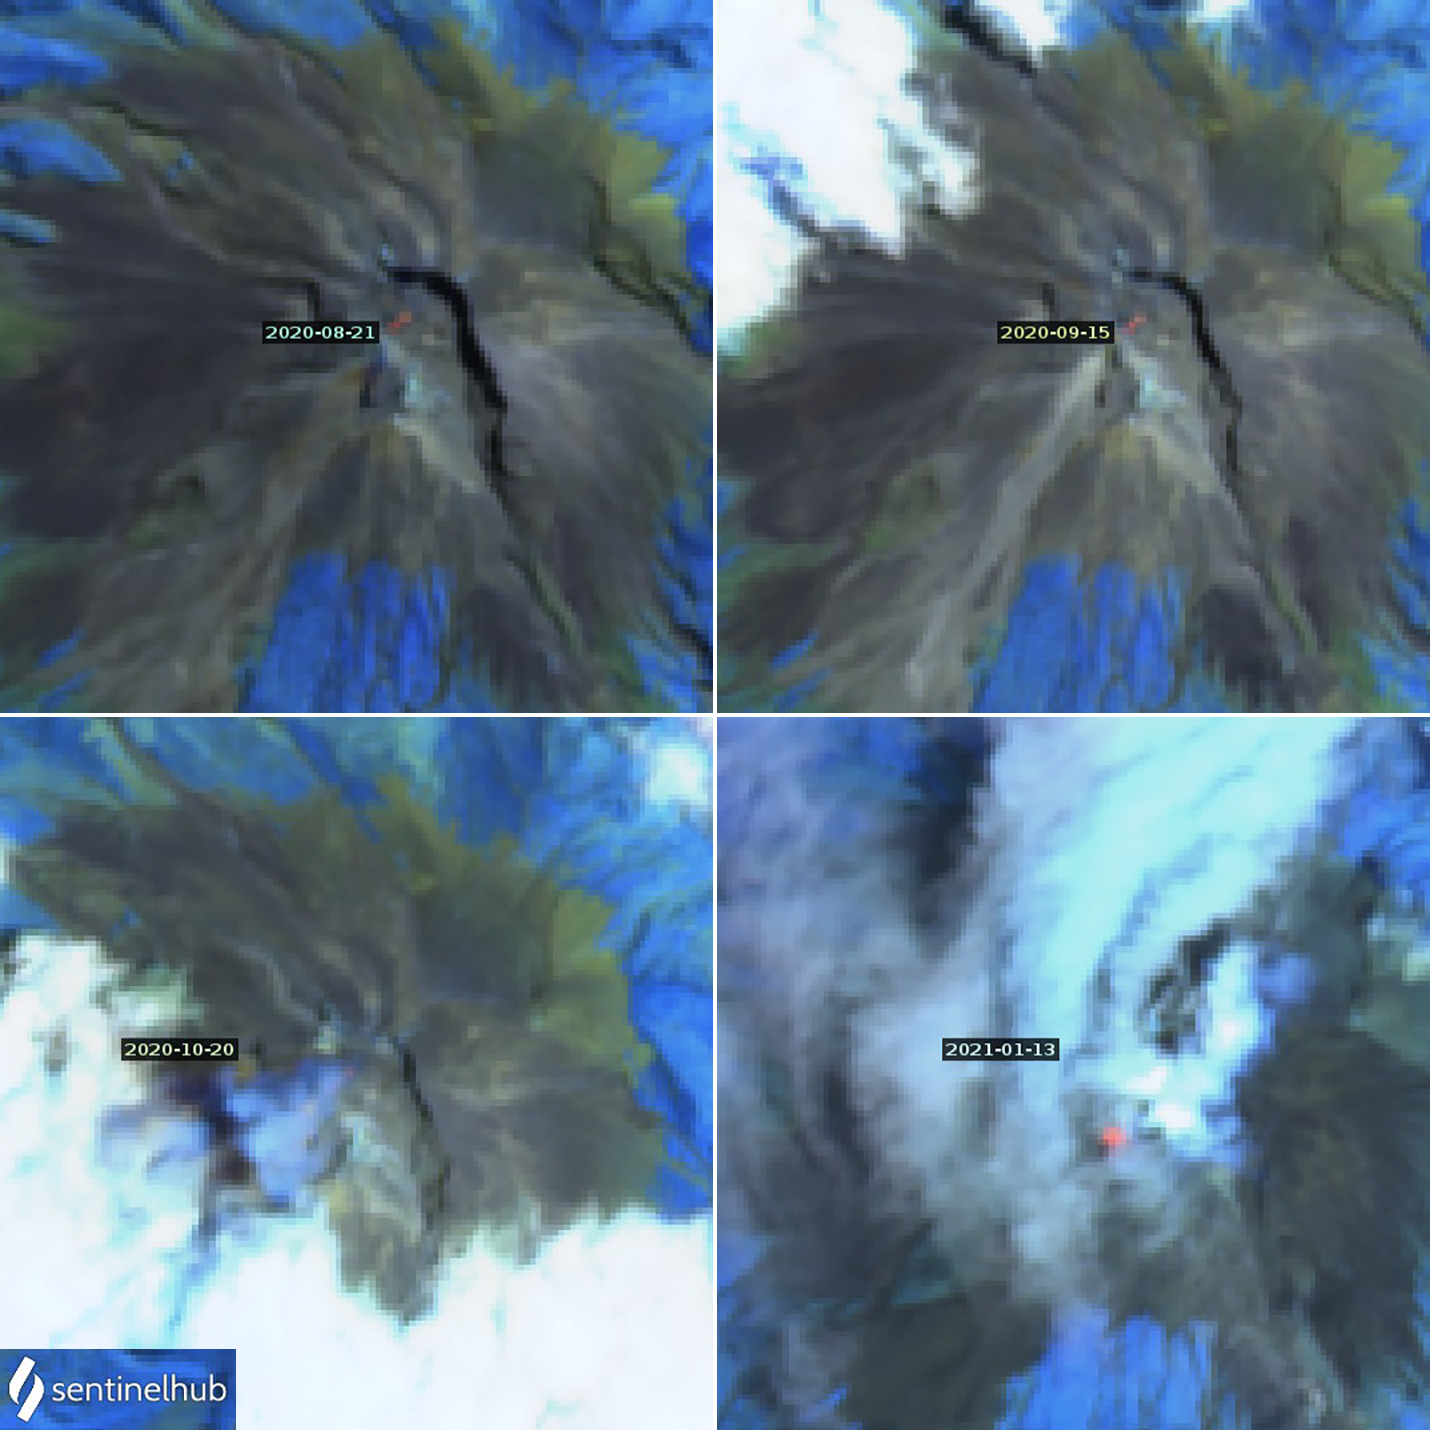 |
Figure 98. A very small thermal anomaly was recorded in Sentinel-2 satellite data near the NW crater rim at the summit of Merapi during August-October 2020, along with gas emissions. Images are from 21 August 2020 (top left), 15 September 2020 (top right), 20 October 2020 (bottom left), and 13 January 2021 (bottom right). The January anomaly was much larger, noticeable even through cloud cover, six days after PBBTKG scientists confirmed the presence of a new dome growing near the SW crater rim. Courtesy of Sentinel Hub Playground. |
The deformation rate at the summit, shortening determined by Electronic Distance Measurements (EDM) interpreted by PBBTK as inflation related to magma moving towards the surface, remained between 1-2 cm per week during August through early -October with just steam-and-gas plumes rising 150-250 m. During the week of 9-15 October PBBTKG reported a deformation rate of 1 cm/day. Drone photographs confirmed no change in the size or shape of the dome on 18 October 2020. The shortening rate increased to 2 cm/day during 16-22 October and the steam-and-gas plumes rose up to 500 m above the summit; the shortening rate increased to 4 cm/day during 23-29 October. PVMBG reported on 28 October that rock avalanches were heard twice in Babadan and Jrakah over the previous 24 hours, but fog prevented observations.
PVMBG raised the Alert Level from II to III on 5 November 2020 based on an increase in both seismicity and the deformation rate. Rock avalanches were heard that day from Babadan. Analyses of the crater area based on photographs from 30 October and 3 November did not show any morphological changes at the dome. The shortening rate, however, increased to 9-10 cm/day during the first three weeks of the month. Rock avalanches were observed on 8 November on the W flank moving as far as 3 km downslope and moving 2 km on 14 November. Photos comparing the SE flank on 11 and 19 November showed that part of the 2018 lava dome had collapsed. Drone images on 16 November also showed a collapse of part of the crater wall. On 22 November rock avalanches from the crater rim moved 1 km down the W flank. Steam and gas emissions were observed from the Babadan Observation Post rising 200-750 m above the summit during the second half of November (figure 99. A photo analysis on 26 November indicated that part of the 1954 lava dome had collapsed since 19 November. The deformation rate had increased to 11 cm/day by the last week of the month. During overflights on 26 and 27 November BNPB and BPPTKG observers noted many new avalanche deposits on the NW, W, and SW flanks. As of 27 November, there were 2,318 people who had been evacuated from the area around the volcano.
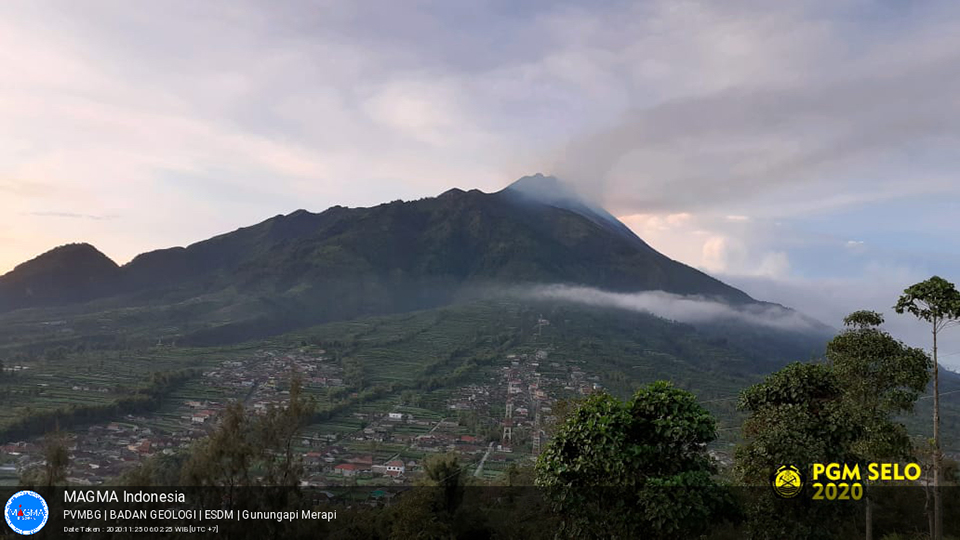 |
Figure 99. Steam and gas emissions at Merapi were observed from the Babadan Observation Post rising 200-750 m above the summit during the second half of November, including on 25 November 2020 shown here. Courtesy of MAGMA Indonesia Volcano Photo Gallery. |
Steam and gas plumes rose 150-400 m above the summit throughout December 2020. Rock avalanches were heard but not seen due to foggy weather during the first few days of the month. On 8 December they were seen falling 200 m upstream of Kali Lamat on the W flank and on 14 December they were observed moving downslope 1.5 km on the NW flank upstream of the Senowo River. Rock avalanches were also observed on 23 December moving 1.5 km down the W flank above Kali Sat ravine and on 31 December moving the same distance above the Senowo River. The deformation rate remained high during December, ranging from 9-11 cm/day through 24 December; it rose to 14 cm/day during the last week. Minor changes were seen in photographs of the summit area, but drone data on 5 and 14 December showed no new lava dome. No lava dome was visible in a clear view of the upper part of the SW flank on 20 December (figure 100); the head of BPPTKG-PVMBG noted that the first observed incandescence in that area was on 31 December.
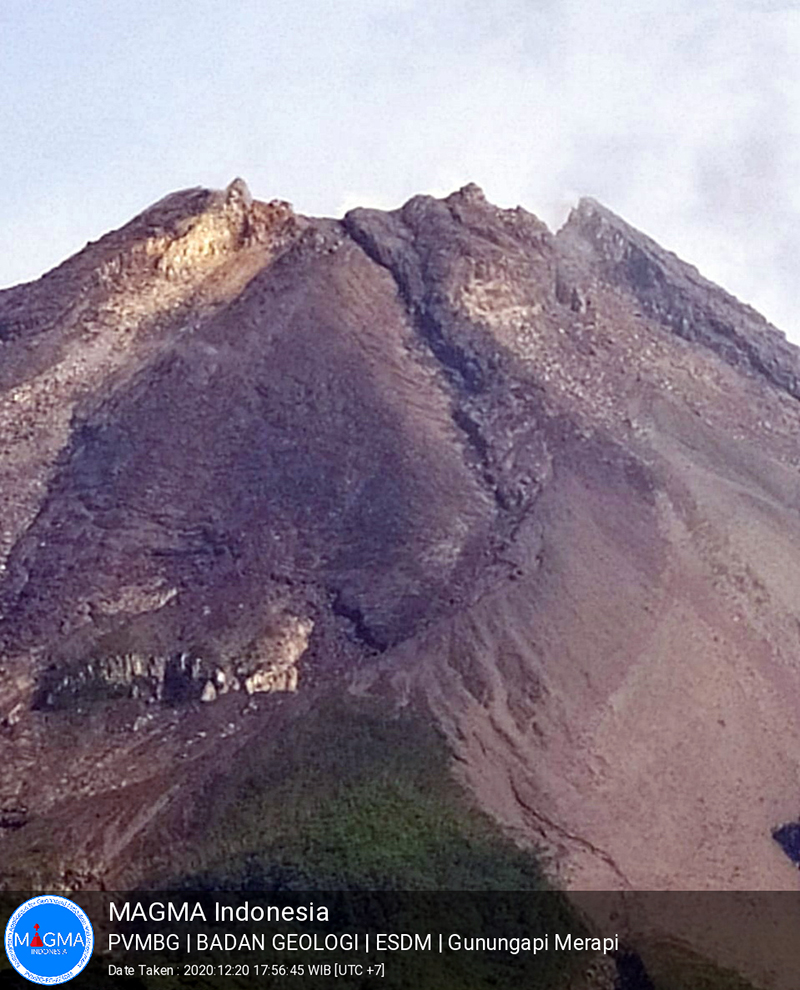 |
Figure 100. No lava dome was visible in a clear view of the upper part of the SW flank of Merapi on 20 December 2020, although rock avalanches had occurred a number of times during the month; the head of BPPTKG-PVMBG noted that the first observed incandescence in that area was on 31 December. Courtesy of BPPTKG and MAGMA Indonesia Volcano Photo Gallery. |
The deformation rate remained very high at 15 cm/day during the first week of January 2021. Rock avalanches were observed on 1 and 3 January that moved 1.5 km from the summit towards Kali Lamat and Kali Senowo on the W and NW flanks. On 4 January incandescent material was observed with a thermal webcam, and rock avalanches were heard at the Babadan Observation Post (figure 101). Incandescent block avalanches were observed 19 times during 4-7 January, traveling 800 m to the upper reaches of Kali Krasak (figure 102). Four block-and-ash flows occurred on 7 January, moving less than 1 km downslope. Comparison of images between 24 December and 7 January revealed a new lava dome. Hanik Humaida, the head of BPPTKG-PVMBG concluded that incandescent lava had appeared at the bottom of the 1997 dome and noted that incandescence had first been observed late on 31 December. PVMBG issued VONAs on 7 and 9 January reporting block-and-ash flows that produced ash plumes which rose to 3.2 km altitude and drifted SW and NW.
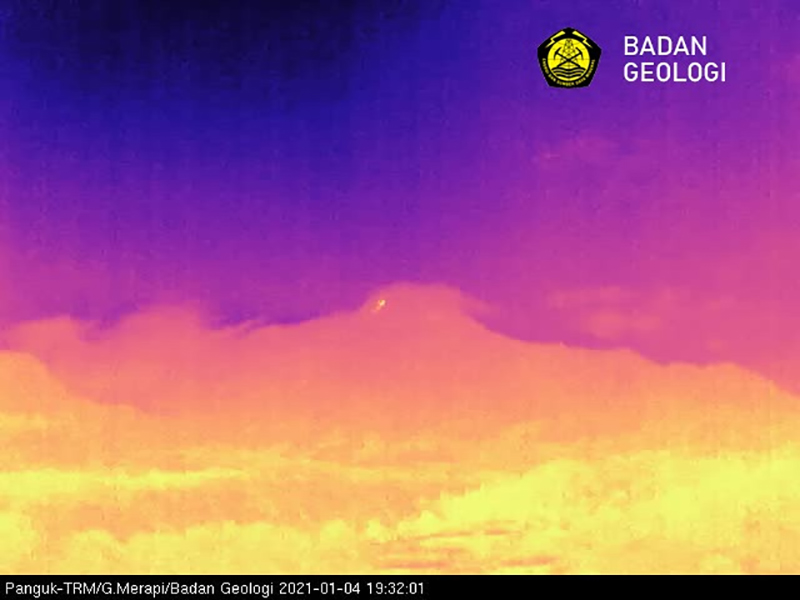 |
Figure 101. Incandescence from the growth of a new dome at Merapi on the SW flank appeared in a thermal webcam image on 4 January 20201. Courtesy of BPPTKG (Terjadi Peningkatan Aktivitas Vulkanik, Teramati Guguran Lava Pijar di Gunung Merapi, 5 January 2021). |
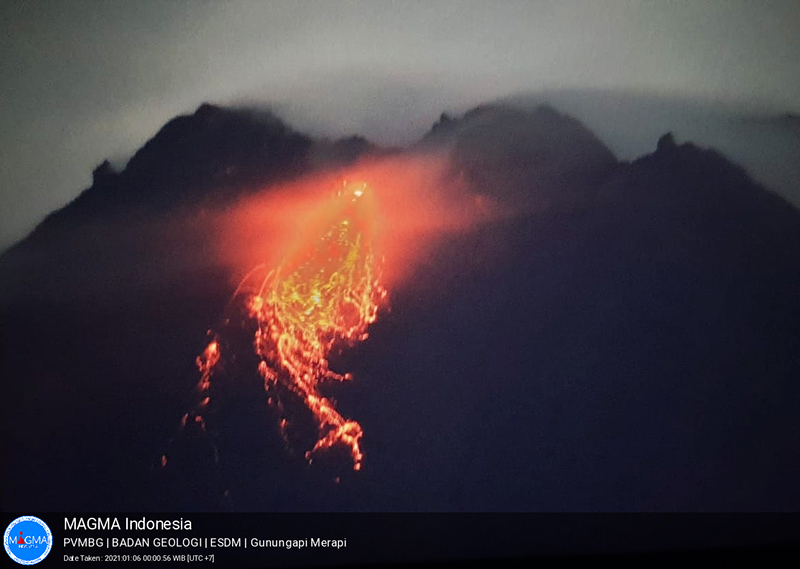 |
Figure 102. Numerous incandescent blocks fell down the SW flank of Merapi from the new lava dome, seen here on 6 January 2021. Courtesy of BPPTKG and MAGMA Indonesia Volcano Photo Gallery. |
Incandescent block avalanches were observed 128 times during the second week of January moving as far as 900 m down the SW flank to the upper reaches of Kali Krasak. Two block-and-ash flows were also reported. On 14 January 2021, the measured volume of the new dome was 46,766 m3 with a growth rate of about 8,500 m3/day. Deformation decreased significantly to a shortening rate of 6 cm/day during the second week of the month. Incandescent avalanches continued at a high rate and were reported 282 times during the third week of January (figure 103); they traveled as far as 1,000 m to the upper reaches of the Kali Krasak and Kali Boyong. Block-and-ash flows were recorded 19 times during 15-21 January moving 1,800 m downslope to the SW (figure 104). Compared to the previous week, as measured on 21 January, the new dome had more than doubled in size to 104,000 m3 with an average growth rate of 8,600 m3/day.
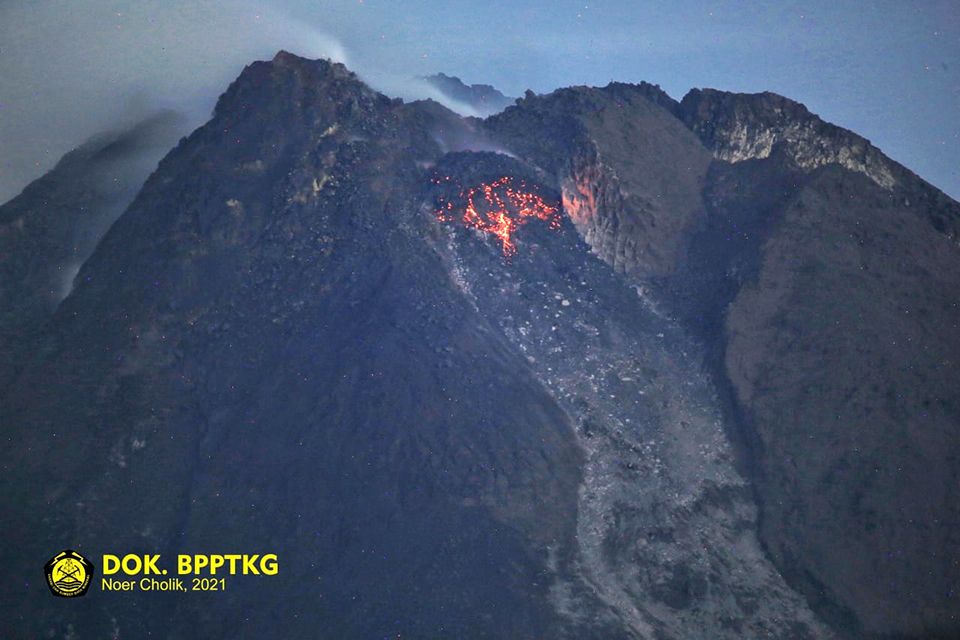 |
Figure 103. There were 20 incandescent block avalanches that fell up to 1,000 m down the SW flank of Merapi from the new dome on 16 January 2021. Courtesy of BPPTKG. |
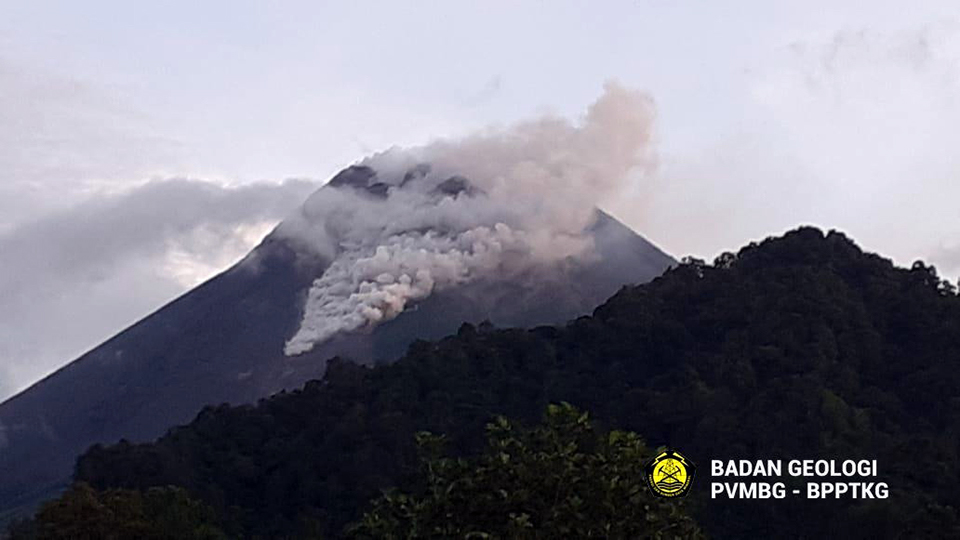 |
Figure 104. PVMBG reported a block-and-ash flow (referred to as Awan Panas Guguran or APG) at Merapi that traveled approximately 1,000 m down the SW flank towards Kali Krasak on 18 January 2021. Courtesy of BPPTKG and BNPB (Gunung Merapi Kembali Keluarkan Awan Panas Guguran Sejauh 1.000 Meter, 18 January 2021). |
The deformation rate decreased further to less than 1 cm/day by the end of the third week of January. A substantial block-and-ash flow on 19 January that moved 1,800 m down the Krasak and Boyong rivers produced a 500-m-high ash plume that drifted E. According to detikNews, ash fell on 19 January in several villages in Musuk and Tamansari Districts in the Boyolali Regency, and in the Kemalang District in the Klaten Regency (figure 105). The Darwin VAAC reported ash visible in the webcam on 20 and 26 January that drifted downwind close to the summit. Over 200 incandescent block avalanches were observed during the last week of January; the maximum distance traveled was 1,500 m down the SW flank. Block-and-ash flow activity increased significantly during 25-27 January with four flows on 25 January and 13 flows on 26 January which produced ash plumes that rose 300-400 m above the summit and traveled 600-1,500 m down the SW flank. PVMBG reported 31 block-and-ash flows on 27 January that traveled as far as 3 km down the SW flank (figure 106).
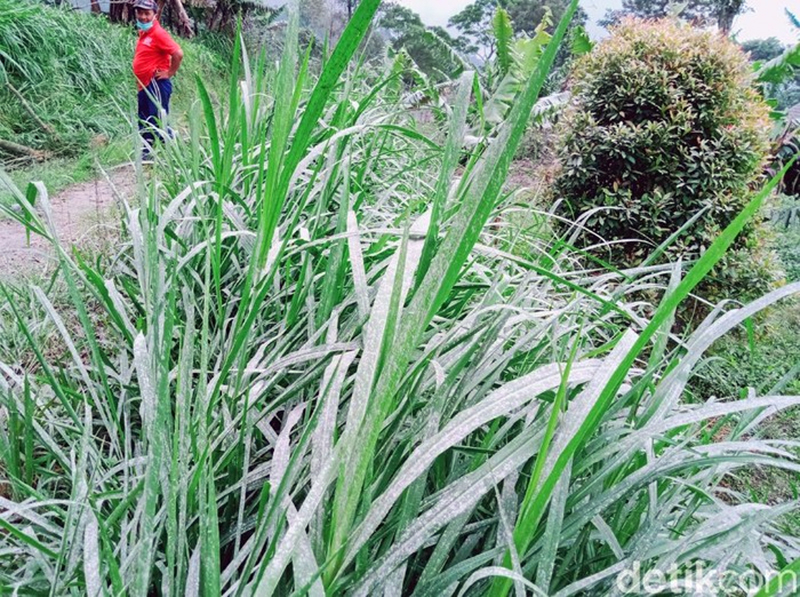 |
Figure 105. Ash from Merapi covered plants in Tegalmulyo Village, in the Klaten Regency on 19 January 2021. Photo by Achmad Syauqi, courtesy of detik.com. |
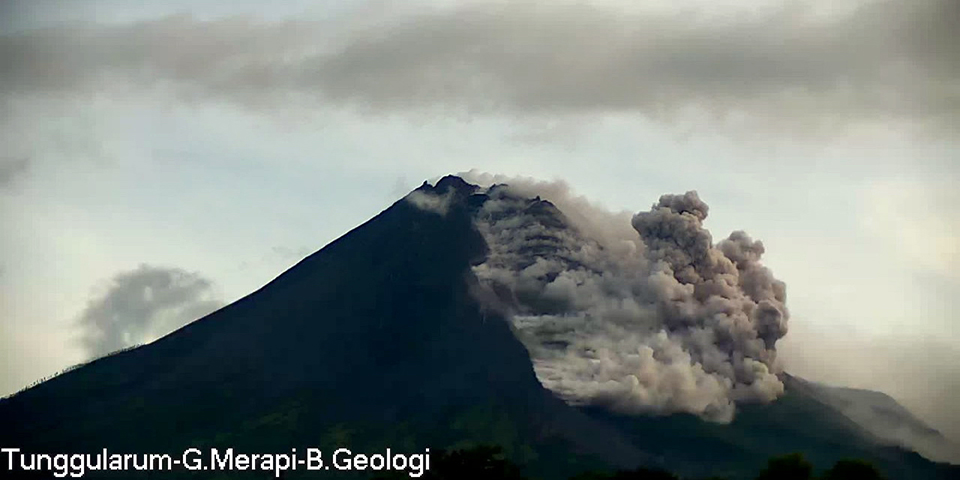 |
Figure 106. A block-and-ash flow at Merapi with it’s associated ash plume seen here on 27 January 2021 was one of 36 such events reported by BPPTKG that day; they traveled up to 3 km from the summit down the SW flank. Courtesy of BNPB (Gunung Merapi Erupsi Besar, Begini Penjelasan BPPTKG, 27 January 2021). |
The volume of the 2021 lava dome on 25 January 2021 was 157,000 m3, but by 28 January it was only 62,000 m3 as a result of block-and-ash flows, explosions, and pyroclastic flows that occurred on 26-27 January. An explosion on 27 January was reported by the Darwin VAAC, based on multiple ground reports of a significant eruption, although meteoric clouds obscured most ground observations. The ash plume rose to 12.2 km altitude, drifted NW, and was visible in satellite images. Ash emissions from a superheated pyroclastic flow rose to 6.1 km altitude and drifted NE (figure 107). Satellite imagery and pilot reports indicated that the 12.2 km ash plume dissipated after about five hours, while the plumes generated by the pyroclastic flow continued moving E at 3.7 km altitude for several more hours. Sand-sized ash was reported in several villages in the Tamansari District in Boyolali Regency on the E flank including the Dukuh Beling area, Sudimoro (Sangup Village), Lanjaran Village, Mriyan and in Boyolali City, Central Java on 27 January. Dense ash was also reported in Tegalmulyo Village; Sruni Village and Cluntang in the Musuk District also reported ashfall.
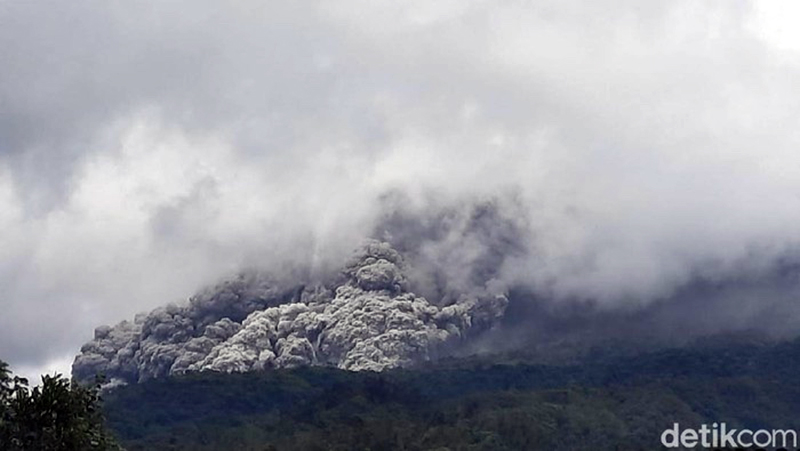 |
Figure 107. A significant explosion at Merapi on 27 January 2021 produced an ash plume to 12.2 km altitude that drifted NW and a pyroclastic flow that sent ash to 6.1 km altitude and drifted NE. The pyroclastic flow is seen here from Ngrangkah, Umbulharjo, Cangkringan, Sleman Regency. Photo by Jauh Hari Wawan S, courtesy of detik.com. |
Multiple incandescent rock avalanches were observed during the first week of February 2021. They traveled 500-1,200 m down the SW flank. On 4 February the volume of the 2021 lava dome on the SW flank was measured at 117,400 m3; the growth rate since 28 January was 12,600 m3/day. On 8 February, 23 incandescent block avalanches were reported that traveled as far as 1,500 m from the summit down the SW flank upstream of Kali Krasak and Kali Boyong. Six incandescent avalanches were reported on 9 February; webcams indicated multiple daily incandescent block avalanches for the rest of the month. When measured on 11 February, the dome had grown significantly to 295,000 m3 at a growth rate of 48,900 m3/day (figure 108).
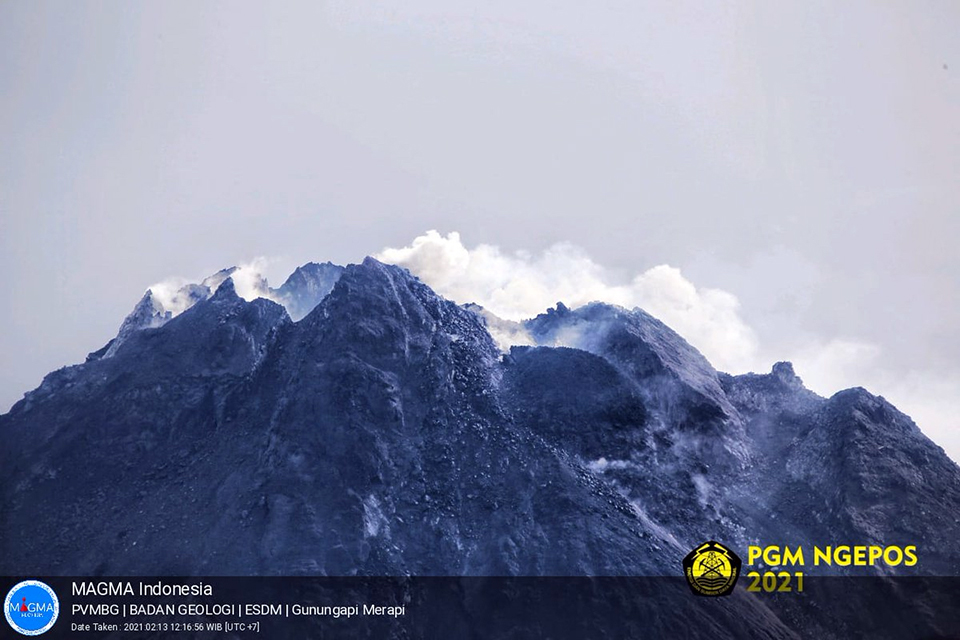 |
Figure 108. The 2021 lava dome at Merapi was located at the head of the SW flank, and was almost 300,000 m3 in size on 11 February, two days before this image taken on 13 February 2021. Courtesy of PVMBG and Rizal. |
A drone observation on 17 February noted two lava domes at the summit. The first (the 2021 lava dome) was located on the SW flank and was attached to the 1997 lava dome, and a second new dome had appeared more in the center of the summit crater. Based on calculations from aerial photographs, the dome on the SW flank was 258 m long, 133 m wide, and 30 m high, with a volume of 397,500 m3 and growth rate of 25,200 m3/day. The lava dome in the center of the summit crater was 160 m long, 120 m wide, and 50 m high, with a volume of 426,000 m3 and an average growth rate of 10,000 m3/day. Deformation data showed no changes during February. During 24-27 February one or two block-and-ash flows occurred each day, the largest travelled 1,900 m SW (figure 109). The block-and-ash flow on 25 February 2021 at 1652 local time (WIB) produced traces of ashfall in Kali Tengah Lor, Kali Tengah Kidul, Deles, and Tlukan. The volume of the lava dome on the SW flank on 25 February was 618,700 m3 with a growth rate of 13,600 m3/day.
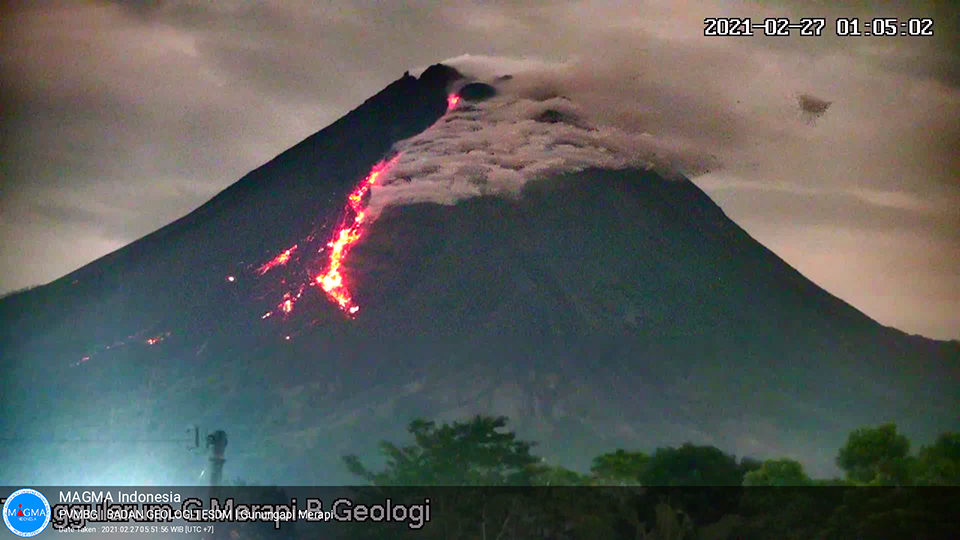 |
Figure 109. A block-and-ash flow at Merapi on 27 February 2021 descended hundreds of meters down the SW flank and sent ash drifting E mostly below the level of the summit. Courtesy of BPPTKG and MAGMA Indonesia Volcano Photo Gallery. |
Information Contacts: Pusat Vulkanologi dan Mitigasi Bencana Geologi (PVMBG, also known as Indonesian Center for Volcanology and Geological Hazard Mitigation, CVGHM), Jalan Diponegoro 57, Bandung 40122, Indonesia (URL: http://www.vsi.esdm.go.id/); MAGMA Indonesia, Kementerian Energi dan Sumber Daya Mineral (URL: https://magma.esdm.go.id/v1, https://magma.esdm.go.id/v1/gunung-api/gallery); Sentinel Hub Playground (URL: https://www.sentinel-hub.com/explore/sentinel-playground); Balai Penyelidikan dan Pengembangan Teknologi Kebencanaan Geologi (BPPTKG), Center for Research and Development of Geological Disaster Technology (URL: http://merapi.bgl.esdm.go.id/, https://twitter.com/BPPTKG/status/1350508928740675584); Badan Nasional Penanggulangan Bencana (BNPB), National Disaster Management Agency, Graha BNPB - Jl. Scout Kav.38, East Jakarta 13120, Indonesia (URL: http://www.bnpb.go.id/); Darwin Volcanic Ash Advisory Centre (VAAC), Bureau of Meteorology, Northern Territory Regional Office, PO Box 40050, Casuarina, NT 0811, Australia (URL: http://www.bom.gov.au/info/vaac/); Detik news (URL: https://news.detik.com/, https://news.detik.com/berita-jawa-tengah/d-5339832/hujan-abu-gunung-merapi-jangkau-desa-di-wilayah-krb-ii-klaten, https://news.detik.com/berita-jawa-tengah/d-5350542/gunung-merapi-erupsi-sirene-bahaya-meraung-warga-turun-ke-tempat-aman, https://news.detik.com/berita-jawa-tengah/d-5350625/gunung-merapi-erupsi-besar-boyolali-diguyur-hujan-abu-campur-pasir?_ga=2.230047007.2076450499.1612195171-14950811.1611700211); Rizal (URL: https://twitter.com/Rizal06691023/status/1360488059649757191).
Dome growth, incandescent avalanches, and block-and-ash flows during March-August 2021
Merapi volcano in central Java, Indonesia, has a lengthy history of major eruptive episodes. Activity has included lava flows, pyroclastic flows, lahars, Plinian explosions with heavy ashfall, incandescent block avalanches, block-and-ash flows, and dome growth and destruction. Fatalities from these events were reported in 1994, 2006, and in 2010 when hundreds of thousands of people were evacuated. Renewed phreatic explosions in May 2018 cancelled airline fights and generated significant SO2 plumes. A new lava dome appeared in early August 2018; gradual dome growth and destruction was accompanied by block avalanches, block-and-ash flows, periodic explosions, and pyroclastic flows. Two new domes appeared in early 2021, one inside the summit crater and one at the top of the SW flank. Activity during March-August 2021 is covered in this report with Information provided by Balai Penyelidikan dan Pengembangan Teknologi Kebencanaan Geologi (BPPTKG), the Center for Research and Development of Geological Disaster Technology, a branch of PVMBG which specifically monitors Merapi, the Pusat Vulkanologi dan Mitigasi Bencana Geologi (PVMBG, also known as Indonesian Center for Volcanology and Geological Hazard Mitigation, CVGHM), MAGMA Indonesia, and the Darwin Volcanic Ash Advisory Centre (VAAC).
Two lava domes at the summit continued to grow during March-August 2021. On 17 February 2021 the volume of the dome on the SW flank was 397,500 m3, and the volume of the dome at the center of the summit crater was 426,000 m3. Six months later, on 1 September 2021, the SW dome volume was estimated at 1,440,000 m3 and the central dome volume was 2,842,000 m3 (figure 110). Tens of daily block avalanches, many incandescent, were recorded throughout the period, generally traveling 500-2,000 m down the flanks. Most of the activity was related to the SW flank dome, but there were also periods of activity on the SE flank produced by the central dome. Tens of block-and-ash flows also occurred each month, moving down the SW and SE flanks, some as far as 3 km from the summit. Ash from explosions and block-and-ash flows occasionally produced ashfall. Ash emissions increased substantially at the end of July and throughout August; the plumes resulted in ashfall over a larger area multiple times during August. The MODIS Log Radiative Power graph produced by the MIROVA project shows a marked increase in thermal activity during July and August (figure 111), corresponding to the increased number incandescent block avalanches and block-and-ash flows.
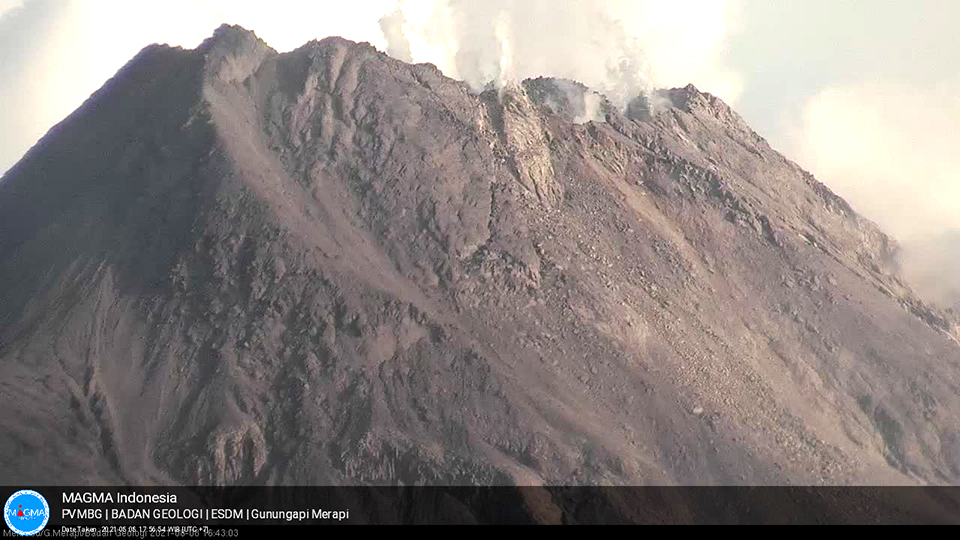 |
Figure 110. The active dome inside the summit crater at Merapi is visible within the steam plumes rising from the summit on 8 August 2021. The volumes of both the center dome and the SW flank dome continued to grow throughout March-August 2021. Courtesy of MAGMA Indonesia. |
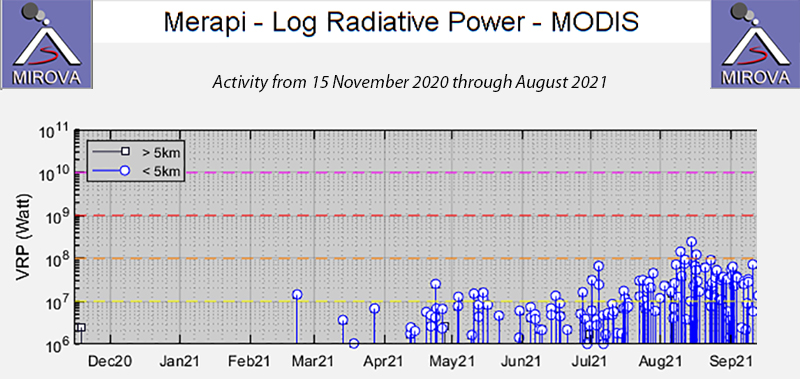 |
Figure 111. The MIROVA graph of Log Radiative Power for Merapi from 15 November 2020 through August 2021 showed a steady increase in thermal energy throughout the period. Explosive activity produced an increasing number of incandescent block avalanches and block-and-ash flows into August. Courtesy of MIROVA. |
The number of daily block avalanches during March 2021 ranged from a high of 210 on 5 March to a low of 97 on 20 March. On 6 March incandescent blocks were observed 24 times on the SW flank, traveling up to 1,000 m and on 8 March they were noted 20 times in the same place. Every day from 16 March through the end of the month, multiple incandescent block avalanches were reported. Most frequently, they descended 800-1,200 m down the SW flank, and were also periodically observed inside the summit crater on the growing central dome. Sentinel-2 satellite imagery showed a faint thermal anomaly on the SW flank on 19 March (figure 112), likely due to incandescent blocks and block-and-ash flows. Larger explosions on 27 March produced 27 incandescent block avalanches, with another 33 observed on 30 March.
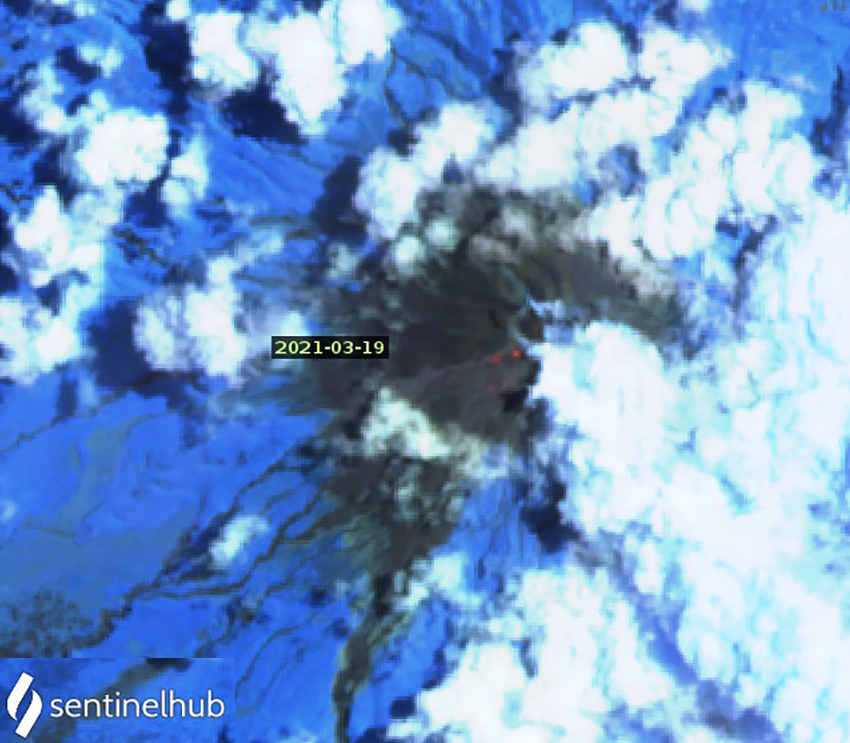 |
Figure 112. A faint thermal anomaly on the SW flank of Merapi near the summit on 19 March 2021 was likely caused by incandescent block avalanches from the growing SW-flank dome. Image uses Atmospheric penetration rendering (bands 12, 11, 8a). Courtesy of Sentinel Hub Playground. |
Thirty-four different block-and-ash flows were reported on 14 days of March, usually one or two in a day. On 8 March, three block-and-ash flows traveled 1,300 m down the SW flank. Eight block-and-ash flows on 27 March extended 1,800 m down the SW flank (figure 113). On 30 March one block-and-ash flow traveled 1,500 m down the SW flank. During the last week of the month small amounts of ashfall were reported in Ngadirojo, Stabelan (4 km NW), Takeran, Tlogolele (5 km NW), Selo (3 km NNW), Pos Babadan (4 km NW), and Pasar Talun (12 km W), and around Talun Market. Based on photos taken from the SW flank, the summit dome grew from 45 m high on 11 March to 70 m high on 1 April. The Darwin VAAC issued an ash advisory on 27 March based on a ground report of ash emissions that rose to 3.7 km altitude. PVMBG reported the ash plume 500 m above the summit.
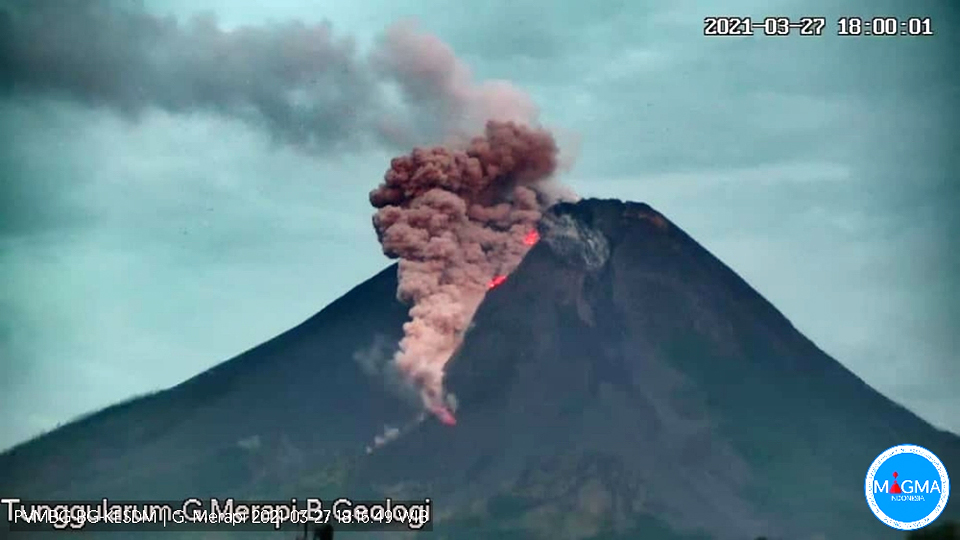 |
Figure 113. Eight block-and-ash flows were recorded at Merapi on 27 March 2021, producing minor ashfall to the NW and sending incandescent blocks down the SW flank. Courtesy of MAGMA Indonesia. |
Over 100 block avalanches occurred each day during April 2021, with few exceptions. The fewest, 74, occurred on 17 April, and the most, 225, occurred on 23 April. Incandescent block avalanches usually traveled 400-800 m down the SW flank. Sixteen were reported by BNPB on 2 April, and twenty were observed on 8 April, moving 700-1,000 m down the SW flank. On 12 April there were 29 incandescent block avalanches reaching 1,000 m down the SW flank; five more were observed 400 m down the SE flank. A total of 43 block-and-ash flows were noted on 17 days during the month, usually traveling 700-1,500 m from the summit. BNPB reported three block and ash flows on 2 April to a distance of 700-1,500 m down the SW flank (figure 114). Four of them traveled 1,800 m down the SW flank on 13 April and six traveled 1,300 m from the summit on 20 April; four moved 1,000-2,000 m down the SW flank on 23 April. Small amounts of ashfall were reported in Ngipiksari, Klangon, and Deles on 3 April 2021. An explosion on 23 April produced block-and-ash flows that traveled 2 km down the SW flank, produced an ash plume that rose 300 m above the summit, and caused ashfall in the Cepogo area of the Boyolali Regency in central Java.
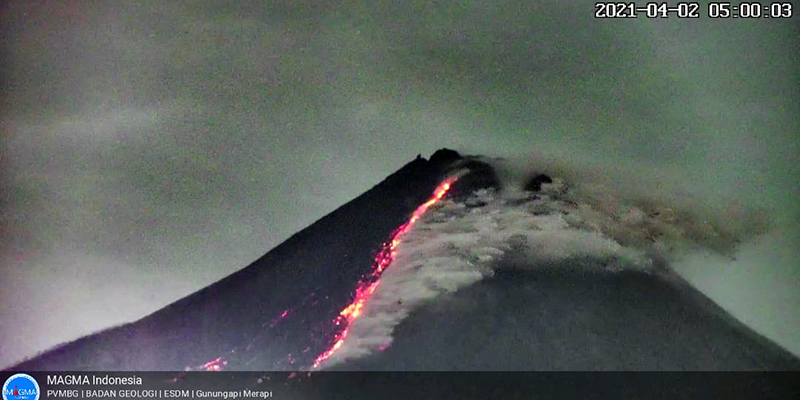 |
Figure 114. Sixteen incandescent block avalanches and three block-and-ash flows were reported on 2 April 2021 at Merapi. Courtesy of BNPB. |
Between 101 and 165 block avalanches were recorded daily during May 2021. PVMBG reported block-and-ash flows traveling 1,700 m on the SW flank on 1 May, and incandescent blocks traveling 600 m down the SW and SE flanks. Incandescent blocks and block-and-ash flows were observed daily during 4-9 May moving 700-2,000 m on the SW flank, and 700 m on the SE flank on 9 May. Similar activity occurred during 14-19, 22, and 27-31 May. Seventeen days of the month had block-and-ash flows, with a total of 31 reported.
The number of block avalanches reported each day during June 2021 ranged from 103 on 1 June to 377 on 30 June. The number was between 100-200 during the first half of the month but rose to over 200 about half the time during the second half of the month, with two days over 300 reported. Incandescent block avalanches were observed multiple times every day with blocks sliding 500-2,000 m down both the SW and SE flanks. Block-and-ash flows also increased in number and frequency during June, compared with the previous months. A total of 85 were reported on all but four days of the month. During most days 1-5 were reported, except 17 were noted on 30 June. The block-and-ash flows sent debris 900-3,000 m down the SW and SE flanks (figure 115). BNPB reported two block-and-ash flows early on 20 June that traveled 2,500 and 1,500 m down the SW flank. Four block-and-ash flows traveled 3 km SE on 25 June (figure 116). The larger explosions that day produced an ash plume that rose to 1 km above the summit (3.9 km altitude) and drifted SE resulting in ashfall in several areas on the SE flank. An ash emission on 29 June rose to 3.4 km altitude and drifted W. The next day 17 block-and-ash flows descended 900-1,500 m down both the SW and SE flanks.
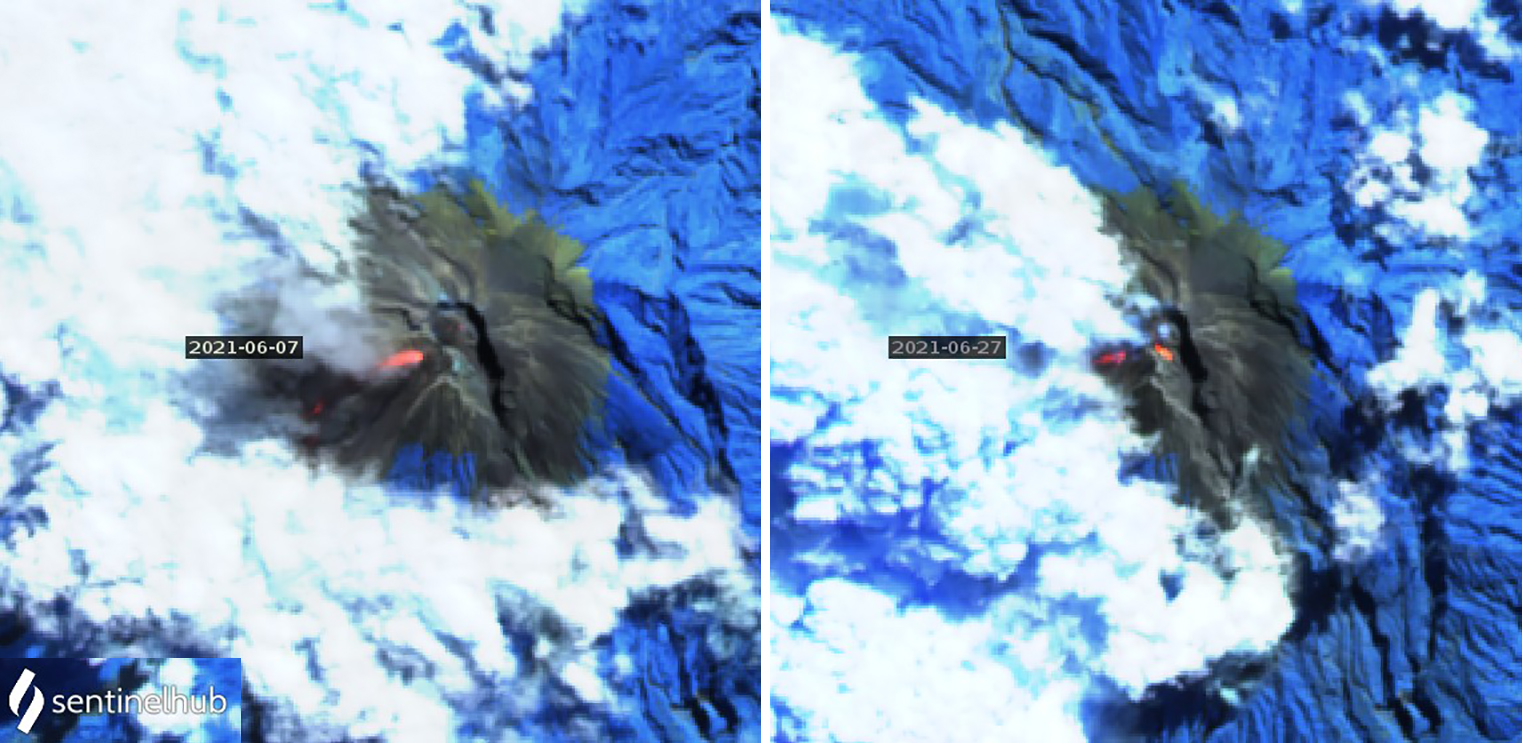 |
Figure 115. Incandescent block avalanches and block-and-ash flows at Merapi produced significant thermal anomalies on both the SW and SE flanks on 7 (left) and 27 (right) June 2021. Sentinel-2 satellite images use Atmospheric penetration rendering (bands 12, 11, 8a). Courtesy of Sentinel Hub Playground. |
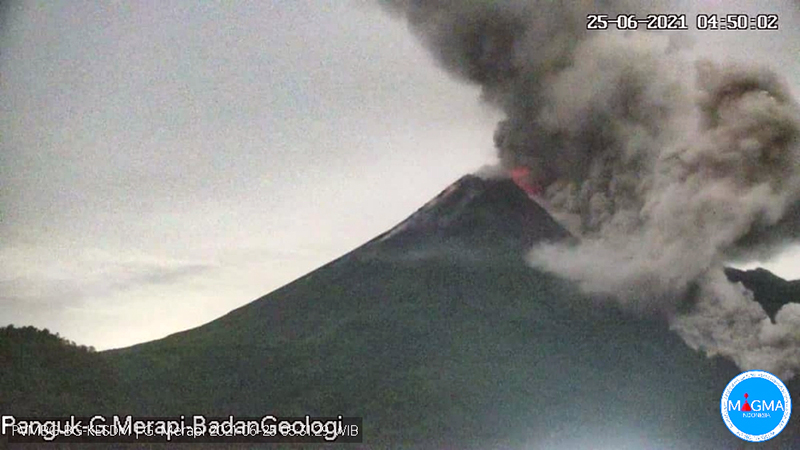 |
Figure 116. Four block-and-ash flows sent debris 3 km SE at Merapi on 25 June 2021. Courtesy of BNPB. |
For the first 20 days of July, the daily number of block avalanches was usually over 200, reaching a high of 338 on 10 July. Multiple incandescent block avalanches occurred on both the SW and SE flanks, extending as far as 2 km on many days (figure 117). Far fewer block-and-ash-flows occurred in July than were reported in June; only 19 during 1-5, 9, 26, and 29 July moving as far as to 2 km down the SW flank. BNPB reported block-and-ash flows on 8 and 9 July that traveled 1,100 m down the SW flank. The Darwin VAAC reported an ash emission on 24 July that rose to 3.0 km altitude and drifted WSW. Incandescent block avalanches caused fires on the SW flank on 25 July about 2.5 km from the summit.
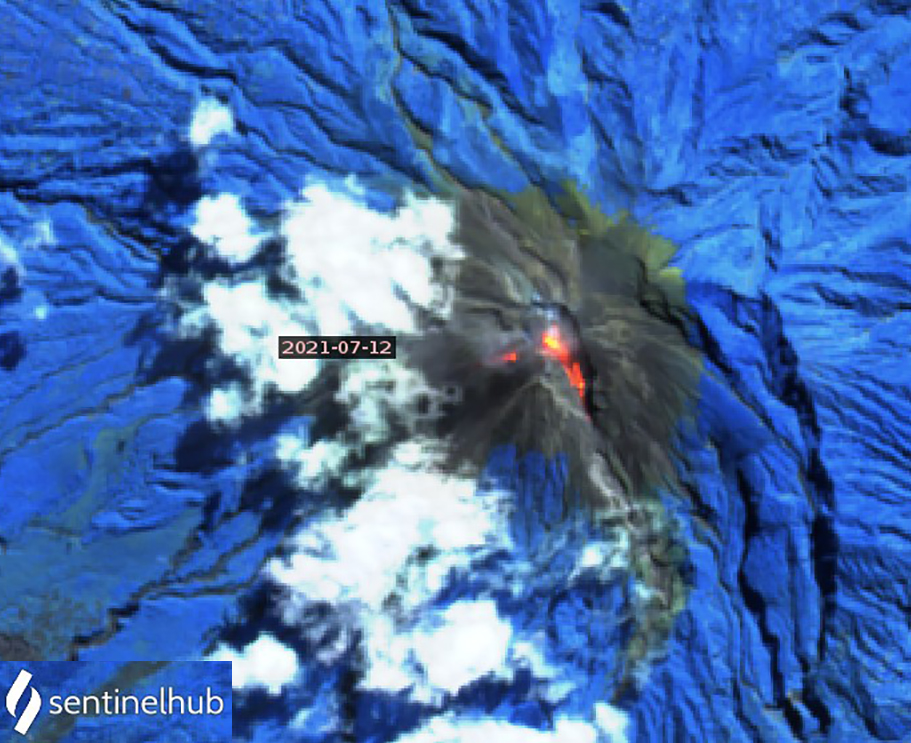 |
Figure 117. Multiple incandescent block avalanches descended both the SW and SE flanks of Merapi during July 2021. On 12 July the blocks traveled 1,700 m down the SW flank and 1,200 m down the SE flank creating significant thermal anomalies in this Sentinel-2 image that uses Atmospheric penetration rendering (bands 12, 11, 8a). Courtesy of Sentinel Hub Playground. |
Incandescent block avalanches were reported daily during August, reaching 1-2 km down the SW flank (figure 118). The number of daily block avalanches reported ranged from 61 to 385, exceeding 200 every day after 8 August (figure 119). Fifty-one block-and-ash flows were observed during sixteen days of August. Six were reported on 5 August, 7 on 12 August and 9 on 13 August. During other days 1-3 were observed. Most were reported moving 1,400 m down the SW flank. The largest events on 8, 10, and 12 August produced block-and-ash flows that traveled 2.5-3 km from the summit. They also traveled over 2 km from the summit on the SW flank on 13-15, 20, and 28 August.
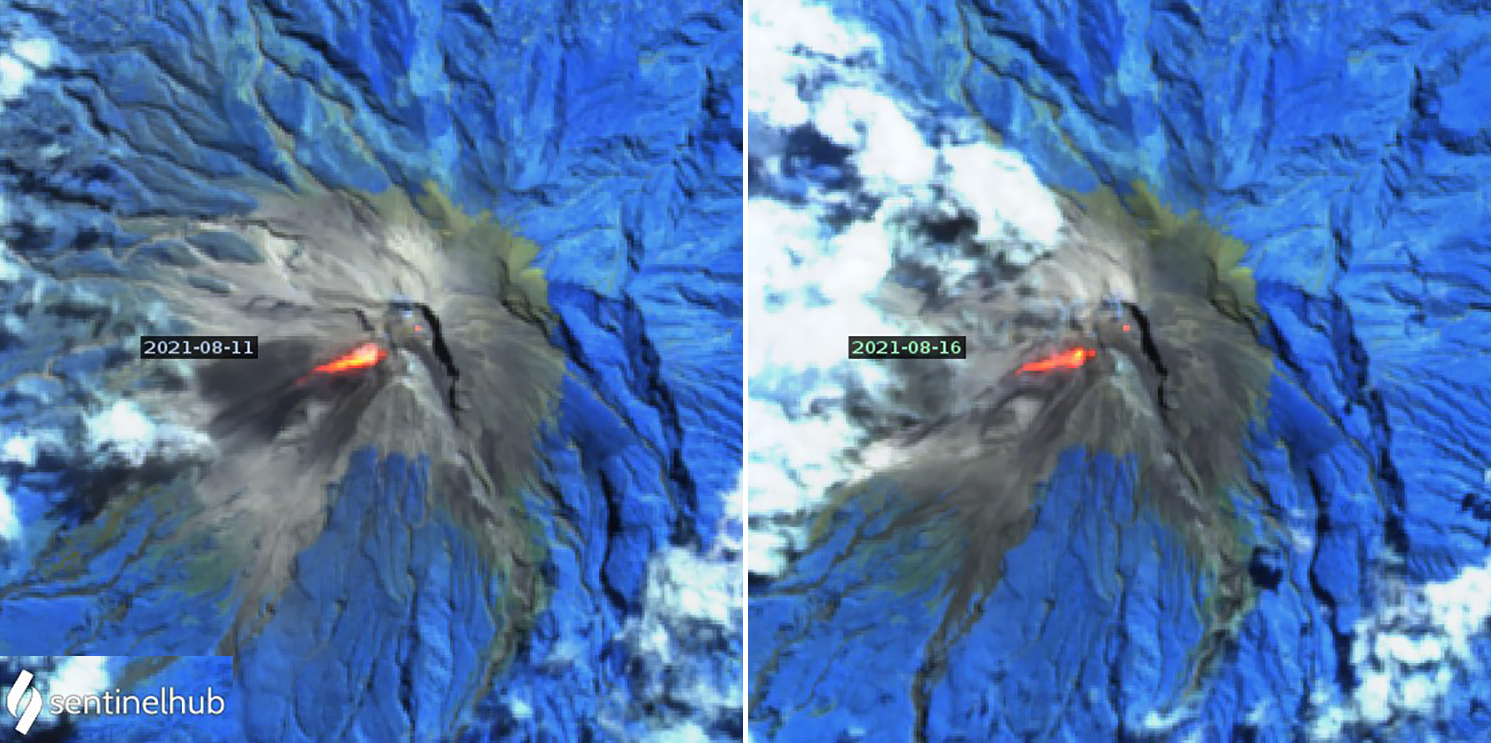 |
Figure 118. A large number of incandescent block avalanches and block-and-ash flows descended the SW flank of Merapi during August 2021. They were detected as large thermal anomalies in Sentinel-2 satellite images on 11 (left) and 16 (right) August. In addition, smaller anomalies were present at the summit crater dome. Images use Atmospheric penetration rendering (bands 12, 11, 8a). Courtesy of Sentinel Hub playground. |
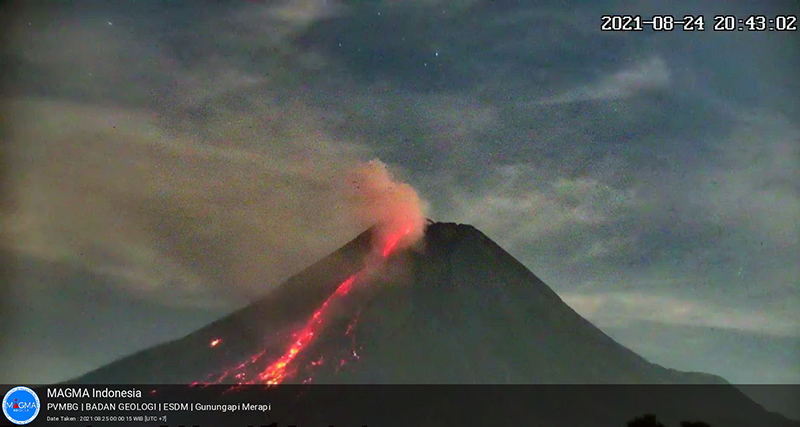 |
Figure 119. Incandescent block avalanches traveled hundreds of meters down the SW flank of Merapi daily throughout August, including on 24 August 2021, shown here. Courtesy of MAGMA Indonesia. |
The number of ash emissions increased significantly during August 2021, and ashfall was reported in surrounding communities on multiple occasions. The Darwin VAAC noted ash emissions continuously during 6-11, 14-19, and 28-29 August. They reported a minor ash emission visible in the webcam on 3 August that was not observed in satellite data, although a significant hotspot was apparent. An ash emission on 6 August rose to 4.3 km altitude and drifted SE. The next day a new emission rose to 3.7 km altitude and drifted NW; it was still clearly visible in satellite imagery early on 8 August moving WNW. Multiple discrete emissions were identifiable in satellite imagery throughout the day at 3.9 km altitude drifting W. An emission on 9 August rose to 3.0 km altitude and drifted WNW. The next day an emission that rose to 3.9 km altitude was discernible on multispectral satellite imagery. This was followed by another ash plume moving NW at 4.3 km altitude. On 11 August ash was observed in satellite imagery drifting NW at 3.0 km altitude. Later that day a plume appeared in satellite imagery moving SW at 4.3 km altitude. A new ash emission rose to 3.0 km altitude and drifted WSW on 14 August; the next day one rose to 3.7 km and drifted W. Ash to a similar altitude drifted W on 16 August and continued to be observed through 18 August, drifting SW (figure 120). On 19 August block-and-ash flows produced an ash plume near summit. Continuous ash emission was reported on 28 August drifting SW and W at 3.7 km altitude. An ash plume rose to 3.0 km altitude and drifted SW late in the day and continued into 29 August drifting NW before dissipating.
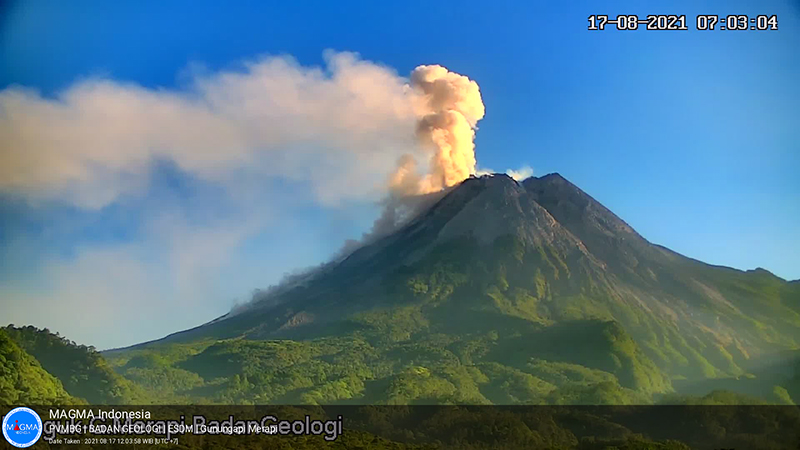 |
Figure 120. Continuous ash emissions were reported by the Darwin VAAC during 14-19 August 2021 at Merapi. On 17 August block-and-ash flows descended the SW flank while dense white steam and diffuse ash rose from the summit area and drifted W. Courtesy of MAGMA Indonesia. |
BNPB reported that 19 villages received ashfall on 11 August after block-and-ash flows traveled 2.5 km down the SW flank, sending ash emissions to 4.3 km altitude the previous day (figure 121). The communities were located in the Magelang Regency of central Java and included Paten and Sengi Villages in Dukun District; Ketep and Wonolelo Villages, Sawangan District; Pakis, Gejagan, Rejosari, Banyusidi, Ketundan, Petung and Daleman Kidul Villages in Pakis District; Pucungsari, Pesidi, and Lebak Villages in Grabag District; Kaliurang Village in Srumbung District; Kebonagung Village in Tegalrejo District; and Karangkajen, Donorejo, and Krincing Villages in the Secang District. On 10 and 12 August ashfall was also reported in Salam, Muntilan, and Mungkid. During the week of 13-19 August there were 20 block-and-ash flows that sent blocks as far as 3.5 km. Ashfall was reported on 16 August in the Dukun, Sawangan, Tegalrejo, Secang, Gowok, and Mertoyudan sub-districts in the Magelang District, and also in Selo, Boyolali, and Mojotengah in Wonosobo District. In addition, the sub-districts of Temanggung, Kedu, Pringsurat, Bulu, Tlogomulyo, Kranggan, and Parakan in Temanggung Regency were affected by ash. Ashfall was reported on 28 August and 1 September in several areas including in Srumbung, Salam, Ngluwar, Dukun, Mungkid, Sawangan, Muntilan, and Salaman sub-districts.
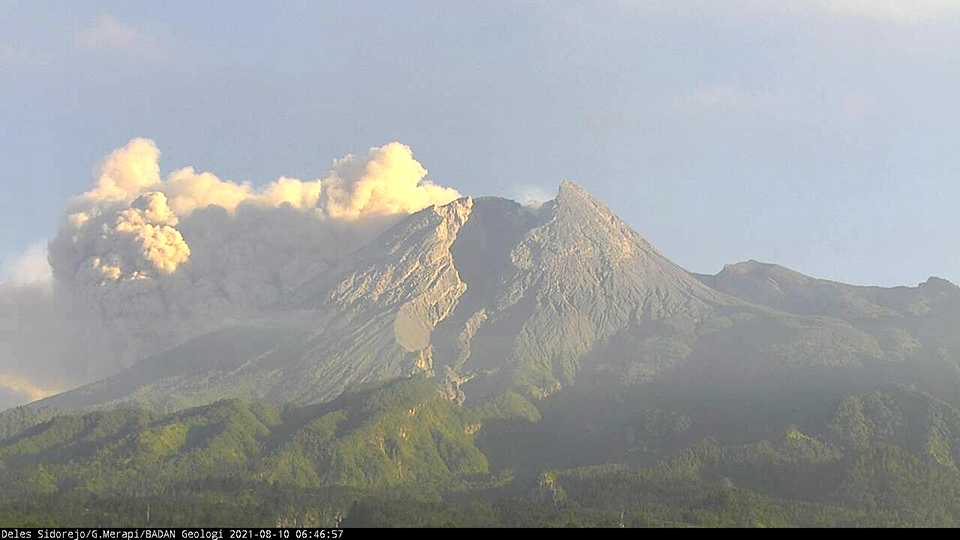 |
Figure 121. Substantial ash emissions from block-and-ash flows on the SW flank of Merapi on 10 August 2021 produced ashfall in numerous nearby villages. Courtesy of PBBTKG. |
Information Contacts: Balai Penyelidikan dan Pengembangan Teknologi Kebencanaan Geologi (BPPTKG), Center for Research and Development of Geological Disaster Technology (URL: http://merapi.bgl.esdm.go.id/, Twitter: @BPPTKG); Pusat Vulkanologi dan Mitigasi Bencana Geologi (PVMBG, also known as Indonesian Center for Volcanology and Geological Hazard Mitigation, CVGHM), Jalan Diponegoro 57, Bandung 40122, Indonesia (URL: http://www.vsi.esdm.go.id/); MAGMA Indonesia, Kementerian Energi dan Sumber Daya Mineral (URL: https://magma.esdm.go.id/v1); Badan Nasional Penanggulangan Bencana (BNPB), National Disaster Management Agency, Graha BNPB - Jl. Scout Kav.38, East Jakarta 13120, Indonesia (URL: http://www.bnpb.go.id/); MIROVA (Middle InfraRed Observation of Volcanic Activity), a collaborative project between the Universities of Turin and Florence (Italy) supported by the Centre for Volcanic Risk of the Italian Civil Protection Department (URL: http://www.mirovaweb.it/); Darwin Volcanic Ash Advisory Centre (VAAC), Bureau of Meteorology, Northern Territory Regional Office, PO Box 40050, Casuarina, NT 0811, Australia (URL: http://www.bom.gov.au/info/vaac/); Sentinel Hub Playground (URL: https://www.sentinel-hub.com/explore/sentinel-playground).
Dome growth, pyroclastic flows, lava avalanches, and ash emissions through February 2022
The frequently active Merapi is located immediately north of the major city of Yogyakarta in central Java, Indonesia. Volcanism has included lava flows, pyroclastic flows, lahars, explosions with heavy ashfall, incandescent block avalanches, block-and-ash flows, and cycles of dome growth and destruction. The current eruption period began in December 2020 and has recently consisted of explosions, dome growth, incandescent avalanches, and block-and-ash flows (BGVN 46:09). Two new domes appeared in January and February 2021: one inside the summit crater and one at the top of the SW flank. This report updates similar activity from September 2021 through February 2022 using information primarily from Balai Penyelidikan dan Pengembangan Teknologi Kebencanaan Geologi (BPPTKG), the Center for Research and Development of Geological Disaster Technology, a branch of PVMBG which specifically monitors Merapi. Additional information came from the Pusat Vulkanologi dan Mitigasi Bencana Geologi (PVMBG, also known as Indonesian Center for Volcanology and Geological Hazard Mitigation, CVGHM), MAGMA Indonesia, and the Darwin Volcanic Ash Advisory Centre (VAAC).
BPPTKG reported that the two lava domes, located just below the SW rim and in the summit crater, continued to grow during September; the SW dome had grown 7 m taller and had an estimated volume of 1.6 million cubic meters and the summit lava dome had grown 1 m wider and had an estimated volume of 2.85 million cubic meters. A total of seven pyroclastic flows descended the SW flank as far as 2.5 km, and 67-144 lava avalanches traveled a maximum of 2 km SW. On 1 September ashfall was reported in several areas, including Srumbung, Salam, Ngluwar, Dukun, Mungkid, Sawangan, Muntilan, and the Salaman sub-districts. White gas-and-steam emissions rose 500 m high, based on observations from the Kaliurang Mount Merapi Observation Post. During 9-10 September a continuous ash emission was observed in satellite imagery and rose to 3 km altitude and drifted E and NW.
Both lava domes continued to grow during October; the SW dome had grown about 5 m higher, with an estimated volume of 1.67 million cubic meters, and the summit dome rose another 4 m with an estimated volume of 2.927 million cubic meters. Two pyroclastic flows descended 2.5 km down the SW flank. There were 30-76 lava avalanches reported that traveled a maximum of 2 km SW. White gas-and-steam emissions rose 700 m high. During 15-21 October a thin ash deposit was reported in the Selo area.
Similar activity continued during November, with active lava domes and 106-212 lava avalanches that traveled 2 km SW. Two pyroclastic flows were reported descending 1.5-2 km on the SW flank; one pyroclastic flow traveled 1.8 km down the SW flank on 13 November and another occurred on 20 November (figure 122). The estimated volume of the SW dome was 1.61 million cubic meters, with the summit dome at almost 2.93 million cubic meters.
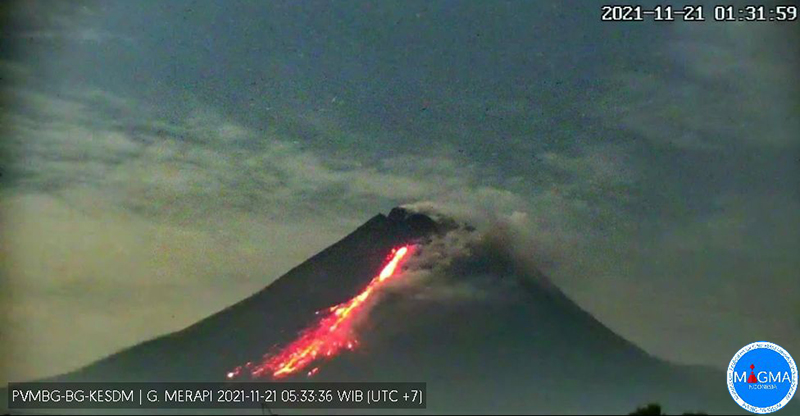 |
Figure 122. Webcam image of an incandescent lava avalanche descending the SW flank at Merapi on 21 November 2021, which generates ash plumes. Courtesy of MAGMA Indonesia. |
CVGHM reported a discrete ash plume that rose to 3.9 km altitude and drifted E on 1 December, but it was not detected in satellite imagery due to cloud cover. Two pyroclastic flows traveled 3 km down the SW flank on 1 December. According to a VONA issued by PVMBG, around 2104 on 1 December an ash plume rose 1 km above the summit and drifted E. The height of the SW lava dome decreased about 2 m during 26 November and 2 December, but the estimated volumes at both remained stable at 1.63 million cubic meters for the SW dome and just over 3 million cubic meters for the summit dome. Between 112-190 lava avalanches moved as far as 2 km SW down the Bebeng drainage. On 6 December a pyroclastic flow traveled 1.8 km down the Bebeng drainage on the SW flank at 1644, which lasted two minutes and forty seconds, based on seismic data, according to BPPTKG. At 1643 on 18 December a pyroclastic flow advanced 2 km SW, which produced an ash plume that rose 400 m high (figure 123). During 24-30 December the height of the SW lava dome had decreased by 3 m.
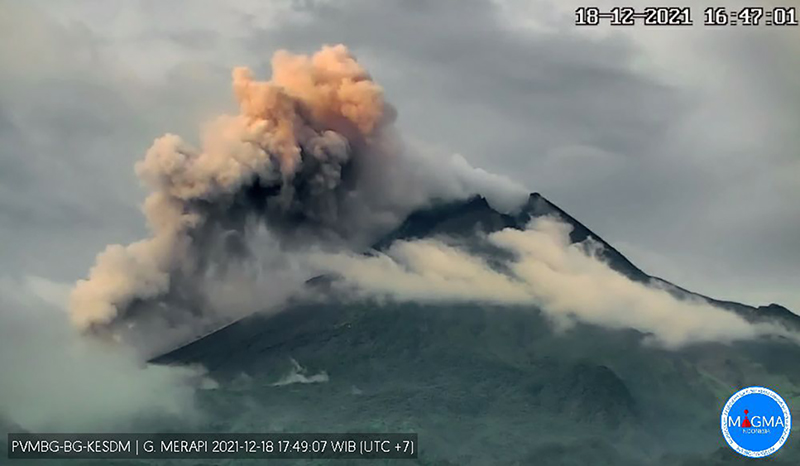 |
Figure 123. Webcam image of a pyroclastic flow at Merapi extending 2 km down the SW flank, which generated a 400-m-high ash plume on 18 December 2021. Courtesy of MAGMA Indonesia. |
Observations during early January 2022 showed that the height of the SW lava dome had increased about 2 m between 31 December and 6 January 2022. Seismicity was recorded at higher levels with more intense earthquakes compared to the previous months. The estimated volume of the SW dome was over 1.67 million cubic meters and just over 3 million cubic meters at the summit dome. The weekly number of detected lava avalanches ranged between 30 and 123, which traveled a maximum of 2.2 km SW down the Bebeng drainage (figure 124). A total of seven pyroclastic flows were reported descending 2-2.5 km down the SW flank.
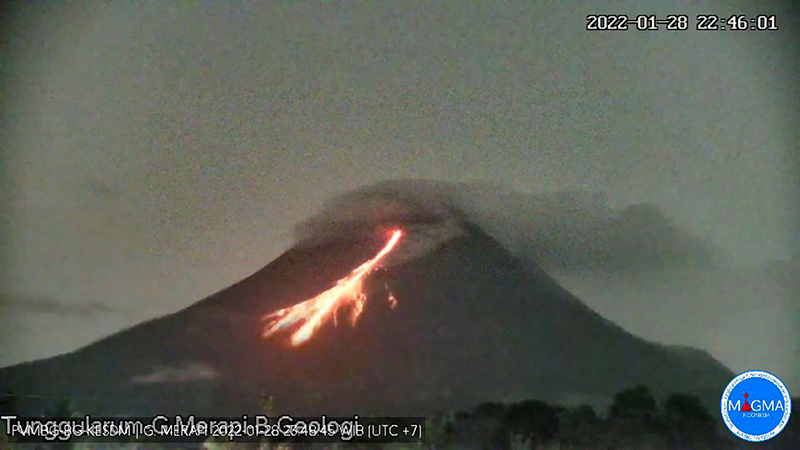 |
Figure 124. Webcam image of an incandescent lava avalanche moving down the SW flank at Merapi on 28 January 2022. Courtesy of MAGMA Indonesia. |
In February, no significant morphological changes were detected at the lava domes, though seismicity remained relatively high. The estimated volumes of the SW and summit domes was 1.58 million cubic meters and 3.23 million cubic meters, respectively. In the Bebeng drainage, 105-173 weekly lava avalanches were reported, moving as far as 2 km SW, and one of which went 300 m NW. Nine pyroclastic flows extended 1.8-2.8 km. On 2 February the Darwin VAAC issued a notice describing resuspended ash that rose to 3.7 km altitude based on satellite data; no eruption was associated with this event. A ground report indicated that on 6 February ash plumes rose 600 m above the summit and drifted E, though it was likely resuspended. Ashfall was reported in multiple areas within about 20 km to the S, SE, and E, including the Cangkringan, Sleman and Musuk districts. On 18 February minor ashfall was reported in the Pakem District.
The MODIS Log Radiative Power graph produced by the MIROVA project showed that thermal activity was stronger and more frequent during September-October 2021 compared to December through February 2022 (figure 125). This pattern is also reflected in the MODVOLC hotspot detection program, which detected a total of 25 thermal anomalies over the days of 3, 10, 17, and 30 September, 5, 14, 21, 28, and 30 October, 29 November, 26 December 2021, 2 and 9 January, and 24 February 2022. This thermal activity was also detected in Sentinel-2 infrared satellite imagery representing incandescent lava and block avalanches dominantly moving down the SW flank (figure 126).
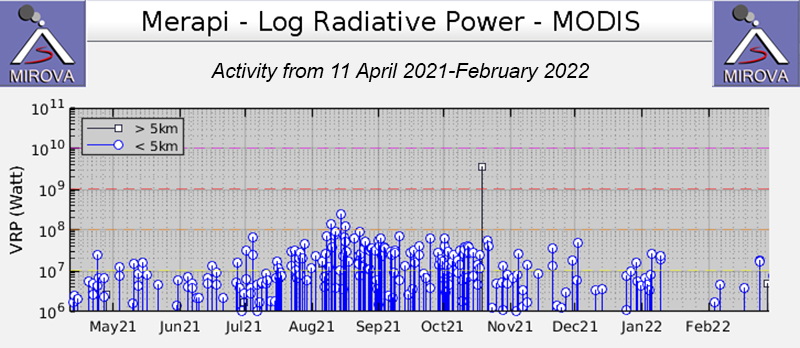 |
Figure 125. Frequent low- to moderate-power thermal anomalies at Merapi persisted during September 2021 through February 2022, according to the MIROVA graph (Log Radiative Power). The frequency of the anomalies visibly decreased during mid-October and there was a break in activity during January. The overall strength of the anomalies also declined from September through February. Courtesy of MIROVA. |
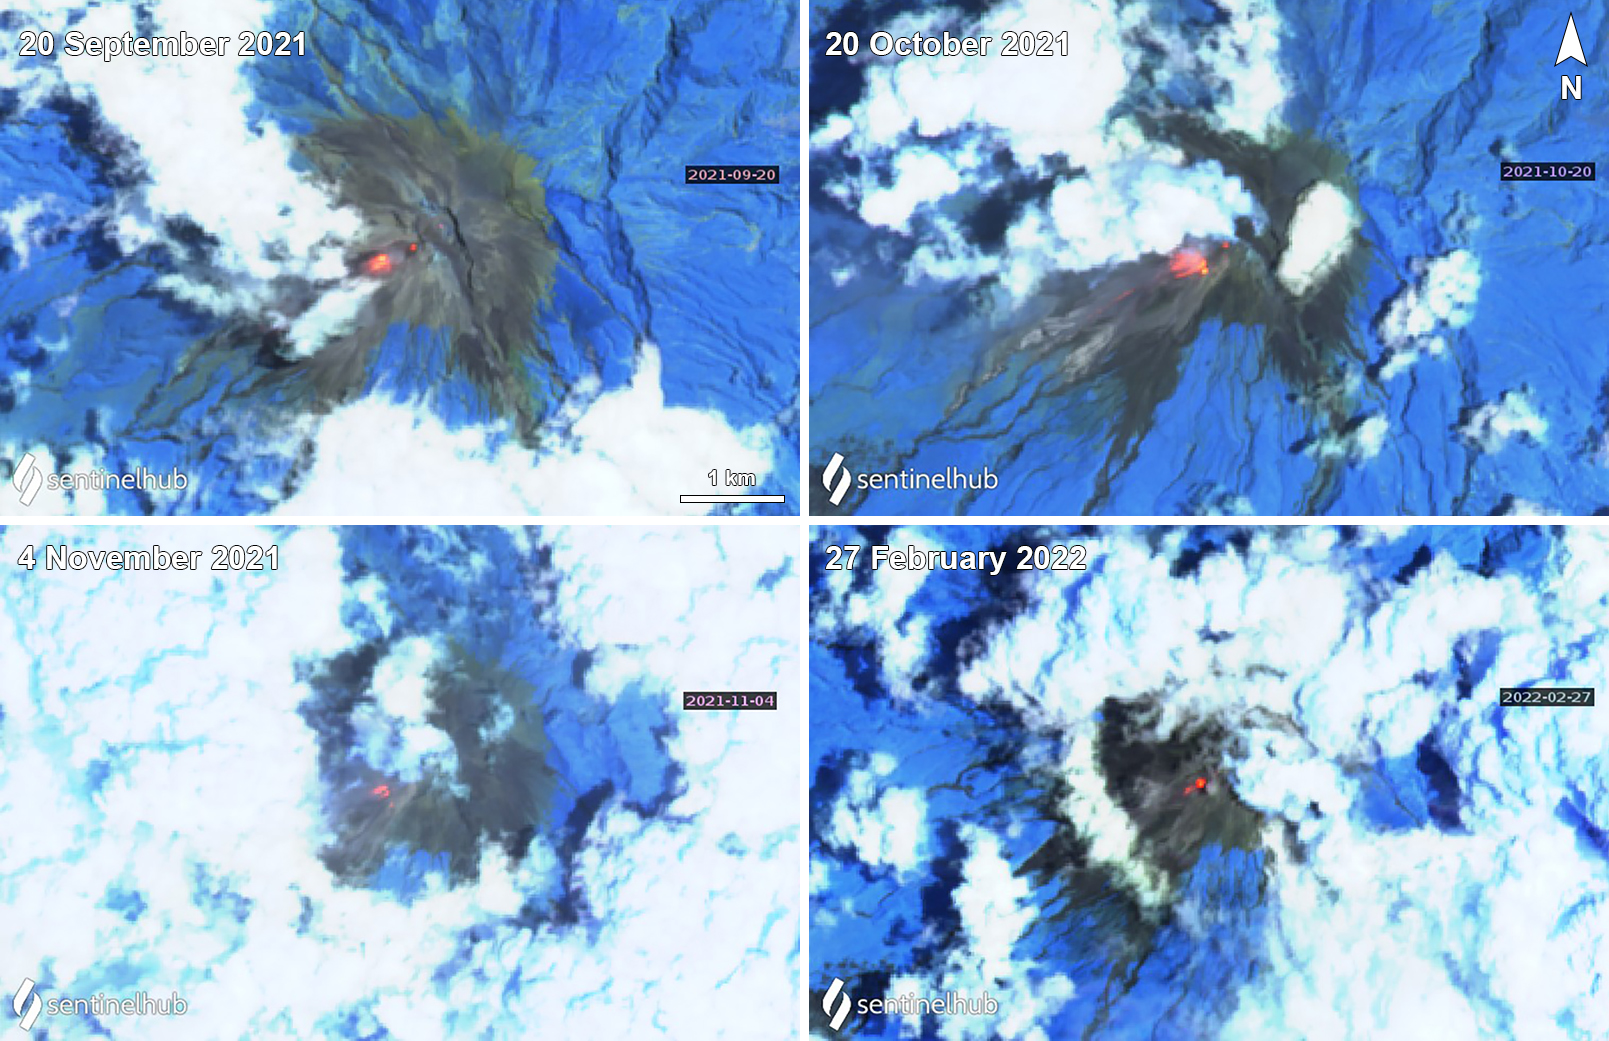 |
Figure 126. Incandescent block avalanches and block-and-ash flows at Merapi produced significant thermal anomalies, mainly on the SW flank. Examples from Sentinel-2 infrared satellite imagery are shown here for 20 September (top left), 20 October (top right), 4 November (bottom left) 2021, and 27 February (bottom right) 2022. Sentinel-2 satellite images use Atmospheric penetration rendering (bands 12, 11, 8a). Courtesy of Sentinel Hub Playground. |
Information Contacts: Balai Penyelidikan dan Pengembangan Teknologi Kebencanaan Geologi (BPPTKG), Center for Research and Development of Geological Disaster Technology (URL: http://merapi.bgl.esdm.go.id/, Twitter: @BPPTKG); MAGMA Indonesia, Kementerian Energi dan Sumber Daya Mineral (URL: https://magma.esdm.go.id/v1); Pusat Vulkanologi dan Mitigasi Bencana Geologi (PVMBG, also known as Indonesian Center for Volcanology and Geological Hazard Mitigation, CVGHM), Jalan Diponegoro 57, Bandung 40122, Indonesia (URL: http://www.vsi.esdm.go.id/); Darwin Volcanic Ash Advisory Centre (VAAC), Bureau of Meteorology, Northern Territory Regional Office, PO Box 40050, Casuarina, NT 0811, Australia (URL: http://www.bom.gov.au/info/vaac/); MIROVA (Middle InfraRed Observation of Volcanic Activity), a collaborative project between the Universities of Turin and Florence (Italy) supported by the Centre for Volcanic Risk of the Italian Civil Protection Department (URL: http://www.mirovaweb.it/); Hawai'i Institute of Geophysics and Planetology (HIGP) - MODVOLC Thermal Alerts System, School of Ocean and Earth Science and Technology (SOEST), Univ. of Hawai'i, 2525 Correa Road, Honolulu, HI 96822, USA (URL: http://modis.higp.hawaii.edu/); Sentinel Hub Playground (URL: https://www.sentinel-hub.com/explore/sentinel-playground).
Frequent avalanches, crater incandescence, and occasional pyroclastic flows
Merapi is located just north of the major city of Yogyakarta in central Java, Indonesia. Pyroclastic flows and lahars accompanying growth and collapse of the steep-sided active summit lava dome have occurred on the western-to-southern flanks, causing many fatalities within the last 20 years. The current eruption period began in late December 2020 and has more recently consisted of dome growth, pyroclastic flows, avalanches, and ash emissions (BGVN 47:03). This report covers activity comprising avalanches and pyroclastic flows during March through September 2022 using information primarily from Balai Penyelidikan dan Pengembangan Teknologi Kebencanaan Geologi (BPPTKG), the Center for Research and Development of Geological Disaster Technology, a branch of PVMBG which specifically monitors Merapi. Additional information comes from the Pusat Vulkanologi dan Mitigasi Bencana Geologi (PVMBG, also known as Indonesian Center for Volcanology and Geological Hazard Mitigation, CVGHM), MAGMA Indonesia, the Darwin Volcanic Ash Advisory Centre (VAAC), and various satellite data.
BPPTKG reported that during March near-daily white gas-and-steam emissions were observed 10-400 m above the summit and as many as 38 daily incandescent avalanches of material descended 1.8-2 km to the SW/W and occasionally 1-2.5 km to the SE (table 23). Shallow volcanic earthquakes were also detected throughout the month. On 7 March a pyroclastic flow was reported descending 2 km on the SW flank, accompanied by 15 incandescent avalanches of material that descended 1.8 km on the SW flank. On 9 March, five pyroclastic flows traveled as far as 5 km down the SE flank at 2318, 2329, 2338, 2344, and 2353. On 9 March the Darwin VAAC reported an ash plume rose to 6 km altitude and drifted NNW, based on ground observations from CVGHM; it was not visible in satellite imagery due to cloud cover. On 10 March, 13 pyroclastic flows were observed traveling 2-2.5 km down the SE flank; 17 avalanches traveled 1.5 km to the SE and 21 avalanches traveled 2 km to the SW. A strong explosion was heard on 18 March, accompanied by a single incandescent avalanche descending 1 km on the SW flank. On 19 March at 1617 a pyroclastic flow traveled 2.5 km to the SW. During the morning of 28 March resuspended ash rose to 3 km altitude and drifted E, based on webcam images. Two pyroclastic flows were observed on 28 March traveling 2.5 km SW.
Table 23. Monthly summary of avalanches and avalanche distances recorded at Merapi during March through September 2022. The number of reported avalanches does not include instances where possible avalanches were heard, because they could not be visually confirmed due to inclement weather. Data courtesy of BPPTKG (March-September 2022 daily reports).
| Month | Average number of avalanches per day | Distance avalanches traveled (km) |
| Mar 2022 | 14 | 1-2.5 |
| Apr 2022 | 18 | 1-2 |
| May 2022 | 16 | 1.2-2 |
| Jun 2022 | 10 | 1.2-1.9 |
| Jul 2022 | 6 | 1-2 |
| Aug 2022 | 4 | 1.2-2 |
| Sep 2022 | 2.6 | 1-2 |
Similar activity during April and May with white gas-and-steam emissions rising 10-500 m above the summit. As many as 45 daily incandescent avalanches of material ranged from 2 to 45, traveling 1-2 km dominantly down the SW flank. Occasional shallow volcanic earthquakes continued throughout the month. On 19 April a pyroclastic flow was reported moving 2 km to the SW (figure 127). On 8 and 10 May pyroclastic flows were observed descending 2 km and 1.8 km on the SW flank, respectively (figure 128). A pyroclastic flow on 19 May traveled 2.5 km SW. Three pyroclastic flows were reported on 26 May that traveled 1.6-2 km SW.
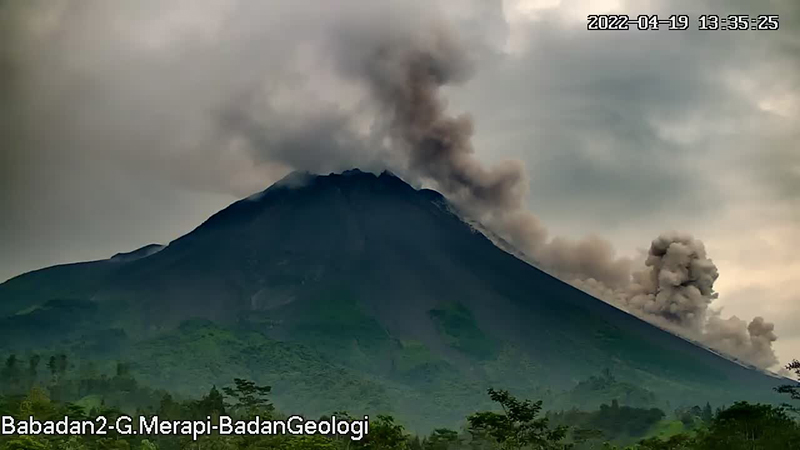 |
Figure 127. Webcam image of a pyroclastic flow descending the SW flank of Merapi as far as 2 km around 1335 on 19 April 2022. Courtesy of BPPTKG. |
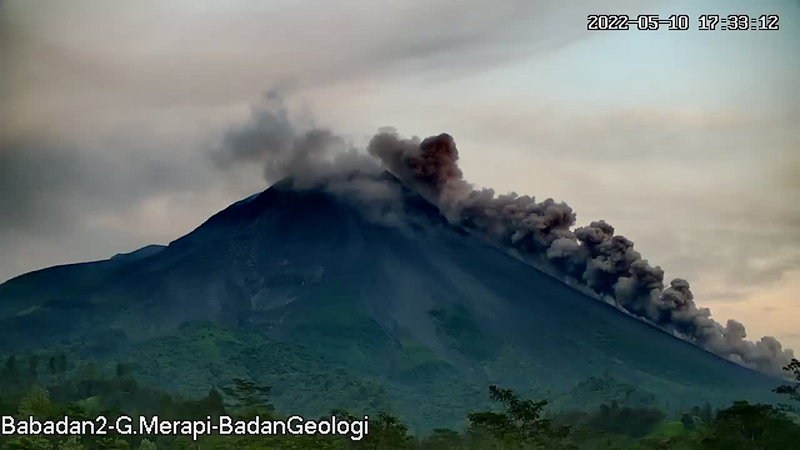 |
Figure 128. Webcam image of a pyroclastic flow descending the SW flank of Merapi as far as 2 km around 1733 on 10 May 2022. Courtesy of BPPTKG. |
During June and July white gas-and-steam emissions rose 20-150 m above the summit and as many as 22 daily incandescent avalanches of material descended as far as 2 km dominantly on the SW flank (figure 129); after June, the number of avalanches decreased compared to the previous months. Shallow volcanic earthquakes continued to be detected.
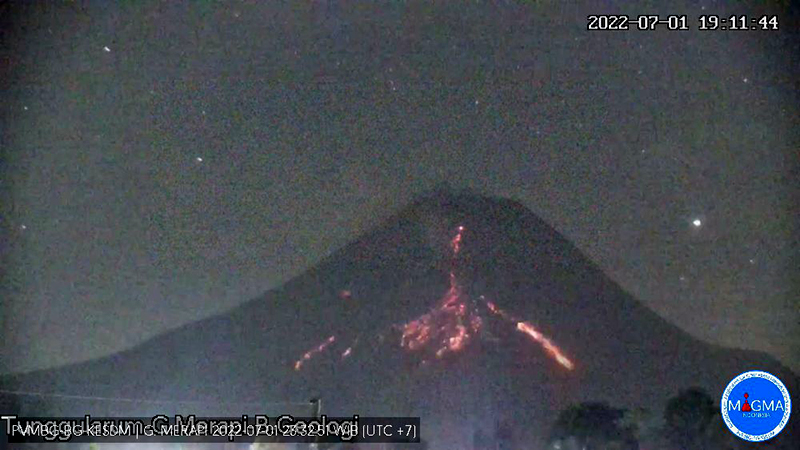 |
Figure 129. Webcam image of an incandescent avalanche descending Merapi at 1911 on 1 July 2022. Courtesy of MAGMA Indonesia. |
Activity continued during August and September. White gas-and-steam emissions rose 15-200 m above the summit and as many as 15 daily incandescent avalanches of material descended as far as 1.8 km dominantly on the SW flank. Cloudy weather during late August and into September often prevented clear views of the summit, so oftentimes avalanches were audible but not visible. Deep and shallow volcanic earthquakes persisted. On 4 August an avalanche descended the NW flank as far as 1.5 km.
The MODIS Log Radiative Power graph produced by the MIROVA (Middle InfraRed Observation of Volcanic Activity) project showed intermittent low-to-moderate power thermal activity occurring during March through early August 2022 (figure 130). The power of those anomalies fluctuated; three small peaks in activity were detected during early March, early April, and late May. No thermal activity was detected during September. Two of those peaks were also reflected in MODVOLC Thermal data. A total of eight thermal hotspots were detected on 15 April, 22 May, and 2 June 2022. This thermal activity was also captured in Sentinel-2 infrared satellite imagery during late March through early July 2022, where incandescent material was visible primarily on the SW flank (figure 131).
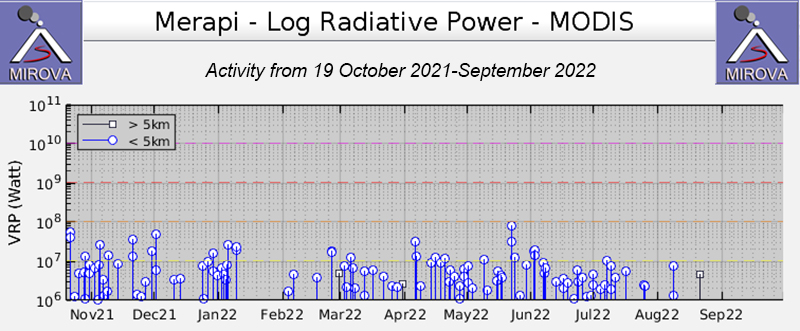 |
Figure 130. Intermittent low-to-moderate-power thermal anomalies at Merapi occurred during March through early August 2022, according to this MIROVA graph (Log Radiative Power). The power of those anomalies fluctuated, with at least three distinct peaks occurring in early March, early April, and late May 2022. No thermal activity was detected during September. Courtesy of MIROVA. |
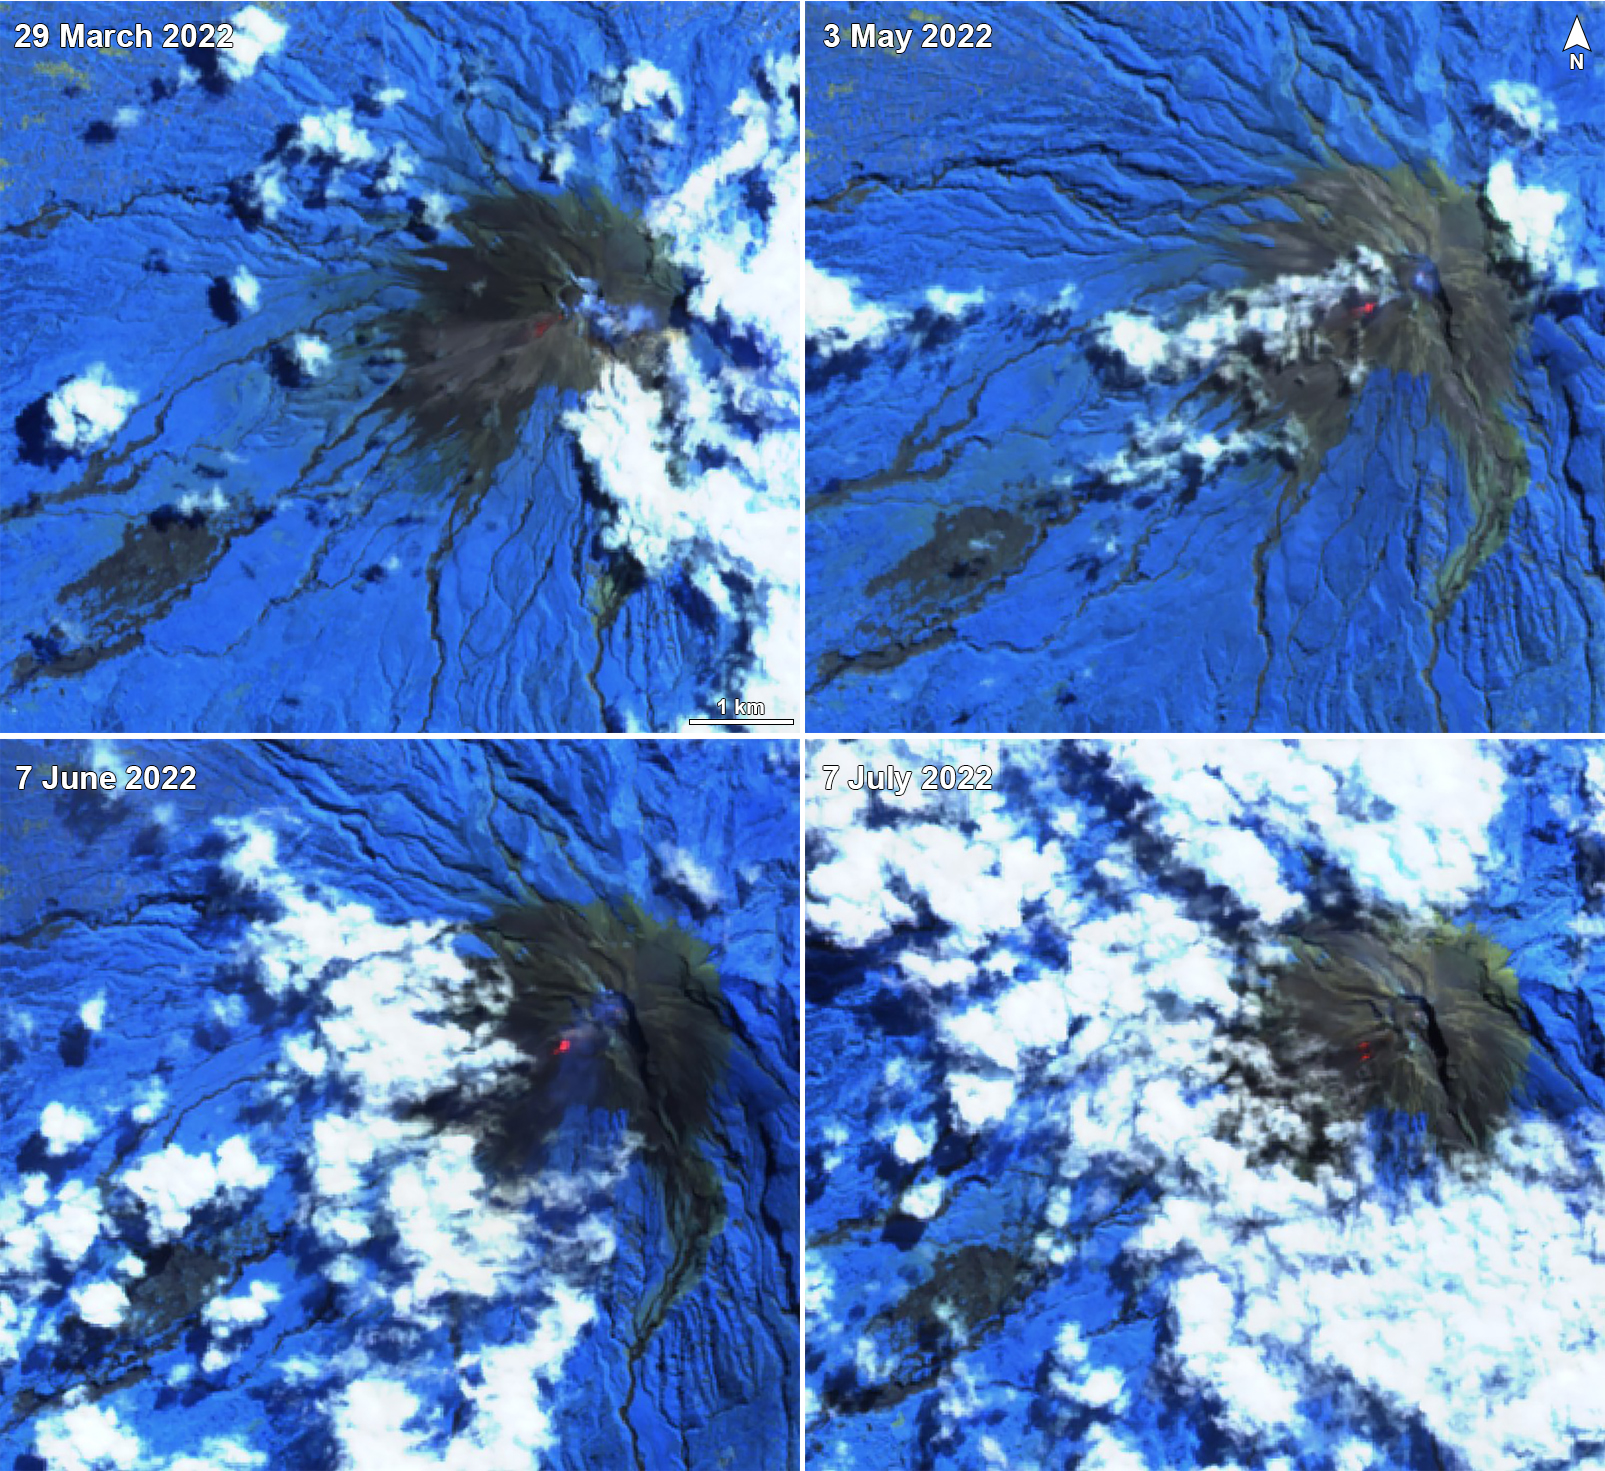 |
Figure 131. Weak-to-moderate incandescence and possible block-and-ash flows were visible on clear weather days near the summit crater of Merapi, dominantly on the SW flank. Examples from Sentinel-2 infrared satellite imagery are shown here on 29 March 2022 (top left), 3 May 2022 (top right), 7 June 2022 (bottom left), and 7 July 2022 (bottom right). Occasional gas-and-steam emissions (light blue) accompanied this activity. Images use Atmospheric penetration rendering (bands 12, 11, 8a). Courtesy of Sentinel Hub Playground. |
Information Contacts: Balai Penyelidikan dan Pengembangan Teknologi Kebencanaan Geologi (BPPTKG), Center for Research and Development of Geological Disaster Technology (URL: http://merapi.bgl.esdm.go.id/, Twitter: @BPPTKG); MAGMA Indonesia, Kementerian Energi dan Sumber Daya Mineral (URL: https://magma.esdm.go.id/v1); Pusat Vulkanologi dan Mitigasi Bencana Geologi (PVMBG, also known as Indonesian Center for Volcanology and Geological Hazard Mitigation, CVGHM), Jalan Diponegoro 57, Bandung 40122, Indonesia (URL: http://www.vsi.esdm.go.id/); Darwin Volcanic Ash Advisory Centre (VAAC), Bureau of Meteorology, Northern Territory Regional Office, PO Box 40050, Casuarina, NT 0811, Australia (URL: http://www.bom.gov.au/info/vaac/); MIROVA (Middle InfraRed Observation of Volcanic Activity), a collaborative project between the Universities of Turin and Florence (Italy) supported by the Centre for Volcanic Risk of the Italian Civil Protection Department (URL: http://www.mirovaweb.it/); Hawai'i Institute of Geophysics and Planetology (HIGP) - MODVOLC Thermal Alerts System, School of Ocean and Earth Science and Technology (SOEST), Univ. of Hawai'i, 2525 Correa Road, Honolulu, HI 96822, USA (URL: http://modis.higp.hawaii.edu/); Sentinel Hub Playground (URL: https://www.sentinel-hub.com/explore/sentinel-playground).
Intermittent incandescent avalanches of material and pyroclastic flows during October 2022-March 2023
Merapi is located just north of the major city of Yogyakarta in central Java, Indonesia. Pyroclastic flows and lahars accompanying growth and collapse of the steep-sided active summit lava dome over the last 20 years have occurred on the western to southern flanks, resulting in many fatalities. The current eruption period began in late December 2020 and has since September 2021 consisted of frequent avalanches of material, crater incandescence, and occasional pyroclastic flows (BGVN 47:10). This report updates information during October 2022 through March 2023, based on information from Balai Penyelidikan dan Pengembangan Teknologi Kebencanaan Geologi (BPPTKG), the Center for Research and Development of Geological Disaster Technology, a branch of PVMBG which specifically monitors Merapi. Additional information comes from the Pusat Vulkanologi dan Mitigasi Bencana Geologi (PVMBG, also known as Indonesian Center for Volcanology and Geological Hazard Mitigation, CVGHM), MAGMA Indonesia, the Darwin Volcanic Ash Advisory Centre (VAAC), and various satellite data.
Activity was relatively low during October 2022 through February 2023 and mainly consisted of frequent white gas-and-steam emissions that rose 10-600 m above the summit and an average of about 2 or fewer avalanches of material per day that affected the SW and W flanks (table 24). Shallow and deep volcanic earthquakes were occasionally recorded. Activity notably increased during 11-15 March, which consisted of tens of pyroclastic flows during this time, ash plumes, and several incandescent avalanches of material.
Table 24. Monthly summary of avalanches and avalanche distances recorded at Merapi during October 2022 through March 2023. The number of reported avalanches does not include instances where possible avalanches were heard but could not be visually confirmed as a result of inclement weather. Data courtesy of BPPTKG (October 2022-March 2023 daily reports).
| Month | Average number of avalanches per day | Distance avalanches traveled (m) |
| Oct 2022 | 2.2 | 800-1,800 |
| Nov 2022 | 1.7 | 800-1,800 |
| Dec 2022 | 1.3 | 500-1,600 |
| Jan 2023 | 1.8 | 500-2,000 |
| Feb 2023 | 1 | 1,700-1,800 |
| Mar 2023 | 22.6 | 1,200-2,500 |
BPPTKG reported that during October and November white gas-and-steam emissions rose 15-600 m above the summit, avalanches of material descended 800-1,800 on the SW and W flanks, and seismicity. Foggy weather often prevented clear views of the summit, so sometimes avalanches could not be verified. A seismometer detected a pyroclastic flow on 11 November at 0905 that lasted 135 seconds; it descended 1 km on the SW flank. A second pyroclastic flow was detected at 1208 later that day, lasting 104 seconds and descending 1 km down the SW flank. In addition, an incandescent avalanche of material traveled 1.1 km to the SW, though the time was not recorded. On 12 November an avalanche traveled 800 m down the SW flank, and two avalanches descended the SW flank for 1.5 km on 15 November. According to a Darwin VAAC report, an ash plume rose to 4.6 km altitude and drifted SW at 0950 on 25 November.
During December 2022 and January 2023, similar activity persisted, with detected seismicity, white gas-and-steam emissions that rose 10-200 m above the summit, occasional incandescent avalanches of material traveled 800-2,000 m down the SW and W flanks. On 19 December a collapse generated an avalanche of material that traveled 1.5 km down the SW flank. A pyroclastic flow on 30 December descended 900 m to the W. On 13 January a collapse generated an avalanche that moved 1.5 km down the SW flank. Avalanches of material during 19 January traveled as far as 2 km on the SW flank.
Occasional white gas-and-steam emissions during February rose 20-75 m above the crater, seismicity continued, and intermittent incandescent avalanches of material traveled 1.7-1.8 km to the SW. On 8 February at 0710 a pyroclastic flow was detected, lasting 130 seconds and traveling 1.5 km to the SW. Ashfall was reported in areas downwind including Sangup, Musuk, and Mriyan.
Increased activity was reported during March, which consisted of some white gas-and-steam emissions, seismicity, incandescent avalanches of material, pyroclastic flows, ash plumes, and ashfall. White gas-and-steam emissions rose 20-550 m above the summit. Incandescent avalanches traveled 1.2-2.5 km to the SW, often accompanied by rock fall events. A VONA issued on 11 March reported that an ash plume at 1212 and 1306 rose 3 km above the summit and drifted W to NW, causing ashfall in several areas downwind, especially in Magelang. During 1212-1500 a series of 21 avalanches of material from the SW lava dome produced 41 pyroclastic flows that traveled as far as 4 km down the SW flank (figure 132). On 12 March at 0708 and 1619 ash plumes rose 2-2.5 km above the summit and drifted N, NW, W, and E, based on information from a ground observer. There were 21 pyroclastic flows on 12 March that traveled as far as 2 km SW (figure 133). In addition, 15 avalanches of material traveled 2.5 km down the SW flank. During 11-12 March ashfall of varying intensities was deposited in areas to the W, NW, and N including in the Dukun District, Sawangan, Magelang Regency; Magelang City; Selo District, Boyolali Regency; and Ambarawa, Jambu, Sumowono, Pringapus, Banyubiru, Bawen Districts, Semarang Regency. Two pyroclastic flows on 13 March descended the SW flank as far as 1.5 km.
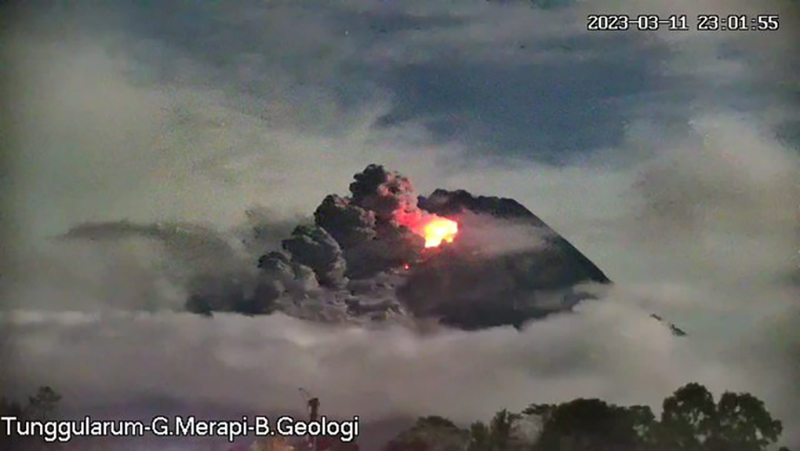 |
Figure 132. Webcam image showing summit crater incandescence accompanied by a pyroclastic flow descending the SW flank of Merapi at 2301 on 11 March 2023. Courtesy of BPPTKG. |
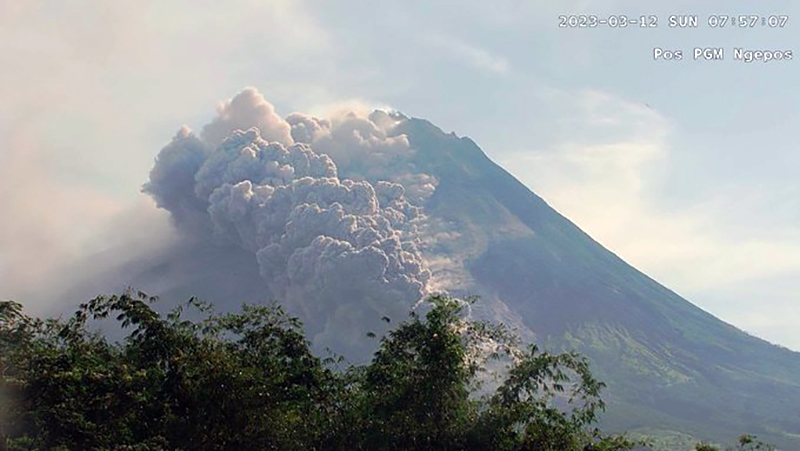 |
Figure 133. Webcam image showing a pyroclastic flow from Merapi on 12 March 2023 at 0757 descending the SW flank. Courtesy of BPPTKG. |
By 13 March a total of 60 pyroclastic flows had mainly affected the Bebeng drainage (SW flank) since 11 March. According to the Darwin VAAC at 0100, 0630, and 0900 ash plumes rose as high as 1.4 km above the summit and drifted NW. A VONA issued on 14 March reported a gray-and-brown ash plume that rose 2.5 km above the summit and drifted E and SE. On 14 March at 0550 pyroclastic flows generated an ash plume that rose 1.5 km above the summit and drifted E to SE. Three pyroclastic flows on the same day traveled 1.3 km down the SW flank. On 15 March three pyroclastic flows descended 1.3 km down the SW flank and at 1036 an ash plume rose 1.2 km above the summit and drifted E. According to the Darwin VAAC ash plumes rose to 1.2 km above the summit and drifted S and W, based on webcam images on 15 and 17 March. Two pyroclastic flows were observed on the SW flank that traveled 2 km on 30 March. Morphological changes were observed in the SW lava dome based on webcam and drone images. The volume of the dome before 11 March was 2,759,100 cubic meters and by 13 March the volume had decreased to 1,686,200 cubic meters, a reduction of nearly 40%. The volume of the summit dome remained unchanged and was estimated at 2,312,100 cubic meters.
MODVOLC thermal alerts detected two thermal anomalies on 11 and 12 March 2023, likely represented by the increased number of incandescent avalanches of material and accompanying pyroclastic flows. A Sentinel-2 infrared satellite image taken on 29 March showed a still active incandescent avalanche descending the SW flank (figure 134).
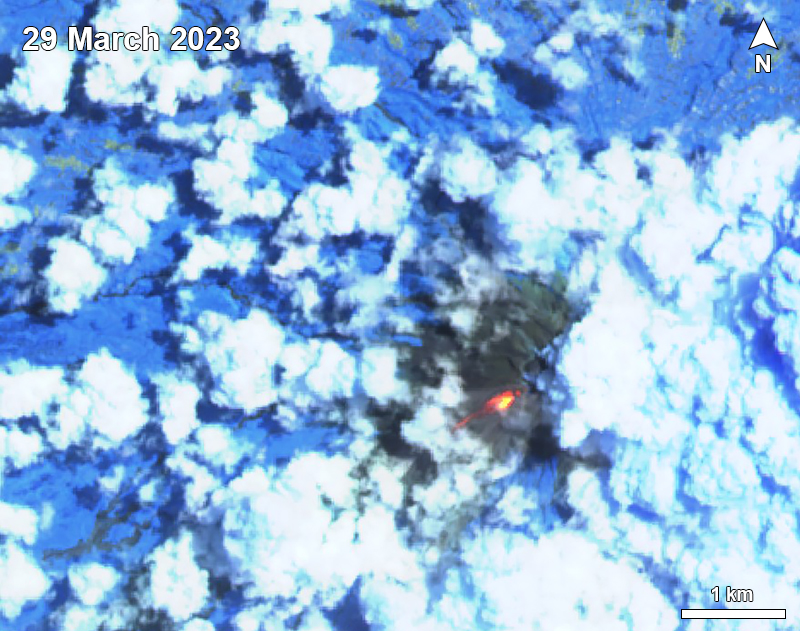 |
Figure 134. Sentinel-2 infrared satellite image taken on 29 March 2023 showed an incandescent avalanche of material descending the SW flank of Merapi. Image uses Atmospheric penetration rendering (bands 12, 11, 8a). Courtesy of Sentinel Hub Playground. |
Information Contacts: Balai Penyelidikan dan Pengembangan Teknologi Kebencanaan Geologi (BPPTKG), Center for Research and Development of Geological Disaster Technology (URL: http://merapi.bgl.esdm.go.id/, Twitter: @BPPTKG); MAGMA Indonesia, Kementerian Energi dan Sumber Daya Mineral (URL: https://magma.esdm.go.id/v1); Pusat Vulkanologi dan Mitigasi Bencana Geologi (PVMBG, also known as Indonesian Center for Volcanology and Geological Hazard Mitigation, CVGHM), Jalan Diponegoro 57, Bandung 40122, Indonesia (URL: http://www.vsi.esdm.go.id/); Hawai'i Institute of Geophysics and Planetology (HIGP) - MODVOLC Thermal Alerts System, School of Ocean and Earth Science and Technology (SOEST), Univ. of Hawai'i, 2525 Correa Road, Honolulu, HI 96822, USA (URL: http://modis.higp.hawaii.edu/); Sentinel Hub Playground (URL: https://www.sentinel-hub.com/explore/sentinel-playground).
Frequent incandescent avalanches during April-September 2023
Merapi, located just north of the major city of Yogyakarta in central Java, Indonesia, has had activity within the last 20 years characterized by pyroclastic flows and lahars accompanying growth and collapse of the steep-sided active summit lava dome. The current eruption period began in late December 2020 and has more recently consisted of ash plumes, intermittent incandescent avalanches of material, and pyroclastic flows (BGVN 48:04). This report covers activity during April through September 2023, based on information from Balai Penyelidikan dan Pengembangan Teknologi Kebencanaan Geologi (BPPTKG), the Center for Research and Development of Geological Disaster Technology, a branch of PVMBG which specifically monitors Merapi. Additional information comes from the Pusat Vulkanologi dan Mitigasi Bencana Geologi (PVMBG, also known as Indonesian Center for Volcanology and Geological Hazard Mitigation, CVGHM), MAGMA Indonesia, the Darwin Volcanic Ash Advisory Centre (VAAC), and various satellite data.
Activity during April through September 2023 primarily consisted of incandescent avalanches of material that mainly affected the SW and W flanks and traveled as far as 2.3 km from the summit (table 25) and white gas-and-steam emissions that rose 10-1,000 m above the crater.
Table 25. Monthly summary of avalanches and avalanche distances recorded at Merapi during April through September 2023. The number of reported avalanches does not include instances where possible avalanches were heard but could not be visually confirmed as a result of inclement weather. Data courtesy of BPPTKG (April-September 2023 daily reports).
| Month | Average number of avalanches per day | Distance avalanches traveled (m) |
| Apr 2023 | 19 | 1,200-2,000 |
| May 2023 | 22 | 500-2,000 |
| Jun 2023 | 18 | 1,200-2,000 |
| Jul 2023 | 30 | 300-2,000 |
| Aug 2023 | 25 | 400-2,300 |
| Sep 2023 | 23 | 600-2,000 |
BPPTKG reported that during April and May white gas-and-steam emissions rose 10-750 m above the crater, incandescent avalanches descended 500-2,000 m on the SW and W flanks (figure 135). Cloudy weather often prevented clear views of the summit, and sometimes avalanches could not be confirmed. According to a webcam image, a pyroclastic flow was visible on 17 April at 0531. During the week of 28 April and 4 May a pyroclastic flow was reported on the SW flank, traveling up to 2.5 km. According to a drone overflight taken on 17 May the SW lava dome volume was an estimated 2,372,800 cubic meters and the dome in the main crater was an estimated 2,337,300 cubic meters.
|
Figure 135. Photo showing an incandescent avalanche affecting the flank of Merapi on 8 April 2023. Courtesy of Øystein Lund Andersen. |
During June and July similar activity persisted with white gas-and-steam emissions rising 10-350 m above the crater and frequent incandescent avalanches that traveled 300-2,000 m down the SW, W, and S flanks (figure 136). Based on an analysis of aerial photos taken on 24 June the volume of the SW lava dome was approximately 2.5 million cubic meters. A pyroclastic flow was observed on 5 July that traveled 2.7 km on the SW flank. According to the Darwin VAAC multiple minor ash plumes were identified in satellite images on 19 July that rose to 3.7 km altitude and drifted S and SW. During 22, 25, and 26 July a total of 17 avalanches descended as far as 1.8 km on the S flank.
|
Figure 136. Photo showing an incandescent avalanche descending the flank of Merapi on 23 July 2023. Courtesy of Øystein Lund Andersen. |
Frequent white gas-and-steam emissions continued during August and September, rising 10-450 m above the crater. Incandescent avalanches mainly affected the SW and W flanks and traveled 400-2,300 m from the vent (figure 137). An aerial survey conducted on 10 August was analyzed and reported that estimates of the SW dome volume was 2,764,300 cubic meters and the dome in the main crater was 2,369,800 cubic meters.
|
Figure 137. Photo showing a strong incandescent avalanche descending the flank of Merapi on 23 September 2023. Courtesy of Øystein Lund Andersen. |
Frequent and moderate-power thermal activity continued throughout the reporting period, according to a MIROVA (Middle InfraRed Observation of Volcanic Activity) analysis of MODIS satellite data (figure 138). There was an increase in the number of detected anomalies during mid-May. The MODVOLC thermal algorithm recorded a total of 47 thermal hotspots: six during April, nine during May, eight during June, 15 during July, four during August, and five during September. Some of this activity was captured in infrared satellite imagery on clear weather days, sometimes accompanied by incandescent material on the SW flank (figure 139).
|
Figure 138. Frequent and moderate-power thermal anomalies were detected at Merapi during April through September 2023, as shown on this MIROVA plot (Log Radiative Power). There was an increase in the number of anomalies recorded during mid-May. Courtesy of MIROVA. |
|
Figure 139. Infrared (bands B12, B11, B4) satellite images showed a consistent thermal anomaly (bright yellow-orange) at the summit crater of Merapi on 8 April 2023 (top left), 18 May 2023 (top right), 17 June 2023 (middle left), 17 July 2023 (middle right), 11 August 2023 (bottom left), and 20 September 2023 (bottom right). Incandescent material was occasionally visible descending the SW flank, as shown in each of these images. Courtesy of Copernicus Browser. |
Information Contacts: Balai Penyelidikan dan Pengembangan Teknologi Kebencanaan Geologi (BPPTKG), Center for Research and Development of Geological Disaster Technology (URL: http://merapi.bgl.esdm.go.id/, Twitter: @BPPTKG); MAGMA Indonesia, Kementerian Energi dan Sumber Daya Mineral (URL: https://magma.esdm.go.id/v1); Pusat Vulkanologi dan Mitigasi Bencana Geologi (PVMBG, also known as Indonesian Center for Volcanology and Geological Hazard Mitigation, CVGHM), Jalan Diponegoro 57, Bandung 40122, Indonesia (URL: http://www.vsi.esdm.go.id/); Darwin Volcanic Ash Advisory Centre (VAAC), Bureau of Meteorology, Northern Territory Regional Office, PO Box 40050, Casuarina, NT 0811, Australia (URL: http://www.bom.gov.au/info/vaac/); MIROVA (Middle InfraRed Observation of Volcanic Activity), a collaborative project between the Universities of Turin and Florence (Italy) supported by the Centre for Volcanic Risk of the Italian Civil Protection Department (URL: http://www.mirovaweb.it/); Hawai'i Institute of Geophysics and Planetology (HIGP) - MODVOLC Thermal Alerts System, School of Ocean and Earth Science and Technology (SOEST), Univ. of Hawai'i, 2525 Correa Road, Honolulu, HI 96822, USA (URL: http://modis.higp.hawaii.edu/); Copernicus Browser, Copernicus Data Space Ecosystem, European Space Agency (URL: https://dataspace.copernicus.eu/browser/); Øystein Lund Andersen (URL: https://www.oysteinlundandersen.com/, https://twitter.com/oysteinvolcano).
|
|
||||||||||||||||||||||||||||
There is data available for 106 confirmed eruptive periods.
2020 Dec 31 - 2025 Jul 11 (continuing) Confirmed Eruption (Explosive / Effusive) VEI: 1
| Episode 1 | Eruption (Explosive / Effusive) | ||||||||||||||
|---|---|---|---|---|---|---|---|---|---|---|---|---|---|---|
| 2020 Dec 31 - 2025 Jul 11 (continuing) | Evidence from Observations: Reported | |||||||||||||
|
List of 1 Events for Episode 1
|
||||||||||||||
2018 May 11 - 2020 Jun 21 Confirmed Eruption (Explosive / Effusive) VEI: 3
| Episode 1 | Eruption (Explosive / Effusive) | Summit crater | ||||||||||||||||||||||||||||||||||||||||||||||||||||||||||||||||||||||||||||||||||||||||||||||||||||||||||||||||||||||||||||||||||||||||||||||||||||||||||||||||||||||||||||||||||
|---|---|---|---|---|---|---|---|---|---|---|---|---|---|---|---|---|---|---|---|---|---|---|---|---|---|---|---|---|---|---|---|---|---|---|---|---|---|---|---|---|---|---|---|---|---|---|---|---|---|---|---|---|---|---|---|---|---|---|---|---|---|---|---|---|---|---|---|---|---|---|---|---|---|---|---|---|---|---|---|---|---|---|---|---|---|---|---|---|---|---|---|---|---|---|---|---|---|---|---|---|---|---|---|---|---|---|---|---|---|---|---|---|---|---|---|---|---|---|---|---|---|---|---|---|---|---|---|---|---|---|---|---|---|---|---|---|---|---|---|---|---|---|---|---|---|---|---|---|---|---|---|---|---|---|---|---|---|---|---|---|---|---|---|---|---|---|---|---|---|---|---|---|---|---|---|---|---|---|---|
| 2018 May 11 - 2018 Jun 2 | Evidence from Observations: Reported | ||||||||||||||||||||||||||||||||||||||||||||||||||||||||||||||||||||||||||||||||||||||||||||||||||||||||||||||||||||||||||||||||||||||||||||||||||||||||||||||||||||||||||||||||||
|
List of 34 Events for Episode 1 at Summit crater
|
|||||||||||||||||||||||||||||||||||||||||||||||||||||||||||||||||||||||||||||||||||||||||||||||||||||||||||||||||||||||||||||||||||||||||||||||||||||||||||||||||||||||||||||||||||
| Episode 2 | Eruption (Explosive / Effusive) | Summit crater | ||||||||||||||||||||||||||||||||||||||||||||||||
|---|---|---|---|---|---|---|---|---|---|---|---|---|---|---|---|---|---|---|---|---|---|---|---|---|---|---|---|---|---|---|---|---|---|---|---|---|---|---|---|---|---|---|---|---|---|---|---|---|---|
| 2018 Aug 12 - 2020 Jun 21 | Evidence from Observations: Reported | ||||||||||||||||||||||||||||||||||||||||||||||||
|
List of 8 Events for Episode 2 at Summit crater
|
|||||||||||||||||||||||||||||||||||||||||||||||||
2014 Mar 9 - 2014 Apr 20 Confirmed Eruption (Explosive / Effusive) VEI: 3
| Episode 1 | Eruption (Explosive / Effusive) | Summit crater | |||||||||||||||||||||||||||||||||||||||||||||||||||||||||||||||||||||||||||||||||||
|---|---|---|---|---|---|---|---|---|---|---|---|---|---|---|---|---|---|---|---|---|---|---|---|---|---|---|---|---|---|---|---|---|---|---|---|---|---|---|---|---|---|---|---|---|---|---|---|---|---|---|---|---|---|---|---|---|---|---|---|---|---|---|---|---|---|---|---|---|---|---|---|---|---|---|---|---|---|---|---|---|---|---|---|---|
| 2014 Mar 9 - 2014 Apr 20 | Evidence from Observations: Reported | |||||||||||||||||||||||||||||||||||||||||||||||||||||||||||||||||||||||||||||||||||
|
List of 15 Events for Episode 1 at Summit crater
|
||||||||||||||||||||||||||||||||||||||||||||||||||||||||||||||||||||||||||||||||||||
2013 Nov 18 - 2013 Nov 18 Confirmed Eruption (Explosive / Effusive) VEI: 3
| Episode 1 | Eruption (Explosive / Effusive) | Summit crater | |||||||||||||||||||||||||||||||||||||||||||
|---|---|---|---|---|---|---|---|---|---|---|---|---|---|---|---|---|---|---|---|---|---|---|---|---|---|---|---|---|---|---|---|---|---|---|---|---|---|---|---|---|---|---|---|---|
| 2013 Nov 18 - 2013 Nov 18 | Evidence from Observations: Reported | |||||||||||||||||||||||||||||||||||||||||||
|
List of 7 Events for Episode 1 at Summit crater
|
||||||||||||||||||||||||||||||||||||||||||||
2013 Jul 22 - 2013 Jul 22 Confirmed Eruption (Explosive / Effusive) VEI: 1
| Episode 1 | Eruption (Explosive / Effusive) | Summit crater | ||||||||||||||||||||||||||||
|---|---|---|---|---|---|---|---|---|---|---|---|---|---|---|---|---|---|---|---|---|---|---|---|---|---|---|---|---|---|
| 2013 Jul 22 - 2013 Jul 22 | Evidence from Observations: Reported | ||||||||||||||||||||||||||||
|
List of 4 Events for Episode 1 at Summit crater
|
|||||||||||||||||||||||||||||
2011 Mar 25 - 2011 Sep 8 Confirmed Eruption (Explosive / Effusive) VEI: 1
| Episode 1 | Eruption (Explosive / Effusive) | Summit crater | |||||||||||||||||||||||||||||||||||||||||||||||||||||||||||||||
|---|---|---|---|---|---|---|---|---|---|---|---|---|---|---|---|---|---|---|---|---|---|---|---|---|---|---|---|---|---|---|---|---|---|---|---|---|---|---|---|---|---|---|---|---|---|---|---|---|---|---|---|---|---|---|---|---|---|---|---|---|---|---|---|---|
| 2011 Mar 25 - 2011 Sep 8 | Evidence from Observations: Photo / Video | |||||||||||||||||||||||||||||||||||||||||||||||||||||||||||||||
|
List of 11 Events for Episode 1 at Summit crater
|
||||||||||||||||||||||||||||||||||||||||||||||||||||||||||||||||
2010 Oct 26 - 2010 Nov 29 Confirmed Eruption (Explosive / Effusive) VEI: 4
This eruption has three episodes. The first is precursor seismicity that occurred in advance of the 26 October 2010 eruption. It began in early September 2010, followed a few weeks later by significant inflation. The second episode began with major explosions on 26 October, and included dome growth, pyroclastic flows, and ash plumes that lasted through the end of November 2010, resulting in tens of thousands of evacuations and several hundred fatalities. The third episode began with secondary lahars on 23 November 2010 that were reported through mid-April 2011, causing additional evacuations, significant damage to infrastructure and property, and several additional fatalities. Renewed dome growth that started on 25 March 2011 was considered by Indonesian volcanologists to be part of the Oct-Nov 2010 eruption, but that is 4 months after the last previously confirmed eruptive activity in late November 2010 and thus treated here as a separate eruption.
| Episode 1 | Non-eruptive (Precursory) | Summit crater | |||||||||||||||||||||||||||||||||||||||||||
|---|---|---|---|---|---|---|---|---|---|---|---|---|---|---|---|---|---|---|---|---|---|---|---|---|---|---|---|---|---|---|---|---|---|---|---|---|---|---|---|---|---|---|---|---|
| 2010 Sep 1 (on or after) - 2010 Oct 26 | Evidence from Observations: Seismicity | |||||||||||||||||||||||||||||||||||||||||||
|
List of 7 Events for Episode 1 at Summit crater
|
||||||||||||||||||||||||||||||||||||||||||||
| Episode 2 | Eruption (Explosive / Effusive) | Summit crater | ||||||||||||||||||||||||||||||||||||||||||||||||||||||||||||||||||||||||||||||||||||||||||||||||||||||||||||||||||||||||||||||||||||||||||||||||||||||||||||||||||||||||||||||||||||||||||||||||||||||||||||||||||||||||||||||||||||||||||||||||||||||||||||||||||||||||||||||||||||||||||||||||||||||||||||||||||||||||||||||||||||||||||||||||||||||||||||||||||||||||||||||||||||||||||||||||||||||||||||||||||||||||||||||||||||||||||||||||||||||||||||||||
|---|---|---|---|---|---|---|---|---|---|---|---|---|---|---|---|---|---|---|---|---|---|---|---|---|---|---|---|---|---|---|---|---|---|---|---|---|---|---|---|---|---|---|---|---|---|---|---|---|---|---|---|---|---|---|---|---|---|---|---|---|---|---|---|---|---|---|---|---|---|---|---|---|---|---|---|---|---|---|---|---|---|---|---|---|---|---|---|---|---|---|---|---|---|---|---|---|---|---|---|---|---|---|---|---|---|---|---|---|---|---|---|---|---|---|---|---|---|---|---|---|---|---|---|---|---|---|---|---|---|---|---|---|---|---|---|---|---|---|---|---|---|---|---|---|---|---|---|---|---|---|---|---|---|---|---|---|---|---|---|---|---|---|---|---|---|---|---|---|---|---|---|---|---|---|---|---|---|---|---|---|---|---|---|---|---|---|---|---|---|---|---|---|---|---|---|---|---|---|---|---|---|---|---|---|---|---|---|---|---|---|---|---|---|---|---|---|---|---|---|---|---|---|---|---|---|---|---|---|---|---|---|---|---|---|---|---|---|---|---|---|---|---|---|---|---|---|---|---|---|---|---|---|---|---|---|---|---|---|---|---|---|---|---|---|---|---|---|---|---|---|---|---|---|---|---|---|---|---|---|---|---|---|---|---|---|---|---|---|---|---|---|---|---|---|---|---|---|---|---|---|---|---|---|---|---|---|---|---|---|---|---|---|---|---|---|---|---|---|---|---|---|---|---|---|---|---|---|---|---|---|---|---|---|---|---|---|---|---|---|---|---|---|---|---|---|---|---|---|---|---|---|---|---|---|---|---|---|---|---|---|---|---|---|---|---|---|---|---|---|---|---|---|---|---|---|---|---|---|---|---|---|---|---|---|---|---|---|---|---|---|---|---|---|---|---|---|---|---|---|---|---|---|---|---|---|---|---|---|---|---|---|---|---|---|---|---|---|---|---|---|---|---|---|---|---|---|---|---|---|---|---|---|---|---|---|---|---|---|---|---|---|---|---|---|---|---|---|---|---|
| 2010 Oct 26 - 2010 Nov 29 | Evidence from Observations: Reported | ||||||||||||||||||||||||||||||||||||||||||||||||||||||||||||||||||||||||||||||||||||||||||||||||||||||||||||||||||||||||||||||||||||||||||||||||||||||||||||||||||||||||||||||||||||||||||||||||||||||||||||||||||||||||||||||||||||||||||||||||||||||||||||||||||||||||||||||||||||||||||||||||||||||||||||||||||||||||||||||||||||||||||||||||||||||||||||||||||||||||||||||||||||||||||||||||||||||||||||||||||||||||||||||||||||||||||||||||||||||||||||||||
|
List of 88 Events for Episode 2 at Summit crater
|
|||||||||||||||||||||||||||||||||||||||||||||||||||||||||||||||||||||||||||||||||||||||||||||||||||||||||||||||||||||||||||||||||||||||||||||||||||||||||||||||||||||||||||||||||||||||||||||||||||||||||||||||||||||||||||||||||||||||||||||||||||||||||||||||||||||||||||||||||||||||||||||||||||||||||||||||||||||||||||||||||||||||||||||||||||||||||||||||||||||||||||||||||||||||||||||||||||||||||||||||||||||||||||||||||||||||||||||||||||||||||||||||||
| Episode 3 | Non-eruptive (Secondary) | Multiple flanks | |||||||||||||||||||||||||||||||||||||||||||||||||||||||||||||||||||||||||||||||||||||||||||||||||||||||||||||||||||||||||||
|---|---|---|---|---|---|---|---|---|---|---|---|---|---|---|---|---|---|---|---|---|---|---|---|---|---|---|---|---|---|---|---|---|---|---|---|---|---|---|---|---|---|---|---|---|---|---|---|---|---|---|---|---|---|---|---|---|---|---|---|---|---|---|---|---|---|---|---|---|---|---|---|---|---|---|---|---|---|---|---|---|---|---|---|---|---|---|---|---|---|---|---|---|---|---|---|---|---|---|---|---|---|---|---|---|---|---|---|---|---|---|---|---|---|---|---|---|---|---|---|---|---|---|---|---|
| 2010 Nov 23 - 2011 Apr 14 | Evidence from Observations: Reported | |||||||||||||||||||||||||||||||||||||||||||||||||||||||||||||||||||||||||||||||||||||||||||||||||||||||||||||||||||||||||||
|
List of 23 Events for Episode 3 at Multiple flanks
|
||||||||||||||||||||||||||||||||||||||||||||||||||||||||||||||||||||||||||||||||||||||||||||||||||||||||||||||||||||||||||||
[ 2008 May 19 ] Uncertain Eruption
| Episode 1 | Eruption (Explosive / Effusive) | |||||||||||||||||||
|---|---|---|---|---|---|---|---|---|---|---|---|---|---|---|---|---|---|---|---|
| 2008 May 19 - Unknown | Evidence from Unknown | ||||||||||||||||||
|
List of 2 Events for Episode 1
|
|||||||||||||||||||
2006 Mar 16 ± 15 days - 2007 Aug 9 (?) Confirmed Eruption (Explosive / Effusive) VEI: 1
| Episode 1 | Eruption (Explosive / Effusive) | ||||||||||||||||||||||||||||||||||||||||||||||||||||||||||||||||
|---|---|---|---|---|---|---|---|---|---|---|---|---|---|---|---|---|---|---|---|---|---|---|---|---|---|---|---|---|---|---|---|---|---|---|---|---|---|---|---|---|---|---|---|---|---|---|---|---|---|---|---|---|---|---|---|---|---|---|---|---|---|---|---|---|
| 2006 Mar 16 ± 15 days - 2007 Aug 9 (?) | Evidence from Observations: Reported | |||||||||||||||||||||||||||||||||||||||||||||||||||||||||||||||
|
List of 11 Events for Episode 1
|
||||||||||||||||||||||||||||||||||||||||||||||||||||||||||||||||
1992 Jan 20 - 2002 Oct 19 (?) Confirmed Eruption (Explosive / Effusive) VEI: 2
| Episode 1 | Eruption (Explosive / Effusive) | NW of 1984 lava dome | ||||||||||||||||||||||||||||||||||||||||||||||||||||||||||||||||||||||||||||||||||||||||||||||||||
|---|---|---|---|---|---|---|---|---|---|---|---|---|---|---|---|---|---|---|---|---|---|---|---|---|---|---|---|---|---|---|---|---|---|---|---|---|---|---|---|---|---|---|---|---|---|---|---|---|---|---|---|---|---|---|---|---|---|---|---|---|---|---|---|---|---|---|---|---|---|---|---|---|---|---|---|---|---|---|---|---|---|---|---|---|---|---|---|---|---|---|---|---|---|---|---|---|---|---|---|
| 1992 Jan 20 - 2002 Oct 19 (?) | Evidence from Observations: Reported | ||||||||||||||||||||||||||||||||||||||||||||||||||||||||||||||||||||||||||||||||||||||||||||||||||
|
List of 18 Events for Episode 1 at NW of 1984 lava dome
|
|||||||||||||||||||||||||||||||||||||||||||||||||||||||||||||||||||||||||||||||||||||||||||||||||||
1986 Oct 10 - 1990 Aug 16 (?) ± 15 days Confirmed Eruption (Explosive / Effusive) VEI: 2
| Episode 1 | Eruption (Explosive / Effusive) | |||||||||||||||||||||||||||||||||||||||||||||||||
|---|---|---|---|---|---|---|---|---|---|---|---|---|---|---|---|---|---|---|---|---|---|---|---|---|---|---|---|---|---|---|---|---|---|---|---|---|---|---|---|---|---|---|---|---|---|---|---|---|---|
| 1986 Oct 10 - 1990 Aug 16 (?) ± 15 days | Evidence from Observations: Reported | ||||||||||||||||||||||||||||||||||||||||||||||||
|
List of 8 Events for Episode 1
|
|||||||||||||||||||||||||||||||||||||||||||||||||
1972 Oct 6 - 1985 Mar 16 ± 15 days Confirmed Eruption (Explosive / Effusive) VEI: 2
| Episode 1 | Eruption (Explosive / Effusive) | ||||||||||||||||||||||||||||||||||||||||||||||||||||||||||||||||||||||||||||||||||||||||||||||
|---|---|---|---|---|---|---|---|---|---|---|---|---|---|---|---|---|---|---|---|---|---|---|---|---|---|---|---|---|---|---|---|---|---|---|---|---|---|---|---|---|---|---|---|---|---|---|---|---|---|---|---|---|---|---|---|---|---|---|---|---|---|---|---|---|---|---|---|---|---|---|---|---|---|---|---|---|---|---|---|---|---|---|---|---|---|---|---|---|---|---|---|---|---|---|
| 1972 Oct 6 - 1985 Mar 16 ± 15 days | Evidence from Observations: Reported | |||||||||||||||||||||||||||||||||||||||||||||||||||||||||||||||||||||||||||||||||||||||||||||
|
List of 17 Events for Episode 1
|
||||||||||||||||||||||||||||||||||||||||||||||||||||||||||||||||||||||||||||||||||||||||||||||
[ 1971 Jan 16 ± 15 days - 1971 Jul 26 ] Uncertain Eruption
| Episode 1 | Eruption (Explosive / Effusive) | |||||||||||||||||||
|---|---|---|---|---|---|---|---|---|---|---|---|---|---|---|---|---|---|---|---|
| 1971 Jan 16 ± 15 days - 1971 Jul 26 | Evidence from Unknown | ||||||||||||||||||
|
List of 2 Events for Episode 1
|
|||||||||||||||||||
1967 Jan 12 - 1970 Jul 2 (?) ± 182 days Confirmed Eruption (Explosive / Effusive) VEI: 2
| Episode 1 | Eruption (Explosive / Effusive) | Upper Batang breach (2600 m) | |||||||||||||||||||||||||||||||||||||||||||||||||||||||||||||||||||||||||||||||||||
|---|---|---|---|---|---|---|---|---|---|---|---|---|---|---|---|---|---|---|---|---|---|---|---|---|---|---|---|---|---|---|---|---|---|---|---|---|---|---|---|---|---|---|---|---|---|---|---|---|---|---|---|---|---|---|---|---|---|---|---|---|---|---|---|---|---|---|---|---|---|---|---|---|---|---|---|---|---|---|---|---|---|---|---|---|
| 1967 Jan 12 - 1970 Jul 2 (?) ± 182 days | Evidence from Observations: Reported | |||||||||||||||||||||||||||||||||||||||||||||||||||||||||||||||||||||||||||||||||||
|
List of 15 Events for Episode 1 at Upper Batang breach (2600 m)
|
||||||||||||||||||||||||||||||||||||||||||||||||||||||||||||||||||||||||||||||||||||
1961 Apr 11 - 1961 Nov 28 Confirmed Eruption (Explosive / Effusive) VEI: 3
| Episode 1 | Eruption (Explosive / Effusive) | ||||||||||||||||||||||||||||||||||||||||||||||||||||||||||||||||
|---|---|---|---|---|---|---|---|---|---|---|---|---|---|---|---|---|---|---|---|---|---|---|---|---|---|---|---|---|---|---|---|---|---|---|---|---|---|---|---|---|---|---|---|---|---|---|---|---|---|---|---|---|---|---|---|---|---|---|---|---|---|---|---|---|
| 1961 Apr 11 - 1961 Nov 28 | Evidence from Observations: Reported | |||||||||||||||||||||||||||||||||||||||||||||||||||||||||||||||
|
List of 11 Events for Episode 1
|
||||||||||||||||||||||||||||||||||||||||||||||||||||||||||||||||
1953 Mar 2 - 1958 Dec 16 ± 15 days Confirmed Eruption (Explosive / Effusive) VEI: 2 (?)
| Episode 1 | Eruption (Explosive / Effusive) | |||||||||||||||||||||||||||||||||||||||||||||||||||||||||||||||||||||||||||||||||||||||||||||||||||
|---|---|---|---|---|---|---|---|---|---|---|---|---|---|---|---|---|---|---|---|---|---|---|---|---|---|---|---|---|---|---|---|---|---|---|---|---|---|---|---|---|---|---|---|---|---|---|---|---|---|---|---|---|---|---|---|---|---|---|---|---|---|---|---|---|---|---|---|---|---|---|---|---|---|---|---|---|---|---|---|---|---|---|---|---|---|---|---|---|---|---|---|---|---|---|---|---|---|---|---|
| 1953 Mar 2 - 1958 Dec 16 ± 15 days | Evidence from Observations: Reported | ||||||||||||||||||||||||||||||||||||||||||||||||||||||||||||||||||||||||||||||||||||||||||||||||||
|
List of 18 Events for Episode 1
|
|||||||||||||||||||||||||||||||||||||||||||||||||||||||||||||||||||||||||||||||||||||||||||||||||||
1948 Sep 29 - 1948 Dec Confirmed Eruption (Explosive / Effusive) VEI: 2
| Episode 1 | Eruption (Explosive / Effusive) | ||||||||||||||||||||||||||||||||||
|---|---|---|---|---|---|---|---|---|---|---|---|---|---|---|---|---|---|---|---|---|---|---|---|---|---|---|---|---|---|---|---|---|---|---|
| 1948 Sep 29 - 1948 Dec | Evidence from Observations: Reported | |||||||||||||||||||||||||||||||||
|
List of 5 Events for Episode 1
|
||||||||||||||||||||||||||||||||||
1942 May 30 - 1945 May Confirmed Eruption (Explosive / Effusive) VEI: 2
| Episode 1 | Eruption (Explosive / Effusive) | |||||||||||||||||||||||||||||||||||||||||||||||||||||||||||||||||||||
|---|---|---|---|---|---|---|---|---|---|---|---|---|---|---|---|---|---|---|---|---|---|---|---|---|---|---|---|---|---|---|---|---|---|---|---|---|---|---|---|---|---|---|---|---|---|---|---|---|---|---|---|---|---|---|---|---|---|---|---|---|---|---|---|---|---|---|---|---|---|
| 1942 May 30 - 1945 May | Evidence from Observations: Reported | ||||||||||||||||||||||||||||||||||||||||||||||||||||||||||||||||||||
|
List of 12 Events for Episode 1
|
|||||||||||||||||||||||||||||||||||||||||||||||||||||||||||||||||||||
1939 Dec 13 - 1940 Sep Confirmed Eruption (Explosive / Effusive) VEI: 2
| Episode 1 | Eruption (Explosive / Effusive) | |||||||||||||||||||||||||||||||||||||||||||||||||
|---|---|---|---|---|---|---|---|---|---|---|---|---|---|---|---|---|---|---|---|---|---|---|---|---|---|---|---|---|---|---|---|---|---|---|---|---|---|---|---|---|---|---|---|---|---|---|---|---|---|
| 1939 Dec 13 - 1940 Sep | Evidence from Observations: Reported | ||||||||||||||||||||||||||||||||||||||||||||||||
|
List of 8 Events for Episode 1
|
|||||||||||||||||||||||||||||||||||||||||||||||||
1933 Oct 1 - 1935 Apr Confirmed Eruption (Explosive / Effusive) VEI: 2
| Episode 1 | Eruption (Explosive / Effusive) | ||||||||||||||||||||||||||||||||||||||||||||||||||||||
|---|---|---|---|---|---|---|---|---|---|---|---|---|---|---|---|---|---|---|---|---|---|---|---|---|---|---|---|---|---|---|---|---|---|---|---|---|---|---|---|---|---|---|---|---|---|---|---|---|---|---|---|---|---|---|
| 1933 Oct 1 - 1935 Apr | Evidence from Observations: Reported | |||||||||||||||||||||||||||||||||||||||||||||||||||||
|
List of 9 Events for Episode 1
|
||||||||||||||||||||||||||||||||||||||||||||||||||||||
1932 Nov Confirmed Eruption (Explosive / Effusive) VEI: 1
| Episode 1 | Eruption (Explosive / Effusive) | ||||||||||||||||||||||||||||||||||
|---|---|---|---|---|---|---|---|---|---|---|---|---|---|---|---|---|---|---|---|---|---|---|---|---|---|---|---|---|---|---|---|---|---|---|
| 1932 Nov - Unknown | Evidence from Observations: Reported | |||||||||||||||||||||||||||||||||
|
List of 5 Events for Episode 1
|
||||||||||||||||||||||||||||||||||
1930 Nov 25 - 1931 Sep Confirmed Eruption (Explosive / Effusive) VEI: 3
| Episode 1 | Eruption (Explosive / Effusive) | ||||||||||||||||||||||||||||||||||||||||||||||||||||||||||||||||
|---|---|---|---|---|---|---|---|---|---|---|---|---|---|---|---|---|---|---|---|---|---|---|---|---|---|---|---|---|---|---|---|---|---|---|---|---|---|---|---|---|---|---|---|---|---|---|---|---|---|---|---|---|---|---|---|---|---|---|---|---|---|---|---|---|
| 1930 Nov 25 - 1931 Sep | Evidence from Observations: Reported | |||||||||||||||||||||||||||||||||||||||||||||||||||||||||||||||
|
List of 11 Events for Episode 1
|
||||||||||||||||||||||||||||||||||||||||||||||||||||||||||||||||
1924 Sep 10 - 1924 Sep 12 ± 1 days Confirmed Eruption (Explosive / Effusive) VEI: 1
| Episode 1 | Eruption (Explosive / Effusive) | ||||||||||||||||||||||||||||||||||
|---|---|---|---|---|---|---|---|---|---|---|---|---|---|---|---|---|---|---|---|---|---|---|---|---|---|---|---|---|---|---|---|---|---|---|
| 1924 Sep 10 - 1924 Sep 12 ± 1 days | Evidence from Observations: Reported | |||||||||||||||||||||||||||||||||
|
List of 5 Events for Episode 1
|
||||||||||||||||||||||||||||||||||
[ 1923 Sep - 1923 Nov ] Uncertain Eruption
| Episode 1 | Eruption (Explosive / Effusive) | ||||
|---|---|---|---|---|
| 1923 Sep - 1923 Nov | Evidence from Unknown | |||
1922 Feb 18 - 1922 Aug 8 Confirmed Eruption (Explosive / Effusive) VEI: 1
| Episode 1 | Eruption (Explosive / Effusive) | |||||||||||||||||||||||||||||
|---|---|---|---|---|---|---|---|---|---|---|---|---|---|---|---|---|---|---|---|---|---|---|---|---|---|---|---|---|---|
| 1922 Feb 18 - 1922 Aug 8 | Evidence from Observations: Reported | ||||||||||||||||||||||||||||
|
List of 4 Events for Episode 1
|
|||||||||||||||||||||||||||||
1920 Jul 25 - 1921 Feb Confirmed Eruption (Explosive / Effusive) VEI: 2
| Episode 1 | Eruption (Explosive / Effusive) | ||||||||||||||||||||||||||||||||||||||||||||
|---|---|---|---|---|---|---|---|---|---|---|---|---|---|---|---|---|---|---|---|---|---|---|---|---|---|---|---|---|---|---|---|---|---|---|---|---|---|---|---|---|---|---|---|---|
| 1920 Jul 25 - 1921 Feb | Evidence from Observations: Reported | |||||||||||||||||||||||||||||||||||||||||||
|
List of 7 Events for Episode 1
|
||||||||||||||||||||||||||||||||||||||||||||
1918 Jan Confirmed Eruption (Explosive / Effusive) VEI: 1
| Episode 1 | Eruption (Explosive / Effusive) | |||||||||||||||||||
|---|---|---|---|---|---|---|---|---|---|---|---|---|---|---|---|---|---|---|---|
| 1918 Jan - Unknown | Evidence from Observations: Reported | ||||||||||||||||||
|
List of 2 Events for Episode 1
|
|||||||||||||||||||
1915 Mar 28 - 1915 May 15 Confirmed Eruption (Explosive / Effusive) VEI: 1
| Episode 1 | Eruption (Explosive / Effusive) | ||||||||||||||||||||||||
|---|---|---|---|---|---|---|---|---|---|---|---|---|---|---|---|---|---|---|---|---|---|---|---|---|
| 1915 Mar 28 - 1915 May 15 | Evidence from Observations: Reported | |||||||||||||||||||||||
|
List of 3 Events for Episode 1
|
||||||||||||||||||||||||
1909 Feb 1 - 1913 May Confirmed Eruption (Explosive / Effusive) VEI: 1
| Episode 1 | Eruption (Explosive / Effusive) | West dome | |||||||||||||||||||||||||||||||||||||||||||
|---|---|---|---|---|---|---|---|---|---|---|---|---|---|---|---|---|---|---|---|---|---|---|---|---|---|---|---|---|---|---|---|---|---|---|---|---|---|---|---|---|---|---|---|---|
| 1909 Feb 1 - 1913 May | Evidence from Observations: Reported | |||||||||||||||||||||||||||||||||||||||||||
|
List of 7 Events for Episode 1 at West dome
|
||||||||||||||||||||||||||||||||||||||||||||
1908 Confirmed Eruption (Explosive / Effusive) VEI: 1 (?)
| Episode 1 | Eruption (Explosive / Effusive) | |||||||||||||||||||
|---|---|---|---|---|---|---|---|---|---|---|---|---|---|---|---|---|---|---|---|
| 1908 - Unknown | Evidence from Observations: Reported | ||||||||||||||||||
|
List of 2 Events for Episode 1
|
|||||||||||||||||||
1906 Jan 26 ± 5 days - 1907 Feb 17 Confirmed Eruption (Explosive / Effusive) VEI: 2
| Episode 1 | Eruption (Explosive / Effusive) | Summit and upper east flank (2600 m) | |||||||||||||||||||||||||||||||||||||||||||
|---|---|---|---|---|---|---|---|---|---|---|---|---|---|---|---|---|---|---|---|---|---|---|---|---|---|---|---|---|---|---|---|---|---|---|---|---|---|---|---|---|---|---|---|---|
| 1906 Jan 26 ± 5 days - 1907 Feb 17 | Evidence from Observations: Reported | |||||||||||||||||||||||||||||||||||||||||||
|
List of 7 Events for Episode 1 at Summit and upper east flank (2600 m)
|
||||||||||||||||||||||||||||||||||||||||||||
1905 Jan - 1905 Jun 1 Confirmed Eruption (Explosive / Effusive) VEI: 2
| Episode 1 | Eruption (Explosive / Effusive) | ||||||||||||||||||||||||||||||||||||||||||||
|---|---|---|---|---|---|---|---|---|---|---|---|---|---|---|---|---|---|---|---|---|---|---|---|---|---|---|---|---|---|---|---|---|---|---|---|---|---|---|---|---|---|---|---|---|
| 1905 Jan - 1905 Jun 1 | Evidence from Observations: Reported | |||||||||||||||||||||||||||||||||||||||||||
|
List of 7 Events for Episode 1
|
||||||||||||||||||||||||||||||||||||||||||||
1902 Dec - 1904 Jun 20 ± 5 days Confirmed Eruption (Explosive / Effusive) VEI: 2
| Episode 1 | Eruption (Explosive / Effusive) | ||||||||||||||||||||||||||||||||||||||||||||||||||||||||||||||||
|---|---|---|---|---|---|---|---|---|---|---|---|---|---|---|---|---|---|---|---|---|---|---|---|---|---|---|---|---|---|---|---|---|---|---|---|---|---|---|---|---|---|---|---|---|---|---|---|---|---|---|---|---|---|---|---|---|---|---|---|---|---|---|---|---|
| 1902 Dec - 1904 Jun 20 ± 5 days | Evidence from Observations: Reported | |||||||||||||||||||||||||||||||||||||||||||||||||||||||||||||||
|
List of 11 Events for Episode 1
|
||||||||||||||||||||||||||||||||||||||||||||||||||||||||||||||||
1902 Feb 3 - 1902 Feb 3 Confirmed Eruption (Explosive / Effusive) VEI: 1
| Episode 1 | Eruption (Explosive / Effusive) | |||||||||||||||||||||||||||||
|---|---|---|---|---|---|---|---|---|---|---|---|---|---|---|---|---|---|---|---|---|---|---|---|---|---|---|---|---|---|
| 1902 Feb 3 - 1902 Feb 3 | Evidence from Observations: Reported | ||||||||||||||||||||||||||||
|
List of 4 Events for Episode 1
|
|||||||||||||||||||||||||||||
1897 Confirmed Eruption (Explosive / Effusive) VEI: 2 (?)
| Episode 1 | Eruption (Explosive / Effusive) | ||||||||||||||||||||||||
|---|---|---|---|---|---|---|---|---|---|---|---|---|---|---|---|---|---|---|---|---|---|---|---|---|
| 1897 - Unknown | Evidence from Observations: Reported | |||||||||||||||||||||||
|
List of 3 Events for Episode 1
|
||||||||||||||||||||||||
1894 Oct Confirmed Eruption (Explosive / Effusive) VEI: 1 (?)
| Episode 1 | Eruption (Explosive / Effusive) | |||||||||||||||||||
|---|---|---|---|---|---|---|---|---|---|---|---|---|---|---|---|---|---|---|---|
| 1894 Oct - Unknown | Evidence from Observations: Reported | ||||||||||||||||||
|
List of 2 Events for Episode 1
|
|||||||||||||||||||
1894 Jan 27 - 1894 Feb 2 Confirmed Eruption (Explosive / Effusive) VEI: 2 (?)
| Episode 1 | Eruption (Explosive / Effusive) | ||||||||||||||||||||||||||||||||||
|---|---|---|---|---|---|---|---|---|---|---|---|---|---|---|---|---|---|---|---|---|---|---|---|---|---|---|---|---|---|---|---|---|---|---|
| 1894 Jan 27 - 1894 Feb 2 | Evidence from Observations: Reported | |||||||||||||||||||||||||||||||||
|
List of 5 Events for Episode 1
|
||||||||||||||||||||||||||||||||||
1893 Oct Confirmed Eruption (Explosive / Effusive) VEI: 1
| Episode 1 | Eruption (Explosive / Effusive) | |||||||||||||||||||
|---|---|---|---|---|---|---|---|---|---|---|---|---|---|---|---|---|---|---|---|
| 1893 Oct - Unknown | Evidence from Observations: Reported | ||||||||||||||||||
|
List of 2 Events for Episode 1
|
|||||||||||||||||||
1891 Aug 25 - 1892 Confirmed Eruption (Explosive / Effusive) VEI: 2 (?)
| Episode 1 | Eruption (Explosive / Effusive) | |||||||||||||||||||||||||||||
|---|---|---|---|---|---|---|---|---|---|---|---|---|---|---|---|---|---|---|---|---|---|---|---|---|---|---|---|---|---|
| 1891 Aug 25 - 1892 | Evidence from Observations: Reported | ||||||||||||||||||||||||||||
|
List of 4 Events for Episode 1
|
|||||||||||||||||||||||||||||
1889 Jul Confirmed Eruption (Explosive / Effusive) VEI: 1
| Episode 1 | Eruption (Explosive / Effusive) | |||||||||||||||||||
|---|---|---|---|---|---|---|---|---|---|---|---|---|---|---|---|---|---|---|---|
| 1889 Jul - Unknown | Evidence from Observations: Reported | ||||||||||||||||||
|
List of 2 Events for Episode 1
|
|||||||||||||||||||
1888 Aug 18 - 1888 Dec 20 Confirmed Eruption (Explosive / Effusive) VEI: 2
| Episode 1 | Eruption (Explosive / Effusive) | |||||||||||||||||||||||||||||||||||||||||||||||||
|---|---|---|---|---|---|---|---|---|---|---|---|---|---|---|---|---|---|---|---|---|---|---|---|---|---|---|---|---|---|---|---|---|---|---|---|---|---|---|---|---|---|---|---|---|---|---|---|---|---|
| 1888 Aug 18 - 1888 Dec 20 | Evidence from Observations: Reported | ||||||||||||||||||||||||||||||||||||||||||||||||
|
List of 8 Events for Episode 1
|
|||||||||||||||||||||||||||||||||||||||||||||||||
1885 Feb 24 ± 4 days - 1887 Confirmed Eruption (Explosive / Effusive) VEI: 1
| Episode 1 | Eruption (Explosive / Effusive) | ||||||||||||||||||||||||
|---|---|---|---|---|---|---|---|---|---|---|---|---|---|---|---|---|---|---|---|---|---|---|---|---|
| 1885 Feb 24 ± 4 days - 1887 | Evidence from Observations: Reported | |||||||||||||||||||||||
|
List of 3 Events for Episode 1
|
||||||||||||||||||||||||
1883 Jan (?) - 1884 Nov Confirmed Eruption (Explosive / Effusive) VEI: 1
| Episode 1 | Eruption (Explosive / Effusive) | East dome | ||||||||||||||||||
|---|---|---|---|---|---|---|---|---|---|---|---|---|---|---|---|---|---|---|---|
| 1883 Jan (?) - 1884 Nov | Evidence from Observations: Reported | ||||||||||||||||||
|
List of 2 Events for Episode 1 at East dome
|
|||||||||||||||||||
1878 - 1879 Jun 20 Confirmed Eruption (Explosive / Effusive) VEI: 2
| Episode 1 | Eruption (Explosive / Effusive) | |||||||||||||||||||||||||||||
|---|---|---|---|---|---|---|---|---|---|---|---|---|---|---|---|---|---|---|---|---|---|---|---|---|---|---|---|---|---|
| 1878 - 1879 Jun 20 | Evidence from Observations: Reported | ||||||||||||||||||||||||||||
|
List of 4 Events for Episode 1
|
|||||||||||||||||||||||||||||
1872 Nov 3 - 1873 Jan (?) Confirmed Eruption (Explosive / Effusive) VEI: 2
| Episode 1 | Eruption (Explosive / Effusive) | ||||||||||||||||||||||||
|---|---|---|---|---|---|---|---|---|---|---|---|---|---|---|---|---|---|---|---|---|---|---|---|---|
| 1872 Nov 3 - 1873 Jan (?) | Evidence from Observations: Reported | |||||||||||||||||||||||
|
List of 3 Events for Episode 1
|
||||||||||||||||||||||||
1872 Apr 15 - 1872 Apr 21 Confirmed Eruption (Explosive / Effusive) VEI: 4
| Episode 1 | Eruption (Explosive / Effusive) | |||||||||||||||||||||||||||||||||||||||||||||||||||||||||||||||||||||
|---|---|---|---|---|---|---|---|---|---|---|---|---|---|---|---|---|---|---|---|---|---|---|---|---|---|---|---|---|---|---|---|---|---|---|---|---|---|---|---|---|---|---|---|---|---|---|---|---|---|---|---|---|---|---|---|---|---|---|---|---|---|---|---|---|---|---|---|---|---|
| 1872 Apr 15 - 1872 Apr 21 | Evidence from Observations: Reported | ||||||||||||||||||||||||||||||||||||||||||||||||||||||||||||||||||||
|
List of 12 Events for Episode 1
|
|||||||||||||||||||||||||||||||||||||||||||||||||||||||||||||||||||||
1865 Oct 24 - 1871 Aug (?) Confirmed Eruption (Explosive / Effusive) VEI: 2
| Episode 1 | Eruption (Explosive / Effusive) | ||||||||||||||||||||||||||||||||||||||||||||||||||||||||||||||||
|---|---|---|---|---|---|---|---|---|---|---|---|---|---|---|---|---|---|---|---|---|---|---|---|---|---|---|---|---|---|---|---|---|---|---|---|---|---|---|---|---|---|---|---|---|---|---|---|---|---|---|---|---|---|---|---|---|---|---|---|---|---|---|---|---|
| 1865 Oct 24 - 1871 Aug (?) | Evidence from Observations: Reported | |||||||||||||||||||||||||||||||||||||||||||||||||||||||||||||||
|
List of 11 Events for Episode 1
|
||||||||||||||||||||||||||||||||||||||||||||||||||||||||||||||||
1862 May 26 - 1864 Confirmed Eruption (Explosive / Effusive) VEI: 2
| Episode 1 | Eruption (Explosive / Effusive) | ||||||||||||||||||||||||||||||||||||||||||||||||||||||
|---|---|---|---|---|---|---|---|---|---|---|---|---|---|---|---|---|---|---|---|---|---|---|---|---|---|---|---|---|---|---|---|---|---|---|---|---|---|---|---|---|---|---|---|---|---|---|---|---|---|---|---|---|---|---|
| 1862 May 26 - 1864 | Evidence from Observations: Reported | |||||||||||||||||||||||||||||||||||||||||||||||||||||
|
List of 9 Events for Episode 1
|
||||||||||||||||||||||||||||||||||||||||||||||||||||||
1861 Confirmed Eruption (Explosive / Effusive) VEI: 2
| Episode 1 | Eruption (Explosive / Effusive) | |||||||||||||||||||
|---|---|---|---|---|---|---|---|---|---|---|---|---|---|---|---|---|---|---|---|
| 1861 - Unknown | Evidence from Observations: Reported | ||||||||||||||||||
|
List of 2 Events for Episode 1
|
|||||||||||||||||||
[ 1854 Sep ] Uncertain Eruption
| Episode 1 | Eruption (Explosive / Effusive) | ||||||||||||||
|---|---|---|---|---|---|---|---|---|---|---|---|---|---|---|
| 1854 Sep - Unknown | Evidence from Unknown | |||||||||||||
|
List of 1 Events for Episode 1
|
||||||||||||||
1849 Sep 14 - 1849 Sep 24 Confirmed Eruption (Explosive / Effusive) VEI: 3
| Episode 1 | Eruption (Explosive / Effusive) | ||||||||||||||||||||||||||||||||||||||||||||
|---|---|---|---|---|---|---|---|---|---|---|---|---|---|---|---|---|---|---|---|---|---|---|---|---|---|---|---|---|---|---|---|---|---|---|---|---|---|---|---|---|---|---|---|---|
| 1849 Sep 14 - 1849 Sep 24 | Evidence from Observations: Reported | |||||||||||||||||||||||||||||||||||||||||||
|
List of 7 Events for Episode 1
|
||||||||||||||||||||||||||||||||||||||||||||
1849 Apr 26 - 1849 Apr 26 Confirmed Eruption (Explosive / Effusive) VEI: 2
| Episode 1 | Eruption (Explosive / Effusive) | ||||||||||||||||||||||||
|---|---|---|---|---|---|---|---|---|---|---|---|---|---|---|---|---|---|---|---|---|---|---|---|---|
| 1849 Apr 26 - 1849 Apr 26 | Evidence from Observations: Reported | |||||||||||||||||||||||
|
List of 3 Events for Episode 1
|
||||||||||||||||||||||||
[ 1848 Jan 8 ] Uncertain Eruption
| Episode 1 | Eruption (Explosive / Effusive) | ||||||||||||||
|---|---|---|---|---|---|---|---|---|---|---|---|---|---|---|
| 1848 Jan 8 - Unknown | Evidence from Unknown | |||||||||||||
|
List of 1 Events for Episode 1
|
||||||||||||||
1846 Sep 2 - 1847 Oct Confirmed Eruption (Explosive / Effusive) VEI: 3
| Episode 1 | Eruption (Explosive / Effusive) | Summit and upper SE flank (2600 m) | ||||||||||||||||||||||||||||||||||||||||||||||||
|---|---|---|---|---|---|---|---|---|---|---|---|---|---|---|---|---|---|---|---|---|---|---|---|---|---|---|---|---|---|---|---|---|---|---|---|---|---|---|---|---|---|---|---|---|---|---|---|---|---|
| 1846 Sep 2 - 1847 Oct | Evidence from Observations: Reported | ||||||||||||||||||||||||||||||||||||||||||||||||
|
List of 8 Events for Episode 1 at Summit and upper SE flank (2600 m)
|
|||||||||||||||||||||||||||||||||||||||||||||||||
1846 Apr 6 Confirmed Eruption (Explosive / Effusive) VEI: 2
| Episode 1 | Eruption (Explosive / Effusive) | ||||||||||||||||||||||||
|---|---|---|---|---|---|---|---|---|---|---|---|---|---|---|---|---|---|---|---|---|---|---|---|---|
| 1846 Apr 6 - Unknown | Evidence from Observations: Reported | |||||||||||||||||||||||
|
List of 3 Events for Episode 1
|
||||||||||||||||||||||||
1840 Jan 4 Confirmed Eruption (Explosive / Effusive) VEI: 1
| Episode 1 | Eruption (Explosive / Effusive) | ||||||||||||||||||||||||
|---|---|---|---|---|---|---|---|---|---|---|---|---|---|---|---|---|---|---|---|---|---|---|---|---|
| 1840 Jan 4 - Unknown | Evidence from Observations: Reported | |||||||||||||||||||||||
|
List of 3 Events for Episode 1
|
||||||||||||||||||||||||
1837 Aug 10 - 1838 Jun Confirmed Eruption (Explosive / Effusive) VEI: 2 (?)
| Episode 1 | Eruption (Explosive / Effusive) | ||||||||||||||||||||||||||||||||||||||||||||
|---|---|---|---|---|---|---|---|---|---|---|---|---|---|---|---|---|---|---|---|---|---|---|---|---|---|---|---|---|---|---|---|---|---|---|---|---|---|---|---|---|---|---|---|---|
| 1837 Aug 10 - 1838 Jun | Evidence from Observations: Reported | |||||||||||||||||||||||||||||||||||||||||||
|
List of 7 Events for Episode 1
|
||||||||||||||||||||||||||||||||||||||||||||
1832 Dec 25 - 1836 Confirmed Eruption (Explosive / Effusive) VEI: 2 (?)
| Episode 1 | Eruption (Explosive / Effusive) | ||||||||||||||||||||||||||||||||||||||||||||||||||||||||||||||||
|---|---|---|---|---|---|---|---|---|---|---|---|---|---|---|---|---|---|---|---|---|---|---|---|---|---|---|---|---|---|---|---|---|---|---|---|---|---|---|---|---|---|---|---|---|---|---|---|---|---|---|---|---|---|---|---|---|---|---|---|---|---|---|---|---|
| 1832 Dec 25 - 1836 | Evidence from Observations: Reported | |||||||||||||||||||||||||||||||||||||||||||||||||||||||||||||||
|
List of 11 Events for Episode 1
|
||||||||||||||||||||||||||||||||||||||||||||||||||||||||||||||||
1828 Dec 18 - 1828 Dec 19 Confirmed Eruption (Explosive / Effusive) VEI: 2
| Episode 1 | Eruption (Explosive / Effusive) | |||||||||||||||||||
|---|---|---|---|---|---|---|---|---|---|---|---|---|---|---|---|---|---|---|---|
| 1828 Dec 18 - 1828 Dec 19 | Evidence from Observations: Reported | ||||||||||||||||||
|
List of 2 Events for Episode 1
|
|||||||||||||||||||
1822 Dec 27 - 1823 Apr 6 Confirmed Eruption (Explosive / Effusive) VEI: 3 (?)
| Episode 1 | Eruption (Explosive / Effusive) | ||||||||||||||||||||||||||||||||||||||||||||||||||||||||||||||||
|---|---|---|---|---|---|---|---|---|---|---|---|---|---|---|---|---|---|---|---|---|---|---|---|---|---|---|---|---|---|---|---|---|---|---|---|---|---|---|---|---|---|---|---|---|---|---|---|---|---|---|---|---|---|---|---|---|---|---|---|---|---|---|---|---|
| 1822 Dec 27 - 1823 Apr 6 | Evidence from Observations: Reported | |||||||||||||||||||||||||||||||||||||||||||||||||||||||||||||||
|
List of 11 Events for Episode 1
|
||||||||||||||||||||||||||||||||||||||||||||||||||||||||||||||||
1812 - 1822 Confirmed Eruption (Explosive / Effusive) VEI: 1
| Episode 1 | Eruption (Explosive / Effusive) | |||||||||||||||||||
|---|---|---|---|---|---|---|---|---|---|---|---|---|---|---|---|---|---|---|---|
| 1812 - 1822 | Evidence from Observations: Reported | ||||||||||||||||||
|
List of 2 Events for Episode 1
|
|||||||||||||||||||
1810 Confirmed Eruption (Explosive / Effusive) VEI: 1
| Episode 1 | Eruption (Explosive / Effusive) | |||||||||||||||||||
|---|---|---|---|---|---|---|---|---|---|---|---|---|---|---|---|---|---|---|---|
| 1810 - Unknown | Evidence from Observations: Reported | ||||||||||||||||||
|
List of 2 Events for Episode 1
|
|||||||||||||||||||
1807 Confirmed Eruption (Explosive / Effusive) VEI: 1 (?)
| Episode 1 | Eruption (Explosive / Effusive) | |||||||||||||||||||
|---|---|---|---|---|---|---|---|---|---|---|---|---|---|---|---|---|---|---|---|
| 1807 - Unknown | Evidence from Observations: Reported | ||||||||||||||||||
|
List of 2 Events for Episode 1
|
|||||||||||||||||||
1797 Confirmed Eruption (Explosive / Effusive) VEI: 1
| Episode 1 | Eruption (Explosive / Effusive) | |||||||||||||||||||
|---|---|---|---|---|---|---|---|---|---|---|---|---|---|---|---|---|---|---|---|
| 1797 - Unknown | Evidence from Observations: Reported | ||||||||||||||||||
|
List of 2 Events for Episode 1
|
|||||||||||||||||||
1791 (in or before) Confirmed Eruption (Explosive / Effusive) VEI: 2
| Episode 1 | Eruption (Explosive / Effusive) | |||||||||||||||||||||||||||||
|---|---|---|---|---|---|---|---|---|---|---|---|---|---|---|---|---|---|---|---|---|---|---|---|---|---|---|---|---|---|
| 1791 (in or before) - Unknown | Evidence from Observations: Reported | ||||||||||||||||||||||||||||
|
List of 4 Events for Episode 1
|
|||||||||||||||||||||||||||||
1786 Jul 17 Confirmed Eruption (Explosive / Effusive) VEI: 1 (?)
| Episode 1 | Eruption (Explosive / Effusive) | |||||||||||||||||||
|---|---|---|---|---|---|---|---|---|---|---|---|---|---|---|---|---|---|---|---|
| 1786 Jul 17 - Unknown | Evidence from Observations: Reported | ||||||||||||||||||
|
List of 2 Events for Episode 1
|
|||||||||||||||||||
1768 Aug 19 Confirmed Eruption (Explosive / Effusive) VEI: 2 (?)
| Episode 1 | Eruption (Explosive / Effusive) | |||||||||||||||||||||||||||||
|---|---|---|---|---|---|---|---|---|---|---|---|---|---|---|---|---|---|---|---|---|---|---|---|---|---|---|---|---|---|
| 1768 Aug 19 - Unknown | Evidence from Observations: Reported | ||||||||||||||||||||||||||||
|
List of 4 Events for Episode 1
|
|||||||||||||||||||||||||||||
1755 Confirmed Eruption (Explosive / Effusive) VEI: 2
| Episode 1 | Eruption (Explosive / Effusive) | |||||||||||||||||||
|---|---|---|---|---|---|---|---|---|---|---|---|---|---|---|---|---|---|---|---|
| 1755 - Unknown | Evidence from Observations: Reported | ||||||||||||||||||
|
List of 2 Events for Episode 1
|
|||||||||||||||||||
1752 Confirmed Eruption (Explosive / Effusive) VEI: 2
| Episode 1 | Eruption (Explosive / Effusive) | |||||||||||||||||||
|---|---|---|---|---|---|---|---|---|---|---|---|---|---|---|---|---|---|---|---|
| 1752 - Unknown | Evidence from Observations: Reported | ||||||||||||||||||
|
List of 2 Events for Episode 1
|
|||||||||||||||||||
1745 Confirmed Eruption (Explosive / Effusive) VEI: 2
| Episode 1 | Eruption (Explosive / Effusive) | |||||||||||||||||||
|---|---|---|---|---|---|---|---|---|---|---|---|---|---|---|---|---|---|---|---|
| 1745 - Unknown | Evidence from Observations: Reported | ||||||||||||||||||
|
List of 2 Events for Episode 1
|
|||||||||||||||||||
1678 Aug 19 Confirmed Eruption (Explosive / Effusive) VEI: 3
| Episode 1 | Eruption (Explosive / Effusive) | |||||||||||||||||||
|---|---|---|---|---|---|---|---|---|---|---|---|---|---|---|---|---|---|---|---|
| 1678 Aug 19 - Unknown | Evidence from Observations: Reported | ||||||||||||||||||
|
List of 2 Events for Episode 1
|
|||||||||||||||||||
1677 Confirmed Eruption (Explosive / Effusive) VEI: 3
| Episode 1 | Eruption (Explosive / Effusive) | |||||||||||||||||||
|---|---|---|---|---|---|---|---|---|---|---|---|---|---|---|---|---|---|---|---|
| 1677 - Unknown | Evidence from Observations: Reported | ||||||||||||||||||
|
List of 2 Events for Episode 1
|
|||||||||||||||||||
1672 Aug 4 Confirmed Eruption (Explosive / Effusive) VEI: 3
| Episode 1 | Eruption (Explosive / Effusive) | |||||||||||||||||||||||||||||||||||||||
|---|---|---|---|---|---|---|---|---|---|---|---|---|---|---|---|---|---|---|---|---|---|---|---|---|---|---|---|---|---|---|---|---|---|---|---|---|---|---|---|
| 1672 Aug 4 - Unknown | Evidence from Observations: Reported | ||||||||||||||||||||||||||||||||||||||
|
List of 6 Events for Episode 1
|
|||||||||||||||||||||||||||||||||||||||
1663 Dec 31 ± 365 days Confirmed Eruption (Explosive / Effusive) VEI: 3
| Episode 1 | Eruption (Explosive / Effusive) | |||||||||||||||||||
|---|---|---|---|---|---|---|---|---|---|---|---|---|---|---|---|---|---|---|---|
| 1663 Dec 31 ± 365 days - Unknown | Evidence from Observations: Reported | ||||||||||||||||||
|
List of 2 Events for Episode 1
|
|||||||||||||||||||
1658 Confirmed Eruption (Explosive / Effusive) VEI: 3
| Episode 1 | Eruption (Explosive / Effusive) | |||||||||||||||||||
|---|---|---|---|---|---|---|---|---|---|---|---|---|---|---|---|---|---|---|---|
| 1658 - Unknown | Evidence from Observations: Reported | ||||||||||||||||||
|
List of 2 Events for Episode 1
|
|||||||||||||||||||
1587 Confirmed Eruption (Explosive / Effusive) VEI: 3
| Episode 1 | Eruption (Explosive / Effusive) | |||||||||||||||||||||||||||||||||||||||
|---|---|---|---|---|---|---|---|---|---|---|---|---|---|---|---|---|---|---|---|---|---|---|---|---|---|---|---|---|---|---|---|---|---|---|---|---|---|---|---|
| 1587 - Unknown | Evidence from Observations: Reported | ||||||||||||||||||||||||||||||||||||||
|
List of 6 Events for Episode 1
|
|||||||||||||||||||||||||||||||||||||||
[ 1586 ] Uncertain Eruption
| Episode 1 | Eruption (Explosive / Effusive) | ||||
|---|---|---|---|---|
| 1586 - Unknown | Evidence from Unknown | |||
1584 Confirmed Eruption (Explosive / Effusive) VEI: 3
| Episode 1 | Eruption (Explosive / Effusive) | |||||||||||||||||||
|---|---|---|---|---|---|---|---|---|---|---|---|---|---|---|---|---|---|---|---|
| 1584 - Unknown | Evidence from Observations: Reported | ||||||||||||||||||
|
List of 2 Events for Episode 1
|
|||||||||||||||||||
1560 Confirmed Eruption (Explosive / Effusive) VEI: 3
| Episode 1 | Eruption (Explosive / Effusive) | ||||||||||||||||||||||||
|---|---|---|---|---|---|---|---|---|---|---|---|---|---|---|---|---|---|---|---|---|---|---|---|---|
| 1560 - Unknown | Evidence from Observations: Reported | |||||||||||||||||||||||
|
List of 3 Events for Episode 1
|
||||||||||||||||||||||||
1554 Confirmed Eruption (Explosive / Effusive) VEI: 3
| Episode 1 | Eruption (Explosive / Effusive) | ||||||||||||||||||||||||
|---|---|---|---|---|---|---|---|---|---|---|---|---|---|---|---|---|---|---|---|---|---|---|---|---|
| 1554 - Unknown | Evidence from Observations: Reported | |||||||||||||||||||||||
|
List of 3 Events for Episode 1
|
||||||||||||||||||||||||
1548 Confirmed Eruption (Explosive / Effusive) VEI: 3
| Episode 1 | Eruption (Explosive / Effusive) | ||||||||||||||||||||||||
|---|---|---|---|---|---|---|---|---|---|---|---|---|---|---|---|---|---|---|---|---|---|---|---|---|
| 1548 - Unknown | Evidence from Observations: Reported | |||||||||||||||||||||||
|
List of 3 Events for Episode 1
|
||||||||||||||||||||||||
1480 ± 300 years Confirmed Eruption (Explosive / Effusive)
| Episode 1 | Eruption (Explosive / Effusive) | Sambisari Ash | |||||||||||||||||||||||||||||||||
|---|---|---|---|---|---|---|---|---|---|---|---|---|---|---|---|---|---|---|---|---|---|---|---|---|---|---|---|---|---|---|---|---|---|---|
| 1480 ± 300 years - Unknown | Evidence from Isotopic: 14C (calibrated) | |||||||||||||||||||||||||||||||||
|
List of 5 Events for Episode 1 at Sambisari Ash
|
||||||||||||||||||||||||||||||||||
1440 ± 100 years Confirmed Eruption (Explosive / Effusive)
| Episode 1 | Eruption (Explosive / Effusive) | ||||||||||||||||||||||||
|---|---|---|---|---|---|---|---|---|---|---|---|---|---|---|---|---|---|---|---|---|---|---|---|---|
| 1440 ± 100 years - Unknown | Evidence from Isotopic: 14C (calibrated) | |||||||||||||||||||||||
|
List of 3 Events for Episode 1
|
||||||||||||||||||||||||
1380 ± 300 years Confirmed Eruption (Explosive / Effusive)
| Episode 1 | Eruption (Explosive / Effusive) | Sambisari Ash | |||||||||||||||||||||||
|---|---|---|---|---|---|---|---|---|---|---|---|---|---|---|---|---|---|---|---|---|---|---|---|---|
| 1380 ± 300 years - Unknown | Evidence from Isotopic: 14C (calibrated) | |||||||||||||||||||||||
|
List of 3 Events for Episode 1 at Sambisari Ash
|
||||||||||||||||||||||||
1300 ± 75 years Confirmed Eruption (Explosive / Effusive)
| Episode 1 | Eruption (Explosive / Effusive) | |||||||||||||||||||||||||||||
|---|---|---|---|---|---|---|---|---|---|---|---|---|---|---|---|---|---|---|---|---|---|---|---|---|---|---|---|---|---|
| 1300 ± 75 years - Unknown | Evidence from Isotopic: 14C (calibrated) | ||||||||||||||||||||||||||||
|
List of 4 Events for Episode 1
|
|||||||||||||||||||||||||||||
1230 ± 200 years Confirmed Eruption (Explosive / Effusive)
| Episode 1 | Eruption (Explosive / Effusive) | Deles Tephra | ||||||||||||||||||||||||||||
|---|---|---|---|---|---|---|---|---|---|---|---|---|---|---|---|---|---|---|---|---|---|---|---|---|---|---|---|---|---|
| 1230 ± 200 years - Unknown | Evidence from Isotopic: 14C (calibrated) | ||||||||||||||||||||||||||||
|
List of 4 Events for Episode 1 at Deles Tephra
|
|||||||||||||||||||||||||||||
1190 ± 30 years Confirmed Eruption (Explosive / Effusive)
| Episode 1 | Eruption (Explosive / Effusive) | |||||||||||||||||||
|---|---|---|---|---|---|---|---|---|---|---|---|---|---|---|---|---|---|---|---|
| 1190 ± 30 years - Unknown | Evidence from Isotopic: 14C (calibrated) | ||||||||||||||||||
|
List of 2 Events for Episode 1
|
|||||||||||||||||||
1140 ± 150 years Confirmed Eruption (Explosive / Effusive)
| Episode 1 | Eruption (Explosive / Effusive) | |||||||||||||||||||
|---|---|---|---|---|---|---|---|---|---|---|---|---|---|---|---|---|---|---|---|
| 1140 ± 150 years - Unknown | Evidence from Isotopic: 14C (calibrated) | ||||||||||||||||||
|
List of 2 Events for Episode 1
|
|||||||||||||||||||
1090 ± 100 years Confirmed Eruption (Explosive / Effusive)
| Episode 1 | Eruption (Explosive / Effusive) | ||||||||||||||||||||||||
|---|---|---|---|---|---|---|---|---|---|---|---|---|---|---|---|---|---|---|---|---|---|---|---|---|
| 1090 ± 100 years - Unknown | Evidence from Isotopic: 14C (calibrated) | |||||||||||||||||||||||
|
List of 3 Events for Episode 1
|
||||||||||||||||||||||||
1010 ± 25 years Confirmed Eruption (Explosive / Effusive)
| Episode 1 | Eruption (Explosive / Effusive) | |||||||||||||||||||
|---|---|---|---|---|---|---|---|---|---|---|---|---|---|---|---|---|---|---|---|
| 1010 ± 25 years - Unknown | Evidence from Isotopic: 14C (calibrated) | ||||||||||||||||||
|
List of 2 Events for Episode 1
|
|||||||||||||||||||
[ 1006 ] Discredited Eruption
0940 ± 100 years Confirmed Eruption (Explosive / Effusive) VEI: 3
| Episode 1 | Eruption (Explosive / Effusive) | Selo Tephra | |||||||||||||||||||||||||||||||||
|---|---|---|---|---|---|---|---|---|---|---|---|---|---|---|---|---|---|---|---|---|---|---|---|---|---|---|---|---|---|---|---|---|---|---|
| 0940 ± 100 years - Unknown | Evidence from Isotopic: 14C (calibrated) | |||||||||||||||||||||||||||||||||
|
List of 5 Events for Episode 1 at Selo Tephra
|
||||||||||||||||||||||||||||||||||
0870 ± 100 years Confirmed Eruption (Explosive / Effusive)
| Episode 1 | Eruption (Explosive / Effusive) | |||||||||||||||||||
|---|---|---|---|---|---|---|---|---|---|---|---|---|---|---|---|---|---|---|---|
| 0870 ± 100 years - Unknown | Evidence from Isotopic: 14C (calibrated) | ||||||||||||||||||
|
List of 2 Events for Episode 1
|
|||||||||||||||||||
0680 ± 200 years Confirmed Eruption (Explosive / Effusive)
| Episode 1 | Eruption (Explosive / Effusive) | ||||||||||||||||||||||||
|---|---|---|---|---|---|---|---|---|---|---|---|---|---|---|---|---|---|---|---|---|---|---|---|---|
| 0680 ± 200 years - Unknown | Evidence from Isotopic: 14C (calibrated) | |||||||||||||||||||||||
|
List of 3 Events for Episode 1
|
||||||||||||||||||||||||
0630 ± 30 years Confirmed Eruption (Explosive / Effusive)
| Episode 1 | Eruption (Explosive / Effusive) | |||||||||||||||||||
|---|---|---|---|---|---|---|---|---|---|---|---|---|---|---|---|---|---|---|---|
| 0630 ± 30 years - Unknown | Evidence from Isotopic: 14C (calibrated) | ||||||||||||||||||
|
List of 2 Events for Episode 1
|
|||||||||||||||||||
0540 ± 50 years Confirmed Eruption (Explosive / Effusive)
| Episode 1 | Eruption (Explosive / Effusive) | |||||||||||||||||||
|---|---|---|---|---|---|---|---|---|---|---|---|---|---|---|---|---|---|---|---|
| 0540 ± 50 years - Unknown | Evidence from Isotopic: 14C (calibrated) | ||||||||||||||||||
|
List of 2 Events for Episode 1
|
|||||||||||||||||||
0480 ± 75 years Confirmed Eruption (Explosive / Effusive)
| Episode 1 | Eruption (Explosive / Effusive) | |||||||||||||||||||
|---|---|---|---|---|---|---|---|---|---|---|---|---|---|---|---|---|---|---|---|
| 0480 ± 75 years - Unknown | Evidence from Isotopic: 14C (calibrated) | ||||||||||||||||||
|
List of 2 Events for Episode 1
|
|||||||||||||||||||
0410 ± 150 years Confirmed Eruption (Explosive / Effusive) VEI: 3
| Episode 1 | Eruption (Explosive / Effusive) | Plalangan Tephra | ||||||||||||||||||||||||||||
|---|---|---|---|---|---|---|---|---|---|---|---|---|---|---|---|---|---|---|---|---|---|---|---|---|---|---|---|---|---|
| 0410 ± 150 years - Unknown | Evidence from Isotopic: 14C (calibrated) | ||||||||||||||||||||||||||||
|
List of 4 Events for Episode 1 at Plalangan Tephra
|
|||||||||||||||||||||||||||||
0280 ± 150 years Confirmed Eruption (Explosive / Effusive)
| Episode 1 | Eruption (Explosive / Effusive) | |||||||||||||||||||
|---|---|---|---|---|---|---|---|---|---|---|---|---|---|---|---|---|---|---|---|
| 0280 ± 150 years - Unknown | Evidence from Isotopic: 14C (calibrated) | ||||||||||||||||||
|
List of 2 Events for Episode 1
|
|||||||||||||||||||
0190 ± 300 years Confirmed Eruption (Explosive / Effusive)
| Episode 1 | Eruption (Explosive / Effusive) | |||||||||||||||||||
|---|---|---|---|---|---|---|---|---|---|---|---|---|---|---|---|---|---|---|---|
| 0190 ± 300 years - Unknown | Evidence from Isotopic: 14C (calibrated) | ||||||||||||||||||
|
List of 2 Events for Episode 1
|
|||||||||||||||||||
0120 ± 75 years Confirmed Eruption (Explosive / Effusive)
| Episode 1 | Eruption (Explosive / Effusive) | |||||||||||||||||||||||||||||
|---|---|---|---|---|---|---|---|---|---|---|---|---|---|---|---|---|---|---|---|---|---|---|---|---|---|---|---|---|---|
| 0120 ± 75 years - Unknown | Evidence from Isotopic: 14C (calibrated) | ||||||||||||||||||||||||||||
|
List of 4 Events for Episode 1
|
|||||||||||||||||||||||||||||
0020 ± 300 years Confirmed Eruption (Explosive / Effusive) VEI: 4
| Episode 1 | Eruption (Explosive / Effusive) | Tegalsruni tephra | ||||||||||||||||||||||||||||
|---|---|---|---|---|---|---|---|---|---|---|---|---|---|---|---|---|---|---|---|---|---|---|---|---|---|---|---|---|---|
| 0020 ± 300 years - Unknown | Evidence from Isotopic: 14C (calibrated) | ||||||||||||||||||||||||||||
|
List of 4 Events for Episode 1 at Tegalsruni tephra
|
|||||||||||||||||||||||||||||
0340 BCE ± 500 years Confirmed Eruption (Explosive / Effusive) VEI: 3
| Episode 1 | Eruption (Explosive / Effusive) | Ngrangkah Tephra | ||||||||||||||||||||||||||||
|---|---|---|---|---|---|---|---|---|---|---|---|---|---|---|---|---|---|---|---|---|---|---|---|---|---|---|---|---|---|
| 0340 BCE ± 500 years - Unknown | Evidence from Isotopic: 14C (calibrated) | ||||||||||||||||||||||||||||
|
List of 4 Events for Episode 1 at Ngrangkah Tephra
|
|||||||||||||||||||||||||||||
0700 BCE ± 150 years Confirmed Eruption (Explosive / Effusive)
| Episode 1 | Eruption (Explosive / Effusive) | |||||||||||||||||||
|---|---|---|---|---|---|---|---|---|---|---|---|---|---|---|---|---|---|---|---|
| 0700 BCE ± 150 years - Unknown | Evidence from Isotopic: 14C (calibrated) | ||||||||||||||||||
|
List of 2 Events for Episode 1
|
|||||||||||||||||||
1010 BCE ± 200 years Confirmed Eruption (Explosive / Effusive)
| Episode 1 | Eruption (Explosive / Effusive) | |||||||||||||||||||
|---|---|---|---|---|---|---|---|---|---|---|---|---|---|---|---|---|---|---|---|
| 1010 BCE ± 200 years - Unknown | Evidence from Isotopic: 14C (calibrated) | ||||||||||||||||||
|
List of 2 Events for Episode 1
|
|||||||||||||||||||
1180 BCE ± 75 years Confirmed Eruption (Explosive / Effusive) VEI: 4
| Episode 1 | Eruption (Explosive / Effusive) | Bakalan tephra | ||||||||||||||||||||||||||||
|---|---|---|---|---|---|---|---|---|---|---|---|---|---|---|---|---|---|---|---|---|---|---|---|---|---|---|---|---|---|
| 1180 BCE ± 75 years - Unknown | Evidence from Isotopic: 14C (uncalibrated) | ||||||||||||||||||||||||||||
|
List of 4 Events for Episode 1 at Bakalan tephra
|
|||||||||||||||||||||||||||||
1410 BCE ± 50 years Confirmed Eruption (Explosive / Effusive)
| Episode 1 | Eruption (Explosive / Effusive) | |||||||||||||||||||
|---|---|---|---|---|---|---|---|---|---|---|---|---|---|---|---|---|---|---|---|
| 1410 BCE ± 50 years - Unknown | Evidence from Isotopic: 14C (calibrated) | ||||||||||||||||||
|
List of 2 Events for Episode 1
|
|||||||||||||||||||
1770 BCE ± 75 years Confirmed Eruption (Explosive / Effusive)
| Episode 1 | Eruption (Explosive / Effusive) | |||||||||||||||||||
|---|---|---|---|---|---|---|---|---|---|---|---|---|---|---|---|---|---|---|---|
| 1770 BCE ± 75 years - Unknown | Evidence from Isotopic: 14C (calibrated) | ||||||||||||||||||
|
List of 2 Events for Episode 1
|
|||||||||||||||||||
1890 BCE ± 55 years Confirmed Eruption (Explosive / Effusive)
| Episode 1 | Eruption (Explosive / Effusive) | |||||||||||||||||||
|---|---|---|---|---|---|---|---|---|---|---|---|---|---|---|---|---|---|---|---|
| 1890 BCE ± 55 years - Unknown | Evidence from Isotopic: 14C (calibrated) | ||||||||||||||||||
|
List of 2 Events for Episode 1
|
|||||||||||||||||||
2910 BCE ± 150 years Confirmed Eruption (Explosive / Effusive)
| Episode 1 | Eruption (Explosive / Effusive) | |||||||||||||||||||
|---|---|---|---|---|---|---|---|---|---|---|---|---|---|---|---|---|---|---|---|
| 2910 BCE ± 150 years - Unknown | Evidence from Isotopic: 14C (calibrated) | ||||||||||||||||||
|
List of 2 Events for Episode 1
|
|||||||||||||||||||
4690 BCE ± 75 years Confirmed Eruption (Explosive / Effusive)
| Episode 1 | Eruption (Explosive / Effusive) | |||||||||||||||||||
|---|---|---|---|---|---|---|---|---|---|---|---|---|---|---|---|---|---|---|---|
| 4690 BCE ± 75 years - Unknown | Evidence from Isotopic: 14C (calibrated) | ||||||||||||||||||
|
List of 2 Events for Episode 1
|
|||||||||||||||||||
7310 BCE ± 300 years Confirmed Eruption (Explosive / Effusive)
| Episode 1 | Eruption (Explosive / Effusive) | |||||||||||||||||||
|---|---|---|---|---|---|---|---|---|---|---|---|---|---|---|---|---|---|---|---|
| 7310 BCE ± 300 years - Unknown | Evidence from Isotopic: 14C (calibrated) | ||||||||||||||||||
|
List of 2 Events for Episode 1
|
|||||||||||||||||||
8780 BCE ± 150 years Confirmed Eruption (Explosive / Effusive)
| Episode 1 | Eruption (Explosive / Effusive) | Old Merapi | |||||||||||||||||||||||
|---|---|---|---|---|---|---|---|---|---|---|---|---|---|---|---|---|---|---|---|---|---|---|---|---|
| 8780 BCE ± 150 years - Unknown | Evidence from Isotopic: 14C (calibrated) | |||||||||||||||||||||||
|
List of 3 Events for Episode 1 at Old Merapi
|
||||||||||||||||||||||||
This compilation of synonyms and subsidiary features may not be comprehensive. Features are organized into four major categories: Cones, Craters, Domes, and Thermal Features. Synonyms of features appear indented below the primary name. In some cases additional feature type, elevation, or location details are provided.
Cones |
||||
| Feature Name | Feature Type | Elevation | Latitude | Longitude |
| Batuwalang Merapi | Stratovolcano | 2551 m | ||
| Bibi, Gunung | Cone | |||
Craters |
||||
| Feature Name | Feature Type | Elevation | Latitude | Longitude |
| Pasarbubar | Crater | |||
Domes |
||||
| Feature Name | Feature Type | Elevation | Latitude | Longitude |
| Batang | Dome | |||
Thermal |
||||
| Feature Name | Feature Type | Elevation | Latitude | Longitude |
| Gendal, Kawah | Thermal | |||
| Woro, Kawah | Thermal | |||
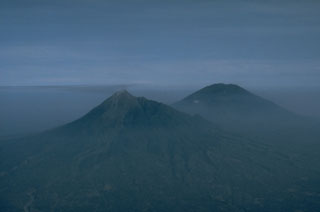 Merapi (left) and Merbabu (right) volcanoes tower above the lowlands between the cities of Yogyakarta and Surakarta in this aerial view from the SE. Both have erupted during historical time, but Merapi is by far the more vigorous of the two. Activity at Merapi frequently includes lava dome and collapse that produces pyroclastic flows and lahars that travel down the valleys, often with catastrophic results.
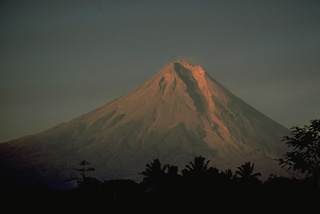 Merapi, one of Indonesia's most active volcanoes, towers above the major regional cultural and religious center of Yogyakarta in central Java. The prominent SW side breach seen here funnels rockfalls, pyroclastic flows, and mudflows associated with long-term growth of summit lava domes onto populated agricultural lands beneath the volcano. Merapi eruptions have frequently produced major devastation during historical time.
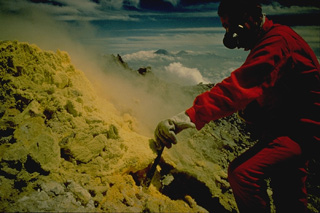 Volcanologist Maurice Krafft measures the temperature of a sulfur-encrusted fumarole during a 1971 trip to the summit of Merapi volcano in central Java. Gas masks are essential when working around the toxic fumaroles. The temperatures of selected fumaroles on the summit of Merapi are measured regularly by the Volcanological Survey of Indonesia as a part of their program to monitor the hazardous volcano. Sumbing (left) and Sundoro (right) volcanoes appear on the distant horizon to the NW.
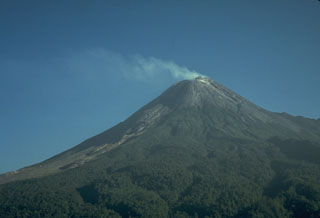 A gas plume is blown to the west from the summit of Merapi volcano on 7 December 1986, accompanying growth of a new lava dome. Small-to-moderate explosive eruptions began in October 1972. Periodic collapse of the growing lava dome produced pyroclastic flows (block-and-ash flows) and lahars that damaged cultivated lands on the SW flank of the volcano.
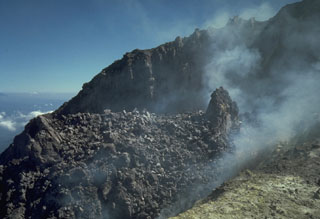 A lava dome that was produced during 1972-1985 lies within the summit crater of Merapi volcano in central Java. A small spine appears on the right in this 4 July 1986 photo, which was taken during a period of inactivity prior to destruction of the dome on 10 October 1986. Historical eruptions have been characterized by repeated growth and collapse of the summit lava domes, periodically producing pyroclastic flows that have impacted communities on the western and southern flanks.
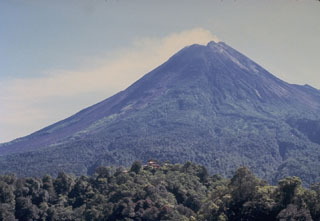 Merapi volcano, one of Indonesia's most active, rises above the city of Yogyakarta in central Java. This May 1987 view from the southern flank with the red-roofed Plawangan observatory on the forested ridge in the foreground shows Merapi's degassing summit lava dome. Unvegetated areas on the left result from periodic rockfalls, avalanches, and pyroclastic flows (block-and-ash flows) from the growing lava dome.
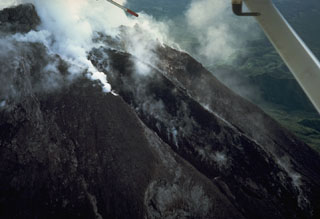 An aerial view from the WSW on 6 January 1987 shows a black lava flow descending from the summit crater of Merapi. During a five-day period beginning 10 October 1986, the dome was partially destroyed by a series of dome-collapse pyroclastic flows (block-and-ash flows). The period of dome growth and lava effusion seen in this photo then began and continued for several years before stabilizing in mid-1990.
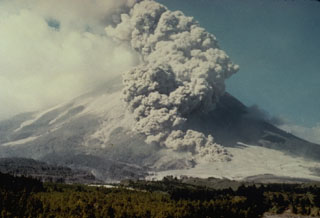 A pyroclastic flow descends the SW flank of Merapi volcano on 14 June 1984. A long period of lava dome growth began on 2 October 1972, and continued intermittently until 1990, occasionally punctuated by partial dome collapse that formed pyroclastic flows (block-and-ash flows) that travel down the flanks.
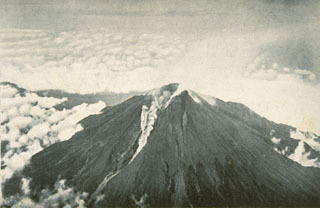 A small pyroclastic flow is shown traveling down the western flank from the breached crater of Merapi volcano in December 1930. A much larger pyroclastic flow that month traveled 12 km from the volcano, totally or partially destroying 42 villages and killing 1,369 people in one of Merapi's deadliest eruptions. Explosions had begun on 22 November 1930, accompanied by growth of a new lava dome and extrusion of a lava flow. Dome growth and associated pyroclastic flows (block-and-ash flows) continued until October 1931.
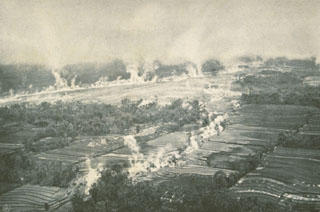 Steam rises from still-hot pyroclastic flow deposits in the Kali Blongkeng valley, 12 km from the summit of Merapi, in December 1930. Thirteen villages were totally destroyed and 29 more partially destroyed by these pyroclastic flows, which killed 1,369 people on 18 December.
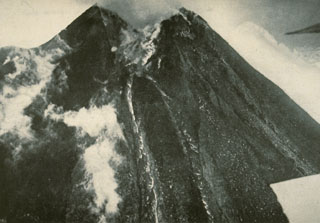 A lava flow at the center of the photo descends from the breached summit crater of Merapi on 27 April 1931 following the devastating eruption of 18 December 1930.
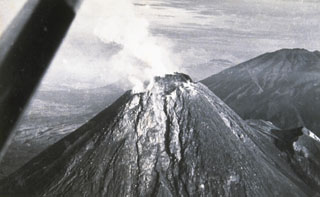 The degassing, growing lava dome of Merapi volcano on 20 January 1954, as viewed from the SE, two days after a major pyroclastic flow that caused 64 fatalities. Lava dome growth had begun on 2 March 1953, accompanied by frequent pyroclastic flows (block-and-ash flows). Several additional cycles of lava dome growth and destruction continued until December 1958.
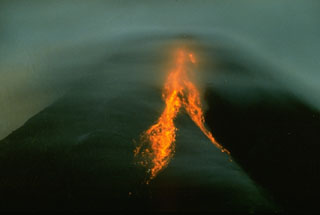 Incandescent rockfalls can be seen accompanying growth of a Merapi lava dome beneath clouds covering the summit in this 1993 nighttime view. Periodic collapse of Merapi's lava dome has produced pyroclastic flows down the western and southern flanks that have devastated populated areas and agricultural lands.
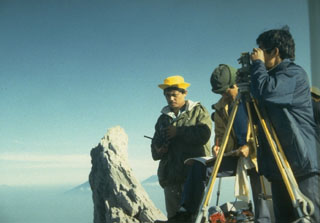 Scientists from the Volcanological Survey of Indonesia make theodolite measurements to determine the height and volume of the growing lava dome at the summit of Merapi volcano in central Java. The pinnacle to the left is the former summit spine of Merapi.
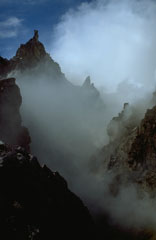 Steam and gas rise between the growing lava dome in the crater of Gunung Merapi and the steep-walled western crater rim (left). The dome visible to the right began growing in 1992. Periodic collapse of the growing dome during successive years produced pyroclastic flows (block-and-ash flows) that devastated the western and southern flanks.
 Merapi volcano, one of Indonesia's most active volcanoes, looms above the renowned Hindu temple complex of Prambanan, Indonesia's largest, dating back to 900 CE. Many of the temple complexes on the culturally rich Prambanan plain below Merapi have been affected by lahars (mudflows) that traveled tens of km from the volcano.
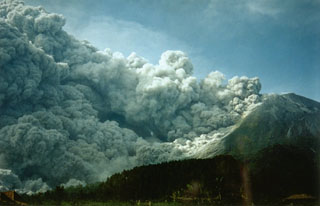 Collapse of the growing lava dome on 22 November 1994, produced a pyroclastic flow (block-and-ash flow) that swept 7.5 km down the south flank, overrunning several villages and killing 64 people. Six thousand people were evacuated as a result of this eruption.
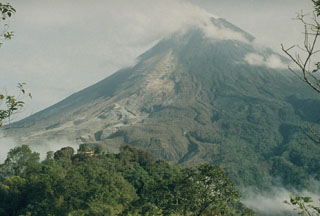 This photo was taken the day after devastating pyroclastic flows swept down the south flank of Merapi in 1994. The lighter area to the left shows where the pyroclastic flows descended the flank. The darker-brown areas to the right of the pyroclastic-flow deposits are trees that were scorched by pyroclastic surge clouds. Sixty-four people were killed by these pyroclastic surges in a village near the location of this photo.
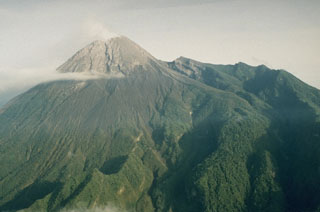 Merapi in central Java is capped by an unvegetated lava dome complex. The modern edifice of Merapi, to the left in this view, is constructed to the SE of the arcuate scarp on the right that was formed by destruction of the older Batulawang volcano. Periodic growth and collapse of lava domes produce pyroclastic flows (block-and-ash flows) and lahars that have devastated populated areas below the volcano.
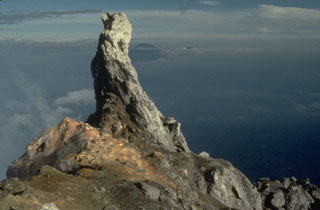 This 10-m-high remnant of a lava spine was at the summit of one of Merapi's older lava domes in 1989 and had collapsed by 2006. The slope to the left drops off steeply into Merapi's summit crater.
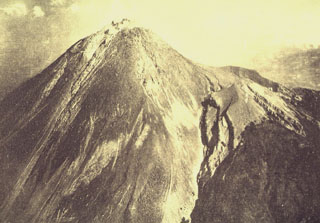 This aerial photo was taken from the SE on 14 August 1922, less than a week after the end of an eruption that began on 18 February 1922. It shows the summit of Merapi prior to a major eruption in 1930, during which much of the summit lava dome collapsed. Eruptions were reported on 18 February, 4-5 April, and 8 August 1922, during which frequent rock avalanches accompanied lava dome growth. A lava flow that traveled 180 m down the western flank is visible to the left.
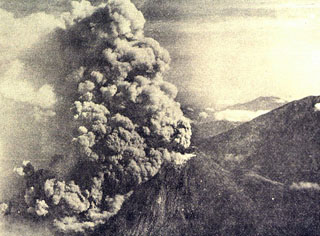 An ash plume rises above the summit and pyroclastic flows (block-and-ash flows) descend the western flank of Merapi in 1961. During 1961, eruptions took place on 13 April, 7-8 May, and 27-28 November. Pyroclastic flows during the 8 May eruption destroyed 10 villages and killed 6 people.
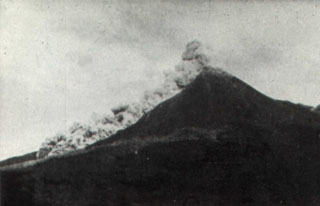 A pyroclastic flow traveling down the SW flank of Merapi volcano is seen from the Plawangan Observatory on 12 April 1967. Explosive eruptions, pyroclastic flows, and lava dome growth took place during 1967-70. Eruptive activity began on 12 January 1967. Paroxysmal phases took place on 7-9 October 1967 and 8 October 1968, during which partial collapse of the lava dome produced frequent pyroclastic flows (block-and-ash flows). The velocity of the pyroclastic flow seen in this photo was estimated by the Volcanological Survey of Indonesia to be 60 km/hour.
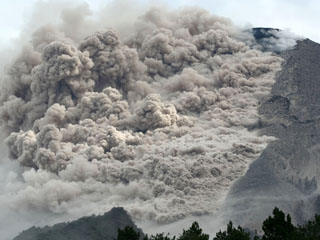 A pyroclastic flow travels down the SE flank of Merapi on 7 June 2006. Renewed lava dome growth had begun at Merapi in April 2006. Ashfall was reported 5 km from the summit on 27 April. Beginning in May, pyroclastic flows descended the flanks of the volcano, sometimes reaching populated areas.
The following 7 samples associated with this volcano can be found in the Smithsonian's NMNH Department of Mineral Sciences collections, and may be availble for research (contact the Rock and Ore Collections Manager). Catalog number links will open a window with more information.
| Catalog Number | Sample Description | Lava Source | Collection Date |
|---|---|---|---|
| NMNH 111253 | Andesite | -- | -- |
| NMNH 111254 | Andesite | -- | -- |
| NMNH 111255 | Andesite | -- | -- |
| NMNH 111256 | Andesite | -- | -- |
| NMNH 111257 | Andesite | -- | -- |
| NMNH 116701-6 | Andesite | -- | -- |
| NMNH 117222-3 | Andesite | -- | 1 Jan 1998 |
| Copernicus Browser | The Copernicus Browser replaced the Sentinel Hub Playground browser in 2023, to provide access to Earth observation archives from the Copernicus Data Space Ecosystem, the main distribution platform for data from the EU Copernicus missions. |
| MIROVA | Middle InfraRed Observation of Volcanic Activity (MIROVA) is a near real time volcanic hot-spot detection system based on the analysis of MODIS (Moderate Resolution Imaging Spectroradiometer) data. In particular, MIROVA uses the Middle InfraRed Radiation (MIR), measured over target volcanoes, in order to detect, locate and measure the heat radiation sourced from volcanic activity. |
| MODVOLC Thermal Alerts | Using infrared satellite Moderate Resolution Imaging Spectroradiometer (MODIS) data, scientists at the Hawai'i Institute of Geophysics and Planetology, University of Hawai'i, developed an automated system called MODVOLC to map thermal hot-spots in near real time. For each MODIS image, the algorithm automatically scans each 1 km pixel within it to check for high-temperature hot-spots. When one is found the date, time, location, and intensity are recorded. MODIS looks at every square km of the Earth every 48 hours, once during the day and once during the night, and the presence of two MODIS sensors in space allows at least four hot-spot observations every two days. Each day updated global maps are compiled to display the locations of all hot spots detected in the previous 24 hours. There is a drop-down list with volcano names which allow users to 'zoom-in' and examine the distribution of hot-spots at a variety of spatial scales. |
|
WOVOdat
Single Volcano View Temporal Evolution of Unrest Side by Side Volcanoes |
WOVOdat is a database of volcanic unrest; instrumentally and visually recorded changes in seismicity, ground deformation, gas emission, and other parameters from their normal baselines. It is sponsored by the World Organization of Volcano Observatories (WOVO) and presently hosted at the Earth Observatory of Singapore.
GVMID Data on Volcano Monitoring Infrastructure The Global Volcano Monitoring Infrastructure Database GVMID, is aimed at documenting and improving capabilities of volcano monitoring from the ground and space. GVMID should provide a snapshot and baseline view of the techniques and instrumentation that are in place at various volcanoes, which can be use by volcano observatories as reference to setup new monitoring system or improving networks at a specific volcano. These data will allow identification of what monitoring gaps exist, which can be then targeted by remote sensing infrastructure and future instrument deployments. |
| Volcanic Hazard Maps | The IAVCEI Commission on Volcanic Hazards and Risk has a Volcanic Hazard Maps database designed to serve as a resource for hazard mappers (or other interested parties) to explore how common issues in hazard map development have been addressed at different volcanoes, in different countries, for different hazards, and for different intended audiences. In addition to the comprehensive, searchable Volcanic Hazard Maps Database, this website contains information about diversity of volcanic hazard maps, illustrated using examples from the database. This site is for educational purposes related to volcanic hazard maps. Hazard maps found on this website should not be used for emergency purposes. For the most recent, official hazard map for a particular volcano, please seek out the proper institutional authorities on the matter. |
| IRIS seismic stations/networks | Incorporated Research Institutions for Seismology (IRIS) Data Services map showing the location of seismic stations from all available networks (permanent or temporary) within a radius of 0.18° (about 20 km at mid-latitudes) from the given location of Merapi. Users can customize a variety of filters and options in the left panel. Note that if there are no stations are known the map will default to show the entire world with a "No data matched request" error notice. |
| UNAVCO GPS/GNSS stations | Geodetic Data Services map from UNAVCO showing the location of GPS/GNSS stations from all available networks (permanent or temporary) within a radius of 20 km from the given location of Merapi. Users can customize the data search based on station or network names, location, and time window. Requires Adobe Flash Player. |
| DECADE Data | The DECADE portal, still in the developmental stage, serves as an example of the proposed interoperability between The Smithsonian Institution's Global Volcanism Program, the Mapping Gas Emissions (MaGa) Database, and the EarthChem Geochemical Portal. The Deep Earth Carbon Degassing (DECADE) initiative seeks to use new and established technologies to determine accurate global fluxes of volcanic CO2 to the atmosphere, but installing CO2 monitoring networks on 20 of the world's 150 most actively degassing volcanoes. The group uses related laboratory-based studies (direct gas sampling and analysis, melt inclusions) to provide new data for direct degassing of deep earth carbon to the atmosphere. |
| Large Eruptions of Merapi | Information about large Quaternary eruptions (VEI >= 4) is cataloged in the Large Magnitude Explosive Volcanic Eruptions (LaMEVE) database of the Volcano Global Risk Identification and Analysis Project (VOGRIPA). |
| EarthChem | EarthChem develops and maintains databases, software, and services that support the preservation, discovery, access and analysis of geochemical data, and facilitate their integration with the broad array of other available earth science parameters. EarthChem is operated by a joint team of disciplinary scientists, data scientists, data managers and information technology developers who are part of the NSF-funded data facility Integrated Earth Data Applications (IEDA). IEDA is a collaborative effort of EarthChem and the Marine Geoscience Data System (MGDS). |

