Recently Published Bulletin Reports
Agung (Indonesia) Three eruptive events reported in April, May, and December 2022
Tengger Caldera (Indonesia) Minor ash emission in December 2023; persistent weak thermal anomaly in the Bromo crater
Saunders (United Kingdom) Persistent thermal anomalies from the summit crater lava lake during February 2023-January 2024
Shishaldin (United States) New eruption with significant Strombolian explosions, ash plumes, and ashfall
Ioto (Japan) New eruption with discolored water, ejecta, and floating pumice during October-December 2023
Purace (Colombia) Gas-and-ash emission on 16 November 2023
Suwanosejima (Japan) Eruption plumes, crater incandescence, and occasional explosions during July-October 2023
Etna (Italy) Strombolian explosions, lava fountains, and lava flows during July-August 2023
Aira (Japan) Explosions, ash plumes, ash fall, and crater incandescence during July-October 2023
Nishinoshima (Japan) Gray emissions during October 2023
Kilauea (United States) Strong lava fountains, lava flows, and spatter at Halema’uma’u during January-September 2023
Tinakula (Solomon Islands) Continued lava flows and thermal activity during June through November 2023
Agung (Indonesia) — January 2024  Cite this Report
Agung
Indonesia
8.343°S, 115.508°E; summit elev. 2997 m
All times are local (unless otherwise noted)
Three eruptive events reported in April, May, and December 2022
Mount Agung, located on the E end of the island of Bali, Indonesia, rises above the SE rim of the Batur caldera. The summit area extends 1.5 km E-W, with the highest point on the W and a steep-walled 800-m-wide crater on the E. Recorded eruptions date back to the early 19th century. A large and deadly explosive and effusive eruption occurred during 1963-64, which was characterized by voluminous ashfall, pyroclastic flows, and lahars that caused extensive damage and many fatalities. More recent activity was documented during November 2017-June 2019 that consisted of multiple explosions, significant ash plumes, lava flows at the summit crater, and incandescent ejecta. This report covers activity reported during April-May 2022 and December 2022 based on data from the Darwin Volcanic Ash Advisory Center (VAAC).
Activity during 2022 was relatively low and mainly consisted of a few ash plumes during April-May and December. An ash plume on 3 April rising to 3.7 km altitude (700 m above the summit) and drifting N was reported in a Darwin VAAC notice based on a ground report, with ash seen in HIMAWARI-8 visible imagery. Another ash plume was reported at 1120 on 27 May that rose to 5.5 km altitude (2.5 m above the summit); the plume was not visible in satellite or webcam images due to weather clouds. An eruption was reported based on seismic data at 0840 on 13 December, with an estimated plume altitude of 3.7 km; however, no ash was seen using satellite imagery in clear conditions before weather clouds obscured the summit.
Geologic Background. Symmetrical Agung stratovolcano, Bali's highest and most sacred mountain, towers over the eastern end of the island. The volcano, whose name means "Paramount," rises above the SE rim of the Batur caldera, and the northern and southern flanks extend to the coast. The summit area extends 1.5 km E-W, with the high point on the W and a steep-walled 800-m-wide crater on the E. The Pawon cone is located low on the SE flank. Only a few eruptions dating back to the early 19th century have been recorded in historical time. The 1963-64 eruption, one of the largest in the 20th century, produced voluminous ashfall along with devastating pyroclastic flows and lahars that caused extensive damage and many fatalities.
Information Contacts: Darwin Volcanic Ash Advisory Centre (VAAC), Bureau of Meteorology, Northern Territory Regional Office, PO Box 40050, Casuarina, NT 0811, Australia (URL: http://www.bom.gov.au/info/vaac/).
Tengger Caldera (Indonesia) — February 2024 Cite this Report
Tengger Caldera
Indonesia
7.942°S, 112.95°E; summit elev. 2329 m
All times are local (unless otherwise noted)
Minor ash emission in December 2023; persistent weak thermal anomaly in the Bromo crater
Tengger Caldera, located at the N end of a volcanic massif in Indonesia’s East Java, consists of five overlapping stratovolcanoes. The youngest and only active cone in the 16-km-wide caldera is Bromo, which typically produces gas-and-steam plumes, occasional ash plumes and explosions, and weak thermal signals (BGVN 44:05, 47:01). This report covers activity during January 2022-December 2023, consisting of mostly white gas-and-steam emissions and persistent weak thermal anomalies. Information was provided by the Pusat Vulkanologi dan Mitigasi Bencana Geologi (PVMBG, also known as Indonesian Center for Volcanology and Geological Hazard Mitigation, CVGHM) and satellite imagery. The Alert Level remained at 2 (on a scale of 1-4), and visitors were warned to stay at least 1 km from the crater.
Activity was generally low during the reporting period, similar to that in 2021. According to almost daily images from MAGMA Indonesia (a platform developed by PVMBG), white emissions and plumes rose from 50 to 900 m above the main crater during this period (figure 24). During several days in March and June 2022, white plumes reached heights of 1-1.2 km above the crater.
After an increase in activity at 2114 on 3 February 2023, a PVMBG team that was sent to observe white emissions rising as high as 300 m during 9-12 February and heard rumbling noises. A sulfur dioxide odor was also strong near the crater and measurements indicated that levels were above the healthy (non-hazardous) threshold of 5 parts per million; differential optical absorption spectroscopy (DOAS) measurements indicated an average flux of 190 metric tons per day on 11 February. Incandescence originating from a large fumarole in the NNW part of the crater was visible at night. The team observed that vegetation on the E caldera wall was yellow and withered. The seismic network recorded continuous tremor and deep and shallow volcanic earthquakes.
According to a PVMBG press release, activity increased on 13 December 2023 with white, gray, and brown emissions rising as high as 900 m above Bromo’s crater rim and drifting in multiple directions (figure 25). The report noted that tremor was continuous and was accompanied in December by three volcanic earthquakes. Deformation data indicated inflation in December. There was no observable difference in the persistent thermal anomaly in the crater between 11 and 16 December 2023.
All clear views of the Bromo crater throughout this time, using Sentinel-2 infrared satellite images, showed a weak persistent thermal anomaly; none of the anomalies were strong enough to cause MODVOLC Thermal Alerts. A fire in the SE part of the caldera in early September 2023 resulted in a brief period of strong thermal anomalies.
Geologic Background. The 16-km-wide Tengger caldera is located at the northern end of a volcanic massif extending from Semeru volcano. The massive volcanic complex dates back to about 820,000 years ago and consists of five overlapping stratovolcanoes, each truncated by a caldera. Lava domes, pyroclastic cones, and a maar occupy the flanks of the massif. The Ngadisari caldera at the NE end of the complex formed about 150,000 years ago and is now drained through the Sapikerep valley. The most recent of the calderas is the 9 x 10 km wide Sandsea caldera at the SW end of the complex, which formed incrementally during the late Pleistocene and early Holocene. An overlapping cluster of post-caldera cones was constructed on the floor of the Sandsea caldera within the past several thousand years. The youngest of these is Bromo, one of Java's most active and most frequently visited volcanoes.
Information Contacts: Pusat Vulkanologi dan Mitigasi Bencana Geologi (PVMBG, also known as Indonesian Center for Volcanology and Geological Hazard Mitigation, CVGHM), Jalan Diponegoro 57, Bandung 40122, Indonesia (URL: http://www.vsi.esdm.go.id/); MAGMA Indonesia, Kementerian Energi dan Sumber Daya Mineral (URL: https://magma.esdm.go.id/v1); Copernicus Browser, Copernicus Data Space Ecosystem, European Space Agency (URL: https://dataspace.copernicus.eu/browser/); Hawai'i Institute of Geophysics and Planetology (HIGP) - MODVOLC Thermal Alerts System, School of Ocean and Earth Science and Technology (SOEST), Univ. of Hawai'i, 2525 Correa Road, Honolulu, HI 96822, USA (URL: http://modis.higp.hawaii.edu/).
Saunders (United Kingdom) — February 2024 Cite this Report
Saunders
United Kingdom
57.8°S, 26.483°W; summit elev. 843 m
All times are local (unless otherwise noted)
Persistent thermal anomalies from the summit crater lava lake during February 2023-January 2024
Saunders is one of eleven islands that comprise the South Sandwich Islands in the South Atlantic. The active Mount Michael volcano has been in almost continuous eruption since November 2014 (BGVN 48:02). Recent activity has resulted in intermittent thermal anomalies and gas-and-steam emissions (BGVN 47:03, 48:02). Visits are infrequent due to its remote location, and cloud cover often prevents satellite observations. Satellite thermal imagery and visual observation of incandescence during a research expedition in 2019 (BGVN 28:02 and 44:08) and a finding confirmed by a National Geographic Society research team that summited Michael in November 2022 reported the presence of a lava lake.
Although nearly constant cloud cover during February 2023 through January 2024 greatly limited satellite observations, thermal anomalies from the lava lake in the summit crater were detected on clear days, especially around 20-23 August 2023. Anomalies similar to previous years (eg. BGVN 48:02) were seen in both MIROVA (Middle InfraRed Observation of Volcanic Activity) data from MODIS instruments and in Sentinel 2 infrared imagery. The only notable sulfur dioxide plume detected near Saunders was on 25 September 2023, with the TROPOMI instrument aboard the Sentinel-5P satellite.
Geologic Background. Saunders Island consists of a large central volcanic edifice intersected by two seamount chains, as shown by bathymetric mapping (Leat et al., 2013). The young Mount Michael stratovolcano dominates the glacier-covered island, while two submarine plateaus, Harpers Bank and Saunders Bank, extend north. The symmetrical Michael has a 500-m-wide summit crater and a remnant of a somma rim to the SE. Tephra layers visible in ice cliffs surrounding the island are evidence of recent eruptions. Ash clouds were reported from the summit crater in 1819, and an effusive eruption was inferred to have occurred from a N-flank fissure around the end of the 19th century and beginning of the 20th century. A low ice-free lava platform, Blackstone Plain, is located on the north coast, surrounding a group of former sea stacks. A cluster of cones on the SE flank, the Ashen Hills, appear to have been modified since 1820 (LeMasurier and Thomson, 1990). Analysis of satellite imagery available since 1989 (Gray et al., 2019; MODVOLC) suggests frequent eruptive activity (when weather conditions allow), volcanic clouds, steam plumes, and thermal anomalies indicative of a persistent, or at least frequently active, lava lake in the summit crater. Due to this observational bias, there has been a presumption when defining eruptive periods that activity has been ongoing unless there is no evidence for at least 10 months.
Information Contacts: MIROVA (Middle InfraRed Observation of Volcanic Activity), a collaborative project between the Universities of Turin and Florence (Italy) supported by the Centre for Volcanic Risk of the Italian Civil Protection Department (URL: http://www.mirovaweb.it/); NASA Global Sulfur Dioxide Monitoring Page, Atmospheric Chemistry and Dynamics Laboratory, NASA Goddard Space Flight Center (NASA/GSFC), 8800 Greenbelt Road, Goddard MD 20771, USA (URL: https://so2.gsfc.nasa.gov/); Copernicus Browser (URL: https://dataspace.copernicus.eu/browser).
Shishaldin (United States) — December 2023 Cite this Report
Shishaldin
United States
54.756°N, 163.97°W; summit elev. 2857 m
All times are local (unless otherwise noted)
New eruption with significant Strombolian explosions, ash plumes, and ashfall
Shishaldin is located on the eastern half of Unimak Island, one of the Aleutian Islands. Frequent explosive activity, primarily consisting of Strombolian ash eruptions from the small summit crater, but sometimes producing lava flows, has been recorded since the 18th century. The previous eruption ended in May 2020 and was characterized by intermittent thermal activity, increased seismicity and surface temperatures, ash plumes, and ash deposits (BGVN 45:06). This report covers a new eruption during July through November 2023, which consisted of significant explosions, ash plumes, ashfall, and lava fountaining. Information comes from daily, weekly, and special reports from the Alaska Volcano Observatory (AVO) and various satellite data. AVO monitors the volcano using local seismic and infrasound sensors, satellite data, web cameras, and remote infrasound and lightning networks.
AVO reported that intermittent tremor and low-frequency earthquakes had gradually become more regular and consistent during 10-13 July. Strongly elevated surface temperatures at the summit were identified in satellite images during 10-13 July. On 11 July AVO raised the Aviation Color Code (ACC) to Yellow (the second color on a four-color scale) and Volcano Alert Level (VAL) to Advisory (the second level on a four-level scale) at 1439. Later in the day on 11 July summit crater incandescence was observed in webcam images. Observations of the summit suggested that lava was likely present at the crater, which prompted AVO to raise the ACC to Orange (the second highest color on a four-color scale) and the VAL to Watch (the second highest level on a four-level scale). The US Coast Guard conducted an overflight on 12 July and confirmed that lava was erupting from the summit. That same day, sulfur dioxide emissions were detected in satellite images.
A significant explosion began at 0109 on 14 July that produced an ash plume that rose to 9-12 km altitude and drifted S over the Pacific Ocean (figure 43). Webcam images and photos taken around 0700 from a ship SW off Unimak Island showed small lahar deposits, which were the result of the interaction of hot pyroclastic material and snow and ice on the flanks. There was also ashfall on the SW and N flanks. A smaller explosion at 0710 generated an ash plume that rose to 4.5 km altitude. Webcam images and pilot reports showed continued low-level ash emissions during the morning, rising to less than 4.6 km altitude; those emissions included a small ash plume near the summit around 1030 resulting from a small explosion.
Seismic tremor amplitude began increasing at around 1700 on 15 July; strongly elevated surface temperatures were also reported. An ash plume rose to 4.6 km altitude and drifted SSE at 2100, based on a satellite image. A continuous ash plume during 2150 through 2330 rose to 5 km altitude and extended 125 km S. At 2357 AVO raised the ACC to Red (the highest color on a four-color scale) and the VAL to Warning (the highest level on a four-level scale), noting that seismicity remained elevated for more than six hours and explosion signals were frequently detected by regional infrasound (pressure sensor) networks. Explosions generated an ash plume that rose to 4.9 km altitude and drifted as far as 500 km SE. Activity throughout the night declined and by 0735 the ACC was lowered to Orange and the VAL to Watch. High-resolution satellite images taken on 16 July showed pyroclastic deposits extending as far as 3 km from the vent; these deposits generated lahars that extended further down the drainages on the flanks. Ash deposits were mainly observed on the SSE flank and extended to the shore of Unimak Island. During 16-17 July lava continued to erupt at the summit, which caused strongly elevated surface temperatures that were visible in satellite imagery.
Lava effusion increased at 0100 on 18 July, as noted in elevated surface temperatures identified in satellite data, increasing seismic tremor, and activity detected on regional infrasound arrays. A significant ash plume at 0700 rose to 7 km altitude and continued until 0830, eventually reaching 9.1 km altitude and drifting SSE (figure 44). As a result, the ACC was raised to Red and the VAL to Warning. By 0930 the main plume detached, but residual low-level ash emissions continued for several hours, remaining below 3 km altitude and drifting S. The eruption gradually declined and by 1208 the ACC was lowered to Orange and the VAL was lowered to Watch. High-resolution satellite images showed ash deposits on the SW flank and pyroclastic deposits on the N, E, and S flanks, extending as far as 3 km from the vent; lahars triggered by the eruption extended farther down the flanks (figure 45). Lava continued to erupt from the summit crater on 19 July.
Elevated surface temperatures were detected in satellite images during 19-25 July, despite occasional weather cloud cover, which was consistent with increased lava effusion. During 22-23 July satellite observations acquired after the eruption from 18 July showed pyroclastic flow and lahar deposits extending as far as 3 km down the N, NW, and NE flanks and as far as 1.5 km down the S and SE flanks. Ash deposits covered the SW and NE flanks. No lava flows were observed outside the crater. On 22 July a sulfur dioxide plume was detected in satellite data midday that had an estimated mass of 10 kt. In a special notice issued at 1653 on 22 July AVO noted that eruptive activity had intensified over the previous six hours, which was characterized by an hours-long steady increase in seismic tremor, intermittent infrasound signals consistent with small explosions, and an increase in surface temperatures that were visible in satellite data. Pilots first reported low-level ash plumes at around 1900. At 2320 an ash plume had risen to 9 km altitude based on additional pilot reports and satellite images. The ACC was increased to Red and the VAL to Warning at 2343. Satellite images indicated growth of a significantly higher ash plume that rose to 11 km altitude continued until 0030 and drifted NE. During the early morning hours of 23 July ash plumes had declined to 4.6 k altitude. Seismic tremor peaked at 0030 on 23 July and began to rapidly decline at 0109; active ash emissions were no longer visible in satellite data by 0130. The ACC was lowered to Orange and the VAL to Watch at 0418; bursts of increased seismicity were recorded throughout the morning, but seismicity generally remained at low levels. Elevated surface temperatures were visible in satellite data until about 0600. On 24 July pilots reported seeing vigorous gas-and-steam plumes rising to about 3 km altitude; the plumes may have contained minor amounts of ash.
During 24-25 July low level seismicity and volcanic tremor were detected at low levels following the previous explosion on 23 July. Strongly elevated surface temperatures were observed at the summit crater in satellite data. Around 2200 on 25 July seismicity began to increase, followed by infrasound signals of explosions after 0200 on 26 July. An ash plume rose to 3 km altitude at 0500 and drifted ENE, along with an associated sulfur dioxide plume that drifted NE and had an estimated mass of 22 kt. Diffuse ash emissions were visible in satellite data and rose to 6.1-7.6 km altitude and extended 125 km from the volcano starting around 1130. These ash events were preceded by about seven hours of seismic tremor, infrasound detections of explosions, and five hours of increased surface temperatures visible in satellite data. Activity began to decline around 1327, which included low-frequency earthquakes and decreased volcanic tremor, and infrasound data no longer detected significant explosions. Surface temperatures remained elevated through the end of the month.
Seismicity, volcanic tremor, and ash emissions remained at low levels during early August. Satellite images on 1 August showed that some slumping had occurred on the E crater wall due to the recent explosive activity. Elevated surface temperatures continued, which was consistent with cooling lava. On 2 August small explosive events were detected, consistent with low-level Strombolian activity. Some episodes of volcanic tremor were reported, which reflected low-level ash emissions. Those ash emissions rose to less than 3 km altitude and drifted as far as 92.6 km N. Pilots that were located N of the volcano observed an ash plume that rose to 2.7 km altitude. Seismicity began to increase in intensity around 0900 on 3 August. Seismicity continued to increase throughout the day and through the night with strongly elevated surface temperatures, which suggested that lava was active at the surface.
An ash cloud that rose to 7.6-7.9 km altitude and drifted 60-75 km NE was visible in a satellite image at 0520 on 4 August. Pilots saw and reported the plume at 0836 (figure 46). By 0900 the plume had risen to 9.1 km altitude and extended over 100 km NE. AVO raised the ACC to Red and the VAL to Warning as a result. Seismic tremor levels peaked at 1400 and then sharply declined at 1500 to slightly elevated levels; the plume was sustained during the period of high tremor and drifted N and NE. The ACC was lowered to Orange and the VAL to Watch at 2055. During 5-14 August seismicity remained low and surface temperatures were elevated based on satellite data due to cooling lava. On 9 August a small lava flow was observed that extended from the crater rim to the upper NE flank. It had advanced to 55 m in length and appeared in satellite imagery on 11 August. Occasional gas-and-steam plumes were noted in webcam images. At 1827 AVO noted that seismic tremor had steadily increased during the afternoon and erupting lava was visible at the summit in satellite images.
Strong explosion signals were detected at 0200 on 15 August. An ash cloud that was visible in satellite data extended 100 km NE and may have risen as high as 11 km altitude around 0240. By 0335 satellite images showed the ash cloud rising to 7.6 km altitude and drifting NE. Significant seismicity and explosions were detected by the local AVO seismic and infrasound networks, and volcanic lightning was detected by the World Wide Lightning Location Network (WWLLN). A sulfur dioxide plume associated with the eruption drifted over the S Bering Sea and parts of Alaska and western Canada. Seismicity was significantly elevated during the eruption but had declined by 1322. A pilot reported that ash emissions continued, rising as high as 4.9 km altitude. Elevated surface temperatures detected in satellite data were caused by hot, eruptive material (pyroclastic debris and lava) that accumulated around the summit. Eruptive activity declined by 16 August and the associated sulfur dioxide plume had mostly dissipated; remnants continued to be identified in satellite images at least through 18 August. Surface temperatures remained elevated based on satellite images, indicating hot material on the upper parts of the volcano. Small explosions were detected in infrasound data on the morning of 19 August and were consistent with pilot reports of small, short-lived ash plumes that rose to about 4.3 km altitude. Low-level explosive activity was reported during 20-24 August, according to seismic and infrasound data, and weather clouds sometimes prevented views. Elevated surface temperatures were observed in satellite images, which indicated continued hot material on the upper parts of the volcano.
Seismic tremor began to increase at around 0300 on 25 August and was followed by elevated surface temperatures identified in satellite images, consistent with erupting lava. Small explosions were recorded in infrasound data. The ACC was raised to Red and the VAL to Warning at 1204 after a pilot reported an ash plume that rose to 9.1 km altitude. Seismicity peaked at 1630 and began to rapidly decline at around 1730. Ash plumes rose as high as 10 km altitude and drifted as far as 400 km NE. By 2020 the ash plumes had declined to 6.4 km altitude and continued to drift NE. Ash emissions were visible in satellite data until 0000 on 26 August and seismicity was at low levels. AVO lowered the ACC to Orange and the VAL to Watch at 0030. Minor explosive activity within the summit crater was detected during 26-28 August and strongly elevated surface temperatures were still visible in satellite imagery through the rest of the month. An AVO field crew working on Unimak Island observed a mass flow that descended the upper flanks beginning around 1720 on 27 August. The flow produced a short-lived ash cloud that rose to 4.5 km altitude and rapidly dissipated. The mass flow was likely caused by the collapse of spatter that accumulated on the summit crater rim.
Similar variable explosive activity was reported in September, although weather observations sometimes prevented observations. A moderate resolution satellite image from the afternoon of 1 September showed gas-and-steam emissions filling the summit crater and obscuring views of the vent. In addition, hot deposits from the previous 25-26 August explosive event were visible on the NE flank near the summit, based on a 1 September satellite image. On 2 and 4 September seismic and infrasound data showed signals of small, repetitive explosions. Variable gas-and-steam emissions from the summit were visible but there was no evidence of ash. Possible summit crater incandescence was visible in nighttime webcam images during 3-4 September.
Seismicity began to gradually increase at around 0300 on 5 September and activity escalated at around 0830. A pilot reported an ash plume that rose to 7.6 km altitude at 0842 and continued to rise as high as possibly 9.7 km altitude and drifted SSE based on satellite images (figure 47). The ACC was raised to Red and the VAL to Warning at 0900. In addition to strong tremor and sustained explosions, the eruption produced volcanic lightning that was detected by the WWLLN. Around 1100 seismicity decreased and satellite data confirmed that the altitude of the ash emissions had declined to 7.6 km altitude. By 1200 the lower-altitude portion of the ash plume had drifted 125 km E. Significant ash emissions ended by 1330 based on webcam images. The ACC was lowered to Orange and the VAL to Watch at 1440. Satellite images showed extensive pyroclastic debris flows on most of the flanks that extended 1.2-3.3 km from the crater rim.
During 6-13 September elevated surface temperatures continued to be observed in satellite data, seismicity remained elevated with weak but steady tremor, and small, low-frequency earthquakes and small explosions were reported, except on 12 September. On 6 September a low-level ash plume rose to 1.5-1.8 km altitude and drifted SSE. Occasional small and diffuse gas-and-steam emissions at the summit were visible in webcam images. Around 1800 on 13 September seismic tremor amplitudes began to increase, and small explosions were detected in seismic and infrasound data. Incandescent lava at the summit was seen in a webcam image taken at 0134 on 14 September during a period of elevated tremor. No ash emissions were reported during the period of elevated seismicity. Lava fountaining began around 0200, based on webcam images. Satellite-based radar observations showed that the lava fountaining activity led to the growth of a cone in the summit crater, which refilled most of the crater. By 0730 seismicity significantly declined and remained at low levels.
Seismic tremor began to increase around 0900 on 15 September and rapidly intensified. An explosive eruption began at around 1710, which prompted AVO to raise the ACC to Red and the VAL to Warning. Within about 30 minutes ash plumes drifted E below a weather cloud at 8.2 km altitude. The National Weather Service estimated that an ash-rich plume rose as high as 12.8 km altitude and produced volcanic lightning. The upper part of the ash plume detached from the vent around 1830 and drifted E, and was observed over the Gulf of Alaska. Around the same time, seismicity dramatically decreased. Trace ashfall was reported in the community of False Pass (38 km ENE) between 1800-2030 and also in King Cove and nearby marine waters. Activity declined at around 1830 although seismicity remained elevated, ash emissions, and ashfall continued until 2100. Lightning was again detected beginning around 1930, which suggested that ash emissions continued. Ongoing explosions were detected in infrasound data, at a lower level than during the most energetic phase of this event. Lightning was last detected at 2048. By 2124 the intensity of the eruption had decreased, and ash emissions were likely rising to less than 6.7 km altitude. Seismicity returned to pre-eruption levels. On 16 September the ACC was lowered to Orange and the VAL to Watch at 1244; the sulfur dioxide plume that was emitted from the previous eruption event was still visible over the northern Pacific Ocean. Elevated surface temperatures, gas-and-steam emissions from the vent, and new, small lahars were reported on the upper flanks based on satellite and webcam images. Minor deposits were reported on the flanks which were likely the result of collapse of previously accumulated lava near the summit crater.
Elevated seismicity with tremor, small earthquakes, and elevated surface temperatures were detected during 17-23 September. Minor gas-and-steam emissions were visible in webcam images. On 20 September small volcanic debris flows were reported on the upper flanks. On 21 September a small ash deposit was observed on the upper flanks extending to the NE based on webcam images. Seismic tremor increased significantly during 22-23 September. Regional infrasound sensors suggested that low-level eruptive activity was occurring within the summit crater by around 1800 on 23 September. Even though seismicity was at high levels, strongly elevated surface temperatures indicating lava at the surface were absent and no ash emissions were detected; weather clouds at 0.6-4.6 km altitude obscured views. At 0025 on 24 September AVO noted that seismicity continued at high levels and nearly continuous small infrasound signals began, likely from low-level eruptive activity. Strongly elevated surface temperatures were identified in satellite images by 0900 and persisted throughout the day; the higher temperatures along with infrasound and seismic data were consistent with lava erupting at the summit. Around 1700 similarly elevated surface temperatures were detected from the summit in satellite data, which suggested that more vigorous lava fountaining had started. Starting around 1800 low-level ash emissions rose to altitudes less than 4.6 km altitude and quickly dissipated.
Beginning at midnight on 25 September, a series of seismic signals consistent with volcanic flows were recorded on the N side of the volcano. A change in seismicity and infrasound signals occurred around 0535 and at 0540 a significant ash cloud formed and quickly reached 14 km altitude and drifted E along the Alaska Peninsula. The cloud generated at least 150 lightning strokes with thunder that could be heard by people in False Pass. Seismicity rapidly declined to near background levels around 0600. AVO increased the ACC to Red and the VAL to Warning at 0602. The ash cloud detached from the volcano at around 0700, rose to 11.6 km altitude, and drifted ESE. Trace to minor amounts of ashfall were reported by the communities of False Pass, King Cove, Cold Bay, and Sand Point around 0700. Ash emissions continued at lower altitudes of 6-7.6 km altitude at 0820. Small explosions at the vent area continued to be detected in infrasound data and likely represented low-level eruptive activity near the vent. Due to the significant decrease in seismicity and ash emissions the ACC was lowered to Orange and the VAL to Watch at 1234. Radar data showed significant collapses of the crater that occurred on 25 September. Satellite data also showed significant hot, degassing pyroclastic and lahar deposits on all flanks, including more extensive flows on the ENE and WSW sections below two new collapse scarps. Following the significant activity during 24-25 September, only low-level activity was observed. Seismicity decreased notably near the end of the strong activity on 25 September and continued to decrease through the end of the month, though tremor and small earthquakes were still reported. No explosive activity was detected in infrasound data through 2 October. Gas-and-steam emissions rose to 3.7 km altitude, as reported by pilots and seen in satellite images. Satellite data from 26 September showed that significant collapses had occurred at the summit crater and hot, steaming deposits from pyroclastic flows and lahars were present on all the flanks, particularly to the ENE and WSW. A small ash cloud was visible in webcam images on 27 September, likely from a collapse at the summit cone. High elevated surface temperatures were observed in satellite imagery during 27-28 September, which were likely the result of hot deposits on the flanks erupted on 25 September. Minor steaming at the summit crater and from an area on the upper flanks was visible in webcam images on 28 September.
During October, explosion events continued between periods of low activity. Seismicity significantly increased starting at around 2100 on 2 October; around the same time satellite images showed an increase in surface temperatures consistent with lava fountaining. Small, hot avalanches of rock and lava descended an unspecified flank. In addition, a distinct increase in infrasound, seismicity, and lightning detections was followed by an ash plume that rose to 12.2 km altitude and drifted S and E at 0520 on 3 October, based on satellite images. Nighttime webcam images showed incandescence due to lava fountaining at the summit and pyroclastic flows descending the NE flank. AVO reported that a notable explosive eruption started at 0547 and lasted until 0900 on 3 October, which prompted a rise in the ACC to Red and the VAL to Warning. Subsequent ash plumes rose to 6-7.6 km altitude by 0931. At 1036 the ACC was lowered back to Orange and the VAL to Watch since both seismic and infrasound data quieted substantially and were slightly above background levels. Gas-and-steam emissions were observed at the summit, based on webcam images. Trace amounts of ashfall were observed in Cold Bay. Resuspended ash was present at several kilometers altitude near the volcano. During the afternoon, low-level ash plumes were visible at the flanks, which appeared to be largely generated by rock avalanches off the summit crater following the explosive activity. These ash plumes rose to 3 km altitude and drifted W. Trace amounts of ashfall were reported by observers in Cold Bay and Unalaska and flights to these communities were disrupted by the ash cloud. Satellite images taken after the eruption showed evidence of pyroclastic flows and lahar deposits in drainages 2 km down the SW flank and about 3.2 km down the NE flank, and continued erosion of the crater rim. Small explosion craters at the end of the pyroclastic flows on the NE flank were noted for the first time, which may have resulted from gas-and-steam explosions when hot deposits interact with underlying ice.
During 4 October seismicity, including frequent small earthquakes, remained elevated, but was gradually declining. Ash plumes were produced for over eight hours until around 1400 that rose to below 3.7 km altitude. These ash plumes were primarily generated off the sides of the volcano where hot rock avalanches from the crater rim had entered drainages to the SW and NE. Two explosion craters were observed at the base of the NE deposits about 3.2 km from the crater rim. Webcam images showed the explosion craters were a source of persistent ash emissions; occasional collapse events also generated ash. Seismicity remained elevated with sulfur dioxide emissions that had a daily average of more than 1,000 tons per day, and frequent small earthquakes through the end of the month. Frequent elevated surface temperatures were identified in satellite images and gas-and-steam plumes were observed in webcam images, although weather conditions occasionally prevented clear views of the summit. Emissions were robust during 14-16 October and were likely generated by the interaction of hot material and snow and ice. During the afternoon of 21 October a strong gas-and-steam plume rose to 3-4.6 km altitude and extended 40 km WSW, based on satellite images and reports from pilots. On 31 October the ACC was lowered to Yellow and the VAL was lowered to Advisory.
Activity in November was characterized by elevated seismicity with ongoing seismic tremor and small, low-frequency earthquakes, elevated surface temperatures, and gas-and-steam emissions. There was an increase in seismic and infrasound tremor amplitudes starting at 1940 on 2 November. As a result, the ACC was again raised to Orange and the VAL was increased to Watch, although ash was not identified in satellite data. An ash cloud rose to 6.1 km altitude and drifted W according to satellite data at 2000. By 0831 on 3 November ash emissions were no longer visible in satellite images. On 6 and 9 November air pressure sensors detected signals consistent with small explosions. Small explosions were detected in infrasound data consistent with weak Strombolian activity on 19 and 21 November. Seismicity started to decrease on 21 November. On 25 November gas-and-steam emissions were emitted from the vent as well as from a scarp on the NE side of the volcano near the summit. A gas-and-steam plume extended about 50 km SSE and was observed in satellite and webcam images on 26 November. On 28 November small explosions were observed in seismic and local infrasound data and gas-and-steam emissions were visible from the summit and from the upper NE collapse scarp based on webcam images. Possible small explosions were observed in infrasound data on 30 November. Weakly elevated surface temperatures and a persistent gas-and-steam plume from the summit and collapse scarps on the upper flanks. A passing aircraft reported the gas-and-steam plume rose to 3-3.4 km altitude on 30 November, but no significant ash emissions were detected.
Satellite data. MODIS thermal anomaly data provided through MIROVA (Middle InfraRed Observation of Volcanic Activity) showed a strong pulse of thermal activity beginning in July 2023 that continued through November 2023 (figure 48). This strong activity was due to Strombolian explosions and lava fountaining events at the summit crater. According to data from MODVOLC thermal alerts, a total of 101 hotspots were detected near the summit crater in July (11-14, 16-19, 23-24 and 26), August (4, 25-26, and 29), September (5, 12, and 17), and October (3, 4, and 8). Infrared satellite data showed large lava flows descending primarily the northern and SE flanks during the reporting period (figure 49). Sulfur dioxide plumes often exceeded two Dobson Units (DUs) and drifted in different directions throughout the reporting period, based on satellite data from the TROPOMI instrument on the Sentinel-5P satellite (figure 50).
Geologic Background. The symmetrical glacier-covered Shishaldin in the Aleutian Islands is the westernmost of three large stratovolcanoes in the eastern half of Unimak Island. The Aleuts named the volcano Sisquk, meaning "mountain which points the way when I am lost." Constructed atop an older glacially dissected edifice, it is largely basaltic in composition. Remnants of an older edifice are exposed on the W and NE sides at 1,500-1,800 m elevation. There are over two dozen pyroclastic cones on its NW flank, which is covered by massive aa lava flows. Frequent explosive activity, primarily consisting of Strombolian ash eruptions from the small summit crater, but sometimes producing lava flows, has been recorded since the 18th century. A steam plume often rises from the summit crater.
Information Contacts: Alaska Volcano Observatory (AVO), a cooperative program of a) U.S. Geological Survey, 4200 University Drive, Anchorage, AK 99508-4667 USA (URL: https://avo.alaska.edu/), b) Geophysical Institute, University of Alaska, PO Box 757320, Fairbanks, AK 99775-7320, USA, and c) Alaska Division of Geological & Geophysical Surveys, 794 University Ave., Suite 200, Fairbanks, AK 99709, USA (URL: http://dggs.alaska.gov/); MIROVA (Middle InfraRed Observation of Volcanic Activity), a collaborative project between the Universities of Turin and Florence (Italy) supported by the Centre for Volcanic Risk of the Italian Civil Protection Department (URL: http://www.mirovaweb.it/); Hawai'i Institute of Geophysics and Planetology (HIGP) - MODVOLC Thermal Alerts System, School of Ocean and Earth Science and Technology (SOEST), Univ. of Hawai'i, 2525 Correa Road, Honolulu, HI 96822, USA (URL: http://modis.higp.hawaii.edu/); NASA Global Sulfur Dioxide Monitoring Page, Atmospheric Chemistry and Dynamics Laboratory, NASA Goddard Space Flight Center (NASA/GSFC), 8800 Greenbelt Road, Goddard, Maryland, USA (URL: https://so2.gsfc.nasa.gov/); Copernicus Browser, Copernicus Data Space Ecosystem, European Space Agency (URL: https://dataspace.copernicus.eu/browser/).
Ioto
Japan
24.751°N, 141.289°E; summit elev. 169 m
All times are local (unless otherwise noted)
New eruption with discolored water, ejecta, and floating pumice during October-December 2023
Ioto (Iwo-jima), located about 1,200 km S of Tokyo, lies within a 9-km-wide submarine caldera along the Izu-Bonin-Mariana volcanic arc. Previous eruptions date back to 1889 and have consisted of dominantly phreatic explosions, pumice deposits during 2001, and discolored water. A submarine eruption during July through December 2022 was characterized by discolored water, pumice deposits, and gas emissions (BGVN 48:01). This report covers a new eruption during October through December 2023, which consisted of explosions, black ejecta, discolored water, and floating pumice, based on information from the Japan Meteorological Association (JMA), the Japan Coast Guard (JCG), and satellite data.
JMA reported that an eruption had been occurring offshore of Okinahama on the SE side of the island since 21 October, which was characterized by volcanic tremor, according to the Japan Maritime Self-Defense Force (JMSDF) Iwo Jima Air Base (figure 22). According to an 18 October satellite image a plume of discolored water at the site of this new eruption extended NE (figure 23). During an overflight conducted on 30 October, a vent was identified about 1 km off the coast of Okinahama. Observers recorded explosions every few minutes that ejected dark material about 20 m above the ocean and as high as 150 m. Ejecta from the vent formed a black-colored island about 100 m in diameter, according to observations conducted from the air by the Earthquake Research Institute of the University of Tokyo in cooperation with the Mainichi newspaper (figure 24). Occasionally, large boulders measuring more than several meters in size were also ejected. Observations from the Advanced Land Observing Satellite Daichi-2 and Sentinel-2 satellite images also confirmed the formation of this island (figure 23). Brown discolored water and floating pumice were present surrounding the island.
The eruption continued during November. During an overflight on 3 November observers photographed the island and noted that material was ejected 169 m high, according to a news source. Explosions gradually became shorter, and, by the 3rd, they occurred every few seconds; dark and incandescent material were ejected about 800 m above the vent. On 4 November eruptions were accompanied by explosive sounds. Floating, brown-colored pumice was present in the water surrounding the island. There was a brief increase in the number of volcanic earthquakes during 8-14 November and 24-25 November. The eruption temporarily paused during 9-11 November and by 12 November eruptions resumed to the W of the island. On 10 November dark brown-to-dark yellow-green discolored water and a small amount of black floating material was observed (figure 25). A small eruption was reported on 18 November off the NE coast of the island, accompanied by white gas-and-steam plumes (figure 23). Another pause was recorded during 17-19 November, which then resumed on 20 November and continued erupting intermittently. According to a field survey conducted by the National Institute for Disaster Prevention Science and Technology on 19 November, a 30-m diameter crater was visible on the NE coast where landslides, hot water, and gray volcanic ash containing clay have occurred and been distributed previously. Erupted blocks about 10 cm in diameter were distributed about 90-120 m from the crater. JCG made observations during an overflight on 23 November and reported a phreatomagmatic eruption. Explosions at the main vent generated dark gas-and-ash plumes that rose to 200 m altitude and ejected large blocks that landed on the island and in the ocean (figure 26). Discolored water also surrounded the island. The size of the new island had grown to 450 m N-S x 200 m E-W by 23 November, according to JCG.
The eruption continued through 11 December, followed by a brief pause in activity, which then resumed on 31 December, according to JMA. Intermittent explosions produced 100-m-high black plumes at intervals of several minutes to 30 minutes during 1-10 December. Overflights were conducted on 4 and 15 December and reported that the water surrounding the new island was discolored to dark brown-to-dark yellow-green (figure 27). No floating material was reported during this time. In comparison to the observations made on 23 November, the new land had extended N and part of it had eroded away. In addition, analysis by the Geospatial Information Authority of Japan using SAR data from Daichi-2 also confirmed that the area of the new island continued to decrease between 4 and 15 December. Ejected material combined with wave erosion transformed the island into a “J” shape, 500-m-long and with the curved part about 200 m offshore of Ioto. The island was covered with brown ash and blocks, and the surrounding water was discolored to greenish-brown and contained an area of floating pumice. JCG reported from an overflight on 4 December that volcanic ash-like material found around the S vent on the NE part of the island was newly deposited since 10 November (figure 28). By 15 December the N part of the “J” shaped island had separated and migrated N, connecting to the Okinahama coast and the curved part of the “J” had eroded into two smaller islands (figure 27).
References. Ukawa, M., Fujita, E., Kobayashi, T., 2002, Recent volcanic activity of Iwo Jima and the 2001 eruption, Monthly Chikyu, Extra No. 39, 157-164.
Geologic Background. Ioto, in the Volcano Islands of Japan, lies within a 9-km-wide submarine caldera. The volcano is also known as Ogasawara-Iojima to distinguish it from several other "Sulfur Island" volcanoes in Japan. The triangular, low-elevation, 8-km-long island narrows toward its SW tip and has produced trachyandesitic and trachytic rocks that are more alkalic than those of other volcanoes in this arc. The island has undergone uplift for at least the past 700 years, accompanying resurgent doming of the caldera; a shoreline landed upon by Captain Cook's surveying crew in 1779 is now 40 m above sea level. The Motoyama plateau on the NE half of the island consists of submarine tuffs overlain by coral deposits and forms the island's high point. Many fumaroles are oriented along a NE-SW zone cutting through Motoyama. Numerous recorded phreatic eruptions, many from vents on the W and NW sides of the island, have accompanied the uplift.
Information Contacts: Japan Meteorological Agency (JMA), 1-3-4 Otemachi, Chiyoda-ku, Tokyo 100-8122, Japan (URL: http://www.jma.go.jp/jma/indexe.html); Japan Coast Guard (JCG) Volcano Database, Hydrographic and Oceanographic Department, 3-1-1, Kasumigaseki, Chiyoda-ku, Tokyo 100-8932, Japan (URL: https://www1.kaiho.mlit.go.jp/GIJUTSUKOKUSAI/kaiikiDB/kaiyo22-2.htm); Copernicus Browser, Copernicus Data Space Ecosystem, European Space Agency (URL: https://dataspace.copernicus.eu/browser/); Asahi, 5-3-2, Tsukiji, Chuo Ward, Tokyo, 104-8011, Japan (URL: https://www.asahi.com/ajw/articles/15048458).
Purace (Colombia) — December 2023 Cite this Report
Purace
Colombia
2.3095°N, 76.3948°W; summit elev. 4650 m
All times are local (unless otherwise noted)
Gas-and-ash emission on 16 November 2023
Puracé, located in Colombia, is a stratovolcano that contains a 500-m-wide summit crater. It is part of the Los Coconucos volcanic chain that is a NW-SE trending group of seven cones and craters. The most recent eruption occurred during March 2022 that was characterized by frequent seismicity and gas-and-steam emissions (BGVN 47:06). This report covers a brief eruption during November 2023 based on monthly reports from the Popayán Observatory, part of the Servicio Geologico Colombiano (SGC).
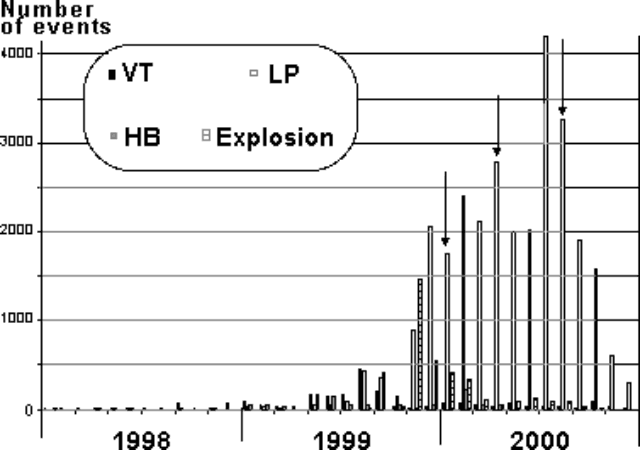
Activity during November 2022 through November 2023 primarily consisted of seismicity: VT-type events, LP-type events, HB-type events, and TR-type events (table 4). Maximum sulfur dioxide values were measured weekly and ranged from 259-5,854 tons per day (t/d) during November 2022 through April 2023. White gas-and-steam emissions were also occasionally reported.
SGC issued a report on 25 October that noted a significant increase in the number of earthquakes associated with rock fracturing. These earthquakes were located SE of the crater between Puracé and Piocollo at depths of 1-4 km. There were no reported variations in sulfur dioxide values, but SGC noted high carbon dioxide values, compared to those recorded in the first half of 2023.
SGC reported that at 1929 on 16 November the seismic network detected a signal that was possibly associated with a gas-and-ash emission, though it was not confirmed in webcam images due to limited visibility. On 17 November an observer confirmed ash deposits on the N flank. Webcam images showed an increase in degassing both inside the crater and from the NW flank, rising 700 m above the crater.
Table 4. Seismicity at Puracé during November 2022-November 2023. Volcano-tectonic (VT), long-period (LP), hybrid (HB), and tremor (TR) events are reported each month. Courtesy of SGC.
| Month |
Volcano-tectonic |
Long-period |
Hybrid |
Tremor |
| Nov 2022 |
429 |
2,023 |
5 |
831 |
| Dec 2022 |
423 |
1,390 |
9 |
834 |
| Jan 2023 |
719 |
1,622 |
0 |
957 |
| Feb 2023 |
598 |
1,701 |
2 |
1,124 |
| Mar 2023 |
331 |
2,408 |
147 |
607 |
| Apr 2023 |
614 |
4,427 |
33 |
148 |
| May 2023 |
620 |
3,717 |
170 |
109 |
| Jun 2023 |
467 |
3,293 |
86 |
148 |
| Jul 2023 |
1,116 |
5,809 |
183 |
542 |
| Aug 2023 |
692 |
2,927 |
94 |
321 |
| Sep 2023 |
887 |
1,505 |
82 |
848 |
| Oct 2023 |
2,373 |
2,949 |
135 |
692 |
| Nov 2023 |
1,212 |
2,302 |
69 |
293 |
Geologic Background. Puracé is an active andesitic volcano with a 600-m-diameter summit crater at the NW end of the Los Coconucos Volcanic Chain. This volcanic complex includes nine composite and five monogenetic volcanoes, extending from the Puracé crater more than 6 km SE to the summit of Pan de Azúcar stratovolcano. The dacitic massif which the complex is built on extends about 13 km NW-SE and 10 km NE-SW. Frequent small to moderate explosive eruptions reported since 1816 CE have modified the morphology of the summit crater, with the largest eruptions in 1849, 1869, and 1885.
Information Contacts: Servicio Geologico Colombiano (SGC), Diagonal 53 No. 34-53 - Bogotá D.C., Colombia (URL: https://www.sgc.gov.co/volcanes).
Suwanosejima (Japan) — December 2023 Cite this Report
Suwanosejima
Japan
29.638°N, 129.714°E; summit elev. 796 m
All times are local (unless otherwise noted)
Eruption plumes, crater incandescence, and occasional explosions during July-October 2023
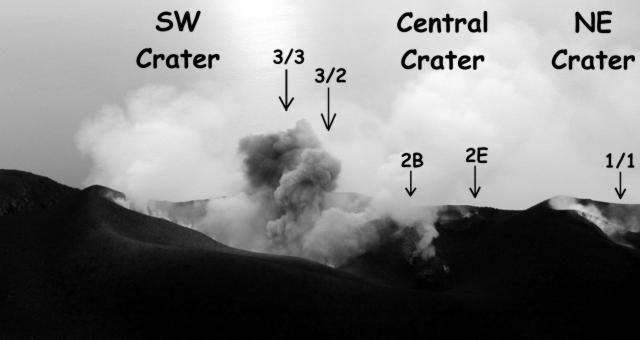
Suwanosejima is an 8-km-long island that consists of a stratovolcano and two active summit craters, located in the northern Ryukyu Islands, Japan. Volcanism over the past century has been characterized by Strombolian explosions, ash plumes, and ashfall. The current eruption began in October 2004 and has more recently consisted of frequent eruption plumes, explosions, and incandescent ejecta (BGVN 48:07). This report covers similar activity of ash plumes, explosions, and crater incandescence during July through October 2023 using monthly reports from the Japan Meteorological Agency (JMA) and satellite data.
Thermal activity during the reporting period was relatively low; only one low-power thermal anomaly was detected during mid-July and one during early August, based on a MIROVA (Middle InfraRed Observation of Volcanic Activity) Log Radiative Power graph of the MODIS thermal anomaly data. On two clear weather days, a thermal anomaly was visible in infrared satellite images (figure 81).
Low-level activity was reported at the Otake crater during July and no explosions were detected. Eruption plumes rose as high as 1.8 km above the crater. On 13 July an ash plume rose 1.7 km above the crater rim, based on a webcam image. During the night of the 28th crater incandescence was visible in a webcam image. An eruptive event reported on 31 July produced an eruption plume that rose 2.1 km above the crater. Seismicity consisted of 11 volcanic earthquakes on the W flank, the number of which had decreased compared to June (28) and 68 volcanic earthquakes near the Otake crater, which had decreased from 722 in the previous month. According to observations conducted by the University of Tokyo Graduate School of Science, Kyoto University Disaster Prevention Research Institute, Toshima Village, and JMA, the amount of sulfur dioxide emissions released during the month was 400-800 tons per day (t/d).
Eruptive activity in the Otake crater continued during August and no explosions were reported. An eruptive event produced a plume that rose 1 km above the crater at 1447 on 12 August. Subsequent eruptive events were recorded at 0911 on 16 August, at 1303 on 20 August, and at 0317 on 21 August, which produced ash plumes that rose 1-1.1 km above the crater and drifted SE, SW, and W. On 22 August an ash plume was captured in a webcam image rising 1.4 km above the crater (figure 82). Multiple eruptive events were detected on 25 August at 0544, 0742, 0824, 1424, and 1704, which generated ash plumes that rose 1.1-1.2 km above the crater and drifted NE, W, and SW. On 28 August a small amount of ashfall was observed as far as 1.5 km from the crater. There were 17 volcanic earthquakes recorded on the W flank of the volcano and 79 recorded at the Otake crater during the month. The amount of sulfur dioxide emissions released during the month was 400-800 t/d.
Activity continued at the Otake crater during September. Occasionally, nighttime crater incandescence was observed in webcam images and ashfall was reported. An eruptive event at 1949 on 4 September produced an ash plume that rose 1 km above the crater and drifted SW. On 9 September several eruption events were detected at 0221, 0301, and 0333, which produced ash plumes that rose 1.1-1.4 km above the crater rim and drifted W; continuous ash emissions during 0404-0740 rose to a maximum height of 2 km above the crater rim (figure 83). More eruptive events were reported at 1437 on 10 September, at 0319 on 11 September, and at 0511 and 1228 on 15 September, which generated ash plumes that rose 1-1.8 km above the crater. During 25, 27, and 30 September, ash plumes rose as high as 1.3 km above the crater rim. JMA reported that large blocks were ejected as far as 300 m from the center of the crater. There were 18 volcanic earthquakes detected beneath the W flank and 82 volcanic earthquakes detected near the Otake crater. The amount of sulfur dioxide released during the month ranged from 600 to 1,600 t/d.
Activity during early-to-mid-October consisted of occasional explosions, a total number of 13, and ash plumes that rose as high as 1.9 km above the Otake crater rim on 29 October (figure 84). These explosions are the first to have occurred since June 2023. Continuous ash emissions were reported during 0510-0555 on 1 October. Explosions were recorded at 0304, 2141, and 2359 on 2 October, at 0112 on 3 October, and at 1326 on 6 October, which produced ash plumes that rose as high as 1 km above the crater rim and drifted SW and W. An explosion was noted at 0428 on 3 October, but emission details were unknown. A total of eight explosions were recorded by the seismic network at 1522 on 14 October, at 0337, 0433, 0555, 1008, and 1539 on 15 October, and at 0454 and 0517 on 16 October. Ash plumes from these explosions rose as high as 900 m above the crater and drifted SE. Eruptive events during 25-27 and 29-30 October generated plumes that rose as high as 1.9 km above the crater and drifted SE, S, and SW. Ash was deposited in Toshima village (3.5 km SSW). Eruptive activity occasionally ejected large volcanic blocks as far as 600 m from the crater. Nighttime crater incandescence was visible in webcams. Intermittent ashfall was reported as far as 1.5 km from the crater. There were 43 volcanic earthquakes detected on the W flank during the month, and 184 volcanic earthquakes detected near the Otake crater. The amount of sulfur dioxide emitted ranged between 400 and 900 t/d.
Geologic Background. The 8-km-long island of Suwanosejima in the northern Ryukyu Islands consists of an andesitic stratovolcano with two active summit craters. The summit is truncated by a large breached crater extending to the sea on the E flank that was formed by edifice collapse. One of Japan's most frequently active volcanoes, it was in a state of intermittent Strombolian activity from Otake, the NE summit crater, between 1949 and 1996, after which periods of inactivity lengthened. The largest recorded eruption took place in 1813-14, when thick scoria deposits covered residential areas, and the SW crater produced two lava flows that reached the western coast. At the end of the eruption the summit of Otake collapsed, forming a large debris avalanche and creating an open collapse scarp extending to the eastern coast. The island remained uninhabited for about 70 years after the 1813-1814 eruption. Lava flows reached the eastern coast of the island in 1884. Only about 50 people live on the island.
Information Contacts: Japan Meteorological Agency (JMA), 1-3-4 Otemachi, Chiyoda-ku, Tokyo 100-8122, Japan (URL: http://www.jma.go.jp/jma/indexe.html); MIROVA (Middle InfraRed Observation of Volcanic Activity), a collaborative project between the Universities of Turin and Florence (Italy) supported by the Centre for Volcanic Risk of the Italian Civil Protection Department (URL: http://www.mirovaweb.it/); Hawai'i Institute of Geophysics and Planetology (HIGP) - MODVOLC Thermal Alerts System, School of Ocean and Earth Science and Technology (SOEST), Univ. of Hawai'i, 2525 Correa Road, Honolulu, HI 96822, USA (URL: http://modis.higp.hawaii.edu/); Copernicus Browser, Copernicus Data Space Ecosystem, European Space Agency (URL: https://dataspace.copernicus.eu/browser/).
Etna
Italy
37.748°N, 14.999°E; summit elev. 3357 m
All times are local (unless otherwise noted)
Strombolian explosions, lava fountains, and lava flows during July-August 2023
Etna, located on the Italian island of Sicily, has had documented eruptions dating back to 1500 BCE. Activity typically originates from multiple cones at the summit, where several craters have formed and evolved. The currently active craters are Northeast Crater (NEC), Voragine (VOR), and Bocca Nuova (BN), and the Southeast Crater (SEC); VOR and BN were previously referred to as the “Central Crater”. The original Southeast crater formed in 1978, and a second eruptive site that opened on its SE flank in 2011 was named the New Southeast Crater (NSEC). Another eruptive site between the SEC and NSEC developed during early 2017 and was referred to as the "cono della sella" (saddle cone). The current eruption period began in November 2022 and has been characterized by intermittent Strombolian activity, lava flows, and ash plumes (BGVN 48:08). This report updates activity during July through October 2023, which includes primarily gas-and-steam emissions; during July and August Strombolian explosions, lava fountains, and lava flows were reported, based on weekly and special reports by the Osservatorio Etneo (OE), part of the Catania Branch of Italy's Istituo Nazionale di Geofisica e Vulcanologica (INGV) and satellite data.
Variable fumarolic degassing was reported at all summit craters (BN, VOR, NEC, and SEC) throughout the entire reporting period (table 15). The MIROVA (Middle InfraRed Observation of Volcanic Activity) volcano hotspot detection system based on the analysis of MODIS data showed frequent low-to-moderate power thermal anomalies during the reporting period (figure 399). During mid-August there was a pulse in activity that showed an increase in the power of the anomalies due to Strombolian activity, lava fountains, and lava flows. Infrared satellite imagery captured strong thermal anomalies at the central and southeast summit crater areas (figure 400). Accompanying thermal activity were occasional sulfur dioxide plumes that exceeded 2 Dobson Units (DUs) recorded by the TROPOMI instrument on the Sentinel-5P satellite (figure 401).
Table 15. Summary of activity at the four primary crater areas at the summit of Etna during July-October 2023. Information is from INGV weekly reports.
| Month |
Bocca Nuova (BN) |
Voragine (VOR) |
Northeast Crater (NEC) |
Southeast Crater (SEC) |
| Jul 2023 |
Continuous degassing. |
No observations. |
Weak gas emissions. |
Continuous degassing. Sporadic and weak-to-moderate ash emissions. Strombolian explosions. |
| Aug 2023 |
Continuous degassing. |
No observations. |
No observations. |
Continuous degassing. Occasional ash emissions. Strombolian activity, lava fountaining, and lava flows. |
| Sep 2023 |
Variable degassing. Crater incandescence. |
Weak fumarolic activity. |
Weak fumarolic activity. |
Variable degassing. |
| Oct 2023 |
Continuous degassing. |
Weak fumarolic activity. |
Weak fumarolic activity. |
Continuous degassing. |
Activity during July and August was relatively low and mainly consisted of degassing at the summit craters, particularly at SEC and BN. Cloudy weather prevented clear views of the summit during early July. During the night of 2 July some crater incandescence was visible at SEC. Explosive activity resumed at SEC during 9-10 July, which was characterized by sporadic and weak ash emissions that rapidly dispersed in the summit area (figure 402). INGV reported moderate Strombolian activity began at 2034 on 14 July and was confined to the inside of the crater and fed by a vent located in the E part of SEC. An ash emission was detected at 2037. A new vent opened on 15 July in the SE part of BN and began to produce continuous gas-and-steam emissions. During an inspection carried out on 28 July pulsating degassing, along with audible booms, were reported at two active vents in BN. Vigorous gas-and-steam emissions intermittently generated rings. On rare occasions, fine, reddish ash was emitted from BN1 and resuspended by the gas-and-steam emissions.
Around 2000 on 13 August INGV reported a sudden increase in volcanic tremor amplitude. Significant infrasonic activity coincided with the tremor increase. Incandescent flashes were visible through the cloud cover in webcam images of SEC (figure 403). Strombolian activity at SEC began to gradually intensify starting at 2040 as seismicity continued to increase. The Aviation Color Code (ACC) was raised to Yellow (the second lowest-level on a four-color scale) at 2126 and then to Orange (the second highest-level on a four-color scale) at 2129 due to above-background activity. The activity rapidly transitioned from Strombolian activity to lava fountains around 2333 that rose 300-400 m above the crater (figure 403). Activity was initially focused on the E vent of the crater, but then the vent located above the S flank of the cone also became active. A lava flow from this vent traveled SW into the drainage created on 10 February 2022, overlapping with previous flows from 10 and 21 February 2022 and 21 May 2023, moving between Monte Barbagallo and Monte Frumento Supino (figure 404). The lava flow was 350 m long, oriented NNE-SSW, and descended to an elevation of 2.8 km. Flows covered an area of 300,000 m2 and had an estimated volume of 900,000 m3. The ACC was raised to Red at 2241 based on strong explosive activity and ashfall in Rifugio Sapienza-Piano Vetore at 1.7 km elevation on the S flank. INGV reported that pyroclastic flows accompanied this activity.
Activity peaked between 0240 and 0330 on 14 August, when roughly 5-6 vents erupted lava fountains from the E to SW flank of SEC. The easternmost vents produced lava fountains that ejected material strongly to the E, which caused heavy fallout of incandescent pyroclastic material on the underlying flank, triggering small pyroclastic flows. This event was also accompanied by lightning both in the ash column and in the ash clouds that were generated by the pyroclastic flows. A fracture characterized by a series of collapse craters (pit craters) opened on the upper SW flank of SEC. An ash cloud rose a few kilometers above the crater and drifted S, causing ash and lapilli falls in Rifugio Sapienza and expanding toward Nicolosi, Mascalucia, Catania, and up to Syracuse. Ashfall resulted in operational problems at the Catania airport (50 km S), which lasted from 0238 until 2000. By 0420 the volcanic tremor amplitude values declined to background levels. After 0500 activity sharply decreased, although the ash cloud remained for several hours and drifted S. By late morning, activity had completely stopped. The ACC was lowered to Orange as volcanic ash was confined to the summit area. Sporadic, minor ash emissions continued throughout the day. At 1415 the ACC was lowered to Yellow and then to Green at 1417.
During the night of 14-15 August only occasional flashes were observed, which were more intense during avalanches of material inside the eruptive vents. Small explosions were detected at SEC at 2346 on 14 August and at 0900 on 26 August that each produced ash clouds which rapidly dispersed into the atmosphere (figure 405). According to a webcam image, an explosive event detected at 2344 at SEC generated a modest ash cloud that was rapidly dispersed by winds. The ACC was raised to Yellow at 2355 on 14 August due to increasing unrest and was lowered to Green at 0954 on 15 August.
Activity during September and October was relatively low and mainly characterized by variable degassing from BN and SEC. Intense, continuous, and pulsating degassing was accompanied by roaring sounds and flashes of incandescence at BN both from BN1 and the new pit crater that formed during late July (figure 406). The degassing from the new pit crater sometimes emitted vapor rings. Cloudy weather during 6-8 September prevented observations of the summit craters .
Geologic Background. Mount Etna, towering above Catania on the island of Sicily, has one of the world's longest documented records of volcanism, dating back to 1500 BCE. Historical lava flows of basaltic composition cover much of the surface of this massive volcano, whose edifice is the highest and most voluminous in Italy. The Mongibello stratovolcano, truncated by several small calderas, was constructed during the late Pleistocene and Holocene over an older shield volcano. The most prominent morphological feature of Etna is the Valle del Bove, a 5 x 10 km caldera open to the east. Two styles of eruptive activity typically occur, sometimes simultaneously. Persistent explosive eruptions, sometimes with minor lava emissions, take place from one or more summit craters. Flank vents, typically with higher effusion rates, are less frequently active and originate from fissures that open progressively downward from near the summit (usually accompanied by Strombolian eruptions at the upper end). Cinder cones are commonly constructed over the vents of lower-flank lava flows. Lava flows extend to the foot of the volcano on all sides and have reached the sea over a broad area on the SE flank.
Information Contacts: Sezione di Catania - Osservatorio Etneo, Istituto Nazionale di Geofisica e Vulcanologia (INGV), Sezione di Catania, Piazza Roma 2, 95123 Catania, Italy (URL: http://www.ct.ingv.it/it/); MIROVA (Middle InfraRed Observation of Volcanic Activity), a collaborative project between the Universities of Turin and Florence (Italy) supported by the Centre for Volcanic Risk of the Italian Civil Protection Department (URL: http://www.mirovaweb.it/); NASA Global Sulfur Dioxide Monitoring Page, Atmospheric Chemistry and Dynamics Laboratory, NASA Goddard Space Flight Center (NASA/GSFC), 8800 Greenbelt Road, Goddard MD 20771, USA (URL: https://so2.gsfc.nasa.gov/); Copernicus Browser, Copernicus Data Space Ecosystem, European Space Agency (URL: https://dataspace.copernicus.eu/browser/).
Aira
Japan
31.5772°N, 130.6589°E; summit elev. 1117 m
All times are local (unless otherwise noted)
Explosions, ash plumes, ash fall, and crater incandescence during July-October 2023
Aira caldera, located in the northern half of Kagoshima Bay, Japan, contains the post-caldera Sakurajima volcano. Eruptions typically originate from the Minamidake crater, and since the 8th century, ash deposits have been recorded in the city of Kagoshima (10 km W), one of Kyushu’s largest cities. The Minamidake summit cone and crater has had persistent activity since 1955; the Showa crater on the E flank has also been intermittently active since 2006. The current eruption period began during March 2017 and has recently been characterized by intermittent explosions, eruption plumes, and ashfall (BGVN 48:07). This report updates activity during July through October 2023 and describes explosive events, ash plumes, nighttime crater incandescence, and ashfall, according to monthly activity reports from the Japan Meteorological Agency (JMA) and satellite data.
Thermal activity remained at low levels during this reporting period, according to the MIROVA (Middle InfraRed Observation of Volcanic Activity) system (figure 149). There was a slight increase in the number of anomalies during September through October. Occasional thermal anomalies were visible in infrared satellite images mainly at the Minamidake crater (Vent A is located to the left and Vent B is located to the right) (figure 150).
Table 30. Number of monthly explosive events, days of ashfall, area of ash covered, and sulfur dioxide emissions from Sakurajima’s Minamidake crater at Aira during July-October 2023. Note that smaller ash events are not listed. Ashfall days were measured at Kagoshima Local Meteorological Observatory and ashfall amounts represent material covering all the Kagoshima Prefecture. Data courtesy of JMA monthly reports.
| Month |
Explosive events |
Days of ashfall |
Ashfall amount (g/m2) |
SO2 emissions (tons/day) |
| Jul 2023 |
3 |
0 |
0 |
1,600-3,200 |
| Aug 2023 |
3 |
10 |
7 |
1,800-3,300 |
| Sep 2023 |
3 |
7 |
3 |
1,600-2,300 |
| Oct 2023 |
33 |
8 |
61 |
2,200-4,200 |
JMA reported that during July, there were eight eruptions, three of which were explosion events in the Showa crater. Large blocks were ejected as far as 600 m from the Showa crater. Very small eruptions were occasionally reported at the Minamidake crater. Nighttime incandescence was observed in both the Showa and Minamidake crater. Explosions were reported on 16 July at 2314 and on 17 July at 1224 and at 1232 (figure 151). Resulting eruption plumes rose 700-2,500 m above the crater and drifted N. On 23 July the number of volcanic earthquakes on the SW flank of the volcano increased. A strong Mw 3.1 volcanic earthquake was detected at 1054 on 26 July. The number of earthquakes recorded throughout the month was 545, which markedly increased from 73 in June. No ashfall was observed at the Kagoshima Regional Meteorological Observatory during July. According to a field survey conducted during the month, the daily amount of sulfur dioxide emissions was 1,600-3,200 tons per day (t/d).
There were three eruptions reported at the Minamidake crater during August, each of which were explosive. The explosions occurred on 9 August at 0345, on 13 August at 2205, and on 31 August at 0640, which generated ash plumes that rose 800-2,000 m above the crater and drifted W. There were two eruptions detected at Showa crater; on 4 August at 2150 ejecta traveled 800 m from the Showa crater and associated eruption plumes rose 2.3 km above the crater. The explosion at 2205 on 13 August generated an ash plume that rose 2 km above the crater and was accompanied by large blocks that were ejected 600 m from the Minamidake crater (figure 152). Nighttime crater incandescence was visible in a high-sensitivity surveillance camera at both craters. Seismicity consisted of 163 volcanic earthquakes, 84 of which were detected on the SW flank. According to the Kagoshima Regional Meteorological Observatory there was a total of 7 g/m2 of ashfall over the course of 10 days during the month. According to a field survey, the daily amount of sulfur dioxide emitted was 1,800-3,300 t/d.
During September, four eruptions were reported, three of which were explosion events. These events occurred at 1512 on 9 September, at 0018 on 11 September, and at 2211 on 13 September. Resulting ash plumes generally rose 800-1,100 m above the crater. An explosion produced an ash plume at 2211 on 13 September that rose as high as 1.7 km above the crater. Large volcanic blocks were ejected 600 m from the Minamidake crater. Smaller eruptions were occasionally observed at the Showa crater. Nighttime crater incandescence was visible at the Minamidake crater. Seismicity was characterized by 68 volcanic earthquakes, 28 of which were detected beneath the SW flank. According to the Kagoshima Regional Meteorological Observatory there was a total of 3 g/m2 of ashfall over the course of seven days during the month. A field survey reported that the daily amount of sulfur dioxide emitted was 1,600-2,300 t/d.
Eruptive activity during October consisted of 69 eruptions, 33 of which were described as explosive. These explosions occurred during 4 and 11-21 October and generated ash plumes that rose 500-3,600 m above the crater and drifted S, E, SE, and N. On 19 October at 1648 an explosion generated an ash plume that rose 3.6 km above the crater (figure 153). No eruptions were reported in the Showa crater; white gas-and-steam emissions rose 100 m above the crater from a vent on the N flank. Nighttime incandescence was observed at the Minamidake crater. On 24 October an eruption was reported from 0346 through 0430, which included an ash plume that rose 3.4 km above the crater. Ejected blocks traveled 1.2 km from the Minamidake crater. Following this eruption, small amounts of ashfall were observed from Arimura (4.5 km SE) and a varying amount in Kurokami (4 km E) (figure 154). The number of recorded volcanic earthquakes during the month was 190, of which 14 were located beneath the SW flank. Approximately 61 g/m2 of ashfall was reported over eight days of the month. According to a field survey, the daily amount of sulfur dioxide emitted was 2,200-4,200 t/d.
Geologic Background. The Aira caldera in the northern half of Kagoshima Bay contains the post-caldera Sakurajima volcano, one of Japan's most active. Eruption of the voluminous Ito pyroclastic flow accompanied formation of the 17 x 23 km caldera about 22,000 years ago. The smaller Wakamiko caldera was formed during the early Holocene in the NE corner of the caldera, along with several post-caldera cones. The construction of Sakurajima began about 13,000 years ago on the southern rim and built an island that was joined to the Osumi Peninsula during the major explosive and effusive eruption of 1914. Activity at the Kitadake summit cone ended about 4,850 years ago, after which eruptions took place at Minamidake. Frequent eruptions since the 8th century have deposited ash on the city of Kagoshima, located across Kagoshima Bay only 8 km from the summit. The largest recorded eruption took place during 1471-76.
Information Contacts: Japan Meteorological Agency (JMA), 1-3-4 Otemachi, Chiyoda-ku, Tokyo 100-8122, Japan (URL: http://www.jma.go.jp/jma/indexe.html); MIROVA (Middle InfraRed Observation of Volcanic Activity), a collaborative project between the Universities of Turin and Florence (Italy) supported by the Centre for Volcanic Risk of the Italian Civil Protection Department (URL: http://www.mirovaweb.it/); Copernicus Browser, Copernicus Data Space Ecosystem, European Space Agency (URL: https://dataspace.copernicus.eu/browser/).
Nishinoshima (Japan) — November 2023 Cite this Report
Nishinoshima
Japan
27.247°N, 140.874°E; summit elev. 100 m
All times are local (unless otherwise noted)
Gray emissions during October 2023
Nishinoshima is a small island in the Ogasawara Arc, about 1,000 km S of Tokyo, Japan. It contains prominent submarine peaks to the S, W, and NE. Recorded eruptions date back to 1973, with the current eruption period beginning in October 2022. Eruption plumes and fumarolic activity characterize recent activity (BGVN 48:10). This report covers the end of the eruption for September through October 2023, based on information from monthly reports of the Japan Meteorological Agency (JMA) monthly reports, and satellite data.
No eruptive activity was reported during September 2023, although JMA noted that the surface temperature was slightly elevated compared to the surrounding area since early March 2023. The Japan Coast Guard (JCG) conducted an overflight on 20 September and reported white gas-and-steam plumes rising 3 km above the central crater of the pyroclastic cone, as well as multiple white gas-and-steam emissions emanating from the N, E, and S flanks of the crater to the coastline. In addition, dark reddish brown-to-green discolored water was distributed around almost the entire circumference of the island.
Similar low-level activity was reported during October. Multiple white gas-and-steam emissions rose from the N, E, and S flanks of the central crater of the pyroclastic cone and along the coastline; these emissions were more intense compared to the previous overflight observations. Dark reddish brown-to-green discolored water remained visible around the circumference of the island. On 4 October aerial observations by JCG showed a small eruption consisting of continuous gas-and-steam emissions emanating from the central crater, with gray emissions rising to 1.5 km altitude (figure 129). According to observations from the marine weather observation vessel Keifu Maru on 26 October, white gas-and-steam emissions persisted from the center of the pyroclastic cone, as well as from the NW, SW, and SE coasts of the island for about five minutes. Slightly discolored water was visible up to about 1 km.
Frequent low-to-moderate power thermal anomalies were recorded in the MIROVA graph (Middle InfraRed Observation of Volcanic Activity) during September (figure 130). Occasional anomalies were detected during October, and fewer during November through December. A thermal anomaly was visible in the crater using infrared satellite imagery on 6, 8, 11, 16, 18, 21, and 23 September and 8, 13, 21, 26, and 28 October (figure 131).
Geologic Background. The small island of Nishinoshima was enlarged when several new islands coalesced during an eruption in 1973-74. Multiple eruptions that began in 2013 completely covered the previous exposed surface and continued to enlarge the island. The island is the summit of a massive submarine volcano that has prominent peaks to the S, W, and NE. The summit of the southern cone rises to within 214 m of the ocean surface 9 km SSE.
Information Contacts: Japan Meteorological Agency (JMA), 1-3-4 Otemachi, Chiyoda-ku, Tokyo 100-8122, Japan (URL: http://www.jma.go.jp/jma/indexe.html); MIROVA (Middle InfraRed Observation of Volcanic Activity), a collaborative project between the Universities of Turin and Florence (Italy) supported by the Centre for Volcanic Risk of the Italian Civil Protection Department (URL: http://www.mirovaweb.it/); Copernicus Browser, Copernicus Data Space Ecosystem, European Space Agency (URL: https://dataspace.copernicus.eu/browser/).
Kilauea (United States) — October 2023 Cite this Report
Kilauea
United States
19.421°N, 155.287°W; summit elev. 1222 m
All times are local (unless otherwise noted)
Strong lava fountains, lava flows, and spatter at Halema’uma’u during January-September 2023
Kīlauea is on the island of Hawai’i and overlaps the E flank of the Mauna Loa volcano. Its East Rift Zone (ERZ) has been intermittently active for at least 2,000 years. An extended eruption period began in January 1983 and was characterized by open lava lakes and lava flows from the summit caldera and the East Rift Zone. During May 2018 magma migrated into the Lower East Rift Zone (LERZ) and opened 24 fissures along a 6-km-long NE-trending fracture zone that produced lava flows traveling in multiple directions. As lava emerged from the fissures, the lava lake at Halema'uma'u drained and explosions sent ash plumes to several kilometers altitude (BGVN 43:10).
The current eruption period started during September 2021 and has been characterized by low-level lava effusions in the active Halema’uma’u lava lake (BGVN 48:01). This report covers three notable eruption periods during February, June, and September 2023 consisting of lava fountaining, lava flows, and spatter during January through September 2023 using information from daily reports, volcanic activity notices, and abundant photo, map, and video data from the US Geological Survey's (USGS) Hawaiian Volcano Observatory (HVO).
Activity during January 2023. Small earthquake swarms were recorded on 2 January 2023; increased seismicity and changes in the pattern of deformation were noted on the morning of 5 January. At around 1500 both the rate of deformation and seismicity drastically increased, which suggested magma movement toward the surface. HVO raised the Volcano Alert Level (VAL) to Watch (the second highest level on a four-level scale) and the Aviation Color Code (ACC) to Orange (the second highest color on a four-color scale) at 1520.
Multiple lava fountains and lava effusions from vents in the central eastern portion of the Halema’uma’u crater began on 5 January around 0434; activity was confined to the eastern half of the crater and within the basin of the western half of the crater, which was the focus of the eruption in 2021-2022 (figure 525). Incandescence was visible in webcam images at 1634 on 5 January, prompting HVO to raise the VAL to Warning (the highest level on a four-level scale) and the ACC to Red (the highest color on a four-color scale). Lava fountains initially rose as high as 50 m above the vent at the onset of the eruption (figure 526) but then declined to a more consistent 5-6 m height in the proceeding days. By 1930 that same day, lava had covered most of the crater floor (an area of about 1,200,000 m2) and the lava lake had a depth of 10 m. A higher-elevation island that formed during the initial phase of the December 2020 eruption remained exposed, appearing darker in images, along with a ring of older lava around the lava lake that was active prior to December 2022. Overnight during 5-6 January the lava fountains continued to rise 5 m high, and the lava effusion rate had slowed.
On 6 January at 0815 HVO lowered the VAL to Watch and the ACC to Orange due to the declining effusion rates. Sulfur dioxide emission rates ranged from 3,000-12,500 tonnes per day (t/d), the highest value of which was recorded on 6 January. Lava continued to erupt from the vents during 6-8 January, although the footprint of the active area had shrunk; a similar progression has been commonly observed during the early stages of recent eruptions at Halema’uma’u. On 9 January HVO reported one dominant lava fountain rising 6-7 m high in the E half of the crater. Lava flows built up the margins of the lake, causing the lake to be perched. On 10 January the eastern lava lake had an area of approximately 120,000 m2 that increased to 250,000 m2 by 17 January. During 13-31 January several small overflows occurred along the margins of the E lake. A smaller area of lava was active within the basin in the W half of the crater that had been the focus of activity during 2021-2022. On 19 January just after 0200 a small ooze-out was observed on the crater’s W edge.
Activity during February 2023. Activity continued in the E part of Halema’uma’u crater, as well as in a smaller basin in the W part of the 2021-2022 lava lake (figure 527). The E lava lake contained a single lava fountain and frequent overflows. HVO reported that during the morning of 1 February the large E lava lake began to cool and crust over in the center of the lake; two smaller areas of lava were observed on the N and S sides by the afternoon. The dominant lava fountain located in the S part of the lava lake paused for roughly 45 minutes at 2315 and resumed by midnight, rising 1-2 m. At 0100 on 2 February lava from the S part was effusing across the entire E lava lake area, covering the crusted over portion in the center of the lake and continuing across the majority of the previously measured 250,000 m2 by 0400. A small lava pond near the E lake produced an overflow around 0716 on 2 February. On 3 February some lava crust began to form against the N and E levees, which defined the 250,000 m2 eastern lava lake. The small S lava fountain remained active, rising 1-6 m high during 3-9 February; around 0400 on 5 February occasional bursts doubled the height of the lava fountain.
A large breakout occurred overnight during 2100 on 4 February to 0900 on 5 February on the N part of the crater floor, equal to or slightly larger in size than the E lava lake. A second, smaller lava fountain appeared in the same area of the E lava lake between 0300 and 0700 on 5 February and was temporarily active. This large breakout continued until 7 February. A small, brief breakout was reported in the S of the E lava lake around midnight on 7 February. In the W lake, as well as the smaller lava pond in the central portion of the crater floor, contained several overflows during 7-10 February and intermittent fountaining. Activity at the S small lava pond and the small S lava fountain within the E lake declined during 9-10 February. The lava pond in the central portion of the crater floor had nearly continuous, expansive flows during 10-13 February; channels from the small central lava pond seemed to flow into the larger E lake. During 13-18 February a small lava fountain was observed in the small lava pond in the central portion of the crater floor. Continuous overflows persisted during this time.
Activity in the eastern and central lakes began to decline in the late afternoon of 17 February. By 18 February HVO reported that the lava effusions had significantly declined, and that the eastern and central lakes were no longer erupting. The W lake in the basin remained active but at a greatly reduced level that continued to decline. HVO reported that this decrease in activity is attributed to notable deflationary tilt that began early on the morning of 17 February and lasted until early 19 February. By 19 February the W lake was mostly crusted over although some weak lava flows remained, which continued through 28 February. The sulfur dioxide emission rates ranged 250-2,800 t/d, the highest value of which was recorded on 6 February.
Activity during March 2023. The summit eruption at Halema’uma’u crater continued at greatly reduced levels compared to the previous two months. The E and central vents stopped effusing lava, and the W lava lake remained active with weak lava flows; the lake was mostly crusted over, although slowly circulating lava intermittently overturned the crust. By 6 March the lava lake in the W basin had stopped because the entire surface was crusted over. The only apparent surface eruptive activity during 5-6 March was minor ooze-outs of lava onto the crater floor, which had stopped by 7 March. Several hornitos on the crater floor still glowed through 12 March according to overnight webcam images, but they did not erupt any lava. A small ooze-out of lava was observed just after 1830 in the W lava lake on 8 March, which diminished overnight. The sulfur dioxide emission rate ranged from 155-321 t/d on 21 March. The VAL was lowered to Advisory, and the ACC was lowered to Yellow (the second lowest on a four-color scale) on 23 March due to a pause in the eruption since 7 March.
Activity during April-May 2023. The eruption at Halema’uma’u crater was paused; no lava effusions were visible on the crater floor. Sulfur dioxide emission rates ranged from 75-185 t/d, the highest of which was measured on 22 April. During May and June summit seismicity was elevated compared to seismicity that preceded the activity during January.
Activity during June 2023. Earthquake activity and changes in the patterns of ground deformation beneath the summit began during the evening of 6 June. The data indicated magma movement toward the surface, prompting HVO to raise the VAL to Watch and the ACC to Orange. At about 0444 on 7 June incandescence in Halema’uma’u crater was visible in webcam images, indicating that a new eruption had begun. HVO raised the VAL to Warning and the ACC to Red (the highest color on a four-color scale). Lava flowed from fissures that had opened on the crater floor. Multiple minor lava fountains were active in the central E portion of the Halema’uma’u crater, and one vent opened on the W wall of the caldera (figure 528). The eruptive vent on the SW wall of the crater continued to effuse into the lava lake in the far SW part of the crater (figure 529). The largest lava fountain consistently rose 15 m high; during the early phase of the eruption, fountain bursts rose as high as 60 m. Lava flows inundated much of the crater floor and added about 6 m depth of new lava within a few hours, covering approximately 10,000 m2. By 0800 on 7 June lava filled the crater floor to a depth of about 10 m. During 0800-0900 the sulfur dioxide emission rate was about 65,000 t/d. Residents of Pahala (30 km downwind of the summit) reported minor deposits of fine, gritty ash and Pele’s hair. A small spatter cone had formed at the vent on the SW wall by midday, and lava from the cone was flowing into the active lava lake. Fountain heights had decreased from the onset of the eruption and were 4-9 m high by 1600, with occasional higher bursts. Inflation switched to deflation and summit earthquake activity greatly diminished shortly after the eruption onset.
At 0837 on 8 June HVO lowered the VAL to Watch and the ACC to Orange because the initial high effusion rates had declined, and no infrastructure was threatened. The surface of the lava lake had dropped by about 2 m, likely due to gas loss by the morning of 8 June. The drop left a wall of cooled lava around the margins of the crater floor. Lava fountain heights decreased during 8-9 June but continued to rise to 10 m high. Active lava and vents covered much of the W half of Halema’uma’u crater in a broad, horseshoe-shape around a central, uplifted area (figure 530). The preliminary average effusion rate for the first 24 hours of the eruption was about 150 cubic meters per second, though the estimate did not account for vesiculated lava and variations in crater floor topography. The effusion rate during the very earliest phases of the eruption appeared significantly higher than the previous three summit eruptions based on the rapid coverage of the entire crater floor. An active lava lake, also referred to as the “western lava lake” was centered within the uplifted area and was fed by a vent in the NE corner. Two small active lava lakes were located just SE from the W lava lake and in the E portion of the crater floor.
During 8-9 June the lava in the central lava lake had a thickness of approximately 1.5 m, based on measurements from a laser rangefinder. During 9-12 June the height of the lava fountains decreased to 9 m high. HVO reported that the previously active lava lake in the E part of the crater appeared stagnant during 10-11 June. The surface of the W lake rose approximately 1 m overnight during 11-12 June, likely due to the construction of a levee around it. Only a few small fountains were active during 12-13 June; the extent of the active lava had retreated so that all activity was concentrated in the SW and central parts of Halema’uma’u crater. Intermittent spattering from the vent on the SW wall was visible in overnight webcam images during 13-18 June. On the morning of 14 June a weak lava effusion originated from near the western eruptive vent, but by 15 June there were no signs of continued activity. HVO reported that other eruptive vents in the SW lava lake had stopped during this time, following several days of waning activity; lava filled the lake by about 0.5 m. Lava circulation continued in the central lake and no active lava was reported in the northern or eastern parts of the crater. Around 0800 on 15 June the top of the SW wall spatter cone collapsed, which was followed by renewed and constant spattering from the top vent and a change in activity from the base vent; several new lava flows effused from the top of the cone, as well as from the pre-existing tube-fed flow from its base. Accumulation of lava on the floor resulted in a drop of the central basin relative to the crater floor, allowing several overflows from the SW lava lake to cascade into the basin during the night of 15 June into the morning of 16 June.
Renewed lava fountaining was reported at the eruptive vent on the SW side of the crater during 16-19 June, which effused lava into the far SW part of the crater. This activity was described as vigorous during midday on 16 June; a group of observatory geologists estimated that the lava was consistently ejected at least 10 m high, with some spatter ejected even higher and farther. Deposits from the fountain further heightened and widened the spatter cone built around the original eruptive vent in the lower section of the crater wall. Multiple lava flows from the base of the cone were fed into the SW lava lake and onto the southwestern-most block from the 2018 collapse within Halema’uma’u on 17 June (figure 531); by 18 June they focused into a single flow feeding into the SW lava lake. On the morning of 19 June a second lava flow from the base of the eruptive cone advanced into the SW lava lake.
Around 1600 on 19 June there was a rapid decline in lava fountaining and effusion at the eruptive vent on the SW side of the crater; vent activity had been vigorous up to that point (figure 532). Circulation in the lava lake also slowed, and the lava lake surface dropped by several meters. Overnight webcam images showed some previously eruptive lava still flowing onto the crater floor, which continued until those flows began to cool. By 21 June no lava was erupting in Halema’uma’u crater. Overnight webcam images during 29-30 June showed some incandescence from previously erupted lava flows as they continued to cool. Seismicity in the crater declined to low levels. Sulfur dioxide emission rates ranged 160-21,000 t/d throughout the month, the highest measurement of which was recorded on 8 June. On 30 June the VAL was lowered to Advisory (the second level on a four-level scale) and the ACC was lowered to Yellow. Gradual inflation was detected at summit tiltmeters during 19-30 June.
Activity during July-August 2023. During July, the eruption paused; no lava was erupting in Halema’uma’u crater. Nighttime webcam images showed some incandescence from previously erupted lava as it continued to cool on the crater floor. During the week of 14 August HVO reported that the rate in seismicity increased, with 467 earthquakes of Mw 3.2 and smaller occurring. Sulfur dioxide emission rates remained low, ranging from 75-86 t/d, the highest of which was recorded on 10 and 15 August. On 15 August beginning at 0730 and lasting for several hours, a swarm of approximately 50 earthquakes were detected at a depth of 2-3 km below the surface and about 2 km long directly S of Halema’uma’u crater. HVO reported that this was likely due to magma movement in the S caldera region. During 0130-0500 and 1700-2100 on 21 August two small earthquake swarms of approximately 20 and 25 earthquakes, respectively, occurred at the same location and at similar depths. Another swarm of 50 earthquakes were recorded during 0430-0830 on 23 August. Elevated seismicity continued in the S area through the end of the month.
Activity during September 2023. Elevated seismicity persisted in the S summit with occasional small, brief seismic swarms. Sulfur dioxide measurements were relatively low and were 70 t/d on 8 September. About 150 earthquakes occurred during 9-10 September, and tiltmeter and Global Positioning System (GPS) data showed inflation in the S portion of the crater.
At 0252 on 10 September HVO raised the VAL to Watch and the ACC to Orange due to increased earthquake activity and changes in ground deformation that indicated magma moving toward the surface. At 1515 the summit eruption resumed in the E part of the caldera based on field reports and webcam images. Fissures opened on the crater floor and produced multiple minor lava fountains and flows (figure 533). The VAL and ACC were raised to Warning and Red, respectively. Gas-and-steam plumes rose from the fissures and drifted downwind. A line of eruptive vents stretched approximately 1.4 km from the E part of the crater into the E wall of the down dropped block by 1900. The lava fountains at the onset of the eruption had an estimated 50 m height, which later rose 20-25 m high. Lava erupted from fissures on the down dropped block and expanded W toward Halema’uma’u crater. Data from a laser rangefinder recorded about 2.5 m thick of new lava added to the W part of the crater. Sulfur dioxide emissions were elevated in the eruptive area during 1600-1500 on 10 September, measuring at least 100,000 t/d.
At 0810 on 11 September HVO lowered the VAL and ACC back to Watch and Orange due to the style of eruption and the fissure location had stabilized. The initial extremely high effusion rates had declined (but remained at high levels) and no infrastructure was threatened. An eruption plume, mainly comprised of sulfur dioxide and particulates, rose as high as 3 km altitude. Several lava fountains were active on the W side of the down dropped block during 11-15 September, while the easternmost vents on the down dropped block and the westernmost vents in the crater became inactive on 11 September (figure 534). The remaining vents spanned approximately 750 m and trended roughly E-W. The fed channelized lava effusions flowed N and W into Halema’uma’u. The E rim of the crater was buried by new lava flows; pahoehoe lava flows covered most of the crater floor except areas of higher elevation in the SW part of the crater. The W part of the crater filled about 5 m since the start of the eruption, according to data from a laser rangefinder during 11-12 September. Lava fountaining continued, rising as high as 15 m by the morning of 12 September. During the morning of 13 September active lava flows were moving on the N and E parts of the crater. The area N of the eruptive vents that had active lava on its surface became perched and was about 3 m higher than the surrounding ground surface. By the morning of 14 September active lava was flowing on the W part of the down dropped block and the NE parts of the crater. The distances of the active flows progressively decreased. Spatter had accumulated on the S (downwind) side of the vents, forming ramparts about 20 m high.
Vigorous spattering was restricted to the westernmost large spatter cone with fountains rising 10-15 m high. Minor spattering occurred within the cone to the E of the main cone, but HVO noted that the fountains remained mostly below the rim of the cone. Lava continued to effuse from these cones and likely from several others as well, traveled N and W, confined to the W part of the down-dropped block and the NE parts of Halema’uma’u. Numerous ooze-outs of lava were visible over other parts of the crater floor at night. Laser range-finder measurements taken of the W part of the crater during 14-15 September showed that lava filled the crater by 10 m since the start of the eruption. Sulfur dioxide emissions remained elevated after the onset of the eruption, ranging 20,000-190,000 t/d during the eruption activity, the highest of which occurred on 10 September.
Field crews observed the eruptive activity on 15 September; they reported a notable decrease or stop in activity at several vents. Webcam images showed little to no fountaining since 0700 on 16 September, though intermittent spattering continued from the westernmost large cone throughout the night of 15-16 September. Thermal images showed that lava continued to flow onto the crater floor. On 16 September HVO reported that the eruption stopped around 1200 and that there was no observable activity anywhere overnight or on the morning of 17 September. HVO field crews reported that active lava was no longer flowing onto Halema’uma’u crater floor and was restricted to a ponded area N of the vents on the down dropped block. They reported that spattering stopped around 1115 on 16 September. Nighttime webcam images showed some incandescence on the crater floor as lava continued to cool. Field observations supported by geophysical data showed that eruptive tremor in the summit region decreased over 15-16 September and returned to pre-eruption levels by 1700 on 16 September. Sulfur dioxide emissions were measured at a rate of 800 t/d on 16 September while the eruption was waning, and 200 t/d on 17 September, which were markedly lower compared to measurements taken the previous week of 20,000-190,000 t/d.
Geologic Background. Kilauea overlaps the E flank of the massive Mauna Loa shield volcano in the island of Hawaii. Eruptions are prominent in Polynesian legends; written documentation since 1820 records frequent summit and flank lava flow eruptions interspersed with periods of long-term lava lake activity at Halemaumau crater in the summit caldera until 1924. The 3 x 5 km caldera was formed in several stages about 1,500 years ago and during the 18th century; eruptions have also originated from the lengthy East and Southwest rift zones, which extend to the ocean in both directions. About 90% of the surface of the basaltic shield volcano is formed of lava flows less than about 1,100 years old; 70% of the surface is younger than 600 years. The long-term eruption from the East rift zone between 1983 and 2018 produced lava flows covering more than 100 km2, destroyed hundreds of houses, and added new coastline.
Information Contacts: Hawaiian Volcano Observatory (HVO), U.S. Geological Survey, PO Box 51, Hawai'i National Park, HI 96718, USA (URL: http://hvo.wr.usgs.gov/).
Tinakula (Solomon Islands) — December 2023 Cite this Report
Tinakula
Solomon Islands
10.386°S, 165.804°E; summit elev. 796 m
All times are local (unless otherwise noted)
Continued lava flows and thermal activity during June through November 2023
Tinakula is a remote 3.5 km-wide island in the Solomon Islands, located 640 km ESE of the capital, Honiara. The current eruption period began in December 2018 and has more recently been characterized by intermittent lava flows and thermal activity (BGVN 48:06). This report covers similar activity during June through November 2023 using satellite data.
During clear weather days (20 July, 23 September, 23 October, and 12 November), infrared satellite imagery showed lava flows that mainly affected the W side of the island and were sometimes accompanied by gas-and-steam emissions (figure 54). The flow appeared more intense during July and September compared to October and November. According to the MODVOLC thermal alerts, there were a total of eight anomalies detected on 19 and 21 July, 28 and 30 October, and 16 November. Infrared MODIS satellite data processed by MIROVA (Middle InfraRed Observation of Volcanic Activity) detected a small cluster of thermal activity occurring during late July, followed by two anomalies during August, two during September, five during October, and five during November (figure 55).
Geologic Background. The small 3.5-km-wide island of Tinakula is the exposed summit of a massive stratovolcano at the NW end of the Santa Cruz islands. It has a breached summit crater that extends from the summit to below sea level. Landslides enlarged this scarp in 1965, creating an embayment on the NW coast. The Mendana cone is located on the SE side. The dominantly andesitic volcano has frequently been observed in eruption since the era of Spanish exploration began in 1595. In about 1840, an explosive eruption apparently produced pyroclastic flows that swept all sides of the island, killing its inhabitants. Recorded eruptions have frequently originated from a cone constructed within the large breached crater. These have left the upper flanks and the steep apron of lava flows and volcaniclastic debris within the breach unvegetated.
Information Contacts: MIROVA (Middle InfraRed Observation of Volcanic Activity), a collaborative project between the Universities of Turin and Florence (Italy) supported by the Centre for Volcanic Risk of the Italian Civil Protection Department (URL: http://www.mirovaweb.it/); Hawai'i Institute of Geophysics and Planetology (HIGP) - MODVOLC Thermal Alerts System, School of Ocean and Earth Science and Technology (SOEST), Univ. of Hawai'i, 2525 Correa Road, Honolulu, HI 96822, USA (URL: http://modis.higp.hawaii.edu/); Copernicus Browser, Copernicus Data Space Ecosystem, European Space Agency (URL: https://dataspace.copernicus.eu/browser/).
Search Bulletin Archive by Publication Date
Select a month and year from the drop-downs and click "Show Issue" to have that issue displayed in this tab.
The default month and year is the latest issue available.
Bulletin of the Global Volcanism Network - Volume 26, Number 07 (July 2001)
Bezymianny (Russia)
Explosive eruption on 7 August sends plume to ~10 km altitude
Fournaise, Piton de la (France)
11 June-7 July eruption; two lava flows block highway
Kikai (Japan)
Ashfall and volcanic tremor through July 2001
Long Valley (United States)
Decreased seismicity during 1999-2000
Merapi (Indonesia)
Volcanism continues at decreased intensity; Alert reduced from 4 to 2
Ruapehu (New Zealand)
Tremor episode peaks on 16 February, lahars predicted for near future
Soufriere Hills (United Kingdom)
29 July dome collapse and rockfalls
Stromboli (Italy)
Continued Strombolian activity during March-May 2001; crater morphology changes
Suwanosejima (Japan)
Explosive eruptions in May and July
Tungurahua (Ecuador)
Summary of August 2000-August 2001 eruptive activity
Bezymianny
Russia
55.972°N, 160.595°E; summit elev. 2882 m
All times are local (unless otherwise noted)
Explosive eruption on 7 August sends plume to ~10 km altitude
Weak fumarolic activity and gas-steam plumes, along with several small earthquakes, occurred from the latter months of the year 2000 through July 2001. AVHRR satellite data confirmed a one-pixel thermal anomaly on 20 November at 0650, and a weak thermal anomaly on 3 January.
On 23-24 July, seismic and satellite data showed gas-and-steam plumes, along with shallow earthquakes and long local seismic events that were possibly due to collapses and/or avalanches. With the beginning of an extrusive process at the dome, the level of concern was raised from Green (volcano is dormant; normal seismicity and fumarolic activity) to Orange (volcano is in eruption or eruption may occur at any time). KVERT reported that an AVHRR image at 0718 on 26 July revealed a 3-pixel thermal anomaly that had a maximum band-3 temperature of 26.8°C within a background near 8°C. The anomaly had a linear shape and SE-trend from the summit. Afterward, a weakening of activity occurred and the level of concern was lowered to Yellow (volcano is restless; eruption may occur). Intermittent weak activity, including shallow earthquakes, fumarolic activity above the dome, and long local seismic events were observed through 31 July. Weak shallow earthquakes within the volcano's edifice, along with probable collapses and avalanches were recorded during 6-9 August.
On 7 August at 1128 (6 August at 2228 UTC) an explosive eruption began. The level of concern was raised to Red (significant eruption is occurring or explosive eruption expected at any time). Spasmodic volcanic tremor up to 11.7 x 10⁻⁶ m/s was recorded until 1300. Tremor amplitude increased up to 1.0 x 10⁻⁶ m/s until 1410, then decreased. Observers in Klyuchi town reported that an ash plume 5 km above the volcano rose to 10 km by 1215, and extended to the E-SE. At the same time observers at Kozirevsk village reported that an ash plume rose 2-2.5 km above the dome and extended to the SW. At 1300 a gas-ash plume rose 2 km above the dome and extended SW 40 km. Observers at Kronoki seismic station reported an ash fall (50 g per square m). Satellite images showed a plume centered off the E coast of Kamchatka about 200 km south of Kronotsky. The plume was approximately 200 km long and 100 km wide and headed due S. A thermal anomaly showed that a viscous lava flow had formed at the dome of volcano. After the 7 August eruption through 31 August, background seismicity was recorded and occasional gas-and-steam clouds were observed. The level of concern was dropped to Green.
Geologic Background. The modern Bezymianny, much smaller than its massive neighbors Kamen and Kliuchevskoi on the Kamchatka Peninsula, was formed about 4,700 years ago over a late-Pleistocene lava-dome complex and an edifice built about 11,000-7,000 years ago. Three periods of intensified activity have occurred during the past 3,000 years. The latest period, which was preceded by a 1,000-year quiescence, began with the dramatic 1955-56 eruption. This eruption, similar to that of St. Helens in 1980, produced a large open crater that was formed by collapse of the summit and an associated lateral blast. Subsequent episodic but ongoing lava-dome growth, accompanied by intermittent explosive activity and pyroclastic flows, has largely filled the 1956 crater.
Information Contacts: Olga Chubarova, Kamchatka Volcanic Eruptions Response Team (KVERT), Institute of Volcanic Geology and Geochemistry, Piip Ave. 9, Petropavlovsk-Kamchatsky, 683006, Russia; Tom Miller, Alaska Volcano Observatory (AVO), a cooperative program of (a)U.S. Geological Survey, 4200 University Drive, Anchorage, AK 99508-4667, USA (URL: http://www.avo.alaska.edu/), b) Geophysical Institute, University of Alaska, PO Box 757320, Fairbanks, AK 99775-7320, USA, and c) Alaska Division of Geological & Geophysical Surveys, 794 University Ave., Suite 200, Fairbanks, AK 99709, USA; Tokyo VAAC, Tokyo, Japan (URL: https://ds.data.jma.go.jp/svd/vaac/data/).
Piton de la Fournaise (France) — July 2001 Cite this Report
Piton de la Fournaise
France
21.244°S, 55.708°E; summit elev. 2632 m
All times are local (unless otherwise noted)
11 June-7 July eruption; two lava flows block highway
A short seismic crisis with 126 recorded events started at Piton de la Fournaise on 11 June 2001 at 1327. At 1350 extensometer variations indicated that a new eruption had started on the ESE flank, in the same area as the previous eruption on 27 March 2001. En echelon fissures started at about 2.5 km elevation on the S flank, 200 m below the Dolomieu summit caldera. More fissures were located between 1.8 and 2 km elevation on the E flank at the southern base of crater Signal de l'Enclos and N of the Ducrot crater. Several lava flows descended the Grand Brûlé but their progression was very slow; at 1700 the front of the lava flow was still located at an elevation of ~1.5 km. On the morning of 12 June, only the lower fissure at 1.8 km elevation was still active. It was ~200 m long, with several lava fountains 20-30 m high. The lava flow followed the northern border of the 27 March lava and descended to about 400 m elevation in the Grand Brûlé.
On 16 June a cone began to form and lava fountains rose up to 30 m above the surface in an area at 1.8 km elevation. An active fissure was located on the E flank at the S base of crater Signal de l'Enclos. Tremor weakened but continued under the volcano's E flank through late June. Lava fountains were visible at two vents; at one vent strong degassing occurred, while at the other vent a boiling lava lake occasionally overflowed, sending lava towards the NE. New lava flows were observed on 29 June in the Grand Brûlé area traveling to the N. On 1 July an increase in tremor occurred for about 1 hour and was accompanied by strong degassing at the cone and a strong amount of lava emission. Several dozen small flows were visible by the next day. Tremor and the intensity of local earthquakes increased during the first week of July. The earthquakes had magnitudes less than 3 and were located under Dolomieu crater at a depth near sea level. On 6 and 7 July two aa lava flows, 80 and 100 m wide and up to 5 m high, crossed the national highway in the Grand Brûlé area (see figure 65). On the afternoon of 7 July the end of the eruption was marked by the disappearance of tremor and a dramatic decrease in the intensity of local earthquakes.
Geologic Background. Piton de la Fournaise is a massive basaltic shield volcano on the French island of Réunion in the western Indian Ocean. Much of its more than 530,000-year history overlapped with eruptions of the deeply dissected Piton des Neiges shield volcano to the NW. Three scarps formed at about 250,000, 65,000, and less than 5,000 years ago by progressive eastward slumping, leaving caldera-sized embayments open to the E and SE. Numerous pyroclastic cones are present on the floor of the scarps and their outer flanks. Most recorded eruptions have originated from the summit and flanks of Dolomieu, a 400-m-high lava shield that has grown within the youngest scarp, which is about 9 km wide and about 13 km from the western wall to the ocean on the E side. More than 150 eruptions, most of which have produced fluid basaltic lava flows, have occurred since the 17th century. Only six eruptions, in 1708, 1774, 1776, 1800, 1977, and 1986, have originated from fissures outside the scarps.
Information Contacts: Thomas Staudacher and Georges Boudon, Observatoire du Piton de la Fournaise Institut de Physique du Globe de Paris - B89, 4 Place Jussieu, 75252 Paris cedex 05, France.
Kikai
Japan
30.793°N, 130.305°E; summit elev. 704 m
All times are local (unless otherwise noted)
Ashfall and volcanic tremor through July 2001
This report covers activity through July 2001. Volcanic tremor was recorded during 20 to 23 July 2001. A seismometer about 700 m SW of Iwo-dake crater recorded 50-110 earthquakes daily, in comparison to 30-90 earthquakes recorded daily during December 2000 and March 2001. The Iwo-jima branch of the Mishima village office reported that ash fell during 19-21 July. A white plume rose to ~ 20 m above the crater. Faint ashfall and weak volcanic tremor had occurred since December 2000.
Geologic Background. Multiple eruption centers have exhibited recent activity at Kikai, a mostly submerged, 19-km-wide caldera near the northern end of the Ryukyu Islands south of Kyushu. It was the source of one of the world's largest Holocene eruptions about 6,300 years ago when rhyolitic pyroclastic flows traveled across the sea for a total distance of 100 km to southern Kyushu, and ashfall reached the northern Japanese island of Hokkaido. The eruption devastated southern and central Kyushu, which remained uninhabited for several centuries. Post-caldera eruptions formed Iodake (or Iwo-dake) lava dome and Inamuradake scoria cone, as well as submarine lava domes. Recorded eruptions have occurred at or near Satsuma-Iojima (also known as Tokara-Iojima), a small 3 x 6 km island forming part of the NW caldera rim. Showa-Iojima lava dome (also known as Iojima-Shinto), a small island 2 km E of Satsuma-Iojima, was formed during submarine eruptions in 1934 and 1935. Mild-to-moderate explosive eruptions have occurred during the past few decades from Iodake, a rhyolitic lava dome at the eastern end of Satsuma-Iojima.
Information Contacts: Volcano Research Center, Earthquake Research Institute, University of Tokyo, Yayoi 1-1-1, Bunkyo-ku, Tokyo 113-0032, Japan (URL: http://www.eri.u-tokyo.ac.jp/VRC/index_E.html).
Long Valley (United States) — July 2001 Cite this Report
Long Valley
United States
37.7°N, 118.87°W; summit elev. 3390 m
All times are local (unless otherwise noted)
Decreased seismicity during 1999-2000
The following summarizes activity at Long Valley during 1999 (Hill, 1999) and 2000 (Hill, 2000). Summaries of activity during 1996, 1997 and 1998 can be found in BGVN 22:11, 22:12, and 24:06.
Summary of activity during 1999. The lowest level of activity within Long Valley since the onset of unrest in 1979-80 occurred in 1999. Earthquake activity and ground deformation were subdued throughout the year. The two largest earthquakes within the caldera were M 2.9 and 3.1 events that occurred on 1 January beneath the S margin of the caldera (5 km ESE of Mammoth Lakes), and on 27 March beneath the S margin of the resurgent dome (9 km E of Mammoth Lakes), respectively. On 24-25 February, a swarm of ~42 small earthquakes was centered just outside the caldera 1-2 km E of Lake Mary (5 km WSW of Mammoth Lakes); the largest in this sequence were M 3.2 and 2.9 events.
Two aspects of caldera seismicity during 1999 were noteworthy. One was the abrupt decrease in seismicity rate within the caldera on 15 May coincident with a M 5.6 earthquake S of the caldera in the Sierra Nevada. The second was a brief swarm of small earthquakes beneath the N flank of Mammoth Mountain within the hour following the M 7.1 Hector Mine earthquake of 16 October, the epicenter of which was in the Mojave Desert ~430 km SE of the caldera. This latter set of events appear to be a subtle example of remote triggering similar to events in the Long Valley caldera and elsewhere following the M 7.3 Landers earthquake in June 1992. Aside from a transient response to the 16 October earthquake, deformation within the caldera remained stationary through 1999.
The rate of deep long-period (LP) "volcanic" earthquake activity beneath the W flank of Mammoth Mountain tapered off following the elevated rate that persisted through the end of 1998. Deep LP earthquakes in 1999 included ~30 events, compared to an average of ~200 events/year during 1997-98. Initial results from the analysis of data collected during a 1997 seismic experiment indicates that these LP events occurred within a N-striking planar distribution that dips steeply (roughly 80°) W at depths of 10-20 km.
Carbon dioxide (CO2) soil-gas concentrations measured at fixed depths in the Horseshoe Lake (HSL) tree-kill area continued to show annual variation with snow depth and occasional fluctuations during the snow-free months. The only notable fluctuation in CO2 concentrations during 1999 involved a three-week increase at the SKI monitoring site (near Chair 19 in the Mammoth Mountain Ski Area) that began four days after the 15 May earthquake; whether these two events are related is unclear. With respect to the cold CO2 emissions from the soils, radioactive carbon measurements on cores from trees at the margin of the HSL tree-kill area indicated that the CO2 discharge in that area has been relatively constant since about 1995. Analyses of helium isotopic composition on the N side of Mammoth Mountain showed that the trend of decreasing 3He/4He at the MMF steam vent since 1997 was interrupted by a rise in May 1999 following a period of increased LP activity in the fall of 1998.
Summary of activity during 2000. Continuing the trend set in 1999, activity levels in the Long Valley caldera and vicinity remained low throughout 2000 (figure 23). Low-level earthquake activity within the caldera was scattered beneath the S moat, the S and E margins of the resurgent dome, and Mammoth Mountain. The largest of these intra-caldera earthquakes was a M 2.3 event that occurred as part of a cluster of half a dozen small earthquakes beneath Mammoth Mountain on 27 April. Activity in the Sierra Nevada immediately S of the caldera was largely concentrated in the aftershock zone of the 8 June 1998, 14 July 1998, and 15 May 1999 earthquakes. The largest earthquake of the year in the region was a M 3.8 earthquake on 20 January located in the Sierra Nevada midway between Convict Lake and Mt. Morrison.
The rate of deep LP earthquakes beneath the W flank of Mammoth Mountain, which began in 1989-90, accelerated significantly in 1997 through early 1998, tapered off in early 1999, and increased again in mid-2000 (figure 24). The increased rate began with a burst of some 15 events in July and included several additional bursts of 5-10 events each in December. Altogether, about 50 deep LP earthquakes were recorded at depths of 10-25 km beneath Mammoth Mountain during 2000.
Two very-long-period (VLP) earthquakes were detected with hypocenters roughly 4 km beneath the summit of Mammoth Mountain; one on 6 July (0356 UTC) and the other on 13 August (0007 UTC). These two events, together with a similar event on 12 October 1996, are the only VLP earthquakes that have been detected beneath Mammoth Mountain since instrumental capability for detecting seismic events in this frequency band was acquired sometime in the 1990's. The fact that both the 6 July and 13 August VLP events were accompanied by spasmodic bursts of brittle failure earthquakes, opens the possibility that the 1989 Mammoth Mountain earthquake swarm, which included multiple episodes of spasmodic bursts, may have also included significant VLP activity. These Mammoth Mountain VLP events are similar to those beneath Kīlauea, which Bernard Chouet and colleagues interpret as the result of small slugs of magma, magmatic brine, or magmatic gas moving through a crack-like restriction. At this low rate, these VLP events do not indicate impending volcanic activity.
No significant deformation episodes were recorded during 2000. The two-color EDM data show small fluctuations about a slight contraction (subsidence) of the resurgent dome of 0.5-1.0 cm for the year. The center of the resurgent dome remains roughly 80 cm higher than in the late 1970's prior to the last two decades of caldera unrest. In contrast to Yellowstone and Campi Flegrei calderas, which showed pronounced uplift through the early 1980's followed by partial subsidence, Long Valley caldera has yet to show any significant subsidence. Rabaul, the other large caldera with well-documented deformation over the last couple of decades, showed sustained uplift at varying rates through the 1980's and early 1990's with no evidence of subsidence until the onset of eruptive activity in September 1994.
Hydrological monitoring in the caldera revealed no significant changes in water wells or stream flow that might be attributable to caldera unrest. Short-term CO2-flux variations during the snow-free months in the HSL tree-kill area appeared to be primarily related to local meteorological conditions. These measurements also show that the total CO2 flux has remained relatively steady over the past several years with no indication of a systematic decline with time. Soil-gas CO2 measured at fixed depths in the HSL tree-kill area continue to show an annual variation with snow depth and occasional temporary fluctuations during the snow-free months. The only notable fluctuation in CO2 concentrations during 2000 occurred at the Laurel Springs station (LSP), which showed a spike in late April and a number of spikes from mid-June through September. The process leading to these spikes remains to be determined. At this point, however, these spikes do not represent a hazard of the sort associated with the sustained high CO2 flux in the Mammoth Mountain tree-kill areas.
References: Hill, David P., 1999, Review of Long Valley Caldera activity for 1999: Long Valley Observatory, U.S. Geological Survey.
Hill, David P., 2000, Long Valley Observatory quarterly report October-December 2000 and annual summary for 2000: Long Valley Observatory, Volcano Hazards Program, U.S. Geological Survey.
Geologic Background. The large 17 x 32 km Long Valley caldera east of the central Sierra Nevada Range formed as a result of the voluminous Bishop Tuff eruption about 760,000 years ago. Resurgent doming in the central part of the caldera occurred shortly afterwards, followed by rhyolitic eruptions from the caldera moat and the eruption of rhyodacite from outer ring fracture vents, ending about 50,000 years ago. During early resurgent doming the caldera was filled with a large lake that left strandlines on the caldera walls and the resurgent dome island; the lake eventually drained through the Owens River Gorge. The caldera remains thermally active, with many hot springs and fumaroles, and has had significant deformation, seismicity, and other unrest in recent years. The late-Pleistocene to Holocene Inyo Craters cut the NW topographic rim of the caldera, and along with Mammoth Mountain on the SW topographic rim, are west of the structural caldera and are chemically and tectonically distinct from the Long Valley magmatic system.
Information Contacts: David Hill, Long Valley Observatory, U.S. Geological Survey, Volcano Hazards Program, MS 910, 345 Middlefield Rd., Menlo Park, CA 94025 USA (URL: https://volcanoes.usgs.gov/observatories/calvo/).
Merapi
Indonesia
7.54°S, 110.446°E; summit elev. 2910 m
All times are local (unless otherwise noted)
Volcanism continues at decreased intensity; Alert reduced from 4 to 2
After the large 10 February eruption (see BGVN 26:01), volcanic activity, including lava avalanches and pyroclastic flows, continued but decreased in intensity. Pyroclastic flows entered the Sat, Lamat, Senowo, and Bebeng rivers to a maximum runout distance of 2-3 km. High fumarole temperatures around the summit indicated that magma remained near the surface. The W and S sides of "lava dome 2001" grew and covered "lava dome 1997" to the S. Several fumaroles appeared to mark a fracture in the area of the 10 February eruption. Fractures formed in a similar manner prior to the November 1994 eruption.
The hazard status was at its highest level, 4 (on a scale of 1-4), through the week of 21-27 February 2001. The Alert Level was reduced to 3 the following week, and then to 2 during 7-13 March, where it remained through August.
Over the interval 14 February to 28 August, ash emissions rose up to ~150 m above the summit, and fumaroles emitted gas that rose up to ~950 m above the summit. Superficial earthquakes dominated the seismicity, though over time they continued to decrease in number and amplitude. Observations on 10 and 17 March revealed that high-pressure fumaroles appeared on most of the dome's surface. An observer reported that on 13 April a small amount of ash fell around the Babadan Post Observatory ~7 km W of the volcano. Activity at Merapi increased during 23-29 April, with reports of several medium-sized pyroclastic flows. Table 10 provides a more detailed description of weekly activity at Mt. Merapi from 14 February through 28 August.
Table 10. Summary of activity at Merapi from 14 February through 28 August 2001. Courtesy of VSI.
| Interval |
Description of Activity |
| 14 Feb-20 Feb 2001 |
Lava and pyroclastic flows continued but decreased in intensity, pyroclastic flows entered the Sat, Lamat, Senowo, and Bebung rivers. Maximum runut 2-3 km. Flows traveled 1.5-2.5 km to the WSW for 1-2 hours. High temperatures around Merapi indicated that magma was near the surface; the W and S sides of "lava dome bgvn_2001" grew and covered "lava dome 1997" to the S; several fumaroles appeared to mark a fracture along where the 10 February eruption occurred. |
| 21 Feb-27 Feb 2001 |
Volcanic activity decreased. Daily ash emissions rose to ~150 m above the summit. |
| 07 Mar-13 Mar 2001 |
Volcanic activity decreased, 100 avalanches per day. Maximum runout of 2.3-2.5 km SW. On 6 March a pyroclastic flow deposited material up to 1.5 km down the Sat river. |
| 14 Mar-20 Mar 2001 |
Volcanic activity continued, hot avalanches continued to enter the Sat, Senowo, Bebeng, and Lamat rivers. Maximum runout of 2.5 km in the Sat river, pyroclastic flows up to 2.75 km down the Sat, Senowo, and Bebeng rivers. Superficial earthquakes dominated the seismicity but decreased. On 19 March high-pressure fumaroles appeared on most of the dome's surface. |
| 21 Mar-27 Mar 2001 |
Volcanic activity continued. hot avalanches continued to enter the Sat, Senowo, Bebeng, and Lamat rivers. Maximum runout of 3 km in the Sat river. Pyroclastic flows traveled up to 1 km down the Sat, Senowo, and Bebeng rivers. Superficial earthquakes dominated the seismicity but decreased. On 17 March a summit visit revealed that high-pressure fumaroles remained on most of the dome's surface. |
| 11 Apr-17 Apr 2001 |
Volcanic activity continued. Lava avalanches continued to enter upstream areas of the Sat, Senowo, Lamat, and Bebeng rivers. Maximum runout of 2.5 km in the Sat river; an observer reported that 10 pyroclastic flows traveled down the Sat, Senowo, and Bebeng rivers, reaching as far as 2.3 km in the Sat river. Fumaroles emitted steam and gas up to 950 m above the volcano's summit; number and amplitude of earthquakes was high but decreasing, seismic activity was dominated by avalanche earthquakes. |
| 18 Apr-24 Apr 2001 |
Lava avalanches continued to fill the upstream areas of the Sat, Senowo, Lamat, and Bebeng rivers. Maximum runout of 2 km in the Sat river; 11 pyroclastic flows entered the Sat and Lamat rivers, reaching as far as 3 km. Avalanche earthquakes dominated the seismicity but their amplitude and frequency decreased; on 13 April a small amount of ash fell around the Babadan Post Observatory ~7 km W of the volcano. |
| 25 Apr-1 May 2001 |
Lava avalanches continued to flow down the Sat, Senowo, Lamat, and Bebeng rivers. Maximum runout of 2 km. Fumaroles emitted gas that rose up to 500 m above the summit, seismic activity dominated by earthquakes. |
| 02 May-08 May 2001 |
Activity increased, with reports of several medium-sized pyroclastic flows. Four pyroclastic flows were observed traveling into the upper reaches of the Sat, Senowo, Lamat, and Bebeng rivers. Maximum runout of 1.8 km in the Sat river; lava avalanches traveled up to 2.5 km down the Sat river. Superficial earthquakes dominated the seismicity. |
| 11 Jul-17 Jul 2001 |
Lava avalanches. Maximum runout of 2.5 km SW. Low-pressure emissions from fumaroles rose 700 m above the volcano. |
| 18 Jul-25 Jul 2001 |
52 lava avalanches. Maximum runout of 2.8 km SW. Emissions from low-pressure fumaroles rose to 755 m above the summit. |
| 22 Aug-28 Aug 2001 |
Lava avalanches. Maximum runout of 2.8 km to the SW. Seismic activity dominated by avalanche earthquakes. |
Geologic Background. Merapi, one of Indonesia's most active volcanoes, lies in one of the world's most densely populated areas and dominates the landscape immediately north of the major city of Yogyakarta. It is the youngest and southernmost of a volcanic chain extending NNW to Ungaran volcano. Growth of Old Merapi during the Pleistocene ended with major edifice collapse perhaps about 2,000 years ago, leaving a large arcuate scarp cutting the eroded older Batulawang volcano. Subsequent growth of the steep-sided Young Merapi edifice, its upper part unvegetated due to frequent activity, began SW of the earlier collapse scarp. Pyroclastic flows and lahars accompanying growth and collapse of the steep-sided active summit lava dome have devastated cultivated lands on the western-to-southern flanks and caused many fatalities.
Information Contacts: Dali Ahmad, Volcanological Survey of Indonesia (VSI), Jalan Diponegoro No. 57, Bandung 40122, Indonesia (URL: http://www.vsi.esdm.go.id/); Darwin VAAC, Bureau of Meteorology, Northern Territory Regional Office, PO Box 40050, Casuarina, Northern Territory 0811, Australia; Australian Broadcasting Company; Associated Press; Meteorological and Geophysical Agency of Indonesia (Badan Meteorologi dan Geofisika, BMG), Jalan Angkasa I/2 Kemayoran, Jakarta Pusat 10720, Indonesia (URL: http://www.bmg.go.id/).
Ruapehu (New Zealand) — July 2001 Cite this Report
Ruapehu
New Zealand
39.28°S, 175.57°E; summit elev. 2797 m
All times are local (unless otherwise noted)
Tremor episode peaks on 16 February, lahars predicted for near future
Ruapehu showed no signs of volcanic unrest from the end of September 2000 (described in BGVN 25:09) until mid-January 2001, when small to moderate amounts of volcanic tremor occurred. Ruapehu continued to experience low-level seismic activity, including volcanic earthquakes, through the beginning of February 2001. In mid-February, the Institute of Geological and Nuclear Sciences (IGNS) reported several periods of moderately elevated volcanic tremor. An episode of strong volcanic tremor peaked on 16 February and was the strongest tremor recorded since the 1996 eruptions, but direct observations of the crater revealed a lack of unusual surface activity. By approximately 23 February the tremor had declined to background levels. After the tremor event in February, no eruptive activity occurred, and seismic activity continued at a low level. Ruapehu remained at Alert Level 1 (signs of volcanic unrest) throughout the time period.
According to the New Zealand Herald, Ruapehu's summit crater lake had filled at twice its normal rate over the summer of 2000, causing fears of a catastrophic mudslide in the near future. A massive lahar has been predicted within 6 years from the summer of 2002-2003, with a peak flow 50% larger than the 1953 Christmas Eve disaster that wiped out the Tangiwai rail bridge, killing 151 travelers. A $370,000 early-warning system is planned that would provide 1 hour warning of the lahar's arrival on the Desert Road and 2 hours warning of its arrival at Tangiwai.
Geologic Background. Ruapehu, one of New Zealand's most active volcanoes, is a complex stratovolcano constructed during at least four cone-building episodes dating back to about 200,000 years ago. The dominantly andesitic 110 km3 volcanic massif is elongated in a NNE-SSW direction and surrounded by another 100 km3 ring plain of volcaniclastic debris, including the NW-flank Murimoto debris-avalanche deposit. A series of subplinian eruptions took place between about 22,600 and 10,000 years ago, but pyroclastic flows have been infrequent. The broad summait area and flank contain at least six vents active during the Holocene. Frequent mild-to-moderate explosive eruptions have been recorded from the Te Wai a-Moe (Crater Lake) vent, and tephra characteristics suggest that the crater lake may have formed as recently as 3,000 years ago. Lahars resulting from phreatic eruptions at the summit crater lake are a hazard to a ski area on the upper flanks and lower river valleys.
Information Contacts: Institute of Geological & Nuclear Sciences (IGNS), Private Bag 2000, Wairakei, New Zealand (URL: http://www.gns.cri.nz/); The New Zealand Herald, PO Box 32, Auckland, New Zealand.
Soufriere Hills (United Kingdom) — July 2001 Cite this Report
Soufriere Hills
United Kingdom
16.72°N, 62.18°W; summit elev. 915 m
All times are local (unless otherwise noted)
29 July dome collapse and rockfalls
This report covers the interval from 9 March to 17 August 2001 and chronicles ongoing dome growth, including a vigorous episode of dome collapse and mass wasting on 28-29 July. As reported in BGVN 26:02, on 25 February 2001, the direction of the continuing dome growth changed markedly, shifting its predominant growth from the volcano's E side towards the S side. Then, as also reported in the Bulletin, the character of the seismicity changed dramatically in early March with the number of hybrid earthquakes exceeding 300/week (table 37). However, by mid-March, seismic activity had decreased significantly. Dome growth with attendant rockfalls, pyroclastic flows, and ash clouds continued at low levels until early-May. A small pyroclastic flow occurred on 9 May and traveled ~2.5 km down the White River to the S of the dome. The number of rockfalls increased substantially in the following week and remained at higher levels until early August. Observations during the week of 11-18 May indicated that the main dome growth was still concentrated in the S sector of the dome, and a lobe of new lava was observed over Galway. Reports from the week of 8-15 June noted that the summit over Galway appeared to contain the highest point on the dome.
Table 37. Seismic and SO2 data from Soufriere Hills during 16 February to 17 August 2001. Courtesy of MVO.
| Week |
Rockfall |
Hybrid |
Volcano-tectonic |
Long-period |
Range of Average Daily SO2 (tons/day) |
| 16 Feb-23 Feb 2001 |
486 |
18 |
6 |
53 |
210-720 |
| 23 Feb-02 Mar 2001 |
729 |
388 |
3 |
58 |
180-1400 |
| 02 Mar-09 Mar 2001 |
629 |
280 |
4 |
45 |
100-1230 |
| 09 Mar-16 Mar 2001 |
294 |
4 |
0 |
23 |
360-460 |
| 16 Mar-23 Mar 2001 |
84 |
5 |
2 |
8 |
120-190 |
| 23 Mar-30 Mar 2001 |
33 |
5 |
3 |
1 |
200-275 |
| 30 Mar-06 Apr 2001 |
62 |
18 |
1 |
1 |
200-370 |
| 06 Apr-13 Apr 2001 |
52 |
9 |
6 |
3 |
40-520 |
| 13 Apr-20 Apr 2001 |
54 |
48 |
1 |
9 |
20-70 |
| 20 Apr-27 Apr 2001 |
31 |
10 |
1 |
2 |
100-250 |
| 27 Apr-04 May 2001 |
98 |
10 |
3 |
7 |
130-220 |
| 04 May-11 May 2001 |
104 |
34 |
6 |
22 |
80-180 |
| 11 May-18 May 2001 |
240 |
17 |
1 |
31 |
170 |
| 18 May-25 May 2001 |
237 |
26 |
0 |
109 |
700 |
| 25 May-01 Jun 2001 |
266 |
36 |
3 |
383 |
90-370 |
| 01 Jun-08 Jun 2001 |
224 |
25 |
6 |
164 |
130-320 |
| 08 Jun-15 Jun 2001 |
373 |
71 |
0 |
169 |
770-1410 |
| 15 Jun-22 Jun 2001 |
462 |
11 |
1 |
77 |
460-630 |
| 22 Jun-29 Jun 2001 |
299 |
1 |
0 |
26 |
860 |
| 29 Jun-06 Jul 2001 |
295 |
4 |
1 |
28 |
120 |
| 06 Jul-13 Jul 2001 |
297 |
7 |
0 |
38 |
347 |
| 13 Jul-20 Jul 2001 |
719 |
5 |
2 |
57 |
709-943 |
| 20 Jul-27 Jul 2001 |
706 |
8 |
1 |
30 |
339-854 |
| 27 Jul-03 Aug 2001 |
453 |
15 |
0 |
67 |
-- |
| 03 Aug-10 Aug 2001 |
258 |
13 |
2 |
13 |
680-950 |
| 10 Aug-17 Aug 2001 |
186 |
6 |
3 |
3 |
-- |
Two notable events occurred during the week of 29 June-6 July. First, on the morning of 30 June, there were prolonged rockfalls that involved ~0.5 x 10⁶ m3 of material transported down the N side of the talus apron in the Tar River valley. Second, on the evening of 4 July, two small pyroclastic flows passed down the W flank of the volcano in the Amersham area, stopping ~1 km short of the sea. Following the pyroclastic flows in the Amersham area, the daytime entry zone (DETZ) was closed until further notice and has remained that way through at least 17 August.
Lava dome collapse. Shortly after 1700 on 29 July, a large pyroclastic flow passed down the Tar River valley on the volcano's E flank and a continuous, dense plume of ash developed and blew W. Pyroclastic-flow output increased gradually over the next three hours, with many of the flows reaching the sea. The downwind plume deposited substantial amounts of wet ash with accretionary lapilli over the residential areas of Salem, Isles Bay, and Olveston.
Pyroclastic-flow activity peaked at ~1950, when surge clouds associated with the largest flow moved out over the sea, followed by rock fragments falling over a wide area in the NW of the island in the sector between Salem and St. Peters. Some fragments were pumiceous, although the majority consisted of angular, dense lithic fragments generally less than a few centimeters in size, but with maximum dimensions of 6 cm. A second peak in pyroclastic-flow output took place shortly after 2200, when another large flow entered the sea and extended out from the shore for 0.5 km or more and rock fragments fell in the Salem area again. After about 0200 on 30 July seismic signals indicated that this dome collapse had largely finished, and the activity level declined rapidly. The ash plume from the collapse dispersed for considerable distances to the NW. Ash was deposited as far away as Puerto Rico and the Virgin Islands.
Observation flights indicated that a large portion of the dome had collapsed. The general summit region dropped ~150 m and there was a complex, amphitheater-shaped scar several hundred meters deep incised into the core of the dome at the head of the Tar River valley. Within this scar, a new dome began extruding. Observations indicated that minor pyroclastic flows also occurred in the upper reaches of White's, Tuitt's, and Gages ghauts, and also on the southern flanks of the dome in the upper reaches of White River. The main pyroclastic flows in the Tar River were highly erosive; they incised a deep canyon extending across the delta region to the shore and split the delta into two distinct lobes. Analysis of seismic data indicated that the two most intensive periods of pyroclastic-flow activity were associated with explosive events related to the collapse of the largest fragments of the dome.
Reports after 3 August noted that activity at Soufriere Hills was at a low level, and it continued that way to the end of the reporting period (17 August). Small-scale rockfalls and minor pyroclastic flows occurred, but clear views of the upper parts of the volcano were hampered by clouds. Occasional views of the dome noted that it was continuing to grow in the scar produced by the 29 July collapse.
Geologic Background. The complex, dominantly andesitic Soufrière Hills volcano occupies the southern half of the island of Montserrat. The summit area consists primarily of a series of lava domes emplaced along an ESE-trending zone. The volcano is flanked by Pleistocene complexes to the north and south. English's Crater, a 1-km-wide crater breached widely to the east by edifice collapse, was formed about 2000 years ago as a result of the youngest of several collapse events producing submarine debris-avalanche deposits. Block-and-ash flow and surge deposits associated with dome growth predominate in flank deposits, including those from an eruption that likely preceded the 1632 CE settlement of the island, allowing cultivation on recently devegetated land to near the summit. Non-eruptive seismic swarms occurred at 30-year intervals in the 20th century, but no historical eruptions were recorded until 1995. Long-term small-to-moderate ash eruptions beginning in that year were later accompanied by lava-dome growth and pyroclastic flows that forced evacuation of the southern half of the island and ultimately destroyed the capital city of Plymouth, causing major social and economic disruption.
Information Contacts: Montserrat Volcano Observatory (MVO), Mongo Hill, Montserrat, West Indies (URL: http://www.mvo.ms/).
Stromboli
Italy
38.789°N, 15.213°E; summit elev. 924 m
All times are local (unless otherwise noted)
Continued Strombolian activity during March-May 2001; crater morphology changes
This report discusses the period March-May 2001, which included a 10-day interval of field observations. Observers and instruments documented variable volcanism and seismicity ongoing since the last report (BGVN 26:04).
Seismic activity increased in early March, as recorded by the University of Udine summit station, which is located 300 m from the craters at 800 m elevation. On 13 March the number of events per day reached 200. The latter half of March was characterized by a decrease of tremor intensity and by a noteworthy number of saturating events (peaking at 63 on 20 March). In April a reprise of the tremor intensity occurred but the number of triggering seismic events decreased. May was characterized by an increased number of seismic events.
During 14 days (10-24 May) of continuous seismic, thermal, and infrasonic measurements, the authors recorded a detailed 16-hour-long log of activity, and they updated the crater terrace map (figures 65 and 66). During the period, 1,050 seismically determined Strombolian events were recorded overall. These came from the NE, Central, and SW craters, with respective craters discharging 463, 42, and 545 events, respectively. These data provide an average daily rate (over the 62-hour period) that ranged from 5 to 31 events/hour and averaged 17 events/hour. Thus, the average repose time between eruptions was ~3.5 min; the largest measured repose time for the three vents was 22 minutes.
Breaking these statistics down by individual crater, the NE, Central, and SW craters had respective daily averages that ranged as follows: 2-21, 0-3, and 1-19 events/hour. The crater's average event rates were 8, 1, and 9 events/hour, respectively. This gives average repose times for the craters of 8, 69, and 7 min, respectively. For comparison, the maximum repose times at NE, Central, and SW craters were 46, 420 and 105 minutes.
As in May 2000 (BGVN 25:08), the NE Crater consisted of two smaller pits separated by a low septum, the two pits being the location of one and two active vents, respectively. Of these, the western-most vent (1/1) and eastern-most vent (1/2) were most active, with average rates of 4 and 3 events/hour, respectively, compared with ~1 event/hour for vent 1/3. The SW crater contained three active vents that often showed paired or synchronous activity. However, the exact combination of paired eruptions varied daily. For example, on 16 May, an eruption from 3/1 would often be followed by one from 3/2 within a few seconds; but, on 19 May, an eruption from 3/1 would be followed by one from 3/3. As in previous years, eruptions from the SW crater had longer durations and were richer in ash than those from the NE crater.
The frequency and style of activity at the NE crater showed significant variations. During 10-11 May, the NE crater erupted up to 10 times/hour. Events at vent 1/1 were characterized by single-shot, ejecta-loaded Strombolian eruptions, while those at vent 1/2 were long duration (typically 10-20 s), gas-rich eruptions with diffuse ejecta sprays. During 14-15 May, the eruption rate increased to 12-17 events/hour, as eruptions at 1/1 switched to longer duration (~10 s), gas-rich ejections mixed with ash and small bombs. At the same time, events from vent 1/2 contained more bombs that reached ~300 m above the crater. On 16 May, maximum eruption rates declined to 8 events/hour, and ejections from 1/1 and 1/2 were characterized by diffuse sprays of small incandescent bombs mixed with ash to ~200 m. During 17-20 May, activity from both vents was characterized by strong eruptions, often occurring in multiple pulses, with heavy bomb loads to 200-300 m above the crater, and maximum eruption rates of 21 events/hour. Activity declined by 21 May and, by 23 May, activity consisted of gas-rich eruptions with rare-to-no bombs and maximum eruption rates of 5-6 events/hour.
During 11-20 May, the eruption rate at the SW crater increased from 1-12 events/hour (11-16 May) to 6-19 events/hour (18-20 May). Events were typified by 20- to 40-second-long emissions of gas, ash, and bombs. During this period, the ash component appeared to decline and the bomb component appeared to increase. The area inundated by bombs gradually increased, reaching the outer flank of the NE crater by 17 May. Activity peaked on 22 May when strong eruptions with heavy bomb loads were observed. At this time bombs hit the cliff below the Pizzo Sopra la Fossa and cleared the lower section of the pizzo ridge where the lowest tourist shelters are located. Bombs ~0.5 m in diameter fell within 20 m of that location and the path was littered with fresh scoria tens of centimeters in diameter. By 23 May, activity had changed entirely with the eruption rate down to 5-6 events/hour and activity characterized by gas- and ash-rich ejections with few or no bombs.
The Central Crater had evolved significantly since May 2000, when the a funnel-shaped pit that had developed during 1997-99 in the SE sector of the crater (BGVN 24:06) was active with a single degassing vent only (BGVN 25:08). Over the intervening period this pit has filled and now has an inactive hornito. Since May 2000, a new hornito (2B) has developed on the rim of this pit, with a 5-10 m wide vent (2A) at its base. The 2A vent was incandescent by night and radiometer-measured temperatures were in the range 726-577°C.
The summit of the 2B hornito was occupied by an open vent that was the source of continuous gas emission with weakly formed puffs, but no eruptions during the observation period. Vent 2A was the source of vigorous degassing with well-formed puffs. Frequent vigorous phases here often sent one or two pieces of scoria to a height of 10 m above the vent rim. This vent was also the location of rare Strombolian explosions, with just 11 observed during the entire 62-hour observation period.
A new ~2 m wide vent (2C) had also opened towards the center of the Central Crater, and appeared to be the source of a small lava flow that was not observed during May 2000. The surface shows a pahoehoe form, and the flow extends around the base of the inactive hornito 2E and laps up against the back wall of the Crater Terrace (figure 65). Vent 2C was also the source of rare (24 over the entire observation period) Strombolian eruptions, characterized by loud, emissions that created well-formed column-shaped ejecta-bearing plumes.
Explanation of seismic events. In the discussion above, the number of seismic "events" is not directly comparable to the number of "eruptions" for two reasons. First, not all eruptions produce a seismic signal in the frequency range recorded by the short-period seismometer installed by University of Udine. Second, the seismic acquisition at Udine employs a trigger algorithm, which, although not perfectly efficient, has been kept constant since the installation of the 3-component station in 1992 to guarantee coherency between the graphs presented in the Bulletin.
Geologic Background. Spectacular incandescent nighttime explosions at Stromboli have long attracted visitors to the "Lighthouse of the Mediterranean" in the NE Aeolian Islands. This volcano has lent its name to the frequent mild explosive activity that has characterized its eruptions throughout much of historical time. The small island is the emergent summit of a volcano that grew in two main eruptive cycles, the last of which formed the western portion of the island. The Neostromboli eruptive period took place between about 13,000 and 5,000 years ago. The active summit vents are located at the head of the Sciara del Fuoco, a prominent scarp that formed about 5,000 years ago due to a series of slope failures which extends to below sea level. The modern volcano has been constructed within this scarp, which funnels pyroclastic ejecta and lava flows to the NW. Essentially continuous mild Strombolian explosions, sometimes accompanied by lava flows, have been recorded for more than a millennium.
Information Contacts: Andy Harris, Department of Earth Sciences, The Open University, Milton Keynes, MK7 6AA, U.K.; Roberto Carniel, Dipartimento di Georisorse e Territorio, Università di Udine, via Cotonificio 114, I-33100 Udine, Italy (URL: http://www.swisseduc.ch/stromboli/); Maurizio Ripepe, Dipartimento di Scienze della Terra, Università di Firenze, via G. La Pira 4, I-50121 Firenze, Italy; Emanuele Marchetti, Dipartimento di Scienze della Terra, Università di Firenze, via G. La Pira 4, I-50121 Firenze, Italy; John Bailey, Department of Geology and Geophysics, SOEST, University of Hawai'i, 2525 Correa Road, Honolulu, HI 96822, USA; Scott Rowland, Department of Geology and Geophysics, SOEST, University of Hawai'i, 2525 Correa Road, Honolulu, HI 96822, USA; Jürg Alean, Kantonsschule Zürcher Unterland, CH8180 Bülach, Switzerland; Dave Rothery, Department of Earth Sciences, The Open University, Milton Keynes, MK7 6AA, U.K.; Jonathan Dehn, University of Alaska Fairbanks, 903 Koyukuk Drive, Fairbanks, AK 99775, USA; Stromboli On-line, maintained by Jürg Alean and Roberto Carniel (URL: http://www.swisseduc.ch/stromboli/).
Suwanosejima (Japan) — July 2001 Cite this Report
Suwanosejima
Japan
29.638°N, 129.714°E; summit elev. 796 m
All times are local (unless otherwise noted)
Explosive eruptions in May and July
Several eruptions occurred at Suwanose-jima in May-July 2001. Beginning on the morning of 9 May 2001 volcanic activity increased at Suwanose-jima when a tremor event commenced (figure 4). The tremor increased at 1100 and became more violent at 2100.
On 11 May an eruption produced ash clouds that rose to 1.8-7.6 km altitude. A seismo-acoustical record of an eruption signal on 10 May is shown on figure 5. Abundant ash fell on 11 May [in the village ~4 km SSW of the active crater].
Vigorous eruptions on the evening of 12 May and the morning of 13 May deposited up to 3 cm of ash in the village (figure 6). At 0900 on 14 May the eruption seemed to have stopped.
The Sakurajima Volcano Observatory also reported that plumes associated with volcanic tremor events have been observed at Suwanose-jima since the new crater was formed during the December 2000 eruption.
Volcanic tremor was also detected near Suwanose-jima's On-take (Otake) crater beginning at 2200 on 25 July and lasting until at least 26 July. JMA reported that an eruption on 26 July at 1430 produced a volcanic plume that rose to 1.3 km above the crater and drifted to the S. That day seismometers ~2 km SW of the crater recorded explosions at 0501, 0558, 0935, and 1055. Ash fell [in the village] the morning of 26 July.
Geologic Background. The 8-km-long island of Suwanosejima in the northern Ryukyu Islands consists of an andesitic stratovolcano with two active summit craters. The summit is truncated by a large breached crater extending to the sea on the E flank that was formed by edifice collapse. One of Japan's most frequently active volcanoes, it was in a state of intermittent Strombolian activity from Otake, the NE summit crater, between 1949 and 1996, after which periods of inactivity lengthened. The largest recorded eruption took place in 1813-14, when thick scoria deposits covered residential areas, and the SW crater produced two lava flows that reached the western coast. At the end of the eruption the summit of Otake collapsed, forming a large debris avalanche and creating an open collapse scarp extending to the eastern coast. The island remained uninhabited for about 70 years after the 1813-1814 eruption. Lava flows reached the eastern coast of the island in 1884. Only about 50 people live on the island.
Information Contacts: Japanese Meteorological Agency (JMA), 1-3-4 Ote-machi, Chiyoda-ku, Tokyo 100 Japan; Tokyo Volcanic Ash Advisory Center, Tokyo, Japan (URL: http://ds.data.jma.go.jp/svd/vaac/data/); Disaster Prevention Research Institute, Kyoto University, Japan (URL: http://www.dpri.kyoto-u.ac.jp/); Setsuya Nakada and Hidefumi Watanabe, Volcano Research Center, Earthquake Research Institute, University of Tokyo, Yayoi 1-1-1, Bunkyo-ku, Tokyo 113-0032, Japan (URL: http://www.eri.u-tokyo.ac.jp/VRC/index_E.html).
Tungurahua (Ecuador) — July 2001 Cite this Report
Tungurahua
Ecuador
1.467°S, 78.442°W; summit elev. 5023 m
All times are local (unless otherwise noted)
Summary of August 2000-August 2001 eruptive activity
Tungurahua was last discussed in BGVN 25:07, in a report covering the first half of the year 2000. This report was taken chiefly from available updates on the Instituto Geofísico (IG) website. Some of the graphics currently available there and discussed in this report cover the interval 1998-2000.
The subsequent part of this report focuses on activity from August 2000 through 15 August 2001. During this latter interval, aviation reports were issued daily, often several times a day. The final section of this report presents some statistics on Tungurahua's recent human impact from a report issued on 5 September 2001.
Tunguharua's continued eruptions were accompanied by varying SO2 fluxes, tremor, and earthquakes. Hazard concerns remained high, and plume heights reached over 11 km altitude (5 km over the summit) on three days in the first half of August 2001.
Observations during 2000. Between January and October 2000 Tungurahua produced significant discharges and explosions, some of which included impressive ash columns and shows of lava in the crater documenting the presence of shallow magma in the edifice. Seismically inferred magmatic intrusions took place in January, April-May, and August-October 2000. The critical seismicity included intense tremor and swarms of long-period and volcano-tectonic earthquakes.
As shown on figure 7, earthquakes of long-period (LP) and volcano-tectonic (VT) types both underwent progressive increases during the year 2000 but decreased again by November 2000. (More recent data were unavailable at the time of this writing.) Earthquakes attributed to explosions grew in number suddenly during November 1999 and then subsequently proceeded to decrease in number until becoming inconspicuous during late 2000. Elevated numbers of earthquakes, particularly LP earthquakes, correlated with eruptive outbursts (arrows). High numbers of LP earthquakes also persisted between outbursts.
Figure 8 illustrates how during September 1999-December 2000 the energy contained in combined harmonic tremor and hydrothermally generated tremor underwent a sudden peak in January 2000, a time when the numbers of earthquakes seen on figure 1 also showed a strong rise. Two subsequent, progressively smaller peaks in tremor energy occurred at roughly 4-month intervals. Intervals of high tremor energy strongly correlated with eruptive outbursts.
SO2 flux climbed to over 10,000 tons/day during late 1999 and early 2000, but dropped thereafter stabilizing in the hundreds of tons per day range in late 2000 (figure 9). A synopsis of SO2 flux has yet to be reported for 2001. A statement discussing the week of 10-16 January 2001 noted that SO2 flux had been in the 1,000 tons/day range but had risen to 2,000-2,400 tons/day. During that same week, new fumaroles were noted at an inaccessible spot on the NW flank above Baños. Plumes that week rose at least one kilometer over the summit (table 4).
Table 4. A summary of hazard status and plume height observations for Tungurahua, 1 November 2000 to 21 August 2001. These data were summarized from GVP / USGS WeeklyRreports derived from IG data. Some of the taller plume heights came from the Washington VAAC and were based on satellite imagery and local aviation reports.
| Dates |
Description of Activity |
| 01 Nov-07 Nov 2000 |
Plumes 0.5 km above crater. |
| 08 Nov-14 Nov 2000 |
13 November small ash cloud near the summit level blown SE. |
| 22 Nov-28 Nov 2000 |
27 November small ash-and-gas discharges reached 0.5 km above the summit. |
| 29 Nov-05 Dec 2000 |
Sporadic gas column. Plumes 0.3-0.5 km above crater. |
| 06 Dec-12 Dec 2000 |
9 December ash cloud moving SW at summit height. |
| 13 Dec-19 Dec 2000 |
14 December ash cloud moving NE at 0.5 km above the summit. |
| 20 Dec-26 Dec 2000 |
21 December ash cloud at 1 km above the summit but not seen on GOES-8 imagery. |
| 03 Jan-09 Jan 2001 |
Plumes seen several times during this week; no ash visible. Emissions on 3-4 January were moderate sized and ash bearing. 2.9-km maximum plume height. |
| 10 Jan-16 Jan 2001 |
Plumes ~ 2 km above crater. |
| 17 Jan-23 Jan 2001 |
Plumes ~ 2 km above crater. |
| 14 Feb-20 Feb 2001 |
19 February lahars down NW flank via Cusua Gorge; steam column to 1 km. |
| 21 Feb-27 Feb 2001 |
Plumes ~ 4 km above crater. |
| 14 Mar-20 Mar 2001 |
13 March ash cloud moving NW at 4.6 km above the summit. 15 March ash cloud 3.2 km above the summit. 16 March ash cloud 3.8 km above the summit. |
| 21 Mar-27 Mar 2001 |
22 March incandescent eruption column 2 km above the summit; 23 March ash cloud ~2 km above the summit resulting from a half-hour emission. |
| 28 Mar-03 Apr 2001 |
29 March ash cloud moving W at 1 km above the summit; another small eruption on 2 April. |
| 11 Apr-17 Apr 2001 |
Plumes ~2 km above crater. |
| 18 Apr-24 Apr 2001 |
Incandescent dome followed by small steam columns. |
| 25 Apr-01 May 2001 |
25 April ash cloud at 2 km; more eruptions followed but poor visibility. 29 and 30 April lahars to the Pampas, Cusua, Hacienda, and Achupashal sectors; river levels rose in the Ulba and Mandur sectors. Lahars in Pampas sector blocked the Pelileo-Banos channel during 0710 to 1100 on 29 April and destroyed the highway. |
| 02 May-08 May 2001 |
Small steam-and-ash plumes during the week. Possible small lahar on 3 May. |
| 09 May-15 May 2001 |
Heavy rainfall caused remobilization of ash deposited on the upper flanks, producing several lahars. Lahars went down the Cusua, Basural, Mandur, Bascun, and Ulba gorges and closed the Banos-Riobamba highway and blocked a route to the town of Banos. |
| 16 May-22 May 2001 |
Small 15 May eruptions sent ash up to 3 km above the summit. Light ash fell in the towns of Cotalo and Bilbao. 17 May ash cloud 4 km above the summit drifted SW. Intense activity suggested by seismicity but cloudy conditions. 19 May ash cloud rose to 1.7 km. |
| 23 May-29 May 2001 |
2-km-high ash plume on 26 May, poor visibility. |
| 30 May-05 Jun 2001 |
Activity increased. A large number of long-period earthquakes accompanied several small eruptions and near-continuous ash clouds. 31 May eruption sent an ash cloud up to 2.9 km above the summit, which drifted W. Incandescent blocks ejected and a sound like a cannon shot was heard kilometers away. Eruptions on 29 May at 2012 sent ash 2.2 km above the summit, on 30 May at 1211 (ash plume to unknown height), and on 2 June at 1709 with an ash plume 2.9 km above the summit. Incandescent material visible in the crater. |
| 06 Jun-12 Jun 2001 |
Several small eruptions. 5 June ash cloud moving W at 2 km above the summit. |
| 13 Jun-19 Jun 2001 |
4.7-7 km maximum plume height. |
| 20 Jun-26 Jun 2001 |
22 June eruptions at 0630 and 0652 sent ash clouds 0.8 and 3.8 km above the summit, respectively. No ash visible on satellite imagery. Small explosions 25 June at 0138 and 1328 produced ash clouds that rose ~1 km above the summit and drifted W. Small amounts of ash deposited in the town of Ambato, ~40 km NW. |
| 27 Jun-03 Jul 2001 |
17 and 28 June ash clouds to 2 km above the summit; ash fell W, damaging crops. 3 July W-drifting ash 0.8-2.6 km above the summit. |
| 04 Jul-10 Jul 2001 |
5 July a larger-than-average ash plume rose to 2.6 km above the summit; however, satellite imagery and additional information suggested that a dense, SE-drifting ash cloud rose to 4 km above the summit. |
| 11 Jul-17 Jul 2001 |
12 July an eruption sent a cloud to ~3.3 km above the summit; it drifted W to NW. |
| 18 Jul-24 Jul 2001 |
Heavy rain remobilized ash deposited on the flanks, generating lahars, and several small-to-moderate eruptions produced ash clouds. On 19 July lahars down the W flank reached the Banos-Riobamba highway. Larger eruption on 20 July produced an ash cloud that rose to ~2.9 km above the summit. |
| 25 Jul-31 Jul 2001 |
25 July the highest ash cloud of the week rose ~4 km above the summit and drifted SW. |
| 01 Aug-07 Aug 2001 |
2 August until at least 3 August there was an increase in activity. Continuous tremor began on 3 August; maybe associated with continuous ash emission. Several eruptions during the week; largest on 5 August produced ash cloud to ~7.5 km above the summit. |
| 08 Aug-14 Aug 2001 |
Ongoing eruptions since at least 6 August, sending steam-and-ash clouds to 2.5-8 km above the summit. Ash clouds primarily drifted W. On 13 August three particularly strong emissions at about 0630, 1200, and 1315. Two distinct areas of ash visible in satellite imagery; one contained ash from the strong emissions, rose to ~6.6 km above the summit and drifted E; the other ash cloud was fed from continuous emissions and possibly rose to ~5 km above the summit and drifted SW. On 14 August one of about five explosions ascended to 8 km above the summit. It was emitted at 0746 and had a reduced displacement of 13.2 cm2. |
| 15 Aug-21 Aug 2001 |
Series of eruptions that began on 6 August continued during the week. Seismicity characterized by many long-period earthquakes and seismic signals that represented ash emissions. Several sporadic explosions occurred, with the largest explosion beginning on 15 August. The eruption produced an ash cloud that rose to 7.2 km above the summit. On 17 August volcanic activity increased slightly and incandescent material was ejected up to 1 km W of the crater. According to news reports, as of 15 August ash affected more than 23,000 people, blanketed approximately 89,000 acres of crops, and killed an undetermined number of livestock. |
Reports noted an inferred intrusion during 9-12 October 2000. On 13 October, a debris flow occurred, but volcanism diminished considerably. The last explosion around this time took place on 23 October.
At the beginning of December 2000, IG survey crews detected a slight swelling in the EDM lines on the volcano's NW flank. An electronic inclinometer that could have helped confirm this deformation was located above the Refugio station. Unfortunately it was damaged when struck by rocks.
Summary of activity during November 2000-August 2001.Variable ash-cloud heights and other activity are summarized in table 1, which covers the time interval 1 November 2000 through 15 August 2001. Stated in terms of height above the summit, ash clouds rose to more than 7 km on two days in August; to 6 km on 1 day in August; and to 2-4 km on 38 days, mostly in June and July. Smaller ash clouds ascended 1-2 km on 28 days in the early months of 2001. Plumes ascended
During 17 October 1999-12 November 2000 ash plume heights exceeded 7 km over the summit on 8 days, chiefly during late 1999 through early 2000. In October 1999 an ash plume rose to ~13 km over the summit.
Observations during 2001. In early January 2001, two volcano-tectonic (VT) events were located 4-5 km below the NW flank. After 3 January, Tungurahua's 300-m-diameter summit crater had an increase in ash emissions, seen visually from the Guadalupe branch observatory, 11 km N of the volcano (table 1).
New fumaroles became apparent in late November 2000 at 4,400 m elevation on the NW flank, in the main drainage that feeds into the town of Baños (population 18,000). The fumaroles were located in a 100- to 150-m-long area.
During 10-12 June 2001, uncommonly intense and prolonged rains fell over the eastern provinces and the Andean foothills of Ecuador. At one pluviometer (rain gauge) that the IG operates on Tungurahua's NW flank, 120 mm of rain fell in two days. The rain-generated lahars that flowed down Tungurahua's flanks were the largest ever recorded, carrying volcanic blocks the size of small cars. The lahars closed the road between Ambato and Baños for hours and totally destroyed the road between Baños and Penipe. Other floods and lahars were recorded in rivers born on the volcano. Along the Vascun and Ulba rivers, some houses on the flood plains were inundated but not destroyed. The Rio Pastaza, on the N flank of Tungurahua, registered a record water flow rate of 1,760 m3/s.
The rains triggered a landslide that overcame two people living downstream of Baños in the vicinity of Rio Negro. Out milking cows, they were swept into the nearby Pastaza river. These two deaths, although in Tungurahua province, were not related to the lahars. As of July 2001, no one had died from the recent lahars. All together, the rainy season left a death toll of ~80 people in Ecuador, including losses from landslides and flooding away from the volcano.
An explosion on 17 June 2001 rose 4.8-7 km above the summit. Owing to clear weather, it was witnessed by many of the region's inhabitants. No pyroclastic flows were produced, and the explosion ceased after about a minute. After that time, the volcano produced about 1 explosion/day. These mid-June explosions were relatively small (their seismic signatures had reduced displacements of 2-5 cm2), but they generally came without warning.
Light ashfalls were also frequent W of the volcano. They affected many crops (including corn, peas, beans, potatoes, tomatoes, blackberries, and squash; as well as orchards of peaches and apples). A 27 August report by the Pan American Health Organization (PAHO) stated that by late August 2001 various areas had received up to 2.5 cm of ash.
Scientists came to believe that a weak seal was forming in the volcano's conduit system. The seal was thought to break under sufficient recharge pressure. In addition, this new spurt of mid-June activity could be attributed to a small injection of magma that was believed to have occurred during 17-18 May. The fresh injection rose up through the conduit and was seen as incandescence on 26 May and when Strombolian fountaining was observed. Later explosions could stem from residual gases and heat.
Earth Probe TOMS (Total Ozone Mapping Spectrometer) detected a weak ash and SO2 plume from Tungurahua on 6 August at around 0630. The plume was directed generally WSW and extended to approximately 4°S, 83°W, containing an estimated SO2mass of
Practice evacuation and maps. On 26 June 2001, 2,000-3,000 people in Baños conducted a simulated evacuation, the first in over a year. It was organized by "Ojos del Volcán" ("Eyes of the Volcano"), a local organization whose members include hotel owners, climbing guides, and tour operators. Other organizers included the IG, local civil defense authorities, the Red Cross, police, firefighters, and health officials. Participants walked to three previously identified zones of temporary refuge. The exercise was successful and revealed some unforseen shortcomings in the local disaster plans. Figures 10 and 11 show maps indicating topography and potential hazard zones.
Human impact. A report was issued by the United Nations Office for the Coordination of Humanitarian Affairs on 5 September 2001, following a multi-agency meeting the day before. The report cited updated Civil Defense statistics on Tungurahua's impact.
As of 5 September, no ash had fallen in the previous 10 days; still, 39,000 people (8,000 families) had been affected by the volcano. Respiratory infections had increased. Ash had affected potable water supplies in some rural communities prompting more water-quality monitoring. There were 3,107 houses damaged.
A total of 53,597 hectares (ha) of farmland and pastures have been affected, of which 17,017 ha lie in the province of Tungurahua, 28,580 ha in Chimborazo, and 8,000 ha in Bolivar. Due to stress and new feed, 13,113 cattle developed health problems. Some were evacuated. The report also discussed a system for enlisting and tracking relief contributions.
Geologic Background. Tungurahua, a steep-sided andesitic-dacitic stratovolcano that towers more than 3 km above its northern base, is one of Ecuador's most active volcanoes. Three major edifices have been sequentially constructed since the mid-Pleistocene over a basement of metamorphic rocks. Tungurahua II was built within the past 14,000 years following the collapse of the initial edifice. Tungurahua II collapsed about 3,000 years ago and produced a large debris-avalanche deposit to the west. The modern glacier-capped stratovolcano (Tungurahua III) was constructed within the landslide scarp. Historical eruptions have all originated from the summit crater, accompanied by strong explosions and sometimes by pyroclastic flows and lava flows that reached populated areas at the volcano's base. Prior to a long-term eruption beginning in 1999 that caused the temporary evacuation of the city of Baños at the foot of the volcano, the last major eruption had occurred from 1916 to 1918, although minor activity continued until 1925.
Information Contacts: Geophysical Institute (Instituto Geofísico), Escuela Politécnica Nacional, Apartado 17-01-2759, Quito, Ecuador; Associated Press; NOAA Operational Significant Events Imagery Support Team (OSEI), NOAA/NESDIS, World Weather Building, Room 510, 5200 Auth Road, Camp Springs, MD 20748 (URL: https://www.nnvl.noaa.gov/); Washington VAAC, Satellite Analysis Branch (SAB), NOAA/NESDIS E/SP23, NOAA Science Center Room 401, 5200 Auth Road, Camp Springs, MD 20746, USA (URL: http://www.ssd.noaa.gov/); Volcano Disaster Assistance Program (VDAP), U.S. Geological Survey, 5400 MacArthur Blvd, Vancouver, WA 98661 (URL: https://volcanoes.usgs.gov/vdap/); Simon Carn and Arlin Krueger, Joint Center for Earth Systems Technology (NASA/UMBC), University of Maryland Baltimore County, Academic IV-/a, Room 114J, 1000 Hilltop Circle, Baltimore, MD 21250; Office for the Coordination of Humanitarian Affairs (OCHA), United Nations, New York, NY 10017 USA (URL: https://reliefweb.int/); Pan American Health Organization (PAHO), United Nations, 525-23rd Street, NW, Washington, DC 20037 USA (URL: http://www.paho.org/).