Additional Reports
Reports of floating pumice from an unknown source, hydroacoustic signals, or possible eruption plumes seen in satellite imagery.
Bulletin Reports - Index
Reports are organized chronologically and indexed below by Month/Year (Publication Volume:Number), and include a one-line summary. Click on the index link or scroll down to read the reports.
January 1977 (NSEB 02:01)  Cite this Report
Japan: Possible submarine eruption in March 1974
[A table of possible submarine eruptions based on aerial observations of water discoloration by the Japanese Maritime Safety Agency included an entry for 26.13°N, 144.48°E, in March 1974. There are no known Holocene volcanoes in this area.]
Information Contacts: AFP; U.S. Defense Mapping Agency.
April 1983 (SEAN 08:04) Cite this Report
Kermadec Islands: Bubbling and floating pumice
While sailing on his yacht Cookoos' Nest, Captain J. McInnis passed through the edge of a roughly 1-hectare area of small pieces of pumice on 6 April at 1206. He reported some "bubbling" but noted no smells. His location at the time of the sighting was fixed by satellite at 27.58°S, 177.40°E, several hundred kilometers W of the Kermadec volcanic trend. Previous pumice rafts in the area have drifted generally toward the W. Water depths in the area of the sighting are in excess of 4,000 m. Seismic records in New Zealand (roughly 1,400 km from the site) showed no earthquakes associated with the activity, and nothing was reported by the observer on Raoul Island (in the Kermadecs and about 460 km from the site).
Information Contacts: I. Everingham, Mineral Resources Dept., Fiji; W. Smith, DSIR, Wellington.
August 1983 (SEAN 08:08) Cite this Report
Kermadec Islands: Pumice in the Tuamoto Archipelago; source unknown
The source of the pumice remains unknown. Analysis of March and April records from the Réseau Sismique Polynésien (RSP) revealed no acoustic waves (T-phase) from eruptions other than that of Macdonald Seamount. However, the numerous small islands in the area of the Kermadecs, Tonga, Samoa, and Fiji interfere with acoustic waves, preventing effective T-phase monitoring of volcanic activity in some parts of the South Pacific. J. Talandier notes that measurements of surface currents in French Polynesia and similar latitudes suggest that pumice from Macdonald should drift eastward, away from the 6 April site.
Pumice came ashore at both the SE and NW ends of the Tuamoto Archipelago, on the Gambier Islands (23.15°S, 134.97°W) and at Rangiroa (15.00°S, 147.67°W), 4,800 km E and 3,900 km ESE of the 6 April observation. No information on the amount of pumice or the date of its arrival at these locations was available. Talandier noted that Rangiroa is very remote from known active volcanoes other than those in the Mehetia region, where eruptions occur at depths that are too great for production of pumice.
Information Contacts: J. Talandier, Lab. de Géophysique, Tahiti.
April 1986 (SEAN 11:04) Cite this Report
United States: Possible eruption cloud in the Aleutian Islands seen on satellite imagery
Polar orbiting weather satellite imagery on 8 May at 0617 showed a distinct very bright plume along the Aleutian chain at 175-180°E. The plume appeared to be below high weather clouds (probably cirrus) and trended in a different direction, moving W to E and fanning out at its distal end. USGS personnel had received no reports of volcanic activity from airplane pilots or other observers. Several volcanoes with historical eruptions are located at the remote W end of the Aleutian Islands, but heavy weather clouds precluded a precise location for the plume's source area.
Information Contacts: W. Gould, NOAA/NESDIS; M.E. Yount, USGS Branch of Alaskan Geology, Anchorage.
June 1986 (SEAN 11:06) Cite this Report
Japan: Pumice rafts in the Ryukyu Islands
Pumice rafts have been drifting ashore in the Ryukyu Islands from late May through June 1986. Pumice was observed by JMA weather station personnel on eight islands: Amami-Oshima, Okinawa, Kume, Minami-Daito, Miyako, Ishigaki, Yonaguni, and Iriomote. More pumice has been observed on E coasts (Pacific coasts) than W coasts of the islands. The coarsest pumice was ~20 cm in diameter on Okinawa, but most of the pumice was small. On most islands, some pumice carried shellfish on the surface. No recent eruptions have been reported at volcanoes in and near the Ryukyu Island chain, and the source of the pumice is unknown.
Information Contacts: JMA.
December 1986 (SEAN 11:12) Cite this Report
South China Sea: Pumice from unknown source clogs ship's intakes
On 28 August 1986, floating pumice at 16.47°N, 110.40°E blocked the water inlet filters of the Dutch MV Nedlloyd Colombo, causing severe engine trouble. Samples were collected.
No recent submarine eruption has been reported in the area. The nearest known Holocene volcano is Cu-Lao Re Island at 15.38°N, 109.12°E, 180 km to the SW. A submarine eruption of Fukutoku-okanoba (3,350 km to the ENE) in January built a temporary island and produced considerable quantities of pumice. Teardrop-shaped 10 x 4 km pumice rafts were observed in a NW-SE trending, 200 x 50 km, zone extending 100-300 km SE of the volcano on 28 January. Submarine eruptions at Rumble III in June and Kavachi in July were 9,200 and 6,000 km from the position of the MV Nedlloyd Colombo, and separated from it by numerous intervening islands.
Information Contacts: F.B. Koek, Bureau of Marine Affairs, Ministry of Transport and Public Works, Royal Netherlands Meteorological Institute, P.O. Box 201, 3730 AE De Bilt, Netherlands.
February 1988 (SEAN 13:02) Cite this Report
Fiji: Pumice near Lau Island, but no new submarine activity known
The crew of Air Pacific flight FJ 407 (Tonga to Nausori, Fiji) observed a zone of floating pumice ~1.5 km long by 3-4 m wide near 20°S, 178°W (near the S end of the Lau Group, Fiji) on 11 February at 1011. No reports of pumice from ships or island residents [are known to GVN].
Information Contacts: J. Latter, DSIR, Wellington.
October 1988 (SEAN 13:10) Cite this Report
Azores-Gibraltar Fracture Zone: 850 events; tremor near submarine volcano
A seismic swarm began 16 October about 30 km S of Sao Miguel Island. [Several older houses were damaged in Vila Franca do Campo and Povoacao on the S coast of Sao Miguel Island. Most of the epicenters were located along a branch of the Azores-Gibraltar fracture zone. [The strongest shock recorded by the WWSSN was an mb 5.1 event at 0615 on 16 October (37.58°N, 25.37°W, 10 km depth)]. In mid-November, the swarm was ending after 850 events had been recorded by the Azores Univ seismic array.
Since early November, tremor has been registered at the Sao Miguel and Terceira Islands stations of the Univ seismic network [but see 14:3]. This tremor appeared to originate from Don Joao de Castro Bank (38.23°N, 26.63°W, 14 m depth), a shallow submarine volcano that erupted in December 1720. Several earthquakes centered near the volcano reached MM V at Terceira, 80 km away.
Information Contacts: V. Forjaz, Univ of the Azores; NEIC; Lisbon International Service.
November 1988 (SEAN 13:11) Cite this Report
Azores-Gibraltar Fracture Zone: New swarm on another section of fracture zone
The seismic swarm along a branch of the Azores-Gibraltar Fracture Zone was ending in mid-November. No surface evidence of submarine volcanism has been reported.
On 21 November at 1556, a second swarm started with an [Ms 5.6] shock centered 25 km NW of Sao Miguel along the Sete Cidades Fault, a branch of the same fracture zone. The hypocenter was 53 km SE of Don Joao de Castro Bank [preliminary location by WWSSN at 37.97°N, 26.11°W, 10 km depth]. By the next day, the number of seismic events/hour had decreased from 24 to 4; several of the shocks were migrating along the main portion of the Sao Miguel Fault. The swarm caused 30 houses to collapse and damaged hundreds of other buildings. Modified Mercalli intensities were VII-VIII in the NW part of the island and V at the capital.
Information Contacts: V. Forjaz, Univ of the Azores; NEIC; Lisbon International Service.
November 1988 (SEAN 13:11) Cite this Report
Russia: Possible eruption cloud seen by airplane pilot
While flying 170 km E of the Kuril Islands on 27 October at 1907, the pilot of Japan Airlines flight 81 (Anchorage, Alaska to Tokyo) observed a spherical blue-white cloud slightly above the WNW horizon. The cloud looked to the pilot like a volcanic plume and was rapidly developing a mushroom head. Visibility was unlimited in moonlight. Airborne radar is generally not able to detect volcanic clouds, and there was no echo from this cloud on the aircraft's radar scope. Winds were blowing from the cloud toward the aircraft at ~55-75 km/hour, and the pilot diverted S to avoid it.
The air route nearest the Kuril Islands (R220) and the neighboring westbound route (R580) were closed to air traffic by Japanese authorities. A third parallel route (A590), normally eastbound, was opened in both directions (at different altitudes) to accommodate aircraft from the two closed routes. Although a reconaissance flight the next day detected what its pilot described as a possible ash cloud below 8.5 km altitude, the closed routes were reopened for their normal use by higher altitude traffic.
At the time of the sighting, the aircraft was at about 48.65 N, 157.45 E, 11 km altitude. The cloud was ~45 to the right of the flight path, prescribed at 238 for that section of the air route (R220). The resultant bearing of 283 to the cloud crosses the northern Kurils near Harimkotan Island, ~170 km from the aircraft. Several recently active volcanoes, including Harimkotan, Chrinokotan, Ekarma, Sinarka, and the Tao Rusyr caldera, are within a few degrees of the 283 bearing from the point of the sighting. However, the IV had no reports of any eruptions in the area at that time, and an October survey of the southern Kurils found only mild fumarolic activity. A strong cold front was passing through the area around the time of the 27 October observation, and might have produced volcanic-like cloud formations.
Information Contacts: N. Krull, FAA; E. Miller, ALPA; Y. Tsukamoto, ALPA of Japan; W. Gould, NOAA/NESDIS; S. Fedotov and B. Ivanov, IV.
December 1988 (SEAN 13:12) Cite this Report
Azores-Gibraltar Fracture Zone: Continued earthquakes and tremor
As of 27 December, a total of 1,300 events had been registered since the activity began. Several patterns of epicentral migration had been noted along the Azores-Gibraltar Fracture Zone and the Congro regional fault. Volcanic tremor remained frequent. Fumarole temperatures were about 10°C higher than normal at Furnas Caldera on Sao Miguel Island. Its most recent eruption, in 1630, deposited tephra over most of the island and killed 191 people.
Information Contacts: V. Forjaz, Univ of the Azores; NEIC; Lisbon International Service.
March 1989 (SEAN 14:03) Cite this Report
Azores-Gibraltar Fracture Zone: Seismicity since May 1988 summarized
The following is a summary of significant seismic activity in the E Azores (figure 1) since May 1988 [through January 1989]. "A swarm of microearthquakes, accompanied by weak harmonic tremor, occurred beneath the NE flank of Agua de Pau Volcano on Sao Miguel (epicentral zone 1 on figure 2) 23-24 May 1988. Seismometers recorded 383 earthquakes; the largest had intensities of MM IV-V in villages along the N coast. A similar but smaller swarm occurred in the same area in 1983 and was recorded by USGS seismographs. Numerous, small, normal faults (including some that show scissor-type movement) displace basaltic, tristanitic, and trachytic vent deposits and flows in this area. However, the area has had no eruptions for about 3,000 years and is the least active of the five volcanic zones on Sao Miguel that have erupted during Holocene time.
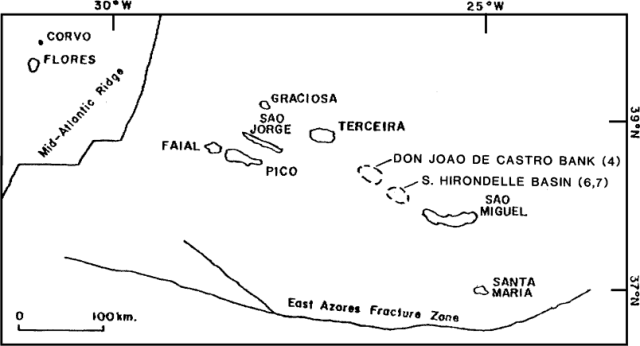 |
Figure 1. Sketch map showing islands in the eastern Azores. Approximate epicenters of the 3-5 October 1988 swarm at the submarine volcano Don Joao de Castro Bank (4) and the 21 November 1988 and 21 January 1989 earthquakes in the Hirondelle Basin (6 and 7) are shown. Courtesy of R. Moore. |
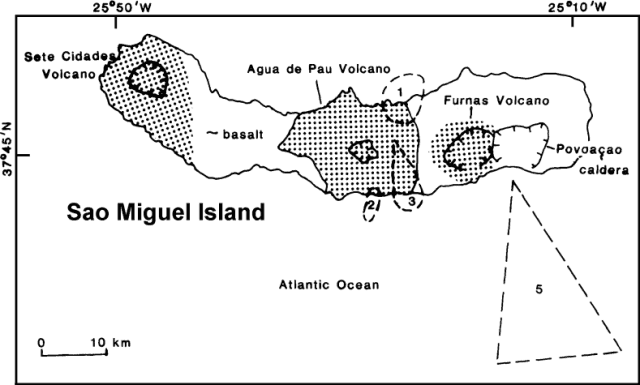 |
Figure 2. Approximate epicenters for earthquakes on and near the island of Sao Miguel, May-October, 1988. Courtesy of R. Moore. |
"A small swarm of microearthquakes occurred 24-26 June on the S flank of Agua de Pau Volcano (zone 2). Sixty-four earthquakes were recorded; the largest had intensities of MM III-IV in nearby villages. No tremor accompanied this episode.
"A small swarm of microearthquakes occurred 6 July near the S coast of Sao Miguel (zone 3). Fifty-one earthquakes were recorded; the largest was felt and had an intensity of MM III-IV. No tremor accompanied this episode.
"A small swarm of earthquakes occurred within the volcano Don Joao de Castro Bank (zone 4) 3-5 October. Sixty-two earthquakes were recorded; no harmonic tremor was detected. A felt earthquake occurred in the same area 23 October; it had intensities of MM IV-V on Terceira and MM III-IV on the N coast of Sao Miguel.
"A swarm of tectonic earthquakes, many of which were felt, occurred beneath the ocean floor about 30 km S of the extinct Povoaçao Volcano (zone 5) 16-20 October 1988. Seismometers recorded 409 earthquakes during this period; the largest had an intensity of MM VI in towns on the S coast of Sao Miguel. Felt aftershocks occurred as recently as late February 1989. No harmonic tremor accompanied this activity. Epicenters were aligned along a N-NW trend; hypocenters generally ranged from 10 km to as shallow as 400 m. Furnas Volcano, which adjoins Povoaçao on its W side and most recently erupted in A.D. 1630, has numerous boiling drowned hot springs and derivative 'fumaroles' that emit only water vapor. Temperatures of the hot springs depend on elevation and range from 98.5° to 100°C. The associated 'fumaroles' are much cooler and are subject to further cooling during periods of heavy rain.
"The largest Azores earthquake of the last year, M 5.8, occurred within the S Hirondelle Basin (zone 6), SE of Don Joao de Castro Bank, on 21 November. The earthquake was widely felt in the E Azores and caused minor damage on the W part of Sao Miguel, where intensities were MM VI-VII. The quake was apparently tectonic in origin as no harmonic tremor occurred during its normal aftershock sequence. An earthquake of MM V (measured near the NW coast of Sao Miguel) occurred 21 January 1989 within the S Hirondelle Basin. The earthquake was probably an aftershock of the 21 November event. No tremor was recorded."
Information Contacts: A. Rodrigues da Silva, Consorcio Geotermico de S. Miguel; R. Moore, USGS; National Institute of Meteorology and Geophysics, Portugal.
October 1990 (BGVN 15:10) Cite this Report
Fiji: 30-km zone of pumice from unknown source
An "underwater explosion" and "pumice swirl" ~30 km wide were reported at 19.10°S, 175.41°E (200 km SW of Nadi, Fiji) on 16 October at 1058 from Air Pacific flight 914 (Nadi to Sydney, Australia). At 1450, the crew of a second Air Pacific flight (enroute from Auckland, New Zealand) noted pumice visible in the sea 130 km from Nadi (on the W coast of Fiji's largest island, Viti Levu) [see also 15:11-12].
Although no historical volcanism has been reported near the observation site, the area is near a spreading center described by Gill and Whelan (1989). Another possible source of the pumice is Monowai Seamount (25.92°S, 177.15°W), 1,100 km to the ESE, where submarine activity was observed from the HMNZS Tui on 13 August. On 30 May-18 June and 5-7 September, the Polynesian Seismic Net recorded T-phase activity, centered in the Monowai area, that had characteristics typical of shallow submarine eruptions.
Reference. Gill, J., and Whelan, P., 1989, Early rifting of an oceanic island arc (Fiji) Produced shoshonitic to tholeiitic basalts: JGR, v. 94, no. B4, p. 4561-4578.
Information Contacts: J. Latter, DSIR Geophysics, Wellington.
November 1990 (BGVN 15:11) Cite this Report
Fiji: Details of aerial pumice observations; pumice washes ashore on one island
The following, from Trevor Jones and Peter Rodda, supplements preliminary reports of pumice sightings near Fiji in 15:10.
"A report of floating pumice was received from Nitin Hiralal, First Officer of Air Pacific flight FJ 914 (Nadi-Sydney) on 16 October. At 1058, he saw a 'pumice swirl' ~15-30 km across, at 19.10°S, 175.41°E, from an altitude of ~10 km. It had a regular circular shape. He saw nothing else, but presumed that there had to be some local volcanological activity because of the regular pattern. He says that it is 'reasonably common' to see streaks of pumice along wave crests on the Vanuatu and Tonga routes (from Fiji). On 17 October, while returning to Fiji, he checked and saw 'only pumice streaks' at about 1330, presumably around the same position. Pumice was also reported 150 km S of Nadi [roughly 19.1°S, 177.5°E] from an Auckland-Nadi flight on 16 October. There have been no reports from ships of pumice in the area, nor have any reports other than the above appeared in the Fiji Times.
"The relative compactness of the first presumed pumice reported suggests an origin in the area, but although submarine volcanoes exist in the vicinity, no peaks are known to rise above ~1,800 m depth in the general area, and it seems unlikely that pumice could form. The two locations from which presumed pumice was reported suggest an origin on the Tonga-Kermadec Ridge, roughly in the latitude of Fonua Fo'ou [20.3°S] or farther S; based on the drift time of Home Reef pumice in 1964, from the first report of the eruption to the first arrival in Fiji and later arrival in Suva, pumice could reach the site in the North Fiji Basin from that part of the Tonga Ridge in ~75-85 days, giving a possible eruption date in late July (or earlier if farther S - if Monowai Seamount, ~95-105 days, or early to mid-July).
"Four reply-paid telegrams sent in late October to the agents at four Postal Agencies in S Fiji brought no replies. The radio-telephone to Vunisea, Post Office for Kadavu Province [about 19°S, 178.5°E] is out of order, so no information about the arrival of pumice there can conveniently be obtained quickly. Questionnaires have been posted." By mid-November, pumice had been reported from Koro Island (about 17.3°S, 179.4°E), and questionnaires were being sent to locations throughout the Lau Group (E of Fiji's largest islands) and elsewhere.
Information Contacts: T. Jones and P. Rodda, Mineral Resources Dept, Suva, Fiji.
January 1991 (BGVN 16:01) Cite this Report
Fiji: No clear evidence of pumice despite aerial observations
Airplane pilots observed what they believed to be floating pumice SW of Fiji 16-17 October, and pumice was initially reported to have come ashore at Koro Island in November. However, careful investigation by Fiji's Mineral Resources Department yielded no evidence of floating pumice in the region (Rodda and Jones, 1991). The "Koro Island" pumice report was in fact from Nacekoro (site of the airport at Savusavu, S-central Vanua Levu), and appears to have been an observation of older pumice, probably from the 1984 eruption of Home Reef. Mineral Resources Department personnel working in the NW (Yasawa Group) and S-central (Toyota Is) parts of Fiji in December saw no new drifting pumice, although a considerable quantity of Home Reef material remained on the backs of beaches. Telegrams requesting information about pumice, sent in late October to each of the four postal agencies in S Fiji, and 38 questionnaires sent to schools, postmasters, and shipping companies in S Fiji, yielded only a single negative response (from Oni-i-Lau, in the southern Lau Group). Responses had been received from 25% of similar inquiries after the arrival of pumice from the Home Reef eruption.
Reference. Rodda, P., and Jones, T.D., 1991, The 1990 reports of drift pumice in Fiji: Mineral Resources Department Note BP1/91, 3 p.
Information Contacts: P. Rodda, Mineral Resources Dept, Suva, Fiji.
May 1992 (BGVN 17:05) Cite this Report
Fiji: Pumice rafts; source unknown
A Fiji Air passenger saw two narrow, elongate rafts of drifting pumice in the Kadavu passage ~30 km SE of Suva (figure 1) on 24 January. Fiji's Maritime Surveillance Centre issued a warning to mariners, published in newspapers on 27 January. Pumice was subsequently reported from ships roughly 50 km SW and 160 km NW of the initial observation.
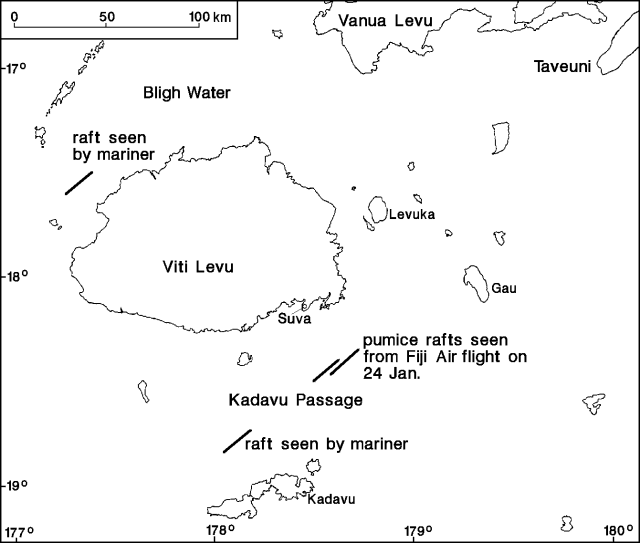 |
Figure 1. Map of Fiji, from Baleivanualala, 1992, showing locations of pumice rafts seen in early 1992. |
A search of the Suva Harbour area on 27 January revealed pumice floating in the Suva Passage and stranded at the high-tide line around the Suva Peninsula. The pumice was gravel-sized, with the largest fragment ~4 cm across. The samples were weathered and some included living barnacles up to 9 mm long. After the 1984 Home Reef (Tonga) eruption, barnacles 1.5 cm long were found on pumice that was at most 25 weeks old, so a provisional maximum age of 15 weeks was assigned by Baleivanualala to the barnacles found in January 1992. Given an estimated drift rate of ~12 km/day (Rodda and Jones, 1990), the pumice might have traveled 1,300 km from the eruption site. No reports of eruptions in the Tonga-Kermadec region have been received.
References. Baleivanualala, V., 1992, Drift pumice in Kadavu Passage, January 1992: Fiji Mineral Resources Department Note BP57/1, 3 pp.
Rodda, P., and Jones, T.D., 1990, The 1990 reports of drift pumice in Fiji (Corrigendum): Fiji Mineral Resources Department Note BP1/91.
Information Contacts: V. Baleivanualala and P. Rodda, Mineral Resources Dept, Suva, Fiji.
November 1994 (BGVN 19:11) Cite this Report
Fiji: Aerial pumice sightings; source unknown
S. Chandra, Fiji Meteorological Service, noted that Air Pacific FJ440 bound for Auckland from Nadi (Viti Levu) reported sighting pumice ~220-330 km out of Nadi at about 1530 on 25 November 1992.
On 2 December 1994, Mike Green of the Fiji Meteorological Service reported that the pilot of a flight from Nadi to Melbourne saw what he believed to be pumice ~130 km SSW of Nadi on a bearing of 200°. A lesser amount of pumice was seen to the left of the flight path ~240 km from the airport. The plane had been scheduled to depart at 1145, placing these observations around noon. Reply-paid telegrams were sent on 6 December to postal agents at Ono-i-Lau (southernmost Lau Group), Qalikarua (Matuku), and Daviqele (W Kadavu), asking if any pumice had arrived within the last few weeks. No reply had been received by the Fiji Mineral Resources Dept by 9 December, so it was assumed that none was seen.
Although no historical volcanism has been reported near these observation sites, the area is close to a spreading center.
Information Contacts: P. Rodda and G. Wheller, Mineral Resources Dept, Suva, Fiji.
January 1996 (BGVN 21:01) Cite this Report
Japan: Acoustic signals in late January; source not locatable
The JMA Ocean Bottom Seismograph off the Boso Peninsula (E of Tokyo) detected T-phase-like signals after 22 January, and clear T-phase signals on 27 January (figure 1). According to tentative analyses of arrival times at the detectors, the signals were interpreted to have propagated from the S. As of mid-February, JMA had not determined a specific source for these signals. However, discolored seawater was observed above two submarine volcanoes in the Volcano Islands during January: Minami-Hiyoshi on 12 January, and Fukutoku-okanoba on 12, 22, and 23 January.
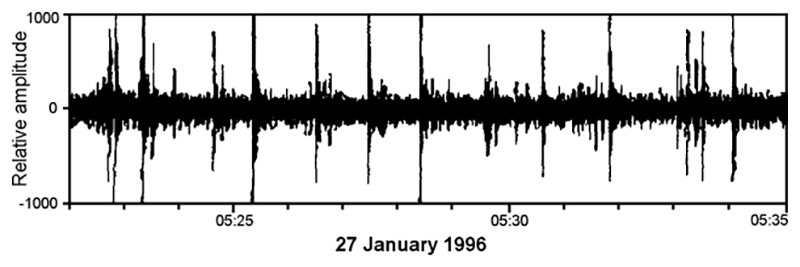 |
Figure 1. Example of T-phase signals (spikes) detected by the Ocean Bottom Seismograph off the Boso Peninsula, Japan, 27 January 1996. Courtesy of JMA. |
Information Contacts: Volcanological Division, Seismological and Volcanological Department, Japan Meteorological Agency (JMA), 1-3-4 Ote-machi, Chiyoda-ku, Tokyo 100 Japan.
November 1999 (BGVN 24:11) Cite this Report
Japan: Hydro-acoustic signals of a possible eruption detected
Robert Dziak at the NOAA/Pacific Marine Environmental Laboratory in Newport, Oregon reported that the large-aperture hydrophone array deployed throughout the north Pacific Ocean basin has been detecting extremely loud, tremor-like signals since May 1998. The best preliminary estimates of the signal sources lie ~1,000 km S of Honshu Island, Japan along the Volcano Island chain (astride the Bonin trench, figure 1).
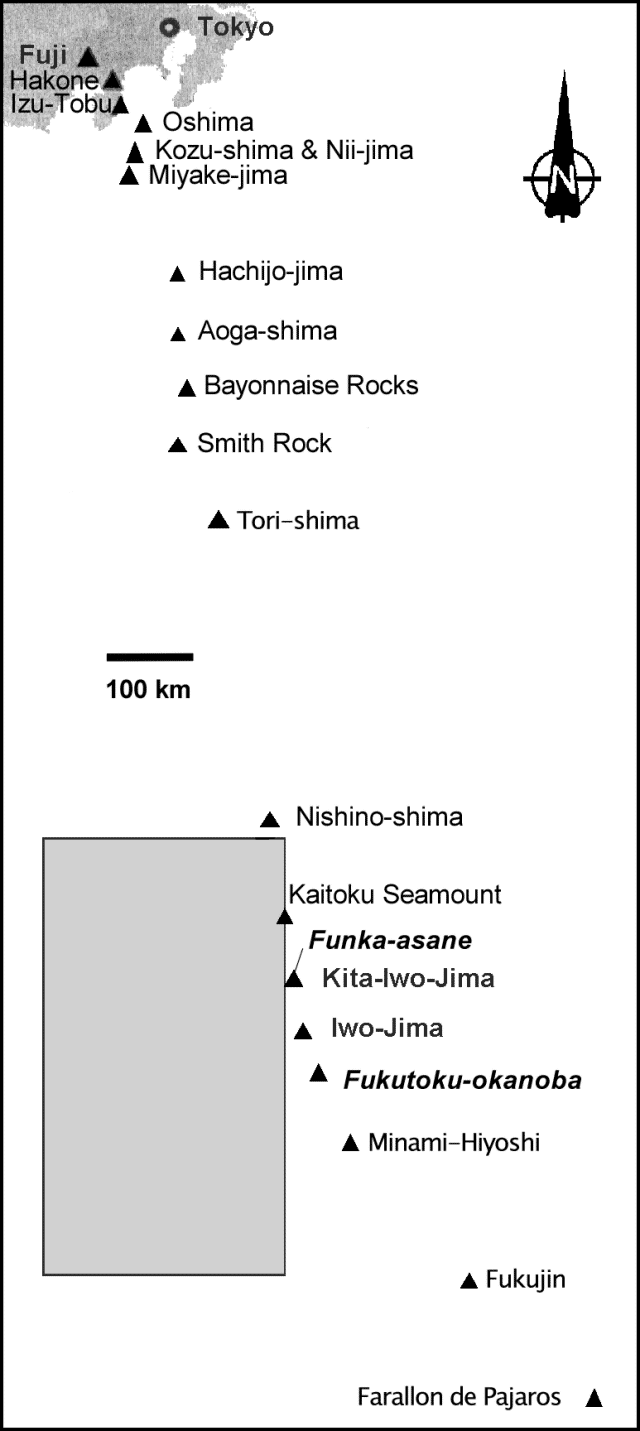 |
Figure 1. A sketch map of part of the island of Honshu, and some of the historically active volcanoes of the Izu, Marianas, and Bonin arcs. Data from the NOAA large-aperture hydrophone array indicates a submarine volcano has been erupting in the area within the box shown. Two possible candidate sources for the eruption discussed in the text are Fukutoku-okanoba and Kita-Iwo-jima (Funka-asane). Courtesy of Robert Dziak and Yasuo Otani. |
Dziak believes these tremors to be volcanic in origin. The signals are characterized by a high amplitude fundamental around 10 Hz and the next three harmonics (20, 30, and 40 Hz). Typically signals appear as discrete packets lasting 4-5 minutes, with a brief ~30 second quiescence period, followed by the beginning of the next signal packet. For the duration of each signal packet, the spectral peaks typically increase monotonically by 5-10 Hz while maintaining their harmonic spacing. Similar distinctive characteristics have been previously identified in volcanic tremor records from both seismic and airborne acoustic measurements at Arenal Volcano in Costa Rica (Garces et al., 1998) and at Pavlof Volcano, Alaska (Garces and Hansen, 1998).
Unfortunately, the source of these signals is outside the optimum coverage area for the NOAA array, so the estimated locations are not accurate; the best preliminary estimates place the signal source in a box at 22-27°N and 138-141°E that lies W of the Bonin arc (figure 1).
The tremor has been occurring intermittently since May 1998, and was still being recorded as of late December 1999. During this period, intense tremor activity was recorded on 30 different days. The signals have for the most part been occurring continuously (with quiet times ranging from several days to several weeks) since first detected. Specific periods of peak amplitude and duration in 1998 and 1999 are presented in table 1. Signals measured on 10-12 December 1999 were the loudest yet detected.
Table 1. Dates of the strongest hydro-acoustic signals registered on the NOAA large-aperture hydrophone array compared to observation dates of discolored seawater over Fukutoku-okanoba and the Funka-asane vent of Kita-Iwo-jima. Hydro-acoustic data courtesy of R. Dziak; seawater observations courtesy of Yasuo Otani, Japan Maritime Safety Agency and Japan Meteorological Agency.
| Periods of peak tremors from hydro-acoustic data | Discolored Seawater at Fukutoku-okanoba | Discolored Seawater at Kita-Iwo-jima (Funka-asane) |
| 16-18 Aug 1998 | -- | -- |
| 31 Aug 1998 | -- | -- |
| -- | 16 Oct 1998 | -- |
| -- | 28 Oct 1998 | -- |
| -- | 14 Dec 1998 | -- |
| -- | 16 Dec 1998 | -- |
| -- | 12-13 Jan 1999 | -- |
| 22 Apr 1999 | -- | -- |
| 20-27 Aug 1999 | -- | -- |
| -- | -- | 07 Sep 1999 |
| -- | 08 Sep 1999 | -- |
| 10-11 Oct 1999 | -- | -- |
| -- | 22 Nov 1999 | -- |
| -- | 10-12 Dec 1999 | -- |
Yasuo Otani of the Hydrographic Department of Japan has provided subsequent information (courtesy of Yukio Hayakawa) regarding periods of discolored sea water seen over Fukutoku-okanoba (24.3°N, 141.5°E). The latter is a known volcanic area located S of Iwo-Jima (24.75°N, 141.33°E) on the fringes of the area delineated above by Dziak. These dates are also presented in the second column of table 1; however, there does not appear to be an obvious correlation between the two data sets. On the other hand, what is not yet known is the density of visual observations, in effect, the number of observations of these sites when surface discolorations were absent. Without such details, trying to correlate the two data sets could be biased by sampling density.
Japan Meteorological Agency reports provided one other case of sea surface discoloration, at Funka-asane, but this lone observation also failed to show any temporal correlation and has the same limitations of sampling bias mentioned above. Funka-asane, a submarine vent ~2 km NW of Kita-Iwo-jima (25.43°N, 141.23°E), is just E of the preliminary box delineated by the acoustical data.
Olivier Hyvernaud at the Geophysical Laboratory in Tahiti had found no evidence of volcanic T-waves from the region in question through the end of 1999.
The area of the preliminary box is large, and could include many other volcanic centers. Given all of the uncertainty, anyone having possibly related data or comments is urged to contact Robert Dziak or the Smithsonian's Global Volcanism Network.
References. Garces, M.A., Hagerty, M.T., Schwartz, S.Y., 1998, Magma acoustics and time-varying melt properties at Arenal Volcano, Costa Rica: Geophysical Research Letters, v. 25, no. 13, p. 2293-6.
Garces, M.A., Hansen, R.A., 1998, Wave form analysis of seismoacoustic signals radiated during the fall 1996 eruption of Pavlof volcano, Alaska: Geophysical Research Letters, v. 25, no.7, p. 1051-4.
Information Contacts: Robert P. Dziak, Oregon State University/NOAA, Hatfield Marine Science Center, 2115 SE OSU Drive, Newport, OR 97365 USA (URL: http://newport.pmel.noaa.gov/); Yasuo Otani, Coastal Surveys and Cartography Division, Hydrographic Department, Maritime Safety Agency, 3-1 Tsukiji, 5-Chome, Chuo-ku, Tokyo 104-0045, Japan; Olivier Hyvernaud, Laboratoire de Géophysique, BP 640 Pamatai, Tahiti, French Polynesia.
December 1999 (BGVN 24:12) Cite this Report
Japan: Spectra of hydrophone-detected tremor
Robert Dziak at the NOAA/Pacific Marine Environmental Laboratory noted that loud acoustic signals continue to be detected from an unknown submarine source in or adjacent to the Volcano Islands of Japan (see sketch map in BGVN 24:11). Spectra and representative time series appear in figures 2, 3, and 4. These data were collected near the Galapagos Islands by a NOAA hydrophone (at 8°S, 95°W) roughly 14,000 km from the estimated source.
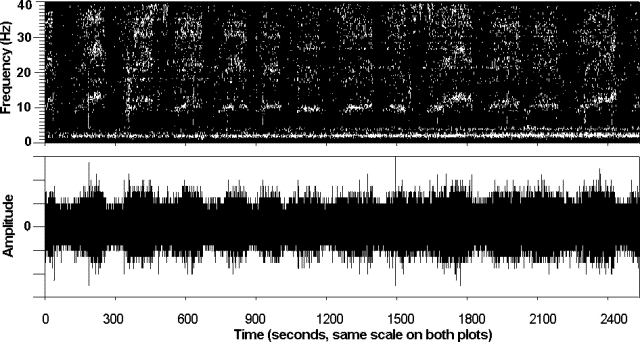 |
Figure 2. Hydrophone record showing the acoustic signals detected from an inferred submarine eruption along the Bonin arc. At this time, the exact location of the volcano is uncertain. The diagram shows a ~ 2,500-second interval of the time-series amplitude (bottom) and corresponding frequency spectra (from consecutive 1-second data windows) received on a hydrophone at 10°S, 95°W. The tremor signals typically last 2-5 minutes; they display a 10 Hz fundamental with 20, 30, and 40 Hz overtones. The signals were recorded on 21 March 1999 (2100-22:00 GMT), after propagating across the Pacific through the oceanic-sound (SOFAR) channel. Similar signals were detected at hydrophone arrays in the E and NE Pacific and at remote hydrophones maintained by NOAA located near the Galapagos Islands. Courtesy of R. Dziak. |
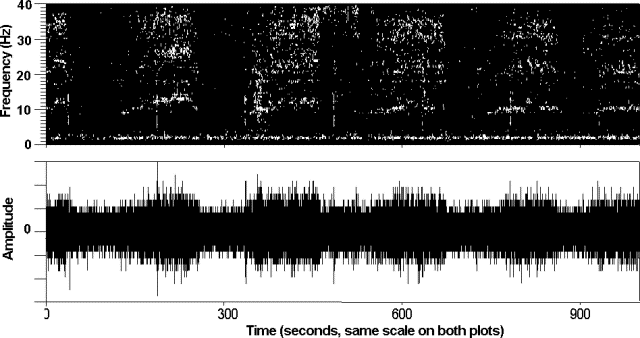 |
Figure 3. This diagram shows an enlargement of the hydrophone record at 10°S, 95°W from an inferred submarine eruption along the Bonin arc. The diagram shows a ~1,000-second interval of the time-series amplitude (bottom) and the corresponding frequency spectra (top). For this interval, only the 20- and 30-Hz overtones are readily apparent (above). The signals shown arrived at the hydrophone at 2100-2200 GMT on 21 March 1999. Courtesy of R. Dziak. |
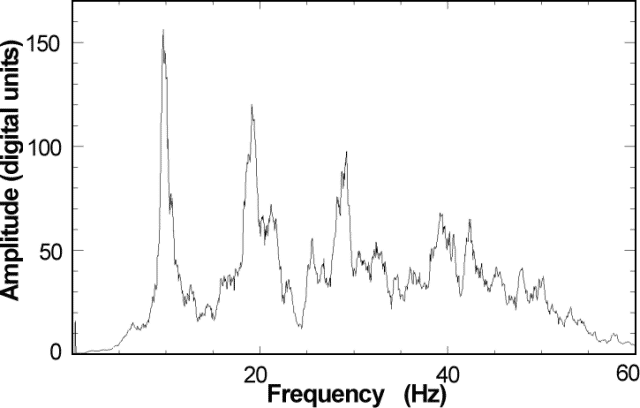 |
Figure 4. A spectral plot of hydrophone amplitude versus frequency from an unconfirmed submarine eruption along the Bonin arc. The spectra were produced from one of the 2-minute signal packets shown in figures 3 and 4. The plot shows a fundamental frequency centered near 10 Hz, and lower-amplitude harmonics at 20, 30, and 40 Hz. Courtesy of R. Dziak. |
The extremely high-amplitude tremor signals have been detected since May 1998, and are clearly recorded on hydrophone arrays in the N and E Pacific, and at a NOAA array in the equatorial area near the Galapagos Islands. The signals are larger, for example, than those from the 1993 submarine eruption at Soccoro Island (BGVN 18:01), and consist of a high-amplitude 10-Hz fundamental and three harmonics at 20, 30, and 40 Hz . The signals are unlikely to have come from any easily envisioned synthetic or biological sources (such as whales) because the fundamental wavelengths are substantial, seemingly too long to have been generated by these types of sources.
In general, the hydrophones are deployed within the ocean-sound (SOFAR) channel. The sound channel is a region of low acoustic velocity, and therefore acts much like a waveguide, allowing sound waves in the ocean to propagate over long distances with little loss in signal strength. However, the signal can be small or even absent at some stations due to bathymetry shadowing or other effects.
According to Olivier Hyvernaud, after careful comparison with the hydroacoustical data, the signals were recognized in seismic records at Tahiti, where the French Polynesian Network commonly records the converted seismic waves of ocean-acoustic signals that propagate past the islands. However, the signals have not been recognized on seismic instruments at Iwo Jima. Although it may seem surprising that Iwo Jima would lack a signal, Dziak notes that the difference could be explained by the physics of the situation. Acoustic waves propagating through an ocean-sound channel (2-D) would undergo little attenuation. In contrast, the seismic waves propagating through the Earth's crust (3-D) undergo much greater attenuation with distance. The Bulletin continues to present hydro-acoustical data so that others may compare them with records from local instruments.
The inferred source area of these acoustic signals (see BGVN 24:11) was derived by combining the arrival times of correlated signals throughout the Pacific basin with detailed ocean sound-speed models. Ocean sound-speed is a complex function of temperature, salinity, and pressure (depth). The models are a result of 30 years of direct sampling of these ocean parameters and account for seasonal variations. Unfortunately, the source of these signals is well to the W of the hydrophone arrays; consequently, the source location is not well-constrained. The estimated source area comprises over ~1.4 x 10⁵ km2, and the area of uncertainty (the "box" shown on the sketch map) could extend far enough east to include the known active volcanic areas such as the Bonin arc. It is hoped that as more ancillary information becomes available, it will be possible to derive a better estimate of the source location.
On the topic of volcanism along the volcanic front of the Bonin arc, Yasuo Otani of the Japanese Maritime Safety Agency noted that there are daily commercial air flights to Guam (~1,300 km S of Iwo jima).
Otani conveyed the latest observations at the two known active vents near Iwo Jima. At Fukutoku-okanoba on 25 January observers saw very small changes in water color; on 26 January they noted somewhat larger-scale changes. Around the same time, 25-26 January, Funka-asane was also the scene of discolored water.
Both Fukutoku-okanoba and Funka-asane are sufficiently shallow that the vent's flux changes can be easily seen from the surface. In fact, hydrothermal emanations and small-scale eruptions gain much attention from fishermen, who keep an eye on various local eruptive sites because they believe some eruptive phases affect fishing.
Otani expressed doubt of far-traveled geophysical signals from either of these two sources near Iwo jima. Instead, he noted, enormous acoustical noise must eminate from breakwater construction on the margin of the Bonin Islands (Ogasawara Islands), ~200 km NE of Iwo Jima, where a large-scale blasting and other heavy moving has been occurring.
Information Contacts: Robert P. Dziak, Oregon State University/NOAA, Hatfield Marine Science Center, 2115 SE OSU Drive, Newport, OR 97365 USA (URL: http://newport.pmel.noaa.gov/); Yasuo Otani, Coastal Surveys and Cartography Division, Hydrographic Department, Maritime Safety Agency, 3-1 Tsukiji, 5-Chome, Chuo-ku, Tokyo 104-0045, Japan.
May 2000 (BGVN 25:05) Cite this Report
Japan: After 6 months of quiescence, tremor returns
Robert Dziak at the NOAA/Pacific Marine Environmental Laboratory in Newport, Oregon reported that 10 Hz band-limited tremor was detected from the Volcano Islands area after a 6 month hiatus (BGVN 24:11 and 24:12). The current episode of signals began at 0800 UTC on 13 June, but were loudest at 0100-0200 UTC on 14 June. The tremor tracks to presumed submarine volcanism at an uncertain volcano.
Information Contacts: Robert P. Dziak, Oregon State University/NOAA, Hatfield Marine Science Center, 2115 SE OSU Drive, Newport, OR 97365 USA (URL: http://newport.pmel.noaa.gov/).
June 2003 (BGVN 28:06) Cite this Report
Japan: Hydroacoustic signals detected during 1998-2002 in the Volcano Islands
Robert Dziak and Christopher Fox at the National Oceanic and Atmospheric Administration's Pacific Marine Environmental Laboratory (NOAA PMEL), reported that a continuous series of low-frequency, long-duration signals were recorded beginning on 18 April 1998, and then during the next 3.3 years by omnidirectional hydrophones deployed throughout the Pacific basin (see BGVN 24:11, 24:12, and 25:05). These hydroacoustic signals were detected 21 different times from April 1998 through December 1999. After a 6-month hiatus, the signals were detected 26 more times from June 2000 through August 2001 (figure 5). The authors concluded that the signals came from a source in the Volcano Islands.
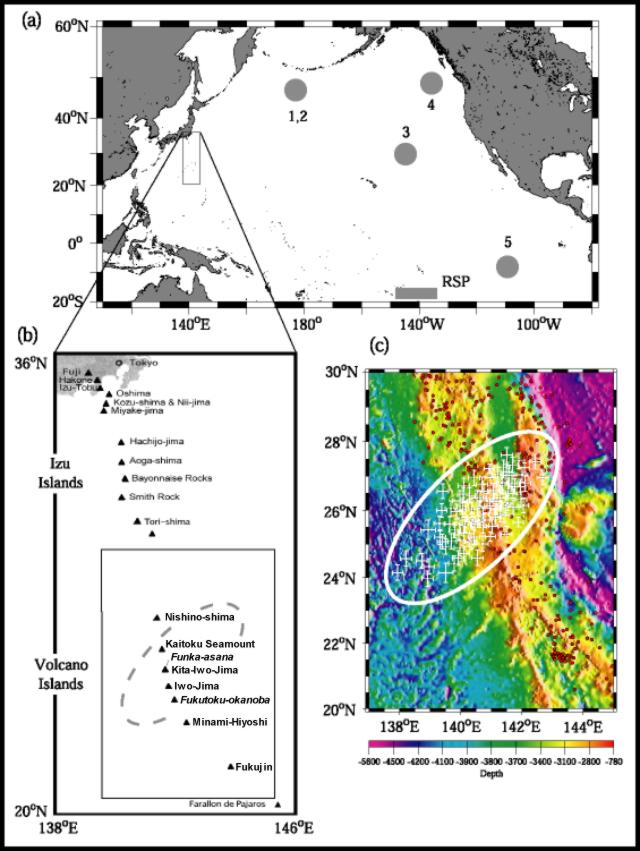 |
Figure 5. Maps showing location of hydrophones and islands of the Izu-Bonin and Volcano Islands groups in the western Pacific S of Japan, and source area of hydroacoustic signals during April 1998-August 2001 from Dziak and Fox (2002). (a) Approximate locations (shaded dots) of SOSUS and NOAA eastern equatorial hydrophones arrays; shaded bar shows the location of the French Polynesian Seismic Network (RSP). (b) Location of the major volcanoes in the Izu and Volcano Islands groups. (c) Location of the tremor waveforms (crossed error bars) estimated using 16 individual hydrophone stations positioned off the W coast of the United States, Hawaii, western Aleutians, and along the East Pacific Rise near the equator. The location error bars indicate the 68% confidence interval. See Dziak and Fox (2002) for additional details. Courtesy of Robert Dziak. |
Dziak and Fox (2002) reported that "The character of the acoustic signals recorded from the Volcano Islands resembles tremor recorded during episodes of magmatic activity at subaerial volcanoes, suggesting that a significant magmatic, and potentially eruptive, process took place in the Volcano Islands between April 1998 and August 2001 and may occur again. To the authors' knowledge, the character of the Volcano Islands harmonic tremor with a 10-Hz fundamental and multiple overtones has not been previously recorded from a submarine volcano. Additionally, detection of harmonic tremor at teleseismic distances (>30°) is a rare occurrence for either a subaerial or submarine volcano."
Matt Fowler (Oregon State University) provided the following information on harmonic tremors from S of Japan from October 2000 to September 2002; all the tremor signals are from the same general area (figure 5) and have roughly the same frequency-time characteristics. Data through August 2001 were also reported by Dziak and Fox (2002). Possible tremors were detected on 18 and 28-31 October, 5, 9, 13, and 19 November 2000. Definite tremors were identified on 17, 22, and 30 December 2000, 13 January 2001, and 15-20 February 2001. During 21-23 February 2001 the tremors became well defined. Over the next few months tremors were only detected during 18-22 March, on 17, 21, and 24 April, and on 16 and 21 June. After another quiet interval, tremor signals were again recorded on 12, 14, 19, 22, and 30 July, and 8-10, 20, and 29 August 2001; tremors on 20 August were "excessively loud." No tremors were detected again until 26 February 2002, followed by a quiet interval until 16-19 and 31 March. Activity increased again during April-May 2002 with tremors recorded on 1, 2, 18, 20, 22, and 23 April, and 2-3, 13-16, and 21 May; "exceptionally loud" tremors occurred on 2-3 May. Additional tremors were detected on 9 June, 6-13 August, 15 August ("exceptionally loud"), and 19 September 2002.
Reference. Dziak, R.P., and Fox, C.G., 2002, Evidence of harmonic tremor from a submarine volcano detected across the Pacific Ocean basin: Journal of Geophysical Research, v. 107, no. B5, p. ESE 1-1 - 1-12.
Information Contacts: Robert P. Dziak and Matt Fowler, Cooperative Institute for Marine Resource Studies, Hatfield Marine Science Center, Oregon State University/NOAA, 2115 SE OSU Drive, Newport, OR 97365 USA (URL: http://www.pmel.noaa.gov/).
March 2005 (BGVN 30:03) Cite this Report
Antarctic Continental Shelf: Newly described submarine volcano (Jun Jaegyu) near the tip of the Antarctic Peninsula
Jun Jaegyu is a young volcano near the Antarctic Peninsula visited in May 2004 by researchers from a group of United States and Canadian universities aboard the U.S. National Science Foundation research vessel Laurence M. Gould (Cruise LMG04-04). The expedition's chief scientist was Eugene Domack of Hamilton College.
Prior to this cruise, bathymetric swath maps from 2002 revealed a symmetrical volcano that had not been scoured by the advance and retreat of glaciers. The 2004 cruise dredged the volcano and found material that included fresh basalt in a flank area devoid of colonizing bottom-dwelling organisms. In contrast, observations suggested that other portions of the volcano were heavily colonized by bottom-dwelling organisms. The discovery of the volcano corroborated mariners' reports of discolored water in the area. These observations, and a thermal anomaly, were all consistent with comparatively recent volcanic activity.
The volcano is located on the Antarctic continental shelf in the southern Antarctic Sound, ~ 9 km N of the easternmost point of Andersson Island and NW of Rosamel Island (figure 1), N of the mapped boundary of Late Cenozoic volcanic rocks. Swath bathymetric mapping indicated that the volcano stands ~ 700 m above the seafloor (at a depth of ~ 1,000 m) and thus extends to within ~ 275 m of the ocean surface. The seamount has an elongate, symmetrical shape and contains ~ 1.5 km3 of volcanic rock.
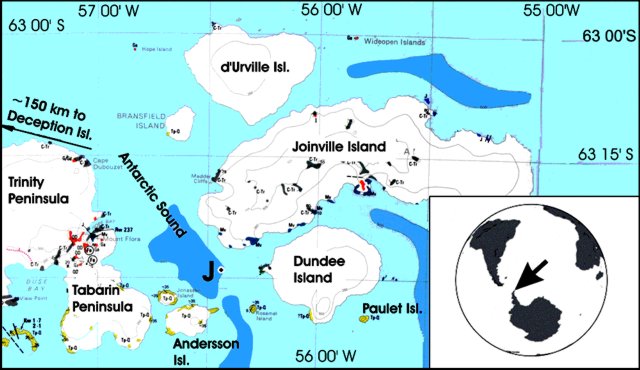 |
Figure 1. Jun Jaegyu submarine volcano (J) lies E of the extreme tip of the Antarctic Peninsula (see inset map) in the Antarctic sound, an area sheltered by several islands. Paulet Island, another volcano of probable Holocene age, lies just outside the Antarctic Sound on the SE side of Dundee Island. A better known Holocene volcano, Deception Island, lies to the NW (adjacent to the South Shetland Islands) as indicated by the arrow. Base map copied from Northern Graham Land and South Shetland Island, British Antarctic Territory Geologic Map (1:500,000) from BAS 500 G, sheet 2, edition 1, 1978. Note that map coordinates shown are in degrees and minutes (eg. 57 00', 57 degrees and 0 minutes). |
Two observed positive thermal anomalies (up to 0.052°C), recorded by temperature probes towed over the volcano from S to N, may be associated with two active volcanic centers. The more complex N temperature anomaly may also be associated with what appeared to be fresher lava flows.
The volcano lies along a NW-SE oriented fault scarp. Material dredged from the volcano have not been dated because accurately dating vesicular, partially altered, young submarine basalts is problematic at best. No gas samples were collected during this cruise.
Ashley Hatfield, a participant in the cruise and an undergraduate geology student at Hamilton College, advised by David Bailey and Eugene Domack, analyzed representative samples for whole-rock major and trace elements using XRF (X-ray fluorescence spectroscopy) and ICP-MS (inductively coupled plasma mass spectrometry). The samples are generally angular, glassy, and vesicular, having plagioclase, olivine, and clinopyroxene present as phenocryst phases, and with small rounded xenoliths being common (Hatfield and others, 2004). The samples were classified as alkali basalts and trachybasalts, and their chemical signatures were consistent with other known volcanoes throughout the northern Antarctic Peninsula.
Hatfield noted that the volcano is named in honor of Jun Jaegyu, a young Korean scientist who lost his life during the 2003 field season in the South Shetland islands. He was participating in the Korean Antarctic Program through their geophysical observatory based in the South Shetland Islands (King Sejong Station, established in 1988 on the Barton Peninsula, King George Island at 62°13.4818'S, 58°47.4744'W).
The scientific crew for this cruise included Hatfield, Bailey, and Domack, (Department of Geology, Hamilton College, Clinton, New York); Stefanie Brachfield, (Department of Earth and Environmental Sciences, Montclair State University, Upper Montclair, New Jersey); Robert Gilbert (Department of Geological Sciences, Queen's University, Kingston, Ontario); Scott Ishman (Department of Geology, Southern Illinois University, Carbondale, Illinois); Gerd Krahmann (Lamont-Doherty Earth Observatory of Columbia University, Palisades, New York); and Amy Leventer (Department of Geology, Colgate University, Hamilton, New York).
Reference. Hatfield, A., Bailey, D., Domack, E., Brachfeld, S., Gilbert, R., Ishman, S., Krahmann, G., and Leventer, A., 2004, Jun Jaegyu volcano; A recently discovered alkali basalt volcano in Antarctic Sound, Antarctica: Eos, Transactions, American Geophysical Union, 85(47), Fall Meeting Supplement, Abstract T11A-1248.
Information Contacts: David G. Bailey, Eugene Domack, and Ashley K. Hatfield, Department of Geosciences, Hamilton College, 198 College Hill Rd., Clinton, NY 13323, USA.
June 2010 (BGVN 35:06) Cite this Report
Cayman Trough, Caribbean Sea: Expedition discovers deep undersea volcanic vents
According to a report in ScienceDaily on 12 April 2010, a scientific expedition from the United Kingdom National Oceanography Centre (NOC) discovered the world's deepest undersea volcanic vents, known as 'black smokers.' The vents, seen on 11 April, were located at a depth of 4,960 m in the Mid-Cayman Spreading Centre (MCSC), also known as the Mid-Cayman Rise Spreading Center (Thompson and others, 1980), of the Cayman Trough in the western Caribbean Sea (figure 1).
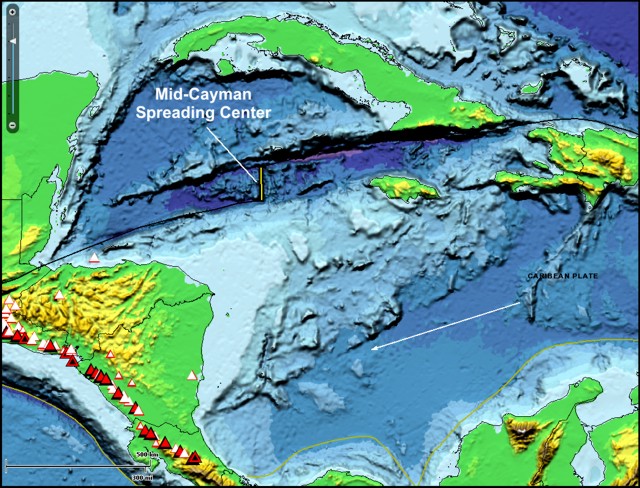 |
Figure 1. Bathymetric map showing plate tectonic configuration and location of the Mid-Cayman Spreading Center (MCSC) within the Cayman Trough, south of Cuba in the western Caribbean Sea. Modified from the Smithsonian's "This Dynamic Planet" interactive map. |
Using remote deep-diving vehicles, the scientists found slender spires made of copper and iron ores on the seafloor, erupting water hot enough to melt lead, ~ 800 m deeper than anyone has seen before (figure 2). The deep-diving vehicles included Autosub6000, developed by engineers at the NOC for surveying; TOBI – Towed Ocean Bottom Instrument– towed behind the ship a few hundred meters above the seafloor, mapping it in detail with its sonar system and other instruments such as a magnetometer; HyBIS, developed by expedition member Bramley Murton and Berkshire-based engineering company Hydro-Lek Ltd. for filming. Instruments were remotely controlled from the Royal Research Ship (RRS) James Cook. Daily details of the expedition may be found on the RRS James Cook Voyage 44 website.
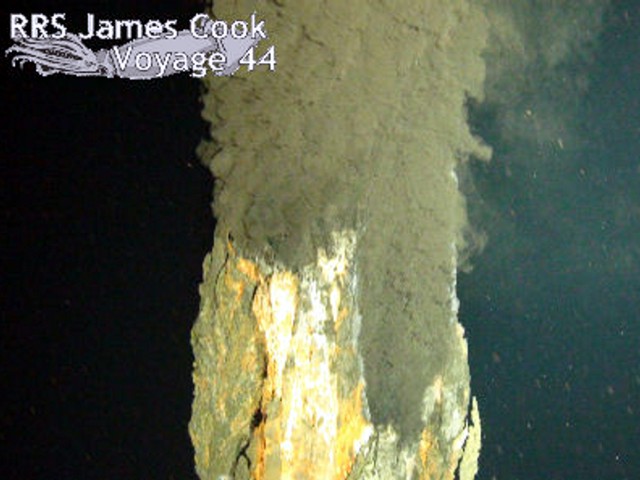 |
Figure 2. Photograph of a 'black smoker' vent erupting hot water at a depth of ~ 5,000 m on the ocean floor in the Cayman Trough, Caribbean Sea. Courtesy of NOC. |
In addition to the scientists from NOC, the team aboard the ship included researchers from the University of Southampton's School of Ocean and Earth Science (SOES), University of Durham in the UK, the University of North Carolina Wilmington, and the University of Texas in the US, and the University of Bergen in Norway. Expedition members also worked with colleagues ashore at Woods Hole Oceanographic Institution and Duke University.
[The Cayman Trough, where the seafloor of the Caribbean is rifting apart, harbors the world's deepest chain of undersea volcanoes,. The Mid-Cayman Spreading Centre (MCSC), the geological name for the chain of volcanoes ~ 80-110 km long that runs N-S across the Cayman Trough in the W Caribbean Sea, S of Cuba and Jamaica and close to the Cayman Islands, is an ultraslow-spreading ridge with a rate of less than 20 mm per year (ultraslow-spreading ridges make up more than 20% of the world's mid-ocean ridges). The MCSC is connected to a group of faults that allow the Caribbean plate to move relative to the North American plate. It has some of the deepest seafloor in a ridge setting, up to 6,500 m below sea level in places.]
Reference. Thompson, G., Bryan, W.B., and Melson, W.G., 1980, Geological and geophysical investigation of the Mid-Cayman Rise Spreading Center: geochemical variation and petrogenesis of basalt glasses: The Journal of Geology, v. 88, no. 1, p. 41-55.
Information Contacts: ScienceDaily (URL: http://www.sciencedaily.com/); United Kingdom National Oceanography Centre (NOC), University of Southampton Waterfront Campus, European Way, Southampton SO14 3ZH, United Kingdom (URL: http://www.noc.soton.ac.uk/); RRS James Cook Voyage 44 (URL: http://www.thesearethevoyages.net/).
September 2011 (BGVN 36:09) Cite this Report
Tonga: Photo from space on 13 April 2011 raises questions about drifting pumice rafts
This report presents a serendipitous observation near Tofua, possibly indicative of volcanism elsewhere (not on Tofua). A photo of Tofua and vicinity from space taken on 13 April 2011 displays significant material on the sea surface - the possible relict of an eruption at some unknown center.
A photo taken from space by Astronaut Paulo Nespoli (figure 1) could suggest an eruption in the Southern Pacific region at an unknown volcano. Nespoli took the photo from the International Space Station on 13 April 2011 (Nespoli, 2011). It shows occasional white clouds over the island's high points, and a thin gray-blue plume indicative of Tofua's volcanic emissions wafting to the SE.
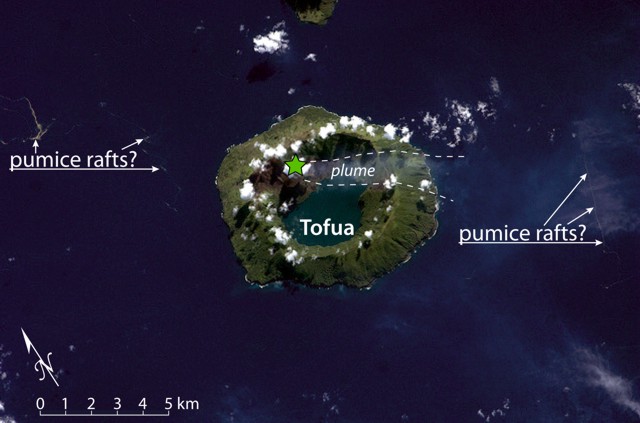 |
Figure 1. Photo taken 13 April 2011 from the International Space Station with hand-held camera showing Tofua and debris on the sea surface suggestive of pumice. The composition and source of the debris is unknown; however, the shape, distribution, and color of areas of debris are consistent with zones of floating pumice. Image (239B2033) courtesy of Astronaut Paolo Nespoli (European Space Agency and the International Space Station); labels and dashed lines added. |
The elongate and sinuous bands of debris seen in the photo are suggestive of floating pumice seen before in the region (eg., see Home Reef, BGVN 31:09; 31:10; 31:12; 32:04; 33:05; 33:12; Metis Shoal, BGVN 20:06). If this is pumice in elongate strands such as seen from Home Reef's 2006 eruption, it could also be derived from deposits of an older eruption. Debris floating in strands are most conspicuous at upper left of figure 1, where they form a curve cut by the photograph's left edge. Faintly linked to that area is a thinner strand of sinuous debris. Other strands of similar width appear elsewhere.
Reference. Nespoli, P., 2011, Tofua Island, Tonga: Flickr (uploaded 18 April 2011) (URL: http://www.flickr.com/photos/magisstra/5618223635/).
November 2011 (BGVN 36:11) Cite this Report
Tonga: Material of uncertain origin seen on 13 April 2011
Based on inspection of a photo taken on 13 April 2011 from the International Space Station of Tofua volcano (Tonga), it appeared that possible pumice rafts were floating near the island (BGVN 36:09). However, the source of the material was unknown.
The source, extent, and makeup of the material remains uncertain. Inquiries sent to Mark Belvedere and others in Tonga in late 2011 failed to identify any mariners or other observers who recall seeing either an eruption or material floating on the sea surface around March to April 2011.
If the rafts drifted from the Tongan region, as they have often done in the past, they may have originated from an eruption at one of the volcanoes of the Ha'apai and Vava'u Groups. Some of those, such as Late, Home Reef, Metis Shoal, and Falcon Island, have erupted frequently, with pumice rafts and emergent ephemeral islands (figure 2).
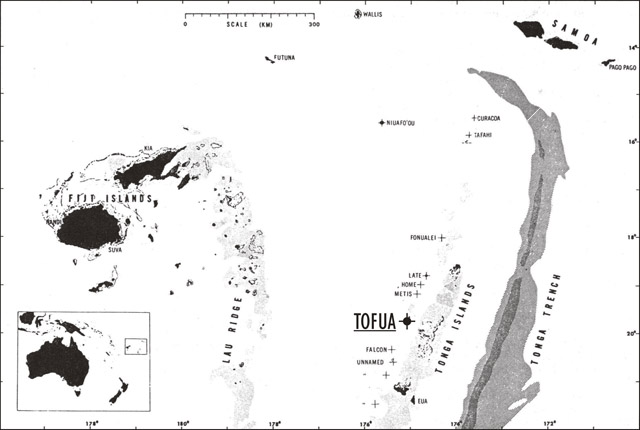 |
Figure 2. Map of the Tonga-Samoa area showing Tofua. Historically active volcanic centers are indicated by crosses. Stippled areas delineate water less than 1 km deep; diagonal and cross-ruled patterns indicate trench areas greater than 6 and 8 km, respectively. After Anonymous, 1979, with map credit to Tom Simkin (GVP). |
Figure 2 came from a similar report in 1979, but in that (very different) case the initial problem was four active eruptive sources, any of which might explain the streaks and rafts of floating pumice drifting NE. The resulting uncertainty then revolved around which of those sources produced the bulk of the floating pumice (SEAN 04:06; Anonymous, 1979). Discovery of a large ephemeral island at Metis Shoal pointed to that as the primary source of the pumice rafts (SEAN 04:07 and 04:12).
NASA initiative and findings. Childs and others (2011), Chojnacki and others (2011), and Honaker and Childs (2011) point out the very practical goal of a "more timely warning system to divert maritime vessels from affected areas." They discussed the spectral signature of several pumice rafts from a remote-sensing perspective. They assessed the date of eruption onset, the volcano's name, coordinates, and the favored satellites to detect and track these rafts in their different environments.
For the limited cases they tested, MODIS best detected large scale pumice rafts and monitored them over time. Landsat 5, 7 and ALI best detected small rafts, especially in closed bodies of water such as lakes. The false-color composite improved the contrast of pumice rafts for visual identification. Thermal anomalies occurred over several large pumice rafts. They found a subpixel classification extremely effective at automatically identifying small areas of pumice.
Note that, for the case at hand, the authors did not know of or analyze the material on the sea surface.
References. Anonymous, 1979, Geophysical Events: Eos, Transactions, American Geophys. Union, 21 Aug 1079, p. 625.
Childs, LM, Chojnacki, PR, Coady, C., Geddes, Q, Honaker, LB, Lyddane, W, McGilloway, J, Scott, J, 2011, Pacific Ocean Disasters - Enhanced Detection and Monitoring of Pumice Rafts Using NASA EOS; Eos, Transaction of the Am. Geophys. Union, V44C-04; (URL: http://www.agu.org/meetings/)
Chojnacki, P, Lyddane, W, McGilloway, J, Geddes, Q, Honaker, L, Coady, C, and Scott, J, 2011, Implementing NASA Remote Sensing to Protect and Monitor our Waterways, [ley DEVELOP Team 5, posted 10 August 2011 in DEVELOP Virtual Poster Session with written transcript] Earthzine (URL: http://www.earthzine.org/2011/08/10/implementing-nasa-remote-sensing-to-protect-and-monitor-our-waterways/, https://www.youtube.com/watch?feature=player_embedded&v=sdTZFq8Kpg4).
Honaker, LB, Childs, L, 2011, Remote Sensing Monitoring of Pumice Rafts in the Pacific Ocean (URL: http://www.nianet.org/NIA/media/photo-gallery/Remote-Sensing-Monitoring-of-Pumice-Rafts-in-the-Pacific-Ocean.pdf).
Information Contacts: Mark Belvedere, Treasure Island Eueiki Eco Resort, Vava'u, Tonga.
December 2011 (BGVN 36:12) Cite this Report
South Sandwich Islands, East Scotia Ridge: Study describes submarine venting and eruption in back-arc setting
Rogers and others (2012) reported on the presence of black smokers, diffuse venting, and associated chemosynthetically-driven ecosystems along the East Scotia Ridge (ESR), a geographically isolated back-arc spreading center in the Atlantic sector of the Southern Ocean, near Antarctica (figure 1). To their best knowledge, this was the first time that these features were observed at this location. Rogers and others (2012) noted that, since the discovery of hydrothermal vents along the Galápagos Ridge in 1977 (Corliss and others, 1979), scientists have detected “numerous vent sites and faunal assemblages at many mid-ocean ridges and back-arc basins...an apparent global biogeography of vent organisms with separate provinces.”
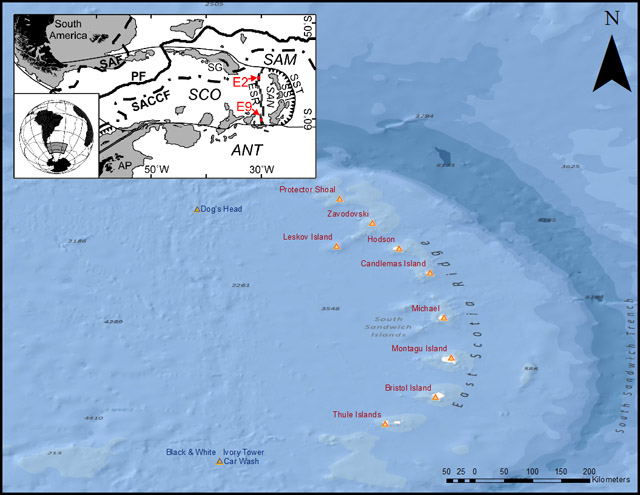 |
Figure 1. (Inset) Map of the Scotia Sea, showing the ESR in relation to the Scotia plate (SCO), the South Sandwich plate (SAN), the South American plate (SAM), the Antarctic plate (ANT), the Antarctic Peninsula (AP), and the South Sandwich trench (SST). Oceanographic features shown include the Polar front (PF), the Sub-Antarctic front (SAF), and the southern Antarctic Circumpolar Current front (SACCF). The vents sites E2 and E9, locations of the detailed studies discussed here, are indicated by red arrows. (Larger image) Map of the South Sandwich islands showing known active island volcanoes (red triangles) relative to the South Sandwich trench, and the East Scotia ridge (ESR) and submarine vents (E9) and fissure (E2, Dog’s Head) discussed here. Index map after Rogers and others (2012); ocean-floor base map from GEBCO, NOAA National Graphic, DeLorme, and ESRI. |
Vent sites E2 and E9. The vent site E2 lies just S of the segment axial high (called the Mermaid’s Purse), between 56°5.2’ and 56°5.4’S and between 30°19’ and 30°19.35’W at ~2,600 m depth (figures 2A and 2B). Prominent N-trending structural fabric seen on the seafloor defines a series of staircased, terraced features that are divided by W-facing scarps (figures 2B and 2C). A major steep-sided fissure runs N-S through the center of the site, between longitude 30°19.10’W and 30°19.15’W (figure 2C). The main hydrothermal vents are located at the intersection between this main fissure and a W-striking fault or scarp, consistent with the expected location of active venting on back-arc spreading ridges such as the case at hand.
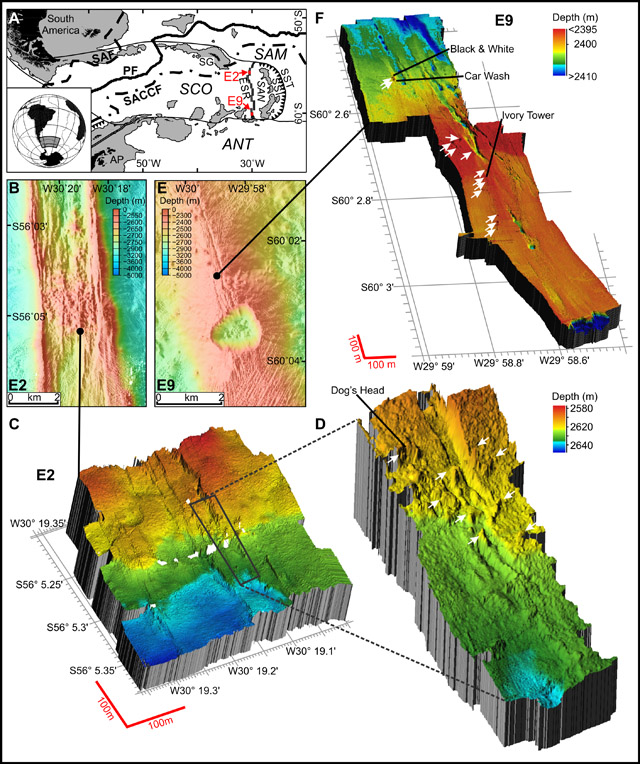 |
Figure 2. Swath maps of the location and setting of ESR vents. (A) Ship-based swath bathymetry at the location of site E2 showing the axial summit graben. The black circle indicates the sites of main venting. (B) and (C) ROV-based 3-D swath bathymetry of site E2 and high-resolution swath bathymetry of the major steep-sided fissure that runs N-S through the center of the site, between longitude 30°19.10’W and 30°19.15’W. Dog’s Head vent is indicated in panel C. White arrows indicate vents not mentioned in text. (D) Ship-based swath bathymetry at the location of site E9 showing the axial fissures and the collapsed crater called the Devil’s Punchbowl. The black spot indicates the sites of main venting. (E) ROV-based 3-D swath bathymetry of the site E9. The vents Ivory Tower, Car Wash, and Black and White are indicated. Other vents are indicated by white arrows. From Rogers and others (2012). |
Relict (extinct) and actively venting chimneys were both resolvable in the high-resolution multibeam bathymetry obtained by the ROV (remotely operated vehicle) Isis, clustered in a band running approximately NW-SE. Numerous volcanic cones and small volcanic craters are also apparent around the vent field. Chimneys of variable morphology were up to 15 m tall and venting clear fluid with a maximum measured temperature of 352.6°C. These formed focused black smokers on contact with cold seawater (figure 3A).
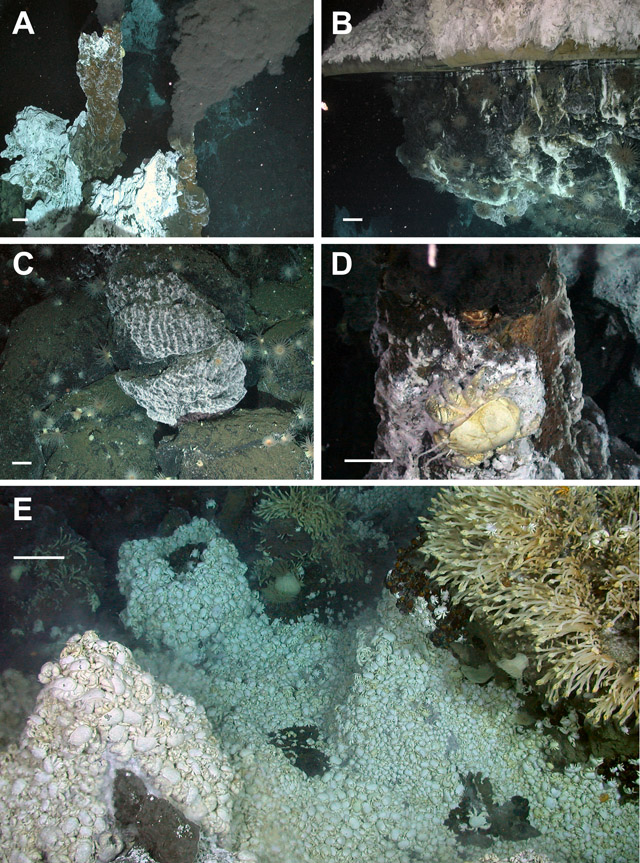 |
Figure 3. Photographs of vents and associated biological communities. (A) Active black smoker chimneys at vents site E2 (2,602 m depth). Note the chimneys emitting dark-colored chemical-laden water into the seabed through vents, hitting cold seawater and causing metallic sulfides to precipitate. (B) Vent flange at E2 with trapped high-temperature reflective hydrothermal fluid (2,621 m depth). (C) Microbial mat covering rock surfaces on vent periphery at E2 (2,604 m depth). (D) Active vent chimney at vents site E9 supporting the new species of the anomuran yeti crab Kiwa (2,396 m depth). (E) Dense mass of the anomuran crab (Kiwa n. sp.) at E9 with the stalked barnacle (cf. Vulcanolepas) attached to nearby chimney (2,397 m depth). Scale bars: 10 cm for foreground. Courtesy of Rogers and others (2012). |
Some of the chimneys have expanded tops with hot (above 300°C) vent fluid emanating from the underside (figure 3B), similar to the flanges found at North East Pacific vents. Diffuse vent flow was observed at a variety of locations, with temperatures varying from 3.5 to 19.9°C, compared with a background temperature of ~0.0°C. Around the periphery of the active high-temperature vents and diffuse flow sites are microbial mats that form a halo around the venting area at E2 (figure 3C).
Site E9 is situated between 60°02.5’ and 60°03.00’S and between 29°59’ and 29°58.6’W, at ~2,400 m depth, amongst relatively flat sheet lavas to the N of a major collapse crater named the Devil’s Punchbowl (figure 2D). The ridge axis is heavily crevassed and fissured, with numerous collapse features, lava drain-back features, and broken pillow lava ridges. Major fissures run NNW-SSE through the site, breaking up an otherwise flat and unvaried terrain (figure 2E).
Topographic highs in the center of the study site lack hydrothermal activity and thus are possibly inactive magma domes. Most active venting appears to lie along one of the smaller fissures, W of a main N-trending feature. Diffuse flow and black smokers line the feature intermittently, but activity becomes reduced and dies away farther S, towards the “Punchbowl.” The chimneys were either emitting high-temperature fluids with a maximum temperature of 382.8°C (Ivory Tower; figure 3E) or had lower temperature diffuse flow, between 5 and 19.9°C (Car Wash vent; figure 3E). Low-temperature diffuse flow was associated with fissures and fine cracks in the sheet lava; the background temperature at E9 varied from -0.11 to -1.3°C.
Deep-sea hydrothermal vents. The ESR vents can be seen in the broader context of deep-sea hydrothermal vents. Hydrothermal vents are essentially hot springs on the ocean floor.
Figure 4 shows the locations of many of the Earth’s known deep-sea hydrothermal vent systems. International Cooperation in Ridge-Crest Studies (InterRidge - a non-profit international organization promoting mid-ocean ridge research) created this map for the International Seabed Authority to show locations of vents that should be protected from exploitation.
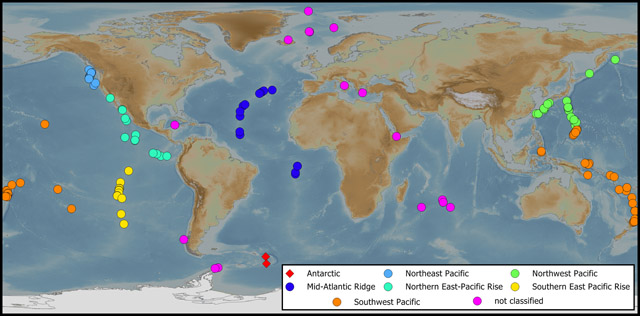 |
Figure 4. Deep-sea hydrothermal vent systems that require protection from exploitation, according to InterRidge (Chown, 2012). Vent biogeographic provinces identified by Bachraty and others (2009) are displayed using color, and the two East Scotia Ridge vents sites described by Rogers and others (2012) are indicated with diamonds, just to the east of the Antarctic Peninsula. A full list of vent sites can be found on InterRidge’s web pages (see Information Contacts, below). The base map is the NOAA global relief model. Modified from Chown (2012); figure compiled by Aleks Terauds. |
References. Bachraty C., Legendre, P., and Desbruyères, D., 2009, Biogeographic relationships among deep-sea hydrothermal vent faunas at global scale, Deep Sea Research, Part I, v. 56, no. 8, p. 1371-1378.
Chown, S.L., 2012, Antarctic marine biodiversity and deep-sea hydrothermal vents, PLoS Biology, v. 10, no. 1, e1001232. doi:10.1371/journal.pbio.1001232 (URL: http://www.plosbiology.org/article).
Corliss, J.B.. Dymond, J., Gordon, L.I., Edmond, J.M., von Herzen, R.P., Ballard, R.D., Green, K., Williams, D., Bainbridge, A., Crane, K., and van Andel, T.H., 1979, Submarine thermal springs on the Galapagos Rift, Science, v. 203, no. 4385, p. 1073-1083. doi: 10.1126/science.203.4385.1073.
InterRidge, 2012, InterRidge Vents Database (URL: http://www.interridge.org/irvents).
Rogers, A.D., Tyler, P.A., Connelly, D.P., Copley, J.T., James, R., Larter, R.D., Linse, K., Mills, R.A., Garabato, A.N., Pancost, R.D., Pearce, D.A., Polunin, N.V.C., German, C.R., Shank, T., Boersch-Supan, P.H., Alker, B.J., Aquilina, A., Bennett, S.A., Clarke, A., Dinley, R.J.J., Graham, A.G.C., Green, D.R.H., Hawkes, J.A., Hepburn, L., Hilario, A., Huvenne, V.A.I., Marsh, L., Ramirez-Llodra, E., Reid, W.D.K., Roterman, C.N., Sweeting, C.J., Thatje, S., and Zwirglmaier, K., 2012, The discovery of new deep-sea hydrothermal vent communities in the Southern Ocean and implications for biogeography, PloS Biology, v. 10, no. 1, e1001234. doi: 10.1371/journal.pbio.1001234 (URL: http://www.plosbiology.org/article).
Information Contacts: International Cooperation in Ridge-Crest Studies (InterRidge) (URLs: http://www.interridge.org; http://www.interridge.org/irvents); VENTS Program, Pacific Marine Environmental Laboratory (PMEL), National Oceanographic and Atmospheric Administration (NOAA) (URL: http://www.pmel.noaa.gov/vents/).