Atmospheric Effects (1980-1989)
The enormous aerosol cloud from the March-April 1982 eruption of Mexico's El Chichón persisted for years in the stratosphere, and led to the Atmospheric Effects section becoming a regular feature of the Bulletin. Descriptions of the initial dispersal of major eruption clouds remain with the individual eruption reports, but observations of long-term stratospheric aerosol loading will be found here.
Bulletin Reports - Index
Reports are organized chronologically and indexed below by Month/Year (Publication Volume:Number), and include a one-line summary. Click on the index link or scroll down to read the reports.
September 1980 (SEAN 05:09)  Cite this Report
Atmospheric effects of probable volcanic origin
In the Tucson, Arizona area (32.25°N, 110.95°W), Marjorie and Aden Meinel report strongly enhanced sunset glows beginning 24 August. That evening, silvery, undulate striae, similar to phenomena associated with the 1974 Fuego eruption, were seen at sunset against a glowing background. As the sun set, striae and background passed simultaneously through the same sequence of colors, indicating that they were at the same altitude, calculated by the Meinels to be about 19 km. The striae were not visible the following evening, but the strong background glow recurred and a secondary glow was visible until about 70 minutes after sunset, as after the eruptions of Krakatau in 1883 and Agung in 1963. The glow became fainter on succeeding evenings, but a strong enhancement occurred 16 September and the glow was still nearly as bright several days later. The Meinels believe that the August phenomena were probably caused by material injected into the upper atmosphere by the 17 August eruption of Hekla, while the September enhancement could have been due either to a return of the Hekla material or normal seasonal trends in glow intensity.
In England, H.H. Lamb observed a week or more of reddened sunsets, culminating in a colored ring around the sun seen from Ketteringham, Norfolk before sunset on 12 June. The same evening lidar observations confirmed the presence of a dust veil over Garmisch-Partenkirchen, West Germany (47.5°N, 11.0°W). Lamb saw no apparent abnormal coloring the following week, nor was any observed during the few breaks in bad weather from late June through mid-July. On 14 July, unusual light diffusion in brownish layers above cumulonimbus clouds was followed by a shower that deposited russet-colored mud. Meteorological data suggest transit from the Arctic. By early September, clear skies showed a brownish coloration at sunset and more than usually diffused light around the sun, interpreted by Lamb to indicate a rather thin dust veil.
Information Contacts: Marjorie Meinel and Aden Meinel; H. Lamb, Univ. of East Anglia, England.
May 1981 (SEAN 06:05) Cite this Report
Volcanic material in stratosphere over Virginia, Wyoming, and Colorado; source uncertain
A thick zone of probable volcanic material was observed in the upper troposphere and lower stratosphere during the night of 8-9 June. NASA's lidar at Hampton, Virginia (37.1°N, 76.3°W), operating at the ruby wavelength of 0.6943 µm, recorded several layers with scattering ratios greater than the normal background reading of 1.1 (scattering ratio = 1 + aerosol scatter/molecular scatter). Thin layers were centered at altitudes of 17.4 km (about 1 km thick, scattering ratio 1.5) and 16.5 km (about 1/2 km thick, scattering ratio 1.3). A much broader layer extended downward from 16 km through the tropopause at 13.3 km to 12 km altitude. Within this broad layer, clearly-defined scattering peaks were located at 14.9 km and 14.1 km, both with scattering ratios of 2. Residual material from St. Helens remains in the stratosphere, raising the background scattering ratio to 1.2.
Weather balloons launched from Laramie, Wyoming (41.33°N, 105.63°W) began to detect volcanic material 16 May. Since then, a thick zone showing some variation in structure has remained between 12 and 18 km altitude. During the night of 8-9 June, an intense new volcanic layer between 11 and 14 km altitude joined the post-26 May material over Laramie and nearby Boulder, Colorado. The previous material, concentrated between 16 and 18 km, was truncated by a reversal in wind direction at 18 km altitude.
The two most likely source volcanoes are Alaid and Pagan, which both injected eruption columns into the stratosphere, at the end of April and on 15 May respectively. No other major explosive eruptions have been reported since then.
Information Contacts: P. McCormick, NASA Langley Research Center, VA; D. Hofmann and J. Rosen, Univ. of Wyoming.
July 1981 (SEAN 06:07) Cite this Report
Volcanic material below the tropopause over NW North America in mid-July; source unknown
High-altitude aerial sampling 9, 10, and 13 July revealed at extensive zone of sulfate aerosols and silicate fragments just below the tropopause at high northern latitudes.
On 9 July, instruments aboard a Los Alamos Scientific Laboratories (LASL) B-57 research aircraft, flying at an altitude of about 13.5 km from Seattle, Washington (47.5°N, 122.5°W) about 2,300 km to Anchorage, Alaska (62°N, 149°W), sampled a very constant sulfate concentration of 0.7-0.8 mg/m3, well above the normal mid-latitude background of about 0.1 mg/m3. The next day, flying directly N from Anchorage at a constant 12 km altitude from 62°N to 75°N (a distance of more than 1,500 km) along the 145° meridian, sampling instruments measured sulfate concentrations of about 1.5 mg/m3. A few silicate particles, larger than 1 mm and probably coated with acid, were also recovered. At 75°N, the aircraft climbed through the tropopause, just above the 12 km altitude of the northbound flight path, to about 16.5 km, then flew S at that altitude back to 62°N. The zone of high sulfate and silicate concentration terminated sharply at the tropopause and no unusual concentrations were recorded in the stratosphere during the return flight.
A U-2 aircraft operating from the NASA Ames Research Center near San Francisco (37.33°N, 121.92°W) flew at gradually increasing altitude to about 50°N, 155°W on 13 July. As the aircraft climbed toward the tropopause, marked by the polar jet stream, concentrations of sulfate increased gradually from about 2 mg/m3 to about 4.5 mg/m3. Some silicate particles were also collected. Sulfate concentrations of 2 mg/m3 or higher were measured for about 2 hours of flight time, representing a lateral distance of about 1,800 km. As in the 9-10 July flights, the zone of high sulfate and silicate concentration was truncated abruptly at the tropopause. While descending on the return leg of the flight, a sulfate concentration of 5 mg/m3 was recorded at the top of the polar jet stream.
While the sulfates and silicates sampled from the aircraft were almost certainly of volcanic origin, it is not yet possible to pinpoint their source, nor their time of eruption [but see 6:10]. Airmass movement in the days prior to 9 July will be analyzed to help locate a probable source area and the presence or absence of significant variation in silicate chemistry should help determine whether all are from a single eruption or whether multiple sources are likely.
Information Contacts: R. Chuan, Brunswick Corp., CA; W. Rose, Jr., Michigan Tech. Univ.
October 1981 (SEAN 06:10) Cite this Report
Aircraft and satellite data on stratospheric ejecta from four eruptions
Filter samples from LASL high-altitude aircraft and data from NASA's SAGE satellite provided information about the height and dispersal of the eruption cloud ejected by Ulawun in October 1980, and the LASL aircraft also collected tephra probably produced by the May 1981 eruption of Pagan.
Ulawun's brief but powerful eruption took place 6-7 October 1980, producing a cloud estimated by ground observers to have reached 7-10 km in height. On 24 October, the aircraft sampled the lower stratosphere at about 19 km altitude, between the equator and 5°N at about 80°W (just S of Panama). Data from these samples indicated atmospheric concentrations of as much as 6 parts per billion (ppb) of sulfate by mass, of which only 25-50% could be attributed to the 18 May eruption of St. Helens. The SAGE satellite detected tephra from St. Helens N of 40°N in October 1980, but also detected a large cloud of new material from 26°N to 10°S (data collection was truncated at 10°S) between 125°W and the International Date Line. SAGE next collected data from the equatorial region in mid-November, when a zone of significant particle enhancement (roughly 5 times background), extending upward from the tropopause (about 16.5 km altitude at the equator) to about 22 km, circled the globe in an irregular band 10-20° wide between 20°S and 10°N.
Pagan's eruption began 15 May. Japanese weather radar recorded the top of the eruption column at 18-20 km altitude and weather satellite images showed that the high-altitude cloud traveled SSE. Ten weeks later, filter samples collected by the LASL aircraft just S of Panama (from the equator to 5°N) on 24 July showed lower stratospheric sulfate concentrations of about 5 ppb by mass at altitudes of 18.2, 19, and 19.2 km. Between 5°N and 35°N at 16.8 km altitude (above the tropopause), sulfate concentrations were as high as 4 ppb by mass; only about 1 ppb could be attributed to material remaining from the St. Helens eruption 14 months earlier. High concentrations of sulfate aerosols and silicate particles collected at mid to high northern latitudes in early July are probably from the late April-early May eruption of Alaid. From these data, the average lower stratospheric sulfate concentration over the entire Northern Hemisphere in July 1981 was calculated to be about 2.5 ppb by mass, primarily contributed by the eruptions of Pagan and Alaid but including a little material from the St. Helens eruption. The same calculations made from July 1980 data yielded a slightly lower concentration, about 2.3 ppb by mass, with St. Helens as the dominant source. In the last decade, only two relatively brief periods can be identified as showing "background" sulfate concentrations, without a substantial volcanic component: mid-1973 through mid-1974 (about 0.34 ppb sulfate by mass), and late 1978 through late 1979 (about 0.47 ppb sulfate by mass).
Information Contacts: W. Sedlacek, LASL; P. McCormick, NASA.
January 1982 (SEAN 07:01) Cite this Report
Stratospheric aerosols from unknown source
A sudden increase in stratospheric aerosols was recorded on 23 January at 1200 GMT by the Nd-YAG lidar, wavelength 1.06 µm, operated by Kyushu University, Fukuoka, Japan (33.65°N, 130.35°E). The scattering ratio at 17 km altitude (about 4) was about 20 times the normal average value. The same equipment detected a strong aerosol layer at 11-17 km on 30 January and a very strong layer at 10-17 km on 2 February. Peak concentrations were about the same as those recorded 1 month after the 18 May 1980 eruption of St. Helens. NOAA's lidar unit on Mauna Loa, Hawaii (19.5°N, 155.6°W) detected a several-kilometer-thick layer centered at 17 km on 28 January, and its next reading, on 4 February, showed 2-3 different layers between 17 and 20 km altitude. No unusual atmospheric debris had been detected during the previous measurement by this instrument on 19 January. Lidar data gathered during clear weather the last week in January from Wallops Island, Virginia (37.9°N, 75.5°W) revealed no notable stratospheric material. However, ground-based ruby lidar at Garmisch-Partenkirchen, West Germany measured strong aerosol layers at 13-16 km on 2 February and 15-17 km the next night.
Motokazu Hirono interpreted the fine structures of the Kyushu University lidar profiles to indicate a volcanic source. However, SEAN has no recent report of a large explosive eruption and the source of the stratospheric aerosols is not yet known.
Reference. Hirono, M., Fujiwara, M., Shibata, T., and Kugimiya, N., 1981, Lidar Observations of Volcanic Clouds in the Stratospheric over Fukuoka caused by Eruptions of St. Helens in May 1980; Geophysical Research Letters, v. 8, no. 9, p. 1019-1022.
Information Contacts: M. Hirono, Kyushu Univ., Japan; B. Mendonça, NOAA/Air Resources Lab, CO; P. McCormick, NASA, VA; R. Reiter, Garmisch-Partenkirchen, W. Germany.
February 1982 (SEAN 07:02) Cite this Report
Voluminous volcanic aerosol cloud; source uncertain
A widely-distributed and voluminous cloud of aerosols remained in the upper troposphere in early March. Aircraft observations indicated that aerosols had been disseminated over broad areas of middle and lower northern latitudes by mid-February. Although the cloud was clearly of volcanic origin, no eruption has been unequivocally identified as its source.
Solar irradiance measurements. On 11 January a pyrheliometer (which measures direct solar irradiance over a broad spectrum at the earth's surface) at Mauna Loa Observatory, Hawaii detected a substantial decrease in solar radiation, nearly as large as that measured after the major eruption of Agung in 1963. A small decrease measured by this instrument during its preceding reading 4 January was within the noise level. Lidar data collected at Mauna Loa indicated that material in the upper troposphere, between 10 and 13 km altitude, was responsible for the initial decrease. Solar irradiance has remained low at Mauna Loa, as it did for about 3 years after the Agung eruption. A pyrheliometer at Aspendale Observatory, Australia (about 38°S, 145°E) had shown no major increase in atmospheric turbidity as of early March. No other atmospheric data are presently available from the Southern Hemisphere.
Lidar and balloon measurements. Stratospheric aerosols were first detected by lidar on 23 January at Kyushu University, Fukuoka, Japan as a thin layer centered at about 17 km altitude. Scattering ratios were at background levels during their next observation 26 January but each measurement since then, beginning 30 January, has recorded backscatter from the cloud, with peak concentrations on 2 February. Their most recent data, on 3 March, indicated the presence of an aerosol layer between 9 and 17 km altitude.
No stratospheric layer was evident on the Mauna Loa lidar until 28 January (9 days after the preceding measurement). It continued to detect stratospheric material through late February and on the 26th the aerosol layer was about 3 km thick, centered at 18 km altitude. Lidar data collected during poor conditions 5 March showed an apparently weak layer centered at 17.3 km. No aerosol layer was detected during a balloon flight from Laramie, Wyoming 5 February, but instruments aboard balloons launched 17 and 27 February measured aerosol concentrations between 13.5 and 18 km altitude that were similar to those observed following the 18 May, 1980 eruption of St. Helens. William Fuller reports that lidar data obtained 26 January from Hampton, Virginia indicated that the stratosphere at this latitude was reasonably clear, with peak backscattering ratios at about background levels. Measurements made with the NASA Langley Research Center airborne lidar 10 February from the ground at Wallops Island, Virginia showed a considerable increase in stratospheric material. The base of the layer was at 12 km and it extended to 18 km with a peak backscattering ratio 4-5 times greater than normal. Stratospheric lidar measurements will continue on a regular basis from Hampton with a ground-based 48-inch lidar and possibly with the airborne lidar. During the night of 8-9 March, the ground-based lidar at Hampton detected the aerosol layer between 12.9 and 16.5 km.
Airborne lidar measurements - Virginia to Costa Rica. By mid-February, stratospheric aerosols were distributed over a broad area of the Northern Hemisphere, as described in the following report from William Fuller.
"A flight was conducted 13 February from Wallops Island to San José, Costa Rica (9.9°N, 84.1°W) with the lidar on board the NASA Wallops Electra aircraft. Lidar measurements indicated that the very intense stratospheric layer was present along the entire flight path. As the aircraft proceeded S, the layer became very intense until the maximum scattering ratio occurred at 21°N, 87.1°W, just E of the Yucat n Peninsula. The stratospheric layer remained strong to 10°N, 82-83°W where the southernmost measurement was made. On the return flight 21 February, lidar measurements were made from New Orleans (30.0°N, 90.05°W) to Wallops Island and the stratospheric layer continued to be present."
Aerial sampling. On 6 March at about 1900 GMT, impact samples of the aerosol cloud were collected at about 20°N, 96.2°W (SW Gulf of Mexico) on a grid carried by a NASA U-2 aircraft. The samples were similar to those collected from the St. Helens aerosol cloud 1-2 weeks after the 18 May, 1980 eruption. More than 70 particles/cm3 greater than 0.6 µm in diameter, all liquid droplets, were recovered at 16.75 km altitude. Preliminary analysis by the Atmospheric Experiments Branch of the NASA Ames Research Center showed that substantial quantities of H2SO4 were present in the cloud, indicating that its source was volcanic. Virtually no mineral grains were recovered. Hand-held geiger counters in the aircraft recorded radioactivity at only one-half of normal background. Additional analyses of the 6 March samples are planned, as are a series of additional flights.
Unusual sunsets - Arizona. Aden and Marjorie Meinel saw sunset glows from Tucson, Arizona beginning 23 January, when late twilight coloration indicated possible enhancement in the region between 18 and 20 km altitude. Glow was stronger the next night and on 15 January glowset was 43 minutes after sunset. The glow was weaker 26 and 27 January, and after cloudy weather 28-29 January, no enhancement was visible 30 January. The Meinels observed a faint glow 19 February, similar to that of 24 January, but after two nights of cloudiness saw none 22 February. Glow was next visible from Tucson 2 March and was present for the next 2 nights.
Information Contacts: W. Fuller, P. McCormick, and M. Fujiwara, NASA, VA; B. Ragent, G. Ferry, V. Overbeck, K. Snetsinger, and D. Hayes, NASA Ames Research Center, CA; K. Coulson, Mauna Loa Observatory (MLO), HI; B. Mendonça, NOAA, CO; A. and M. Meinel, Univ. of Arizona; J. Rosen, Univ. of Wyoming; M. Hirono, Kyushu Univ., Japan; J. Gras, CSIRO, Australia.
March 1982 (SEAN 07:03) Cite this Report
Volcanic cloud remains in stratosphere; source still uncertain
The widely-distributed volcanic aerosol cloud remained in the lower stratosphere through early April. Since 29 January, each lidar measurement at MLO has detected the cloud. As of 9 April, it was centered at about 18 km altitude (with a peak backscattering ratio of 1.6) and was about 2 km thick. A balloon flight the first week in April from Laramie, Wyoming showed a broad layer centered at 18 km altitude. From Hampton, Virginia, lidar data 8 April showed a 3-km-thick layer centered at about 17 km altitude (backscattering ratio about 1.6). The cloud has also been intermittently present over Toronto, Canada (43.6°N, 70.5°W) since early March.
A NASA sampling aircraft flew S from San Francisco 18 March, and collected about 20 times the normal concentration of H2SO4 from a layer at the base of the stratosphere. Silicate particles about 0.25 µm in diameter were present both as discrete fragments and within the acid droplets. Chemical analysis of these particles showed that they contained no Na, and their Si/Al ratio was consistent with a basaltic composition. Additional sampling flights are planned in mid-April by NASA and LASL.
No eruption can be unequivocally identified as the source for the cloud. Careful inspection of satellite images has yielded no large eruption clouds that had gone unreported from the ground, but cloudy weather often obscured volcanically active areas of the world. The best candidate appears to be Pagan (18.13°N, 145.80°E), where moderate explosive activity was reported in early January. However, no ground observations are available between 6 January and 8 February, and the source eruption for the cloud probably occurred in mid-January. Careful inspection of images from the Japanese geostationary weather satellite by Yosihiro Sawada showed a possible volcanic cloud from Pagan 14 January at 1900 local time (0900 GMT), but interference from weather clouds made this impossible to confirm. Sawada observed a similar feature on an image returned at 2200 local time 19 January 1981, the same day that visiting islanders reported explosive activity.
[Unpublished data from NASA's Total Ozone Mapping Spectrometer (TOMS), which is sensitive to the SO2 that is emitted by most eruptions, strongly suggest that this cloud was ejected by Nyamuragira (Zaire) during the initial explosive phase of its December 1981-January 1982 eruption.]
Information Contacts: R. Chuan, Brunswick Corp.; Y. Sawada, Meteorological Research Inst., Japan; N. Banks, USGS-HVO, HI; K. Coulson, MLO; W. Fuller, NASA, VA; D. Hofmann, Univ. of Wyoming; B. Ragent, NASA, CA; W. Evans, ARPX-AES, Downsview, Canada.
June 1982 (SEAN 07:06) Cite this Report
Lidar from Hawaii, Japan, and southeastern US; unusual sunrises and sunsets
The initial dispersal of the major stratospheric cloud from the March-April, 1982 eruption of El Chichón is described in the El Chichón [volcano reports]. Its persistent atmospheric effects are reported below.
Lidar data collected in June at Mauna Loa, Hawaii showed backscattering that typically increased from near the base of the stratosphere to a peak at 26-27 km altitude, with significantly enhanced values to 33-34 km. Data were less variable from night to night and layering within the cloud was less distinct than in May. The cloud above Hawaii has apparently affected incoming solar radiation, measured for about 50 years by the Hawaiian Sugar Planters Association. Although mean daily solar radiation would normally have been about 110% of the long-term average (because precipitation in May at the primary station was only 27% of normal), the measured value for the month was only 92% of average.
Lidar at Fukuoka, Japan showed decreased backscattering from the 21-29 km layer in late June, but backscattering increased again in early July. The less dense layer at 18.5 km remained stable through this period. In early July, backscattering detected by lidar at Hampton, Virginia increased sharply for the (highest) layer centered at about 25 km altitude, approaching those values measured at lower latitudes for the first time.
To assess latitudinal variation in the stratospheric cloud, a lidar-equipped NASA aircraft flew from Wallops Island, Virginia to Puerto Rico during the night of 8-9 July, to about 12°N (near the coast of Venezuela) 10 July, and from Puerto Rico to the vicinity of Albany, New York (about 42°N) 11 July. From 25-30°N to the southern limit of the flight, preliminary data show greatly enhanced backscattering from a dense layer between 21 and 33 km altitude. Some material was present below 21 km, but it was much less dense. Strong local variation in the cloud was observed. Although the cloud diminished in density N of 25-30°N, significantly enhanced stratospheric backscattering was detected to the N limit of the flight.
Brilliant sunrises and sunsets - Saudi Arabia. Weather satellite images first showed the front of the 4 April stratospheric cloud (visible over water during the day) over the Red Sea 21 April. Edward Brooks, who has made frequent sunrise and sunset observations from Jeddah, Saudi Arabia (21.5°N, 39.16°E) saw WNW-ESE-trending bands of haze in the WNW sky after sunset 20 April and similar bands before dawn the next morning. The twilight of 24 April was a brilliant pink from bands and patches of WSW-ENE-trending aerosol. During the next several weeks, volcanic cloud effects could be seen in the sky around sunrise and sunset most days, often as bands of material oriented within 45° of E-W. Brooks observed a layer 10° above the horizon at twilight 18 May and calculated its altitude at roughly 20-25 km. Multiple layers began to be visible in June. At sunrise on 5 June, criss-cross bands of aerosol trended SW-NE and SSE-NNW. Brilliant sunrises and sunsets were common in mid-June. Beginning on 19 June, many sunrises illuminated two distinct layers, at about 30-minute intervals. This effect weakened later in the month and by 30 June the higher layer (illuminated earlier in the morning) had disappeared. Brooks and others also noted that on 6 July roughly the upper half of the eclipsed moon was considerably darker than the lower half, which Brooks interprets as indicating the presence of volcanic aerosols in the atmosphere of the earth's northern (but not southern) hemisphere.
Further References. Galindo, I., Hofmann, D.J., and McCormick, M.P., eds., 1984, Atmospheric Effects of the Volcanic Eruption of El Chichón; Geof¡sica Internacional, v. 23, nos. 2-3, p. 113-448 (22 papers).
Pollack, J.B., Toon, O.B., Danielsen, E.F., Hofmann, D., et al., eds., 1983, The El Chichón Volcanic Cloud: An Introduction; Geophysical Research Letters, v. 10, no. 11, p. 989-1128 (18 papers).
Information Contacts: W. Fuller and P. McCormick, NASA; T. DeFoor, MLO; M. Hirono, Kyushu Univ., Japan; E. Brooks, Saudi Arabia; K. How, Hawaiian Sugar Planters Assoc.; M. Matson, NOAA/NESS.
July 1982 (SEAN 07:07) Cite this Report
Cloud movement; lidar measurements; observations from the southwest Pacific area
The major stratospheric cloud remained dense over lower northern latitudes. It has been estimated to cover the earth from S of the equator to as far N as Japan between 21 and 33 km altitude and to average 9.6 km thick. Lidar measurements and reports from England indicated that gradual northward dispersal was continuing.
At Mauna Loa, Hawaii, lidar measurements showed that cloud material was densest at 25-27 km altitude. Lidar at Fukuoka, Japan showed increasing concentrations during July at 22-25 km altitude. Measurements of well-resolved fine structures on 26 July showed a more dense layer at 22-24 km and a less dense one at 28-29 km. The backscattering ratio of 42 at 25 km altitude detected 1 July by lidar at Hampton, Virginia was the highest ever observed in the stratosphere from there. Measurements from the 8-13 July NASA flight revealed several separate layers of material, with greatest concentrations between 24 and 26 km altitude.
As observed from Norwich, England (52.5°N, 1°E) the cloud was a thin veil that was not always present. On most evenings when the sun was visible, a round area of diffused pale bluish-white light appeared around the sun, extending 20-30° out from it and remaining obvious after sunset. On 28 and 29 May a brownish band appeared around the perimeter of the bright area, separating it from blue sky; this was interpreted as Bishop's Ring. A similar ring and a prominent sun pillar were noted around the midnight sun on 13 June at latitude 67.5°N between Bodí and the Lofoten Islands, Norway.
Observations from Australia, Samoa, and New Zealand. This report is from John Gras and Keith Bigg.
"At Sydney, Australia (33.77°S, 151.1°E) brilliant sunsets have been observed consistently since 17 June until present (21 July). Twilight intensity measured at 20° elevation was also greatly enhanced on 24 May, but had subsided on 30 May increasing again by 17 June. Shadow heights indicated layers at 15 and 25 km on 24 May and between 15 and 20 km subsequent to 17 June.
"Brilliant twilights were also observed at Samoa (14.28°S, 170.68°E) during a visit 19-29 June. Twilight intensity and shadow height on 27 June indicated a pronounced layer at 20 km.
"No enhancement of twilight was evident at New Plymouth, New Zealand (39°S, 174°E) 26 June-2 July."
Information Contacts: W. Fuller, NASA; M. Hirono, Kyushu Univ., Japan; H. Lamb, Univ. of East Anglia, England; John Gras and Keith Bigg, CSIRO Division of Cloud Physics, Australia.
August 1982 (SEAN 07:08) Cite this Report
Northern hemisphere observations and lidar
Lidar measurements from several locations in the northern hemisphere suggest that the bulk of the El Chichón stratospheric cloud remains confined to lower northern latitudes. Measurements at MLO, Hawaii showed that the cloud remained densest at 25-27 km altitude, but seemed more uniform than last month. Lidar at Fukuoka, Japan showed the aerosols in multi-layer structures above 21 km, in the easterly winds, but well-mixed below that altitude, in the westerly winds. Over Hampton, Virginia, multiple layers were detected between 16 and 31 km, but lower backscattering ratios indicated that the aerosols were much less dense than over Hawaii or Japan. Farther N, at L'Aquila, Italy (42.37°N, 13.4°E) large aerosol enhancements were detected 28 July, and 5, 11-21, and 25-30 August. Layers 3-4 km thick with backscattering ratios as large as 10-12 were observed around 25 km altitude, and on 26 August there was a layer at 32 km altitude with a backscattering ratio of 2.
Scientists from the Department of Physics and Astronomy, University of Wyoming studied the cloud during two unmanned, balloon flights from S Texas (27.3 and 27.7°N) and 7 flights from SE Wyoming (41°N). Optical particle counter measurements of the concentration of particles with radii greater than 0.15 µm revealed two stratospheric layers. The lower layer was 2-3 km thick with peak concentrations, at least 40 times background levels, at about 18 km. The upper was about 3 km thick with peak concentrations, at least 200 times background levels, at about 25 km. Ten sublayers were identified in the upper layer over Texas in May, but only some were found over Wyoming before July.
Since early September brilliant colors persisting at least 30 minutes after sunset have been observed from Norwich, England. At that time on 7 September the brightest area was faintly rimmed with a brown band, interpreted as Bishop's Ring. On 8 September, long smooth streaks at an altitude of 20-25 km were illuminated until 30-35 minutes after sunset.
Information Contacts: T. DeFoor, MLO; M. Hirono, Kyushu Univ., Japan; P. McCormick and W. Fuller, NASA; G. Visconti, Univ. L'Aquila, Italy; D. Hofmann, Univ. of Wyoming; H. Lamb, Univ. of East Anglia, England.
September 1982 (SEAN 07:09) Cite this Report
Little stratospheric cloud movement evident in satellite, lidar, and balloon data
Satellite, lidar, and balloon data continue to indicate that little latitudinal movement of the stratospheric cloud has occurred in recent months. Mean monthly sea surface temperatures determined from the NOAA 7 satellite have been as much as 3°C lower in some regions than the actual ocean temperatures measured at the same time and place by ships, apparently because of interference from the El Chichón cloud. Previous work had shown that the satellite temperatures are normally quite accurate, varying from ship measurements by a maximum of about 0.5°C. Significant discrepancies between actual temperatures and satellite temperatures have remained between 10°S and 30°N, with maximum variations from 15-20°N. No substantial northward movement has been detected through September. Variations peaked in June and July, declining somewhat in August and September.
September lidar data showed gradual vertical expansion of the cloud but little evidence of large-scale northward movement. Layers were detected below the tropopause in Hawaii, but this material may be from Galunggung or some other source, rather than from El Chichón. Balloon soundings from Wyoming (41°N) continued to show a very broad layer around 18 km altitude and some layers as high as 25 km during September, but there were large variations between soundings. The upper layers were not as broad as they had been over Texas (about 27.5°N) during previous measurements. When samples collected from these layers by the Wyoming sondes were heated to 150°C, 98% of the material volatilized, a result consistent with an H2SO4-H2S composition. The composition of the particulate matter, the 2% that did not volatilize, has not been determined.
Brilliant sunsets continued to be seen by H.H. Lamb from Norwich, England through mid-September. A probable Bishop's Ring was seen after sunset 7 September and long, smooth streaks at 20-25 km altitude were illuminated the next evening, but low-level haze prevented any useful observations 9-10 September. No anomalous features were present at sunset or during twilight on the 11th, but a brightly-colored layer could be seen around sunset 12-14 September. The timing of the end of illumination of this layer indicated that it was at about 21 km altitude. When dark, it showed a structure of long streaks.
In late October, government and university scientists will begin a satellite and field experiment designed to determine the key radiative, dynamical, and chemical properties of the El Chichón stratospheric eruption cloud. A NASA Electra aircraft, equipped with a number of remote sensors (including 2-wavelength lidar, 13-channel sun photometer, 4-channel direct diffuse photometer, and Brewer spectrometer) will collect data over the US, the Caribbean, and Central and South America between 19 October and 5 November. The flight plan will be coordinated with a number of concurrrent in-situ and satellite (SME, NOAA/TIROS N, NIMBUS 7, and GOES) measurements. Coordinated rendezvous are planned with high-flying aircraft and with balloon experiments in Texas, New Mexico, and Wyoming. Comprehensive data sets from this research will be made readily available to the scientific community. For more information, contact Pat McCormick or George Maddrea at NASA Langley Research Center.
Information Contacts: W. Fuller, P. McCormick, and G. Maddrea, NASA; T. DeFoor, MLO; M. Hirono, Kyushu Univ., Japan; A. Strong and M. Matson, NOAA/NESS; D. Hofmann, Univ. of Wyoming; B. Mendonça, NOAA; H. Lamb, Univ. of East Anglia, England.
October 1982 (SEAN 07:10) Cite this Report
Ejecta from El Chichón reaches both poles; lidar and sunset observations
In late October and early November, a NASA Electra aircraft with a package of remote sensing instruments on board gathered data on El Chichón's stratospheric cloud from about 46°N to 46°S. Only very preliminary results were available at press time. Lidar profiles were collected over the entire flight path, optical depths of the atmosphere were determined by sun photometry at 13 wavelengths, and the total SO2 and O3 columns over the aircraft were measured. No dramatic changes in the position or morphology of the cloud appeared to have occurred since a similar flight (N Hemisphere only) 8-13 July. Stratospheric material was detected over the entire flight path, and M. P. McCormick believes that ejecta from El Chichón has reached both poles. As in July, there was a distinct boundary between the much more dense cloud at lower northern latitudes and more diffuse material farther from the volcano. The densest portion of the cloud extended only a few degrees farther N in November than in July. A similar boundary was found at lower southern latitudes. The strongest concentration of aerosols was typically at 23-24 km altitude, with the base of the cloud at about 21 km, but considerable variation in its morphology was observed.
From lower northern latitudes, ground-based lidar continued to detect stratospheric debris from El Chichón, but peak backscattering ratios were smaller and occurred at slightly lower altitudes in October than in September. Farther north, however, new layers have been observed since 3 November over Garmisch-Partenkirchen, West Germany.
Edward M. Brooks resumed daily sunrise and sunset observations from Jeddah, Saudi Arabia on 26 August. Between April and June, brilliant colors had been visible 40 minutes from sunrise and sunset, indicating material at 20-25 km altitude, but by October, only faint remnants of color could be seen that long before sunrise and after sunset. However, Brooks continued to see unusual colors, although somewhat nearer to sunrise and sunset, and at dawn on 21 October observed a brown NNW-SSE-trending band that looked like volcanic ash at 10° above the ESE horizon. In early November, the timing of the appearance and disappearance of color indicated that the layers being illuminated may have only been in the upper troposphere. H. H. Lamb observed brilliant sunsets from Norwich, England in early and mid-September, but reported that sunset colors were less spectacular, although still usually abnormal, by late October.
Information Contacts: P. McCormick, NASA; T. DeFoor, MLO; M. Hirono, Kyushu Univ., Japan; S. Hayashida and A. Ono, Nagoya Univ., Japan; R. Reiter, Garmisch-Partenkirchen, W. Germany; E. Brooks, Saudi Arabia; H. Lamb, Univ. of East Anglia, England.
November 1982 (SEAN 07:11) Cite this Report
Lidar data from Germany and Hawaii; visual observations
Data from ground-based lidar distant from El Chichón indicated that the dense portion of the stratospheric cloud ejected 4 April was spreading slowly northward. However, at low latitudes, where dense aerosols have been observed since shortly after the eruption, both the altitudes and concentrations of the strongest layers have decreased noticeably in November.
During the late October-early November NASA flight between 46°N and 46°S the dense portion of the cloud terminated at 6-10°S and 30-37°N. In some areas, the edge was quite abrupt, almost cliff-like, but in other regions, it was more gradual. The N boundary of the dense aerosols was at 35-37°N in late October, but at the time of the return flight in early November an arctic air mass had pushed it back to about 30°N, its approximate July position. Peak backscattering ratios were about half of those measured in July, but the cloud had become more homogeneous. By mid to late November, however, ground-based lidar showed that the dense cloud had advanced significantly farther N.
The following is from a report from Reinhold Reiter. "Short-interval lidar observations by the Fraunhofer-Institut für Atmospharische Umwelforschung, Garmisch-Partenkirchen, West Germany have been made since October 1976. Our first lidar sighting of an aerosol cloud attributed to the El Chichón activity was on 3 May at 15-16 km altitude (figure 1). This layer, with a scattering ratio of 3 (ratio of total to molecular backscattering) at 0.69 µm (ruby wavelength) was clearly distinguishable from the layer produced by the as yet unknown eruption in late December 1981 or early January 1982 (the so-called "mystery cloud"). From 11 May on, a broad layer between 10 and 20 km had developed with a backscattering maximum at 18 km. This layer remained very steady throughout the summer months. The maximum scattering ratio of 8 was observed 16 May; later on the layer showed values of 2-3. This layer, transported by the stratospheric westerlies, was joined by aerosol layers after the end of May that were carried by the stratospheric summer easterlies above 20 km. In the height range 20-25 km, the aerosol concentrations fluctuated drastically (figure 1) and not before mid-August had a rather homogeneous aerosol layer developed. The highest scattering ratio of 14 was observed with a height resolution of 600 m at 24.6 km on 1 August. After mid-October the double structure merged into a broad layer between 13 and 25 km, which can be explained by the change of the stratospheric wind pattern to the winter regime with westerlies throughout this height range.
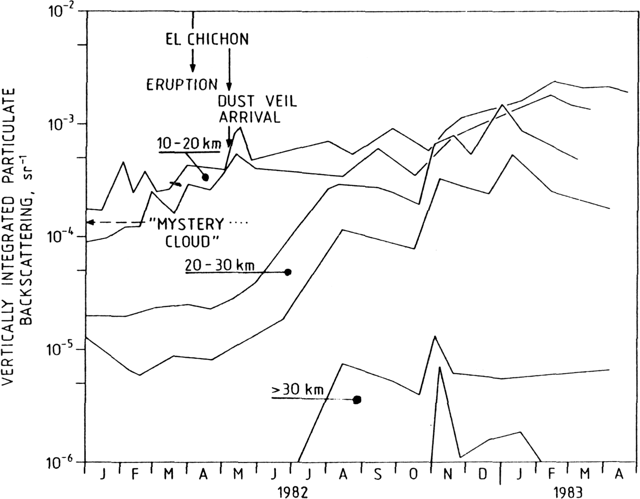 |
Figure 1. Lidar observations of volcanic aerosols over West Germany, January 1982-April 1983, showing the arrival dates of layers at different altitudes from two eruptions. Data include the passage of material from the "Mystery Cloud" [later beleived to have been ejected from Nyamuragira (Zaire) in late December 1981] and the aerosols from the March 1982 eruption of El Chichón. Vertically integrated particulate backscatter intensity (sr-1) is subdivided into 10-20, 20-30, and > 30 km altitude ranges. Measurements were made by the 694.3 nm pulsed ruby laser (height resolution 600 m) at Garmisch-Partenkirchen. |
"In November the stratospheric aerosol again changed its structure because of the arrival of the uppermost El Chichón clouds. Above 25 km, 2 new layers could be observed with scattering ratios of about 3, one centered at about 27 km, the other centered at about 30 km, tailing off to 35 km."
In Hawaii, lidar measurements showed a gradual decrease in total integrated backscatter until 3 December, when a hole appeared in in the aerosol layers at 26 km altitude, dropping integrated backscatter by nearly a factor of 2. Preliminary data from 10 December measurements indicates a return to a pattern similar to that of late November. The lower stratospheric layer first observed there in October was very strong in mid-November, but had nearly disappeared by the end of the month. In Hampton, Virginia increasingly strong backscattering ratios (twice those previously recorded at this latitude) at high altitudes were measured in November, showing that northward spread of the dense portion of the cloud had resumed, but lower stratospheric layers like those detected from Hawaii were not observed.
Unusual sunrises and sunsets were seen in Japan, Saudi Arabia, and Germany. Toshio Fujita reported fiery red glows and unusual twilights from various locations in Japan since 17 May. These were seen as far N as Sendai (38.27°N, 140.90°E) in late October. During the autumn, evening glows have been more brilliant than usual at Sapporo (43.05°N, 141.33°E). Many of these observations corresponded with detection of increased aerosols at 25-27 km altitude by the Meteorological Research Institute lidar (36°N, 140°E). Backscattering ratios ranged from 30-150. Small pale brownish halos often surrounded the moon, with diffused light extending 3-5 diameters. In Saudi Arabia, Edward Brooks continued to see long and unusually-colored dawns and twilights through early December, but noted considerable day-to-day variation. He could often see distinct bands of volcanic material (27 and 29 October, 5, 6, 11, 14-15, 17, 24, and 27 November, and 3-4 December). After sunset on 5 November, a SSW-NNE band of ash was illuminated after cirrus clouds (in the upper troposphere) had lost their illumination, indicating that the ash was at stratospheric altitudes. Separate tropospheric and stratospheric layers were illuminated before sunrise 3 December.
Information Contacts: P. McCormick and W. Fuller, NASA; R. Reiter, Garmisch-Partenkirchen, W. Germany; T. DeFoor, MLO; M. Hirono, Kyushu Univ., Japan; S. Hayashida, Nagoya Univ., Japan; T. Fujita, Meteorological Research Inst., Japan; E. Brooks, Saudi Arabia; A. Strong, NOAA.
December 1982 (SEAN 07:12) Cite this Report
Dispersal of the stratospheric aerosol cloud continues
Atmospheric data indicated continued dispersal of the dense part of the stratospheric aerosol cloud ejected by El Chichón's 4 April eruption. Balloon data from Wyoming (41°N) began to show a few isolated layers of the dense portion of the cloud in July and August. More layers gradually appeared and by 30 November about 80% of the zone between the tropopause (roughly 10 km altitude) and 30 km altitude contained aerosols from the cloud. Particle concentration dropped sharply above 30 km altitude and was two orders of magnitude lower at 32 km. By the next balloon launch on 9 December, no major gaps were evident in the aerosols within this 20 km-thick region. Data collected 30 December were similar. Particles in the upper half of the cloud averaged about 0.3 µm in diameter, as compared to a mean particle size of about 0.1 µm in the lower half, more typical of volcanic clouds. From the balloon data, the total mass of the El Chichón cloud was estimated to be 8-10 megatons, about 40 times that of the cloud ejected 18 May 1980 from St. Helens. Most of the mass of the El Chichón cloud was concentrated in its upper layers. No decay of the cloud was evident from the balloon data, indicating that the rate of particle settling did not yet exceed the rate of gas to particle conversion.
Gas and particle samples were collected for LANL between the tropopause and 20 km altitude from a WB57-F aircraft that flew from the equator to 75°N in April-May, July-August, and October. The maximum lower stratospheric sulfate concentration detected was 167 ppb by mass from a sample taken 20 April. Because the 4 April cloud had probably not reached the sampling area by then, this material is thought to have been collected from the smaller 29 March cloud. The average lower stratospheric concentrations over the entire Northern Hemisphere were calculated to be 11.85 ppb by mass in April-May, 9.27 ppb in July-August, and 7.54 ppb in October, in contrast to the July 1981 value of 2.5 ppb (primarily from Alaid and Pagan) and the July 1980 value of 2.3 ppb (mostly from St. Helens). However, unlike the 1980 and 1981 eruptions, the bulk of the material from El Chichón's explosions reached altitudes higher than 20 km, so the 1982 concentration figures represent only 20-33% of the total cloud mass, estimated at about 5 megatons from the aircraft data.
Comparison of October and December data collected from a NASA Ames Research Center Convair 990 aircraft showed that considerable mass transport of the El Chichón cloud took place in the Northern Hemisphere during the autumn. Visible wavelength optical depth measurements indicated that large quantities of material had reached 54°N, the northern limit of the flight, by mid-December. Significant variation in particle size distribution at different locations was detected. Measurements were also made at many infrared wavelengths. Data reduction was not yet complete, but spectral resolution of about 1.5% will allow isolation of the effects from volcanic components in the stratosphere from the effects of other material such as ozone. Samples were collected during U-2 flights to 21 km altitude. The concentrations of SO2 and CN had declined since the summer and new particle formation in the lower stratosphere appeared to have stopped.
Lidar data from Hawaii indicated that most of the aerosol material was between 16 and 30 km although some enhancement in backscattering was detected to 38 km. Total integrated backscatter varied, but was generally less than in November. Maximum backscatter measured from Fukuoka, Japan dropped in mid-December, but returned to November levels 5 days later. The amount of stratospheric material over Hampton, Virginia increased in December, but peak values for individual layers have not been as large as those measured over lower latitudes before significant lateral dispersal of the cloud began.
During the lunar eclipse of 30 December, the moon was much darker than normal, with only the extreme S limb showing substantial light. Edward Brooks notes that this relatively uniform darkening of most of the moon during the total phase of the eclipse suggests that the El Chichón cloud was present over all but extreme southern latitudes. Darkening of the moon during the 6 July total eclipse was asymmetrical, concentrated on its N half.
Edward Brooks continued to see some brilliant dawns and twilights from Saudi Arabia, but noted considerable variation in their intensity and length. SSW-NNE bands of ash were visible low in the ESE sky near sunrise on 14 December. Beginning in mid-December, long dawns and twilights indicated the presence of high-altitude material over the area. From Boulder, Colorado (40°N, 105.2°W), Richard Keen observed brick-red color to 1.5 hours after sunset 3-4 November and 11-12 January. This corresponds to a solar depression angle of about 18°, indicating that the volcanic material reached an altitude of about 40 km [but see 08:01]. On other nights, the glow has persisted only until a solar depression angle of 6-7° was reached, yielding a maximum cloud height of about 23 km.
Information Contacts: D. Hofmann, Univ. of Wyoming; W. Sedlacek, LASL; J. Pollack, NASA, CA; T. DeFoor, MLO; M. Hirono, Kyushu Univ., Japan; W. Fuller, NASA, VA; E. Brooks, Saudi Arabia; R. Keen, Univ. of Colorado; M. Matson and A. Strong, NOAA.
January 1983 (SEAN 08:01) Cite this Report
Stratospheric aerosol cloud data to 76°N; unusual sunrises and sunsets
Aerosol cloud - Instrumental observations. Lidar data continued to show a gradual decrease in both the altitude and intensity of backscatter from the aerosol cloud's densest layer. From Fukuoka, Japan, no notable peak was found above 21 km altitude after 24 January. A single broad layer was detected, with maximum backscatter at 18-19 km. The strongest layer over Mauna Loa, Hawaii remained at about 22 km altitude through early February while the cloud's integrated backscatter declined slowly. A layer between 16.8 and 17.4 km measured 26 January may not have been El Chichón material; it accounted for about 2% of the 26 January integrated backscatter. A 12-16 km layer was detected the same night from Wallops Island, Virginia.
Between 27 January and 5 February, a NASA P-3 Electra aircraft collected aerosol data from 27°N-76°N. The cloud was quite homogeneous from 27-38°N, with peak ruby lidar scattering ratios of roughly 8 at about 20 km altitude. To 55°N, both the upper and lower altitude portions of the aerosol cloud continued to be present, in similar concentrations. As the aircraft approached Greenland at about 55°N and entered the polar vortex, a system circulating air southward from the polar region, the upper aerosol layers disappeared fairly abruptly. However, lower stratospheric material remained, with scattering ratios of 3-8 at 15-16 km altitude, values similar to those at the same altitudes S of 55°N. As the aircraft flew W at 76°N, a similar pattern persisted until it exited the polar vortex at about 100°W, when the upper layer reappeared; scattering ratios ranged from 2-4 at 18-23 km altitude and some material was detected to 30 km altitude. M. P. McCormick noted that these data support information from the SAM II satellite indicating that the lower stratospheric aerosols from El Chichón moved fairly rapidly to the poles but material at higher altitudes has yet to fully penetrate the polar regions.
David Hofmann reported that late January-early February balloon data from Laramie, Wyoming revealed an extensive cloud of aerosols at higher altitudes than previously observed. The base of the layer, at about 29 km altitude, was marked by a boundary zone that was only about 50 m thick. Particle concentrations on 28 January exceeded 600/cm3 at 29 km, compared to normal background values of 1-2/cm3 at that altitude. Enhanced concentrations were measured to about 35 km altitude. A second balloon flight, on 1 February, again penetrated the cloud. The aerosol particles were about 0.02 µm in diameter, too small to be detected by lidar. They had no non-volatile cores and were probably H2SO4 droplets formed in the north polar region from SO2 ejected by El Chichón. Given a wind speed of about 80 km/hour (from the E) at these altitudes, the cloud was at least 8000 km in lateral extent. By a third flight on 4 February, the high-altitude cloud was greatly attenuated.
Gas and particle samples were collected for LANL between the tropopause and 20 km altitude from a WB57-F aircraft that flew from the equator to 75°N in April-May, July-August, and October. Eugene Mroz reports that calculations based on information from these samples, combined with data from balloon launches to 30 km altitude at 33°N and limited sampling to 10°S, yield a mass of 5.68 x 10¹² g of sulfate injected into the stratosphere by El Chichón's explosions. Using the same methods, the mass of sulfate in the "mystery cloud" ejected in early January by a volcano that remains unidentified was calculated to be 0.85 x 10¹² g.
Unusual sunrises and sunsets. Brilliant sunrises and sunsets continued to be reported from England in early January and Saudi Arabia in late January. However, no unusual colors were seen from Wyoming in January, or from Colorado after mid-January, and sunset colors in New Jersey weakened considerably in late January and early February.
In mid-January, H. H. Lamb reported that during clear days for the previous 3-4 weeks the sun over Norwich, England had increasingly appeared to be surrounded by a white sheen of diffused light extending to about a 20° radius, although there was little apparent diminuition of solar brightness. On 16 December at 1605 GMT, with the sun about 6° below the horizon, a roughly round, vivid purple patch was seen at 20-25° elevation, indicating to Lamb that the layer was at 20-24 km altitude. Twenty minutes later, the W sky was a brilliant orange, changing to fiery red nearer the horizon during the next 20 minutes. A brilliant afterglow continued until 1700, which Lamb interpreted to presumably indicate the presence of aerosol material to 34 km altitude. There were no unusual sunset colors for the next several nights, and cloudy weather made observations after 24 December difficult. Glow was stronger than usual through breaks in the clouds 26 December and on the 28th the increased spread of diffuse white light around the sun throughout the day (see above) began to be obvious. On 9 January at 1630-1635 GMT, with the sun about 5° below the horizon 22-27 minutes after sunset, a vivid magenta-purple area developed at 15-27° elevation above a greenish-pale yellow sky, suggesting an aerosol layer at about 18-20 km altitude. During the next 15-20 minutes, the sky changed to a more normal appearance, but at 1700-1705 a fainter purple patch appeared at 10-15° elevation, suggesting a possible second aerosol layer at about 35 km altitude.
From Jeddah, Saudi Arabia, Edward Brooks saw several sunrises in early January that were preceded by two distinct periods of unusual colors. SW-NE-trending bands of volcanic aerosols were seen at dawn 1 January and the next day 2 periods of dawn color were separated by the appearance of dull reddish SSW-NNE-trending volcanic aerosol layers. Similar layers were seen 5 and 6 January in association with 2-stage dawns, and after a period of cloudy weather, on 13 January. Several long-lasting and bright-colored dawns and twilights were observed during the next several days. On 21 January, the second part of a 2-stage dawn included faint N-S bands of volcanic aerosols. When weather conditions permitted, bright dawn and twilight colors were visible until 29 January, then were succeeded by several days of little or no color. A brilliant twilight 2 February was followed by the observation of NNE-SSW-trending bands after sunset 3-4 February that may have been volcanic aerosols. An early dawn 5 February indicated the presence of high-altitude aerosols, but the later stage of dawn color was absent, indicating that no lower altitude material was present.
From Boulder, Colorado, Richard Keen reported that a salmon-colored primary twilight glow visible to solar depression angles of 6-7° preceded the brick-red secondary glow that persisted to 1.5 hours after sunset 11-13 January (7:12; note that 13 January has been added). Keen noted that Volz (1969) described similar double twilights after the 1963 Agung eruption and showed that the later glow can be produced by secondary illumination of the same single layer. Keen therefore suggests that the double twilights that he observed in November and January were caused by a particularly thick layer at about 23 km altitude and that there probably was no 40 km layer. To produce a double twilight, the 23 km layer would have to extend at least 1500 km W of Boulder. Since 13 January, he has seen no unusual twilights. From Laramie, Wyoming, David Hofmann observed no unusual twilight colors since about early January. Fred Schaaf observed numerous double twilights from Millville, New Jersey (39.4°N, 74.9°W) through mid-January, but secondary glow was not present on 19 January and other twilight colors were much weaker. Twilight color remained subdued or absent for the next several days. A rather strong double twilight was visible 28 January, but colors were weaker on succeeding days. Daytime aerosol effects also seemed weaker in January than in December.
Reference. Volz, F. E., 1969, Twilights and stratospheric dust before and after the Agung eruption: Applied Optics, v. 8, p. 2507-2517.
Information Contacts: M. Hirono, Kyushu Univ., Japan; T. DeFoor, MLO; P. McCormick and W. Fuller, NASA; D. Hofmann, Univ. of Wyoming; E. Mroz, LASL; H. Lamb, Univ. of East Anglia, England; E. Brooks, Saudi Arabia; R. Keen, Univ. of Colorado; F. Schaaf, Millville, NJ.
February 1983 (SEAN 08:02) Cite this Report
Tiny aerosols recondense above 30 km; little change to N hemisphere cloud; unusual sunrises and sunsets
Lidar data. Lidar measurements from Nagoya, Japan (35.13°N, 136.88°E) 2, 6, 13, 19, and 27 December showed similar altitudes and peak backscattering ratios, but small secondary peaks were detected at 35-36 km only on the 13th and 19th. Both the altitude and the strength of peak backscatter measured at Garmisch-Partenkirchen, Germany were significantly higher on 1 January than for the very consistent readings of 10, 18, and 29 January. Late February-early March lidar data from Mauna Loa, Hawaii, Fukuoka, Japan, and Hampton, Virginia were similar to data at the same locations a month earlier. Integrated aerosol backscatter was considerably higher in Virginia than in Hawaii, suggesting that the bulk of the cloud had moved from the low latitudes where it was concentrated for several months after the March-April 1982 eruption.
Unusual sunrises and sunsets. From Tsukuba, Japan (36°N, 140°E) Toshio Fujita observed unusual twilight glows through January. Evening glows in December appeared redder than those in November, but by mid-January the red twilight colors were rapidly becoming lighter. A twilight photograph taken 24 January showed much paler colors than one taken 7 December at a time of similar solar depression angle. Despite the difference in color, the peak backscattering ratio measured 26 January was very close to the 8 December value. The maximum backscattering ratio increased from 17 (at 23 km altitude) on 8 December, to 28 on 28 December, but both heights of the strongest aerosol layers and their peak backscattering ratios were gradually descending by mid-January, and maximum backscattering was 16 on the 26th. Fujita attributed the differences in color at times of similar lidar readings to varying turbidity in the lower atmosphere. In mid-February, lidar at Tsukuba again measured relatively weak backscattering and the strongest aerosol layer had descended farther to about 20 km altitude.
Edward Brooks noted considerable variation in dawn and dusk colors from Jeddah, Saudi Arabia in February. Colorful early dawns 6-9 February indicated the presence of higher stratospheric aerosols, but the absence of unusual late dawn colors suggested that lower stratospheric aerosols were absent. This pattern reversed early 10 February, when no early dawn was evident but a colorful late dawn resulted from illumination of volcanic layers near the tropopause, visible as faint N-S bands. Similar bands were visible that evening, when aerosols could be observed both at the tropopause and higher in the stratosphere. Few unusual colors were visible early 11 February, but on the 12th both the upper and lower aerosol layers were illuminated. For the next several days, bands of material, generally trending SSW-NNE, were often observed at dawn and twilight with both early and late colors. Only higher aerosols were illuminated at dawn 19 February; some lower-altitude material appeared to be present early 20 February, but no unusual colors were evident that evening.
From Norwich, England, H. H. Lamb reported that on all cloudless days the sun continued to be surrounded by a white sheen of diffused light that seemed to be increasing steadily in extent, from about 20° in angular radius in mid-January to 25-30° as of 10 February. The sun itself often appeared nearly white at elevations of 5-15° and on partly cloudy days the sky was a paler gray than usual. Richard Keen observed no unusual sunsets from Boulder, Colorado between 13 January and 17 February.
Fred Schaaf observed increased optical effects in February from Millville, New Jersey after a notable weakening in January. By 15 February, late dawn colors (lower altitude aerosols) had returned to moderate levels. During the afternoon of 18 February, the sun was surrounded by a red-brown ring with a radius of about 30° that remained visible until shortly after sunset, when weather clouds obscured further observations. The next evening, twilight glow was stronger and Schaaf calculated that later glows seen for the first time since 31 January were produced by aerosols as high as about 16 km. Twilights were less impressive for the next few days, but similar effects were seen 23 February. On the 26th, the length of twilight glows indicated aerosols to 16-19 km. On 2 March, moderate to strong early twilight colors from material at about 16 km were followed by a very weak secondary glow that may have indicated the presence of aerosols to 32-40 km.
Balloon data - Wyoming. David Hofmann reported that balloon launches from Laramie, Wyoming continued to penetrate remnants of the extensive cloud of tiny aerosols at 29-35 km altitude first detected 28 January, and encountered a newly formed cloud of similar particles 2 March. The average radius of the 28 January particles was about 0.015 µm, with a few as large as 0.05-0.06 µm. Given the particle size distribution and a 30-50% drop in electrical conductivity measured within the cloud, Hofmann calculated a particle concentration of about 1,200/cm3. During the next week, this concentration dropped to about 100/cm3, a rate of decay corresponding closely to the expected rate of particle coagulation. About 90% of the particles disappeared when heated to 150°C, indicating that the cloud was composed of H2SO4 and H2O droplets. Remnants of this cloud were still present 2 March but had diffused and coagulated considerably, extending from 25-35 km altitude with a maximum concentration of about 50 particles per cm3. Although coagulation had increased the size of individual particles, they remained too small to be detected by lidar at these concentrations. Superimposed on the remnants of the 28 January cloud, a new cloud was detected 2 March. Sharply constrained between 31 and 34 km altitude, the new cloud reached concentrations of about 300 particles per cm3, and appeared to be about 4-5 days old.
Hofmann noted that between 25 and 35 km altitude, liquid H2SO4 is vulnerable to vaporization if its temperature is raised slightly. If cooled again, it would then recondense into tiny droplets. High-altitude wind data indicated that the 28 January cloud originated in the Alaska-Siberia area, in a zone of 30-40°C stratospheric warming. From this warm area, the cloud reached Wyoming in about 30 hours, carried by 200 km/hour winds. Cooling of about 40°C probably occurred during transport, sufficient to recondense the H2SO4. Similar clouds have been detected for the past several years, usually in the spring, but the 28 January cloud had particle concentrations 15 times as high as clouds seen in 1982, which in turn were 5 times as concentrated as 1981 clouds (Rosen and Hofmann, 1983).
The much larger particles from the original El Chichón cloud remained evident over Wyoming. During the most recent fully-analyzed sounding on 11 February, a very broad layer extended from the tropopause (11 km) to about 27 km with a peak concentration of 10 particles (larger than 0.15 µm) per cm3 at 19 km altitude. A sounding in an equatorial airmass, on 10 March, showed a similar profile, with a peak concentration of 8 particles per cm3 at 19-20 km altitude and the top of the cloud at roughly 27 km. The profile included a 1 km-thick zone of very clean air (about 1/2 particle per cm3) centered at about 15 km altitude, probably tropospheric in origin.
Reference. Rosen, J. M., and Hofmann, D. J., 1983, Unusual behavior in the condensation nuclei concentration at 30 km: JGR, v. 88, p. 3725-3731.
Information Contacts: D. Hofmann, Univ. of Wyoming; W. Fuller, NASA; T. DeFoor, MLO; M. Hirono, Kyushu Univ., Japan; R. Reiter, Garmisch-Partenkirchen, W. Germany; E. Brooks, Saudi Arabia; H. Lamb, Univ. of East Anglia, England; T. Fujita, Meteorological Research Inst., Japan; S. Hayashida, Nagoya Univ., Japan; F. Schaaf, Millville NJ; R. Keen, Univ. of Colorado.
March 1983 (SEAN 08:03) Cite this Report
Continued monitoring of stratospheric cloud from El Chichón
Lidar data from Fukuoka, Japan showed a significant decrease in peak values during the limited intervals when weather permitted observations. Broad, almost monolayer profiles were obtained. On 22 March, lidar at Hampton, Virginia showed a broader peak than it had on the 3rd, but about the same total amount of aerosol. From Mauna Loa, Hawaii, lidar detected only minor variations in total aerosol through March. In late April and early May, a lidar-equipped NASA aircraft will collect data on the El Chichón aerosols from high northern to high southern latitudes, and will coordinate with balloon launches from Palestine, Texas.
David Hofmann reported that a balloon launch from Laramie, Wyoming early 8 April detected remnants of the extensive cloud of tiny aerosols observed 28 January. About 20 particles per cm3 remained between 25 and 33 km altitude. A new layer of similar particles, probably about 1 week old, was observed at 20 km, an unusually low altitude. Particle concentrations were about 125/cm3, but the layer was only 200 m thick. The arctic airmass over Wyoming on 8 April lowered the tropopause to 9-10 km altitude, so the densest layers of the main El Chichón cloud were lower than usual. Counts of particles larger than 0.15 µm reached 13/cm3 at 12 km and were still 7/cm3 at 20 km. The layer terminated rather abruptly at 23 km.
Edward Brooks reported brilliant dawns and twilights and visible bands of volcanic aerosols over Jeddah, Saudi Arabia during several periods between late February and late March. In addition to colors observed shortly before sunrise and soon after sunset, caused by illumination of aerosols in the lower stratosphere, the presence of higher layers often resulted in unusual colors long before sunrise and after sunset. Early and late colors were both visible near dawn 21 February, but remained feeble. Brightly colored sunsets were observed 21-22 February, and another 2-stage dawn the 23rd. That evening, brown volcanic aerosols formed a layer at about 6° above the horizon. Clouds obscured the sky for the next several days, but many N-S bands of aerosols were visible at 1-3° elevation in the E sky early 28 February. During the first week in March, both early and late dawn colors were usually faint and were sometimes entirely absent. N-S bands of volcanic aerosols were present early 4 March at about 5° elevation. Clouds made observations difficult 10-14 March, but the return of clear weather revealed more bands of aerosols 15-19 and 22 March accompanying long, brilliant dawns and twilights.
Fred Schaaf saw several examples of Bishop's Ring in March from Millville. New Jersey, but frequent cloudiness limited his observations. Before sunset on 13 March, the sun was surrounded by a band about 6° wide that formed a ring with a radius of about 24-30°. On 15 March, the sun's brightness was considerably diminished by a haze that could not be accounted for by weather conditions or local pollution. A milky area bordered by a Bishop's Ring that was again about 24-30° in radius was visible an hour before sunset 20 March. A similar Bishop's Ring was observed before sunset 30 March. Sunset glows through the month were only weak to moderate and there was only one weak example of late glow indicating illumination of higher aerosols. Richard Keen reported that he had observed no unusual twilights from Boulder, Colorado since mid-January.
Information Contacts: M. Hirono, Kyushu Univ., Japan; M. Osborn, NASA; T. DeFoor, MLO; D. Hofmann, Univ. of Wyoming; E. Brooks, Saudi Arabia; F. Schaaf, Millville NJ; R. Keen, Univ. of Colorado.
April 1983 (SEAN 08:04) Cite this Report
Stratospheric aerosols reduce solar radiation; high latitude aerosols sampled
Atmospheric scientists continued to monitor the stratospheric cloud ejected by El Chichón's March-April 1982 explosions. Poor weather plagued attempts to gather lidar data in Hawaii and Japan, but a few measurements were obtained. In Hawaii, declines were recorded in April for both peak and integrated backscatter, indicating decreases in the aerosol concentration within the densest layers and the cloud as a whole. In Japan, however, limited data showed a recovery of peak backscattering ratios to March levels, after a decline in early April.
Pyrheliometer data from Japan and Colorado show substantial reductions in direct solar radiation after the March-April 1982 injection of stratospheric aerosols. Japanese stations between 26.3°N and 43.3°N showed significant increases in turbidity and decreases in transmissivity since last autumn. These effects seemed to occur earlier at the southernmost station. Direct solar radiation first began to show a slight decline at Boulder, Colorado in July 1982 (about 2%) and was about 6% below the 1978 value in September (figure 2). The major decrease in direct solar radiation occurred in late October (around the 27th), with November and December 1982 having average values 13% and 20% less than the 1978 means. However, January-April 1983 data show increasing direct solar radiation, indicating a slow diminuition in cloud density over Boulder. Total radiation data (direct plus diffuse on a horizontal surface) show a much smaller effect. Changes to these data first became apparent in November with a decrease of slightly more than the 2% measurement/analytical noise, and the December 1982 values were about 3% below the December 1978 mean. Edwin Flowers noted that reductions in direct solar radiation caused by previous volcanic aerosol clouds were usually of short duration, interspersed with periods of normal transmission. However, once the effects of the El Chichón aerosols began to be observed, solar radiation values remained depressed, without periods of normal transmission, indicating the cloud's strong lateral uniformity.
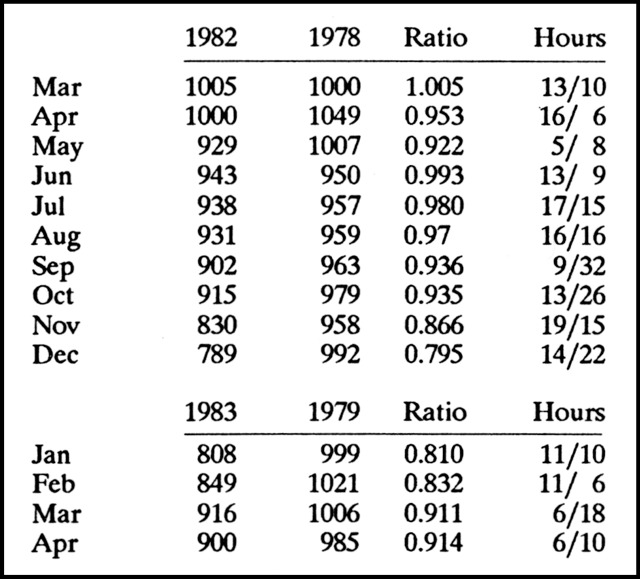 |
Figure 2. Comparison of direct solar radiation (in watt-hours/m2) at Boulder, Colorado (40°N, 105.2°W) before and after the arrival of El Chichón aerosols. The dense cloud of H2SO4 droplets scatters sunlight, measureably reducing the amount that reaches the Earth's surface. Ratios (1982-83 divided by 1978-79 values) show little change before the appearance of a dense aerosol cloud over Colorado in late October 1982. A slight increase in direct solar radiation January-April 1983 suggests a slow diminution in aerosol density. The right-hand column shows the number of hours of measurement each month, 1982-83 and 1978-79 (left and right of slash, respectively). Courtesy of Edwin Flowers. |
A cooperative NASA-NOAA effort, using real-time TOMS data from the Nimbus-7 polar orbiting satellite, identified episodes of tropospheric-stratospheric "folding" that brought stratospheric air to within 3 km of sea level in the arctic. During one of these events, on 23 March, a NOAA P3 Orion aircraft sampled stratospheric aerosols along the coast of Greenland on a flight between Thule (77.5°N, 69.3°W) and Söndre Strömfjord (67°N, 50.6°W). In 6 hours of sampling, mainly at about 4.5 km altitude, aerosols were collected with 9 different filter systems. Concentrations of 0.1 and 1.0 µm particles exceeded 2000/cm3 with occasional peak values to 5,000/cm3. These particles were predominantly droplets, probably of H2SO4. Larger (1-5 µm) fragmented particles were present in concentrations about 1/1000 of the smaller ones and were predominantly composed of Si, lesser amounts of Fe, and traces of Al. In scanning electron micrographs, these particles appeared similar to El Chichón ash collected on the ground shortly after the March-April 1982 explosions. Although the sampling system was designed to operate at 4.5 km altitude or lower, some aerosols were also collected at about 7.5 km, also in stratospheric air. Along with the droplets and fragmented particles, some NaCl was recovered, although in concentrations only 1/1,000-1/10,000 of the droplets. Salt had also been collected at 4.5 km, but Russell Schnell noted that at the lower altitude the source of the NaCl could have been sea water, extremely unlikely at 7.5 km. NaCl crystals were collected by NASA aircraft from the El Chichón cloud in April and May 1982. In tropospheric air, aerosol concentrations were 100/cm3 or less and included very few particles that looked volcanic.
H. H. Lamb reported increased evidence of stratospheric aerosols over Norwich, England. Since early March normal blue skies have been absent; clear sky colors range from milky blue at considerable distance from the sun to strongly increasing whiteness within 30°-50° of arc from the sun. Sky seen in gaps between clouds within 15°-30° of the sun has invariably been virtually white. During many evenings, particularly in March but continuing as of mid-April, the dominant sky color after sunset has been sepia brown to bronze. From Jeddah, Saudi Arabia, Edward Brooks occasionally observed bands of volcanic aerosols from late March through late April, although brilliant dawn and twilight colors were less frequent than in previous months. In addition to colors observed shortly before sunrise and shortly after sunset, caused by illumination of aerosols in the lower stratosphere, material higher in the stratosphere sometimes resulted in colors long before sunrise and after sunset. On 23 March, SSW-NNE bands of aerosols were visible to 7° altitude in the WSW sky around sunset, and faint SSE-NNW aerosol bands below 5° in the ENE were illuminated during a 2-stage dawn the next day. Many sunrises and sunsets in late March were pale to nearly colorless. A brilliant sunset 4 April was followed by a 2-stage dawn on the 5th. Although dawn colors were nearly absent 7 April, faint brown, narrow, closely-spaced N-S bands of volcanic aerosols were seen at 15° altitude in the E; a colorful dusk that evening was also accompanied by brown N-S-trending aerosols. More aerosol bands were visible the next morning. A dense haze, probably stratospheric, was visible early 9 April as were gray N-S bands of haze that evening, accompanying chalky-appearing dawn and dusk colors that extended to 30-35° altitude. Pale dawns and twilights were observed when cloud conditions permitted 10-15 April, but brilliant colors reappeared at sunset 16 April and bands of aerosols were present at 3° altitude late on the 18th and early on the 19th. Neither bright colors nor aerosol bands were observed from sunset 19 April through the 21st.
Information Contacts: R. Schnell, NOAA/GMCC; E. Flowers, NOAA; T. Yamauchi, JMA, Japan; T. Fujita, Meteorological Research Inst., Japan; M. Hirono, Kyushu Univ., Japan; T. DeFoor, MLO; E. Brooks, Saudi Arabia; H. Lamb, Univ. of East Anglia, England.
May 1983 (SEAN 08:05) Cite this Report
Aerosol cloud remains strong
The following paragraph is from Alan Strong. "Stratospheric aerosols from El Chichón continue to produce offsets in satellite measurements of sea-surface temperatures. NOAA has used these offsets to monitor the month-to-month evolution of the aerosol cloud over the northern and southern hemispheres. Revised analyses agree well with data from the Solar Mesospheric Explorer satellite and show spreading S of the equator by June 1982, followed by a more extensive southward push during August, when the northern limit of the aerosols was rarely beyond 30°N. During autumn, material began diffusing northward over the Pacific Ocean and by December was extensive over North America. The NOAA 7 satellite measurements continued to show large sea surface temperature offsets (i.e. high aerosol concentrations) into January, but by February this higher-latitude material appeared to migrate away from North America over the North Pacific. In April, although some material was indicated between 10°S and 20°N, with some increases being seen in the southern hemisphere, the highest concentrations appeared to be north of 50°N over the Pacific."
David Hofmann reported that data from a balloon launched at Palestine, Texas (31.6°N, 96.5°W) on 16 May showed a peak concentration of about 5.2 particles (larger than 0.15 µm) per cm3 at about 20 km altitude. Remnants of the extensive cloud of tiny aerosols first detected above Wyoming 28 January were encountered between 25 km and the upper limit of reliable data collection at 35 km altitude, peaking at 12 particles per cm3 at 30 km. Background at this altitude is about 1-2 particles per cm3. Similar concentrations of these tiny particles were measured from Laramie, Wyoming 25 May. The larger (> 0.15 µm) aerosols were again centered at about 20 km altitude. Concentrations of 7.3/cm3 were detected, more than in Texas nine days earlier, but slightly less than January-February peak values of 8-10/19cm3 over Wyoming.
Lidar observations from Fukuoka, Japan showed a slight decrease in both the altitude and density of the strongest layer of El Chichón aerosols in early May. From Mauna Loa, Hawaii a new layer that straddled the troposphere/stratosphere boundary (tropopause heights during May lidar measurements were 15.6-15.9 km) was first noted 11 May between 15.2 and 16.5 km altitude and was quite strong during the next observation 25 May, ranging from 13-16.4 km. This layer was weaker during subsequent lidar measurements, but some material was still present at these altitudes 8 June. The new material slightly boosted the integrated backscatter over Mauna Loa, but little change was noted in aerosol layers higher in the stratosphere.
JMA has collected pyrheliometer data from a number of stations since 1959. A marked increase in atmospheric turbidity has been evident since autumn 1982 in the combined data (figure 3), while data from individual locations shows effects beginning earlier at southern stations (figure 4).
 |
Figure 3. Variations in atmospheric turbidity over Japan, 1959-1982, comparing the effects of several large eruptions in two plots. The increase after the El Chichón eruption is substantially larger than those following major explosive events at Tiatia, Agung, St. Helens, Alaid, and Pagan. I) Monthly minimum turbidity coefficients (connected by solid line) from pyrheliometer observations at JMA stations were used to reduce local tropospheric effects. The dashed line connects winter values only; T. Yamauchi cautions that abundant water vapor over Japan during the summer might disturb turbidity observations. Three other points are also plotted for each month: the middle point, of "normal" value, is the mean of the 1959-1982 minimum values for that month; the upper and lower points define the range of one standard deviation from that "normal" value. II) The 3-month running means of deviations form the "normal" value are connected by the solid line. The dots again show one standard deviation for each month. The abnormally high turbidity after several of the large eruptions, especially El Chichón, is emphasized by this plot. Courtesy of Toshio Fujita and Toyotaro Yamauchi. |
 |
Figure 4. Atmospheric turbidity measured at ten stations in Japan, 1980-83, comparing the cloud from El Chichón with those produced by eruptions from St. Helens, Alaid, and Pagan. Note that El Chichón aerosols were first detected at the southernmost stations, nearest in latitude to the volcano. Left: monthly minimum (solid lines) of Feussner-Dubois' turbidity factor (t0) from pyroheliometer observations (at 0900, 1200, and 1500 local time) by JMA stations. The middle dot is the mean minimum monthly value, 1951-1980; the top and bottom dots define one standard deviation from the mean. Right: the solid line shows the deviation of the 3-month running mean of the monthly minimum turbidity factor (t0) from the 1951-1980 mean monthly minimum. Dots again mark a range of one standard deviation. Courtesy of Toyotaro Yamauchi and H, Shimura. |
José Caburian reported gaudy dawns and twilights in the Philippines in early 1983. Dawns and twilights at low latitudes are usually relatively brief, but colors have been observed for an hour or more before sunrise and after sunset. From Jeddah, Saudi Arabia, Edward Brooks observed pale dawn and twilight colors 22-25 April but on the 26th, colors were present only in the sky N of the sunrise and sunset points. Late dawn and early dusk colors were visible 27-28 April, indicating aerosols at lower altitudes, but material at higher altitudes produced colors long before sunrise 29 April-1 May and well after sunset 29 April. Bands of aerosols were observed early 1 May and late 2 May. Only late dawn colors were seen 4-5 May but NNE-SSW bands of aerosols were present early on the 5th. Overcast weather limited observations 7-10 May but little color was apparent through breaks in the clouds. Two-stage dawns, indicative of aerosols in both the lower stratosphere and at higher altitudes, were seen 11-12 May; early dawn on the 12th was fiery red, and long dark NNW-SSE bands of aerosols were visible nearer to sunrise. Only late dawn colors were noted 13-15 May, but there were broad N-S bands of aerosols on the 14th. Sunrises and sunsets were nearly colorless 16-19 May, but brilliant 2-stage dawns and twilights with N-S bands of aerosols occurred 20-21 May. Long crepuscular rays extended to 30° above the horizon early 21 May. Fred Schaaf noted that twilight effects at Millville, New Jersey continued to diminish in April and early May. An aureole around the sun remained prominent on some days, although it was far weaker than in previous months. A Bishop's Ring of 20-30° radius was visible for 1 or more hours before sunset in late April. From a good viewing site 22 April, Schaaf observed 10 minutes of purple light that faded at 5-10° altitude at 1910 local time, indicating material only to roughly 9.5-13 km altitude.
Information Contacts: A. Strong, NOAA/NESDIS; T. Yamauchi, JMA; T. Fujita, Meteorological Research Inst., Japan; D. Hofmann, Univ. of Wyoming; E. Brooks, Saudi Arabia; F. Schaaf, Millville NJ; J. Caburian, Manila, Philippines; T. DeFoor, MLO; M. Hirono, Kyushu Univ., Japan.
June 1983 (SEAN 08:06) Cite this Report
Slight decline in aerosols; fresh volcanic material in lower stratosphere; new layer near tropopause
Reinhold Reiter provided the following summary of the results of lidar measurements from Garmisch-Partenkirchen, West Germany, January 1982-April 1983. A more detailed analysis [appears in Reiter and others, 1983].
"The stratospheric dust veil from the early 1982 "Mystery Cloud" caused from January on (before the El Chichón eruption) a clearly increased background level of particle backscattering at 10-20 km altitude, but not at higher levels. We observed the arrival of the dust veil from El Chichón on 3 May 1982 at 10-20 km altitude (peak at 15 km). In this height interval the aerosol backscatter intensity rose until March 1983, with fluctuations of a factor of 5 (weakened by preloading from the "Mystery Cloud"). We noted the strongest increase, by about a factor of 40, in January 1983 in the height interval 20-30 km. Since August 1982, a clearly increased aerosol backscatter from the El Chichón dust veil can also be seen at levels higher than 30 km. In contrast to the other dust veils that we traced in the stratosphere (St. Helens and Alaid), the aerosol backscatter intensity increased, as figure 4 shows, up to the recent past, i.e. over many months. Only in the 20-30 km range can a slight decrease be recognized from January 1983 on; at this level sedimentation of particles seems now to prevail over their influx. The time history of the stratospheric aerosol loading can be explained by El Chichón's position near the equator. There was only a slow meridional transport and a poleward homogenization of the stratospheric material in the northern hemisphere. Surely, part of the material also entered the stratosphere in the southern hemisphere.
"Important for an assessment of possible global climate affects is the change in the optical thickness. Before the eruption of St. Helens, its value was about 0.002, before the eruption of El Chichón, 0.022, and presently it is about 0.18. This means a considerable increase which, according to known models, suggests most probably a cooling of the earth's surface by some tenths of a degree within the next 1-2 years. In the stratosphere, however, warming is to be expected."
The following is from M. P. McCormick. "A dedicated El Chichón survey mission was flown on the NASA CV990 aircraft 8-20 May, 1983, from 71°N to 56°S (California - Alaska - S of New Zealand, and return to California). Previous missions were conducted on the NASA Electra aircraft in July and October-November 1982, and January-February 1983 and on the CV990 in December 1982. These flights were coordinated with measurements by satellites or balloons, or with in situ measurements aboard other aircraft.
"During the May 1983 flight, lidar profiles were obtained over the full latitude range, showing a definite peak in integrated stratospheric backscattering (related to optical depth or mass of stratospheric aerosols) at about 50-55°N. This agreed with lidar data collected during the January-February 1983 arctic mission. The May lidar profiles showed a well-defined southern boundary of the dense stratospheric aerosols between 40° and 50°N, with a minimum near 20°N, a small maximum near the equator, and a definite falloff to even lower values near 10°S. These data are preliminary at this time and are being processed for future publication. In addition to the airborne lidar measurements, other experiments conducted during the May 1983 flight included measurements of optical depth at visible and infrared wavelengths, radiation flux, and total SO2 and O3 column content."
Ground-based lidar in Hawaii and Virginia showed a continuing gradual (although somewhat irregular) decrease in total integrated backscatter. Peak backscattering remained similar.
Edward Brooks reported that bands of aerosols and brilliant dawns and twilights were visible on some days through mid-June from Jeddah, Saudi Arabia. Aerosol bands were seen early 22-24 and 26 May and impressive sunrises and sunsets were frequent during this period, some showing 2 distinct stages caused by illumination of unusually high layers. Optical effects declined 16-20 June, but weather conditions made observations difficult. From Millville, New Jersey, Fred Schaaf reported that only occasional observations were possible because of cloudy weather. Aerosols at moderate altitudes were illuminated 10 May and early sunset color was slightly enhanced 11 and 13 May. Jos‚ Caburian noted that fiery red sunrises and sunsets, seen in the Philippines for the previous several months, were not evident at the end of May and early June.
Recently erupted volcanic material from an unknown source was collected at 18-19 km altitude over the western US during a series of flights by a NASA U-2 aircraft 22-29 April. Samples from a 22 April mission flown at 37°N from near San Francisco (about 37.7°N, 122.5°W) to Topeka, Kansas (39.02°N, 95.68°W) included particles ranging from less than 0.1 µm to 20-30 µm in diameter: fragments of magnesian olivine, Cl-rich agglomerates, and H2SO4 droplets, plus a few glass shards, fragments of SiO2, and particles of copper and zinc oxide. The copper oxide-zinc oxide particles were similar to those found in previous aircraft samples of volcanic debris, with a characteristic 2:1 Cu to Zn ratio. During a flight from Topeka southward to Palestine, Texas 28 April, concentrations of volcanic material were less than on 22 April but remained above background levels. However, flying northward from Topeka to the U.S.-Canada border (49°N) the next day, particle concentrations were substantially higher, and the debris included many large fragments.
The source of the volcanic material remains uncertain. The samples were not similar to ejecta collected from the El Chichón aerosol cloud, and Raymond Chuan added that the large size of some of the particles suggests that the eruption probably occurred no more than about 2 months before the late April flights. Some large particles had been found in July 1982 samples from the El Chichón stratospheric cloud but none were recovered during flights in November 1982. Chuan also noted that a mid to high northern latitude source for the April 1983 material is suggested by the higher concentration of volcanic debris on more northern flight paths. No observations of early 1983 eruption clouds large enough to penetrate the stratosphere have been reported to SEAN. However, the largest clouds from the 8 April eruption of Asama (Japan, 36.40°N, 138.53°E) were produced before dawn and were not observed. Ashfall from this eruption extended more than 250 km ENE, reaching the coast of Honshu. Large plumes from Etna (Italy, 37.73°N, 15.00°E) have been observed from the ground and on satellite imagery during the eruption that began 28 March.
Lidar data from Mauna Loa, Hawaii showed an aerosol layer straddling the tropopause on 11 May that had not been present during the previous measurement on 4 May. This layer was narrow and well-defined, extending from 15.2-16.4 km altitude on 11 May and from 15.6-16.4 km on 28 May. Lidar data on 25 May seemed to show some mixing between the new layer and the base of the El Chichón material. Lesser amounts of aerosol were detected by lidar at 13-15.6 km on 8 June and 11.4-15.2 km on 29 June, but no upper tropospheric material was present 22 June. Clouds that were probably at too high an altitude to be cirrus persisted over Hawaii for several weeks and a corona and brilliant white aureole sometimes surrounded the sun. A relatively weak layer peaking at 13.5 km altitude was detected by lidar at Hampton, Virginia on 23 June but none was present at that level 22, 26, 27, or 30 June. Lidar data were not collected at Hampton between 22 March and 22 June. The relationship between these lidar observations and the fresh volcanic material collected during the NASA flight on 22 April is uncertain.
References. Labitzke, K., Naujokat, B., and McCormick, M. P., 1983, Temperature effects on the stratosphere of the April 4, 1982 eruption of El Chichón, Mexíco, in Pollack, J.B., Toon, O.B., Danielsen, E.F., Hofmann, D., et al., eds., 1983, The El Chichón volcanic cloud: An introduction: Geophysical Research Letters, v. 10, no. 11.
Reiter, R., et al, 1983, The El Chichón cloud over central Europe observed by Lidar at Garmisch-Partenkirchen during 1982: Geophysical Research Letters, v. 10, no. 11.
Information Contacts: R. Reiter, Garmisch-Partenkirchen, W. Germany; P. McCormick, D. Woods, and W. Fuller, NASA; T. DeFoor, MLO; E. Brooks, Saudi Arabia; F. Schaaf, Millville, NJ; J. Caburian, Manila, Philippines; R. Chuan, Brunswick Corp.
July 1983 (SEAN 08:07) Cite this Report
El Chichón aerosols weaken gradually; new layer sometimes present near tropopause
Lidar data showed a continuing gradual decline in backscattering ratios from El Chichón aerosols. However, lidar in Hampton, Virginia and Fukuoka, Japan detected layers near the local tropopause that may have been from another eruption. A weak layer peaking at 13.5 km altitude was present over Hampton 23 June and aerosols were also observed at 9-14 km on 7 July and 11-13.5 km on 26 July. In July, this material was associated with a "double tropopause", a condition in which 2 temperature inversions were found instead of the single one that typically marks the boundary between the troposphere (where temperature decreases with altitude) and the lower stratosphere (where temperature increases with altitude). No aerosols were detected below the El Chichón material 12 and 27 July. From Fukuoka, new thin layers were observed 1-5 August between 12 and 16 km altitudes, at or below the local tropopause. The layers had fine structures of 100 m and were much more stable than the often-observed cirrus clouds in that altitude range, indicating the possibility that they were volcanic ejecta. Their peak scattering ratios were about 3-30 using YAG lidar. Aerosol layers were observed below the El Chichón material at Mauna Loa, Hawaii on some nights in May and June, but none were detected in July and early August. The source of this material and its relationship to the recently-erupted volcanic material collected in late April by a NASA aircraft over the central United States remain uncertain. Although the eruption of Una Una, Indonesia (0.17°S, 120.61°E) that began 18 July probably injected tephra into the stratosphere, meteorologists anticipated little northward migration of this material until autumn.
From Norwich, England, H. H. Lamb observed little change in optical phenomena. Skies in the direction of the sun continued to be whitish with much diffuse radiation; broken clouds seen against this background appeared an unusually pale gray. Clear twilight skies still produced abnormal colors, often bronze or sepia near the horizon, and whitish shades sometimes with a magenta or purplish patch above, in the direction of the sun. Before sunset, a fan-shaped area of brilliant bluish-white glow above the sun was common. On 30 June between 2245 and 2315 GMT (and probably for some time before and after) noctilucent clouds, structured like dense cirrus, were seen glowing strongly with a soft bluish-white light against the background of the brightest part of the twilight sky, between the horizon and about 9° elevation. The implied altitude of the clouds was about 80 km. Noctilucent clouds are rare at England's latitude and are seen only within about 2-3 weeks of the summer solstice. Lamb last observed noctilucent clouds a year or 2 after the 1963 Agung eruption, which injected large quantities of aerosols into the stratosphere.
Richard Keen reported that enhanced twilights returned to Boulder, Colorado on 14 June, after an absence of 5 months. Unusual twilights were observed 14 and 17 June, and 2-5, 13-14, 17, 22, and 24 July. The twilights were salmon-colored, with brightest and most pronounced coloring at solar depression angle (SDA) of 4°, disappearing on the horizon at SDA 5-6°. In addition, the 3, 13, and 17 July twilights included fainter purplish color that continued to an SDA of about 11°. None of the twilights were as bright as those seen in January, and they ended at somewhat smaller SDA's, suggesting that they were produced by aerosols at somewhat lower altitudes. Cloudy weather February-May made observations difficult but no unusual twilights were observed on clear evenings. Raymond Chuan began to see similar salmon-colored twilights about 10 July from Costa Mesa, California (33.65°N, 117.93°W) and these continued through the week of 18 July, but no enhanced colors were present in early August.
From Millville, New Jersey, Fred Schaaf observed twilight glows in June, July, and early August that were the strongest since January. Skies were whitened by volcanic aerosols 9 June and a 20° Bishop's Ring was seen the next evening. Purple light after sunset indicated aerosols to more than 8 km altitude 13-14 June. Faint but very late color 22 June was followed by a 2-stage twilight the next evening suggesting the presence of both lower-altitude material and aerosols extending to 24 km. Colors caused by high-altitude material were not evident 24-25 June but returned on the 26th, from aerosols at 24-27 km. Sunsets showed no evidence of high-altitude material for the rest of June, but Bishop's Ring was seen on the 30th. Poor weather prevented additional observations until 10 July, when a 2-stage twilight again indicated aerosols at low and high altitudes; if aerosols were being directly illuminated, continued color at 2200 suggests material extended to 40-48 km. Twilight was spectacular the next evening. Shortly after sunset, an intense narrow red band was observed, indicating strong low-altitude aerosols, but late color was also the strongest since January; if caused by direct illumination, aerosols reached more than 50 km altitude. Twilights were similar 12-13 July. Poor weather limited observations during the next 2 weeks. Moderately-colored 2-stage twilights were observed 22 and 26 July, with a mid-level layer at 13-19 km altitude. This layer was still present 27 July, but higher material seemed absent. Dawn observations 1, 2, and 5 August continued to show mid-level aerosols but no high-altitude material was observed.
Late June observations by Edward Brooks of dawns and twilights from Jeddah, Saudi Arabia were hampered by haze, sand, and occasional clouds. However, very early dawns, although often nearly colorless, suggested the presence of high-altitude aerosols. Brilliant dusk colors were observed 3 July and and faint bands of volcanic aerosols were observed with a very early dawn the next day.
Information Contacts: T. DeFoor, MLO; W. Fuller, NASA; M. Hirono, Kyushu Univ., Japan; R. Reiter, Garmisch-Partenkirchen, W. Germany; H. Lamb, Univ. of East Anglia, England; F. Schaaf, Millville, NJ; R. Keen, Univ. of Colorado; E. Brooks, Saudi Arabia; R. Chuan, Brunswick Corp.
August 1983 (SEAN 08:08) Cite this Report
June-July balloon data show new layers near tropopause; only El Chichón aerosols detected by lidar in August
Balloon data from Laramie, Wyoming in June and July showed little change in the El Chichón stratospheric aerosol cloud. Maximum concentrations of about 5-6 particles (> 0.15 µm) per cm3 were measured at about 20 km altitude. A few small layers were also detected near the tropopause, perhaps from recent eruptions.
The profile of stratospheric aerosols from the March-April 1982 eruption of El Chichón remained almost constant during August over Fukuoka, Japan. Integrated backscatter of the aerosol cloud over Hampton, Virginia declined slightly in August from July values. New layers near the local tropopause, occasionally observed in recent months, were not reported in August.
From Millville, New Jersey, Fred Schaaf continued to observe moderate to strong twilight glows in August and early September. Primary glow shortly after sunset often blended with somewhat later purple light but faded quickly, indicating aerosol layers that reached a maximum altitude of 8-13 km. Two-stage twilights 14, 15, and 24 August were characterized by long intervals between illumination of the lower and higher layers. If late colors were caused by direct illumination of high-altitude layers, aerosol material was present to roughly 32-40 km altitude. Late colors were usually present, but were not observed 5-6 September. Schaaf noted that their occasional absence during evenings when early colors were visible suggests that they are produced by primary illumination of high-altitude layers rather than secondary glow from material at lower latitudes.
Information Contacts: W. Fuller, NASA; M. Hirono, Kyushu Univ., Japan; D. Hofmann, Univ. of Wyoming; F. Schaaf, Millville, NJ.
September 1983 (SEAN 08:09) Cite this Report
El Chichón cloud remains over mid-latitudes
Lidar data from Fukuoka, Japan and Hampton, Virginia showed little change in the remnants of the stratospheric cloud ejected by the March-April 1982 eruption of El Chichón.
Edward Brooks resumed dawn and twilight observations from Jeddah, Saudi Arabia in late August. Bright colors were seen during some dawns and dusks in late August but colors became more intense in early September. NNW-SSE bands of aerosols were seen low in the W sky during brilliant dusks 12 and 13 September. During the evening of the 14th, faint N-S aerosol bands were visible, but their rapid fading suggested that they were at relatively low altitudes. Aerosol bands, trending N-S and NNW-SSE, were seen in the E sky at dawn 18-19 September. Colors remained brilliant through 24 September. Brooks noted that the very late twilight illumination at high sky angles observed at times since April 1982 would require particles to be present at altitudes near 100 km if caused by primary scatter. He suggests instead that secondary scattering from aerosols near 25 km altitude was responsible for late, high angle illumination.
From Millville, New Jersey, Fred Schaaf observed moderate to strong early and late twilight colors during the first half of September. After the arrival of a northern air mass 15 September, both early and late colors became weak. Moderately strong early and late colors returned 6 October. Schaaf noted that if late colors were caused by direct illumination of high-altitude aerosols (timing of illumination would indicate altitudes in excess of 70 km), they should have been unaffected by the northern airmass; the near disappearance of late colors in mid-September suggests that they are the result of secondary scattering from lower-altitude material.
Information Contacts: E. Brooks, Saudi Arabia; F. Schaaf, Millville, NJ; W. Fuller, NASA; M. Fujiwara and M. Hirono, Kyushu Univ., Japan.
October 1983 (SEAN 08:10) Cite this Report
Lower stratospheric layer; source uncertain
Lidar data from Hampton, Virginia showed a sharp increase in backscattering from aerosols in the lower stratosphere on 27 October. Accompanying the enhanced aerosols was a lowered, multiple tropopause, with sever al temperature inversions (the strongest at 9.4 km) instead of the single one that usually marks the boundary between the troposphere and the stratosphere. Poor weather had prevented observations since 3 October, when backscattering integrated from the tropopause to 30 km altitude was only half the 27 October value. Four nights later, lower stratospheric backscattering had declined but was still somewhat enhanced, and the altitude of the tropopause was 2 km higher. Preliminary analysis of 8 November data indicated an additional decrease in the amount of lower stratospheric aerosols and a further rise in the tropopause altitude. The source of the enhanced aerosols could not be determined but NASA scientists suggested either a recent eruption (perhaps the 3 October Miyakejima activity) or El Chichón material transported southward by an arctic air mass from high latitudes, where it has recently been concentrated. No lower stratospheric layers were reported in October from Fukuoka, Japan.
From Jeddah, Saudi Arabia, Edward Brooks reported variable dawns and dusks; some were brief because aerosols were at lower elevation than before. Dusk on 28 September ended quickly and was the same color as the sun, indicating that the scatterers were at low altitude and relatively large. Two distinct periods of enhanced colors were observed at dusk 2 October and dawn on the 8th, suggesting illumination of layers at 2 altitudes. Dusks 10-11 October and dawn on the 11th ended quickly, indicating that the scattering layer was at low altitude. Dusks 29 September and 9 October produced no significant color enhancement.
Information Contacts: W. Fuller and P. McCormick, NASA; M. Fujiwara and M. Hirono, Kyushu Univ., Japan; E. Brooks, Saudi Arabia.
November 1983 (SEAN 08:11) Cite this Report
El Chichón aerosols monitored by balloon, lidar, and sunset observations
Balloon data - Antarctica and Wyoming. University of Wyoming atmospheric scientists launched a balloon from McMurdo, Antarctica (77.85°S, 166.62°E) on 27 October. Aerosols with a size and altitude distribution typical of remnants of debris injected by El Chichón were detected between the tropopause (at 12 km) and 19 km altitude. The layer's broad peak was centered on 15 km, where concentrations of particles larger than 0.15 µm were about 6/cm3, similar to values observed over Laramie, Wyoming at the same latitude 6 days earlier (see below).
From 22 km to the top of the sounding at 33 km, the balloon passed through a zone of much smaller particles, reminiscent of the cloud of tiny condensation nuclei observed over Wyoming in early 1983 and (in lesser quantities) during previous springtimes. Maximum concentrations of particles larger than 0.01 µm reached 100/cm3 at 25 km altitude, an order of magnitude less than the maximum in the early 1983 cloud over Wyoming. A secondary peak was measured at 30 km altitude (20/cm3), and concentrations were increasing again (to 10/19cm3) shortly before the balloon burst at about 33 km.
Stratospheric temperatures were unusually warm during the 27 October balloon mission, rising from -75°C at the tropopause, to about -50 to -60°C at 25 km, (the altitude of peak CN concentrations), to -25°C at 33 km. Comparison of the peak CN concentration during the 27 October balloon launch with a particle coagulation curve suggests that roughly 16 days had elapsed since the evaporation event. Temperature profile data in the South Polar region is sparse, but weather soundings at the Pole show a warming from about -50°C at roughly 30 km altitude (10 millibars) on 6 October, to -30°C at the same altitude on 11 October. This temperature change is consistent with those observed in conjunction with CN events in the arctic.
Balloons were launched from Laramie, Wyoming on 21 October and 22 November. A double tropopause was detected during the 21 October mission, with temperature reversals at 11 and 15 km altitude. Each reversal was associated with an aerosol layer. The denser layer was at 15 km, where particle concentrations were 6/cm3 larger than 0.15 µm and 4/cm3 larger than 0.25 µm. On 22 November, the aerosol layer extended from the tropoopause, at 7.5 km altitude in arctic air, to 22 km, reaching peak particle concentrations of 9-10/19cm3 (>0.15 µm) at 13 km. A secondary peak of 0.3/cm3 at 30 km (a high concentration for that altitude), suggested that equatorial air was present above the arctic air. Ratios of particles larger than 0.15 µm to those larger than 0.25 µm were similar to a month earlier, remaining at about 1.5, a value characteristic of the El Chichón aerosols but in distinct contrast with ratios of 4-5 for most volcanic aerosol clouds. Hofmann noted that multiple aerosol layers and complex boundaries between troposphere and stratosphere are often seen over mid-latitudes in the autumn, when air from polar regions is present at low altitudes while higher-altitude air has been transported from equatorial regions.
Lidar data. From Mauna Loa, Hawaii aerosol profile shape and backscattering values became increasingly variable in the autumn. The 13 September and 19 October profiles were jagged, with many small peaks. The 10 August profile was smooth; the 6 October pattern was similar but with a single new peak superimposed. On 9 November, a layer only 30-60 m thick was present between 15 and 16 km, just below the tropopause. On 30 November, backscattering increased very steeply from the base of the aerosol layer, dropping off above 21 km. At Hampton, Virginia, lidar data in late October and November showed variable aerosol profiles. When the jet stream moved south of Hampton, it transported polar air containing lower stratospheric aerosols into the region. Bases of aerosol layers in both the polar and tropical air masses were near the tropopause, several km lower in polar air than in tropical air (roughly 10 km vs 15 km). "Polar" aerosols were emplaced beneath the higher-altitude "tropical" layers, approximately doubling integrated backscattering values over Hampton in polar airmasses. A distinct layer at 18.5-19.8 km observed 29 and 30 November did not appear to be part of this pattern and its source is uncertain. This layer was not present 8 December. Late November lidar data from Fukuoka, Japan were very similar to late October results.
Unusual sunrises and sunsets. From Norwich, England, H. H. Lamb provided the following report.
"Abnormal coloured sunset and twilight glows presumed associated with the El Chichón eruption's stratospheric cloud have continued to be observed on almost any clear evening. In July, August, and September, the most regularly noticeable anomalies were cold yellow to sepia or stone-coloured twilights, later turning fiery red at the horizon. Frequently a nearly circular beautiful purple to rose patch of softer colour, some 10° of arc or a little more in diameter, was present above the horizontal yellow-brown layers of colour. The timing of the decline in elevation and ultimate disappearance of the purple/rose patch consistently indicated a height of about 20 km for the layer responsible throughout the period from late July to 14 October. On 5, 6, and 25 September and again on 7 October the purple/rose patch merged or extended into crepuscular rays in the same colour, the timing of which was used to derive the probable height of the layer.
"Since mid-October the displays have become more brilliant again and greater heights have been indicated for the active layer. On 21 October, the after-sunset glow was a brilliant fiery red along the horizon and at 1750 GMT a roughly circular purple patch of light developed strongly to over 20° elevation. This indicates a layer above 50 km height unless some secondary scattering effect was responsible. But on 24, 29, and 30 October a purple patch which later turned to rose pink became strongly illuminated about 1700 GMT up to 30° elevation, declining in elevation to 20° by 1707 and to 10° as it faded quickly about 1710. Over these dates a height of about 27 km is consistently indicated by these timings.
"It is not known whether this renewal of the optical effects and evidence of greater heights should be attributed to fresh dispersal of El Chichón material from other latitudes and/or other heights by the seasonal changes of the winds or whether a new stratospheric veil is involved."
Richard Keen continued to observe colorful twilights from Boulder, Colorado. An enhanced, salmon-colored twilight with maximum brightness and coloration at an SDA of 4° occurred 28 July. Similar twilights were observed 3 and 11-13 September (no observations were made in August). These included a fainter purplish glow to an SDA of 9°, similar to twilights of 3, 13, and 17 July. Strong double twilights, comparable to those seen from Boulder in November 1982 and January 1983, occurred 15-16 and 21 September, 3-6, 22, and 24-26 October, and 3, 6, 12, 14, and 23 November. They typically consisted of an enhanced salmon-colored 4° SDA primary twilight followed by a deep red secondary twilight to an SDA of about 17°. Keen had earlier noted that an aerosol layer at about 20 km altitude would have to extend about 1500 km W of a given observation point for secondary twilight illumination to occur. He suggests that a second requirement appears to be the absence of cirrus clouds in the same range. Satellite imagery showed that middle and high-altitude weather clouds were absent for 1500 km W from Boulder during all such observations, and these conditions were successfully used to predict double twilights.
Edward Brooks continued to observe some bright dawns and dusks through mid-November from Jeddah, Saudi Arabia. Colors were often strong in late October and sometimes reached 40° elevation, but illumination was usually most intense within a few degrees of the horizon. In early November, dawn and dusk colors were typically present only near the horizon; on the 8th, the absence of early dawn colors and the brief late dawn illumination low in the sky suggested that the scattering layer was at lower altitude than before. In mid-November, the onset of variable autumn weather coincided with frequent changes in dawns and dusks, which ranged from prolonged and bright-colored to brief and subdued.
From Millville, New Jersey, Fred Schaaf observed strong twilight colors in October. The timing and extent of illumination 10 October suggested an aerosol altitude of little more than 8 km. Strong 2-stage twilights were seen 27-28 October. Twilight effects weakened suddenly 30 October as arctic air moved into the area, as had occurred in mid-September, and remained weak through early November. Double twilights returned 8 November, when first-stage aerosol illumination ended at a time indicating that the top of the layer was at about 16-19 km. On the 12th, the arrival of arctic air again coincided with the weakening of twilight colors. In late November, colors were often intense but the aerosols appeared to be lower, with the top of the illuminated layer estimated at 11-13 km on the 29th.
Information Contacts: D. Hofmann, Univ. of Wyoming; R. Reiter, Garmisch-Partenkirchen, W Germany; T. DeFoor, MLO; W. Fuller and P. McCormick, NASA; M. Fujiwara and M. Hirono, Kyushu Univ., Japan; H. Lamb, Univ. of East Anglia, England; R. Keen, Univ. of Colorado; E. Brooks, Saudi Arabia; F. Schaaf, Milleville, NJ.
December 1983 (SEAN 08:12) Cite this Report
Balloon and lidar data and colorful sunsets indicate continued presence of El Chichón aerosols
Balloon data - Wyoming. Particle counters on a balloon flight from Laramie, Wyoming 14 December detected a layer of tiny condensation nuclei (CN), centered at about 30 km altitude. Particle concentrations reached about 200/cm3, compared to background values of about 10/19cm3 at that altitude. Temperatures at 30 km altitude had warmed to -30 to -35°C on 10-11 December. David Hofmann noted that particle concentrations observed on the 14th were consistent with values that would be expected in a CN cloud produced a few days earlier.
Data on larger particles were collected during a balloon flight 21 December. The base of the aerosol layer was just above the tropopause (at about 8 km altitude, indicating an arctic air mass). Maximum particle concentrations of about 10/19cm3 (larger than 0.15 µm) were detected at about 12.5 km, declining gradually to about half that value at 18 km and 10% of the peak at 23 km. No distinct sublayers were observed.
Lidar data. In December, lidar at Mauna Loa, Hawaii detected slightly less stratospheric aerosol, as measured by total integrated backscattering, than in October and November. On 7 December, major backscattering peaks, marking the strongest aerosol layers, were separated by only small decreases in values; the 23.2 km layer was the strongest among several sharp peaks. The 2 major layers were well-defined on 14 December. On the 28th, each had a broad, smooth shape and backscattering values dropped sharply between them. At Hampton, Virginia peak backscattering remained somewhat enhanced over lowest summer values. The aerosol profile was considerably more irregular on 3 January than during the previous reading 7 December. The 12 January data at Fukuoka, Japan showed a broad monolayer that included most aerosols below 21 km.
Unusual sunrises and sunsets. From Jeddah, Saudi Arabia, Edward Brooks reported that dawn and twilight colors diminished in late November. Dawns showed no evidence of the presence of a volcanic aerosol layer over nearby Saudi Arabia 28 November - 6 December. Colored but rather subdued dawns indicated that aerosols returned during the second week in December. On 18 December, only the late dawn had significant color, indicating that the aerosol layer was at relatively low altitude. Separate early and late dawn illumination 24 December showed the presence of 2 scattering layers, at high and low altitudes respectively.
Information Contacts: D. Hofmann, Univ. of Wyoming; T. DeFoor, MLO; W. Fuller and M. Osborn, NASA; M. Fujiwara and M. Hirono, Kyushu Univ., Japan; E. Brooks, Saudi Arabia.
January 1984 (SEAN 09:01) Cite this Report
El Chichón cloud persists; lidar data to N Pole
NASA Airborne Lidar Mission, 37°N-North Pole. The following is a report from M. P. McCormick. "An airborne lidar mission was flown 19-28 January on the NASA Electra aircraft from 37°N to the North Pole, via Goose Bay, Labrador, and Söndre Strömfjord and Thule airbases, Greenland. The primary objective of the mission was to provide correlative stratosperic aerosol measurements for the SAM II (Stratospheric Aerosol Measurement) satellite, successfully accomplished on 3 separate satellite underflights.
"The El Chichón cloud was very consistent from 37°N-76°N, generally as a single broad layer with very little structure. From Thule a flight was conducted 24 January to the North Pole along the 60° W meridian to determine the northerly extent of the El Chichón material and to search for polar stratospheric clouds (PSC's, see below). As the aircraft proceeded north from Thule, considerable structure and varied intensity were observed in the El Chichón cloud, with an increase in peak scattering ratio.
"First detected by the SAM II satellite, PSC's are thought to be ice clouds that form during the Arctic and Antarctic winter by freezing of diluted sulfuric acid-water aerosol droplets at temperatures less than about -80° to -85°C, followed by rapid growth by sublimation (McCormick et al., 1982, and Steele et al., 1983). Nacreous or mother-of-pearl clouds are thought to be subsets of PSC's. From 85°N to the Pole, PSC's were detected for the first time by a remote sensor other than SAM II. They occurred at 19-21 km altitude, above the main El Chichón layer.
"A second flight was conducted 25 January from Thule to 86°N and PSC's were again detected within the temperature region of -85°C from about 81°N - 86°N. A third mission was flown 27 January from Thule to 87°N over the same flight path (60° meridian) and somewhat to the east. The El Chichón layer decreased in intensity and was less structured. There were no indications of PSC's, correlating with stratospheric temperature data, which showed that the low-temperature region had moved over the north pole toward Siberia. Returning to Virginia on 28 January, the same consistency was observed in the stratospheric layer as on the earlier northbound flight, with a slight decrease in peak scattering ratio.
"In addition to the uplooking airborne lidar, a downlooking lidar was used to study the tropospheric aerosols. In-situ measurements of aerosol mass and number density, CO2 and O3 were made over the full flight range at various altitudes during the mission.
Lidar data. At Mauna Loa, Hawaii, a distinct double aerosol layer was observed 3 January, similar to the pattern observed in December. No strong upper peak was present a week later, but numerous small layers were detected above the main lower peak. On 19 January, enhanced higher-altitude layers were no longer detected. Two distinct layers were observed over Fukuoka, Japan on 10 February, in contrast to the broad monolayer present a month earlier.
Lidar at Garmisch-Partenkirchen, West Germany continued to detect aerosols from the March-April 1982 eruption of El Chichón. Altitude and values of peak backscattering were slightly lower than in the summer but secondary peaks at higher altitudes were sometimes detected. Integrated backscattering between 1 km above the tropopause and the top of the aerosol layer, about 20% below expected values in the second half of September and the first half of October, rose to 70% above expected values 14 November as the tropopause altitude dropped to 9.9 km in arctic air and backscattering was enhanced between 9 and 13 km.
Unusual sunrises and sunsets. Edward Brooks reported that dawns and dusks indicated a variable and often weak aerosol layer over Jeddah, Saudi Arabia in late December and early January. Morning and evening colors on 26 December suggested that few scattering particles were present at either low or high altitudes. Stronger sunrises and sunsets were observed 27-30 December, but only late dawn colors, illuminating low-altitude aerosols, were visible 31 December. Dawns were essentially colorless 3 and 7-9 January; only late dawn colors (aerosols at low altitude) were visible on the 4th, while only early dawn colors (high-altitude material) were seen 2 days later.
From Millville, New Jersey, Fred Schaaf reported that twilight colors were usually weak to moderate in December and early January. On 16 December, early twilight colors merged into a strong crimson glow at 12° altitude, suggesting that the top of the scattering layer was at 13-18 km altitude. Colors were strong again the following evening and included secondary illumination to a solar depression angle of about 12°. As in previous months, the arrival of arctic air 24 December weakened twilight colors. On 8 January, weak to moderate colors were replaced suddenly by a milky area at 12° altitude, indicating the top of the aerosol layer at 13-16 km. The same evening, a secondary glow remained visible to an SDA of 10°. On 12 January, the time that illumination ended suggested that highest aerosols were at 11-13 km. Only early twilight colors were visible 19 January. A week later, timing of the end of purplish illumination indicated that aerosols reached 16-19 km altitude and a deep-hued secondary glow persisted for much longer. However, colors were very weak the following night. On 1 February, moderate colors disappeared at a time indicating aerosols reached 11-16 km.
References. McCormick, M. P., Steele, H. M., Hamill, P., Chu, W. P., and Swissler, T. J., 1982, Polar stratospheric cloud sightings by SAM II: Journal of the Atmospheric Sciences, v. 39, no. 6, p. 1387-1397.
Steele, H. M., Hamill, P., McCormick, M. P., and Swissler, T. J., 1983, The formation of polar stratospheric clouds: Journal of the Atmospheric Sciences, v. 40, no. 8, p. 2055-2067.
Information Contacts: P. McCormick, NASA; R. Reiter, Garmisch-Partenkirchen, W. Germany; T. DeFoor, MLO; M. Fujiwara and M. Hirono, Kyushu Univ., Japan; E. Brooks, Saudi Arabia; F. Schaaf, Millville, NJ.
February 1984 (SEAN 09:02) Cite this Report
Lidar still detects aerosols but dawn/twilight colors decrease
Lidar data. Lidar data from Mauna Loa, Hawaii showed a substantial decrease in total aerosol backscatter between measurements on 1 and 15 February. Total backscatter as well as altitudes and values of peak backscatter were nearly identical on 15, 22, and 29 February but shapes of aerosol profiles varied somewhat. A broad, single layer without fine structures was detected over Fukuoka, Japan on 11 March. Two distinct layers had been seen from Fukuoka a month earlier. Total backscatter over Hampton, Virginia remained at roughly double the Mauna Loa values. Three distinct layers were observed 8 February, but the aerosol profile showed a single broad layer on 21 February and 1 March.
Unusual sunrises and sunsets. From Boulder, Colorado, Richard Keen reported that unusual twilights were not seen during December. However, Keen notes that clear skies for 1,500 km to the west of the observation site are necessary to generate double twilights, and December weather was usually poor. Double twilights, with salmon color at 4° SDA followed by persistent deep red secondary color, were observed on 2, 4, 6, and 7 January. Double twilights were also observed on 24, 28, and 30 January, and 5-6 February, but were not as bright as those in late 1983 or early January 1984. The secondary twilights of late January-February were also not as persistent; at the end of red secondary glow, SDA was 16° on 4 January, 14° on 28 January, 13° on 30 January and 12° on 6 February. Keen notes that these observations imply a thinning and/or lowering of the aerosol layer. No double twilights have occurred at Boulder from 6 February through early March, but skies west of Boulder were again frequently cloudy.
Optical effects at Jeddah, Saudi Arabia were often weak in late January and February. From sunset 25 January to sunrise 28 January dusk and dawn observations by Edward Brooks indicated that aerosol scatterers were nearly absent. Only early dawn colors (higher altitude aerosols) were seen 1, 2, and 4 February. Of the twilights between 1 and 9 February, only on the 6th did colors indicate a strong scattering layer. Brighter dusks and dawns were more frequent from mid-February, but scattering effects remained inconsistent. No dawn colors were visible 21, 25, and 27 February and colors were subdued on many other mornings and evenings late in the month.
Fred Schaaf reported that twilight effects at Millville, New Jersey in February and early March were the weakest since aerosols from the March-April 1982 El Chichón eruption first arrived over the area. Frequent cloudy weather limited observations. Little or no high-altitude aerosol material appeared to be present and colors produced by lower altitude material had diminished.
Information Contacts: T. DeFoor, MLO; W. Fuller, NASA; M. Fujiwara and M. Hirono, Kyushu Univ., Japan; R. Keen, Univ. of Colorado; E. Brooks, Saudi Arabia; F. Schaaf, Millville, NJ.
March 1984 (SEAN 09:03) Cite this Report
Aerosols persist at mid-latitudes; sunset reports
Unusual sunrises and sunsets. Paul Handler observed brilliant twilights 11-18 March from Guana Island, British Virgin Islands (18.50°N, 64.62°W). Skies 30-45° above the horizon were tinted lavender pink and colors remained for 36-37 minutes after sunset, suggesting the presence of aerosols to about 18 km altitude (Meinel and Meinel, 1983). Yellowish-green illumination was observed one evening, and green clouds were seen around sunset during the week before Handler's visit. The source of the aerosols was unknown.
From Jeddah, Saudi Arabia, Edward Brooks observed few colorful dawns and twilights in early March. Little stratospheric aerosol material appeared to be present, and the bright yellow dawns of 9 and 12 March were the only colorful ones observed during the first half of the month. Effects of stratospheric aerosols were occasionally observed in late March, but colors were not usually strong. Pale colors were seen 17-21 March. The absence of late dusk illumination 22 March indicated that there were no significant aerosols in the stratosphere, and scatterers appeared scarce the next morning. The brief dusk color sequence 30 March indicated a thin layer of aerosols. Dawns were bright and began early 31 March and 1 April, suggesting the presence of high aerosol layers. Dusks and dawns were strong during the first 3 days of April.
Lidar data. Lidar data from Fukuoka, Japan showed two backscattering peaks 28 and 29 March; on the 29th the lower peak was below the local tropopause. Layer altitudes and peak backscattering were very similar 1, 7, and 14 March at Hampton, Virginia, but integrated values were substantially lower on the 7th. More structure was evident on 2 April and integrated backscattering had dropped again to below 7 March levels. Data collection from Mauna Loa, Hawaii was curtailed by the onset of the eruption 25 March. Integrated backscattering has remained very similar since 16 February. Two layers were evident 7 and 13 March, but a broad, multiple-peaked layer was present on the 21st.
Reference. Meinel, A.B., and Meinel, M.P., 1983, Sunsets, twilights and evening skies: Cambridge University Press, Cambridge, England.
Information Contacts: P. Handler, Univ. of Illinois; E. Brooks, Saudi Arabia; M. Fujiwara and M. Hirono, Kyushu Univ., Japan; T. DeFoor, MLO; W. Fuller, NASA.
April 1984 (SEAN 09:04) Cite this Report
Stratospheric aerosols decrease
Lidar data from Fukuoka, Japan and Hampton, Virginia showed generally weaker stratospheric aerosol backscattering in April. On 22 April, the lidar profile at Fukuoka showed a broad single layer that decreased gradually upward from 17 km. At Hampton, integrated backscattering on 25 and 26 April was only half that on the 11th, and lower than values measured in previous months. Lava from the March-April eruption of Mauna Loa cut electric power lines to Mauna Loa Observatory and no lidar data has been collected there since 21 March.
Edward Brooks reported that dawn and dusk colors at Jeddah, Saudi Arabia were variable but generally unimpressive in April, continuing the trend of recent months. Dawn colors were bright 1-3 April and remained bright on the 4th and 5th, but no late dusk colors were observed, indicating the absence of high-altitude aerosols. Dawn was colorless 7 April and faint 8-11 April. A bright dusk 11 April and dawn the next morning were followed by cloudy weather through the 14th. Dawn and dusk were colorless on the 15th, but moderately strong from the 16th through dawn on the 21st.
Information Contacts: W. Fuller, NASA; M. Fujiwara and M. Hirono, Kyushu Univ., Japan; E. Brooks, Saudi Arabia.
May 1984 (SEAN 09:05) Cite this Report
Volcanic aerosols remain in stratosphere
Lidar continued to detect remnants of the aerosol cloud produced by the March-April 1982 explosions from El Chichón, México. Peak backscattering ratios decreased at Fukuoka, Japan, where 2 layers were evident. Altitudes and peak backscattering ratios of the main layers at Hampton, Virginia were similar in April and May. However, measurements made in an Arctic airmass 16 May yielded a total backscatter nearly twice as large as it had been a week earlier in tropical air. Aerosols were relatively dense down to the tropopause, at 11 km altitude on the 9th and 9.6 km on the 16th. On 24 May, many small layers were present, the tropopause was much higher (13.5 km), and total backscatter had decreased to late April levels. Little structure was evident in the aerosol material 4 June. Values from Garmisch-Partenkirchen, Germany showed minor variation between January and April, but were generally slightly lower than in late 1983. Lidar measurements resumed 30 May at Mauna Loa Observatory. Peak and total backscattering had decreased slightly since late March.
From Jeddah, Saudi Arabia, dawns and dusks observed by Edward Brooks varied in intensity. Moderately strong colors observed from 16-21 April persisted through dawn on the 23rd, but were only intermittently present through the end of the month. Weak dawns and twilights from 30 April through the dawn of 6 May suggested that little or no aerosol material was present. Moderate colors returned late 6 May and dusk on the 9th was long and strongly illuminated, indicating the presence of high-altitude aerosols. Dawns and twilights were colorful through 14 May, and faint N-S bands of high-altitude aerosols were visible at dawn on the 11th. Morning and evening colors were again absent 15-18 May, then clouds prevented observations through the 22nd. Moderate colors were present 23-24 May but were weak the following 2 days.
Information Contacts: R. Reiter, Garmisch-Partenkirchen, W Germany; W. Fuller, NASA; M. Fujiwara and M. Hirono, Kyushu Univ., Japan; T. DeFoor, MLO; E. Brooks, Saudi Arabia.
June 1984 (SEAN 09:06) Cite this Report
Atmospheric turbidity over Japan declines gradually from late 1982 to early 1983 peak; lidar shows persistent aerosols
Toyotaro Yamauchi and Hidehiro Shimura report that atmospheric turbidity over Japan (figure 5) reached a maximum between late autumn 1982 and spring 1983. Atmospheric turbidity has decreased gradually since then, but was still considerably higher than normal during the winter of 1983-84. At noon on clear days in December 1982, direct solar radiation (I) and global solar radiation (G) showed decreases of 0.17 kW/m2 (20%) and 0.02 kW/m2 (3%), and diffuse solar radiation (D) a 0.07 kW/m2 (74%) increase at Tsukuba, Japan (36.17°N, 141.09°E) as compared to a normal year. In December 1983, I was 0.05 kW/m2 (6%) lower and D was 0.02 kW/m2 (26%) higher than a normal year at Tsukuba, while G was approximately normal (figure 6).
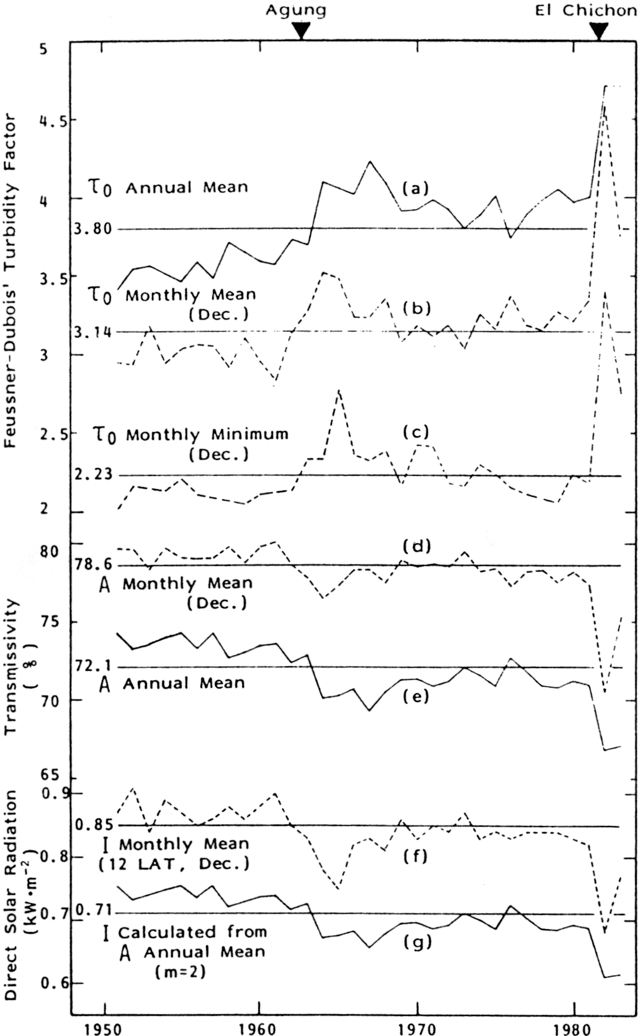 |
Figure 5. Three measures of aerosol content of the atmosphere; (top) variation in atmospheric turbidity (t0), (center) transmissivity (A), and (bottom) direct solar radiation (I), for all stations in Japan, 1950-1983. The largest changes followed the eruptions of Agung in 1963 and El Chichón in 1982. Courtesy of T. Yamauchi and H. Shimura. |
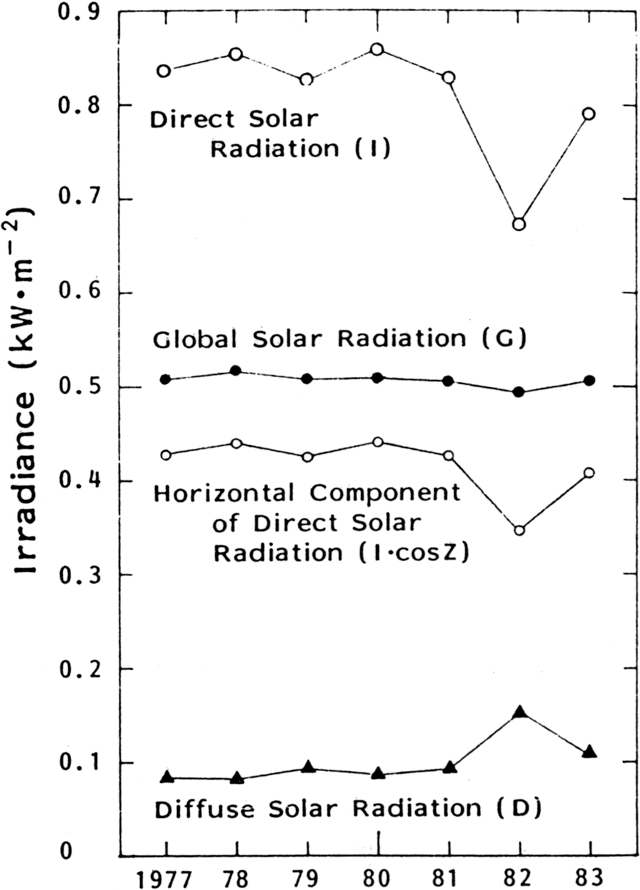 |
Figure 6. Monthly means of direct, diffuse, and global solar radiation observed at noon on clear days at Tsukuba, Japan. [Note that the decline in direct solar radiation after the 1982 El Chichón eruption is mirrored by an increase in diffuse radiation as the aerosol cloud scatters sunlight.] Courtesy of Minoru Obata, Aerological Observatory. |
Lidar at Mauna Loa, Hawaii continued to detect stratospheric aerosols from the March-April 1982 eruption of El Chichón. Altitude and peak backscatter of the main layer remained similar through June. A small peak in the upper troposphere or lower stratosphere was also observed throughout the month. Particularly pronounced on 14 June, it was distinctly weaker although still evident on the 29th. There was no obvious single source for this layer, although moderate explosions had occurred at low latitudes at several volcanoes in previous weeks, including Pagan (Mariana Islands), Soputan (Indonesia), and Manam (Papua New Guinea). A similar layer was present over Hampton, Virginia in late May, but a distinct lower layer was not reported from there in June. Altitude and backscattering of the main layer were relatively uniform through the month, but a lower tropopause on the 25th (10.5 km) was accompanied by an increase in total backscatter.
Information Contacts: T. Yamauchi and H. Shimura, JMA; T. DeFoor, MLO; W. Fuller, NASA.
July 1984 (SEAN 09:07) Cite this Report
El Chichón aerosols persist in stratosphere
July lidar data indicated the continuing presence of stratospheric aerosols from El Chichón. A small layer in the upper troposphere or lower stratosphere over Mauna Loa, Hawaii in June was still present in July, although somewhat weaker. Layer altitudes, and values of peak and integrated backscatter at Hampton, Virginia in early July and early August were similar to late June figures. Collection of lidar data resumed at Fukuoka, Japan in mid-July. A single layer was reported in contrast to the pair of layers observed in May.
Brightness and duration of July twilights at Boulder, Colorado were the strongest since January, but Richard Keen noted that it was difficult to determine whether the cause was less cloudiness west of Boulder or the presence of thicker and/or higher aerosols. Bright salmon-pink topinkish-lavender twilights, peaking in color intensity at an SDA of 4-5°, were observed 20 March, 14-15 April, 7 May, 1-5 and 16-18 July, and 2 August. Rather dim reddish secondary twilight colors persisted to an SDA of 9° on 14-15 April. Brighter red secondary twilights remained visible to an SDA of 9° on 4 July, 11° on the 5th and 16th, 12° on the 17th and 13° on the 18th. Keen related the general lack of twilight effects March-June to frequent high-level coloudiness over the western United States in the spring. Dates in July without twilight effects corresponded to dates of thunderstorm activity over the Great Basin. Late May - early June dawns observed by Edward Brooks from Jeddah, Saudi Arabia were later than those of the previous year, indicating a significant reduction in stratospheric aerosols. Brooks noted that observations during the second week in June showed no firm evidence of volcanic aerosols in the stratosphere. Fred Schaaf noted that twilight glows were sometimes visible from Millville, New Jersey in June and July, after having been nearly absent March-May. Timing and position of the glow suggested maximum aerosol altitudes of little more than 8 km.
Information Contacts: R. Keen, Univ. of Colorado; E. Brooks, Saudi Arabia; F. Schaaf, Millville, NJ; M. Fujiwara and M. Hirono, Kyushu Univ., Japan; T. DeFoor, MLO; W. Fuller, NASA.
August 1984 (SEAN 09:08) Cite this Report
10 years of lidar data from Virginia summarized
H. H. Lamb's report describes observations from Holt, England (52.9°N, 1.1°E), about 30 km N of Norwich, his previous observing site.
"Twilight optical effects presumably attributable to the remnants of the El Chichón aerosol remained visible on clear evenings in November, 1983, but then became less noticeable and in early 1984 seemed generally weak. After a long period in which an untrained observer would surely have noticed nothing unusual about the twilight glows, on 19 August pink crepuscular rays reached 20-22° elevation at 1945-1950 GMT, about a half-hour after sunset, indicating an illuminating layer at about 25-27 km altitude."
Little variation was seen in aerosol profiles measured by lidar at Mauna Loa, Hawaii in August and at Hampton, Virginia in August and early September. Integrated backscattering at Mauna Loa was consistently higher in August than in July; values dropped somewhat at Hampton. The lidar profile at Mauna Loa suggested that aerosols extended downward several km into the troposphere from the stratospheric layer. Figure 7 shows changes in stratospheric aerosols over Hampton during the past 10 years, with timing of large explosive eruptions.
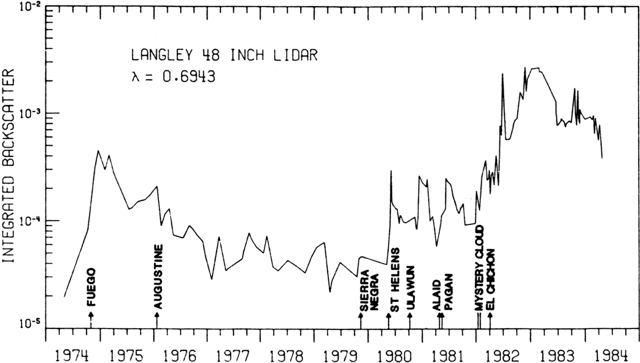 |
Figure 7. Atmospheric effects of some large explosive eruptions, 1974-1984. Integrated backscattering measured at the 48-inch lidar at Hampton, Virginia. Courtesy of the NASA Langley Research Center. |
Information Contacts: H. Lamb, Univ. of East Anglia, England; W. Fuller, NASA; T. DeFoor, MLO.
September 1984 (SEAN 09:09) Cite this Report
Two years of lidar data from Germany summarized
Lidar and balloon data showed that aerosols from the March-April 1982 eruption of El Chichón remain in the stratosphere. Despite the 15-km eruption clouds reported during the Mayon eruption, no new aerosol layers were detected. At Mauna Loa, Hawaii, integrated backscattering values were lower in September than in August. Cirrus clouds were abundant throughout the month, masking any upper tropospheric aerosols that might have been present. A sunrise during clear weather in early October did not show any apparent aerosol layers. At Hampton, Virginia, a very broad backscattering peak and somewhat increased integrated backscatter were measured 6 September, but a profile with a narrower peak on 19 September (the last measurement of the month) yielded integrated values lower than in August. September values from Fukuoka, Japan were similar to those from the last measurement in mid-July. April-June lidar data from Garmisch-Partenkirchen, Germany show a gradual decrease in backscattering from stratospheric aerosols. A 3-dimensional representation of the structure of the aerosol profile since early 1982 is shown in figure 8. Balloon data from Laramie, Wyoming have continued to show slow decay of the El Chichón aerosols. No material from Mayon was evident during a flight 6 October.
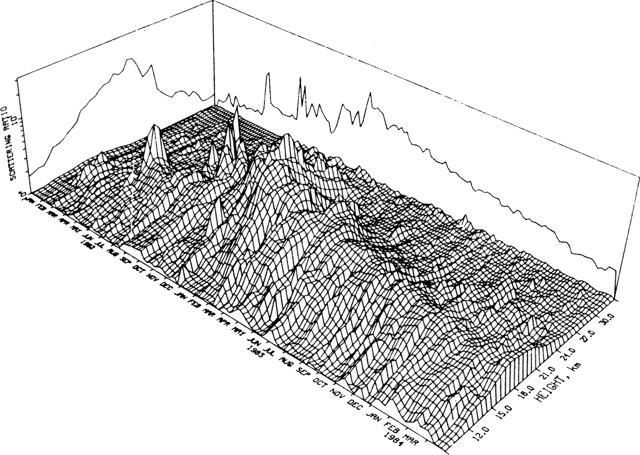 |
Figure 8. Development and gradual decay of the El Chichón aerosol cloud over Garmisch-Partenkirchen, West Germany, January 1982-March 1984. The aerosol profile structure is represented in three dimensions. Courtesy of Reinhold Reiter. |
Information Contacts: R. Reiter, Garmisch-Partenkirchen, W. Germany; T. DeFoor, MLO; M. Osborn, NASA; M. Fujiwara and M. Hirono, Kyushu Univ., Japan; J. Rosen, Univ. of Wyoming.
October 1984 (SEAN 09:10) Cite this Report
Lidar data from Italy and Germany
Lidar at Garmisch-Partenkirchen, Germany continued to detect remnants of the stratospheric aerosols from the El Chichón eruption. Peak backscattering ratios were somewhat lower in the summer and early autumn than they had been in the spring. At Firenze, Italy (43.8°N, 15.25°E), lidar data were collected April 1982-March 1984 by the Istituto di Ricerca Sulle Onde Electromagnetiche (figures 9 and 10). Integrated backscattering increased from just after the El Chichón eruption through early 1983, then declined gradually. At Hampton, Virginia, integrated backscattering was about the same in late October as in mid-September. A relatively weak secondary layer appeared to be present above the main layer of El Chichón material. Integrated backscattering varied considerably in October at Mauna Loa, Hawaii. An intense layer observed 30 October between a double tropopause at 15 and 15.3 km was probably cirrus cloud; below 13 km several layers appeared on the lidar data and cirrus were visible to the naked eye. At Fukuoka, Japan, increases in peak and integrated backscattering were noted for several days beginning 8 October between 9 and 22 km. Values rose to about 1.8 times seasonal means, then returned to previous levels.
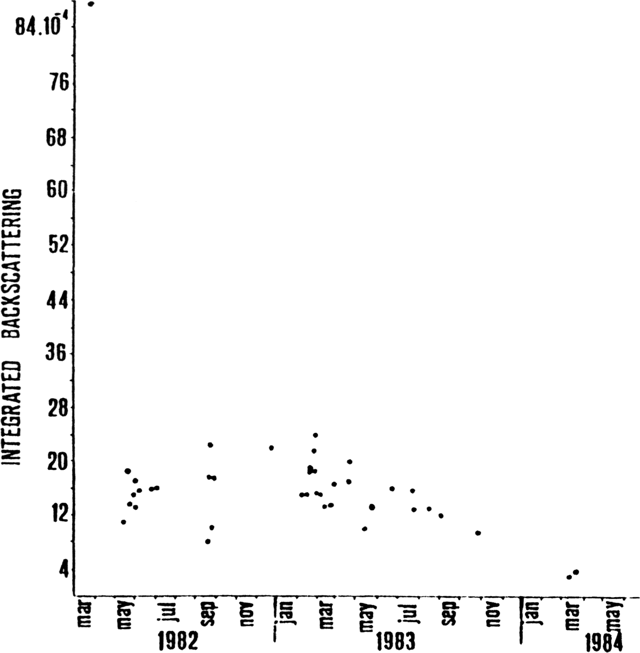 |
Figure 9. Arrival and decay of the El Chichón aerosol cloud over Firenze, Italy, April 1982-March 1984. Integrated backscattering measured by Nd-YAG lidar (with second harmonic generator, producing a wavelength of 0.53 microns). Receiving optics were redesigned and new acquisition and processing software written in fall 1982. Prior data were from a system designed for detecting lower tropospheric aerosols and are thus less reliable. Courtesy of Leopoldo Stefanutti. |
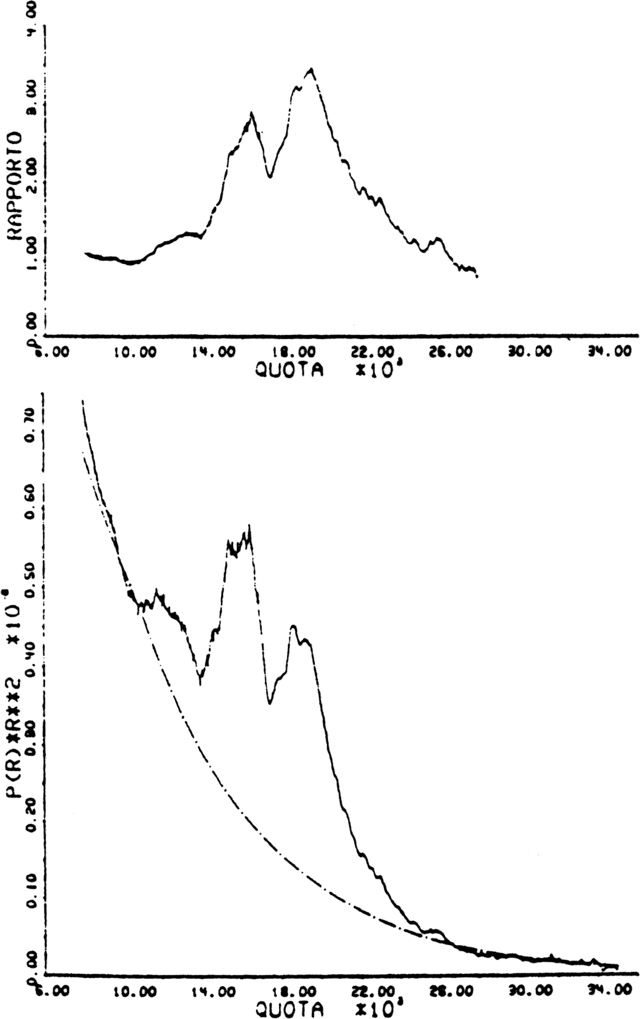 |
Figure 10. Profile of volcanic aerosol layers over Firenze, Italy, 18 February 1983, about the time of maximum enhancement (figure 9). Backscattering ratios (top) and coefficients (bottom) vs. altitude, from Nd-YAG lidar data. The dashed line on the lower graph represents the US standard atmosphere. Courtesy of Leopoldo Stefanutti. |
M. Patrick McCormick and Thomas Swissler provided the following information about the relationship between backscattering ratios measured by lidar at wavelengths generated by ruby (0.6943 µm), and Nd-YAG (1.064 and 0.532 µm) laser transmitters. For any two wavelengths, the relationship can be expressed as:
(1) (R1-1) = (N1/N2)4-x (R2-1) where R1 and R2 are backscattering ratios produced by lidar operating at wavelengths N1 and N2. The value of x varies with the aerosol size distribution at a given time. Using techniques described in McCormick et al., (1984), McCormick and Swissler calculated values of x for a typical background aerosol size distribution (no significant volcanic contribution) from Russell et al. (1981) and for the aerosols measured by Hofmann using a 6-channel dustsonde on 24 August and 21 December, 1983 (about 17 and 21 months after the March-April 1982 eruption of El Chichón). After calculating x, equation (1) can be simplified to:
(2) (R1-1) = k(R2-1)
By substituting k values into equation (2) from the appropriate model in table 1, lidar data of different frequencies can be made approximately comparable.
Table 1. For each of three aerosol models, values of k relating pairs of lidar frequencies are shown. Values of x used to derive k for each model are also shown. Subscripts of k show the two frequencies being compared, where r = ruby (0.6943 µm), y = Nd YAG (1.064 µm), and g = Nd YAG 2nd harmonic (0.532 µm). In addition to the Russell and Hofmann models, Hirono's value of 0.4 for k(r,y) is extrapolated for k(g,y) and k(g,r).
| Aerosol model | x | k(r,y) | k(g,y) | k (g,r) |
| Hirono (SEAN 07:05) | 1.85 | 0.40 | 0.23 | 0.56 |
| Russell et al. 1981 | 1.60 | 0.36 | 0.19 | 0.53 |
| Hofmann 24 Aug and 21 Dec 1983 | 0.90 | 0.27 | 0.12 | 0.44 |
From Millville, New Jersey, Fred Schaaf continued to observe unusual twilight colors. From mid-July through mid-September, weak to moderate primary glows were usually present, and purple and crimson colors were often observed for somewhat longer after sunset. Timing of the disappearance of later colors suggested that aerosols were present to at least 8-13 km. Strong crepuscular rays were observed during the evenings of 20 August and 11 September. On a few evenings, little or no glow was evident. In late September and early October, weak secondary illumination was visible, and the timing of primary colors suggested that aerosols were present to 13-19 km altitude on 26 September. From about 38°N, 75.5°W (Maryland-Virginia border), Schaaf saw moderate colors and many crepuscular rays on 28 October. In arctic air over New Jersey 7-8 November, colors were relatively weak and faded quickly.
References. Russell, P. B., Swissler, T.J., McCormick, M. P., Chu, W. P., Livingston, J. M., and Pepin, T. J., 1981, Satellite and correlative measurements of the stratospheric aerosol. I: An optical model for data conversions: Journal of Atmospheric Sciences, v. 38, no. 6, p. 1279-1294.
McCormick, M. P., Swissler, T. J., Fuller, W. H., Hunt, W. H., and Osborn, M. T., 1984, Airborne and ground-based Lidar measurements of the El Chichón stratospheric aerosol from 90°N to 56°S: Geofísica Internacional, v. 23, no. 2, p. 187-221.
Information Contacts: L. Stefanutti, Isto. di Ricerca Sulle Onde Electromagnetiche, Italy; R. Reiter, Garmischen-Partenkirchen, W. Germany; P. McCormick, T. Swissler, W. Fuller, and M. Osborn, NASA; T. DeFoor, MLO; M. Fujiwara and M. Hirono, Kyushu Univ. Japan; F. Schaaf, Millville, NJ.
November 1984 (SEAN 09:11) Cite this Report
Aerosols increase over Italy but decline over Hawaii
Since the El Chichón eruption cloud was first detected over Mauna Loa, Hawaii in April 1982, the aerosols measured by lidar there have extended downward from the stratosphere into the upper troposphere, without a sharply-defined base. Aerosol concentrations in the upper troposphere decreased graduually with decreasing altitude. November lidar data showed a return to typical pre-El Chichón profiles in the upper troposphere, with few aerosols and cleanest air at the top of the troposphere, near the tropopause.
The Mauna Loa lidar cannot reliably measure aerosol concentrations above about 30 km altitude, but the presence of a distinct break in slope in the recorded profile at roughly 39 km in past months has suggested enhanced aerosol concentrations to that altitude. However, lidar measurements on 15 and 27 November showed no structure between 30 and 40 km altitude, suggesting that no aerosols were present. The 27 November data also showed a substantial decrease in the integrated aerosol backscattering, suggesting a decline in the stratospheric aerosol load. The decrease in integrated backscattering appeared real and the instrument signal looked typical, but the presence of a heavy cirrus layer at the altitude where the instrument is usually normalized may have distorted the data. No similar decreases in aerosol backscattering were observed at Fukuoka, Japan or Hampton, Virginia.
Lidar data at Firenze, Italy showed no firm evidence of aerosols from the eruption of Mayon (Philippines) in September, but integrated backscattering increased from the end of October through the end of November. Aerosol loading seemed quite continuous from about 14 km to 22-23 km altitude. Measurements at the end of November showed more evidence of inhomogeneity of aerosol distribution with height.
William Fuller reports that a ground truth measurement experiment took place over Laramie, Wyoming 29-30 November during the overflight of the newly-launched SAGE II satellite. Sun photometer and airborne lidar measurements were conducted on board the Ames Research Center CV 990 aircraft. Aerosol, water vapor, ozone, and NO2 measurements were made using balloon-borne samplers. Excellent data sets were obtained on each day.
Information Contacts: T. DeFoor, MLO; W. Fuller, NASA; M. Fujiwara and M. Hirono, Kyushu Univ., Japan; L. Stefanutti, Isto. di Ricera Sulle Onde Electromagnetiche, Italy.
December 1984 (SEAN 09:12) Cite this Report
Strong twilight colors resume over England
H. H. Lamb reported a resumption of strong sunset colors in late November in the vicinity of Holt, England. The effects were stronger than they had been in more than 12 months. The timings and elevations of the optical phenomena seemed to suggest the illumination of an aerosol layer at about 22-25 km altitude. Lamb noted that for both the March-April 1982 eruption of El Chichón, and the August 1883 eruption of Krakatau, the first strong optical effects over England were at about the same time of year.
On 25 November, Lamb noted a strong purple patch that extended to more than 20° elevation and appeared about 30 minutes after sunset. At sunset on 28 November, the slightly greenish orange sun was surrounded by strong orange diffused light, and a purplish patch more prominent than on the 25th was present 50-60 minutes after sunset. However, no anomalous colors or other optical effects were seen at sunset in clear weather on 30 November.
During clear weather in early December, optical phenomena similar to those of late 1982 and early 1983 yet stronger than those of late 1983 were consistently observed by Lamb and his colleague Michael Kelly. The 6 December effects were very similar to the most impressive twilight seen in November 1982. As the sun set on 6 December, it was surrounded by orange light to about 3 solar diameters. From 10 to 20 minutes after sunset, a horizontal pinkish purple band appeared, evidently from the illumination of a layer above the surface haze. This band gradually climbed to 10° elevation, becoming broader and more diffuse. At 1600, 20 minutes after sunset, the entire western sky was a brilliant yellow to 35° elevation, edged by a brown layer along the horizon. By 1610, a purple patch had developed from 10-30° elevation above a shield-shaped area of bright white sky. At 1616, the maximum elevation of the purple glow was 20° and the sky from the horizon to 3° was a fiery deep brownish red. The next morning, the rising sun was pale yellow and surrounded by orange diffused light to 4 solar diameters. Twilight observations that evening were similar to those the previous day, but the purple patch at 1615 was asymmetrical, roughly triangular, with a vertical northern edge. It then narrowed to a broad column of light, which reached only 10-12° elevation by 1622 and faded fast. Sunrise on 8 December was obscured by clouds. That evening, purple light development was less pronounced than on the 6th and 7th, and gradually changed to a dirty gray. A fiery red band was present along the horizon at 1630. After sunset on 10 December, the purple patch was especially beautifully colored and in the form of crepuscular rays, reaching 25° elevation at 1615 and fading soon after 1620, when the maximum elevation was about 18°.
Richard Keen reported that brightness and duration of twilights at Boulder, Colorado showed a noticeable and steady decrease from late August through early December, indicative of a continued thinning and/or lowering of the aerosol layer. Enhanced salmon-pink to lavender twilights, peaking in color intensity at an SDA of 4°, were observed on either the mornings or evenings of 26, 27, 29, and 30 August; 2, 3, 5, and 15 September, 7 October, and 4-6 December. Extended lavender to purplish twilights were visible to an SDA of 11° in either the morning or evening sky on all these dates except 26 and 29 August and 5 December. Keen related the occurrence of extended twilights on individual dates to the absence of cirrus clouds for 1000-2000 km in the direction of the sun.
The shapes of lidar profiles and total aerosol backscattering at Mauna Loa, Hawaii varied considerably in December. Data on 11 and 19 December were similar to those of October and early November, with higher integrated backscattering than in late November and early December. Breaks in slope in recorded profiles on those dates suggested that aerosols were present to 34 and 39 km altitudes. Aerosol concentrations and maximum layer altitudes decreased again at the end of December.
Information Contacts: H. Lamb, Univ. of East Anglia, England; R. Keen, Univ. of Colorado; T. DeFoor, MLO.
January 1985 (SEAN 10:01) Cite this Report
Major stratospheric warming evaporates aerosols
Significant concentrations of aerosols from El Chichón remained in the stratosphere at the beginning of 1985. Major stratospheric warming in late December and January may have evaporated and recondensed the El Chichón aerosols over a large portion of mid and high northern latitudes.
A small stratospheric warming event started about 7 December over the Aleutians. Air circulation at the 30 km level carried air from the zone of warming toward the western United States, cooling the air in transport. Balloon-borne particle counters detected increased numbers of tiny condensation nuclei (CN) at about 30 km altitude over Laramie, Wyoming on 14 and 18 December. The bases of December particle count profiles were relatively smooth, suggesting that the CN droplets were about 1-2 weeks old.
A much larger and more intense stratospheric warming began in late December and increased stratospheric temperatures persisted through January. Labitzke et al. (1985) note that "The evolution of this warming was very unusual. Only the development of the winter of 1956/7 appears to be similar, although few stratospheric data are available from that event." They report that stratospheric warming was first observed 26 December over Sable Island (44°N, 60°W) where the temperature at about 30 km altitude (10 hPa) was -24°C. Within a few days, the entire Arctic had warmed, resulting in a complete reversal of the stratospheric and mesospheric circulation over high latitudes and a breakdown of the polar vortex. By 29 December, temperatures at 30 km over the Labrador Sea area were 55° higher than they had been 5 days earlier and effects extended over much of eastern and central North America. Satellite data showed the rapid disappearance of the polar vortex over Europe and radiosonde measurements over Berlin (52.32°N, 13.25°E) on 2 January showed that intense warming had occurred in the 3 days since the previous measurement. The lower and middle stratosphere remained very disturbed in mid-January and a new warming pulse was developing over Labrador.
Balloon soundings from Laramie on 9, 24, and 31 January measured CN concentrations as high as 100/cm3 at 30 km altitude, compared to background values of 2-3/cm3. In contrast to previous years, meteorological data suggested that Laramie was within the zone of warming, so the January soundings may have sampled ongoing or very fresh CN events.
January lidar data from Mauna Loa, Hawaii showed no major changes from the previous month. The profile on 15 January showed a pronounced peak, whereas the layer was much broader on the 22nd, but integrated backscattering values on the two nights were very similar. Early February lidar data from Hampton, Virginia were similar to those from previous measurements in November.
Reference. Labitzke, K., Lenschow, R., Naujokat, B., and Petzoldt, K., 1985, First note on the major stratospheric warming at the end of December 1984: Beilage zur Berliner Wetterkarte SO 1/85, Met. Inst. Free University of Berlin. A shortened version has been submitted to the Map Newsletter.
Information Contacts: D. Hofmann, Univ. of Wyoming; T. DeFoor, MLO; W. Fuller, NASA.
February 1985 (SEAN 10:02) Cite this Report
El Chichón aerosols persist over N Hemisphere
The 20 February lidar profile at Hampton, Virginia showed quite uniform aerosol density to 23.5 km altitude. By 6 March, the lidar profile had returned to a more normal shape with a distinct peak. At Mauna Loa, Hawaii, lidar data indicated that the aerosol layer on 19 February terminated at a much lower altitude and had smaller peaks than 5 days earlier; integrated backscattering was nearly halved. No significant increase in backscattering was observed from Garmisch-Partenkirchen, Germany October 1984-January 1985. A second higher-altitude layer was detected in December and January, but maximum backscattering ratios did not increase.
Information Contacts: R. Reiter, Garmisch-Partenkirchen, W Germany; T. DeFoor, MLO; W. Fuller, NASA.
March 1985 (SEAN 10:03) Cite this Report
El Chichón aerosols continue gradual decline
Integrated aerosol backscattering remained about the same over Mauna Loa, Hawaii and decreased slightly over Hampton, Virginia in March. Lidar data from Garmisch-Partenkirchen, Germany showed little change in altitudes of aerosol layers or peak backscattering ratios during winter 1984-85. No new aerosol layers were reported.
Information Contacts: T. DeFoor, MLO; M. Osborn, NASA; R. Reiter, Garmisch-Partenkirchen, W Germany.
April 1985 (SEAN 10:04) Cite this Report
Fewer stratospheric aerosols remain over low latitudes
An airborne lidar mission supporting the SAGE II satellite detected substantially smaller amounts of stratospheric aerosol at low latitudes than an mid-latitudes. Maximum backscattering ratios off the east coasts of Central America and Brazil were similar to those measured over southern California. However, the aerosol layers off Central America and Brazil were narrower, truncated at the base by higher tropopauses characteristic of the tropics, and integrated backscattering at low latitudes was only about 1/3 that over California. Sun photometer data were also collected from the aircraft, and balloons and ozone-sensing rockets were launched from Natal, Brazil.
Data from Mauna Loa, Hawaii showed a continuing gradual decline in stratospheric aerosols, with integrated backscattering at the end of April dropping to little more than half the early March values. Peak backscattering over Fukuoka, Japan declined sharply in early April, but had returned to near late March values by mid-April.
Information Contacts: W. Fuller, NASA; M. Fujiwara, Kyushu Univ., Japan; T. DeFoor, MLO.
May 1985 (SEAN 10:05) Cite this Report
El Chichón aerosols persist over low and mid latitudes
Stratospheric aerosol concentrations continued to decline through mid-May at Mauna Loa, Hawaii, but a new layer was detected just above the tropopause late in the month. The new layer was only a small anomaly on the 23 May lidar profile, but was somewhat stronger by the time of the next measurement on 30 May. It was not sharply defined, suggesting that it was at least a month old, although it had not been previously observed at Mauna Loa. Small layers of this type can be produced by recirculation of existing aerosols as well as by a new injection of material. No such layer was detected by the SAGE II support mission in late March and early April. Lidar at Garmisch-Partenkirchen, Germany continued to detect remnants of the El Chichón stratospheric aerosol cloud. Layer altitudes and peak backscattering ratios changed little from February through April.
Information Contacts: R. Reiter, Garmisch-Partenkirchen, W. Germany; T. DeFoor, MLO, HI; W. Fuller, NASA, VA.
June 1985 (SEAN 10:06) Cite this Report
El Chichón aerosols persist; tropospheric layers may be smoke from forest fires
Persistent remnants of the El Chichón stratospheric aerosol cloud were measured over Virginia and Hawaii. Tropospheric aerosol layers were also detected by lidar over Virginia in late June and early July, and by an airline pilot at about 11 km altitude over Tennessee in late June. No volcanic source was recognized for the tropospheric aerosols, but many forert fires were burning in the western United States during this period. In early July, smoke from one major fire rose to 5.5 km altitude. Enhanced sunrises and sunsets have been reported from Boulder, Colorado, roughly 1,500 km away.
Information Contacts: W. Fuller, NASA; T. DeFoor, MLO; P. Handler, Univ. of Illinois; M. Matson, NOAA/NESDIS.
July 1985 (SEAN 10:07) Cite this Report
Stratospheric aerosols from El Chichón persist
Stratospheric aerosols produced by the 1982 eruption of El Chichón continued to be measured over Virginia and Hawaii in July. A tropospheric layer, perhaps smoke from major forest fires in the western United States was detected over Virginia on 9 July, but no such layer was present 9 days later. Peak and integrated backscattering remained similar to values of the past few months, but were distinctly lower than the beginning of this year.
Information Contacts: T. DeFoor, MLO; W. Fuller, NASA.
August 1985 (SEAN 10:08) Cite this Report
Aerosol data similar over Alaska and lower latitudes
Stratospheric aerosols from the El Chichón eruption weakened in August over Japan, Hawaii, and Virginia.
The following is a report from William Fuller. "An airborne lidar mission supporting the SAGE II/SAM II correlative measurement experiment was flown on the NASA Wallops P-3 aircraft on 7, 8, and 9 August 1985 from Fairbanks, Alaska. SAGE II missions were flown on 7 and 9 August just south and north of Fairbanks (64.8°N, 147.9°W) and SAM II measurements were conducted to 74°N. Other correlative measurements supporting the experiments were as follows: in-situ balloon-borne aerosol, water vapor, ozone measurements, and higher-altitude sampling from a NASA U-2 aircraft. Sun photometer data were also obtained on the P-3 flights. One set of data was taken at the Wallops flight facility on 2 August prior to departing for Alaska. Peak scattering ratios from 63°N to 74°N were approximately the same as at 38°N latitude, on the order of 1.4. The peaks occurred at lower altitudes because of the lower tropopause heights at high latitudes (10 km at 64°N, 16 km at 38°N."
Information Contacts: W. Fuller, NASA; M. Hirono, Kyushu Univ. Japan; T. DeFoor, MLO.
September 1985 (SEAN 10:09) Cite this Report
El Chichón aerosols weaken slightly
Lidar measurements indicated that the stratospheric aerosol cloud from the 1982 eruption of El Chichón had weakened very slightly over Germany, Japan, and Hawaii.
Information Contacts: R. Reiter, Garmisch-Partenkirchen, W Germany; T. DeFoor, MLO; M. Fujiwara, Kyushu Univ., Japan.
October 1985 (SEAN 10:10) Cite this Report
El Chichón aerosols persist in the lower stratosphere
Lidar data from Japan, Hawaii, and Virginia showed the continuing presence of aerosols from the 1982 eruption of El Chichón (figure 11). Although both peak and integrated backscattering values remained very uniform over Hawaii from measurement to measurement, the lidar profiles showed substantial variation. The 1 October profile was relatively smooth; two small peaks were apparent on the 16 October data; a zone of sharply decreased aerosol concentration was detected between 20.5 and 23 km altitude on 23 October; and there was a step increase (in contrast to the usual gradual increase) in backscattering at the base of the stratosphere on the 30 October profile.
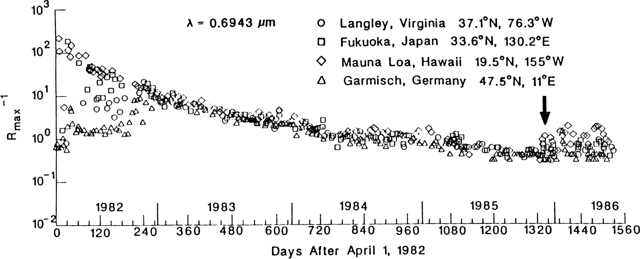 |
Figure 11. Aerosol layers from the eruptions of El Chichón and Ruiz as monitored from four lidar sites, April 1982-mid 1986. El Chichón aerosols arrived first at lower altitude sites, but by early 1983 measurements were very similar at low and mid-latitudes. Values were much smaller for the Ruiz aerosols (to the right of the arrow). Peak backscatter data (x axis; note logarithmic scale) were normalized to ruby values. Courtesy of M.O. McCormick. |
From Holt, England, H. H. Lamb has observed weakening of optical phenomena associated with stratospheric aerosols since his report of strong effects in November and December 1984. On 16 February, the clear sky appeared dirty at twilight and a distinct purple patch developed 20 minutes after sunset. Strong optical effects and colors were observed after sunset on 4-6 and 13 March, and 21 April, with measurements indicating an aerosol height of 20-25 km, as in December. Lamb's next detailed sunset observations were on 1 September and 13 October, with a characteristic fiery red layer along the horizon being particularly notable on the latter date. Measurements of the elevation of the top of the illuminated patch in September and October suggested that the aerosol layer was at 15-18 km altitude.
Information Contacts: H. Lamb, Univ. of East Anglia, England; T. DeFoor, MLO; M. Fujiwara, Kyushu Univ. Japan; M. Osborn, NASA.
November 1985 (SEAN 10:11) Cite this Report
New stratospheric aerosol layers
Data from Hawaii and Wyoming suggest that aerosol material, perhaps from the 13 November eruption of Ruiz volcano, Colombia, has recently been injected into the stratosphere. Through 22 November, lidar measurements at Mauna Loa, Hawaii continued to show only remnants of the 1982 El Chichón aerosol cloud. On 26 and 27 November, a distinct new layer centered at 25-25.5 km appeared on Mauna Loa lidar profiles (figure 12), accompanied by a substantial increase in total backscatter. This layer was absent over Mauna Loa on 3 December, but new layers centered at 15, 16.8, and 18.6 km altitude (tropopause altitude was 16.5 km) were detected and total backscatter remained elevated. Preliminary data 7 and 10 December showed some apparent new material, but less distinctly than on the 3rd. No new material was evident 10 December over Hampton, Virginia.
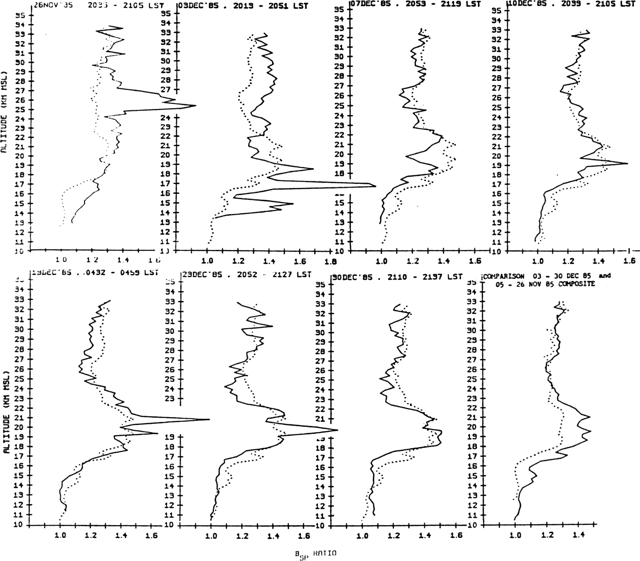 |
Figure 12. Arrival of Ruiz aerosols at different altitudes, shown by preliminary lidar profiles from Mauna Loa, Hawaii, 26 November-30 December 1985. Backscattering ratios are on the x axis, altitudes above sea level on the y axis. In the six dated graphs, the solid line records the data collected that night, the dotted line represents the average December profile. The final graph compares the average December profile (solid line) containing the new Ruiz aerosols with the average November profile (dotted line), primarily aerosols remaining from the 1982 eruption of El Chichón. Courtesy of Thomas DeFoor. |
While flying from Honolulu to Los Angeles on 27 November at approximately 22°N, 140°W, David Hofmann saw a cloud of particles above the aircraft at an estimated elevation of 12 km. The gray haze and large ring around the sun were very similar towhat Hofmann observed shortly after the eruption of Fuego volcano, Guatemala in October 1974, suggesting that this cloud was also of volcanic origin.
On 5 December, balloon-borne particle counters detected a 10-fold increase in condensation nuclei (CN, H2SO4 droplets with diameters much less than 0.1 µm) between 15 and 17 km altitude over Laramie, Wyoming. Particle counts were 400 per cm3 compared to background values of 40 particles per cm3 at that altitude [see 10:12]. This CN event is distinguishable from El Chichón aerosols by both its altitude (El Chichón aerosols are found at 17-19 km) and particle size (El Chichón particles are now larger than 0.1 µm). A subsequent balloon flight on 11 December showed only background CN concentrations at these elevations.
Information Contacts: D. Hofmann and J. Rosen, Univ. of Wyoming; T. DeFoor, MLO; R. Reiter, Garmisch-Partenkirchen, W Germany; W. Fuller, NASA.
December 1985 (SEAN 10:12) Cite this Report
New aerosols over Hawaii, Japan, and Wyoming; unusual haze over Fiji
Lidar instruments in Hawaii and Japan detected new stratospheric aerosol layers that may have been produced by the 13 November eruption of Ruiz volcano, Colombia. Lidar profiles at Mauna Loa, Hawaii showed a distinct new layer centered at 25-25.5 km altitude on 26 and 27 November. That layer was not detected during the next measurement on 3 December, but distinct new upper tropospheric and lower stratospheric material was evident that night, and apparent new layers centered at 18-22 km were present during the rest of December (figures 13 and 15). At Fukuoka, Japan, a relatively strong scattering layer appeared at 16.9 km (0.2 km above the tropopause observed at the Fukuoka Meteorological Observatory, 7 km from the lidar site) on 28 November, but there were two probable cirrus cloud layers at 6-15 km and it was not possible to confirm that the layer was volcanic. The next night, a very thin scattering layer was present at 18.4 km (3 km above the tropopause); the 29 November lidar profile was of a type not observed except after major volcanic eruptions. Layers were observed at about the same altitude during most December lidar measurements at Fukuoka. Lidar at the National Institute for Environmental Studies at Tsukuba, Japan detected an aerosol layer about 1 km thick at 18 km altitude on 11 and 12 December (figure 14). No such layer had been observed through November. The layer became more obscure 13 and 16 December. Another small layer was detected at about 22 km through December, but it was not certain whether it had been present in previous months. Weak layers centered at 25.8 and 24.5 km were detected from Hampton and Wallops Island, Virginia in December.
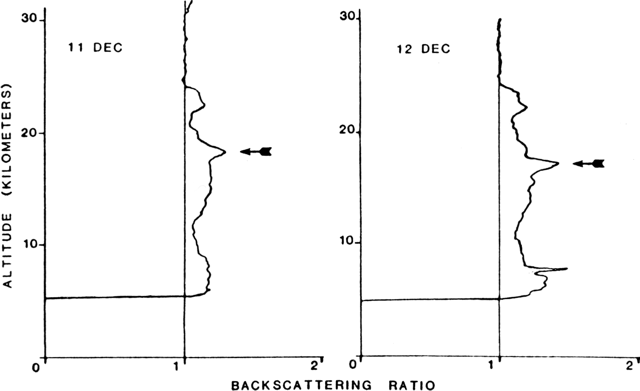 |
Figure 13. New aerosol layer at 18 km altitude (arrow) detected on preliminary lidar profiles from Tsukuba, Japan, 11 and 12 December 1985, one month after the Ruiz eruption. Backscattering ratios are on the x axis, with the solid vertical line representing a ratio of 1, and altitudes are on the y axis. Courtesy of Sachiko Hayashida. |
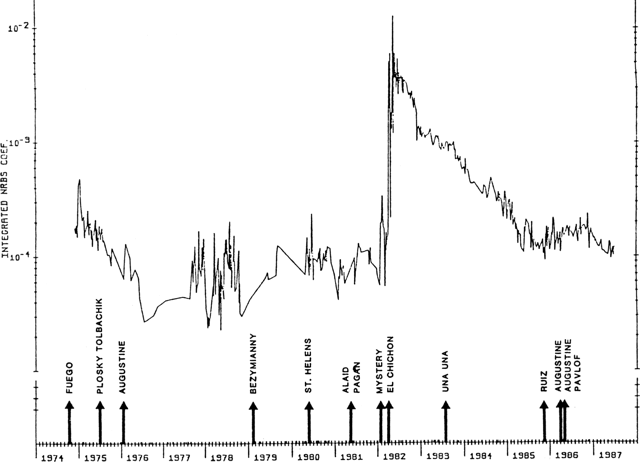 |
Figure 14. Timing of large explosive eruptions, 1974-1986, compared to lidar measurements of stratospheric aerosols over Mauna Loa, hawaii. Non-Rayleigh backscattering coefficients are integrated over the lower stratosphere. Courtesy of Thomas DeFoor and Elmer Robinson. |
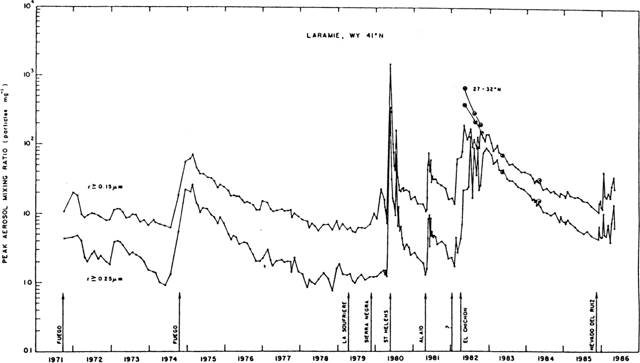 |
Figure 15. Timing of large explosive eruptions, 1971-1985, compared to particle concentrations (per milligram of ambient air) measured during 200 balloon soundings from Laramie, Wyoming and five from southern Texas (circled crosses). Data were collected for two particle sizes (radii 0.25 and 0.15 microns) at the stratospheric maximum (18-22 km altitude). Courtesy of David Hofman. |
The following is from Ram Krishna. "An ususual, heavy haze was observed at Nadi, Fiji (17.78°S, 177.48°E) from 20 through 22 November. The haze significantly reduced the very good visibility normally encountered in this area, and, according to reports by pilots, it extended through the boundary layer to the inversion and was evident for many tens of kilometers across Viti Levu to Vanua Levu. Winds were light throughout the period and meteorological analyses could not provide reliable back trajectories. The appearance, density, and spatial extent of the haze suggest that it was an aerosol formed from volcanic sulfur-containing gas emission not too far upstream. Volcanic activity in Vanuatu has been implicated in previous haze episodes and is a likely explanation for the present episode, but this could not be confirmed. A similarly heavy haze was observed on 21 December, but it did not persist beyond that date."
Four balloon-borne aerosol observations were made over Laramie, Wyoming during December, showing enhanced concentrations of condensation nuclei (CN particles with radii between 0.01 and 0.1 µm) above background, probably from the 13 November eruption of Ruiz (table 2 and figure 15). The strongest enhancement was a 10-fold increase at 15-18 km on 5 December, when smaller increases were also measured at 23 and 28 km altitudes (data in table 2 replace the preliminary 5 December values in 10:11). Only one weak layer was detected on 11 December, but flights on 18 and 31 December showed several zones of enhanced aerosol concentrations. Increased concentrations of optically active aerosols (larger than 0.15 µm) were not present in any of the samplings. Preliminary data from the 10 January flight showed no substantial CN enhancement.
Table 2. Zones of enhanced condensation nuclei concentration detected by balloon-borne instruments over Laramie, Wyoming, 5-31 December. Concentrations are expressed as counts per cm3; normal background concentrations for each altitude are given after the slash. Data courtesy of David Hofmann.
| Date | Altitude (km) | Concentration (/cm3) |
| 05 Dec 1985 | 15-18 | 600/50 |
| 05 Dec 1985 | 23 | 30/7 |
| 05 Dec 1985 | 28 | 10/194 |
| 11 Dec 1985 | 20 | 18/7 |
| 18 Dec 1985 | 12-14 | 70/20 |
| 18 Dec 1985 | 16 | 35/15 |
| 18 Dec 1985 | 18 | 45/8 |
| 31 Dec 1985 | 13-17 | 80/30 |
| 31 Dec 1985 | 19 | 40/10 |
| 31 Dec 1985 | 20 | 15/7 |
| 31 Dec 1985 | 22-25 | 30/7 |
Information Contacts: T. DeFoor, MLO; M. Fujiwara, Kyushu Univ., Japan; S. Hayashida, National Inst. for Environmental Studies, Japan; W. Fuller and M. Osborn, NASA; R. Krishna, Fiji Meteorological Service; D. Hofmann, Univ. of Wyoming.
January 1986 (SEAN 11:01) Cite this Report
Apparent new stratospheric aerosols at high N latitudes
From Tsukuba, Japan (36.2°N, 140.1°E), Sachiko Hayashida reported that the aerosol layer detected at 18 km altitude on 11 and 12 December was probably present on 1 December, but with a scattering ratio of only about 1.3 (figure 16). On 6 January, another aerosol layer was observed at about 22 km altitude. The peak scattering ratio of this layer increased to about 2.8 on 9 and 10 January. Aerosols were concentrated in a layer about 1 km thick. The 14 January profile showed a decrease in peak scattering ratio to about 1.6. At Mauna Loa, Hawaii (19.5°N, 155.6°W), lidar profiles showed an increase in aerosol concentrations through January as the layer centered at about 20 km altitude strengthened (figures 17-19). Only remnants of El Chichón's 1982 eruption cloud were detected by lidar at Garmisch-Partenkirchen, Germany (47.5°N, 11.0°E) through 4 January. The next measurement, on 21 January, showed new layers centered at 18.6 and 21 km altitude. Data on 22 and 26 January continued to show new aerosols, centered at 18 and 17.4 km.
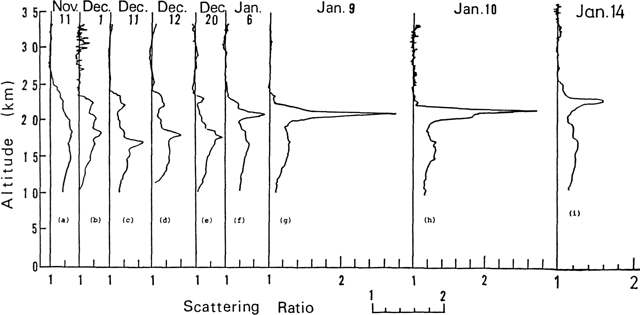 |
Figure 16. Lidar profiles from Tsukuba, Japan (36.2°N, 140.1°E), courtesy or Sachiko Hayashida. Solid vertical lines represent a scattering ratio of 1. Lidar wavelength is 0.53 µm. |
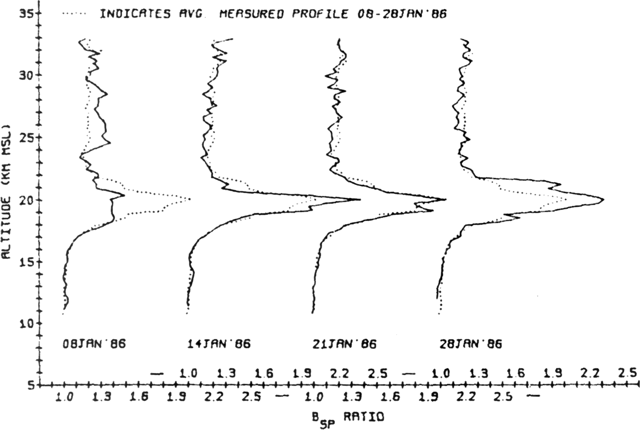 |
Figure 17. Lidar profiles from Mauna Loa, Hawaii (19.5°N, 155.6°W), 8-28 January 1986. The dotted line superimposed on each profile represents the average January data. Courtesy of Thomas DeFoor. |
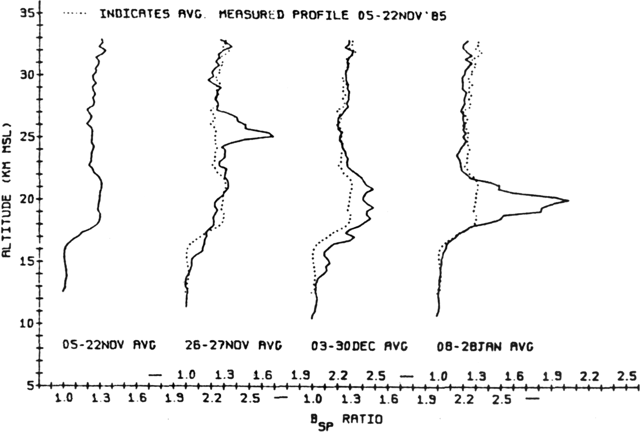 |
Figure 18. Average lidar profiles measured during four periods (5-22 November 1985, 26-27 November 1985, 3-30 December 1985, and 8-28 January 1986) at Mauna Loa, Hawaii. The dotted line superimposed on each profile represents the average 5-22 November 1985 data, just before the arrival of fresh aerosol layers. Courtesy of Thomas DeFoor. |
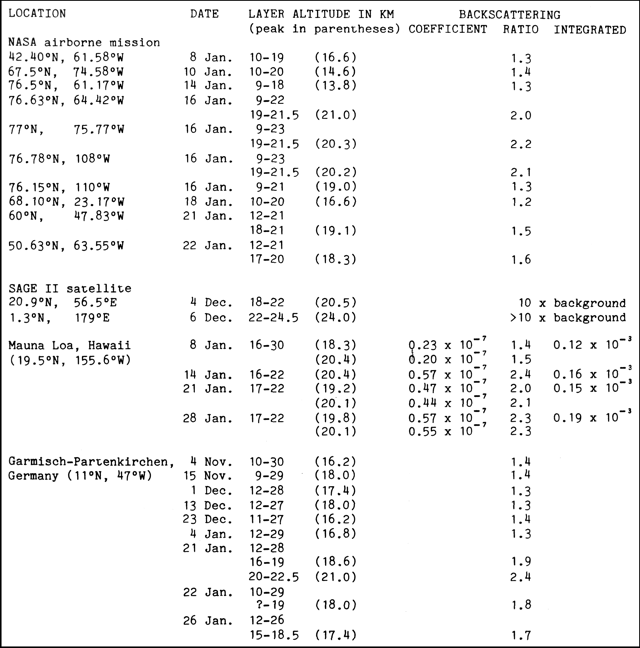 |
Figure 19. Lidar data from various locations, showing altitudes of aerosol layers. Note that some layers have multiple peaks. Backscattering ratios from Fukuoka, Japan, are for the Nd-YAG wavelength of 1.06 µm; from Tsukuba, Japan, for the Nd-YAG wavelength of 0.53 µm; all others are for the ruby wavelength of 0.69 µm. Altitudes of maximum backscattering ratios and coefficients are shown for each layer at Mauna Loa; maxima were at the same altitude on 14 January. Integrated values show total backscatter, expressed in steradians-1, integrated over 300-m intervals from 16-33 km at Mauna Loa and from the tropopause to 30 km at Hampton. |
NASA's SAGE II/SAM II/Polar Stratospheric Cloud mission 7-22 January included airborne lidar measurements from near Hampton, VA to 77°N. Initial data at 42.5°, 67.5°, and 76.5°N (between Hampton and Thule, Greenland) 8-14 January showed relatively low backscattering ratios (figure 20). However, during flights on 16, 21, and 22 January that penetrated the circumpolar vortex wind system, lidar detected strong fresh-looking aerosol layers about 2.5-3 km thick, centered at 18-20 km. Possible sources of the strong layers included the Kliuchevskoi eruption or remnants of the 1982 El Chichón cloud. After exiting the circumpolar vortex at about 76.8°N, 108°W on 16 January, backscattering ratios dropped sharply. NASA's Stratospheric Aerosol and Gas Experiment II (SAGE II) satellite detected aerosol concentrations that were enhanced 10 times or more above background on 4 and 6 December at 20.9°N and 1.3°N.
 |
Figure 20. Lidar data from a NASA airborne mission and the SAGE II satellite, showing altitudes of aerosol layers. Note that some layers have multiple peaks. Backscattering ratios are for the ruby wavelength of 0.69 µm. Integrated values show total backscatter, expressed in steradians-1, integrated over 300-m intervals from the tropopause to 30 km. |
On 18 January, balloon-borne instruments over Laramie, Wyoming (41°N, 105.5°W) detected the first enhancement of optically active aerosols (radius > 0.15 µm) thought to have been produced by the 13 November eruption of Ruiz. A concentration of about 5/cm3 above a background of 1.8/cm3 was measured at 17-19 km (figure 21). No other major stratospheric perturbations have been observed in this component at Laramie since the eruption of El Chichón in 1982. Flights on 10 January and 3 February showed smaller increases in optically active particles.
 |
Figure 21. Aerosols collected by balloons launched from Laramie, WY (41°N, 105.5°W) in late 1985 and early 1986. Left, concentration of optically active aerosols (radius > 0.15 µm); right, concentration of condensation nuclei (radius > 0.01 µm). |
Enhanced concentrations of condensation nuclei (CN, radius > 0.01 µm) were also measured on 18 January between 16 and 19 km altitude, peaking at 100/cm3 as compared to a background of 20-30/cm3. Figure 21 illustrates this increase and includes the profile for 5 December, when the first lower stratospheric CN perturbation was observed over Laramie since the eruption of El Chichón. This CN enhancement is thought to be caused by aerosols from the 13 November eruption of Ruiz, but increases observed at about 25 km altitude on 3 February are interpreted as having been produced by evaporation and recondensation of older aerosols in association with a stratospheric warming event at high northern latitudes.
The following is from Richard Keen. "Enhanced twilights continued to be observed in 1985, but in general the brightness, color intensity, and duration of the twilight phenomena were not as great as in 1984. Salmon or lavender-colored twilights, with peak color intensity at a solar depression angle (SDA) of 4°, were observed on 6 February, 5 and 24 July, 1, 2, 26, 27, & 29 October, and 13 December. The concentration of observations in October may be due to the normal absence of high cirrus clouds over the W United States during the early fall. Horizontal striations were noted in the twilights of 6 February and 13 December.
"A spectacular twilight was seen on 31 December. The bright salmon color peaked at an SDA of 5°, implying a somewhat higher aerosol layer than that responsible for the twilight phenomena earlier in the year. In addition, there were pronounced horizontal striations and banding in the twilight glow. This twilight was similar to those observed in late 1982 and 1983. Enhanced twilights in early January 1986 (on the 7th and 12th) were modest 4° SDA twilights of the type observed earlier in 1985, so the bright 31 December twilight was apparently due to a passing localized aerosol cloud.
"Hemispherically averaged volcanic aerosol optical thicknesses can be derived from observations of the brightness of the moon during total lunar eclipses (Keen, 1983). The 2 lunar eclipses of 1985 (4 May and 28 October) were observable only from the Eastern Hemisphere. Aerosol optical thicknesses have been derived using observations from England, Spain, Austria, South Africa, and Australia for the 1985 eclipses (table 3).
Table 3. Aerosol optical thicknesses derived from observations of lunar eclipses, 1982-85. Data for the 1985 eclipses are from England, Spain, Austria, South Africa, and Australia. The 25 June 1983 observations was for a partial eclipse. Courtesy of Richard Keen.
| Date | Hemisphere | Optical Depth |
| 30 Dec 1982 | N | 0.12 |
| 25 Jun 1983 | S | 0.03 |
| 05 May 1985 | N | 0.04 |
| 28 Oct 1985 | S | 0.00 |
The uncertainty of the derived optical thicknesses is ± 0.02. These observations indicate that the Northern Hemisphere volcanic aerosols from El Chichón decayed to 1/3 of their peak values between 1982 and 1985; the calculated e-folding decay time is 2.1 years. The Southern Hemisphere aerosol layer, which in 1983 was apparently only 1/4 as thick as the Northern Hemisphere layer, had decayed to undetectability by 1985."
Edward Brooks observed unusual sunrises and sunsets from Trinidad, Florida, and Massachusetts. On 31 December, the sunset was a vivid pink to dark purple at Key West, Florida (24.57°N, 81.60°W). At Port of Spain, Trinidad (10.63°N, 61.52°W), the 12 January evening sky was a brilliant orange to red with a dark blue crepuscular ray for about 30 minutes after sunset (solar depression angle about 15°). On 20 January, the sunset was brightly colored at Jacksonville, Florida (30.33°N, 81.67°W). Two days later at Boca Raton, Florida (26.37°N, 80.08°W), sunrise was strongly pink and sunset was also a brilliant pink with multiple dark and light crepuscular rays. Pink crepuscular rays were associatated with the 5 February sunset at Newton, Massachusetts (42.33°N, 71.22°W), and the sky remained bright red for about 30 minutes after sunset (solar depression angle about 10°; note differing SDA rates at low and mid-latitudes).
Reference. Keen, R.A., 1983, Volcanic Aerosols and Lunar Eclipses; Science, v. 222, p. 1011-1013.
Information Contacts: William Fuller, NASA Langley Research Center, Hampton, VA 23665 USA; Sachiko Hayashida, National Institute for Environmental Studies, Yatabe-machi, Tsukuba, Ibaraki 305, Japan; Thomas DeFoor, Mauna Loa Observatory, P.O. Box 275, Hilo, HI 96720 USA; D.J. Hofmann and J.M. Rosen, Department of Physics and Astronomy, University of Wyoming, Laramie, WY 82071 USA; H. Jäger, Fraunhofer-Institut fur Atmospharische Umweltforschung, Kreuzeckbahnstrasse 19, D-8l00 Garmisch-Partenkirchen, West Germany; Richard Keen, CIRES, Campus Box 449, University of Colorado, Boulder, CO 80309 USA; Edward M. Brooks, Department of Geology and Geophysics, Boston College, Chestnut Hill, MA 02167 USA.
February 1986 (SEAN 11:02) Cite this Report
Stratospheric aerosols persist
Lidar data from Mauna Loa, Hawaii on 5 February showed continued development of the aerosol layer centered at about 20 km (figure 22). The entire profile was depressed on the 12th, but a week later the 20 km layer had strengthened and backscattering was slightly enhanced above 25 km. By 28 February, the higher layer had become prominent, the first significant enhancements detected at that altitude over Mauna Loa since 26-27 November (probably from Ruiz). From Hampton, VA (37.1°N, 76.3°W), lidar data on 14 February showed a layer centered around 20 km that was at a similar altitude but weaker than layers observed in Japan in January. Lidar profiles from the segments of the NASA airborne mission W of Thule, Greenland (about 77.5°N, 69.5°W) were similar to profiles from Tsukuba, Japan, 9-10 January.
 |
Figure 22. Lidar profiles from Mauna Loa, Hawaii, 5-28 February 1986. The dotted line superimposed on each profile represents the average data 5-22 November, before the arrival of new aerosols over Hawaii. Courtesy of Thomas DeFoor. |
Balloon flights over Laramie, WY on 3 and 22 February detected no layers of optically active areosols (radius > 0.15 µm) or condensation nuclei (CN, radius > 0.01 µm) that could be associated with recent volcanic activity. An increase in CN at 25 km on 3 February was attributed to evaporation and recondensation of older aerosols, rather than a new volcanic event.
From Millville, New Jersey (39.4°N, 74.9°W), Fred Schaaf observed an unusual sunrise on 11 January. Glow reached 15° altitude at 0702 and visible NE-SW horizontal striations seemed to be at higher altitudes than normal weather clouds. The intensity of the effects were similar to those observed after the 1980 St. Helens eruption, but much weaker than those that followed the eruption of El Chichón in 1982.
Information Contacts: Thomas DeFoor, Mauna Loa Observatory, P.O. Box 275, Hilo, HI 96720 USA; William Fuller, NASA Langley Research Center, Hampton, VA 23665 USA; J.M. Rosen and D.J. Hofmann, Department of Physics and Astronomy, University of Wyoming, Laramie, WY 82071 USA; Fred Schaaf, R. D. 2, Box 248, Millville, New Jersey 08332 USA.
March 1986 (SEAN 11:03) Cite this Report
New stratospheric aerosols
On 18-19 January, lidar operated by the University of Bonn at the Andoya Rocket Range, Norway (69.28°N, 16.02°E) detected strong layers to 24.5 km that were not present during their previous observation on 30-31 December. Stratospheric aerosols were less conspicuous the next night and little aerosol material was evident the nights of 20-21 and 21-22 January, and the morning of 1 February. Strong layers to almost 26 km were observed again the night of 2-3 February. Lidar data from Garmisch-Partenkirchen, Germany showed no apparent new aerosols until 4 January, when a layer was detected at 26.4 km. Backscattering ratios were largest 21, 22, and 26 January for layers centered from 17.4-21 km, but enhanced values at similar altitudes continued to be observed through February including a 24-km layer on the 22nd. The source of these high-latitude aerosols was uncertain, but may have included material from both the 13 November 1985 eruption of Ruiz, Colombia and vigorous late-l985 explosive activity from Kliuchevskoi Volcano, Kamchatka. Aerosols had also been detected in January at high northern latitudes by a NASA airborne mission.
At lower latitudes, new stratospheric aerosols have been present since shortly after the Ruiz eruption. At Mauna Loa, Hawaii lidar data showed a series of small sharp peaks between 16.5 and 26 km on 5 March (figure 23). The layer centered at about 20 km altitude strengthened later in the month, dominating the profile 20 and 28 March. A layer at about 23 km, not evident on 12 March, was seen on 20 and 28 March, and a broad zone of enhanced backscattering at 28-35 km was present on 28 March. From Fukuoka, Japan (33.65°N, 130.35°E), lidar continued to detect a layer centered at 18.4 km altitude on several nights in March, as during much of December. A very sharp peak, measured at 22 km on 11 March, was weaker but still present on 24 March, and sharp peaks were found at 21.4 and 25.1 km during the next observation on 31 March.
 |
Figure 23. Lidar data from various locations, showing altitudes of aerosol layers. Note that some layers have multiple peaks. Backscattering ratios from Fukuoka, Japan, are for the Nd-YAG wavelength of 1.06 µm; all others are for the ruby wavelength of 0.69 µm. Integrated values show total backscatter, expressed in steradians-1, integrated over 300-m intervals from 16-33 km at Mauna Loa and from the tropopause to 30 km at Hampton. Altitudes of maximum backscattering ratios and coefficients are shown for each layer at Mauna Loa; maxima were at the same altitudes on 12, 20, and 28 March. The 23 December-26 January data from Garmisch-Partenkirchen and the 5 March data from Hampton replace previously published preliminary values. |
Robert Malmström reported that sunsets at La Palma, Canary Is. (28.75°N, 17.88°W) appeared similar to one another 9-21 January, but the sky was distinctly more pink on the 23rd (about 1945 GMT) and 24th. On 30 January there was a very strong pink glow, again at about 1945 GMT, that was reminiscent of sunsets seen after the El Chichón eruption.
Information Contacts: H. Jäger, Fraunhofer-Institut für Atmosphärische Umweltforschung, Kreuzeckbahnstrasse 19, D-8100 Garmisch-Partenkirchen, West Germany; U. von Zahn, Physikalisches Institut, Universität Bonn, Nussallee 12, 5300 Bonn 1, West Germany; Thomas DeFoor, Mauna Loa Observatory, P.O. Box 275, Hilo, HI 96720 USA; William Fuller, NASA Langley Research Center, Hampton, VA 23665 USA; Motowo Fujiwara, Physics Department, Kyushu University Fukuoka 812, Japan; Robert Malmström, Gaildorferstrasse 27, D-7000 Stuttgart 50, West Germany.
April 1986 (SEAN 11:04) Cite this Report
Ruiz aerosols persist, but no Augustine material evident
Lidar instruments in Germany, Virginia, and Hawaii continued to detect stratospheric aerosols that were probably from the 13 November 1985 eruption of Ruiz. No new layers from the late March explosive activity of Augustine were apparent as of late April. At Mauna Loa, Hawaii, lidar continued to detect a strong layer at about 21 km altitude, accompanied by a weaker layer at about 27 km on 1 and 22 April (figure 24). High-altitude layers had previously been observed at Mauna Loa two weeks after the Ruiz eruption and in late February. April backscattering ratios at Garmisch-Partenkirchen, West Germany were similar to those of late February. At Hampton, VA, stratospheric layers were centered at about 19-20 km altitude. Enhanced backscattering, perhaps from large forest fires in the eastern United States, continued down into the troposphere.
 |
Figure 24. Lidar data from various locations, showing altitudes of aerosol layers. Note that some layers have multiple peaks. Backscattering ratios are for the ruby wavelength of 0.69 µm. Integrated values show total backscatter, expressed in steradians-1, integrated over 300-m intervals from 16-33 km at Mauna Loa and from the tropopause to 30 km at Hampton. Altitudes of maximum backscattering ratios and coefficients are shown for each layer at Mauna Loa. |
Further Reference. DeFoor, T., and Robinson, E., 1987, Stratospheric Lidar Profiles from Mauna Loa Observatory, Winter 1985-1986: GRL, v. 14, p. 618-621.
Information Contacts: Thomas DeFoor, Mauna Loa Observatory, P.O. Box 275, Hilo, HI 96720 USA; William Fuller, NASA Langley Research Center, Hampton, VA 23665 USA; H. Jäger, Fraunhofer-Institut fur Atmosphärische Umweltforschung, Kreuzeckbahnstrasse 19, D-8l00 Garmisch-Partenkirchen, West Germany.
May 1986 (SEAN 11:05) Cite this Report
Ruiz aerosols persist; balloon data since 1971
Balloon soundings from Laramie, WY on 19 May showed maximum particle concentrations of about 2.8/cm, (radius > 0.15 µm) at about 20 km altitude. Figure 25 plots 1971-86 balloon data, showing perturbations associated with major eruptions.
 |
Figure 25. Aerosol mixing ratios (particles/mg ambient air) versus time at the stratospheric maximum (18-22 km) for r > 0.25 µm and r > 0.15 µm during 200 balloon soundings at Laramie, WY and 5 in S Texas (circled crosses). The times of major volcanic eruptions believed to have perturbed the stratosphere at Laramie are indicated by arrows. |
Lidar instruments in Virginia, Hawaii, Japan, and Germany continued to detect stratospheric aerosol layers thought to be from the 13 November 1985 eruption of Ruiz. At Mauna Loa, Hawaii, backscattering ratios of the sharp layer centered at 20.5-21 km diminished through May, while backscattering was enhanced at higher altitudes (figure 26). Higher altitude material had first been detected over Hampton, VA on 29 April, and peak backscattering ratios were at 20.5-21.5 km in early June, up from 19-20 km in early May. The lower layer appeared to be weakening and did not form a distinct peak. At Fukuoka, Japan, lidar continued to measure 2-3 layers in April and May, generally centered at altitudes of about 19 and 21-23 km, similar to March observations. From Garmisch-Partenkirchen, Germany, peak May backscattering ratios were similar to those of April, but altitudes increased slightly.
 |
Figure 26. Lidar data from various locations, showing altitudes of aerosol layers. Note that some layers have multiple peaks. Backscattering ratios from Fukuoka, Japan, are for the Nd-YAG wavelength of 1.06 µm; all others are for the ruby wavelength of 0.69 µm. Integrated values show total backscatter, expressed in steradians-1, integrated over 300-m intervals from 16-33 km at Mauna Loa and from the tropopause to 30 km at Hampton. Altitudes of maximum backscattering ratios and coefficients are shown for each layer at Mauna Loa. Mauna Loa backscattering values were truncated at 23 km on 8 May because of instrument problems. The 5 May data from Hampton replace previously published preliminary values. |
Information Contacts: David Hofmann and James Rosen, Department of Physics and Astronomy, University of Wyoming, Laramie, WY 82071 USA; Motowo Fujiwara, Physics Department, Kyushu University, Fukuoka 812, Japan; Thomas DeFoor, Mauna Loa Observatory, P.O Box 275, Hilo, HI 96720 USA; H. Jäger, Fraunhofer-Institut für Atmosphärische Umweltforschung, Kreuzeckbahnstrasse 19, D-8100 Garmisch-Partenkirchen, West Germany; William Fuller, NASA Langley Research Center, Hampton, VA 23665 USA.
June 1986 (SEAN 11:06) Cite this Report
Ruiz aerosols persist; 1985-86 lidar data summarized
Lidar profiles at Mauna Loa, Hawaii varied substantially in June (figure 27). No trends were obvious but the increased integrated stratospheric backscattering coefficient observed since May persisted, apparently due to increased aerosols above about 21 km.
 |
Figure 27. Lidar data from Hawaii and Virginia, showing altitudes of aerosol layers. Note that some layers have multiple peaks. Backscattering ratios are for the ruby wavelength of 0.69 µm. Integrated values show total backscatter, expressed in steradians-1, integrated over 300-m intervals from 16-33 km at Mauna Loa and from the tropopause to 30 km at Hampton. Altitudes of maximum backscattering ratios and coefficients are shown for each layer at Mauna Loa. The 9 June data from Hampton replace previously published preliminary values. |
Thomas DeFoor reports that "Figure 28 shows the trend in integrated non-Rayleigh backscattering coefficient between January 1985 and June 1986. Integrated aerosol scattering reached its lowest value since before the "Mystery Cloud" (20 January 1982 = 0.6 x 10⁻⁴ sr-1) on 23 May 1985 (1.0 x 10⁻⁴) as the remnant of the El Chichón aerosol continued to decline toward the 'non-volcanic' background of 0.4 x 10⁻⁴ sr-1. However, this trend was abruptly interrupted with an increase beginning 30 May 1985. This increase and the subsequent declining trend through 22 November 1985 is judged to have been the result of an unknown 1985 eruption. Evidence strongly suggests that this injection was at least several months old at first detection and probably had a Southern Hemisphere source, as it was apparently not detected by other Northern Hemisphere lidar stations. The increased backscatter first observed 26 November 1985 was probably the result of the 13 November Ruiz eruption. The variable backscatter values that followed for the next few months are not surprising. However, the apparent increasing trend between February and June 1986 is peculiar, especially since there is no obvious evidence of post-Ruiz aerosol sources in any of the Mauna Loa lidar profiles to date."
 |
Figure 28. Integrated non-Rayleigh backscatter coefficient between 16 and 33 km at Mauna Loa, Hawaii, 15 January 1985-24 June 1986. The decline of El Chichón aerosols toward background January-May 1985 was interrupted by the 30 May arrival of aerosols from an unknown source, perhaps originating in the Southern Hemisphere several months earlier. Aerosols from Ruiz appeared in late November 1985 and a gradual increase again from an unknown source, was detected February-June, 1986. Courtesy or Thomas DeFoor. |
At Hampton, VA, peak backscattering ratios have declined slightly since late April but integrated backscattering has generally increased. An unusually high tropopause on 9 June depressed integrated values but the remaining profile was similar in shape to others during the month. Lidar data from Firenze, Italy (43.78°N, 11.25°E) indicated a very small aerosol layer at about 20 km, with a scattering ratio (at 0.53 µm wavelength) of about 1.2-1.3.
Richard Keen observed the 24 April lunar eclipse from Auckland, New Zealand. Visual magnitude of the moon at mid-eclipse was -2.0, very close to the theoretical brightness for this eclipse, yielding a derived volcanic aerosol optical thickness of 0.00 ± 0.02. Because the moon passed through the southern part of the earth's shadow, this value is representative of the Southern Hemisphere stratosphere. The 28 October 1985 Southern Hemisphere lunar eclipse also yielded an unmeasureable volcanic aerosol optical thickness, suggesting that there had been no significant recent injections of stratospheric aerosols from Southern Hemisphere volcanoes. Stratospheric aerosols from an early 1985 Southern Hemisphere eruption suggested above by DeFoor were below the eclipse detection threshold.
Information Contacts: Thomas DeFoor, Mauna Loa Observatory, P.O. Box 275, Hilo, HI 96720 USA; William Fuller, NASA Langley Research Center, Hampton, VA 23665 USA; Leopoldo Stefanutti, Istituto di Ricerca sulle Onde Elettromagnetiche, CNR, Via Panciatichi 64, 50127 Firenze, Italy; Richard Keen, CIRES, Campus Box 449, University of Colorado, Boulder, CO 80309 USA.
July 1986 (SEAN 11:07) Cite this Report
Ruiz stratospheric aerosols persist
A NASA airborne lidar mission, supporting correlative measurements with the SAGE II satellite, was flown on the NASA-Wallops P-3 aircraft on 29 and 31 July from Peterson AFB, Colorado Springs. Data collected 29 July over Laramie, WY and SE Utah, and on 31 July over Laramie were similar (figure 29). Other correlative measurements supporting the experiment were in-situ balloon-borne aerosol sampling, H2O vapor, O3, balloon-borne NO2, sun photometer, and high-altitude sampling from a NASA U-2 aircraft. Balloon data over Laramie showed peak concentrations of 1.5 particles (radius > 0.15 µm) per cm3 at 19-20 km altitude.
 |
Figure 29. Airborne lidar data collected from Laramie, WY and SE Utah in support of SAGE II satellite observations, Germany, and Hawaii, showing altitudes of aerosol layers. Backscattering ratios are for the ruby wavelength of 0.69 µm. The integrated value shows total backscatter, expressed in steradians, integrated over 300-m intervals from the 16-33 km at Mauna Loa. Altitudes of maximum backscattering ratios and coefficients are shown for each layer at Mauna Loa. |
Lidar profiles from Mauna Loa, Hawaii showed broader layers in early July than in June, suggesting vertical dispersal of Ruiz aerosols, but a sharper layer was detected on 28 July. Total backscatter was about the same as in June. At Garmisch-Partenkirchen, Germany, altitudes and peak backscattering ratios in June were similar to those in May.
Information Contacts: William Fuller, NASA Langley Research Center, Hampton, VA 23665 USA; Thomas DeFoor, Mauna Loa Observatory, P.O. Box 275, Hilo, HI 96720 USA; H. Jäger, Fraunhofer-Institut für Atmosphärische Umweltforschung, Kreuzeckbahnstrasse 19, D-8l00 Garmisch-Partenkirchen, West Germany; James Rosen, Department of Physics and Astronomy, University of Wyoming, Laramie, WY 82071 USA.
August 1986 (SEAN 11:08) Cite this Report
Ruiz aerosol layer broader and less intense
Stratospheric aerosols from from the November 1985 eruption of Ruiz persisted through over Mauna Loa, Hawaii. The zone of enhanced lidar backscattering was distinctly broader and less intense than it had been several months earlier (figure 30). However, total backscatter has remained relatively stable since the arrival of Ruiz aerosols over Mauna Loa in late November. At Hampton, VA, peak backscattering remained at about the same altitude as in June, but total backscatter had declined since late June.
 |
Figure 30. Average monthly lidar profiles at Mauna Loa, Hawaii, March-August, 1986. The dotted line superimposed on each profile represents the average 5-22 November 1985 data, before the arrival of Ruiz aerosols. |
Information Contacts: Thomas DeFoor, Mauna Loa Observatory, P.O. Box 275, NllO, Hawaii 96720 USA; William Fuller, NASA Langley Research Center, Hampton, VA 23665 USA.
September 1986 (SEAN 11:09) Cite this Report
New aerosol layers seen over Alaska
From Fairbanks, Alaska (64.83°N, 147.83°W) Glenn Shaw observed optical phenomena that may have been produced by volcanic aerosols. On 6 October at about 1600 local time, a thin striated filamentous layer with considerable wave structure, similar to subvisible cirrus, could be seen in the SW sky. The sun, at 6° altitude, turned blood red when it passed behind the layer. Altitude of the layer could not be precisely determined, but the summits of 5000-m mountains S of Fairbanks were clearly visible beneath it. At twilight, cloudiness partially obscured illumination of the layer, but strong colors did not appear, suggesting that the material was not stratospheric. Similar aerosols were visible on 8 October. Optical effects of layers of dust from Asian deserts (usually in the spring), and probable industrial air pollution from Siberia ("Arctic haze"; usually in the winter) are distinctly different from those observed on 6 and 8 October. No eruption clouds were evident in an initial inspection of 4-6 October Japanese GMS imagery, and no large explosive eruptions have been reported at high northern latitudes.
About a month earlier (on 9 September), Fred Schaaf observed ultra-cirris clouds from Millville, New Jersey (39.4°N, 74.9°W) for the first time since December. They were brightly illuminated at a solar depression angle of 4-5°, and oriented parallel to the western horizon. At 1942, striations were still visible up to 6°, although purple illumination was almost gone, indicating an altitude of roughly 16 km for their tops.
Lidar from Hawaii, Japan, Virginia, and Germany continued to detect stratospheric aerosols from the November 1985 eruption of Ruiz, but showed no evidence of new aerosol layers. Data from Mauna Loa, Hawaii were similar in August and September. However, in mid to late Septemver, the broad stratospheric layer typically had a pair of peaks instead of the single maximum backscattering value that had characterized previous months (figure 31). At Fukuoka, Japan, peak backscattering increased slightly from early August through late September, but the height of the peak values remained similar. The altitude of the strongest layer over Garmisch-Partenkirchen, Germany dropped from about 20 km in July and August to 16-17 km on 5 and 22 September, but returned to about 20 km on 30 September; scattering ratios remained approximately stable. The 16 September measurement at Hampton, VA yielded data very similar to August values.
 |
Figure 31. Lidar data from various locations, showing altitudes of aerosol layers. Note that some layers have multiple peaks. Backscattering ratios from Fukouka, Japan, are for the Nd-YAG wavelength of 1.06 µm; all others are for the ruby wavelength of 0.69 µm. Integrated values show total backscatter, expressed in steradians-1, integrated over 300-m intervals from the tropopause to 30 km at Hampton. Altitudes of maximum backscattering ratios and coefficients are shown for each layer at Mauna Loa. |
Information Contacts: Glenn Shaw and Juergen Kienle, Geophysical Institute, University of Alaska, Fairbanks, AK 99775 USA; Will Gould, NOAA/NESDIS, Room 100, World Weather Bldg,, Washington, DC 20233 USA; Thomas DeFoor, Mauna Loa Observatory, P.O. Box 275, Hilo, HI 96720 USA; Motowo Fujiwara, Physics Department, Kyushu University, Fukuoka 812, Japan; H. Jäger, Fraunhofer-Institut für Atmosphärische Umweltforschung, Kreuzeckbahnstrasse 19, D-8100 Garmisch-Partenkirchen, West Germany; William Fuller, NASA Langley Research Center, Hampton, VA 23665 USA; Fred Schaaf, 706 E St., Millville, New Jersey 08332 USA.
October 1986 (SEAN 11:10) Cite this Report
New stratospheric aerosols over Europe, Japan, and USA; 24 September Etna eruption possible source
Lidar in Italy, Germany, Japan, and the USA detected the arrival of new stratospheric aerosols between 29 September and 5 November (figure 32), but their source remains uncertain. The 24 September eruption of Mt. Etna produced substantial tephra falls, but ground observers estimated that the eruption column reached a maximum altitude of only 10-13 km. No other strong explosive eruptions have been reported in recent months.
 |
Figure 32. Lidar data from various locations, showing altitudes of aerosol layers. Note that some layers have multiple peaks. Backscattering ratios from Fukouka, Japan, are for the Nd-YAG wavelength of 1.06 µm; from Oshkosh, Wisconsin, for the Nd-YAG wavelength of 0.53 µm; all others are for the ruby wavelength of 0.69 µm. Integrated values show total backscatter, expressed in steradians-1, integrated over 300-m intervals from 16-33 km at Mauna Loa and from the tropopause to 30 km at Hampton. Altitudes of maximum backscattering ratios and coefficients are shown for each layer at Mauna Loa. |
From Fukuoka, Japan, a sharp new peak in the lidar profile at 19.9 km altitude, accompanied by a general background increase in stratospheric aerosols, was first detected 29 September. The new peak was less distinct during the next observation, on 2 October, but the increase in total backscatter was substantial, especially at altitudes below the peak. On 6 October, a secondary peak was detected at 23 km, associated with a substantial increase in backscattering at 22-26 km. No observations were made 7-29 October, but data 30 October and 1-2 November continued to show substantially enhanced total backscatter.
Lidar in Garmisch-Partenkirchen, Germany showed a peak on 24 October from an apparently fresh layer that was probably not thicker than 500-1000 m. During initial observations (1807-1821 local time; = GMT + 1 hour), the peak was seen at 19.2 km altitude; later (1822-1845) at 19.8 km. Scattering ratios of the individual peaks were about 1.6.
At Firenze, Italy, lidar measurements resumed on 5 November, when a distinct new aerosol layer was observed from 15.5 to at least 18 km altitude. Data were noisy above 20 km, but a second peak was noted at 20.2 km and possible enhancement continued to 23 km.
At Hampton, VA, a new layer at 18.5-22 km was first seen on 16 October, 1 month after the previous observation. The layer remained evident on 20 October, but by the 28th had merged with remnants of the November 1985 Ruiz aerosols. Data collected at Oshkosh, Wisconsin (44°N, 88.5°W) on 11 October did not appear to show new aerosols. Data from Mauna Loa, Hawaii seemed to show an increase in total backscatter, but no fresh aerosol layers were evident.
Particle sampling data from balloons launched near Laramie, WY showed a new layer of condensation nuclei (CN), too small to be detected by lidar, on 5 September. CN concentrations were about 100 x normal background values in a zone about 0.75 km thick. By 1 October, the layer had broadened to 2 km (22-24 km altitude) but concentrations had decreased to about 5 x background. In early September, particle sizes were an order of magnitude smaller than normal for that altitude, but were somewhat larger by the beginning of October. Balloon launches from Laramie will resume in December.
Information Contacts: Motowo Fujiwara, Physics Department, Kyushu University, Fukuoka 812, Japan; Leopoldo Stefanutti, Istituto di Ricerca sulle onde Elettromagnetiche, CNR, Via Panciatichi 64, 50127 Firenze, Italy; H. Jäger, Fraunhofer-Institut für Atmosphärische Umweltforschung, Kreuzeckbahnstrasse 19, D-8100 Garmisch-Partenkirchen, West Germany; William Fuller, NASA Langley Research Center, Hampton, VA 23665 USA; Thomas DeFoor, Mauna Loa Observatory, P.O. Box 275, Hilo, HI 96720 USA; James Rosen, Department of Physics and Astronomy, University of Wyoming, Laramie, WY 82071 USA.
November 1986 (SEAN 11:11) Cite this Report
Enhanced aerosols persist; perhaps brought from tropics by seasonal winds
Lidar stations continued to detect increased stratospheric aerosols in November (figure 33). At Mauna Loa, Hawaii, a substantial increase in both peak and total backscatter was measured 18 November and numerous tiny sharp peaks were evident on initial data. From Fukuoka, Japan, very sharp peaks were recorded between 20.5 and 22 km altitude on 10, 17, and 21 November. Lidar at Hampton, VA detected both increased total backscatter and the presence of new higher-latitude layers in late November and early December. A thin layer at 21 km altitude was measured from Garmisch-Partenkirchen, Germany on 7 November, slightly higher than another new layer that had been observed on 24 October.
 |
Figure 33. Lidar data from various locations, showing altitudes of aerosol layers. Note that some layers have multiple peaks. Backscattering ratios from Fukouka, Japan, are for the Nd-YAG wavelength of 1.06 µm; all others are for the ruby wavelength of 0.69 µm. Integrated values show total backscatter, expressed in steradians-1, integrated over 300-m intervals from 16-33 km at Mauna Loa and from the tropopause to 30 km at Hampton. Altitudes of maximum backscattering ratios and coefficients are shown for each layer at Mauna Loa. Layers from Fukuoka, Japan, marked with an asterisk have very sharp peaks. |
No eruption columns are known to have penetrated the stratosphere since the November 1985 eruption of Ruiz, although a brief strong explosive eruption occurred at Etna on 24 September, shortly before the initial appearance of increased aerosols. M. P. McCormick suggested the following interpretation for the observations.
"At certain times of the year, SAGE and SAGE II satellite observations show layers at altitudes well above the 'normal' stratospheric aerosol peak for that particular latitude. A clear seasonal cycle has become evident in both hemispheres, showing low-latitude type layers outside the equatorial belt in late fall and winter periods, with very few cases observed in summer (figure 34). The most obvious explanation for this 'extra' layer is that we are observing transport of low-latitude aerosols into the winter hemisphere by planetary wave activity, which is greater in the winter hemisphere. Care must be given, therefore, to interpreting local measurements by lidar or made in situ which show this type of layer as possibly due to a new volcanic eruption."
 |
Figure 34. Extinction ratio (aerosol plus molecular extinction divided by molecular extinction) plotted as a function of altitude for two SAGE II observations taken on the same day at different longitudes. The B profile shows a secondary peak at about 27 km, well above the 'normal' peak for this latitude. Presented by G. S. Kent at the Sixth Conference on Atmospheric Radiation, Williamsburg, VA, May 12-16, 1986. |
Information Contacts: M.P. McCormick and William Fuller, NASA Langley Research Center, Hampton, VA 23665 USA; Thomas DeFoor, Mauna Loa Observatory, P.O. Box 275, Hilo, HI 96720 USA; Motowo Fujiwara, Physics Department, Kyushu University, Fukuoka 812, Japan; H. Jäger, Fraunhofer-Institut für Atmosphärische Umweltforschung, Kreuzeckbahnstrasse 19, D-8100 Garmisch-Partenkirchen, West Germany.
December 1986 (SEAN 11:12) Cite this Report
Continued fluctuations in stratospheric aerosols
From Mauna Loa, Hawaii, lidar data on 2 December showed a sharp decline in aerosols between 21 and 25 km altitudes (figure 35), the zone where increased concentrations were observed in November. Data later in December showed aerosols returning to that altitude range.
 |
Figure 35. Lidar data from Hawaii and Virginia, showing altitudes of aerosol layers. Note that some layers have multiple peaks. Backscattering ratios are for the ruby wavelength of 0.69 µm. Integrated values show total backscatter, expressed in steradians-1, integrated over 300-m intervals from 16-33 km at Mauna Loa and from the tropopause to 30 km at Hampton. Because of probable cirrus layers at 14-17 km on 30 December at Mauna Loa and 11.1-12.8 km on 22 December at Hampton, data are integrated from 17.1 and 13 km, respectively. If different, altitudes of maximum backscattering ratios and coefficients are shown for each layer at Mauna Loa. |
On 30 December, NE-SW bands of clouds about 500 km long and 250 km apart were seen in the vicinity of Hawaii on infrared weather satellite imagery. Cloud altitudes could not be determined from the satellite data. They looked like gravity waves in cirrus, and may have caused the very sharp peak detected by lidar that night between 14 and 17 km (tropopause altitude was 16.5 km). Lidar profiles from Hampton, VA in late December and early January were similar to the 4 December data, unlike the complex layers observed in November.
Information Contacts: Thomas DeFoor, Mauna Loa Observatory, P.O. Box 275, Hilo, HI 96720 USA; William Fuller, NASA Langley Research Center, Hampton, VA 23665 USA.
January 1987 (SEAN 12:01) Cite this Report
4.5 years of lidar data summarized
Lidar data from Mauna Loa, Hawaii continued to show remnants of the broad aerosol layer seen 18 November and 12 and 16 December between 20 and 25 km altitude (figure 36). Only the upper portion of the layer was detected 6 and 20 January and only the lower portion on the 16th, suggesting the layer was breaking up into different atmospheric circulation regimes. From Fukuoka, Japan, some higher altitude peaks continued to be detected through early January, but peak values were declining later in the month. Data from Garmisch-Partenkirchen, Germany showed that peak backscattering ratios increased slightly from early December through late January, while peak altitudes declined gradually.
 |
Figure 36. Lidar data from various locations, showing altitudes of aerosol layers. Note that some layers have multiple peaks. Backscattering ratios from Fukouka, Japan, are for the Nd-YAG wavelength of 1.06 µm; all others are for the ruby wavelength of 0.69 µm. Integrated values show total backscatter, expressed in steradians-1, integrated over 300-m intervals from 16-33 km at Mauna Loa and from the tropopause to 30 km at Hampton. Altitudes of maximum backscattering ratios and coefficients are shown for each layer at Mauna Loa. |
Peak backscattering ratios measured at four lidar observation sites since the March/April 1982 eruption of El Chichón showed that values at sites nearer the equator remained substantially stronger through late 1982, as aerosols gradually migrated to higher latitudes. A generally consistent decline then continued until the November 1985 Ruiz eruption. Data remained scattered through late 1986, with no obvious trends.
Information Contacts: Thomas DeFoor, Mauna Loa Observatory, P.O. Box 275, Hilo, HI 96720 USA; M.P. McCormick and William Fuller, NASA Langley Research Center, Hampton, VA 23665 USA; Motowo Fujiwara, Physics Department, Kyushu University, Fukuoka 812, Japan; H. Jäger, Fraunhofer-Institut für Amosphärische Umweltforschung, Kreuzeckbahnstrasse 19, D-8100 Garmisch-Partenkirchen, West Germany.
February 1987 (SEAN 12:02) Cite this Report
Aerosols weaken slowly; 1985-86 Hawaii data
Lidar observations from Hampton, VA continued to show a second aerosol layer above 23 km altitude through late February, but it was thinner by the 25th, and appeared to be absent the first week in March. Aerosols over Mauna Loa, Hawaii were weaker in February than in January, with most of the decline in the lower stratosphere (figure 38).
 |
Figure 37. Lidar data from Hawaii and Virginia, showing altitudes of aerosol layers. Note that some layers have multiple peaks. Backscattering ratios are for the ruby wavelength of 0.69 µm. Integrated values show total backscatter, expressed in steradians-1, integrated over 300-m intervals from 16-33 km at Mauna Loa and from the tropopause to 30 km at Hampton. Altitudes of maximum backscattering ratios and coefficients are shown for each layer at Mauna Loa. Note that the backscattering ratio for the 10 February measurement at Hampton has been revised from the previously reported value. An unusually low tropopause (8 km) over Hampton on 12 February resulted in an increased integrated value that night. |
 |
Figure 38. Average monthly lidar profiles from Mauna Loa, Hawaii. September 1986-February 1987. The dotted line superimposed on each profile represents the average 5-22 November data, before the arrival of the Ruiz aerosols. |
January 1985-December 1986 integrated backscatter data from Mauna Loa shows decay of the El Chichón aerosol through May 1985, when a sudden increase was detected from an unknown source, then a decline until the appearance of Ruiz material in November 1985. Data have been irregular since then, but 1986 has shown a slight increase in mean integrated backscatter, despite the absence of any known injection of volcanic aerosols into the stratosphere.
Information Contacts: Thomas DeFoor, Mauna Loa Observatory, P.O. Box 275, Hilo, HI 96720 USA; William Fuller, NASA Langley Research Center, Hampton, VA 23665 USA.
March 1987 (SEAN 12:03) Cite this Report
Ruiz aerosols persist; optical effects seen from England
Stratospheric aerosol layers observed from Fukuoka, Japan, have been significantly disturbed since late February (figure 39). Additional layers were detected at higher altitudes and backscattering ratios increased. February and March lidar data from Garmisch-Partenkirchen, Germany, generally showed peaks at higher altitudes than in January, but backscattering ratios remained similar. At Mauna Loa, Hawaii, a progressive depletion of aerosols in the lower stratosphere continued through March, but increased concentration between 21 and 25 km compensated for declines from 16 to 21 km, yielding the same average integrated backscatter as in February.
 |
Figure 39. Lidar data from various locations, showing altitudes of aerosol layers. Note that some layers have multiple peaks. Backscattering ratios from Fukouka, Japan, are for the Nd-YAG wavelength of 1.06 µm; all others are for the ruby wavelength of 0.69 µm. Integrated values show total backscatter, expressed in steradians-1, integrated over 300-m intervals from 16-33 km at Mauna Loa. Altitudes of maximum backscattering ratios and coefficients are shown for each layer at Mauna Loa. |
H. H. Lamb has continued to monitor twilight optical effects from Holt, England (53°N, 1°E). No remarkable evening colors were observed through late spring and most of the summer of 1986. On 8 September at 1850 GMT (20 minutes after sunset), the W sky was a cold yellow color. During the next 10 minutes a purplish patch of light developed, to 23° elevation at 1855 and 19° at 1900, suggesting that the illuminated layer was at 18-20 km altitude. By 1905, the sky near the horizon was a fiery red. Similar phenomena were observed 17-18 September, the last 5 days of October, and 15 November. Abnormal yellow color was visible in the evening sky on 14 and 20 December, and on the 20th a purple patch developed above the yellow, grading into white. A purple patch was seen again at dawn on the 21st, with a crepuscular ray to beyond 20° elevation at 0730 GMT, about 40 minutes before sunrise.
These observations suggested an aerosol layer at an altitude of 20 km or more. None of the effects were as intense as those observed between 1982 and 1984-5, produced by the El Chichón aerosols. Lidar in Italy, Germany, Japan, and the USA had begun to detect additional aerosol layers between late September and early November, and aerosol material, probably in the upper troposphere, was visible in daylight from Fairbanks, Alaska in early October. However, satellite data suggested that these apparent new aerosols may have been older material seasonally transported from lower to higher latitudes.
Information Contacts: H.H. Lamb, Climatic Research Unit, School of Environmental Sciences, University of East Anglia, Norwich NR4 7TJ England; Thomas DeFoor, Mauna Loa Observatory, P.O. Box 275, Hilo, HI 96720 USA; Motowo Fujiwara, Physics Department, Kyushu University, Fukuoka 812, Japan; Horst Jäger, Fraunhofer-Institut für Atmosphärische Umweltforschung, Kreuzeckbahnstrasse 19, D-8100 Garmisch-Partenkirchen, West Germany.
April 1987 (SEAN 12:04) Cite this Report
Ruiz aerosols remain in stratosphere
Lidar in Hawaii, Virginia, and Germany continued to detect stratospheric aerosols from the November 1985 eruption of Ruiz (figure 40). Data from Mauna Loa, Hawaii showed a continuing gradual decline in both total backscatter and the thickness of the zone of enhanced aerosols. From Hampton, VA, the aerosol layer was quite uniform from the tropopause upward, with little sublayering evident. Altitudes of peak backscattering measured from Garmisch-Partenkirchen, Germany, which had increased slightly in February and March, returned to January levels. Backscattering ratios have remained stable.
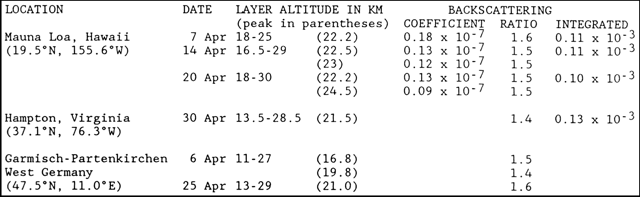 |
Figure 40. Lidar data from various locations, showing altitudes of aerosol layers. Note that some layers have multiple peaks. Backscattering ratios are for the ruby wavelength of 0.69 µm. Integrated values show total backscatter, expressed in steradians-1, integrated over 300-m intervals from 16-33 km at Mauna Loa. Altitudes of maximum backscattering ratios and coefficients are shown for each layer at Mauna Loa. |
Information Contacts: Thomas DeFoor, Mauna Loa Observatory, P. O. Box 275, Hilo, HI 96720 USA; Horst Jäger, Fraunhofer-Institut für Atmosphärische Umweltforschung, Kreuzeckbahnstrasse 19, D-8100 Garmisch-Partenkirchen, West Germany; William Fuller, NASA Langley Research Center, Hampton, VA 23665 USA.
May 1987 (SEAN 12:05) Cite this Report
Ruiz aerosols persist in stratosphere
Lidar in Hawaii, Virginia, and Germany continued to detect remnants of the aerosols from the November 1985 eruption of Ruiz (figure 41). Total backscatter over Hawaii increased in late May, as a higher altitude layer, centered around 28 km, became evident. This material lacked the sharp sublayering that generally characterizes fresh aerosols, and no large explosive eruptions have recently been reported.
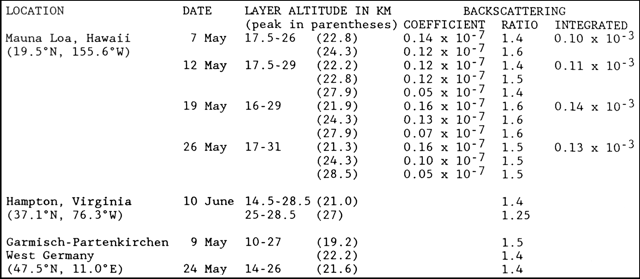 |
Figure 41. Lidar data from various locations, showing altitudes of aerosol layers. Note that some layers have multiple peaks. Backscattering ratios are for the ruby wavelength of 0.69 µm. Integrated values show total backscatter, expressed in steradians-1, integrated over 300-m intervals from 16-33 km at Mauna Loa. Altitudes of maximum backscattering ratios and coefficients are shown for each layer at Mauna Loa. |
Smoke from major forest fires in China that started 6 May could be tracked on polar orbiting satellite imagery as it moved over Kamchatka and S of the Aleutian Islands. The maximum altitude reached by the smoke was uncertain.
Information Contacts: Thomas DeFoor, Mauna Loa Observatory, P.O. Box 275, Hilo, HI 96720 USA; Horst Jäger, Fraunhofer-Institut für Atmosphärische Umweltforschung, Kreuzeckbahnstrasse 19, D-8100 Garmisch-Partenkirchen, West Germany; William Fuller, NASA Langley Research Center, Hampton, VA 23665 USA.
June 1987 (SEAN 12:06) Cite this Report
New stratospheric layer may be from forest fire smoke
An apparently new aerosol layer was detected at the base of the stratosphere on lidar and balloon data. The source of the aerosols was uncertain. No large explosive eruptions were documented in the weeks before the layer was first observed in early June. However, large forest fires that burned from about 6 to 22 May in N China produced extensive clouds of smoke that were tracked for thousands of kilometers on NOAA weather satellite imagery. One major smoke plume moved over Kamchatka, then covered most of the Gulf of Alaska before advancing over Canada's Yukon Territory. Another extended into the Arctic Basin in streamers several hundred kilometers wide and thousands of kilometers long. A third major zone of smoke entered a low pressure area and could be traced as far as Ellesmere Island, just W of northern Greenland.
Instruments on a balloon launched near Laramie, WY on 29 May detected strong particle enhancement from ground level through the tropopause into the lower stratosphere. Highest values were measured between 10 km and the top of the layer at about 13 km, with concentrations of particles larger than 0.15 µm exceeding 10/19cm3, compared to recent lower stratospheric values of about 0.5/cm3. Concentrations remained above 5/cm3 throughout the troposphere, increasing to more than 10/19cm3 near ground level. More than a month later (8 July), the next balloon flight from Laramie detected no unusual tropospheric material, but an aerosol layer extended from the tropopause at 11 km to about 14 km. Counts of particles larger than 0.15 µm reached 3/cm3. The layer was relatively smooth and the distribution of particle sizes suggested that it was probably several weeks old (figure 42). The ratios of the number of particles of 0.15 µm diameter to those of 0.25 µm size was somewhat less than 10 on 29 May, decreasing to about 5 on 8 July. Smaller particles are generally expected from biomass burning, typically yielding ratios of the 0.15/0.25 µm size fractions greater than 10, compared to values of 2-5 for eruption-generated aerosols.
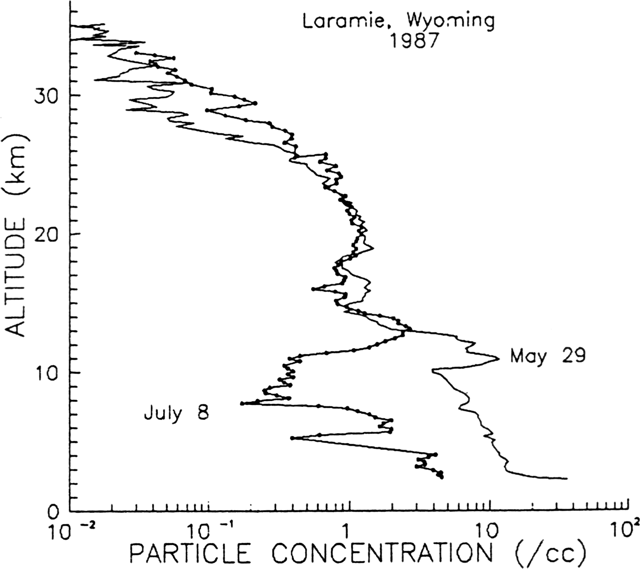 |
Figure 42. Plots of concentrations of particles with radii >0.15 µm counted from balloons launched from Laramie, WY on 29 May and 8 July 1987. Note that the x axis is a logarithmic scale. The 8 July tropopause was at about 11 km altitude. |
Lidar at Hampton, VA detected a distinct layer between the tropopause (13 km) and 15 km altitude on 10 June (figure 43). Eight days later, remnants of the layer were still present, but it was not evident on 25 or 29 June.
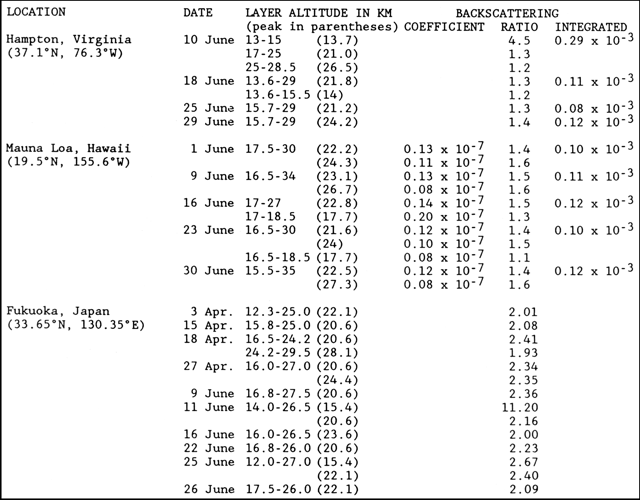 |
Figure 43. Lidar data from various locations, showing altitudes of aerosol layers. Note that some layers have multiple peaks. Backscattering ratios from Fukouka, Japan, are for the Nd-YAG wavelength of 1.06 µm; all others are for the ruby wavelength of 0.69 µm. Integrated values show total backscatter, expressed in steradians-1, integrated over 300-m intervals from 16-33 km at Mauna Loa and from the tropopause to 30 km at Hampton, Virginia. Altitudes of maximum backscattering ratios and coefficients are shown for each layer at Mauna Loa. |
A strong but thin layer at the tropopause (15.6 km) was observed 19 May by lidar at Mauna Loa, Hawaii, and the upper troposphere was very turbid during the next measurement, on 26 May. Each of the five June lidar measurements at Mauna Loa showed a small layer at the base of the stratosphere, most strongly on 16 June. The upper troposphere remained turbid through June. On 11 June a very strong scattering layer that had not been present 2 days earlier appeared just above the tropopause at Fukuoka, Japan. A similar but weaker layer was detected again on 25 June, but was not evident on 16, 22, or 26 June. Late on 10 July, lidar at Garmisch-Partenkirchen, West Germany measured minor peaks at 12.5 and 14 km, probably near the tropopause, with scattering ratios estimated at 1.2-1.3. The next day, peaks of the same intensity were observed at 14 and 16 km, and on 12 July there was a peak of the same scattering ratio at 15 km.
Integrated backscatter data from Mauna Loa, January 1985-June 1987, show a rapid decline in the aerosol produced by the 1982 El Chichón eruption, a sudden increase in June 1985 from an unknown source, then a decline until the appearance of the Ruiz aerosol in December 1985. A gradual increase was observed through much of 1986, then values have diminished for most of the first half of 1987.
Information Contacts: David Hofmann and James Rosen, Department of Physics and Astronomy, University of Wyoming, Laramie, WY 82071 USA; William Fuller and Mary Osborn, NASA Langley Research Center, Hampton, VA 23665 USA; Thomas DeFoor, Mauna Loa Observatory, P. O. Box 275, Hilo, HI 96720 USA; Motowo Fujiwara, Physics Department, Kyushu University, Fukuoka 812, Japan; Horst Jäger, Fraunhofer-Institut für Atmosphärische Umweltforschung, Kreuzeckbahnstrasse 19, D-8100 Garmisch-Partenkirchen, West Germany; Will Gould, NOAA/NESDIS, World Weather Building, Camp Springs, MD 20746, USA.
July 1987 (SEAN 12:07) Cite this Report
New aerosols extend into lower stratosphere
New aerosols that extended into the lower stratosphere were detected at several locations in May and June: at Mauna Loa, Hawaii in each of seven lidar measurements 19 May-30 June; at Fukuoka, Japan on 11 and 25 June but not on three other June dates; at Hampton, VA on 10 and 18 June but not on the 25th or 29th; and from balloons above Laramie, WY on 29 May and 8 July. Peaks near the local tropopause were observed from Garmisch-Partenkirchen Germany beginning 24 May and on most dates through the end of July (table 4). However, July lidar data from Hawaii (figure 44) and Virginia no longer revealed any new material (figure 45).
Table 4. Lidar data from Garmisch-Partenkirchen, Germany (47.5°N, 11.0°E), showing altitudes of peak backscattering ratios of layers near the local tropopause, late May-late July.
| Date | Peak Altitude (km) | Tropopause (km) | Scattering Ratio |
| 24 May 1987 | 10.2 | 9.3 | 1.4 |
| 10 Jun 1987 | 13.2 | 11.4 | 1.4 |
| 22 Jun 1987 | 10.8 | 10.6 | 1.4 |
| 28 Jun 1987 | 15.0 | 13.5 | 1.3 |
| 10 Jul 1987 | 14.4 | 13.4 | 1.3 |
| 11 Jul 1987 | 13.8 | 13.1 | 1.5 |
| 11 Jul 1987 | 16.2 | -- | 1.6 |
| 12 Jul 1987 | 12.6 | 12.3 | 1.3 |
| 12 Jul 1987 | 15.6 | -- | 1.3 |
| 29 Jul 1987 | 14.4 | 11.2 | 1.2 |
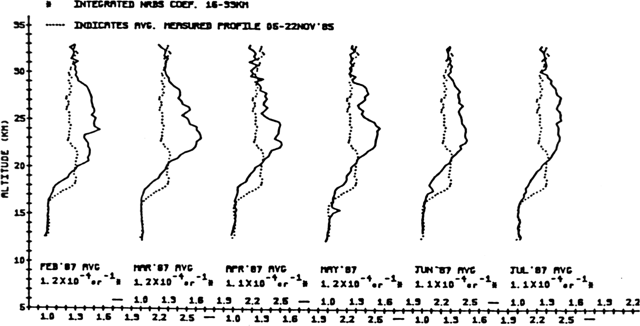 |
Figure 44. Average monthly lidar profiles from Mauna Loa Hawaii, February-July 1987. The dotted line superimposed on each profile represents the average 5-22 November 1985 data, before the arrival of Ruiz aerosols. Courtesy of Thomas DeFoor. |
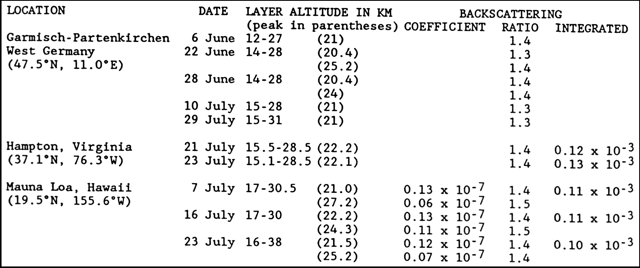 |
Figure 45. Lidar data from various locations, showing altitudes of aerosol layers. Note that some layers have multiple peaks. Backscattering ratios are for the ruby wavelength of 0.69 µm. Integrated values show total backscatter, expressed in steradians-1, integrated over 300-m intervals from 16-33 km at Mauna Loa and from the tropopause to 30 km at Hampton, Virginia. Altitudes of maximum backscattering ratios and coefficients are shown for each layer at Mauna Loa. |
Information Contacts: Horst Jäger, Fraunhofer-Institut für Atmosphärische Umweltforschung, Kreuzeckbahnstrasse 19, D-8100 Garmisch-Partenkirchen, West Germany; Thomas DeFoor, Mauna Loa Observatory, P. O. Box 275, Hilo, HI 23665 USA; William Fuller, NASA Langley Research Center, Hampton, VA 23665 USA.
August 1987 (SEAN 12:08) Cite this Report
Aerosols at 12 km mostly H2SO4 spheres; no new layers
The last two Bulletins reported lower stratospheric layers, perhaps from forest fires in China. Since June, however, no evidence of these layers has been detected by lidar at Hampton, VA or Mauna Loa, Hawaii (figure 46). August profiles at Hampton were smooth, without significant sublayering. Altitudes of peak backscattering at Mauna Loa dropped from 26-29 km in July to 22-25 km in August. There were no indications of recent aerosol injections.
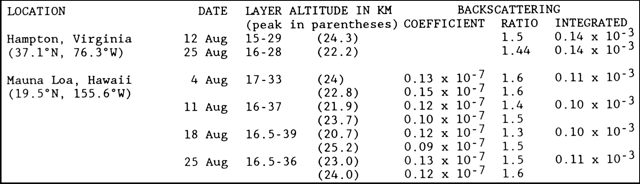 |
Figure 46. Lidar data from Virginia and Hawaii, showing altitudes of aerosol layers during August 1987. Note that some layers have multiple peaks. Backscattering ratios are for the ruby wavelength of 0.69 µm. Integrated values show total backscatter, expressed in steradians-1, integrated over 300-m intervals from 16-33 km at Mauna Loa and from the tropopause to 30 km at Hampton, Virginia. Altitudes of maximum backscattering ratios and coefficients are shown for each layer at Mauna Loa. |
Samples taken on 3 August near San Francisco (about 37.7°N, 122.5°W) by a NASA aircraft at about 12 km altitude did not show unusual concentrations of aerosols. Most particles were H2SO4 spheres, with a few chlorides and nitrates. The size distribution was generally unimodal, with a mean geometric radius of 0.06 µm, but there was a small bulge at about 0.3 µm radius.
Information Contacts: Mary Osborn, NASA Langley Research Center, Hampton, VA 23665 USA; Thomas DeFoor, Mauna Loa Observatory, P. O. Box 275, Hilo, HI 23665 USA; Rudolf Pueschel, Mail Stop 245-5, NASA Ames Research Center, Moffett Field, California 94035 USA.
September 1987 (SEAN 12:09) Cite this Report
Aerosols over Hawaii, 1974-87, summarized
September lidar data from Mauna Loa, Hawaii generally yielded profiles similar to those of the two previous months. On 1 September, aerosol backscattering above 20 km was significantly stronger than the month's average, but fresh layers were not evident and values returned to normal during the next measurement, on 8 September (figure 47). Poor weather limited lidar observations at Fukuoka, Japan during the summer, but data revealed no new aerosols after apparent forest fire debris was detected in the lower stratosphere on 11 and 25 June. A single broad aerosol layer was present over Hampton, VA during each of the September lidar measurements. Much of the variation in integrated backscatter was caused by varying tropopause heights. August and September data from Garmisch-Partenkirchen, West Germany were similar to those of July, but no layers near the local tropopause have been reported since late July.
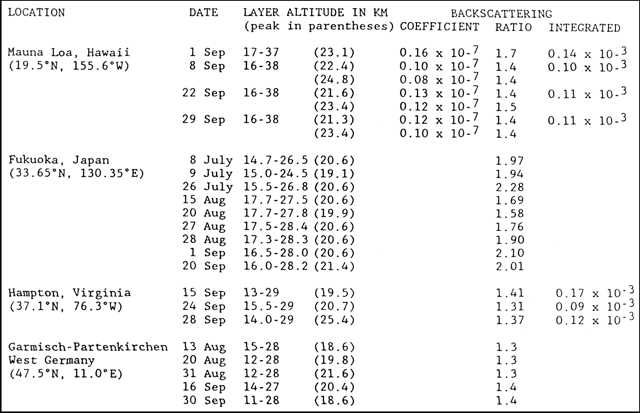 |
Figure 47. Lidar data from various locations, showing altitudes of aerosol layers during July-September 1987. Note that some layers have multiple peaks. Backscattering ratios from Fukouka, Japan, are for the Nd-YAG wavelength of 1.06 µm; all others are for the ruby wavelength of 0.69 µm. Integrated values show total backscatter, expressed in steradians-1, integrated over 300-m intervals from 16-33 km at Mauna Loa and from the tropopause to 30 km at Hampton, Virginia. Altitudes of maximum backscattering ratios and coefficients are shown for each layer at Mauna Loa. |
Integrated backscattering values at Mauna Loa since late 1974 show that the increase in stratospheric aerosols following the 1982 El Chichón eruption dwarfed the effects of other eruptions of the 13-year period. Although remnants of aerosols injected by the November 1985 eruption of Ruiz persist in the stratosphere, values are approaching background levels.
Information Contacts: Thomas DeFoor, Mauna Loa Observatory, P.O. Box 275, Hilo, HI 23665 USA; Horst Jäger, Fraunhofer-Institut für Atmosphärsiche Umweltforschung, Kreuzeckbahnstrasse 19, D-8100 Garmisch-Partenkirchen, West Germany; Motowo Fujiwara, Physics Department, Kyushu University, Fukuoka 812, Japan; William Fuller, NASA Langley Research Center, Hampton, VA 23665 USA.
October 1987 (SEAN 12:10) Cite this Report
Stratospheric aerosols stable or declining
Stratospheric aerosol concentrations measured by lidar from Hawaii, Virginia, and Germany in October remained stable or declined slightly from the previous month (figure 48). Integrated backscatter over Mauna Loa, Hawaii on 27 October was the lowest since the 1982 eruption of El Chichón.
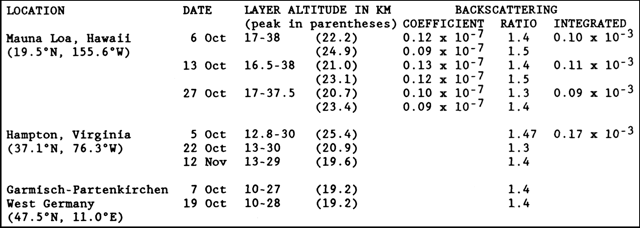 |
Figure 48. Lidar data from Virginia, Hawaii, and Germany, showing altitudes of aerosol layers during October-November 1987. Note that some layers have multiple peaks. Backscattering ratios are for the ruby wavelength of 0.69 µm. Integrated values show total backscatter, expressed in steradians-1, integrated over 300-m intervals from 16-33 km at Mauna Loa and from the tropopause to 30 km at Hampton, Virginia. Altitudes of maximum backscattering ratios and coefficients are shown for each layer at Mauna Loa. |
Information Contacts: Thomas DeFoor, Mauna Loa Observatory, P.O. Box 275, Hilo, HI 96720 USA; William Fuller, NASA Langley Research Center, Hampton, VA 23665 USA; Horst Jäger, Fraunhofer-Institut für Atmosphärische Umweltforschung, Kreuzeckbahnstrasse 19, D-8100 Garmisch-Partenkirchen, West Germany.
November 1987 (SEAN 12:11) Cite this Report
Lowest aerosol values since 1981
Lidar data from Mauna Loa, Hawaii continued to show a gradual decline in stratospheric aerosols (figure 49). Integrated backscattering on 24 November was the lowest measured since the 1982 increases associated with the eruptions of El Chichón and the "Mystery Cloud" (probably from the initial explosive phase of the December 1981-January 1982 Nyamuragira eruption in Zaire). Values measured in Virginia and Germany remained relatively stable. The low integrated backscattering recorded 9 October off the coast of North Carolina was attributed at least partly to the high tropopause that night.
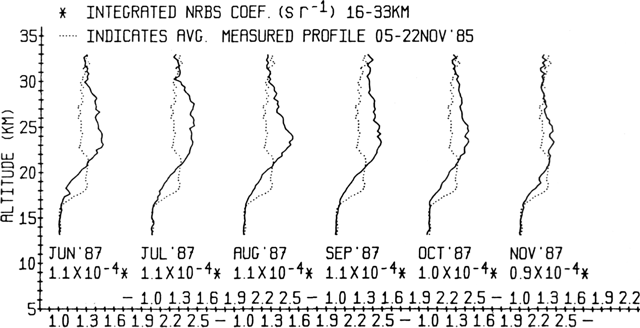 |
Figure 49. Average monthly lidar profiles from Mauna Loa, Hawaii, June-November 1987. The dotted line superimposed on each profile represents the average 5-22 November 1985 data, before the arrival of Ruiz aerosols. |
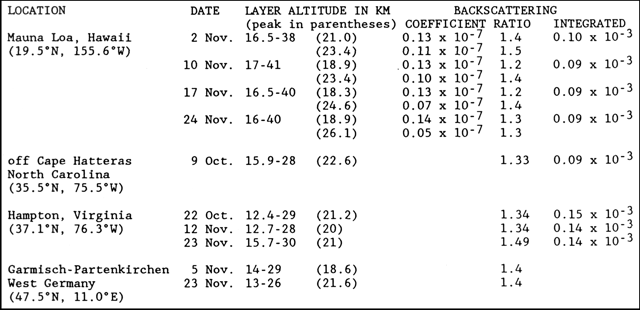 |
Figure 50. Lidar data from various locations, showing altitudes of aerosol layers during October-November 1987. Note that some layers have multiple peaks. Data from the Cape hatteras area are from a NASA airborne mission taking correlative measurements with the SAGE II satellite. Backscattering ratios are for the ruby wavelength of 0.69 µm. Integrated values show total backscatter, expressed in steradians-1, integrated over 300-m intervals from 16-33 km at Mauna Loa and from the tropopause to 30 km at Hampton, Virginia and the NASA airborne mission. Altitudes of maximum backscattering ratios and coefficients are shown for each layer at Mauna Loa. The 22 October and 12 November data from Hampton replace previously published values. |
Information Contacts: William Fuller, NASA Langley Research Center, Hampton, VA 23665 USA; Thomas DeFoor, Mauna Loa Observatory, P. O. Box 275, Hilo, HI 96720 USA; Horst Jäger, Fraunhofer-Institut für Atmosphärische Umweltforschung, Kreuzeckbahnstrasse 19, D-8100 Garmisch-Partenkirchen, West Germany.
December 1987 (SEAN 12:12) Cite this Report
1985-87 aerosol data from Hawaii summarized
A long-term decline in integrated backscattering measured at Mauna Loa, Hawaii persisted through the end of 1987. Aerosols from the 1982 eruption of El Chichón declined rapidly through the first half of 1985, followed by a sharp increase from a source that remains unknown, then a renewed decline until the arrival of Ruiz aerosols in December 1985. After a slow increase through much of 1986, aerosol concentrations have generally declined again through 1987. At low aerosol concentrations, data are sensitive to normalization effects, which probably accounts for many of the small changes plotted in 1987. However, a minor peak in mid-1987 may reflect the effects of large forest fires in China.
Altitudes of peak backscattering over Fukuoka, Japan were slightly higher in the autumn than during the summer but peak backscattering ratios changed little (figure 51). Values were similar at Garmisch-Partenkirchen, West Germany in November and December.
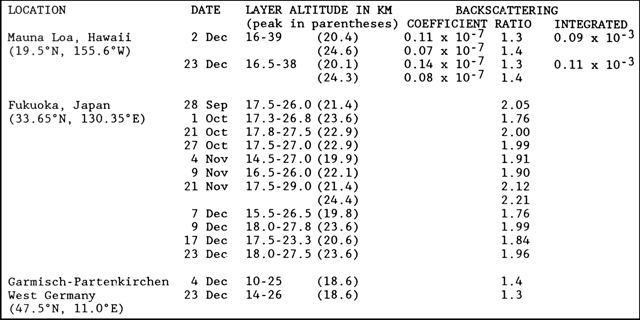 |
Figure 51. Lidar data from various locations, showing altitudes of aerosol layers during October-December 1987. Note that some layers have multiple peaks. Backscattering ratios from Fukouka, Japan, are for the Nd-YAG wavelength of 1.06 µm; all others are for the ruby wavelength of 0.69 µm. Integrated values show total backscatter, expressed in steradians-1, integrated over 300-m intervals from 16-33 km at Mauna Loa and from the tropopause to 30 km at Hampton, Virginia. Altitudes of maximum backscattering ratios and coefficients are shown for each layer at Mauna Loa. |
Information Contacts: Thomas DeFoor, Mauna Loa Observatory, P. O. Box 275, Hilo, HI 96720 USA; Motowo Fujiwara, Physics Department, Kyushu University, Fukuoka 812, Japan; Horst Jäger, Fraunhofer-Institut für Atmosphärische Umweltforschung, Kreuzeckbahnstrasse 19, D-8100 Garmisch-Partenkirchen, West Germany.
January 1988 (SEAN 13:01) Cite this Report
High latitude aerosols similar; 1982-87 values shown
The following is a report from William Fuller. "NASA Langley Research Center conducted a SAM II, Polar Stratospheric Cloud (PSC), and CHEOPS II (Chemistry of Ozone in the Polar Stratosphere) airborne mission 10-31 January. Stratospheric lidar measurements were conducted from Wallops flight facility (38°N, 76.3°W) to Andoya, Norway (69.3°N, 16°E) by way of Goose Bay, Canada and Iceland. The aerosol measurements showed very little change in the stratospheric profiles during the transit flight from Wallops to Andoya, and during the SAM II mission, as the data indicate (figure 52). The SAM II, CHEOPS II, and PSC missions were conducted from Andoya. A PSC mission was flown to 84°N, 15°W, to a low stratospheric temperature region where there was a high probability of the occurrence of PSCs. The early formation of PSCs was detected, peaking at 23 km with a scattering ratio of 1.22, but was much weaker than the PSC measurements of the 1984 and 1986 Arctic missions."
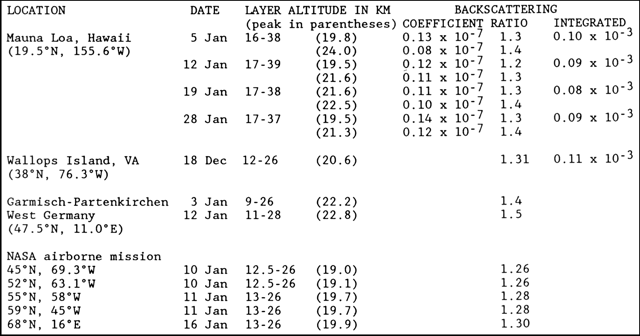 |
Figure 52. Lidar data from various locations, showing altitudes of aerosol layers during December 1987-January 1988. Note that some layers have multiple peaks. Backscattering ratios are for the ruby wavelength of 0.69 µm. Integrated values show total backscatter, expressed in steradians-1, integrated over 300-m intervals from 16-33 km at Mauna Loa. Altitudes of maximum backscattering ratios and coefficients are shown for each layer at Mauna Loa. |
Concentrations of stratospheric aerosols over Hawaii continued to decline slowly, reflecting a long-term trend at other Northern Hemisphere sites (figure 53). Peak backscattering over Germany occurred at a somewhat higher altitude in January than in December.
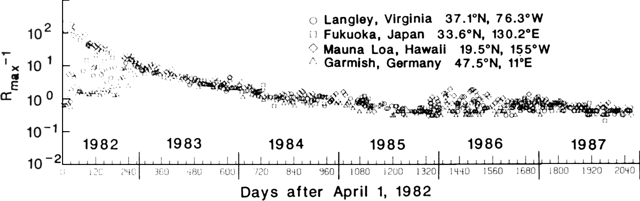 |
Figure 53. Peak aerosol backscatter, normalized to ruby values, from four lidar sites, 1 April 1982 (just after the first major explosion of El Chichón) through 1987. Courtesy of M.P. McCormick and William Fuller. |
Information Contacts: William Fuller, NASA Langley Research Center, Hampton, VA 23665 USA; Thomas DeFoor, Mauna Loa Observatory, P. O. Box 275, Hilo, HI 96720 USA; Horst Jäger, Fraunhofer-Institut für Atmosphärische Umweltforschung, Kreuzeckbahnstrasse 19, D-8100 Garmisch-Partenkirchen, West Germany.
February 1988 (SEAN 13:02) Cite this Report
Stratospheric aerosol concentrations continue to decline
Stratospheric aerosol concentrations continued to decline in the absence of new large explosive eruptions (figure 54). Lidar profiles from Mauna Loa, Hawaii showed a return to conditions similar to those before the November 1985 Ruiz eruption. A distinct change was evident between the 1 March measurements from Hampton, VA and the previous data set in December, but values had not yet returned to background.
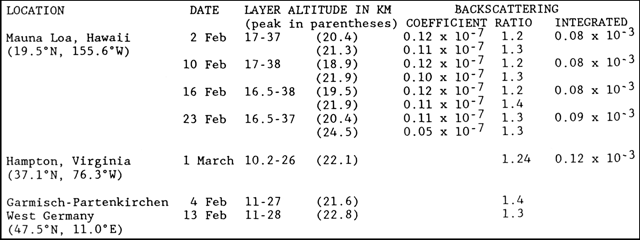 |
Figure 54. Lidar data from various locations, showing altitudes of aerosol layers during February-March 1988. Note that some layers have multiple peaks. Backscattering ratios are for the ruby wavelength of 0.69 µm. Integrated values show total backscatter, expressed in steradians-1, integrated over 300-m intervals from 16-33 km at Mauna Loa and from the tropopause to 30 km at Hampton, Virginia. Altitudes of maximum backscattering ratios and coefficients are shown for each layer at Mauna Loa. |
Information Contacts: Thomas DeFoor, Mauna Loa Observatory, P. O. Box 275, Hilo, HI 96720 USA; Horst Jäger, Fraunhofer-Institut für Atmosphärische Umweltforschung, Kreuzeckbahnstrasse 19, D-8100 Garmisch-Partenkirchen, West Germany; William Fuller, NASA Langley Research Center, Hampton, VA 23665 USA.
March 1988 (SEAN 13:03) Cite this Report
Lidar figures since 1974 summarized; Antarctic data
Lidar data from Hampton, VA continued to show a gradual decline in stratospheric aerosols, but values had not yet dropped to the level of 1977-79. Similar trends have been measured in Europe, Hawaii, and Japan (for 1982-87). The increased aerosol observed from Mauna Loa, Hawaii on 19 March (figure 55) was concentrated between 20 and 25 km altitude and did not appear to be newly injected material. January-March data from Fukuoka, Japan were similar to values measured in late 1987.
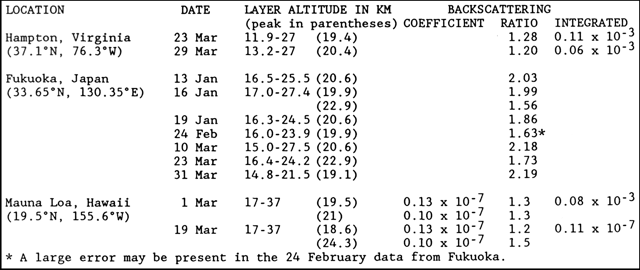 |
Figure 55. Lidar data from various locations, showing altitudes of aerosol layers during January-March 1988. Note that some layers have multiple peaks. Backscattering ratios from Fukouka, Japan, are for the Nd-YAG wavelength of 1.06 µm; all others are for the ruby wavelength of 0.69 µm. Integrated values show total backscatter, expressed in steradians-1, integrated over 300-m intervals from 16-33 km at Mauna Loa and from the tropopause to 30 km at Hampton, Virginia. Altitudes of maximum backscattering ratios and coefficients are shown for each layer at Mauna Loa. |
Stratospheric aerosol measurements using Nd-YAG, frequency-doubled lidar (0.532 µm), were made from Italy's base at Terra Nova Bay, Antarctica (74.6988°S, 164.0856°E) from 28 December, 1987 to 10 February, 1988. Lidar data were compared with the Antarctic molecular atmosphere derived from the base Meteorological Office's daily radiosonde soundings. Good lidar profiles were obtained, most of them during the day, to more than 30 km height (figure 56). Aerosols were detected between about 16 and 25 km, with only gradual variations in the layer structure during the period. Integrated backscattering values (between 10 and 30 km) varied from 0.02-0.03 x 10⁻³.
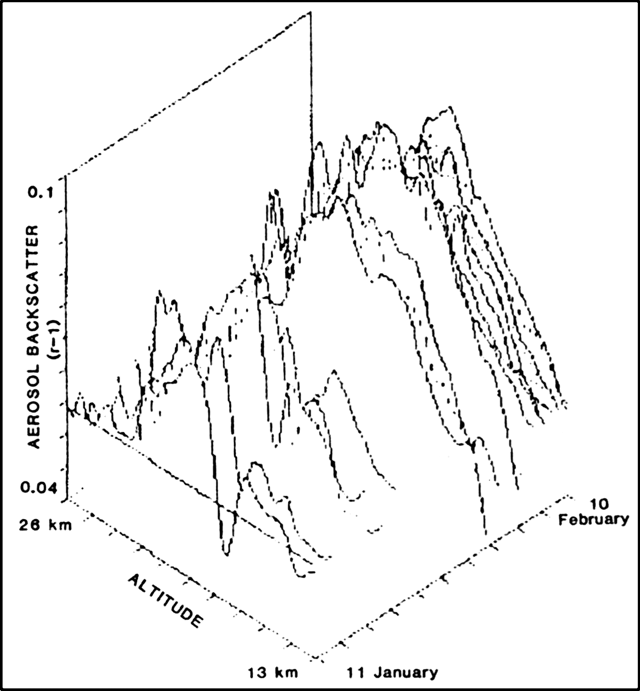 |
Figure 56. Lidar profiles (at 0.532 µm) from Italy's base at Terra Nova Bay, Antarctica (74.6988°S, 164.0856°E), 11 January-10 February, 1988. Courtesy of Leopoldo Stefanutti. |
The source of the Antarctic aerosols is uncertain. The last known vigorous explosive activity in the Antarctic region was the late 1984 eruption of Mt. Erebus but no eruption clouds large enough to penetrate the stratosphere were observed. Remnants of large eruptions elsewhere on the globe that continue to be detected at lower latitudes may also persist in the Antarctic stratosphere.
Information Contacts: Leopoldo Stefanutti, Istituto di Ricerca sulle Onde Elettromagnetiche, Via Panciatichi 64, 50127 Firenze, Italy; William Fuller, NASA Langley Research Center, Hampton, VA 23665 USA; Thomas DeFoor, Mauna Loa Observatory, P.O. Box 275, Hilo, HI 96720 USA; Motowo Fujiwara, Physics Department, Fukuoka University, Jonan-ku, Fukuoka 814-01, Japan.
April 1988 (SEAN 13:04) Cite this Report
Little change in stratospheric aerosols
No eruptions are known to have added significant quantities of aerosols to the stratosphere since Ruiz in November 1985. April lidar profiles from Mauna Loa, Hawaii generally showed aerosols gradually returning to pre-Ruiz values, although enhanced backscattering was measured between about 21 and 25 km altitude on 19 March. March-April lidar data from Garmisch-Partenkirchen, West Germany showed little change in stratospheric aerosol values.
Information Contacts: Horst Jäger, Fraunhofer-Institut für Atmosphärische Umweltforschung, Kreuzeckbahnstrasse 19, D-8100 Garmisch-Partenkirchen, West Germany; Thomas DeFoor, Mauna Loa Observatory, P.O. Box 275, Hilo, HI 96720 USA.
May 1988 (SEAN 13:05) Cite this Report
No new aerosols detected
No significant additions of aerosols to the stratosphere have been detected since the period following the eruption of Ruiz in November 1985. April and May lidar observations from Mauna Loa, Hawaii showed a continuation of the gradual decline in the stratosphere's aerosol content.
Information Contacts: Thomas DeFoor, Mauna Loa Observatory, P.O. Box 275, Hilo, HI 96720 USA.
June 1988 (SEAN 13:06) Cite this Report
Small new layer near tropopause may be from Banda Api
Apparent small new aerosol layers near the tropopause, perhaps from the May eruption of Banda Api, Indonesia (4.525°S, 129.871°E), were detected by lidar at Mauna Loa, Hawaii and Fukuoka, Japan (figure 57). Very small lower stratospheric layers that looked sharp and fresh were evident on profiles from all three June observations at Mauna Loa (figure 58). The 8 June data showed peaks at 15.9 and 17.7 km altitude; only the peak at 17.7 km was evident on 16 and 21 June. Data from Fukuoka first showed a very thin layer at about 15.4 km altitude (about 1 km below the tropopause) on 5 July, nearly a month after the previous measurement on 10 June. The layer was less than 0.75 km thick, much thinner than the usual cirrus cloud. The next night, a similar layer appeared at the same altitude. Observation with a height resolution of 0.15 km showed it to be thinner than 0.3 km. No cirrus clouds were visible either night. No new layers were detected in late June from Hampton, VA.
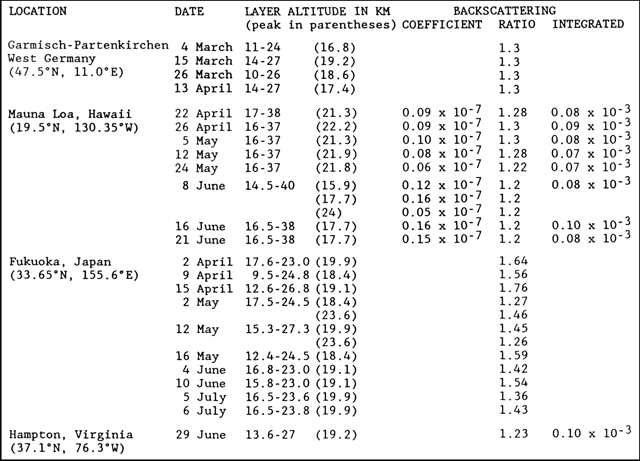 |
Figure 57. Lidar data from various locations, showing altitudes of aerosol layers during March-July 1988. Note that some layers have multiple peaks. Backscattering ratios from Fukouka, Japan, are for the Nd-YAG wavelength of 1.06 µm; all others are for the ruby wavelength of 0.69 µm. Integrated values show total backscatter, expressed in steradians-1, integrated over 300-m intervals from 16-33 km at Mauna Loa and from the tropopause to 30 km at Hampton, Virginia. Altitudes of maximum backscattering ratios and coefficients are shown for each layer at Mauna Loa. |
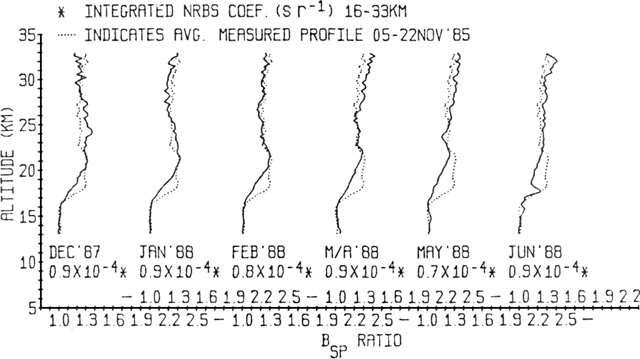 |
Figure 58. Average monthly lidar profiles from Mauna Loa, Hawaii, December 1987-June 1988. The dotted line superimposed on each profile represents the average 5-22 November 1985 data, before the arrival of Ruiz aerosols. |
Figure 59 shows vertically integrated backscattering at Garmisch-Partenkirchen, West Germany, 1982-87. Seasonal variations measured 1983-85 were discussed in Jäger and Carnuth, 1987. The 3 closely spaced higher values in May-June 1987 are from a lower stratospheric layer that may have been caused by strong forest fires in China.
 |
Figure 59. Vertically integrated ruby-wavelength backscattering data from Garmisch-Partenkirchen, West Germany, 1982-1987. Integration was performed from 1 km above the local tropopause to the top of the aerosol layer (at 25-35 km). |
Reference. Jäger, H., and Carnuth, W., 1987, The Decay of the El Chichón Stratospheric Perturbation, Observed by Lidar at Northern Midlatitudes; Geophysical Research Letters, v. 14, p. 696-699.
Information Contacts: Motowo Fujiwara, Physics Department, Fukuoka University, Jonan-ku, Fukuoka 814-01, Japan; Thomas DeFoor, Mauna Loa Observatory, P. O. Box 275, Hilo, HI 96720 USA; Horst Jäger, Fraunhofer-Institut für Atmosphärische Umweltforschung, Kreuzeckbahnstrasse 19, D-8100 Garmisch-Partenkirchen, West Germany; William Fuller and Mary Osborn, NASA Langley Research Center, Hampton, VA 23665 USA.
July 1988 (SEAN 13:07) Cite this Report
Decline in aerosol backscattering
Lidar data from the USSR showed aerosols at similar altitudes as those observed at other Northern Hemisphere locations (figure 60), but data from Obninsk (55°N, 38°E) on 30 June included a higher altitude layer. Integrated backscattering returned to 3 April/27 May values after a substantial decline in late May and early June. No evidence of material from the 29 July eruption of Makian (Indonesia) had been detected by lidar stations as of early August. Lidar data from Mauna Loa, Hawaii has documented a a continuing irregular decline in integrated aerosol backscattering since late 1986. No large explosive eruptions are known to have produced significant stratospheric aerosols since the Ruiz eruption of November 1985.
 |
Figure 60. Lidar data from various locations, showing altitudes of aerosol layers during April-August 1988. Note that some layers have multiple peaks. Backscattering ratios from Obninsk and Teplokluchenka, USSR, are for the Nd-YAG wavelength of 0.53 µm; all others are for the ruby wavelength of 0.69 µm. Integrated values show total backscatter, expressed in steradians-1, integrated over 500-m intervals from 15-30 km at Obninsk and Teplokluchenka, and from the tropopause to 30 km at Hampton, Virginia. Altitudes of maximum backscattering ratios and coefficients are shown for each layer at Mauna Loa. |
Information Contacts: Sergei Khmelevtsov, Institute of Experimental Meteorology, Lenin St. 82, Obninsk, Kaluga Reg., USSR; Thomas DeFoor, Mauna Loa Observatory, P.O. Box 275, Hilo, HI 96720 USA; Horst Jäger, Fraunhofer-Institut für Atmosphärische Umweltforschung, Kreuzeckbahnstrasse 19, D-8100 Garmisch-Partenkirchen, West Germany; William Fuller and Mary Osborn, NASA Langley Research Center, Hampton, VA 23665 USA.
August 1988 (SEAN 13:08) Cite this Report
Tropospheric layers probably from forest fires
Lidar data indicated that few aerosols remain in the stratosphere from the November 1985 Ruiz eruption, and no subsequent eruptions appear to have produced large amounts of stratospheric ejecta. At Mauna Loa, Hawaii, the small lower stratospheric layers observed in early and mid June were not detected on 26 June or in subsequent measurements (figure 61). Stratospheric aerosols measured at Hampton, VA continued their gradual decline. However, relatively dense layers, perhaps from major forest fires in the western United States, were evident in the troposphere during observations on 23 August. Winds at about 5.8 km altitude on 22 and 23 August were favorable for transport of smoke from the fires to the Hampton area. Late July-early August data from Garmisch-Partenkirchen, West Germany were similar to those of early July.
 |
Figure 61. Lidar data from various locations, showing altitudes of aerosol layers during June-August 1988. Note that some layers have multiple peaks. Backscattering ratios are for the ruby wavelength of 0.69 µm. Integrated values show total backscatter, expressed in steradians-1, integrated over 300-m intervals from 16-33 km at Mauna Loa and from the tropopause to 30 km at Hampton, Virginia. Altitudes of maximum backscattering ratios and coefficients are shown for each layer at Mauna Loa. Upper and lower limits of layers at Mauna Loa were not clearly evident and are therefore not reported. |
Information Contacts: William Fuller, NASA Langley Research Center, Hampton, VA 23665 USA; Thomas DeFoor, Mauna Loa Observatory, P. O. Box 275, Hilo, HI 96720 USA; Horst Jäger, Fraunhofer-Institut für Atmosphärische Umweltforschung, Kreuzeckbahnstrasse 19, D-8100 Garmisch-Partenkirchen, West Germany.
September 1988 (SEAN 13:09) Cite this Report
Aerosols continue to decline toward background levels
Lidar data from Virginia, Japan, and Hawaii indicated that stratospheric aerosol concentrations continued to decline toward background levels through September (figure 62). Small lower stratospheric layers measured in June at Mauna Loa, Hawaii and in early July at Fukuoka, Japan, perhaps from the May eruption of Banda Api, have not been evident since then. No large injections of volcanic material into the stratosphere have been detected since the November 1985 eruption of Ruiz.
 |
Figure 62. Lidar data from various locations, showing altitudes of aerosol layers during August-September 1988. Note that some layers have multiple peaks. Backscattering ratios from Fukouka, Japan, are for the Nd-YAG wavelength of 1.06 µm; all others are for the ruby wavelength of 0.69 µm. Integrated values show total backscatter, expressed in steradians-1, integrated over 300-m intervals from 16-33 km at Mauna Loa and from the tropopause to 30 km at Hampton, Virginia. Altitudes of maximum backscattering ratios and coefficients are shown for each layer at Mauna Loa. Upper and lower limits of layers at Mauna Loa were not clearly evident and are therefore not reported. |
Information Contacts: William Fuller, NASA Langley Research Center, Hampton, VA 23665 USA; Thomas DeFoor, Mauna Loa Observatory, P.O. Box 275, Hilo, HI 96720 USA; Motowo Fujiwara, Physics Department, Fukuoka University, Jonanku, Fukuoka 814-01, Japan.
October 1988 (SEAN 13:10) Cite this Report
No new volcanic aerosols
No large new volcanic layers appear to have been injected since the November 1985 eruption of Ruiz. Lidar data in September and October showed few remaining stratospheric volcanic aerosols. Satellite data suggest that eruption clouds ejected on 9 May at Banda Api and 29 July at Makian, both in Indonesia, may have penetrated the stratosphere. Small new layers were detected by lidar after the Banda Api eruption, but neither eruption appears to have had a significant long-term effect on the stratosphere.
Information Contacts: Thomas DeFoor, Mauna Loa Observatory, P.O. Box 275, Hilo, HI 96720 USA; Horst Jäger, Fraunhofer-Institut für Atmosphärische Umweltforschung, Kreuzeckbahnstrasse 19, D-8100 Garmisch-Partenkirchen, West Germany.
November 1988 (SEAN 13:11) Cite this Report
No new stratospheric injections
Lidar stations in Germany, Japan, and Hawaii detected no apparent new stratospheric aerosol layers, and no recent large explosive eruptions have been reported. Substantially increased backscattering was measured between 17 and 22 km altitude at Mauna Loa, Hawaii on 1 November. Despite some instrument problems that night, the increased aerosols appeared real, but the profile did not have the characteristics of material from a new eruption.
 |
Figure 63. Lidar data from various locations, showing altitudes of aerosol layers during September-November 1988. Note that some layers have multiple peaks. Backscattering ratios from Fukouka, Japan, are for the Nd-YAG wavelength of 1.06 µm; all others are for the ruby wavelength of 0.69 µm. Integrated values show total backscatter, expressed in steradians-1, integrated over 300-m intervals from 16-33 km at Mauna Loa and from the tropopause to 30 km at Hampton, Virginia. Altitudes of maximum backscattering ratios and coefficients are shown for each layer at Mauna Loa. Some upper and lower limits of layers at Mauna Loa were not clearly evident and are therefore not reported. |
Information Contacts: Thomas DeFoor, Mauna Loa Observatory, P.O. Box 275, Hilo, HI 96720 USA; Motowo Fujiwara, Physics Department, Fukuoka University, Jonan-ku, Fukuoka 814-01, Japan; Horst Jäger, Fraunhofer-Institut für Atmosphärische Umweltforschung, Kreuzeckbahnstrasse 19, D-8100 Garmisch-Partenkirchen, West Germany.
December 1988 (SEAN 13:12) Cite this Report
1985-88 Hawaii aerosol data summarized
Lidar data from Mauna Loa, Hawaii continued to document the gradual decay in stratospheric aerosol density. No large volcanic aerosol injections have occurred since the November 1985 eruption of Ruiz. A small increase in aerosols was detected after the 9 May eruption of Banda Api, Indonesia, but effects on the stratosphere appear to have been brief. The cause of the small November peak at Mauna Loa is uncertain, but profile characteristics did not suggest that the material was from a new eruption.
Information Contacts: Thomas DeFoor, Mauna Loa Observatory, P.O. Box 275, Hilo, HI 96720 USA.
January 1989 (SEAN 14:01) Cite this Report
Stratosphere injections unlikely from recent eruptions
Lidar data from Hawaii, Japan, and Germany generally showed continuing low concentrations of stratospheric aerosols (figure 64. A broad layer centered at about 24 km altitude was detected over Mauna Loa, Hawaii on 26 January, but its profile was not characteristic of newly injected material. At Fukuoka, Japan, peak backscattering increased slightly in December and January, to levels last measured shortly after the May eruption of Banda Api, Indonesia.
 |
Figure 64. Lidar data from various locations, showing altitudes of aerosol layers during December 1988-January 1989. Note that some layers have multiple peaks. Backscattering ratios from Fukouka, Japan, are for the Nd-YAG wavelength of 1.06 µm; all others are for the ruby wavelength of 0.69 µm. Integrated values show total backscatter, expressed in steradians-1, integrated over 300-m intervals from 16-33 km at Mauna Loa and from the tropopause to 30 km at Hampton, Virginia. Altitudes of maximum backscattering ratios and coefficients are shown for each layer at Mauna Loa. Some upper and lower limits of layers at Mauna Loa were not clearly evident and are therefore not reported. |
No recent eruptions appear to have produced clouds that reached the stratosphere. Observations of the December-January eruption of Lonquimay, Chile from the ground and from weather satellites revealed no clouds exceeding 9 km altitude. Weather conditions hampered observations during the December-January eruption of Tokachi-dake, Japan, and no large eruption clouds were seen, although ash fell tens of kilometers away.
Information Contacts: Thomas DeFoor, Mauna Loa Observatory, P.O. Box 275, Hilo, HI 96720 USA; Motowo Fujiwara, Physics Department, Fukuoka University, Jonan-ku, Fukuoka 814-01, Japan; Horst Jäger, Fraunhofer-Institut für Atmosphärische Umweltforschung, Kreuzeckbahnstrasse 19, D-8100 Garmisch-Partenkirchen, West Germany.
February 1989 (SEAN 14:02) Cite this Report
Hampton, Virginia lidar data since 1974 summarized
Stratospheric aerosols continued their descent toward background levels in February. Lidar data at Mauna Loa, Hawaii were similar to those of the previous month. The long-term trend in integrated backscattering at Hampton, VA shows a continuing irregular decline since the maximum reached shortly after the 1982 El Chichón eruption. However, values remained slightly higher than during the period of relative atmospheric quiet in the late 1970's, ended by the May 1980 eruption of St. Helens.
Information Contacts: William Fuller, NASA Langley Research Center, Hampton, VA 23665 USA; Thomas DeFoor, Mauna Loa Observatory, P.O. Box 275, Hilo, HI 96720 USA.
March 1989 (SEAN 14:03) Cite this Report
Stratospheric aerosols continue long-term decline
Lidar data has continued to show gradual declines in stratospheric aerosols (figure 65). Aerosol concentrations over Obninsk, USSR were more variable than from other sites during summer 1988, but generally declined from April-June values. No large explosive eruptions have been reported in recent months and no fresh aerosol layers have been observed.
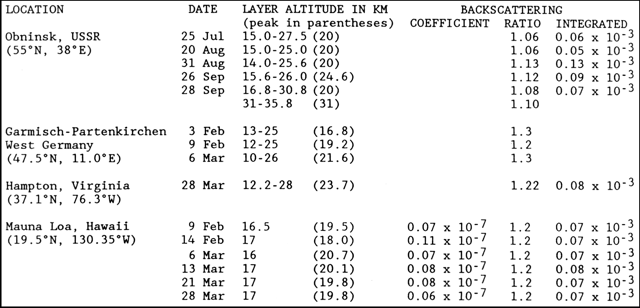 |
Figure 65. Lidar data from various locations, showing altitudes of aerosol layers during July 1988-March 1989. Note that some layers have multiple peaks. Backscattering ratios from Obninsk are for the Nd-YAG wavelength of 0.53 µm; all others are for the ruby wavelength of 0.69 µm. Integrated values show total backscatter, expressed in steradians-1, integrated over 500-m intervals from 15-30 km at Obninsk; and 300-m intervals from 16-33 km at Mauna Loa and from the tropopause to 30 km at Hampton, Virginia. |
Information Contacts: Sergei Khmelevtsov, Institute of Experimental Meteorology, Lenin St. 82, Obninsk, Kaluga Reg., USSR; Thomas DeFoor, Mauna Loa Observatory, P. O. Box 275, Hilo, HI 96720 USA; Horst Jäger, Fraunhofer-Institut für Atmosphärische Umweltforschung, Kreuzeckbahnstrasse 19, D-8100 Garmisch-Partenkirchen, West Germany; Mary Osborn, NASA Langley Research Center, Hampton, VA 23665 USA.
April 1989 (SEAN 14:04) Cite this Report
No new stratospheric aerosols
Recent eruptions have apparently contributed little new aerosol material to the stratosphere. Aerosol concentrations over Obninsk and Teplocluchenka, USSR increased slightly during fall and winter 1988 from spring and summer values (figure 66). Poor weather limited observations from Mauna Loa, Hawaii; the one successful April 1989 observation registered the lowest integrated aerosol backscattering measured since before the 1982 eruption of El Chichón.
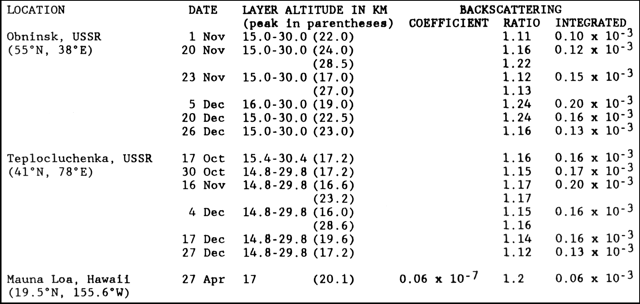 |
Figure 66. Lidar data from various locations, showing altitudes of aerosol layers during October 1988-April 1989. Note that some layers have multiple peaks. Backscattering ratios from Obninsk and Teplocluchenka are for the Nd-YAG wavelength of 0.53 µm; all others are for the ruby wavelength of 0.69 µm. Integrated values show total backscatter, expressed in steradians-1, integrated over 500-m intervals from 15-30 km at Obninsk and Teplocluchenka, and 300-m intervals from 16-33 km at Mauna Loa. |
Information Contacts: Sergei Khmelevtsov, Yu. Kaufman, and B. Chen, Institute of Experimental Meteorology, Lenin St. 82, Obninsk, Kaluga Reg., USSR; Thomas DeFoor, Mauna Loa Observatory, P. O. Box 275, Hilo, HI 96720 USA.
May 1989 (SEAN 14:05) Cite this Report
Aerosols continue decline towards background levels
No large explosive eruptions have recently been reported and lidar stations have not detected new material in the stratosphere. May data from Mauna Loa, Hawaii showed a continued gradual decline of stratospheric aerosols toward background.
Information Contacts: Thomas DeFoor, Mauna Loa Observatory, P.O. Box 275, Hilo, HI 96720 USA.
June 1989 (SEAN 14:06) Cite this Report
No new volcanic injections into the stratosphere
Lidar data from Northern Hemisphere stations showed no evidence of new injections of volcanic material into the stratosphere (figure 67). A polar stratospheric cloud, with strongest backscatter at about 23 km altitude, was detected from Obninsk, USSR on 1 February.
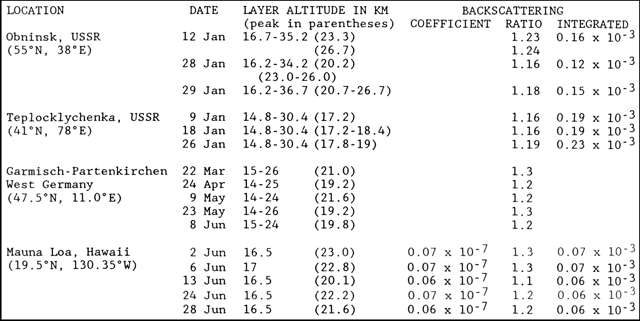 |
Figure 67. Lidar data from various locations, showing altitudes of aerosol layers during January-June 1989. Note that some layers have multiple peaks. Backscattering ratios from Obninsk and Teplocklychenka are for the Nd-YAG wavelength of 0.53 µm; all others are for the ruby wavelength of 0.69 µm. Integrated values show total backscatter, expressed in steradians-1, integrated over 500-m intervals from 15-30 km at Obninsk and Teplocluchenka, and 300-m intervals from 16-33 km at Mauna Loa. |
Information Contacts: Sergei Khmelevtsov, Institute of Experimental Meteorology, Lenin St. 82, Obninsk, Kaluga Reg., USSR; Thomas DeFoor, Mauna Loa Observatory, P. O. Box 275, Hilo, HI 96720 USA; Horst Jäger, Fraunhofer-Institut für Atmosphärische Umweltforschung, Kreuzeckbahnstrasse 19, D-8100 Garmisch-Partenkirchen, West Germany.
July 1989 (SEAN 14:07) Cite this Report
Stratospheric aerosols near background levels
No recent large explosive eruptions have been reported and the aerosol content of the stratosphere appears to be nearing background levels. Data from a single July observation at Mauna Loa, Hawaii showed little change from the previous month. A data set collected at Hampton, VA during marginal weather conditions on 24 July showed a profile typical of recent months, with a peak backscattering ratio of 1.2 at about 20 km altitude. Preliminary plans have been made for lidar instruments at the NASA Langley Research Center and several other sites to monitor the atmosphere almost continuously for much of October.
Information Contacts: Thomas DeFoor, Mauna Loa Observatory, P.O. Box 275, Hilo, HI 96720 USA; David Woods, NASA Langley Research Center, Hampton, VA 23665 USA.
August 1989 (SEAN 14:08) Cite this Report
New aerosols, possibly from July Santiaguito explosion
Lidar data from Utah and Hawaii, and unusual sunsets seen from Colorado, indicated that a small new aerosol layer has been injected into the lower stratosphere. The strongest effects were observed from Salt Lake City, Utah (41°N, 112°W) 4-6 August (figure 68) by lidar equipment generally used for monitoring cirrus clouds in the upper troposphere. A slight enhancement may have been present 7 August, but no additional stratospheric aerosols have been detected over Utah since then. Strong red sunsets were seen in the area at the beginning of August and some faint aerosol-like cloud bands were also visible in daylight. Richard Keen saw a bright salmon-pink twilight from Golden, Colorado (39.75°N, 105.25°W) the evening of 4 August. The colors peaked at a solar depression angle of 4°, and horizontal striations were visible. Keen had not observed unusual twilights since early 1986.
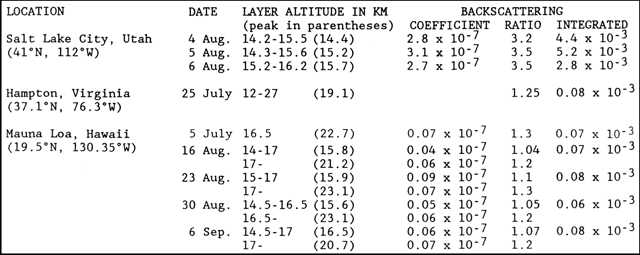 |
Figure 68. Lidar data from various locations, showing altitudes of aerosol layers during July-September 1989. Backscattering ratios are all for the ruby wavelength of 0.69 µm. Only bases of higher altitude layers at Mauna Loa are shown. Because of different sampling parameters, the very preliminary data from Salt Lake City are not directly comparable to those from other locations. A 75-m sampling interval was used, and 3-4 ten-shot averages were combined to yield the results shown. Integrated values show total backscatter, expressed in steradians-1, integrated over 300-m intervals from 16-33 km at Mauna Loa. |
Meteorological analysis at the University of Utah suggested that the aerosols had been carried to the area by a strong subtropical jet stream, and that the same material had probably been over Hawaii around 1 August. Equipment problems at Mauna Loa, Hawaii had prevented lidar observations since 5 July, but when observations resumed there on 16 August, a very small aerosol layer was detected within a double tropopause. A somewhat stronger layer was detected on the aerosol profile 23 August, and a small amount of apparently new material was detected again 30 August and 6 September. No new material was evident at Hampton, VA on 25 July. Instrument problems prevented additional data collection there as of early September.
The source of the new aerosol material was uncertain, but University of Utah meteorologists suggested that Central America was the most likely recent source. The plume produced by the strong 19 July explosion of Santiaguito was reported to have reached only about 4 km above the vent (approximate elevation 2,500 m). However, wind shearing of the plume was distinctly visible. Its lower portion, which contained the bulk of the ash and reached 4 km above the vent, moved NW, while a less dense upper portion was carried SE. Analyses of radiosonde data, newly available photographs from a different viewpoint (Llano del Pinal), and weather satellite information are planned, and may allow better characterization of cloud dynamics.
Observations of the February and August 1989 lunar eclipses indicate no significant new aerosol layers (figure 69). Richard Keen made brightness estimates of the 17 August eclipse by comparing the reduced brightness of the moon seen in reversed binoculars with the actual brightness of stars. Although a thunderstorm obscured the eclipse at mid-totality, 15 minutes before the end of totality the moon's visual magnitude was -2.0, 0.2 magnitudes fainter than predicted by the model in Keen, 1983 [citation in 11:3]. The observed minus calculated residual yields a globally averaged volcanic aerosol vertical optical thickness of only 0.005, which, within the probable error of the method, is zero. Data from Mauna Loa, Hawaii also document a continuing decline in the aerosol content of the stratosphere. A small irregular increase in stratospheric aerosols following the November 1985 eruption of Ruiz is superimposed on the gradual decay of the much larger El Chichón aerosol erupted in 1982. No large new injections of volcanic material are evident on the Mauna Loa records since 1985.
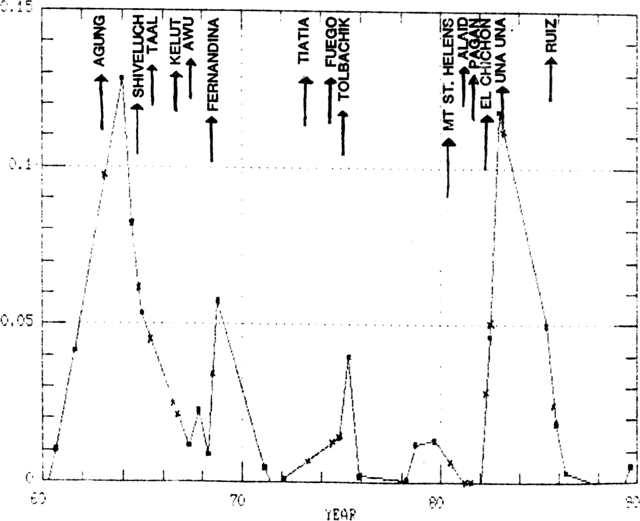 |
Figure 69. Global volcanic aerosol optical thickness derived from lunar eclipse observations, 1960-89. Arrows show some major explosive eruptions. Courtesy of Richard Keen. |
Further Reference. Sassen, K., and Horel, J., 1990, Polarization Lidar and synoptic analyses of an unusual volcanic aerosol cloud: Journal of the Atmospheric Sciences, v. 24, p. 2881-2889.
Information Contacts: Ken Sassen, Dept. of Meteorology, University of Utah, Salt Lake City, UT 84112 USA; Thomas DeFoor, Mauna Loa Observatory, P.O. Box 275, Hilo, HI 96720 USA; Richard Keen, 34296 Gap Road, Golden, CO 80403 USA; William I. Rose, Dept. of Geology and Geological Engineering, Michigan Technological University, Houghton, MI 49931 USA; Mary Osborn, NASA Langley Research Center, Hampton, VA 23665 USA.
September 1989 (SEAN 14:09) Cite this Report
Continued minor lower stratospheric aerosol layer
September lidar data from Mauna Loa, Hawaii (figure 70) continued to show minor aerosol enhancement in the lower stratosphere, perhaps from the 19 July explosion of Santiaguito, Guatemala. Lidar at Garmisch-Partenkirchen, West Germany also recorded a small increase near the base of the stratosphere on 16 September.
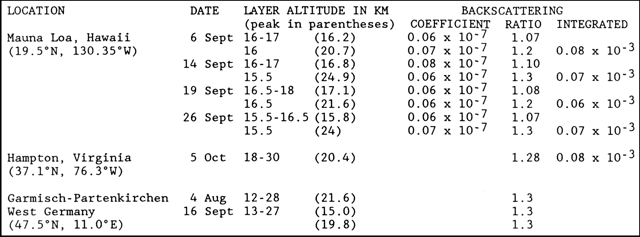 |
Figure 70. Lidar data from various locations, showing altitudes of aerosol layers during August-October 1989. Backscattering ratios are all for the ruby wavelength of 0.69 µm. Only bases of higher altitude layers at Mauna Loa are shown. Integrated values show total backscatter, expressed in steradians-1, integrated over 300-m intervals from 16-33 km at Mauna Loa and from the tropopause to 30 km at Hampton. |
Inspection of data from NASA's SAGE satellite, which has a precessing orbit that was centered at 7-7.4°N on 19 July and 12.2-12.5°N the next day, revealed cloud layers at about 16 km altitude, near the tropopause. However, the 19 July SAGE data were collected before the explosion, and the layers had characteristics typical of cirrus clouds.
Information Contacts: Thomas DeFoor, Mauna Loa Observatory, P.O. Box 275, Hilo, HI 96720 USA; Horst Jäger, Fraunhofer-Institut für Atmosphärische Umweltforschung, Kreuzeckbahnstrasse 19, D-8100 Garmisch-Partenkirchen, West Germany; Mary Osborn, NASA Langley Research Center, Hampton, VA 23665 USA.
October 1989 (SEAN 14:10) Cite this Report
New aerosols seen August/September no longer evident
The new stratospheric aerosols, perhaps from the 19 July explosion of Santiaguito, Guatemala, were no longer evident when observations from Hawaii resumed on 20 October (after a period of cloudy weather), nor in subsequent early November data (figure 71). Lidar measurements from Hampton, VA have not revealed any new aerosol material.
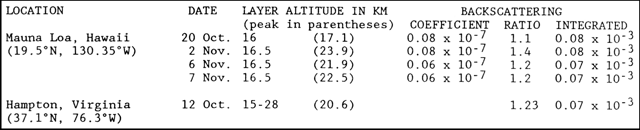 |
Figure 71. Lidar data from various locations, showing altitudes of aerosol layers during October-November 1989. Backscattering ratios are all for the ruby wavelength of 0.69 µm. Only bases of layers at Mauna Loa are shown. Integrated values show total backscatter, expressed in steradians-1, integrated over 300-m intervals from 16-33 km at Mauna Loa and from the tropopause to 30 km at Hampton. |
Enhanced twilight glows over Millville, New Jersey (39.4°N, 74.9°W) 3-5 October were described as only fairly strong, but the most impressive of the past several years.
Information Contacts: Thomas DeFoor, Mauna Loa Observatory, P.O. Box 275, Hilo, HI 96720 USA; Mary Osborn, NASA Langley Research Center, Hampton, VA 23665 USA; Fred Schaaf, RD 2, Box 248, Millville, New Jersey 08332 USA.
November 1989 (SEAN 14:11) Cite this Report
August balloon data show aerosols near tropopause
Balloon data from sampling missions over Laramie, WY showed enhanced aerosols near the tropopause on 24 August, not evident a month earlier, that had a clearly volcanic character (figure 72). By the next measurements from Wyoming on 24 October, the aerosols had apparently gone. High tropopauses (15 km on 24 July, 16 km on 24 August, and 15.5 km on 24 October) suggested that air sampled on those days (and therefore the likely source of the 24 August aerosols) was from low latitudes. The background sulfate aerosol level of about 0.5/cm3 at 20 km did not seem to have been affected.
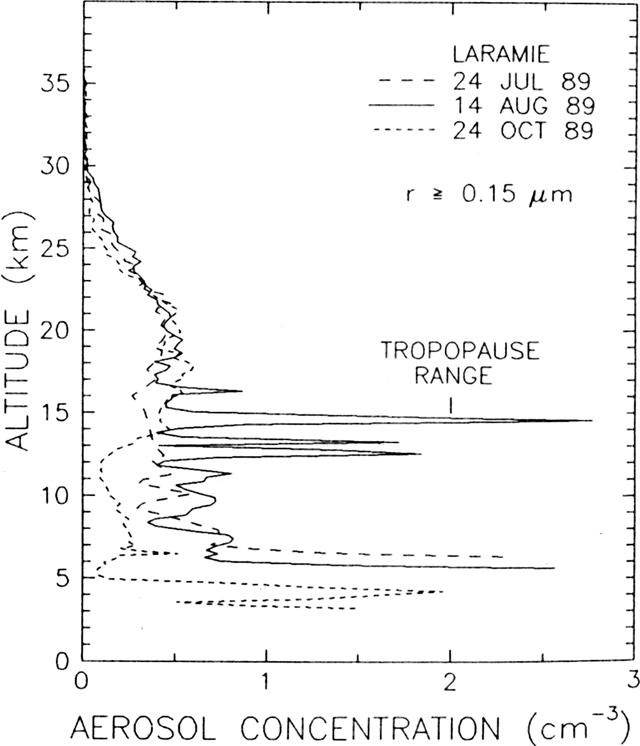 |
Figure 72. Concentrations of particles with radii greater than 0.15 µm counted from balloons launched from Laramie, WY on 24 July, 14 August, and 24 October 1989. Courtesy of David Hofmann. |
Small aerosol enhancements were detected in the lower stratosphere over Garmisch-Partenkirchen, West Germany in mid-November. Stratospheric aerosols have remained at background levels at Mauna Loa, Hawaii since observations resumed there on 20 October following a period of cloudy weather.
Information Contacts: David Hofmann, Department of Physics and Astronomy, University of Wyoming, Laramie, WY 82071 USA; Horst Jäger, Fraunhofer-Institut für Atmosphärische Umweltforschung, Kreuzeckbahnstrasse 19, D-8100 Garmisch-Partenkirchen, West Germany; Thomas DeFoor, Mauna Loa Observatory, P.O. Box 275, Hilo, HI 96720 USA.
December 1989 (SEAN 14:12) Cite this Report
Aerosols, probably from Redoubt, seen over Germany
Lidar data from Germany and an unusual sunrise over Colorado indicated apparent new aerosol layers, probably from the explosive activity at Redoubt, Alaska, that began 14 December [but see caution in 15:1].
Lidar profiles at Garmisch-Partenkirchen, West Germany (figure 73) remained similar to previous measurements through 19 December. On 23 December, strong signals were detected below and between the local tropopauses at 9.4 and 13.6 km, and enhanced backscattering extended up to about 17 km. The next measurement, on 25 December, showed moderately enhanced backscattering through the tropopause (at 11.7 km) to about 15 km altitude. On the 3 January profile, backscattering was enhanced below 12 km (tropopause at 10.5 km). No enhanced layers were evident on 9 January. No new aerosols were evident over Mauna Loa, Hawaii on 19 December or in preliminary 4 January data, suggesting that Redoubt aerosols have not yet reached lower northern latitudes.
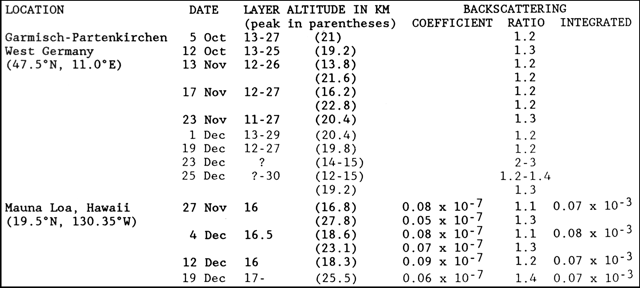 |
Figure 73. Lidar data from various locations, showing altitudes of aerosol layers during October-December 1989. Backscattering ratios are all for the ruby wavelength of 0.69 µm. Only bases of layers at Mauna Loa are shown. Integrated values show total backscatter, expressed in steradians-1, integrated over 300-m intervals from 16-33 km at Mauna Loa and from the tropopause to 30 km at Hampton. |
Richard Keen saw horizontal striations in the SE sky from Golden, Colorado early 24 December from shortly before until about an hour after sunrise. From the timing of its initial illumination, several minutes before nearby cirrus clouds were illuminated, the new material appeared to be in the upper troposphere or lower stratosphere. Aerosols were not evident on other days through 9 January. The striations appeared similar to those seen several weeks after the 1980 eruption of St. Helens (after the initial dense ash cloud had moved away) but lacked the vivid coloration of the aerosol layers from El Chichón's 1982 eruption.
Information Contacts: Horst Jäger, Fraunhofer-Institut für Atmosphärische Umweltforschung, Kreuzeckbahnstrasse 19, D-8100 Garmisch-Partenkirchen, West Germany; Thomas DeFoor, Mauna Loa Observatory, P.O. Box 275, Hilo, HI 96720 USA; Richard Keen, 34296 Gap Road, Golden, CO 80403 USA.