Recently Published Bulletin Reports
Agung (Indonesia) Three eruptive events reported in April, May, and December 2022
Tengger Caldera (Indonesia) Minor ash emission in December 2023; persistent weak thermal anomaly in the Bromo crater
Saunders (United Kingdom) Persistent thermal anomalies from the summit crater lava lake during February 2023-January 2024
Shishaldin (United States) New eruption with significant Strombolian explosions, ash plumes, and ashfall
Ioto (Japan) New eruption with discolored water, ejecta, and floating pumice during October-December 2023
Purace (Colombia) Gas-and-ash emission on 16 November 2023
Etna (Italy) Strombolian explosions, lava fountains, and lava flows during July-August 2023
Suwanosejima (Japan) Eruption plumes, crater incandescence, and occasional explosions during July-October 2023
Aira (Japan) Explosions, ash plumes, ash fall, and crater incandescence during July-October 2023
Nishinoshima (Japan) Gray emissions during October 2023
Kilauea (United States) Strong lava fountains, lava flows, and spatter at Halema’uma’u during January-September 2023
Tinakula (Solomon Islands) Continued lava flows and thermal activity during June through November 2023
Agung (Indonesia) — January 2024  Cite this Report
Agung
Indonesia
8.343°S, 115.508°E; summit elev. 2997 m
All times are local (unless otherwise noted)
Three eruptive events reported in April, May, and December 2022
Mount Agung, located on the E end of the island of Bali, Indonesia, rises above the SE rim of the Batur caldera. The summit area extends 1.5 km E-W, with the highest point on the W and a steep-walled 800-m-wide crater on the E. Recorded eruptions date back to the early 19th century. A large and deadly explosive and effusive eruption occurred during 1963-64, which was characterized by voluminous ashfall, pyroclastic flows, and lahars that caused extensive damage and many fatalities. More recent activity was documented during November 2017-June 2019 that consisted of multiple explosions, significant ash plumes, lava flows at the summit crater, and incandescent ejecta. This report covers activity reported during April-May 2022 and December 2022 based on data from the Darwin Volcanic Ash Advisory Center (VAAC).
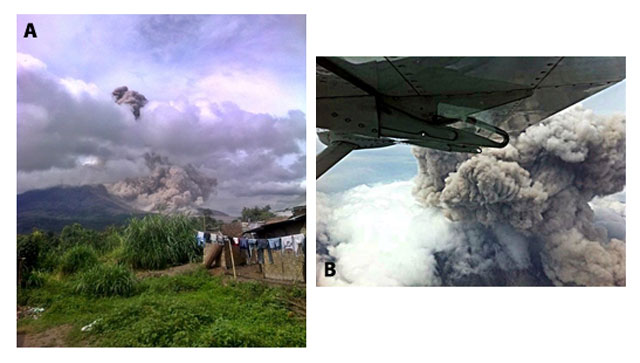
Activity during 2022 was relatively low and mainly consisted of a few ash plumes during April-May and December. An ash plume on 3 April rising to 3.7 km altitude (700 m above the summit) and drifting N was reported in a Darwin VAAC notice based on a ground report, with ash seen in HIMAWARI-8 visible imagery. Another ash plume was reported at 1120 on 27 May that rose to 5.5 km altitude (2.5 m above the summit); the plume was not visible in satellite or webcam images due to weather clouds. An eruption was reported based on seismic data at 0840 on 13 December, with an estimated plume altitude of 3.7 km; however, no ash was seen using satellite imagery in clear conditions before weather clouds obscured the summit.
Geologic Background. Symmetrical Agung stratovolcano, Bali's highest and most sacred mountain, towers over the eastern end of the island. The volcano, whose name means "Paramount," rises above the SE rim of the Batur caldera, and the northern and southern flanks extend to the coast. The summit area extends 1.5 km E-W, with the high point on the W and a steep-walled 800-m-wide crater on the E. The Pawon cone is located low on the SE flank. Only a few eruptions dating back to the early 19th century have been recorded in historical time. The 1963-64 eruption, one of the largest in the 20th century, produced voluminous ashfall along with devastating pyroclastic flows and lahars that caused extensive damage and many fatalities.
Information Contacts: Darwin Volcanic Ash Advisory Centre (VAAC), Bureau of Meteorology, Northern Territory Regional Office, PO Box 40050, Casuarina, NT 0811, Australia (URL: http://www.bom.gov.au/info/vaac/).
Tengger Caldera (Indonesia) — February 2024 Cite this Report
Tengger Caldera
Indonesia
7.942°S, 112.95°E; summit elev. 2329 m
All times are local (unless otherwise noted)
Minor ash emission in December 2023; persistent weak thermal anomaly in the Bromo crater
Tengger Caldera, located at the N end of a volcanic massif in Indonesia’s East Java, consists of five overlapping stratovolcanoes. The youngest and only active cone in the 16-km-wide caldera is Bromo, which typically produces gas-and-steam plumes, occasional ash plumes and explosions, and weak thermal signals (BGVN 44:05, 47:01). This report covers activity during January 2022-December 2023, consisting of mostly white gas-and-steam emissions and persistent weak thermal anomalies. Information was provided by the Pusat Vulkanologi dan Mitigasi Bencana Geologi (PVMBG, also known as Indonesian Center for Volcanology and Geological Hazard Mitigation, CVGHM) and satellite imagery. The Alert Level remained at 2 (on a scale of 1-4), and visitors were warned to stay at least 1 km from the crater.
Activity was generally low during the reporting period, similar to that in 2021. According to almost daily images from MAGMA Indonesia (a platform developed by PVMBG), white emissions and plumes rose from 50 to 900 m above the main crater during this period (figure 24). During several days in March and June 2022, white plumes reached heights of 1-1.2 km above the crater.
After an increase in activity at 2114 on 3 February 2023, a PVMBG team that was sent to observe white emissions rising as high as 300 m during 9-12 February and heard rumbling noises. A sulfur dioxide odor was also strong near the crater and measurements indicated that levels were above the healthy (non-hazardous) threshold of 5 parts per million; differential optical absorption spectroscopy (DOAS) measurements indicated an average flux of 190 metric tons per day on 11 February. Incandescence originating from a large fumarole in the NNW part of the crater was visible at night. The team observed that vegetation on the E caldera wall was yellow and withered. The seismic network recorded continuous tremor and deep and shallow volcanic earthquakes.
According to a PVMBG press release, activity increased on 13 December 2023 with white, gray, and brown emissions rising as high as 900 m above Bromo’s crater rim and drifting in multiple directions (figure 25). The report noted that tremor was continuous and was accompanied in December by three volcanic earthquakes. Deformation data indicated inflation in December. There was no observable difference in the persistent thermal anomaly in the crater between 11 and 16 December 2023.
All clear views of the Bromo crater throughout this time, using Sentinel-2 infrared satellite images, showed a weak persistent thermal anomaly; none of the anomalies were strong enough to cause MODVOLC Thermal Alerts. A fire in the SE part of the caldera in early September 2023 resulted in a brief period of strong thermal anomalies.
Geologic Background. The 16-km-wide Tengger caldera is located at the northern end of a volcanic massif extending from Semeru volcano. The massive volcanic complex dates back to about 820,000 years ago and consists of five overlapping stratovolcanoes, each truncated by a caldera. Lava domes, pyroclastic cones, and a maar occupy the flanks of the massif. The Ngadisari caldera at the NE end of the complex formed about 150,000 years ago and is now drained through the Sapikerep valley. The most recent of the calderas is the 9 x 10 km wide Sandsea caldera at the SW end of the complex, which formed incrementally during the late Pleistocene and early Holocene. An overlapping cluster of post-caldera cones was constructed on the floor of the Sandsea caldera within the past several thousand years. The youngest of these is Bromo, one of Java's most active and most frequently visited volcanoes.
Information Contacts: Pusat Vulkanologi dan Mitigasi Bencana Geologi (PVMBG, also known as Indonesian Center for Volcanology and Geological Hazard Mitigation, CVGHM), Jalan Diponegoro 57, Bandung 40122, Indonesia (URL: http://www.vsi.esdm.go.id/); MAGMA Indonesia, Kementerian Energi dan Sumber Daya Mineral (URL: https://magma.esdm.go.id/v1); Copernicus Browser, Copernicus Data Space Ecosystem, European Space Agency (URL: https://dataspace.copernicus.eu/browser/); Hawai'i Institute of Geophysics and Planetology (HIGP) - MODVOLC Thermal Alerts System, School of Ocean and Earth Science and Technology (SOEST), Univ. of Hawai'i, 2525 Correa Road, Honolulu, HI 96822, USA (URL: http://modis.higp.hawaii.edu/).
Saunders (United Kingdom) — February 2024 Cite this Report
Saunders
United Kingdom
57.8°S, 26.483°W; summit elev. 843 m
All times are local (unless otherwise noted)
Persistent thermal anomalies from the summit crater lava lake during February 2023-January 2024
Saunders is one of eleven islands that comprise the South Sandwich Islands in the South Atlantic. The active Mount Michael volcano has been in almost continuous eruption since November 2014 (BGVN 48:02). Recent activity has resulted in intermittent thermal anomalies and gas-and-steam emissions (BGVN 47:03, 48:02). Visits are infrequent due to its remote location, and cloud cover often prevents satellite observations. Satellite thermal imagery and visual observation of incandescence during a research expedition in 2019 (BGVN 28:02 and 44:08) and a finding confirmed by a National Geographic Society research team that summited Michael in November 2022 reported the presence of a lava lake.
Although nearly constant cloud cover during February 2023 through January 2024 greatly limited satellite observations, thermal anomalies from the lava lake in the summit crater were detected on clear days, especially around 20-23 August 2023. Anomalies similar to previous years (eg. BGVN 48:02) were seen in both MIROVA (Middle InfraRed Observation of Volcanic Activity) data from MODIS instruments and in Sentinel 2 infrared imagery. The only notable sulfur dioxide plume detected near Saunders was on 25 September 2023, with the TROPOMI instrument aboard the Sentinel-5P satellite.
Geologic Background. Saunders Island consists of a large central volcanic edifice intersected by two seamount chains, as shown by bathymetric mapping (Leat et al., 2013). The young Mount Michael stratovolcano dominates the glacier-covered island, while two submarine plateaus, Harpers Bank and Saunders Bank, extend north. The symmetrical Michael has a 500-m-wide summit crater and a remnant of a somma rim to the SE. Tephra layers visible in ice cliffs surrounding the island are evidence of recent eruptions. Ash clouds were reported from the summit crater in 1819, and an effusive eruption was inferred to have occurred from a N-flank fissure around the end of the 19th century and beginning of the 20th century. A low ice-free lava platform, Blackstone Plain, is located on the north coast, surrounding a group of former sea stacks. A cluster of cones on the SE flank, the Ashen Hills, appear to have been modified since 1820 (LeMasurier and Thomson, 1990). Analysis of satellite imagery available since 1989 (Gray et al., 2019; MODVOLC) suggests frequent eruptive activity (when weather conditions allow), volcanic clouds, steam plumes, and thermal anomalies indicative of a persistent, or at least frequently active, lava lake in the summit crater. Due to this observational bias, there has been a presumption when defining eruptive periods that activity has been ongoing unless there is no evidence for at least 10 months.
Information Contacts: MIROVA (Middle InfraRed Observation of Volcanic Activity), a collaborative project between the Universities of Turin and Florence (Italy) supported by the Centre for Volcanic Risk of the Italian Civil Protection Department (URL: http://www.mirovaweb.it/); NASA Global Sulfur Dioxide Monitoring Page, Atmospheric Chemistry and Dynamics Laboratory, NASA Goddard Space Flight Center (NASA/GSFC), 8800 Greenbelt Road, Goddard MD 20771, USA (URL: https://so2.gsfc.nasa.gov/); Copernicus Browser (URL: https://dataspace.copernicus.eu/browser).
Shishaldin (United States) — December 2023 Cite this Report
Shishaldin
United States
54.756°N, 163.97°W; summit elev. 2857 m
All times are local (unless otherwise noted)
New eruption with significant Strombolian explosions, ash plumes, and ashfall
Shishaldin is located on the eastern half of Unimak Island, one of the Aleutian Islands. Frequent explosive activity, primarily consisting of Strombolian ash eruptions from the small summit crater, but sometimes producing lava flows, has been recorded since the 18th century. The previous eruption ended in May 2020 and was characterized by intermittent thermal activity, increased seismicity and surface temperatures, ash plumes, and ash deposits (BGVN 45:06). This report covers a new eruption during July through November 2023, which consisted of significant explosions, ash plumes, ashfall, and lava fountaining. Information comes from daily, weekly, and special reports from the Alaska Volcano Observatory (AVO) and various satellite data. AVO monitors the volcano using local seismic and infrasound sensors, satellite data, web cameras, and remote infrasound and lightning networks.
AVO reported that intermittent tremor and low-frequency earthquakes had gradually become more regular and consistent during 10-13 July. Strongly elevated surface temperatures at the summit were identified in satellite images during 10-13 July. On 11 July AVO raised the Aviation Color Code (ACC) to Yellow (the second color on a four-color scale) and Volcano Alert Level (VAL) to Advisory (the second level on a four-level scale) at 1439. Later in the day on 11 July summit crater incandescence was observed in webcam images. Observations of the summit suggested that lava was likely present at the crater, which prompted AVO to raise the ACC to Orange (the second highest color on a four-color scale) and the VAL to Watch (the second highest level on a four-level scale). The US Coast Guard conducted an overflight on 12 July and confirmed that lava was erupting from the summit. That same day, sulfur dioxide emissions were detected in satellite images.
A significant explosion began at 0109 on 14 July that produced an ash plume that rose to 9-12 km altitude and drifted S over the Pacific Ocean (figure 43). Webcam images and photos taken around 0700 from a ship SW off Unimak Island showed small lahar deposits, which were the result of the interaction of hot pyroclastic material and snow and ice on the flanks. There was also ashfall on the SW and N flanks. A smaller explosion at 0710 generated an ash plume that rose to 4.5 km altitude. Webcam images and pilot reports showed continued low-level ash emissions during the morning, rising to less than 4.6 km altitude; those emissions included a small ash plume near the summit around 1030 resulting from a small explosion.
Seismic tremor amplitude began increasing at around 1700 on 15 July; strongly elevated surface temperatures were also reported. An ash plume rose to 4.6 km altitude and drifted SSE at 2100, based on a satellite image. A continuous ash plume during 2150 through 2330 rose to 5 km altitude and extended 125 km S. At 2357 AVO raised the ACC to Red (the highest color on a four-color scale) and the VAL to Warning (the highest level on a four-level scale), noting that seismicity remained elevated for more than six hours and explosion signals were frequently detected by regional infrasound (pressure sensor) networks. Explosions generated an ash plume that rose to 4.9 km altitude and drifted as far as 500 km SE. Activity throughout the night declined and by 0735 the ACC was lowered to Orange and the VAL to Watch. High-resolution satellite images taken on 16 July showed pyroclastic deposits extending as far as 3 km from the vent; these deposits generated lahars that extended further down the drainages on the flanks. Ash deposits were mainly observed on the SSE flank and extended to the shore of Unimak Island. During 16-17 July lava continued to erupt at the summit, which caused strongly elevated surface temperatures that were visible in satellite imagery.
Lava effusion increased at 0100 on 18 July, as noted in elevated surface temperatures identified in satellite data, increasing seismic tremor, and activity detected on regional infrasound arrays. A significant ash plume at 0700 rose to 7 km altitude and continued until 0830, eventually reaching 9.1 km altitude and drifting SSE (figure 44). As a result, the ACC was raised to Red and the VAL to Warning. By 0930 the main plume detached, but residual low-level ash emissions continued for several hours, remaining below 3 km altitude and drifting S. The eruption gradually declined and by 1208 the ACC was lowered to Orange and the VAL was lowered to Watch. High-resolution satellite images showed ash deposits on the SW flank and pyroclastic deposits on the N, E, and S flanks, extending as far as 3 km from the vent; lahars triggered by the eruption extended farther down the flanks (figure 45). Lava continued to erupt from the summit crater on 19 July.
Elevated surface temperatures were detected in satellite images during 19-25 July, despite occasional weather cloud cover, which was consistent with increased lava effusion. During 22-23 July satellite observations acquired after the eruption from 18 July showed pyroclastic flow and lahar deposits extending as far as 3 km down the N, NW, and NE flanks and as far as 1.5 km down the S and SE flanks. Ash deposits covered the SW and NE flanks. No lava flows were observed outside the crater. On 22 July a sulfur dioxide plume was detected in satellite data midday that had an estimated mass of 10 kt. In a special notice issued at 1653 on 22 July AVO noted that eruptive activity had intensified over the previous six hours, which was characterized by an hours-long steady increase in seismic tremor, intermittent infrasound signals consistent with small explosions, and an increase in surface temperatures that were visible in satellite data. Pilots first reported low-level ash plumes at around 1900. At 2320 an ash plume had risen to 9 km altitude based on additional pilot reports and satellite images. The ACC was increased to Red and the VAL to Warning at 2343. Satellite images indicated growth of a significantly higher ash plume that rose to 11 km altitude continued until 0030 and drifted NE. During the early morning hours of 23 July ash plumes had declined to 4.6 k altitude. Seismic tremor peaked at 0030 on 23 July and began to rapidly decline at 0109; active ash emissions were no longer visible in satellite data by 0130. The ACC was lowered to Orange and the VAL to Watch at 0418; bursts of increased seismicity were recorded throughout the morning, but seismicity generally remained at low levels. Elevated surface temperatures were visible in satellite data until about 0600. On 24 July pilots reported seeing vigorous gas-and-steam plumes rising to about 3 km altitude; the plumes may have contained minor amounts of ash.
During 24-25 July low level seismicity and volcanic tremor were detected at low levels following the previous explosion on 23 July. Strongly elevated surface temperatures were observed at the summit crater in satellite data. Around 2200 on 25 July seismicity began to increase, followed by infrasound signals of explosions after 0200 on 26 July. An ash plume rose to 3 km altitude at 0500 and drifted ENE, along with an associated sulfur dioxide plume that drifted NE and had an estimated mass of 22 kt. Diffuse ash emissions were visible in satellite data and rose to 6.1-7.6 km altitude and extended 125 km from the volcano starting around 1130. These ash events were preceded by about seven hours of seismic tremor, infrasound detections of explosions, and five hours of increased surface temperatures visible in satellite data. Activity began to decline around 1327, which included low-frequency earthquakes and decreased volcanic tremor, and infrasound data no longer detected significant explosions. Surface temperatures remained elevated through the end of the month.
Seismicity, volcanic tremor, and ash emissions remained at low levels during early August. Satellite images on 1 August showed that some slumping had occurred on the E crater wall due to the recent explosive activity. Elevated surface temperatures continued, which was consistent with cooling lava. On 2 August small explosive events were detected, consistent with low-level Strombolian activity. Some episodes of volcanic tremor were reported, which reflected low-level ash emissions. Those ash emissions rose to less than 3 km altitude and drifted as far as 92.6 km N. Pilots that were located N of the volcano observed an ash plume that rose to 2.7 km altitude. Seismicity began to increase in intensity around 0900 on 3 August. Seismicity continued to increase throughout the day and through the night with strongly elevated surface temperatures, which suggested that lava was active at the surface.
An ash cloud that rose to 7.6-7.9 km altitude and drifted 60-75 km NE was visible in a satellite image at 0520 on 4 August. Pilots saw and reported the plume at 0836 (figure 46). By 0900 the plume had risen to 9.1 km altitude and extended over 100 km NE. AVO raised the ACC to Red and the VAL to Warning as a result. Seismic tremor levels peaked at 1400 and then sharply declined at 1500 to slightly elevated levels; the plume was sustained during the period of high tremor and drifted N and NE. The ACC was lowered to Orange and the VAL to Watch at 2055. During 5-14 August seismicity remained low and surface temperatures were elevated based on satellite data due to cooling lava. On 9 August a small lava flow was observed that extended from the crater rim to the upper NE flank. It had advanced to 55 m in length and appeared in satellite imagery on 11 August. Occasional gas-and-steam plumes were noted in webcam images. At 1827 AVO noted that seismic tremor had steadily increased during the afternoon and erupting lava was visible at the summit in satellite images.
Strong explosion signals were detected at 0200 on 15 August. An ash cloud that was visible in satellite data extended 100 km NE and may have risen as high as 11 km altitude around 0240. By 0335 satellite images showed the ash cloud rising to 7.6 km altitude and drifting NE. Significant seismicity and explosions were detected by the local AVO seismic and infrasound networks, and volcanic lightning was detected by the World Wide Lightning Location Network (WWLLN). A sulfur dioxide plume associated with the eruption drifted over the S Bering Sea and parts of Alaska and western Canada. Seismicity was significantly elevated during the eruption but had declined by 1322. A pilot reported that ash emissions continued, rising as high as 4.9 km altitude. Elevated surface temperatures detected in satellite data were caused by hot, eruptive material (pyroclastic debris and lava) that accumulated around the summit. Eruptive activity declined by 16 August and the associated sulfur dioxide plume had mostly dissipated; remnants continued to be identified in satellite images at least through 18 August. Surface temperatures remained elevated based on satellite images, indicating hot material on the upper parts of the volcano. Small explosions were detected in infrasound data on the morning of 19 August and were consistent with pilot reports of small, short-lived ash plumes that rose to about 4.3 km altitude. Low-level explosive activity was reported during 20-24 August, according to seismic and infrasound data, and weather clouds sometimes prevented views. Elevated surface temperatures were observed in satellite images, which indicated continued hot material on the upper parts of the volcano.
Seismic tremor began to increase at around 0300 on 25 August and was followed by elevated surface temperatures identified in satellite images, consistent with erupting lava. Small explosions were recorded in infrasound data. The ACC was raised to Red and the VAL to Warning at 1204 after a pilot reported an ash plume that rose to 9.1 km altitude. Seismicity peaked at 1630 and began to rapidly decline at around 1730. Ash plumes rose as high as 10 km altitude and drifted as far as 400 km NE. By 2020 the ash plumes had declined to 6.4 km altitude and continued to drift NE. Ash emissions were visible in satellite data until 0000 on 26 August and seismicity was at low levels. AVO lowered the ACC to Orange and the VAL to Watch at 0030. Minor explosive activity within the summit crater was detected during 26-28 August and strongly elevated surface temperatures were still visible in satellite imagery through the rest of the month. An AVO field crew working on Unimak Island observed a mass flow that descended the upper flanks beginning around 1720 on 27 August. The flow produced a short-lived ash cloud that rose to 4.5 km altitude and rapidly dissipated. The mass flow was likely caused by the collapse of spatter that accumulated on the summit crater rim.
Similar variable explosive activity was reported in September, although weather observations sometimes prevented observations. A moderate resolution satellite image from the afternoon of 1 September showed gas-and-steam emissions filling the summit crater and obscuring views of the vent. In addition, hot deposits from the previous 25-26 August explosive event were visible on the NE flank near the summit, based on a 1 September satellite image. On 2 and 4 September seismic and infrasound data showed signals of small, repetitive explosions. Variable gas-and-steam emissions from the summit were visible but there was no evidence of ash. Possible summit crater incandescence was visible in nighttime webcam images during 3-4 September.
Seismicity began to gradually increase at around 0300 on 5 September and activity escalated at around 0830. A pilot reported an ash plume that rose to 7.6 km altitude at 0842 and continued to rise as high as possibly 9.7 km altitude and drifted SSE based on satellite images (figure 47). The ACC was raised to Red and the VAL to Warning at 0900. In addition to strong tremor and sustained explosions, the eruption produced volcanic lightning that was detected by the WWLLN. Around 1100 seismicity decreased and satellite data confirmed that the altitude of the ash emissions had declined to 7.6 km altitude. By 1200 the lower-altitude portion of the ash plume had drifted 125 km E. Significant ash emissions ended by 1330 based on webcam images. The ACC was lowered to Orange and the VAL to Watch at 1440. Satellite images showed extensive pyroclastic debris flows on most of the flanks that extended 1.2-3.3 km from the crater rim.
During 6-13 September elevated surface temperatures continued to be observed in satellite data, seismicity remained elevated with weak but steady tremor, and small, low-frequency earthquakes and small explosions were reported, except on 12 September. On 6 September a low-level ash plume rose to 1.5-1.8 km altitude and drifted SSE. Occasional small and diffuse gas-and-steam emissions at the summit were visible in webcam images. Around 1800 on 13 September seismic tremor amplitudes began to increase, and small explosions were detected in seismic and infrasound data. Incandescent lava at the summit was seen in a webcam image taken at 0134 on 14 September during a period of elevated tremor. No ash emissions were reported during the period of elevated seismicity. Lava fountaining began around 0200, based on webcam images. Satellite-based radar observations showed that the lava fountaining activity led to the growth of a cone in the summit crater, which refilled most of the crater. By 0730 seismicity significantly declined and remained at low levels.
Seismic tremor began to increase around 0900 on 15 September and rapidly intensified. An explosive eruption began at around 1710, which prompted AVO to raise the ACC to Red and the VAL to Warning. Within about 30 minutes ash plumes drifted E below a weather cloud at 8.2 km altitude. The National Weather Service estimated that an ash-rich plume rose as high as 12.8 km altitude and produced volcanic lightning. The upper part of the ash plume detached from the vent around 1830 and drifted E, and was observed over the Gulf of Alaska. Around the same time, seismicity dramatically decreased. Trace ashfall was reported in the community of False Pass (38 km ENE) between 1800-2030 and also in King Cove and nearby marine waters. Activity declined at around 1830 although seismicity remained elevated, ash emissions, and ashfall continued until 2100. Lightning was again detected beginning around 1930, which suggested that ash emissions continued. Ongoing explosions were detected in infrasound data, at a lower level than during the most energetic phase of this event. Lightning was last detected at 2048. By 2124 the intensity of the eruption had decreased, and ash emissions were likely rising to less than 6.7 km altitude. Seismicity returned to pre-eruption levels. On 16 September the ACC was lowered to Orange and the VAL to Watch at 1244; the sulfur dioxide plume that was emitted from the previous eruption event was still visible over the northern Pacific Ocean. Elevated surface temperatures, gas-and-steam emissions from the vent, and new, small lahars were reported on the upper flanks based on satellite and webcam images. Minor deposits were reported on the flanks which were likely the result of collapse of previously accumulated lava near the summit crater.
Elevated seismicity with tremor, small earthquakes, and elevated surface temperatures were detected during 17-23 September. Minor gas-and-steam emissions were visible in webcam images. On 20 September small volcanic debris flows were reported on the upper flanks. On 21 September a small ash deposit was observed on the upper flanks extending to the NE based on webcam images. Seismic tremor increased significantly during 22-23 September. Regional infrasound sensors suggested that low-level eruptive activity was occurring within the summit crater by around 1800 on 23 September. Even though seismicity was at high levels, strongly elevated surface temperatures indicating lava at the surface were absent and no ash emissions were detected; weather clouds at 0.6-4.6 km altitude obscured views. At 0025 on 24 September AVO noted that seismicity continued at high levels and nearly continuous small infrasound signals began, likely from low-level eruptive activity. Strongly elevated surface temperatures were identified in satellite images by 0900 and persisted throughout the day; the higher temperatures along with infrasound and seismic data were consistent with lava erupting at the summit. Around 1700 similarly elevated surface temperatures were detected from the summit in satellite data, which suggested that more vigorous lava fountaining had started. Starting around 1800 low-level ash emissions rose to altitudes less than 4.6 km altitude and quickly dissipated.
Beginning at midnight on 25 September, a series of seismic signals consistent with volcanic flows were recorded on the N side of the volcano. A change in seismicity and infrasound signals occurred around 0535 and at 0540 a significant ash cloud formed and quickly reached 14 km altitude and drifted E along the Alaska Peninsula. The cloud generated at least 150 lightning strokes with thunder that could be heard by people in False Pass. Seismicity rapidly declined to near background levels around 0600. AVO increased the ACC to Red and the VAL to Warning at 0602. The ash cloud detached from the volcano at around 0700, rose to 11.6 km altitude, and drifted ESE. Trace to minor amounts of ashfall were reported by the communities of False Pass, King Cove, Cold Bay, and Sand Point around 0700. Ash emissions continued at lower altitudes of 6-7.6 km altitude at 0820. Small explosions at the vent area continued to be detected in infrasound data and likely represented low-level eruptive activity near the vent. Due to the significant decrease in seismicity and ash emissions the ACC was lowered to Orange and the VAL to Watch at 1234. Radar data showed significant collapses of the crater that occurred on 25 September. Satellite data also showed significant hot, degassing pyroclastic and lahar deposits on all flanks, including more extensive flows on the ENE and WSW sections below two new collapse scarps. Following the significant activity during 24-25 September, only low-level activity was observed. Seismicity decreased notably near the end of the strong activity on 25 September and continued to decrease through the end of the month, though tremor and small earthquakes were still reported. No explosive activity was detected in infrasound data through 2 October. Gas-and-steam emissions rose to 3.7 km altitude, as reported by pilots and seen in satellite images. Satellite data from 26 September showed that significant collapses had occurred at the summit crater and hot, steaming deposits from pyroclastic flows and lahars were present on all the flanks, particularly to the ENE and WSW. A small ash cloud was visible in webcam images on 27 September, likely from a collapse at the summit cone. High elevated surface temperatures were observed in satellite imagery during 27-28 September, which were likely the result of hot deposits on the flanks erupted on 25 September. Minor steaming at the summit crater and from an area on the upper flanks was visible in webcam images on 28 September.
During October, explosion events continued between periods of low activity. Seismicity significantly increased starting at around 2100 on 2 October; around the same time satellite images showed an increase in surface temperatures consistent with lava fountaining. Small, hot avalanches of rock and lava descended an unspecified flank. In addition, a distinct increase in infrasound, seismicity, and lightning detections was followed by an ash plume that rose to 12.2 km altitude and drifted S and E at 0520 on 3 October, based on satellite images. Nighttime webcam images showed incandescence due to lava fountaining at the summit and pyroclastic flows descending the NE flank. AVO reported that a notable explosive eruption started at 0547 and lasted until 0900 on 3 October, which prompted a rise in the ACC to Red and the VAL to Warning. Subsequent ash plumes rose to 6-7.6 km altitude by 0931. At 1036 the ACC was lowered back to Orange and the VAL to Watch since both seismic and infrasound data quieted substantially and were slightly above background levels. Gas-and-steam emissions were observed at the summit, based on webcam images. Trace amounts of ashfall were observed in Cold Bay. Resuspended ash was present at several kilometers altitude near the volcano. During the afternoon, low-level ash plumes were visible at the flanks, which appeared to be largely generated by rock avalanches off the summit crater following the explosive activity. These ash plumes rose to 3 km altitude and drifted W. Trace amounts of ashfall were reported by observers in Cold Bay and Unalaska and flights to these communities were disrupted by the ash cloud. Satellite images taken after the eruption showed evidence of pyroclastic flows and lahar deposits in drainages 2 km down the SW flank and about 3.2 km down the NE flank, and continued erosion of the crater rim. Small explosion craters at the end of the pyroclastic flows on the NE flank were noted for the first time, which may have resulted from gas-and-steam explosions when hot deposits interact with underlying ice.
During 4 October seismicity, including frequent small earthquakes, remained elevated, but was gradually declining. Ash plumes were produced for over eight hours until around 1400 that rose to below 3.7 km altitude. These ash plumes were primarily generated off the sides of the volcano where hot rock avalanches from the crater rim had entered drainages to the SW and NE. Two explosion craters were observed at the base of the NE deposits about 3.2 km from the crater rim. Webcam images showed the explosion craters were a source of persistent ash emissions; occasional collapse events also generated ash. Seismicity remained elevated with sulfur dioxide emissions that had a daily average of more than 1,000 tons per day, and frequent small earthquakes through the end of the month. Frequent elevated surface temperatures were identified in satellite images and gas-and-steam plumes were observed in webcam images, although weather conditions occasionally prevented clear views of the summit. Emissions were robust during 14-16 October and were likely generated by the interaction of hot material and snow and ice. During the afternoon of 21 October a strong gas-and-steam plume rose to 3-4.6 km altitude and extended 40 km WSW, based on satellite images and reports from pilots. On 31 October the ACC was lowered to Yellow and the VAL was lowered to Advisory.
Activity in November was characterized by elevated seismicity with ongoing seismic tremor and small, low-frequency earthquakes, elevated surface temperatures, and gas-and-steam emissions. There was an increase in seismic and infrasound tremor amplitudes starting at 1940 on 2 November. As a result, the ACC was again raised to Orange and the VAL was increased to Watch, although ash was not identified in satellite data. An ash cloud rose to 6.1 km altitude and drifted W according to satellite data at 2000. By 0831 on 3 November ash emissions were no longer visible in satellite images. On 6 and 9 November air pressure sensors detected signals consistent with small explosions. Small explosions were detected in infrasound data consistent with weak Strombolian activity on 19 and 21 November. Seismicity started to decrease on 21 November. On 25 November gas-and-steam emissions were emitted from the vent as well as from a scarp on the NE side of the volcano near the summit. A gas-and-steam plume extended about 50 km SSE and was observed in satellite and webcam images on 26 November. On 28 November small explosions were observed in seismic and local infrasound data and gas-and-steam emissions were visible from the summit and from the upper NE collapse scarp based on webcam images. Possible small explosions were observed in infrasound data on 30 November. Weakly elevated surface temperatures and a persistent gas-and-steam plume from the summit and collapse scarps on the upper flanks. A passing aircraft reported the gas-and-steam plume rose to 3-3.4 km altitude on 30 November, but no significant ash emissions were detected.
Satellite data. MODIS thermal anomaly data provided through MIROVA (Middle InfraRed Observation of Volcanic Activity) showed a strong pulse of thermal activity beginning in July 2023 that continued through November 2023 (figure 48). This strong activity was due to Strombolian explosions and lava fountaining events at the summit crater. According to data from MODVOLC thermal alerts, a total of 101 hotspots were detected near the summit crater in July (11-14, 16-19, 23-24 and 26), August (4, 25-26, and 29), September (5, 12, and 17), and October (3, 4, and 8). Infrared satellite data showed large lava flows descending primarily the northern and SE flanks during the reporting period (figure 49). Sulfur dioxide plumes often exceeded two Dobson Units (DUs) and drifted in different directions throughout the reporting period, based on satellite data from the TROPOMI instrument on the Sentinel-5P satellite (figure 50).
Geologic Background. The symmetrical glacier-covered Shishaldin in the Aleutian Islands is the westernmost of three large stratovolcanoes in the eastern half of Unimak Island. The Aleuts named the volcano Sisquk, meaning "mountain which points the way when I am lost." Constructed atop an older glacially dissected edifice, it is largely basaltic in composition. Remnants of an older edifice are exposed on the W and NE sides at 1,500-1,800 m elevation. There are over two dozen pyroclastic cones on its NW flank, which is covered by massive aa lava flows. Frequent explosive activity, primarily consisting of Strombolian ash eruptions from the small summit crater, but sometimes producing lava flows, has been recorded since the 18th century. A steam plume often rises from the summit crater.
Information Contacts: Alaska Volcano Observatory (AVO), a cooperative program of a) U.S. Geological Survey, 4200 University Drive, Anchorage, AK 99508-4667 USA (URL: https://avo.alaska.edu/), b) Geophysical Institute, University of Alaska, PO Box 757320, Fairbanks, AK 99775-7320, USA, and c) Alaska Division of Geological & Geophysical Surveys, 794 University Ave., Suite 200, Fairbanks, AK 99709, USA (URL: http://dggs.alaska.gov/); MIROVA (Middle InfraRed Observation of Volcanic Activity), a collaborative project between the Universities of Turin and Florence (Italy) supported by the Centre for Volcanic Risk of the Italian Civil Protection Department (URL: http://www.mirovaweb.it/); Hawai'i Institute of Geophysics and Planetology (HIGP) - MODVOLC Thermal Alerts System, School of Ocean and Earth Science and Technology (SOEST), Univ. of Hawai'i, 2525 Correa Road, Honolulu, HI 96822, USA (URL: http://modis.higp.hawaii.edu/); NASA Global Sulfur Dioxide Monitoring Page, Atmospheric Chemistry and Dynamics Laboratory, NASA Goddard Space Flight Center (NASA/GSFC), 8800 Greenbelt Road, Goddard, Maryland, USA (URL: https://so2.gsfc.nasa.gov/); Copernicus Browser, Copernicus Data Space Ecosystem, European Space Agency (URL: https://dataspace.copernicus.eu/browser/).
Ioto
Japan
24.751°N, 141.289°E; summit elev. 169 m
All times are local (unless otherwise noted)
New eruption with discolored water, ejecta, and floating pumice during October-December 2023
Ioto (Iwo-jima), located about 1,200 km S of Tokyo, lies within a 9-km-wide submarine caldera along the Izu-Bonin-Mariana volcanic arc. Previous eruptions date back to 1889 and have consisted of dominantly phreatic explosions, pumice deposits during 2001, and discolored water. A submarine eruption during July through December 2022 was characterized by discolored water, pumice deposits, and gas emissions (BGVN 48:01). This report covers a new eruption during October through December 2023, which consisted of explosions, black ejecta, discolored water, and floating pumice, based on information from the Japan Meteorological Association (JMA), the Japan Coast Guard (JCG), and satellite data.
JMA reported that an eruption had been occurring offshore of Okinahama on the SE side of the island since 21 October, which was characterized by volcanic tremor, according to the Japan Maritime Self-Defense Force (JMSDF) Iwo Jima Air Base (figure 22). According to an 18 October satellite image a plume of discolored water at the site of this new eruption extended NE (figure 23). During an overflight conducted on 30 October, a vent was identified about 1 km off the coast of Okinahama. Observers recorded explosions every few minutes that ejected dark material about 20 m above the ocean and as high as 150 m. Ejecta from the vent formed a black-colored island about 100 m in diameter, according to observations conducted from the air by the Earthquake Research Institute of the University of Tokyo in cooperation with the Mainichi newspaper (figure 24). Occasionally, large boulders measuring more than several meters in size were also ejected. Observations from the Advanced Land Observing Satellite Daichi-2 and Sentinel-2 satellite images also confirmed the formation of this island (figure 23). Brown discolored water and floating pumice were present surrounding the island.
The eruption continued during November. During an overflight on 3 November observers photographed the island and noted that material was ejected 169 m high, according to a news source. Explosions gradually became shorter, and, by the 3rd, they occurred every few seconds; dark and incandescent material were ejected about 800 m above the vent. On 4 November eruptions were accompanied by explosive sounds. Floating, brown-colored pumice was present in the water surrounding the island. There was a brief increase in the number of volcanic earthquakes during 8-14 November and 24-25 November. The eruption temporarily paused during 9-11 November and by 12 November eruptions resumed to the W of the island. On 10 November dark brown-to-dark yellow-green discolored water and a small amount of black floating material was observed (figure 25). A small eruption was reported on 18 November off the NE coast of the island, accompanied by white gas-and-steam plumes (figure 23). Another pause was recorded during 17-19 November, which then resumed on 20 November and continued erupting intermittently. According to a field survey conducted by the National Institute for Disaster Prevention Science and Technology on 19 November, a 30-m diameter crater was visible on the NE coast where landslides, hot water, and gray volcanic ash containing clay have occurred and been distributed previously. Erupted blocks about 10 cm in diameter were distributed about 90-120 m from the crater. JCG made observations during an overflight on 23 November and reported a phreatomagmatic eruption. Explosions at the main vent generated dark gas-and-ash plumes that rose to 200 m altitude and ejected large blocks that landed on the island and in the ocean (figure 26). Discolored water also surrounded the island. The size of the new island had grown to 450 m N-S x 200 m E-W by 23 November, according to JCG.
The eruption continued through 11 December, followed by a brief pause in activity, which then resumed on 31 December, according to JMA. Intermittent explosions produced 100-m-high black plumes at intervals of several minutes to 30 minutes during 1-10 December. Overflights were conducted on 4 and 15 December and reported that the water surrounding the new island was discolored to dark brown-to-dark yellow-green (figure 27). No floating material was reported during this time. In comparison to the observations made on 23 November, the new land had extended N and part of it had eroded away. In addition, analysis by the Geospatial Information Authority of Japan using SAR data from Daichi-2 also confirmed that the area of the new island continued to decrease between 4 and 15 December. Ejected material combined with wave erosion transformed the island into a “J” shape, 500-m-long and with the curved part about 200 m offshore of Ioto. The island was covered with brown ash and blocks, and the surrounding water was discolored to greenish-brown and contained an area of floating pumice. JCG reported from an overflight on 4 December that volcanic ash-like material found around the S vent on the NE part of the island was newly deposited since 10 November (figure 28). By 15 December the N part of the “J” shaped island had separated and migrated N, connecting to the Okinahama coast and the curved part of the “J” had eroded into two smaller islands (figure 27).
References. Ukawa, M., Fujita, E., Kobayashi, T., 2002, Recent volcanic activity of Iwo Jima and the 2001 eruption, Monthly Chikyu, Extra No. 39, 157-164.
Geologic Background. Ioto, in the Volcano Islands of Japan, lies within a 9-km-wide submarine caldera. The volcano is also known as Ogasawara-Iojima to distinguish it from several other "Sulfur Island" volcanoes in Japan. The triangular, low-elevation, 8-km-long island narrows toward its SW tip and has produced trachyandesitic and trachytic rocks that are more alkalic than those of other volcanoes in this arc. The island has undergone uplift for at least the past 700 years, accompanying resurgent doming of the caldera; a shoreline landed upon by Captain Cook's surveying crew in 1779 is now 40 m above sea level. The Motoyama plateau on the NE half of the island consists of submarine tuffs overlain by coral deposits and forms the island's high point. Many fumaroles are oriented along a NE-SW zone cutting through Motoyama. Numerous recorded phreatic eruptions, many from vents on the W and NW sides of the island, have accompanied the uplift.
Information Contacts: Japan Meteorological Agency (JMA), 1-3-4 Otemachi, Chiyoda-ku, Tokyo 100-8122, Japan (URL: http://www.jma.go.jp/jma/indexe.html); Japan Coast Guard (JCG) Volcano Database, Hydrographic and Oceanographic Department, 3-1-1, Kasumigaseki, Chiyoda-ku, Tokyo 100-8932, Japan (URL: https://www1.kaiho.mlit.go.jp/GIJUTSUKOKUSAI/kaiikiDB/kaiyo22-2.htm); Copernicus Browser, Copernicus Data Space Ecosystem, European Space Agency (URL: https://dataspace.copernicus.eu/browser/); Asahi, 5-3-2, Tsukiji, Chuo Ward, Tokyo, 104-8011, Japan (URL: https://www.asahi.com/ajw/articles/15048458).
Purace (Colombia) — December 2023 Cite this Report
Purace
Colombia
2.3095°N, 76.3948°W; summit elev. 4650 m
All times are local (unless otherwise noted)
Gas-and-ash emission on 16 November 2023
Puracé, located in Colombia, is a stratovolcano that contains a 500-m-wide summit crater. It is part of the Los Coconucos volcanic chain that is a NW-SE trending group of seven cones and craters. The most recent eruption occurred during March 2022 that was characterized by frequent seismicity and gas-and-steam emissions (BGVN 47:06). This report covers a brief eruption during November 2023 based on monthly reports from the Popayán Observatory, part of the Servicio Geologico Colombiano (SGC).
Activity during November 2022 through November 2023 primarily consisted of seismicity: VT-type events, LP-type events, HB-type events, and TR-type events (table 4). Maximum sulfur dioxide values were measured weekly and ranged from 259-5,854 tons per day (t/d) during November 2022 through April 2023. White gas-and-steam emissions were also occasionally reported.
SGC issued a report on 25 October that noted a significant increase in the number of earthquakes associated with rock fracturing. These earthquakes were located SE of the crater between Puracé and Piocollo at depths of 1-4 km. There were no reported variations in sulfur dioxide values, but SGC noted high carbon dioxide values, compared to those recorded in the first half of 2023.
SGC reported that at 1929 on 16 November the seismic network detected a signal that was possibly associated with a gas-and-ash emission, though it was not confirmed in webcam images due to limited visibility. On 17 November an observer confirmed ash deposits on the N flank. Webcam images showed an increase in degassing both inside the crater and from the NW flank, rising 700 m above the crater.
Table 4. Seismicity at Puracé during November 2022-November 2023. Volcano-tectonic (VT), long-period (LP), hybrid (HB), and tremor (TR) events are reported each month. Courtesy of SGC.
| Month |
Volcano-tectonic |
Long-period |
Hybrid |
Tremor |
| Nov 2022 |
429 |
2,023 |
5 |
831 |
| Dec 2022 |
423 |
1,390 |
9 |
834 |
| Jan 2023 |
719 |
1,622 |
0 |
957 |
| Feb 2023 |
598 |
1,701 |
2 |
1,124 |
| Mar 2023 |
331 |
2,408 |
147 |
607 |
| Apr 2023 |
614 |
4,427 |
33 |
148 |
| May 2023 |
620 |
3,717 |
170 |
109 |
| Jun 2023 |
467 |
3,293 |
86 |
148 |
| Jul 2023 |
1,116 |
5,809 |
183 |
542 |
| Aug 2023 |
692 |
2,927 |
94 |
321 |
| Sep 2023 |
887 |
1,505 |
82 |
848 |
| Oct 2023 |
2,373 |
2,949 |
135 |
692 |
| Nov 2023 |
1,212 |
2,302 |
69 |
293 |
Geologic Background. Puracé is an active andesitic volcano with a 600-m-diameter summit crater at the NW end of the Los Coconucos Volcanic Chain. This volcanic complex includes nine composite and five monogenetic volcanoes, extending from the Puracé crater more than 6 km SE to the summit of Pan de Azúcar stratovolcano. The dacitic massif which the complex is built on extends about 13 km NW-SE and 10 km NE-SW. Frequent small to moderate explosive eruptions reported since 1816 CE have modified the morphology of the summit crater, with the largest eruptions in 1849, 1869, and 1885.
Information Contacts: Servicio Geologico Colombiano (SGC), Diagonal 53 No. 34-53 - Bogotá D.C., Colombia (URL: https://www.sgc.gov.co/volcanes).
Etna
Italy
37.748°N, 14.999°E; summit elev. 3357 m
All times are local (unless otherwise noted)
Strombolian explosions, lava fountains, and lava flows during July-August 2023
Etna, located on the Italian island of Sicily, has had documented eruptions dating back to 1500 BCE. Activity typically originates from multiple cones at the summit, where several craters have formed and evolved. The currently active craters are Northeast Crater (NEC), Voragine (VOR), and Bocca Nuova (BN), and the Southeast Crater (SEC); VOR and BN were previously referred to as the “Central Crater”. The original Southeast crater formed in 1978, and a second eruptive site that opened on its SE flank in 2011 was named the New Southeast Crater (NSEC). Another eruptive site between the SEC and NSEC developed during early 2017 and was referred to as the "cono della sella" (saddle cone). The current eruption period began in November 2022 and has been characterized by intermittent Strombolian activity, lava flows, and ash plumes (BGVN 48:08). This report updates activity during July through October 2023, which includes primarily gas-and-steam emissions; during July and August Strombolian explosions, lava fountains, and lava flows were reported, based on weekly and special reports by the Osservatorio Etneo (OE), part of the Catania Branch of Italy's Istituo Nazionale di Geofisica e Vulcanologica (INGV) and satellite data.
Variable fumarolic degassing was reported at all summit craters (BN, VOR, NEC, and SEC) throughout the entire reporting period (table 15). The MIROVA (Middle InfraRed Observation of Volcanic Activity) volcano hotspot detection system based on the analysis of MODIS data showed frequent low-to-moderate power thermal anomalies during the reporting period (figure 399). During mid-August there was a pulse in activity that showed an increase in the power of the anomalies due to Strombolian activity, lava fountains, and lava flows. Infrared satellite imagery captured strong thermal anomalies at the central and southeast summit crater areas (figure 400). Accompanying thermal activity were occasional sulfur dioxide plumes that exceeded 2 Dobson Units (DUs) recorded by the TROPOMI instrument on the Sentinel-5P satellite (figure 401).
Table 15. Summary of activity at the four primary crater areas at the summit of Etna during July-October 2023. Information is from INGV weekly reports.
| Month |
Bocca Nuova (BN) |
Voragine (VOR) |
Northeast Crater (NEC) |
Southeast Crater (SEC) |
| Jul 2023 |
Continuous degassing. |
No observations. |
Weak gas emissions. |
Continuous degassing. Sporadic and weak-to-moderate ash emissions. Strombolian explosions. |
| Aug 2023 |
Continuous degassing. |
No observations. |
No observations. |
Continuous degassing. Occasional ash emissions. Strombolian activity, lava fountaining, and lava flows. |
| Sep 2023 |
Variable degassing. Crater incandescence. |
Weak fumarolic activity. |
Weak fumarolic activity. |
Variable degassing. |
| Oct 2023 |
Continuous degassing. |
Weak fumarolic activity. |
Weak fumarolic activity. |
Continuous degassing. |
Activity during July and August was relatively low and mainly consisted of degassing at the summit craters, particularly at SEC and BN. Cloudy weather prevented clear views of the summit during early July. During the night of 2 July some crater incandescence was visible at SEC. Explosive activity resumed at SEC during 9-10 July, which was characterized by sporadic and weak ash emissions that rapidly dispersed in the summit area (figure 402). INGV reported moderate Strombolian activity began at 2034 on 14 July and was confined to the inside of the crater and fed by a vent located in the E part of SEC. An ash emission was detected at 2037. A new vent opened on 15 July in the SE part of BN and began to produce continuous gas-and-steam emissions. During an inspection carried out on 28 July pulsating degassing, along with audible booms, were reported at two active vents in BN. Vigorous gas-and-steam emissions intermittently generated rings. On rare occasions, fine, reddish ash was emitted from BN1 and resuspended by the gas-and-steam emissions.
Around 2000 on 13 August INGV reported a sudden increase in volcanic tremor amplitude. Significant infrasonic activity coincided with the tremor increase. Incandescent flashes were visible through the cloud cover in webcam images of SEC (figure 403). Strombolian activity at SEC began to gradually intensify starting at 2040 as seismicity continued to increase. The Aviation Color Code (ACC) was raised to Yellow (the second lowest-level on a four-color scale) at 2126 and then to Orange (the second highest-level on a four-color scale) at 2129 due to above-background activity. The activity rapidly transitioned from Strombolian activity to lava fountains around 2333 that rose 300-400 m above the crater (figure 403). Activity was initially focused on the E vent of the crater, but then the vent located above the S flank of the cone also became active. A lava flow from this vent traveled SW into the drainage created on 10 February 2022, overlapping with previous flows from 10 and 21 February 2022 and 21 May 2023, moving between Monte Barbagallo and Monte Frumento Supino (figure 404). The lava flow was 350 m long, oriented NNE-SSW, and descended to an elevation of 2.8 km. Flows covered an area of 300,000 m2 and had an estimated volume of 900,000 m3. The ACC was raised to Red at 2241 based on strong explosive activity and ashfall in Rifugio Sapienza-Piano Vetore at 1.7 km elevation on the S flank. INGV reported that pyroclastic flows accompanied this activity.
Activity peaked between 0240 and 0330 on 14 August, when roughly 5-6 vents erupted lava fountains from the E to SW flank of SEC. The easternmost vents produced lava fountains that ejected material strongly to the E, which caused heavy fallout of incandescent pyroclastic material on the underlying flank, triggering small pyroclastic flows. This event was also accompanied by lightning both in the ash column and in the ash clouds that were generated by the pyroclastic flows. A fracture characterized by a series of collapse craters (pit craters) opened on the upper SW flank of SEC. An ash cloud rose a few kilometers above the crater and drifted S, causing ash and lapilli falls in Rifugio Sapienza and expanding toward Nicolosi, Mascalucia, Catania, and up to Syracuse. Ashfall resulted in operational problems at the Catania airport (50 km S), which lasted from 0238 until 2000. By 0420 the volcanic tremor amplitude values declined to background levels. After 0500 activity sharply decreased, although the ash cloud remained for several hours and drifted S. By late morning, activity had completely stopped. The ACC was lowered to Orange as volcanic ash was confined to the summit area. Sporadic, minor ash emissions continued throughout the day. At 1415 the ACC was lowered to Yellow and then to Green at 1417.
During the night of 14-15 August only occasional flashes were observed, which were more intense during avalanches of material inside the eruptive vents. Small explosions were detected at SEC at 2346 on 14 August and at 0900 on 26 August that each produced ash clouds which rapidly dispersed into the atmosphere (figure 405). According to a webcam image, an explosive event detected at 2344 at SEC generated a modest ash cloud that was rapidly dispersed by winds. The ACC was raised to Yellow at 2355 on 14 August due to increasing unrest and was lowered to Green at 0954 on 15 August.
Activity during September and October was relatively low and mainly characterized by variable degassing from BN and SEC. Intense, continuous, and pulsating degassing was accompanied by roaring sounds and flashes of incandescence at BN both from BN1 and the new pit crater that formed during late July (figure 406). The degassing from the new pit crater sometimes emitted vapor rings. Cloudy weather during 6-8 September prevented observations of the summit craters .
Geologic Background. Mount Etna, towering above Catania on the island of Sicily, has one of the world's longest documented records of volcanism, dating back to 1500 BCE. Historical lava flows of basaltic composition cover much of the surface of this massive volcano, whose edifice is the highest and most voluminous in Italy. The Mongibello stratovolcano, truncated by several small calderas, was constructed during the late Pleistocene and Holocene over an older shield volcano. The most prominent morphological feature of Etna is the Valle del Bove, a 5 x 10 km caldera open to the east. Two styles of eruptive activity typically occur, sometimes simultaneously. Persistent explosive eruptions, sometimes with minor lava emissions, take place from one or more summit craters. Flank vents, typically with higher effusion rates, are less frequently active and originate from fissures that open progressively downward from near the summit (usually accompanied by Strombolian eruptions at the upper end). Cinder cones are commonly constructed over the vents of lower-flank lava flows. Lava flows extend to the foot of the volcano on all sides and have reached the sea over a broad area on the SE flank.
Information Contacts: Sezione di Catania - Osservatorio Etneo, Istituto Nazionale di Geofisica e Vulcanologia (INGV), Sezione di Catania, Piazza Roma 2, 95123 Catania, Italy (URL: http://www.ct.ingv.it/it/); MIROVA (Middle InfraRed Observation of Volcanic Activity), a collaborative project between the Universities of Turin and Florence (Italy) supported by the Centre for Volcanic Risk of the Italian Civil Protection Department (URL: http://www.mirovaweb.it/); NASA Global Sulfur Dioxide Monitoring Page, Atmospheric Chemistry and Dynamics Laboratory, NASA Goddard Space Flight Center (NASA/GSFC), 8800 Greenbelt Road, Goddard MD 20771, USA (URL: https://so2.gsfc.nasa.gov/); Copernicus Browser, Copernicus Data Space Ecosystem, European Space Agency (URL: https://dataspace.copernicus.eu/browser/).
Suwanosejima (Japan) — December 2023 Cite this Report
Suwanosejima
Japan
29.638°N, 129.714°E; summit elev. 796 m
All times are local (unless otherwise noted)
Eruption plumes, crater incandescence, and occasional explosions during July-October 2023
Suwanosejima is an 8-km-long island that consists of a stratovolcano and two active summit craters, located in the northern Ryukyu Islands, Japan. Volcanism over the past century has been characterized by Strombolian explosions, ash plumes, and ashfall. The current eruption began in October 2004 and has more recently consisted of frequent eruption plumes, explosions, and incandescent ejecta (BGVN 48:07). This report covers similar activity of ash plumes, explosions, and crater incandescence during July through October 2023 using monthly reports from the Japan Meteorological Agency (JMA) and satellite data.
Thermal activity during the reporting period was relatively low; only one low-power thermal anomaly was detected during mid-July and one during early August, based on a MIROVA (Middle InfraRed Observation of Volcanic Activity) Log Radiative Power graph of the MODIS thermal anomaly data. On two clear weather days, a thermal anomaly was visible in infrared satellite images (figure 81).
Low-level activity was reported at the Otake crater during July and no explosions were detected. Eruption plumes rose as high as 1.8 km above the crater. On 13 July an ash plume rose 1.7 km above the crater rim, based on a webcam image. During the night of the 28th crater incandescence was visible in a webcam image. An eruptive event reported on 31 July produced an eruption plume that rose 2.1 km above the crater. Seismicity consisted of 11 volcanic earthquakes on the W flank, the number of which had decreased compared to June (28) and 68 volcanic earthquakes near the Otake crater, which had decreased from 722 in the previous month. According to observations conducted by the University of Tokyo Graduate School of Science, Kyoto University Disaster Prevention Research Institute, Toshima Village, and JMA, the amount of sulfur dioxide emissions released during the month was 400-800 tons per day (t/d).
Eruptive activity in the Otake crater continued during August and no explosions were reported. An eruptive event produced a plume that rose 1 km above the crater at 1447 on 12 August. Subsequent eruptive events were recorded at 0911 on 16 August, at 1303 on 20 August, and at 0317 on 21 August, which produced ash plumes that rose 1-1.1 km above the crater and drifted SE, SW, and W. On 22 August an ash plume was captured in a webcam image rising 1.4 km above the crater (figure 82). Multiple eruptive events were detected on 25 August at 0544, 0742, 0824, 1424, and 1704, which generated ash plumes that rose 1.1-1.2 km above the crater and drifted NE, W, and SW. On 28 August a small amount of ashfall was observed as far as 1.5 km from the crater. There were 17 volcanic earthquakes recorded on the W flank of the volcano and 79 recorded at the Otake crater during the month. The amount of sulfur dioxide emissions released during the month was 400-800 t/d.
Activity continued at the Otake crater during September. Occasionally, nighttime crater incandescence was observed in webcam images and ashfall was reported. An eruptive event at 1949 on 4 September produced an ash plume that rose 1 km above the crater and drifted SW. On 9 September several eruption events were detected at 0221, 0301, and 0333, which produced ash plumes that rose 1.1-1.4 km above the crater rim and drifted W; continuous ash emissions during 0404-0740 rose to a maximum height of 2 km above the crater rim (figure 83). More eruptive events were reported at 1437 on 10 September, at 0319 on 11 September, and at 0511 and 1228 on 15 September, which generated ash plumes that rose 1-1.8 km above the crater. During 25, 27, and 30 September, ash plumes rose as high as 1.3 km above the crater rim. JMA reported that large blocks were ejected as far as 300 m from the center of the crater. There were 18 volcanic earthquakes detected beneath the W flank and 82 volcanic earthquakes detected near the Otake crater. The amount of sulfur dioxide released during the month ranged from 600 to 1,600 t/d.
Activity during early-to-mid-October consisted of occasional explosions, a total number of 13, and ash plumes that rose as high as 1.9 km above the Otake crater rim on 29 October (figure 84). These explosions are the first to have occurred since June 2023. Continuous ash emissions were reported during 0510-0555 on 1 October. Explosions were recorded at 0304, 2141, and 2359 on 2 October, at 0112 on 3 October, and at 1326 on 6 October, which produced ash plumes that rose as high as 1 km above the crater rim and drifted SW and W. An explosion was noted at 0428 on 3 October, but emission details were unknown. A total of eight explosions were recorded by the seismic network at 1522 on 14 October, at 0337, 0433, 0555, 1008, and 1539 on 15 October, and at 0454 and 0517 on 16 October. Ash plumes from these explosions rose as high as 900 m above the crater and drifted SE. Eruptive events during 25-27 and 29-30 October generated plumes that rose as high as 1.9 km above the crater and drifted SE, S, and SW. Ash was deposited in Toshima village (3.5 km SSW). Eruptive activity occasionally ejected large volcanic blocks as far as 600 m from the crater. Nighttime crater incandescence was visible in webcams. Intermittent ashfall was reported as far as 1.5 km from the crater. There were 43 volcanic earthquakes detected on the W flank during the month, and 184 volcanic earthquakes detected near the Otake crater. The amount of sulfur dioxide emitted ranged between 400 and 900 t/d.
Geologic Background. The 8-km-long island of Suwanosejima in the northern Ryukyu Islands consists of an andesitic stratovolcano with two active summit craters. The summit is truncated by a large breached crater extending to the sea on the E flank that was formed by edifice collapse. One of Japan's most frequently active volcanoes, it was in a state of intermittent Strombolian activity from Otake, the NE summit crater, between 1949 and 1996, after which periods of inactivity lengthened. The largest recorded eruption took place in 1813-14, when thick scoria deposits covered residential areas, and the SW crater produced two lava flows that reached the western coast. At the end of the eruption the summit of Otake collapsed, forming a large debris avalanche and creating an open collapse scarp extending to the eastern coast. The island remained uninhabited for about 70 years after the 1813-1814 eruption. Lava flows reached the eastern coast of the island in 1884. Only about 50 people live on the island.
Information Contacts: Japan Meteorological Agency (JMA), 1-3-4 Otemachi, Chiyoda-ku, Tokyo 100-8122, Japan (URL: http://www.jma.go.jp/jma/indexe.html); MIROVA (Middle InfraRed Observation of Volcanic Activity), a collaborative project between the Universities of Turin and Florence (Italy) supported by the Centre for Volcanic Risk of the Italian Civil Protection Department (URL: http://www.mirovaweb.it/); Hawai'i Institute of Geophysics and Planetology (HIGP) - MODVOLC Thermal Alerts System, School of Ocean and Earth Science and Technology (SOEST), Univ. of Hawai'i, 2525 Correa Road, Honolulu, HI 96822, USA (URL: http://modis.higp.hawaii.edu/); Copernicus Browser, Copernicus Data Space Ecosystem, European Space Agency (URL: https://dataspace.copernicus.eu/browser/).
Aira
Japan
31.5772°N, 130.6589°E; summit elev. 1117 m
All times are local (unless otherwise noted)
Explosions, ash plumes, ash fall, and crater incandescence during July-October 2023
Aira caldera, located in the northern half of Kagoshima Bay, Japan, contains the post-caldera Sakurajima volcano. Eruptions typically originate from the Minamidake crater, and since the 8th century, ash deposits have been recorded in the city of Kagoshima (10 km W), one of Kyushu’s largest cities. The Minamidake summit cone and crater has had persistent activity since 1955; the Showa crater on the E flank has also been intermittently active since 2006. The current eruption period began during March 2017 and has recently been characterized by intermittent explosions, eruption plumes, and ashfall (BGVN 48:07). This report updates activity during July through October 2023 and describes explosive events, ash plumes, nighttime crater incandescence, and ashfall, according to monthly activity reports from the Japan Meteorological Agency (JMA) and satellite data.
Thermal activity remained at low levels during this reporting period, according to the MIROVA (Middle InfraRed Observation of Volcanic Activity) system (figure 149). There was a slight increase in the number of anomalies during September through October. Occasional thermal anomalies were visible in infrared satellite images mainly at the Minamidake crater (Vent A is located to the left and Vent B is located to the right) (figure 150).
Table 30. Number of monthly explosive events, days of ashfall, area of ash covered, and sulfur dioxide emissions from Sakurajima’s Minamidake crater at Aira during July-October 2023. Note that smaller ash events are not listed. Ashfall days were measured at Kagoshima Local Meteorological Observatory and ashfall amounts represent material covering all the Kagoshima Prefecture. Data courtesy of JMA monthly reports.
| Month |
Explosive events |
Days of ashfall |
Ashfall amount (g/m2) |
SO2 emissions (tons/day) |
| Jul 2023 |
3 |
0 |
0 |
1,600-3,200 |
| Aug 2023 |
3 |
10 |
7 |
1,800-3,300 |
| Sep 2023 |
3 |
7 |
3 |
1,600-2,300 |
| Oct 2023 |
33 |
8 |
61 |
2,200-4,200 |
JMA reported that during July, there were eight eruptions, three of which were explosion events in the Showa crater. Large blocks were ejected as far as 600 m from the Showa crater. Very small eruptions were occasionally reported at the Minamidake crater. Nighttime incandescence was observed in both the Showa and Minamidake crater. Explosions were reported on 16 July at 2314 and on 17 July at 1224 and at 1232 (figure 151). Resulting eruption plumes rose 700-2,500 m above the crater and drifted N. On 23 July the number of volcanic earthquakes on the SW flank of the volcano increased. A strong Mw 3.1 volcanic earthquake was detected at 1054 on 26 July. The number of earthquakes recorded throughout the month was 545, which markedly increased from 73 in June. No ashfall was observed at the Kagoshima Regional Meteorological Observatory during July. According to a field survey conducted during the month, the daily amount of sulfur dioxide emissions was 1,600-3,200 tons per day (t/d).
There were three eruptions reported at the Minamidake crater during August, each of which were explosive. The explosions occurred on 9 August at 0345, on 13 August at 2205, and on 31 August at 0640, which generated ash plumes that rose 800-2,000 m above the crater and drifted W. There were two eruptions detected at Showa crater; on 4 August at 2150 ejecta traveled 800 m from the Showa crater and associated eruption plumes rose 2.3 km above the crater. The explosion at 2205 on 13 August generated an ash plume that rose 2 km above the crater and was accompanied by large blocks that were ejected 600 m from the Minamidake crater (figure 152). Nighttime crater incandescence was visible in a high-sensitivity surveillance camera at both craters. Seismicity consisted of 163 volcanic earthquakes, 84 of which were detected on the SW flank. According to the Kagoshima Regional Meteorological Observatory there was a total of 7 g/m2 of ashfall over the course of 10 days during the month. According to a field survey, the daily amount of sulfur dioxide emitted was 1,800-3,300 t/d.
During September, four eruptions were reported, three of which were explosion events. These events occurred at 1512 on 9 September, at 0018 on 11 September, and at 2211 on 13 September. Resulting ash plumes generally rose 800-1,100 m above the crater. An explosion produced an ash plume at 2211 on 13 September that rose as high as 1.7 km above the crater. Large volcanic blocks were ejected 600 m from the Minamidake crater. Smaller eruptions were occasionally observed at the Showa crater. Nighttime crater incandescence was visible at the Minamidake crater. Seismicity was characterized by 68 volcanic earthquakes, 28 of which were detected beneath the SW flank. According to the Kagoshima Regional Meteorological Observatory there was a total of 3 g/m2 of ashfall over the course of seven days during the month. A field survey reported that the daily amount of sulfur dioxide emitted was 1,600-2,300 t/d.
Eruptive activity during October consisted of 69 eruptions, 33 of which were described as explosive. These explosions occurred during 4 and 11-21 October and generated ash plumes that rose 500-3,600 m above the crater and drifted S, E, SE, and N. On 19 October at 1648 an explosion generated an ash plume that rose 3.6 km above the crater (figure 153). No eruptions were reported in the Showa crater; white gas-and-steam emissions rose 100 m above the crater from a vent on the N flank. Nighttime incandescence was observed at the Minamidake crater. On 24 October an eruption was reported from 0346 through 0430, which included an ash plume that rose 3.4 km above the crater. Ejected blocks traveled 1.2 km from the Minamidake crater. Following this eruption, small amounts of ashfall were observed from Arimura (4.5 km SE) and a varying amount in Kurokami (4 km E) (figure 154). The number of recorded volcanic earthquakes during the month was 190, of which 14 were located beneath the SW flank. Approximately 61 g/m2 of ashfall was reported over eight days of the month. According to a field survey, the daily amount of sulfur dioxide emitted was 2,200-4,200 t/d.
Geologic Background. The Aira caldera in the northern half of Kagoshima Bay contains the post-caldera Sakurajima volcano, one of Japan's most active. Eruption of the voluminous Ito pyroclastic flow accompanied formation of the 17 x 23 km caldera about 22,000 years ago. The smaller Wakamiko caldera was formed during the early Holocene in the NE corner of the caldera, along with several post-caldera cones. The construction of Sakurajima began about 13,000 years ago on the southern rim and built an island that was joined to the Osumi Peninsula during the major explosive and effusive eruption of 1914. Activity at the Kitadake summit cone ended about 4,850 years ago, after which eruptions took place at Minamidake. Frequent eruptions since the 8th century have deposited ash on the city of Kagoshima, located across Kagoshima Bay only 8 km from the summit. The largest recorded eruption took place during 1471-76.
Information Contacts: Japan Meteorological Agency (JMA), 1-3-4 Otemachi, Chiyoda-ku, Tokyo 100-8122, Japan (URL: http://www.jma.go.jp/jma/indexe.html); MIROVA (Middle InfraRed Observation of Volcanic Activity), a collaborative project between the Universities of Turin and Florence (Italy) supported by the Centre for Volcanic Risk of the Italian Civil Protection Department (URL: http://www.mirovaweb.it/); Copernicus Browser, Copernicus Data Space Ecosystem, European Space Agency (URL: https://dataspace.copernicus.eu/browser/).
Nishinoshima (Japan) — November 2023 Cite this Report
Nishinoshima
Japan
27.247°N, 140.874°E; summit elev. 100 m
All times are local (unless otherwise noted)
Gray emissions during October 2023
Nishinoshima is a small island in the Ogasawara Arc, about 1,000 km S of Tokyo, Japan. It contains prominent submarine peaks to the S, W, and NE. Recorded eruptions date back to 1973, with the current eruption period beginning in October 2022. Eruption plumes and fumarolic activity characterize recent activity (BGVN 48:10). This report covers the end of the eruption for September through October 2023, based on information from monthly reports of the Japan Meteorological Agency (JMA) monthly reports, and satellite data.
No eruptive activity was reported during September 2023, although JMA noted that the surface temperature was slightly elevated compared to the surrounding area since early March 2023. The Japan Coast Guard (JCG) conducted an overflight on 20 September and reported white gas-and-steam plumes rising 3 km above the central crater of the pyroclastic cone, as well as multiple white gas-and-steam emissions emanating from the N, E, and S flanks of the crater to the coastline. In addition, dark reddish brown-to-green discolored water was distributed around almost the entire circumference of the island.
Similar low-level activity was reported during October. Multiple white gas-and-steam emissions rose from the N, E, and S flanks of the central crater of the pyroclastic cone and along the coastline; these emissions were more intense compared to the previous overflight observations. Dark reddish brown-to-green discolored water remained visible around the circumference of the island. On 4 October aerial observations by JCG showed a small eruption consisting of continuous gas-and-steam emissions emanating from the central crater, with gray emissions rising to 1.5 km altitude (figure 129). According to observations from the marine weather observation vessel Keifu Maru on 26 October, white gas-and-steam emissions persisted from the center of the pyroclastic cone, as well as from the NW, SW, and SE coasts of the island for about five minutes. Slightly discolored water was visible up to about 1 km.
Frequent low-to-moderate power thermal anomalies were recorded in the MIROVA graph (Middle InfraRed Observation of Volcanic Activity) during September (figure 130). Occasional anomalies were detected during October, and fewer during November through December. A thermal anomaly was visible in the crater using infrared satellite imagery on 6, 8, 11, 16, 18, 21, and 23 September and 8, 13, 21, 26, and 28 October (figure 131).
Geologic Background. The small island of Nishinoshima was enlarged when several new islands coalesced during an eruption in 1973-74. Multiple eruptions that began in 2013 completely covered the previous exposed surface and continued to enlarge the island. The island is the summit of a massive submarine volcano that has prominent peaks to the S, W, and NE. The summit of the southern cone rises to within 214 m of the ocean surface 9 km SSE.
Information Contacts: Japan Meteorological Agency (JMA), 1-3-4 Otemachi, Chiyoda-ku, Tokyo 100-8122, Japan (URL: http://www.jma.go.jp/jma/indexe.html); MIROVA (Middle InfraRed Observation of Volcanic Activity), a collaborative project between the Universities of Turin and Florence (Italy) supported by the Centre for Volcanic Risk of the Italian Civil Protection Department (URL: http://www.mirovaweb.it/); Copernicus Browser, Copernicus Data Space Ecosystem, European Space Agency (URL: https://dataspace.copernicus.eu/browser/).
Kilauea (United States) — October 2023 Cite this Report
Kilauea
United States
19.421°N, 155.287°W; summit elev. 1222 m
All times are local (unless otherwise noted)
Strong lava fountains, lava flows, and spatter at Halema’uma’u during January-September 2023
Kīlauea is on the island of Hawai’i and overlaps the E flank of the Mauna Loa volcano. Its East Rift Zone (ERZ) has been intermittently active for at least 2,000 years. An extended eruption period began in January 1983 and was characterized by open lava lakes and lava flows from the summit caldera and the East Rift Zone. During May 2018 magma migrated into the Lower East Rift Zone (LERZ) and opened 24 fissures along a 6-km-long NE-trending fracture zone that produced lava flows traveling in multiple directions. As lava emerged from the fissures, the lava lake at Halema'uma'u drained and explosions sent ash plumes to several kilometers altitude (BGVN 43:10).
The current eruption period started during September 2021 and has been characterized by low-level lava effusions in the active Halema’uma’u lava lake (BGVN 48:01). This report covers three notable eruption periods during February, June, and September 2023 consisting of lava fountaining, lava flows, and spatter during January through September 2023 using information from daily reports, volcanic activity notices, and abundant photo, map, and video data from the US Geological Survey's (USGS) Hawaiian Volcano Observatory (HVO).
Activity during January 2023. Small earthquake swarms were recorded on 2 January 2023; increased seismicity and changes in the pattern of deformation were noted on the morning of 5 January. At around 1500 both the rate of deformation and seismicity drastically increased, which suggested magma movement toward the surface. HVO raised the Volcano Alert Level (VAL) to Watch (the second highest level on a four-level scale) and the Aviation Color Code (ACC) to Orange (the second highest color on a four-color scale) at 1520.
Multiple lava fountains and lava effusions from vents in the central eastern portion of the Halema’uma’u crater began on 5 January around 0434; activity was confined to the eastern half of the crater and within the basin of the western half of the crater, which was the focus of the eruption in 2021-2022 (figure 525). Incandescence was visible in webcam images at 1634 on 5 January, prompting HVO to raise the VAL to Warning (the highest level on a four-level scale) and the ACC to Red (the highest color on a four-color scale). Lava fountains initially rose as high as 50 m above the vent at the onset of the eruption (figure 526) but then declined to a more consistent 5-6 m height in the proceeding days. By 1930 that same day, lava had covered most of the crater floor (an area of about 1,200,000 m2) and the lava lake had a depth of 10 m. A higher-elevation island that formed during the initial phase of the December 2020 eruption remained exposed, appearing darker in images, along with a ring of older lava around the lava lake that was active prior to December 2022. Overnight during 5-6 January the lava fountains continued to rise 5 m high, and the lava effusion rate had slowed.
On 6 January at 0815 HVO lowered the VAL to Watch and the ACC to Orange due to the declining effusion rates. Sulfur dioxide emission rates ranged from 3,000-12,500 tonnes per day (t/d), the highest value of which was recorded on 6 January. Lava continued to erupt from the vents during 6-8 January, although the footprint of the active area had shrunk; a similar progression has been commonly observed during the early stages of recent eruptions at Halema’uma’u. On 9 January HVO reported one dominant lava fountain rising 6-7 m high in the E half of the crater. Lava flows built up the margins of the lake, causing the lake to be perched. On 10 January the eastern lava lake had an area of approximately 120,000 m2 that increased to 250,000 m2 by 17 January. During 13-31 January several small overflows occurred along the margins of the E lake. A smaller area of lava was active within the basin in the W half of the crater that had been the focus of activity during 2021-2022. On 19 January just after 0200 a small ooze-out was observed on the crater’s W edge.
Activity during February 2023. Activity continued in the E part of Halema’uma’u crater, as well as in a smaller basin in the W part of the 2021-2022 lava lake (figure 527). The E lava lake contained a single lava fountain and frequent overflows. HVO reported that during the morning of 1 February the large E lava lake began to cool and crust over in the center of the lake; two smaller areas of lava were observed on the N and S sides by the afternoon. The dominant lava fountain located in the S part of the lava lake paused for roughly 45 minutes at 2315 and resumed by midnight, rising 1-2 m. At 0100 on 2 February lava from the S part was effusing across the entire E lava lake area, covering the crusted over portion in the center of the lake and continuing across the majority of the previously measured 250,000 m2 by 0400. A small lava pond near the E lake produced an overflow around 0716 on 2 February. On 3 February some lava crust began to form against the N and E levees, which defined the 250,000 m2 eastern lava lake. The small S lava fountain remained active, rising 1-6 m high during 3-9 February; around 0400 on 5 February occasional bursts doubled the height of the lava fountain.
A large breakout occurred overnight during 2100 on 4 February to 0900 on 5 February on the N part of the crater floor, equal to or slightly larger in size than the E lava lake. A second, smaller lava fountain appeared in the same area of the E lava lake between 0300 and 0700 on 5 February and was temporarily active. This large breakout continued until 7 February. A small, brief breakout was reported in the S of the E lava lake around midnight on 7 February. In the W lake, as well as the smaller lava pond in the central portion of the crater floor, contained several overflows during 7-10 February and intermittent fountaining. Activity at the S small lava pond and the small S lava fountain within the E lake declined during 9-10 February. The lava pond in the central portion of the crater floor had nearly continuous, expansive flows during 10-13 February; channels from the small central lava pond seemed to flow into the larger E lake. During 13-18 February a small lava fountain was observed in the small lava pond in the central portion of the crater floor. Continuous overflows persisted during this time.
Activity in the eastern and central lakes began to decline in the late afternoon of 17 February. By 18 February HVO reported that the lava effusions had significantly declined, and that the eastern and central lakes were no longer erupting. The W lake in the basin remained active but at a greatly reduced level that continued to decline. HVO reported that this decrease in activity is attributed to notable deflationary tilt that began early on the morning of 17 February and lasted until early 19 February. By 19 February the W lake was mostly crusted over although some weak lava flows remained, which continued through 28 February. The sulfur dioxide emission rates ranged 250-2,800 t/d, the highest value of which was recorded on 6 February.
Activity during March 2023. The summit eruption at Halema’uma’u crater continued at greatly reduced levels compared to the previous two months. The E and central vents stopped effusing lava, and the W lava lake remained active with weak lava flows; the lake was mostly crusted over, although slowly circulating lava intermittently overturned the crust. By 6 March the lava lake in the W basin had stopped because the entire surface was crusted over. The only apparent surface eruptive activity during 5-6 March was minor ooze-outs of lava onto the crater floor, which had stopped by 7 March. Several hornitos on the crater floor still glowed through 12 March according to overnight webcam images, but they did not erupt any lava. A small ooze-out of lava was observed just after 1830 in the W lava lake on 8 March, which diminished overnight. The sulfur dioxide emission rate ranged from 155-321 t/d on 21 March. The VAL was lowered to Advisory, and the ACC was lowered to Yellow (the second lowest on a four-color scale) on 23 March due to a pause in the eruption since 7 March.
Activity during April-May 2023. The eruption at Halema’uma’u crater was paused; no lava effusions were visible on the crater floor. Sulfur dioxide emission rates ranged from 75-185 t/d, the highest of which was measured on 22 April. During May and June summit seismicity was elevated compared to seismicity that preceded the activity during January.
Activity during June 2023. Earthquake activity and changes in the patterns of ground deformation beneath the summit began during the evening of 6 June. The data indicated magma movement toward the surface, prompting HVO to raise the VAL to Watch and the ACC to Orange. At about 0444 on 7 June incandescence in Halema’uma’u crater was visible in webcam images, indicating that a new eruption had begun. HVO raised the VAL to Warning and the ACC to Red (the highest color on a four-color scale). Lava flowed from fissures that had opened on the crater floor. Multiple minor lava fountains were active in the central E portion of the Halema’uma’u crater, and one vent opened on the W wall of the caldera (figure 528). The eruptive vent on the SW wall of the crater continued to effuse into the lava lake in the far SW part of the crater (figure 529). The largest lava fountain consistently rose 15 m high; during the early phase of the eruption, fountain bursts rose as high as 60 m. Lava flows inundated much of the crater floor and added about 6 m depth of new lava within a few hours, covering approximately 10,000 m2. By 0800 on 7 June lava filled the crater floor to a depth of about 10 m. During 0800-0900 the sulfur dioxide emission rate was about 65,000 t/d. Residents of Pahala (30 km downwind of the summit) reported minor deposits of fine, gritty ash and Pele’s hair. A small spatter cone had formed at the vent on the SW wall by midday, and lava from the cone was flowing into the active lava lake. Fountain heights had decreased from the onset of the eruption and were 4-9 m high by 1600, with occasional higher bursts. Inflation switched to deflation and summit earthquake activity greatly diminished shortly after the eruption onset.
At 0837 on 8 June HVO lowered the VAL to Watch and the ACC to Orange because the initial high effusion rates had declined, and no infrastructure was threatened. The surface of the lava lake had dropped by about 2 m, likely due to gas loss by the morning of 8 June. The drop left a wall of cooled lava around the margins of the crater floor. Lava fountain heights decreased during 8-9 June but continued to rise to 10 m high. Active lava and vents covered much of the W half of Halema’uma’u crater in a broad, horseshoe-shape around a central, uplifted area (figure 530). The preliminary average effusion rate for the first 24 hours of the eruption was about 150 cubic meters per second, though the estimate did not account for vesiculated lava and variations in crater floor topography. The effusion rate during the very earliest phases of the eruption appeared significantly higher than the previous three summit eruptions based on the rapid coverage of the entire crater floor. An active lava lake, also referred to as the “western lava lake” was centered within the uplifted area and was fed by a vent in the NE corner. Two small active lava lakes were located just SE from the W lava lake and in the E portion of the crater floor.
During 8-9 June the lava in the central lava lake had a thickness of approximately 1.5 m, based on measurements from a laser rangefinder. During 9-12 June the height of the lava fountains decreased to 9 m high. HVO reported that the previously active lava lake in the E part of the crater appeared stagnant during 10-11 June. The surface of the W lake rose approximately 1 m overnight during 11-12 June, likely due to the construction of a levee around it. Only a few small fountains were active during 12-13 June; the extent of the active lava had retreated so that all activity was concentrated in the SW and central parts of Halema’uma’u crater. Intermittent spattering from the vent on the SW wall was visible in overnight webcam images during 13-18 June. On the morning of 14 June a weak lava effusion originated from near the western eruptive vent, but by 15 June there were no signs of continued activity. HVO reported that other eruptive vents in the SW lava lake had stopped during this time, following several days of waning activity; lava filled the lake by about 0.5 m. Lava circulation continued in the central lake and no active lava was reported in the northern or eastern parts of the crater. Around 0800 on 15 June the top of the SW wall spatter cone collapsed, which was followed by renewed and constant spattering from the top vent and a change in activity from the base vent; several new lava flows effused from the top of the cone, as well as from the pre-existing tube-fed flow from its base. Accumulation of lava on the floor resulted in a drop of the central basin relative to the crater floor, allowing several overflows from the SW lava lake to cascade into the basin during the night of 15 June into the morning of 16 June.
Renewed lava fountaining was reported at the eruptive vent on the SW side of the crater during 16-19 June, which effused lava into the far SW part of the crater. This activity was described as vigorous during midday on 16 June; a group of observatory geologists estimated that the lava was consistently ejected at least 10 m high, with some spatter ejected even higher and farther. Deposits from the fountain further heightened and widened the spatter cone built around the original eruptive vent in the lower section of the crater wall. Multiple lava flows from the base of the cone were fed into the SW lava lake and onto the southwestern-most block from the 2018 collapse within Halema’uma’u on 17 June (figure 531); by 18 June they focused into a single flow feeding into the SW lava lake. On the morning of 19 June a second lava flow from the base of the eruptive cone advanced into the SW lava lake.
Around 1600 on 19 June there was a rapid decline in lava fountaining and effusion at the eruptive vent on the SW side of the crater; vent activity had been vigorous up to that point (figure 532). Circulation in the lava lake also slowed, and the lava lake surface dropped by several meters. Overnight webcam images showed some previously eruptive lava still flowing onto the crater floor, which continued until those flows began to cool. By 21 June no lava was erupting in Halema’uma’u crater. Overnight webcam images during 29-30 June showed some incandescence from previously erupted lava flows as they continued to cool. Seismicity in the crater declined to low levels. Sulfur dioxide emission rates ranged 160-21,000 t/d throughout the month, the highest measurement of which was recorded on 8 June. On 30 June the VAL was lowered to Advisory (the second level on a four-level scale) and the ACC was lowered to Yellow. Gradual inflation was detected at summit tiltmeters during 19-30 June.
Activity during July-August 2023. During July, the eruption paused; no lava was erupting in Halema’uma’u crater. Nighttime webcam images showed some incandescence from previously erupted lava as it continued to cool on the crater floor. During the week of 14 August HVO reported that the rate in seismicity increased, with 467 earthquakes of Mw 3.2 and smaller occurring. Sulfur dioxide emission rates remained low, ranging from 75-86 t/d, the highest of which was recorded on 10 and 15 August. On 15 August beginning at 0730 and lasting for several hours, a swarm of approximately 50 earthquakes were detected at a depth of 2-3 km below the surface and about 2 km long directly S of Halema’uma’u crater. HVO reported that this was likely due to magma movement in the S caldera region. During 0130-0500 and 1700-2100 on 21 August two small earthquake swarms of approximately 20 and 25 earthquakes, respectively, occurred at the same location and at similar depths. Another swarm of 50 earthquakes were recorded during 0430-0830 on 23 August. Elevated seismicity continued in the S area through the end of the month.
Activity during September 2023. Elevated seismicity persisted in the S summit with occasional small, brief seismic swarms. Sulfur dioxide measurements were relatively low and were 70 t/d on 8 September. About 150 earthquakes occurred during 9-10 September, and tiltmeter and Global Positioning System (GPS) data showed inflation in the S portion of the crater.
At 0252 on 10 September HVO raised the VAL to Watch and the ACC to Orange due to increased earthquake activity and changes in ground deformation that indicated magma moving toward the surface. At 1515 the summit eruption resumed in the E part of the caldera based on field reports and webcam images. Fissures opened on the crater floor and produced multiple minor lava fountains and flows (figure 533). The VAL and ACC were raised to Warning and Red, respectively. Gas-and-steam plumes rose from the fissures and drifted downwind. A line of eruptive vents stretched approximately 1.4 km from the E part of the crater into the E wall of the down dropped block by 1900. The lava fountains at the onset of the eruption had an estimated 50 m height, which later rose 20-25 m high. Lava erupted from fissures on the down dropped block and expanded W toward Halema’uma’u crater. Data from a laser rangefinder recorded about 2.5 m thick of new lava added to the W part of the crater. Sulfur dioxide emissions were elevated in the eruptive area during 1600-1500 on 10 September, measuring at least 100,000 t/d.
At 0810 on 11 September HVO lowered the VAL and ACC back to Watch and Orange due to the style of eruption and the fissure location had stabilized. The initial extremely high effusion rates had declined (but remained at high levels) and no infrastructure was threatened. An eruption plume, mainly comprised of sulfur dioxide and particulates, rose as high as 3 km altitude. Several lava fountains were active on the W side of the down dropped block during 11-15 September, while the easternmost vents on the down dropped block and the westernmost vents in the crater became inactive on 11 September (figure 534). The remaining vents spanned approximately 750 m and trended roughly E-W. The fed channelized lava effusions flowed N and W into Halema’uma’u. The E rim of the crater was buried by new lava flows; pahoehoe lava flows covered most of the crater floor except areas of higher elevation in the SW part of the crater. The W part of the crater filled about 5 m since the start of the eruption, according to data from a laser rangefinder during 11-12 September. Lava fountaining continued, rising as high as 15 m by the morning of 12 September. During the morning of 13 September active lava flows were moving on the N and E parts of the crater. The area N of the eruptive vents that had active lava on its surface became perched and was about 3 m higher than the surrounding ground surface. By the morning of 14 September active lava was flowing on the W part of the down dropped block and the NE parts of the crater. The distances of the active flows progressively decreased. Spatter had accumulated on the S (downwind) side of the vents, forming ramparts about 20 m high.
Vigorous spattering was restricted to the westernmost large spatter cone with fountains rising 10-15 m high. Minor spattering occurred within the cone to the E of the main cone, but HVO noted that the fountains remained mostly below the rim of the cone. Lava continued to effuse from these cones and likely from several others as well, traveled N and W, confined to the W part of the down-dropped block and the NE parts of Halema’uma’u. Numerous ooze-outs of lava were visible over other parts of the crater floor at night. Laser range-finder measurements taken of the W part of the crater during 14-15 September showed that lava filled the crater by 10 m since the start of the eruption. Sulfur dioxide emissions remained elevated after the onset of the eruption, ranging 20,000-190,000 t/d during the eruption activity, the highest of which occurred on 10 September.
Field crews observed the eruptive activity on 15 September; they reported a notable decrease or stop in activity at several vents. Webcam images showed little to no fountaining since 0700 on 16 September, though intermittent spattering continued from the westernmost large cone throughout the night of 15-16 September. Thermal images showed that lava continued to flow onto the crater floor. On 16 September HVO reported that the eruption stopped around 1200 and that there was no observable activity anywhere overnight or on the morning of 17 September. HVO field crews reported that active lava was no longer flowing onto Halema’uma’u crater floor and was restricted to a ponded area N of the vents on the down dropped block. They reported that spattering stopped around 1115 on 16 September. Nighttime webcam images showed some incandescence on the crater floor as lava continued to cool. Field observations supported by geophysical data showed that eruptive tremor in the summit region decreased over 15-16 September and returned to pre-eruption levels by 1700 on 16 September. Sulfur dioxide emissions were measured at a rate of 800 t/d on 16 September while the eruption was waning, and 200 t/d on 17 September, which were markedly lower compared to measurements taken the previous week of 20,000-190,000 t/d.
Geologic Background. Kilauea overlaps the E flank of the massive Mauna Loa shield volcano in the island of Hawaii. Eruptions are prominent in Polynesian legends; written documentation since 1820 records frequent summit and flank lava flow eruptions interspersed with periods of long-term lava lake activity at Halemaumau crater in the summit caldera until 1924. The 3 x 5 km caldera was formed in several stages about 1,500 years ago and during the 18th century; eruptions have also originated from the lengthy East and Southwest rift zones, which extend to the ocean in both directions. About 90% of the surface of the basaltic shield volcano is formed of lava flows less than about 1,100 years old; 70% of the surface is younger than 600 years. The long-term eruption from the East rift zone between 1983 and 2018 produced lava flows covering more than 100 km2, destroyed hundreds of houses, and added new coastline.
Information Contacts: Hawaiian Volcano Observatory (HVO), U.S. Geological Survey, PO Box 51, Hawai'i National Park, HI 96718, USA (URL: http://hvo.wr.usgs.gov/).
Tinakula (Solomon Islands) — December 2023 Cite this Report
Tinakula
Solomon Islands
10.386°S, 165.804°E; summit elev. 796 m
All times are local (unless otherwise noted)
Continued lava flows and thermal activity during June through November 2023
Tinakula is a remote 3.5 km-wide island in the Solomon Islands, located 640 km ESE of the capital, Honiara. The current eruption period began in December 2018 and has more recently been characterized by intermittent lava flows and thermal activity (BGVN 48:06). This report covers similar activity during June through November 2023 using satellite data.
During clear weather days (20 July, 23 September, 23 October, and 12 November), infrared satellite imagery showed lava flows that mainly affected the W side of the island and were sometimes accompanied by gas-and-steam emissions (figure 54). The flow appeared more intense during July and September compared to October and November. According to the MODVOLC thermal alerts, there were a total of eight anomalies detected on 19 and 21 July, 28 and 30 October, and 16 November. Infrared MODIS satellite data processed by MIROVA (Middle InfraRed Observation of Volcanic Activity) detected a small cluster of thermal activity occurring during late July, followed by two anomalies during August, two during September, five during October, and five during November (figure 55).
Geologic Background. The small 3.5-km-wide island of Tinakula is the exposed summit of a massive stratovolcano at the NW end of the Santa Cruz islands. It has a breached summit crater that extends from the summit to below sea level. Landslides enlarged this scarp in 1965, creating an embayment on the NW coast. The Mendana cone is located on the SE side. The dominantly andesitic volcano has frequently been observed in eruption since the era of Spanish exploration began in 1595. In about 1840, an explosive eruption apparently produced pyroclastic flows that swept all sides of the island, killing its inhabitants. Recorded eruptions have frequently originated from a cone constructed within the large breached crater. These have left the upper flanks and the steep apron of lava flows and volcaniclastic debris within the breach unvegetated.
Information Contacts: MIROVA (Middle InfraRed Observation of Volcanic Activity), a collaborative project between the Universities of Turin and Florence (Italy) supported by the Centre for Volcanic Risk of the Italian Civil Protection Department (URL: http://www.mirovaweb.it/); Hawai'i Institute of Geophysics and Planetology (HIGP) - MODVOLC Thermal Alerts System, School of Ocean and Earth Science and Technology (SOEST), Univ. of Hawai'i, 2525 Correa Road, Honolulu, HI 96822, USA (URL: http://modis.higp.hawaii.edu/); Copernicus Browser, Copernicus Data Space Ecosystem, European Space Agency (URL: https://dataspace.copernicus.eu/browser/).
Search Bulletin Archive by Publication Date
Select a month and year from the drop-downs and click "Show Issue" to have that issue displayed in this tab.
The default month and year is the latest issue available.
Bulletin of the Global Volcanism Network - Volume 39, Number 10 (October 2014)
Bardarbunga (Iceland)
Substantial dike eruption ~45 km NE at Holuhraun begins 29 August 2014
Klyuchevskoy (Russia)
Two eruptive pulses: 15 August-20 December 2013 and 1 January-24 March 2015
Merapi (Indonesia)
During June 2011 to December 2014, several eruptions and elevated seismicity
Sinabung (Indonesia)
Frequent eruptions, pyroclastic flows, and advancing lava-flow lobe during May-October 2014
Bardarbunga (Iceland) — October 2014 Cite this Report
Bardarbunga
Iceland
64.633°N, 17.516°W; summit elev. 2000 m
All times are local (unless otherwise noted)
Substantial dike eruption ~45 km NE at Holuhraun begins 29 August 2014
[Barbarbunga is a subglacial caldera beneath the NW part of the Vatnajokull ice cap. Carrivick and Gertisser (2014) described the volcano as a caldera 700 m deep with a diameter of 11 km, covered by glacial ice ~850 m thick. This report is divided into two major sections, the first discussing activity between 1986 and 2008 and the second looking at more recent activity from 2014 to early 2015.]
1986-2008 activity. In 2010, the Icelandic Meteorological Office (IMO) presented a list of Icelandic volcanic eruptions from 1902-2010 on their website. That list lacks any eruption at the Bardarbunga caldera. Seibert and others (2010) stated that between 1986 and 2008, there were several uncertain cases of eruptions or unrest in the area of Loki-Fögrufjöll (S-SW of Bardarbunga caldera), which they consider a part of the larger Bardarbunga volcanic system (green in figure 1). The eruptive characteristics of these events included regional fissure and subglacial events associated with jökulhlaups (glacier bursts).
The associated jökulhlaups from 1986-2008 originated from the East and West Loki cauldrons found along the Loki Ridge of the Loki-Fögrufjöll system (figure 2). The cauldrons are located ~15 km SW of the center of the Bardarbunga caldera. Other terms for the Loki cauldrons include the East and West Skaftárketill cauldrons; the Eastern and Western Skaftá cauldrons; and the Eastern and Western cauldrons.
The Loki cauldrons are depressions formed in the Vatnajokull glacier surface by two underlying, subglacial geothermal areas (Einarsson, 2009). The geothermal areas melt the glacier's base and melt water collects forming subglacial lakes. As the lakes grow, the ice above them flattens. Eventually, the melt water escapes from the subglacial lakes in a jökulhlaup. The water of the jökulhlaup then travels ~40 km subglacially to flood the Skatfá river (Einarsson, 2009). Once the subglacial lake has emptied, the overlying ice collapses and the cauldrons can be seen again in the glacier surface (Einarsson, 2009).
Table 1 presents the dates of uncertain cases of eruption within the Bardarbunga volcanic system. The source of the jökulhlaups associated with these uncertain eruptions consistently originated from the East or West Loki cauldron or both.
Table 1. Table condensing Bardarbunga's uncertain cases of eruptive history during 1986-2008. The uncertain cases all reside in the area of Loki-Fögrufjöll. The table also show the source of the jökulhlaup associated with each of the cases. None of these uncertain cases occurred at the Bardarbunga caldera. Data in this table summarizes written communication with Páll Einarsson in 2008.
| Month |
Jökulhlaup source |
| Nov 1986 |
East Loki |
| Aug 1991 |
East Loki |
| Jul 1995 |
East Loki |
| Aug 1996 |
West Loki |
| Aug 1997 |
East Loki |
| Aug 2000 |
East and West Loki |
| Jul 2002 |
West Loki |
| Sep 2002 |
East Loki |
| Jul-Aug 2005 |
West Loki |
| Apr 2006 |
East Loki |
| Aug 2008 |
West Loki |
Two examples of uncertain eruptions at the East Loki cauldron follow. They occurred in November 1986 and August 1991. For the 1986 case, Björnsson and Einarsson (1990) stated, "There is a seismic indication that a small eruption occurred in 1986 during a Skaftá jökulhlaup from beneath the easternmost ice cauldron [figure 2]. The flood in Skaftá began on November 29, and on November 30 and the following day short bursts of continuous tremor were recorded on seismographs around Vatnajokull.... It is likely that the pressure release associated with the jökulhlaup triggered a short eruption that did not reach the surface of the glacier."
For the 1991 case, Björnsson and Einarsson (1990) reported that "Bursts of tremor were recorded on seismographs near Vatnajokull on Aug. 12, 1991, during a jökulhlaup in Skaftá. The course of events is similar to that of Nov. 30, 1986, and suggests that a small and short-lived eruption may have occurred beneath the Eastern Loki cauldron."
Based on the communication between Einarsson and GVP, the other cases in table 1 followed a similar pattern. For each of those events, the occurrence of a jökulhlaup was followed by either an eruption tremor or bursts of eruption tremor, which suggested the possibility of a small, subglacial eruption at East or West Loki.
Confirmed 1996 eruptions. There are two confirmed eruptions at Bardarbunga, both within a few weeks of each other in 1996 (1 and 2 below).
(1) Einarsson and others (1997) discuss the complex interplay of events that occurred during 29 September through 7 November 1996, which involved seismicity, dikes, jökulhlaups, and various eruptions at Bardarbunga, Grímsvötn and Gjálp (fissure between the two calderas). Einarsson and others (1997) start with this introduction: "A volcanic eruption beneath the Vatnajokull ice cap in central Iceland... began on September 30, 1996, along a 7-km-long fissure between the volcanoes Bardarbunga and Grímsvötn. The eruption continued for 13 days...."
They further note "... a minor subglacial eruption occurred on the southeast rim of the Bardarbunga caldera, 6-7 km to the north. Two small depressions formed in the ice surface there." Regarding this, Páll Einarsson added this comment in a 2015 email: "The small subglacial eruptions at the Bárðarbunga caldera rim, mentioned in our paper, are a separate event [from the one a few weeks later mentioned in (2) below]. They are evidenced by sinkholes in the glacier that were discovered late and the timing of these events is not known. Most likely the sinkholes were initiated during the Gjálp eruption, i.e. between September 30 and October 13."
(2) According to the Institute of Earth Sciences of the University of Iceland (IES, posting date uncertain), a small eruption took place at Bardarbunga in 1996. They wrote the following: "A small eruption started in Bardarbunga around 1300 hrs on November 6th. The eruption lasted for about 20 to 30 min. According to seismograms at the Meteorological office, the eruption was initiated by some intrusive activity. The intrusive activity is based on recorded eruption tremor picked up [by] the seismometers. Eruption column reached about 4 km in to the air. Relation between pressure decrease due to the flooding [has] been suggested as the main cause of the eruption." This eruption came a day after a jökulhlaup was released from the Grímsvötn caldera (BGVN 21:09 and 23:11, and IES (posting date uncertain). We have not found a clear description of where in the caldera the eruption took place on 6 November 1996.
In regards to the confirmed eruption of 6 November, Einarsson's email made these remarks: "Keep in mind that Bárðarbunga is very remote and observations of the activity are difficult and very dependent on weather conditions. The webpage of our institute describes a small explosive event that happened on Nov. 6 at the end of the large jökulhlaup, when the meltwater from the large Gjálp eruption was flushed down to the coast. Most of us think now that this was a phreatic reaction of the still hot edifice to the sudden pressure release when the caldera lake of Grímsvötn was emptied, i.e. not due to a fresh injection of magma. But observations were scarce and there may be other opinions on this."
2014-early 2015 activity. This section of the Bulletin report primarily summarizes events from 16 August 2014, when seismic activity began, into mid-January 2015. The eruption was still ongoing at that time.
Bardarbunga is monitored by a seismic network, an extensive GPS network, and various sensors such as webcams and infrared cameras. Monitoring and analyses at Bardarbunga is conducted by a group of collaborators that include the IMO, the Institute of Earth Sciences (IES) at the University of Iceland, and the National Commissioner of Police, and the Department of Civil Protection and Emergency Management.
Gudmundsson and others (2014) and IMO describe dike emplacement (without apparent breaching the ground surface) associated with a seismic swarm that began at the caldera and migrated tens of kilometers with branches to the N and NE during 16-31 August 2014. On 29 August 2014, two days before the swarm ended, an eruption was first documented at the surface at a flank vent devoid of ice cover ~45 km NE of the caldera.
Figures 3 and 4 help explain the location of volcanoes in Iceland and Bardarbunga lava that progressed northward as a dike and ultimately erupted in the Holuhraun vent.
The NE-trending dike reached an area outboard of the Vatnajokull ice cap at the Holuhraun volcanic field (figure 4), where the first clear eruption began on 29 August 2014. The fissure vent area was 4.5 km from the ice margin of the outlet glacier Dyngjujökull. The venting took place along an old fissure, and came out along an N-trending zone 600 m long. According to Gudmundsson and others (2014), that eruption was moderate and effusive.
Holuhraun is sometimes discussed in the context of Askja volcano (figure 4), which lies just to the N. Holuhraun is sometimes considered as peripheral vent system for Askja (Ialongo and others, 2015).
Figure 5 indicates the location of earthquakes during the first 16 days of dike emplacement (where days 1-16 correspond to 16-31 August 2014). Gudmundsson and others (2014) comment that "During this time, the dike generated some 17,000 earthquakes, more than produced in Iceland as a whole over a normal year." The venting to the surface at Holuhraun took place on 29 August 2014 and became strong by 31 August. In the early hours of the 29 August, the onset consisted of a minor, four-hour long, fissure eruption. The pattern on figure 5, depicting a 45-km-long dike injection along the rift system passing through Bardarbunga, testifies to the importance and utility of the seismograph in monitoring shallow magmatism leading to eruption.
According to IMO, seismic activity associated with Bardarbunga had gradually increased during the last seven years, although it temporarily diminished during the Grimsvotn eruption in May 2011. Vatnajokull GPS stations showed both upward and outward movements since early June 2014, and on 16 August 2014, the number of earthquakes significantly increased, with more than 300 earthquakes detected under the NW part of Vatnajokull ice cap (figure 5). As a result, the Aviation Color Code was increased to Yellow, the third level from the highest on a five color scale (Gray, Green, Yellow, Orange, and Red). On 18 August, IMO reported one earthquake swarm to the E and another swarm to the N of Bardarbunga. An M 4 earthquake occurred, the strongest in the region since 1996. By 18 August, 2,600 earthquakes had been detected at the volcano; earthquake locations from the E and N swarms had been migrating NE. In the evening of 18 August, earthquakes diminished in the N swarm. That same day the Aviation Color Code was raised to Orange.
According to IMO, GPS and seismic data during 20-26 August suggested that a NE-trending intrusive dike had increased from 25 to 40 km in length. During 22-26 August, several earthquakes in the 4.7-5.7 magnitude range had been detected at or near the volcano. These values were among the largest detected in the first few weeks of the swarm (Gudmundsson and others, 2014). The Aviation Color Code, chiefly Orange during this reporting interval, rose to the highest level, Red, several times during late August and September.
On 23 August seismic tremor indicated what IMO initially suggested was a small lava eruption at beneath the Dyngjujokull glacier (which is 150-400 m thick in this region). An overflight the next day found no evidence for an eruption.
On 27 August an overflight showed a 4- to 6-km-long row of cauldrons 10-15 m in diameter S of Bardarbunga.
Beginning on 31 August, lava erupted along a 1.5 km long fissure. During 1-2 September a white steam-and-gas plume rose to an altitude of 4.5 km and drifted 60 km NNE and ENE. Lava flowed N and lava fountains rose tens of meters. The number of earthquakes decreased from 500 earthquakes on 1 September to 300 earthquakes on 2 September. During the middle of September, seismicity persisted mainly around the caldera and the Dyngjujokull glacier.
On 2 September the lava had covered 4.2 km2 and was 4.5 km from the glacier's edge. By 3 September, the lava flow advanced ENE and covered 7.2 km2. The following day, the lava flow had an aerial extent of 10.8 km2. During 3-9 September, IMO observers noted ongoing lava effusion, high gas emissions, and elevated seismicity from the Holuhraun lava field. Ash production was almost negligible.
On 5 September, two new eruptive fissures were observed S of the main eruption site. These sites were less effusive and were located ~2 km from the edge of Dyngjujokull glacier (see this small shaded area in figure 2). The eruption also continued from the original fissure and generated a ~460 m high steam plume. Eventually, a row of craters formed along the eruptive fissure, the largest one was named Baugur crater.
The fissure eruption continued during 6-7 September, and the lava effusion rate was 100-200 m3/sec on 7 September (figures 6 and 7). Activity from the S fissures was less than that of the N fissure, which had been active since the beginning of the eruption. The advancing lava flow reached the W main branch of the Jökulsá á Fjöllum river (figure 4), which is fed by the icecap and exits the icecap ENE of the volcano. No explosive activity due to lava and river water interaction was observed, but steam rose from the area.
During 8-9 September, activity was no longer detected from the southernmost fissure. Lava continued to advance and interact with the Jökulsá á Fjöllum river. The extent of the lava flow reached 19 km2 and gas emissions remained high.
During 10-16 September, lava flows continued to advance at a consistent rate toward the E and W. A report on 22 September noted that the total volume of the erupted lava was 0.4-0.6 km3 and the flow rate was 250-350 m3/sec. By 30 September, the lava field was 46 km2, and the main flow had entered the river bed of Jökulsá á Fjöllum and continued to follow the river's course. Steam rose from the river where the lava was in contact with water but no explosive activity occurred.
Although reporting noted a lack of tall mobile ash plumes blown towards Europe and causing air traffic delays, the plumes remained lower and more local causing widespread air quality problems in Iceland. IMO reported continued gas emissions that included elevated SO2 emissions during 10-16 September and issued warnings to the public in the municipality of Fjarðarbyggð (180 km ENE of Bardarbunga) on 13 September. These emissions persisted through at least November.
During 17-23 September, chemical analysis and geophysical modeling indicated that the source of the magma was at a depth of more than 10 km. On 21 September, field scientists estimated that about 90% of the SO2 from the eruption originated at the active craters and the rest rose from the lava field. Dead birds were also found around the eruption site.
Seismic activity at the N part of the dike and around the vents declined in October 2014, although the lava field continued to grow and lava production continued at the same output. On 5 October, a new lava front emerged at the S edge of the main lava flow and advanced E.
On 18 October, an M 5.4 earthquake struck in the N part of Bardarbunga caldera, one of the biggest earthquakes since the start of the eruption. The growing lava field at Holuhraun was 66 km2 by 31 October. By late October, the fissure's main vent (Baugur crater) had constructed a local topographic high that stood 80 m higher than the local landscape.
In November, eruption-associated seismicity remained strong although an IMO report on the 19th suggested that the number of large, M~5 events seemed to be decreasing. FLIR thermal images of the craters on 18 November showed that by then the most intense area of thermal convection was at a crater in the N part of the eruption site. On 20 November, observers characterized the eruption in the crater as pulsating explosions every 10-15 minutes, followed by a gush of lava down the main channel with splashing on either side. During 25-26 November, the activity was characterized as pulsating, with lava surging from the vent for 2-3 minutes at intervals of about 5-10 minutes. The upper parts of the lava channel developed a sinuous appearance owing to a series of bulges in the channel's margins.
On 12 November, IMO indicated that it monitored gas releases from Holuhraun using DOAS and FTIR instruments to estimate the fluxes of SO2 and other gases in the volcanic cloud. In the first month and a half of the eruption, the average flux was 400 kg/s (~35,000 metric tons per day, t/d) with peaks up to 1300 kg/s (~112,000 t/d). The IMO calculated that, assuming a constant release of gas through 12 November, the eruption had injected into the atmosphere an amount of SO2 in the range 3.5–11.2 Mega tons, Mt (depending on whether the computed from the average or the peak flux).
On 27 November, observers indicated that a plume rose 3.1 km above the sandy plain. A thermal image from 1 December showed several changes to the lava field. In just over 24 hours there was a new lava extrusion at the NE margin that had traveled 450 m. A new flow traveled N in an area just W of the lava lake. One or more new flows also developed S of the lava lake. The lava field from this eruption was just over 75 km2.
In early December, data also showed a decline in the eruption's intensity, although seismic activity remained strong. By 9 December, the lava field at Holuhraun had covered just over 76 km2, making its aerial extent the second largest in Iceland (but still considerably smaller than the largest historical field created by the Laki fissure eruption of 1783-1784). By 18 January 2015, the lava covered an area of 85 km2. A NASA photo of the lava flow is shown in figure 8. The vent area contained a lava lake, a large mass of highly radiant (molten, red-colored) lava.
According to the IMO, the ongoing eruption's very gas-rich emissions had affected the entire country. IMO stated that "we have to go 150 years back to find an event (Trölladyngja) that had a comparable impact on Iceland and its inhabitants, in terms of environmental and health issues."
Radar measurements of the flow field during a surveillance flight on 30 December 2014 provided preliminary evidence that lava thickness averaged ~10 m in the eastern part, ~12 m in the center, and at least 14 m in the western part. IMO indicated that the preliminary estimate of the lava volume was 1.1 km3. (A later estimate in 2015 took the volume to 1.4 km3, roughly 10% of the Laki fissure eruption.)
IMO reported that during 31 December-6 January fresh lava flowed N and also to the E where in part it transited through a closed channel (shallow lava tube). During 7-20 January 2015, IMO noted that the lava field expanded along its N and NE margins. Seismicity remained strong and local air pollution from gas emissions persisted. IMO said that on the days10 and 15 January the lava field covered 84.1 and 84.3 km2, respectively.
Figure 9 shows the eruption on 21 January 2015.
Subsidence. The caldera had been subsiding during the reporting period. The subsidence at Bardarbunga caldera was visible on the ice surface and was interpreted as reflecting deformation of the caldera itself. The depression developed in a roughly bowl-shape area that, as of 20 January 2015, was about 80 km2 in area with a volume exceeding 1.5 km3.
Figure 10 shows the chronology of subsidence levels between 5 September 2014 and 30 December 2014. The subsidence in the center of the caldera was about 60 m by 20 January 2015, a value determined by comparing the ice surface elevation with that elevation at the same location before the beginning of the collapse. Gudmundsson states that the assumption is that the ice surface lies more or less passively on top of the bedrock in the caldera. As of 20 January, no evidence of major ice melting had been observed; however, increased geothermal activity on the caldera rims has resulted in ice depressions over the hot spots. Other ice depressions on the Dyngjujokull glacier were also observed, suggesting that small, short sub-glacial eruptions may have occurred there. According to Gunnar Gudmundsson, there was no evidence of a subglacial eruption within the caldera.
During early December, IMO reported that the Scientific Advisory Board of the Icelandic Civil Protection had reviewed data from the beginning of the eruption to 3 December. They acknowledged that the subsidence rate had decreased during that time, dropping from highs of up to 80 cm/day down to 25 cm/day, with most of the subsidence concentrated at the caldera center.
References. Björnsson, H. and Einarsson, P., 1990, Volcanoes beneath Vatnajokull, Iceland: Evidence from radio echo-sounding, earthquakes and j kulhlaups, Jökull, no. 40, pp 147-168.
Carrivick, J and Gertisser, R, 2014, Bardabunga: eruption develops in Iceland, Geology Today, v. 30, Issue 6, pp. 205-206, November/December 2014, John Wiley & Sons Ltd.
Einarsson, P., B. Brandsdóttir, M. T. Gudmundsson, H. Björnsson, K. Grínvold, and F. Sigmundsson, 1997, Center of the Iceland hotspot experiences volcanic unrest, Eos Trans. AGU, 78(35),369–375, doi:10.1029/97EO00237.
Einarsson, B., 2009, Jökulhlaups in Skaftá: A study of a jökulhlaup from the Western Skaftá cauldron in the Vatnajokull ice cap, Iceland, Thesis for Master of Science in Geophysics degree, School of Engineering and Natural Sciences, Faculty of Sciences, University of Iceland, (URL: https://notendur.hi.is/~mtg/nemritg/BE-MS_2009.pdf)
Gudmundsson, A, Lecoeur, N, Mohajeri, N, and Thordarson, T, 2014, Dike emplacement at Bardarbunga, Iceland, induces unusual stress changes, caldera deformation, and earthquakes. Bulletin of Volcanology, vol. 76, no. 10, pp. 1-7.
Hartley, M. E., and Thordarson, T., 2013, The 1874–1876 volcano-tectonic episode at Askja, North Iceland: Lateral flow revisited. Geochemistry, Geophysics, Geosystems, vol. 14, no. 7, pp. 2286-2309.
Ialongo, I., Hakkarainen, J., Kivi, R., Anttila, P., Krotkov, N. A., Yang, K., & Tamminen, J., 2015, Validation of satellite SO2 observations in northern Finland during the Icelandic Holuhraun fissure eruption. Atmospheric Measurement Techniques Discussions, vol. 8, no. 1, pp. 599-621.
Institute of Earth Sciences (IES), 1996, The Gjálp eruption in Vatnajokull 30/9 - 13/10 1996, Institute of Earth Sciences (IES), University of Iceland, Accessed on 31 March 2015 (URL: http://earthice.hi.is/gjalp_eruption_vatnajokull_309_1310_1996) .
Larsen, G. and Gudmundsson, M. T., 2014, Volcanic system: Bárðarbunga system, pre-publication extract from the Catalogue of Icelandic Volcanoes, Accessed on 4 April 2015, (URL: http://blog.snaefell.de/images/Bardarbunga_kafli20140825.pdf).
Icelandic Meteorological Office, 2010, List of recent volcanic eruptions in Iceland, Accessed on 31 March 2015 (URL: http://en.vedur.is/earthquakes-and-volcanism/articles/nr/1874).
Marteinsson, V.T., Rúnarsson, Á., Stefánsson, A., Thorsteinsson, T., Jóhannesson, T., Magnússon, S.H., Reynisson, E., Einarsson, B., Wade, N., Morrison, H., and Gaidos, E., 2013, Microbial communities in the subglacial waters of the Vatnajokull ice cap, Iceland, The ISME Journal, vol. 7, pp. 427–437, doi:10.1038/ismej.2012.97, (URL: http://www.nature.com/ismej/journal/v7/n2/full/ismej201297a.html).
Seibert, L., Simkin, T., and Kimberly, P., 2010, Volcanoes of the World (Third Edition), pp. 204-205, University of Cailfornia Press, ISBN 978-0-520-26877-7.
Geologic Background. The large central volcano of Bárðarbunga lies beneath the NW part of the Vatnajökull icecap, NW of Grímsvötn volcano, and contains a subglacial 700-m-deep caldera. Related fissure systems include the Veidivötn and Trollagigar fissures, which extend about 100 km SW to near Torfajökull volcano and 50 km NE to near Askja volcano, respectively. Voluminous fissure eruptions, including one at Thjorsarhraun, which produced the largest known Holocene lava flow on Earth with a volume of more than 21 km3, have occurred throughout the Holocene into historical time from the Veidivötn fissure system. The last major eruption of Veidivötn, in 1477, also produced a large tephra deposit. The subglacial Loki-Fögrufjöll volcanic system to the SW is also part of the Bárðarbunga volcanic system and contains two subglacial ridges extending from the largely subglacial Hamarinn central volcano; the Loki ridge trends to the NE and the Fögrufjöll ridge to the SW. Jökulhlaups (glacier-outburst floods) from eruptions at Bárðarbunga potentially affect drainages in all directions.
Information Contacts: Icelandic Met Office (IMO) (URL: http://en.vedur.is/); London Volcanic Ash Advisory Centre (URL: http://www.metoffice.gov.uk/aviation/vaac/); Institute of Earth Sciences (IES), University of Iceland (URL: http://earthice.hi.is); Pall Einarsson, IES, University of Iceland; Gunnar Gudmundsson, IMO; Magnus Tumi Gudmundsson, IES, University of Iceland (URL: http://earthice.hi.is); National Commissioner of Police, Department of Civil Protection and Emergency Management (URL: http://avd.is/en/):NASA Earth Observatory (URL: http://earthobservatory.nasa.gov); Peter Hartree, Reykjavik, Iceland (UR: https://web.peterhartree.co.uk/).
Klyuchevskoy (Russia) — October 2014 Cite this Report
Klyuchevskoy
Russia
56.056°N, 160.642°E; summit elev. 4754 m
All times are local (unless otherwise noted)
Two eruptive pulses: 15 August-20 December 2013 and 1 January-24 March 2015
During mid-2013 to early 2015, Klyuchevskoy had two strong eruptive pulses with an intervening lull. The first pulse occurred 15 August-20 December 2013 (~3 months of eruption). Ash plumes and related eruptive activity halted during 2014 until about January 2015 (12 months pause). The second pulse occurred very late December 2014 or very early January 2015 through at least 24 March 2015 (~3 months of eruption).
We start by discussing the latter portion of the first pulse, covering the interval 15 November to 20 December 2013. That time period was missing from our earlier reporting, which ended with our last report (BGVN 38:07) summarizing eruptions during October 2012 through 14 November 2013.
In a later subsection labeled "2015," we discuss the second of the two eruptive pulses. The Global Volcanism Program requires an eruptive repose of three or more months before an eruption is considered to be over; thus, at the time of this writing (6 April 2015), it is too early to tell whether 24 March will hold true as the end date for the later pulse.
We base this report on the reporting interval from the Kamchatkan Volcanic Eruption Response Team (KVERT). Table 15 in BGVN 38:07 delineates the Aviation Color Code (a four-step code from a low of Green, advancing from Yellow to Orange, and ultimately to a high of Red). Klyuchevskoy is also spelled alternatively Kliuchevskoi, Klyuchevskaya Sopka, and Klyuchevskaya.
Late 2013 activity (and lull during 2014). KVERT documented that eruptions were common during 15 August 2013-20 December 2013 (continuing for about 5 weeks beyond our last Bulletin report). Figure 16 shows a photo taken on 16 November 2013 (UTC) by an astronaut aboard the International Space Station. This low angle image highlights some interesting plume dynamics–whereby the dark material at left branches off from a lighter colored plume trending farther to the right (heading ESE)). A NASA Earth Observatory article (posted in 2 December 2013) commented: "The plume—likely a combination of steam, volcanic gases, and ash—stretched to the [ESE] due to prevailing winds. The dark region to the [NNW] is likely a product of shadows and of ash settling out. Several other volcanoes are visible in the image, including Ushkovsky, Tolbachik, Zimina, and Udina. To the [SSW] of Klyuchevskoy lies Bezymianny Volcano, which appears to be emitting a small steam plume (at image center)."
During the reporting interval, KVERT issued multiple reports of a type called a VONA (Volcano Observatory Notices for Aviation), and they provide a record of eruptive activity at Klyuchevskoy. A VONA issued at 0242 on 17 November 2013 indicated that web camera assessments revealed strombolian eruptions with strong gas and steam; an ash plume rose to 7 km altitude and blew 160 km E. The four-step Aviation Color Code (low to high, Green, Yellow, Orange, and Red) rose to Orange. The VONA issued the next day at 0246 on the 18th (UTC) indicated significant decrease in eruptive activity, including a lack of ash plume during the last several hours, but with cautions that aerosols with ash were still possible at low altitudes.
Two VONAs were issued on 19 November 2013; the first at 0248 (UTC) raised the Aviation Color Code from Yellow to Red. This VONA noted that based on seismic data strong ash explosions had resumed at 0216 UTC on the 19th. Visual data showed ash plumes up to 10-12 km altitude extending unstated distances SE.
The VONA for 2341 on the 19th reported a lowered Color Code, to Orange, in response to lowered ash plumes (at 5-5.5 km altitude) during the previous several hours. The plumes blew unstated distances N and NE.
2014. The VONAs for December 2013 and into early January 2014 mentioned some still robust plumes, but the eruption ended on 20 December. A 3 December 2013 VONA indicated that an explosive eruption had seemingly stopped on 19 November, but this was ruled out by a 6 December VONA that again raised the Color Code to Red associated with strong ash plumes up to 5.5-6.0 km altitude and extending over 212 km NE of the volcano.
More information about the 3 December 2013 eruption came out in the 12 December WIR (emphasis added and plume length converted to kilometers): "Seismicity of the volcano increased on December 06, and began to decrease on December 10. Video data showed ash plumes rose up to [5-6 km altitude] on December 06-10. Satellite data showed a very weak thermal anomaly over the volcano summit; ash plumes extended about [1020 km in] the different directions [from] the volcano: to the [E] on December 06-08, to the [NW] on December 09-10, and to the [E and SE] on December 10-11 [2013]." This 1020 km long ash plume was among the longest documented during the reporting interval.
On 7 December a VONA announced the Color Code had dropped to Orange although explosive eruption continued. Video and satellite data revealed a 5.5-km-altitude, NE-directed plume of unstated length. Also, volcanic tremor remained at the previous level (0.7-1.0 mcm/s) and shallow volcanic earthquakes registered.
VONAs issued on 26 December 2013 and 2 January 2014 stated the eruption had ended. The later report noted the eruption end date of 20 December 2014.
No further VONAs were issued for Klyuchevskoy during the remainder of 2014.
2015. Late in 2014, KVERT reported that both the abundance and the magnitude of shallow volcanic earthquakes began to increase during 19-20 December 2014 and again on 31 December 2014; tremor became constant. The volcano was cloaked in clouds during 31 December 2014 to 1 January 2015, but KVERT judged that a strombolian eruption probably began on 1 January 2015, which is consistent with a satellite thermal anomaly. On 2 January 2015, the Aviation Color Code rose from Green (normal) to Yellow (which is a sign of elevated unrest). During the course of January 2015 the volcano resumed frequent eruptive activity and that month KVERT issued ~15 VONAs for Klyuchevskoy. The eruption stopped on 24 March 2015 and any later events after 6 April 2015 extend beyond the current reporting period.
Besides the VONAs, KVERT also creates Weekly Information Releases (hereafter WIRs). The WIR issued on 8 January 2015 stated that both strombolian explosive eruptions of the volcano and associated incandescence continued. Lava bombs rose up to 200-300 m above the crater and ash plumes to ~5 km altitude. Seismic activity of the volcano continued to increase. The magnitude of tremor increased from 3 to 13 x10-5 m/sec. (Note that KVERT reported tremor in units reflecting the velocity of the seismic sensor. They state these units as "mcm/s," 'milli-centimeters per second', which are equivalent to 10-5 m/sec, the means of expression used in this report.) Video data on the 4th and 7th revealed strong gas-steam emissions. Clouds obscured the volcano during other days of the week. Satellite infrared data showed a bright thermal anomaly over the volcano all week.
KVERT's 16 January WIR noted clear visibility of the summit area where bombs were ejected 200-300 m above the summit crater. Strombolian and vulcanian eruptions produced a series of ash plumes that rose to 5-8 km altitude (table 16). The Aviation Color Code increased to Orange.
Figure 17 shows a strombolian eruption at the summit on 19 January 2015. The KVERT caption reported that at this time two centers of strombolian activity and lava flows could be observed at the summit crater. About a week before, video images suggested a new lava flow had started to discharge downslope, and by mid-January through March, lava flows were regularly indicated in KVERT reports (two were seen on the NW slope on 15 March).
The lava flows led to phreatic explosions at the lava flow front. These produced gas-and-steam clouds with minor amounts of ash that during 27-28 January rose to an altitude of 7-8 km. Ashfall was reported in nearby (table 16). Consistent with the lava flows and the spatter from strombolian eruptions, satellite images consistently showed thermal anomalies over the volcano.
On 15 February, a series of explosions generated ash plumes that rose to an altitude of 8 km, prompting KVERT to raise briefly the Aviation Color Code to Red. Later that day, it was lowered to Orange. During the second half of February, bombs were ejected 150 m above the crater, rather than up to ~300 m, as earlier. Towards the end of February they were no longer reported although that may have been due to lack of visibility or the spatter and bombs may have decreased in size to the point where such emissions became difficult to observe.
On 9 March, the magnitude of seismic tremor significantly decreased. Only moderate emissions of steam and gas were observed, and a thermal anomaly over the summit disappeared. The Aviation Color Code was lowered to Yellow. On 10 March, seismic tremor significantly increased again, prompting KVERT to raise the Aviation Color Code to Orange. Video images showed moderate gas-and-steam activity, while satellite images detected a gas-and-steam plume with small amounts of ash. During 10-17 March, a weak thermal anomaly was detected occasionally over the summit. The eruption continued through the middle of March, but the energy of the explosions decreased significantly, prompting KVERT to lower the Aviation Color Code to Yellow on 25 March.
As of 2 April 2015, KVERT reported that moderate activity continued, with strong fumarole activity. As previously mentioned, KVERT described the explosive eruption as ended on 24 March (table 16).
Table 16. Plume characteristics at Klyuchevskoy during 10 January to 2 April 2015 (UTC). -- means not reported, Bhgt stands for the height above the crater to which bombs were thrown (in meters). Data do not include low-rising emissions. KVERTs satellite-based assessment of the ash content in plumes was generally determined by methods discussed by Ellrod (2012) and Ackerman and others (undated) and references therein. The table was assembled largely from KVERT VONAs and their Weekly Information Releases (WIRs).
| Time period |
Max. plume altitude (km) |
Drift length and direction |
Remarks |
| 01 Jan-11 Jan 2015 |
-- |
-- |
(2nd) VONA this day (the only one until the 11th) reported strong and moderate gas-steam plumes during past weeks. Weak thermal anomaly at both the summit and at a SW-flank. Seismically active.
WIR issued on 2nd noted that explosive eruption probably continued, and a thermal anomaly appeared on the 1st. Weather clouds often masked visibility. WIR issued the 11th noted strong gas-and-steam emissions and strombolian eruptions. Bhgt 200-300 m. Thermal anomaly, but absence of ash plumes during past week. Clouds often blocked views. Aviation Color Code (2nd and 11th): Yellow |
| 12 Jan-15 Jan 2015 |
5-7 (11-15th) |
In general, 160 km SW and NE |
On 11th, ~35 km @ 5 km alt. SSE WIR issued 16 Jan noted the following: Moderate explosive activity. Ashfall in Kozyrevsk village. Bhgt 200-300 m. Thermal anomalies all week. Intervals of increased seismicity and tremor. Aviation Color Code: mainly Orange through 20 March
(10-12th) Strong explosive events; ash clouds rose up to 6-10 km alt., strong ashfall on 12th at Klyuchi village (~50 km W of volcano).
(10-12th; 15-16th) Ash plumes drifted over 200 km W and SW of volcano. |
| 16 Jan-22 Jan 2015 |
5-7 |
210 km SW, NW, NE |
WIR issued 23 Jan noted the following: Moderate explosive activity. Bhgt: 200-300 m. Satellite IR thermal anomaly was consistent with hot lava. E flank lava flow noted.
(21st) Ashfall in Klyuchi village. |
| 23 Jan-29 Jan 2015 |
5.5-7 & more (at right) |
300 km various (W, N, NE, E, and SE) |
WIR issued 30 Jan noted the following. Moderate explosive activity. Good summit visibility; incandescence and thermal anomaly all week. Bhgt: 200-300 m. E flank lava flow.
(27-28th) Phreatic explosions at the advancing E-flank lava front produced gas-and-steam plumes with minor amounts of ash that rose to 7-8 km. Ashfall on 27th both in Klyuchi village and near the Khapitsa river, and on 28th in Kozyrevsk village. |
| 30 Jan-04 Feb 2015 |
5-6 Various during week. |
(4-5th) 1,000 km NW and N |
WIR issued 5 Feb noted the following. Moderate explosive activity. Ongoing strombolian and vulcanian eruptions all week; Bhgt 200-300 m; advancing E flank lava flows and consistent thermal anomalies.
(5th) Ashfall in Klyuchi village. |
| 05 Feb-12 Feb 2015 |
5.5-6.5 |
400 km, mainly NW and N |
WIR issued 13 Feb noted the following. Moderate explosive activity. Ongoing strombolian and vulcanian eruptions all week. On 7th, ashfall in Kozyrevsk village and on 11th in Klyuchi village. Bhgt 200-300 m. |
| 13 Feb-20 Feb 2015 |
5-8 |
Up to 600 km, mainly E, SE, and S during week |
WIR issued 21 Feb noted strombolian and vulcanian eruptions: Bhgt: 150 m. (13-16th) Ashfall in Klyuchi village (temporary elevation of Avaiation Color Code to Red). |
| 21 Feb-27 Feb 2015 |
5-6 |
90 km NE |
WIR issued 28 Feb noted continuing strombolian and vulcanian eruptions and ash explosions. Bhgt not reported in this or later WIRs. |
| 28 Feb-05 Mar 2015 |
5-6 |
400 km, mainly E, SE, and NE during week |
WIR issued 6 Mar noted moderate eruption continued and still included strombolian and vulcanian eruptions, ash explosions, and summit glow. Thermal anomalies all week. |
| 06 Mar-11 Mar 2015 |
5-6 (8th and 10th) |
~338 km broadly E |
WIR issued 12 Mar noted moderate explosive eruptions continued this week. Thermal anomalies on 7th and 10-11th. (9th) Moderate emissions of steam and gas; (10th) similar to 9th but with minor ash. |
| 12 Mar-20 Mar 2015 |
5-5.5 |
90 km, broadly E |
WIR issued 20 Mar noted moderate ongoing eruption but significantly weaker than in previous weeks. Thermal anomaly weak. Better visibility during 16-17th, poor on other days.
(16-17th) (includes observations to left); poor visibility on other days;.) Aviation Color Code Orange |
| 21 Mar-26 Mar 2015 |
-- |
-- |
WIR issued 27 Mar: End of explosive eruption on 24th. Strong fumaroles persisted. Gas-steam plumes containing small amounts of ash on 22nd-23rd. Weak thermal anomaly all week. Aviation Color Code, Yellow. |
| 27 Mar-06 Apr 2015 |
-- |
-- |
WIR issued on 3 Apr stated that strong fumarolic activity and weak thermal anomalies both continued, but that clouds blocked view except for 30th. VONA was issued on 6th: Both high seismicity and moderate gas-steam emissions continued. Aviation Color Code on 3rd Yellow, changing on 10th to Green. |
References: Gary Ellrod, 2012, Remote Sensing of Volcanic Ash, National Weather Association (URL: http://www.nwas.org/committees/rs/volcano/ash.htm).
Ackerman, S., Lettvin, E, Mooney, M, Emerson, N, Lindstrom, S, Whittaker, T., Avila, L, Kohrs, R, and Bellon, B., undated, Satellite applications for geoscience education [online course; Facilitating the use of satellite observations in G6-12 Earth Science Education] University of Wisconsin and University of Washington (URL: https://cimss.ssec.wisc.edu/sage/geology/lesson3/concepts.html).
Geologic Background. Klyuchevskoy is the highest and most active volcano on the Kamchatka Peninsula. Since its origin about 6,000 years ago, this symmetrical, basaltic stratovolcano has produced frequent moderate-volume explosive and effusive eruptions without major periods of inactivity. It rises above a saddle NE of Kamen volcano and lies SE of the broad Ushkovsky massif. More than 100 flank eruptions have occurred during approximately the past 3,000 years, with most lateral craters and cones occurring along radial fissures between the unconfined NE-to-SE flanks of the conical volcano between 500 and 3,600 m elevation. Eruptions recorded since the late 17th century have resulted in frequent changes to the morphology of the 700-m-wide summit crater. These eruptions over the past 400 years have originated primarily from the summit crater, but have also included numerous major explosive and effusive eruptions from flank craters.
Information Contacts: Kamchatka Volcanic Eruption Response Team (KVERT), Far East Division, Russian Academy of Sciences, 9 Piip Blvd., Petropavlovsk-Kamchatsky, 683006, Russia (URL: http://www.kscnet.ru/ivs/); Kamchatka Branch, Geophysical Service, Russian Academy of Sciences (KB GS RAS) (URL: http://www.krsc.ru/english/network.htm); NASA Earth Observatory (URL: http://earthobservatory.NASA.gov/); and William L. Stefanov, Jacobs Technology/ESCG, NASA Johnson Space Center, Houston, Texas.
Merapi (Indonesia) — October 2014 Cite this Report
Merapi
Indonesia
7.54°S, 110.446°E; summit elev. 2910 m
All times are local (unless otherwise noted)
During June 2011 to December 2014, several eruptions and elevated seismicity
This report details activity and monitoring at Merapi from 13 June 2011 through December 2014.
The last major eruption at Merapi was in 2010 as discussed in the previous two reports. As noted in BGVN 36:01 (covering 26 October 2010 to January 2011), Merapi began to erupt on 26 October 2010 and continued erupting throughout the interval, causing ~400 fatalities. BGVN 36:05 (26 October 2010 to 12 June 2011) further discussed this eruption detailing new dome growth and how lahars damaged infrastructure.
During the current reporting interval (13 June 2011 through December 2014), Merapi erupted regularly amid elevated seismicity. This report chiefly derives from three sources: (1) Balai Penyelidikan dan Pengembangan Teknologi Kegunungapian (BPPTK), (2) Pusat Vulkanologi dan Mitigasi Bencana Geologi (PVMBG; here referenced as CVGHM which stands for Center for Volcanology and Geological Hazard Mitigation), and (3) the Darwin Volcanic Ash Advisory Center (VAAC).
Activity during 2011.The hazard status for Merapi from 13 June 2011 onwards was Alert, Level II (on a scale of I–IV), before it decreased during 12–18 September 2011 and remained at Normal, Level I. Several minor avalanches occurred, with noted incidents on 2, 4, 6, 7, 14, and 25 July; 2, 7, and 15 August; and 4 and 8 September. Merapi also released several plumes, most of which consisted of white, thin or thin-to-thick clouds that rose to a maximum of only a few hundred meters above the summit (table 21).
Table 21. From 13 June to 31 December 2011, the plumes released by Merapi were generally described as thin or thin-to-thick and white in color. The only exception was apparent puffing associated with the plume on 10 July 2011, which lasted ~3 hours. Courtesy of BPPTK weekly reports from 2011.
| Date |
Time (Local Time) |
Max. height above the crater(m) |
| 19 Jun 2011 |
2100 |
200 |
| 03 Jul 2011 |
2015 |
600 |
| 04 Jul 2011 |
2043 |
600 |
| 10 Jul 2011 |
2100-2400 |
200 |
| 16 Jul 2011 |
2115 |
400 |
| 18 Jul 2011 |
1750 |
350 |
| 25 Jul 2011 |
1510 |
400 |
| 07 Aug 2011 |
2150 |
400 |
| 10 Aug 2011 |
2028 |
600 |
| 18 Aug 2011 |
2015 |
200 |
| 03 Sep 2011 |
3002 |
350 |
| 08 Sep 2011 |
1950 |
100 |
| 16 Sep 2011 |
1650 |
200 |
| 10 Oct 2011 |
1805 |
150 |
| 23 Oct 2011 |
1740 |
125 |
| 26 Oct 2011 |
1840 |
100 |
| 06 Nov 2011 |
1456 |
400 |
| 09 Nov 2011 |
1720 |
400 |
| 02 Dec 2011 |
1740 |
150 |
| 05 Dec 2011 |
1700 |
200 |
| 14 Dec 2011 |
1929 |
900 |
| 31 Dec 2011 |
2110 |
90 |
The non-tremor seismicity at Merapi in 2011 (figure 54) was categorized into four types of earthquakes, each of which had different patterns on the time-series plots. The seismicity was also described in terms of Real-time Seismic Amplitude Measurement (RSAM), (not shown here). In 2011, avalanche earthquakes and multiphase earthquakes dominated the record.
A key means of measuring changes in linear length at Merapi consisted of surveys employing Electronic Distance Measurement (EDM) instruments (figure 55). The instruments computed the distance from several reflectors positioned on Merapi's slopes to fixed points at surrounding observatory posts. Figure 56 (below) provides the location of the posts and reflectors mentioned. Length changes were generally in the range of a few centimeters.
Activity during 2012. A thin, white plume rose to a maximum of 150 m above the crater at 1910 on 6 January, and storms and heavy clouds covered Merapi's summit. On 9 January at an unstated time, a photo from CCTV Deles (discussed by BPPTK) showed Merapi amid clear weather with a white billowing cloud rising from the crater area. A few days later, at 1835 on 15 January, Merapi ejected a thin, white plume, rising to a maximum of 100 m above the summit, heading W. Thin, white plumes were also observed above the crater to 50 m, heading E on 1 February at 1720; to 500 m at 1745 on 11 February; and to 400 m at 1800 on 13 February. During 30 July to 5 August 2012, BPPTK referred to thick, white plumes drifting from the volcano. One plume reached a maximum of 600 m above the crater at an unstated date around this time. For the intervals in 2012 discussed above, the hazard status remained constantly at Normal (I). Furthermore, during 2012, the BPPTK recorded the seismicity (figure 57) and the EDM linear length (figure 58).
Activity during 2013. A thick plume blew W and reached a maximum of 450 m above the crater at 1750 on 3 February. The hazard status was at Normal (I).
On 22 July at 0415, BPPTK observed an ash eruption with brown-to-black color, reaching 1 km above the crater. A roar was heard within a radius of 6–7 km around Merapi, and ash fell to the SE, S, and SW. The hazard status remained at Normal (I); the Aviation Color Code was at Orange. According to a news article (Yahya, 2013), the eruption caused hundreds to temporarily evacuate; they returned to their homes later the same day. On 29 October 2013, BPPTK observed a white, thin-to-thick plume that reached 150 m above the summit, heading W.
On 18 November 2013, Merapi erupted. A news article in the Jakarta Post discussed the event extensively quoting BPPTK staff (Muryanto and Ayuningtyas, 2013). The article said that the eruption began at 0453 LT forming a plume that rose to 2 km above the crater. Ash fell until about 1000 that day, with noticeable amounts found up to 60 km to the E. The news report also noted that ~600 families "in Kalitengah Lor, Kalitengah Kidul and Srune hamlets, and in Glagaharjo village, Sleman regency, Yogyakarta, had immediately gathered to be evacuated" and that "villagers in Turgo village, Turi district, Sleman, located on the western flank of Mount Merapi, also fled their homes, [returning] a few hours later as the situation returned to normal." The eruption followed an M 4.7 tectonic earthquake detected in Ciamis, West Java earlier that day and was more powerful than a previous eruption on 22 July 2013 (Muryanto and Ayuningtyas, 2013).
Based on a Darwin VAAC report at 2025 LT on the same day (18 Nov), the eruption formed a plume that reached ~12.2 km altitude. The Aviation Color Code was increased to Red. By 2104 on the 18th, VAAC satellite analysis no longer detected the high altitude volcanic plume, but the VAAC reported a lower plume at ~4.6 km altitude. At 0300 on 19 November, the low level plume had extended to ~46 km E. However, by 0735, the plume had completely dissipated, and the Aviation Color Code returned to Orange.
BPPTK noted the seismicity (figure 59), the EDM linear length (figure 60), and the tilt (figure 61). In 2013, seismicity was dominated by avalanche earthquakes (figure 59). The only major change in linear length was the distance to Kaliurang 2 which had a gradual upward trend for most of the year, before a comparatively rapid downward trend in mid-October (figure 60). The two tiltmeter records showed broad consistency, with mild increases in the middle to late part of the year that reverted near to the original tilt (figure 61). The temperature graph had a broad peak in August 2013 that could account for some of the increase in tilt, but the BPPTK report did not discuss this in any detail. (For the location of the tiltmeter stations mentioned, see figure 62.)
Activity during 2014. BPPTK noted that on 17 January at 1615, a white plume rose to 50 m above the summit, heading E.
At 1854 LT on 10 March 2014, Merapi erupted forming an ash plume that blew W. The event was captured on an automated closed-circuit video (CCTV Pasarbubar) and was followed by two more blasts within a minute (the first at 1855). At 1908, BPPTK noted a volcanic earthquake (with a maximum amplitude of 20 cm). Another video monitor (CCTV Bubar) recorded brown eruptive columns that rose straight up, reaching up to ~1.5 km above the summit. During 1925 to 1930, the eruption gradually stopped. Around this time, ash fell on several villages including Umbulharjo, Kepuharjo, Sidorejo, and Balerante, areas located ~6–7 km to the S of Merapi.
During 14-20 March 2014, thick gas plumes rose to ~600 m above the summit. On 17 March, the BPPTK recorded one such event at 0530.
On 27 March 2014, an eruption lasted from 1312 to 1316 LT. The VAAC detected volcanic ash to ~9.8 km altitude, using multi-spectral MTSAT-2 imagery, and the Aviation Color Code was raised to Red. A pilot reported that the "large ash cloud [was] moving NW." Darwin VAAC received a SACS SO2 alert at 2150 for the plume, and atmospheric SO2 gas was detected SE of Merapi. By 2232, the volcanic ash appeared to be dissipating; the advisory was terminated at 0830 on 28 March.
The 27 March eruption was the subject of a Jakarta Post news article by Muryanto and Ayuningtyas (2014), who indicated that ash fell in the Kemalang and Balerante Klaten regency and that it was 1 mm thick in some areas. The article also noted an M 5.4 tectonic earthquake that struck ~115 km SE of Malang regency, East Java on 23 March. The ash discharge had apparently been occurring regularly since the 2010 eruption but authorities had not taken this as a sign of an escalation in activity, and they urged locals to remain calm. However, according to the article, Sukiman, a resident of the nearby Deles district, said villagers responded to half an hour of ash falling by hitting "kentongan [bamboo drums] to warn others of the danger."
On 15 April, BPPTK reported that a thick white plume rose to a maximum of 300 m above the summit.
Several tectonic earthquakes occurred in April 2014. On 18 April at 2033, BPPTK recorded tectonic earthquakes 151 km SW of Merapi at a depth of 10 km. On 19 April, four more tectonic earthquakes occurred between 0800 and 2000, and an earthquake lasting 20 minutes was recorded at 0421 from a station on the peak of Merapi. On 20 April from 0426 to 0440, rumbling could be heard within a radius of 8 km around the volcano.
The BPPTK reported that on 20 April at 1600, an ash plume traveled W towards the village of Sewukan, amid foggy conditions. The associated eruption was followed by a widely heard roar and a later thin-to-thick plume rose to 400 m above the summit at 1800. The activity ultimately led to ashfall in Sewukan and in sectors to the SE, S, and SW, up to 15 km away from Merapi's summit.
The ash from this eruption was also detected by Darwin VAAC, who stated that the ash plume rose to ~10.7 km and extended ~260 km W to NW. The ash was difficult to distinguish from meteorological clouds, and at 1004 LT on 21 April, the VAAC terminated the advisory. In a news article, Minggu (2014) added further details on the eruption omitted here.
The BPPTK conducted a field expedition on 22 April to Merapi's crater. The expedition found that the eruption on 20 April had changed the summit crater morphology (figure 63). The slit that cut through the lava dome trending NE had widened by 70 m to the W, and reddish material that the team judged as indicative of oxidation was visible around the center of the lava dome. They also found new eruptive products along the crater's W side and evidence of new growth at the lava dome.
The BPPTK reported that monitoring outposts heard as many as 47 thumping sounds between 25 April and 1 May 2014, 20 sounds between 2 and 8 May, and 22 sounds between 9 and 15 May. On 25 April at 0740, a white, fumarolic plume rose to a maximum of 450 m above the summit, heading W, and the hazard status was raised to Alert (II). White, thin-to-thick plumes rose above the summit to 650 m on 2 May at 0700; to 350 m on 12 May at 0606; to 450 m on 22 May at 1924; to 300 m, heading W, on 27 May at 1854; and to 400 m on 31 May at 2010. The hazard status was lowered to Normal (I) during 21–27 May.
On 4 July 2014 at 1754, BPPTK observed thin-to-thick white plumes rising to 450 m above the summit.
On 10 September at 2008, thin, white plumes rose to 200 m above the summit, according to BPPTK.
During 10 to 16 October, Merapi released a thin white plume to ~200 m above the summit. The Darwin VAAC noted that small rock avalanches extended for ~1 km.
For 2014, BPPTK noted the seismicity (figure 64), EDM linear length (figure 65), and tilt (figure 66).
Background. Several detailed maps of Merapi have been published by various sources. Handisantono and others (2002) contains a topographic hazard map of Merapi. The map includes the location of several villages mentioned in this report, as wells as rivers and other geological landmarks. BNPB also published a map of Merapi (figure 67). The map highlights the location of the W/SW/S-flank drainage systems, which have the potential to funnel lahars to local infrastructure such as bridges and into inhabited areas.
A detailed analysis of Merapi's history and periods of activity is documented by CVGHM (2014). The ongoing magmatism and volcanism at Merapi are considered consistent with documented copper, zinc, and lead enrichment as well as zonation there (Nadeau and others, 2013).
References.
Badan Nasional Penanggulangan Bencana (BNPB), date unknown, Peta Zonasi Ancaman Banjir Laha Dingin, Relief Web (URL: http://reliefweb.int/sites/reliefweb.int/files/resources/E0676C85D7612CE1852578340054FD68-map.pdf) [accessed in April 2015]
CVGHM, 2014, G. Merapi, Jawa Tengah, 03 June 2014, Center for Volcanology and Geological Hazard Mitigation (URL: http://www.vsi.esdm.go.id/index.php/gunungapi/data-dasar-gunungapi/542-g-merapi) [accessed in April 2015]
Hadisantono, R.D., Andreastuti, M.CH.S.D., Abdurachman, E.K., Sayudi, D.S., Nurnusanto, I., Martono, A., Sumpena, A.D., Muzani, M., 2002, Peta Kawasan Rawan Bencana Gunungapi Merapi, Jawa Tengah Dan Daerah Istimewa Yogayakarta (Volcanic Hazard Map of Merapi Volcano, Central Java and Yogyakarta Special Province), Center for Volcanology and Geological Hazard Mitigation (URL: http://www.vsi.esdm.go.id/galeri/index.php/Peta-Kawasan-Rawan-Bencana-Gunungapi-01/Wilayah-Jawa/KRB-G_-Merapi) [accessed in April 2015]
Minggu, 2014, Mt. Merapi rumbles spewing volcanic material to nearby areas, 20 April 2014, Antara News (URL: http://www.antaranews.com/en/news/93713/mt-merapi-rumbles-spewing-volcanic-material-to-nearby-areas) [accessed in April 2015]
Muryanto, B., Ayuningtyas, K., 2013, Hundreds of villagers flee Mount Merapi eruptions, 19 November 2013, The Jakarta Post (URL: www.thejakartapost.com/news/2013/11/19/hundreds-villagers-flee-mount-merapi-eruptions.html) [accessed in April 2015]
Muryanto, B., Ayuningtyas, K., 2014, Mount Merapi spews sulfuric gas, ash, 11 March 2014, The Jakarta Post (URL: www.thejakartapost.com/news/2014/03/11/mt-merapi-spews-sulfuric-gas-ash.html) [accessed in April 2015]
Nadeau, O., Stix, J., Williams-Jones, A.E., 2013, The behavior of Cu, Zn and Pb during magmatic–hydrothermal activity at Merapi volcano, Indonesia, 29 March 2013, Chemical Geology Volume 342 (URL: www.sciencedirect.com/science/article/pii/S0009254113000466)
Yahya, A., 2013, Mount Merapi Status Remains Normal Despite Weak Eruptions, 22 July 2013, Bernama (URL: http://www.bernama.com/bernama/v7/ge/newsgeneral.php?id=965338) [accessed in April 2015]
Geologic Background. Merapi, one of Indonesia's most active volcanoes, lies in one of the world's most densely populated areas and dominates the landscape immediately north of the major city of Yogyakarta. It is the youngest and southernmost of a volcanic chain extending NNW to Ungaran volcano. Growth of Old Merapi during the Pleistocene ended with major edifice collapse perhaps about 2,000 years ago, leaving a large arcuate scarp cutting the eroded older Batulawang volcano. Subsequent growth of the steep-sided Young Merapi edifice, its upper part unvegetated due to frequent activity, began SW of the earlier collapse scarp. Pyroclastic flows and lahars accompanying growth and collapse of the steep-sided active summit lava dome have devastated cultivated lands on the western-to-southern flanks and caused many fatalities.
Information Contacts: Balai Penyelidikan dan Pengembangan Teknologi Kegunungapian (BPPTK), Pusat Vulkanologi dan Mitigasi Bencana Geologi (PVMBG) (URL: http://merapi.bgl.esdm.go.id/); Darwin Volcanic Ash Advisory Centre (VAAC) (URL: http://www.bom.gov.au/info/vaac/); and Center for Volcanology and Geological Hazard Mitigation (CVGHM, Pusat Vulkanologi dan Mitigasi Bencana Geologi), Badan Geologi, Kementerian Energi dan Sumber Daya Mineral (ESDM), Yogyakarta 55166, Indonesia (URL: http://www.vsi.esdm.go.id/).
Sinabung (Indonesia) — October 2014 Cite this Report
Sinabung
Indonesia
3.17°N, 98.392°E; summit elev. 2460 m
All times are local (unless otherwise noted)
Frequent eruptions, pyroclastic flows, and advancing lava-flow lobe during May-October 2014
On the basis of ash-plume reports from the aviation community around the time of this reporting, Sinabung ranked as the most active volcano in Indonesia, the world's fourth-most populated country. The volcano is located in the Karo Regency of N Sumatra (figure 19). The latest eruption began mid-September 2013; activity through April 2014 was reported in BGVN 39:01. This report describes the continuing volcanic activity from May 2014 through October 2014, primarily drawn from reports issued by the Indonesian Center of Volcanology and Geological Hazard Mitigation (CVGHM) and reports from the Darwin Volcanic Ash Advisory Centre (VAAC). During this reporting interval, many photographs of Sinabung emerged online, some with outstanding information content, but far too numerous to either catalog or feature here.
The Darwin VAAC describes their jurisdiction as covering ~150 active volcanoes located in the South Pacific region from the Philippines to the Solomon Islands, including Indonesia. They issued 1,511 Volcanic Ash Advisories (VAAs) during the 12-month period, 1 July 2013 to 30 June 2014 (their fiscal year 13/14; Darwin VAAC, 2014). During the next 7-month interval (ending 31 January 2015) the VAAC issued 742 reports (Darwin VAAC, 2015). These VAAs are part of their mission to create materials for warning and guidance to the aviation community, including aviation meteorologists, air traffic control offices, and airlines (e.g. dispatchers and pilots).
One way to assess the production of noteworthy ash plumes at volcanoes is to consider the number of VAAs issued, an assessment found in their Management Reports (Darwin VAAC, 2014; 2015). The Darwin VAAC issued Management Reports that both cover and extend beyond (i.e., both earlier and later than) this reporting interval (May to October 2014). Specifically, their reports cover 1 July 2013-30 June 2014 and 1 July 2014-31 January 2015. In both those intervals the largest number of VAAs issued for any single volcano in their region went to Sinabung. In the earlier interval this consisted of 537 out of 1,511 total regional reports; in the later interval, 321 out of 742 total regional reports.
The table in the section "Data compilation" at the bottom of this report also highlights a case at 12:32 UTC on 22 May 2014 of a rapidly growing cloud around Sinabung plausibly associated with an eruption there. The cloud reached ~15.2 km altitude and was initially assessed as eruptive and ash bearing. At the time forecasters felt there was sufficient evidence the cloud contained ash to warrant an advisory. A more detailed assessment made later determined the cloud to probably have been a cumulonimbus cloud (abbreviated Cb; a towering vertical dense cloud often associated with thunderstorms and atmospheric instability). The case illustrates the challenge of creating VAAs rapidly with limited information and time for analysis, balanced against the desire for high accuracy (with low rates of false positives and false negatives). Darwin VAAC (2015) also described the region as one with "...moist tropical convection that makes remote sensing difficult for much of the year."
During the reporting interval, Sinabung was the scene of both lava flows and vigorous dome-building eruptions that discharged significant ash plumes and pyroclastic flows (PFs). Lava flows constructed a several kilometer long tongue or lobe of lava on the flank to the S-SE. These events accompanied elevated seismicity.
During the reporting interval the Aviation Colour Code (ACC) issued by the VAAC was generally Orange; however, during the week of 15-21 October, the ACC was Red.
The ACC is a four-color scale used to inform the needs of the aviation community. The four colors denoting increasing risk are Green, Yellow, Orange, and Red. According to the World Organization of Volcano Observatories' website, Orange connotes "Volcano is exhibiting heightened unrest with increased likelihood of eruption." Red connotes "Eruption is forecast to be imminent with significant emission of ash into the atmosphere likely."
The CVGHM uses a separate volcanic hazard status code to warn people in the region. The Darwin VAAC Weekly report issued for 29 October-4 November 2014 gave this overview of the eruption and the variation in CVGHM's volcanic hazard status: "On 14 September 2013, a new eruptive phase began. By mid-October the volcano was degassing almost daily with small phreatic eruptions. Seismic and visual activity continued to build into November. After nine powerful explosions in a 24 hour period, the Centre for Volcanology and Geological Hazard Mitigation (CVGHM) raised the Alert level to Level IV on 24 November 2013, the highest volcano rating. The status was decreased to Alert Level III on 8 April 2014."
During this reporting interval, lava flows advanced in the sector S- SE from the summit (figure 20). In accord with that lobe or tongue of lava, incandescent zones were at various times noted in different parts of the flows. As reported by CVGHM, avalanches from the front of the advancing lava flows occurred often. Scientists associated this process with a distinct seismic signal called an avalanche earthquake. CVGHM repeatedly warned residents that the lava flows and their associated avalanches could threaten areas to the S and SE within 5 km of the summit. Measurements of the length of this flow are included in the table at the bottom of this report. A previous map with clearer labels of the earlier flows appears as figure 16 in BGVN 39:01.
Seismicity at Sinabung included avalanche earthquakes, low-frequency earthquakes, tectonic earthquakes, volcanic earthquakes and ongoing tremor. Totals and measured averages of these seismic events are included when available (see table at bottom). CVGHM reported that the dominating seismic signals, avalanche earthquakes and intervals of constant tremor, were associated with the instability of the growing lava dome and lava flows.
During this reporting interval, numerous eruptions took place, often generating ash plumes and in some cases pyroclastic flow. During the eruptions, some ash plumes were detected by satellite imagery. Ground-based observations were also important. For example, CVGHM often detected Sinabung eruptions, PFs, and plumes via webcam. Darwin VAAC also benefited from the CVGHM webcam data in several of their VAAs. The VAAC has also begun to use social media to both dispense and retrieve operationally relevant information (Darwin VAAC, 2015). This has aided VAAC forecaster's understanding of, for example, whether residents have noticed ashfall during times when ash is not discernable due to meteorological clouds (Darwin VAAC, 2015).
During May and October 2014, PFs had runout distances up to 4.5 km and ash plumes rose up to 5.2 km altitude. White or slightly discolored plumes were the most common type reported by CVGHM. These plumes sometimes rose to as high as on the order of 1 km over the summit.
Figure 21 is a map of Sinabung and towns surrounding the volcano.
Photographs. The following are photos documenting events at Sinabung during this reporting interval. Ancillary information pertaining to each photo can be found in a table at the bottom of this report.
Data compilation. Table 4 summarizes activity at Sinabung from May-October 2014. Data sources include reporting by CVGHM (often the original source), the Darwin VAAC (their Volcanic Ash Advisories (VAAs), Weekly Activity Reports; and other reports), the Indonesian National Agency for Disaster Management (Badan Nacional Penanggulangan Bencana-BNPB), occasional news articles; and the Smithsonian-USGS Weekly Volcanic Activity Reports.
Table 4. A synthesis of Sinabung's reported activity from May-October 2014. The bulk of this table came from CVGHM and Darwin VAAC reporting unless otherwise stated. Dates and times are in some cases ambiguous as to local time (LT) or UTC (LT = UTC + 7). Abbreviations: pyroclastic flow, PF; Aviation Color Code, ACC; earthquake(s), EQ(s); maximum amplitude, max. amp.; and altitude, alt.
| Week |
Remarks |
| 30 Apr-20 May 2014 |
ACC: Orange |
| 21 May-31 May 2014 |
ACC: Orange
22 May: At 1132 UTC, Darwin VAAC noted a suspicious, possibly ash bearing cloud around Sinabung in a MTSAT-2 IR image. In retrospective analysis, Darwin VAAC concluded the cloud was the beginning of a cumulonimbus (Cb) cloud forming due to atmospheric instability in the area (unrelated to the eruption). For more information, see text and the 21-27 May 2014 issue of the Darwin Weekly Activity Report.
26 May: Ash plume observed at 0132 UTC on MTSAT-2 satellite imagery. Plume extended 28 km SE at 3.4 km alt. Plume observed via webcam. Similar length ash plume again observed by satellite at 0432 UTC on 27th. VAA ended after plume no longer visible. |
| 01 Jun-17 Jun 2014 |
Lava flow associated with dome growth. S and SE flank lava avalanches. Columns of white plumes rose 100-400 m over crater. Seismicity dominated by avalanche EQs and tremor, both associated with instability of dome and lava flows. 13th: Lava flow: ~2.796 km long. |
| 18 Jun-28 Jun 2014 |
Visual monitoring from ~10 km ESE from summit (Post PGA Sinabung located in Ndokum Siroga village) confirmed ongoing dome growth and glowing areas of the lava flow. Avalanches from the flow front seen.
18-24th: Seismicity dominated by avalanche signals; minor deformation. |
| 29 Jun 2014 |
CVMGH reported an eruption with a 4 km alt. ash plume. PF flows traveled 4.5 km SE. Ashfall noted in settlements of Sigarang-Garang and Sukanalu (figure 21). Earthquakes reached high (105 mm) amplitude for 64 minutes. Dome growth continued. A Xinhua news report from 29 June 2014, noted a reporter's telephone interview with a CVGHM authority; the basis for the article's claim of up to 14,382 people still evacuated. |
| 30 Jun-15 Jul 2014 |
8-14th: Real-time Seismic Amplitude Measurement (RSAM) values from 8-15th remained steady. SO2 flux: 1,252 metric tons/day. Dome growth and lava flows continued.
8 Jul: Thick white plume 100-200 m above summit. 38 avalanche EQs (max. amp. 2-70 mm).
9 Jul: Thick bluish plume to 100 m above summit. 54 avalanche EQs; continuous tremor (max. amp. 2-53 mm).
10 Jul: PF traveled up to 3 km S. Plumes of blue and brown color rose 200-2000 m above summit. 52 avalanche EQs and continuous tremor (max. amp. 2-53 mm.).
11 Jul: Thick white plume 300-1000 m above summit. 59 avalanche EQs; continuous tremor (max. amp. 2-52 mm).
12 Jul: Eruption at 2305; a PF moved ~4 km E. Ashfall at several places around Karo district. Maximum height of eruption column indeterminate. 88 avalanche EQs; 2 deep volcanic (VA) EQs. Continuous tremor (max. amp. 2-66 mm). No further evacuations reported.
13 Jul: Thick white plume to 400 m over summit. 92 avalanche EQs; 1 deep volcanic (VA) EQ. Continuous tremor (max. amp. 2-45 mm).
14 Jul: Lava flow: 2.824 km long. Thick white to bluish plume to 200 m above summit. 83 avalanche EQs; 3 deep volcanic (VA) EQs; continuous tremor (max. amp. 2-62 mm). 15th (until 0600LT): 34 avalanche EQs; continuous tremor (max. amp. 2-42 mm). |
| 16 Jul-29 Jul 2014 |
23 Jul: Molten lava captured in photo posted by CVGHM at 2207 on 22 July 2014 UTC. No ash identified on satellite imagery. No Volcanic Ash Advisories (VAAs) issued. |
| 23 Jul-29 Jul 2014 |
ACC: Orange |
| 13 Aug-19 Aug 2014 |
ACC: Orange
13 Aug: 94 avalanche EQs; 2 deep volcanic EQs; 2 deep tectonic EQs; and continuous tremor. Lava ~1000-1500 m from summit moving SE.
14 Aug: PFs at 0728UTC and 0750UTC (figure 22). PFs traveled 1-1.5 km. White plumes rose 300-1000 m above the summit. 102 avalanche EQs; 3 deep volcanic EQs; and continuous tremor. Lava flow: ~2.904 km long. |
| 20 Aug-26 Aug 2014 |
ACC: Orange
20-23 Aug: White plumes rose 100-300 m over crater. Continuous tremor. Avalanche EQs reported on 20-21 and 23 Aug.
22 Aug: PFs traveled 1.5 km to SE. 3 deep volcanic EQs recorded.
23 Aug: 3 southerly moving PFs observed. (1) 0356 UTC, and travelling 2 km; (2) 1140 UTC, and travelling 2 km; (3) 0409 UTC and traveled 1.5 km. |
| 27 Aug-02 Sep 2014 |
ACC: Orange
29 Aug: PF traveled 1.5 km to SE. Time of PF is unknown.
2 Sep: PF at 0940 UTC traveled a distance of 1.5 km SE (figure 23). |
| 03 Sep-09 Sep 2014 |
ACC: Orange
5-11 Sep: White plumes, appeared bluish on some days, rose 50-500 m over crater. Avalanche EQs (average of 96 events/day), low frequency EQs (average of 75 events/day), deep tectonic EQs, and deep volcanic EQs often recorded. Avalanches, travelling various distances observed moving SE and S.
6 Sep: Lava flow: 2.915 km long (figure 20).
7 Sep: Eruption at 1358 UTC that lasted 19 minutes. Plume rose 2 km above summit and ash from plume blown S (figure 24). Eruption's PFs traveled max distances of 2 km to SE. 1 eruption earthquake noted. |
| 10 Sep-16 Sep 2014 |
10-16 Sep: RSAM stable.
12-16 Sep: White plumes rose 100-1000 m over crater. On occasions, the plumes had a bluish tint.
12 Sep: Ash plume on webcam moving E/NE at 0140 UTC. Plume not identifiable on satellite imagery due to overlying clouds. Plume height of 3.7 km alt. (based on model data). Advisory terminated on UTC 13th at 0732 after satellite imagery indicated ash had dissipated.
15 Sep: PF traveled 2.5 km to SE. |
| 17 Sep-23 Sep 2014 |
ACC: Orange
12-20 Sep: Average total of avalanche EQs was 110 events/day, average for volcanic EQs was 1 event/day, average for low frequency EQs was 75 events/day and tremor was continuously recorded.
17-20 Sep: White (sometimes bluish) plumes rose 100-200 m; RSAM stable. 18th: PFs reached 2 km to S. |
| 24 Sep-30 Sep 2014 |
ACC: Orange
24 Sep: Eruption at 1343 emitted hot ash and gravel. Eruption lasted ~15 minutes and a PF descended ~2 km from summit. Eruption column height could not be determined. 4,700 residents remain in evacuation centers.
30 Sep: Eruption at 1720 sent volcanic ash 2 km above the summit. A PF traveled 3.5 km from summit; PF's direction was unstated. Recent eruptions covered settlements and agricultural lands around Sinabung with ash. News sources noted that farmers harvested their crops early to reduce losses. |
| 01 Oct-07 Oct 2014 |
5 Oct: Four eruptions took place. (1) 0146: volcanic ash sent 2 km over crater and a PF moved max distance of 4.5 km S; (2) 0638: PFs traveled 2.5 km S; (3) 0736: PFs traveled 3 km S; and (4) 0753: eruption column with ash rose 3 km and PFs traveled 4.5 km S. No additional refugees were reported. Two other eruptions that caused PFs were reported at 0900 and 1200.
6 Oct: Low-level eruption observed on webcam starting at 0120 UTC. Eruption plume moved E and a PF also seen moving below the summit.
7 Oct: Volcanic ash at 5.2 km alt. moving S. Ash not identifiable in satellite imagery. |
| 08 Oct-14 Oct 2014 |
ACC: Orange
8 Oct: At 0543 UTC, an initial VAA issued for an in-progress eruption. Eruption first noted through webcam, but no ash was seen in satellite imagery. Eruption produced a 4.9 km eruption column and a PF (both were observed by webcam at 0543 UTC) (figure 25). Another eruption observed at 2336 UTC by webcam.
9 Oct: A low-level plume moving NE seen in satellite imagery at 0332 UTC. According to a 0531 UTC VAA, several eruptions were observed over the last 6 hours via webcam. Darwin VAAC weekly report noted that eruption from 8th reached the provincial capital Medan and disrupted flights on the 9th.
10 Oct: Eruption was observed via webcam at 0200 UTC and through satellite imagery at 0132 UTC. In the imagery from 0132 UTC, an eruption plume extended 30 NM NE. Volcanic ash was noted at 0335 UTC in satellite imagery and was last seen at 0632 UTC extending 30 NM NE.
11 Oct: Webcam captured a 3 km ash plume drifting SW.
12 Oct: Volcanic ash on webcam at 0030 UTC to SE at 3.1 km alt. Volcanic ash was again observed at 0600 UTC via webcam.
14 Oct: Ash plume recorded by webcam rising 4 km and moving SW. |
| 15 Oct-21 Oct 2014 |
ACC: Red
15 Oct: At 0036 UTC, an eruption took place that sent ash 500 m over crater and a PF 2.5 km (direction unstated). At 0200 UTC, Sinabung was observed on webcam to 4.3 km alt. Eruption column moved N. Continuous small eruptions seen via webcam, during daylight hours.
17 Oct: Ash rose to ~ 3.7 km alt. In photos taken by a pilot, ash seen extending ~15 mi to W of Sinabung. On ground, PF extended 3.5 km and ash was thrown up 2.5 km, according to a picture taken at 0409 UTC.
19-20 Oct: Eruption columns seen via both ground-based and aerial images (figure 26) |
| 22 Oct-28 Oct 2014 |
ACC: Orange
23 Oct: Eruption observed via webcam. Eruption column rose to 4.3 km alt. and extended 10 NM to N at 0400 UTC.
25 Oct: Eruption at 0249 UTC seen via webcam. Volcanic ash at 4.6 km alt. identifiable through satellite images from 0332 UTC. Plume extended 15 NM to W-NW. Eruptions also seen via webcam at 1000 UTC and 2312 UTC. In a 2331 UTC VAA, ash plume reported at 3 km and drifting E based on webcam.
26 Oct: Activity reported as high. PFs traveled 3.5 km S on two occasions and an ash plume rose 2 km over crater. Lava moved distances of 700-1000 m from summit.
27 Oct: Eruption at 1013 UTC seen via webcam. BNPB reported ~3,000 people remained in evacuation shelters. |
| 29 Oct-30 Oct 2014 |
ACC: Orange |
References. Associated Press, 2014, Volcano in Western Indonesia erupts again, accessed on 28 September 2014, (URL: http://abcnews.go.com/International/wireStory/volcano-western-indonesia-erupts-25720623 )
Darwin VAAC, (6 August) 2014, VAAC Darwin Management Report [discussing 1 July 2013 to the 30 June 2014], International Civil Aviation Organization (ICAO); Eighteenth Meeting of the Meteorology Sub-Group (Met Sg/18) Of Apanpirg; ICAO Regional Sub-Office, Beijing, China; 18–21 August 2014 [Agenda Item 7.4: Research, development and implementation issues in the MET field, [7.4] Advisories and warnings, MET SG/18 - IP/17; Agenda Item 7.4; 6 August 2014; (Presented by Australia)]; 5 pp. (URL: http://www.icao.int/APAC/Meetings/2014 METSG18/IP17_AUS AI.7.4 - VAAC Darwin Management.pdf )
Darwin VAAC, (18 February) 2015, Darwin VAAC Management Report [discussing 1 July 2014-31 January 2015], International Civil Aviation Organization (ICAO), Fifth Meeting of Meteorological Hazards Task Force (MET/H TF/5), Seoul, Republic of Korea, 18 March 2015 [Thirteenth Meeting of the Asia/Pacific Regional Opmet Bulletin Exchange Working Group (Robex Wg/13), ROBEX WG/13 & MET/H TF/5 – WP/C6; Agenda Item (conjoint session) 2 (Presented by Australia)] (URL: http://www.icao.int/APAC/Meetings/2015 ROBEXWG13/WP-C6 - AI.2 - AUS - Darwin VAAC Management Report.pdf )
Indonesian National Agency for Disaster Management (Badan Nacional Penanggulangan Bencana-BNPB), 2014, Four time Sinabung, Normal Community Activity, accessed on 6 October 2014, (URL: http://bnpb.go.id/berita/2211/empat-kali-sinabung-meletus-masyarakat-beraktivitas-normal)
The Jakarta Post/Asia News Network, 2014, Mount Sinabung erupts again, accessed on 6 October 2014, (URL: http://news.asiaone.com/news/asia/mount-sinabung-erupts-again)
Okezone.com, 2014, accessed on 28 September 2014, (URL: http://news.okezone.com/read/2014/10/01/340/1046715/hujan-abu-gunung-sinabung-guyur-karo-petani-menderita )
Pixshark.com, accessed on 7 April 2015 (URL: http://pixshark.com/peta-gunung-sinabung.htm)
World Organizations of Volcano Observatories (WOVO), Aviation Colour Codes, accessed on 8 April 2015, (URL: http://www.wovo.org/aviation-colour-codes.html)
Xinhua News Agency, 2014, 2nd LD Writethru: Mount Sinabung in Indonesia erupts, triggering massive evacuation, accessed on 29 June 2014, (URL: http://www.globalpost.com/article/6190943/2014/06/29/2nd-ld-writethru-mount-sinabung-indonesia-erupts-triggering-massive)
Xinhua News Agency, 2014, Mount Sinabung erupts in Sumatra, Indonesia, accessed on 28 September 2014, (URL: http://english.cntv.cn/2014/09/24/ARTI1411549583755731.shtml).
Geologic Background. Gunung Sinabung is a Pleistocene-to-Holocene stratovolcano with many lava flows on its flanks. The migration of summit vents along a N-S line gives the summit crater complex an elongated form. The youngest crater of this conical andesitic-to-dacitic edifice is at the southern end of the four overlapping summit craters. The youngest deposit is a SE-flank pyroclastic flow 14C dated by Hendrasto et al. (2012) at 740-880 CE. An unconfirmed eruption was noted in 1881, and solfataric activity was seen at the summit and upper flanks in 1912. No confirmed historical eruptions were recorded prior to explosive eruptions during August-September 2010 that produced ash plumes to 5 km above the summit.
Information Contacts: Indonesian Center of Volcanology and Geological Hazard Mitigation (CVGHM) (also known as Pusat Vulkanologi dan Mitigasi Bencana Geologi-PVMBG), Jalan Diponegoro 57, Bandung 40122, Indonesia (URL: http://vsi.esdm.go.id/); Indonesian National Agency for Disaster Management (Badan Nacional Penanggulangan Bencana-BNPB), Gedung Graha 55 Jl. Tanah Abang II No. 57, 10120, Jakarta Pusat (URL: http://www.bnpb.go.id/); and Darwin Volcanic Ash Advisory Centre (VAAC), Bureau of Meteorology, Northern Territory Regional Office, PO Box 40050, Casuarina, NT 0811, Australia (URL: http://www.bom.gov.au/info/vaac/).