Logo link to homepage

Smithsonian / USGS Weekly Volcanic Activity Report

Weekly Volcanic Activity Map

The Weekly Volcanic Activity Report is a cooperative project between the Smithsonian's Global Volcanism Program and the US Geological Survey's Volcano Hazards Program. Updated by 2300 UTC every Wednesday and averaging 16 reported volcanoes, this is not a comprehensive list of all eruptions this week, but rather a summary of activity that meet criteria discussed in the "Criteria and Disclaimers" section below.

Volcanic activity reported here is preliminary and subject to change. Carefully reviewed, detailed narratives over longer time periods are published as reports of the Bulletin of the Global Volcanism Network available through volcano profile pages.

Smithsonian / USGS Weekly Volcanic Activity Report for the week of 24 April-30 April 2024
Name Location Eruption Start Date Report Status
Poas Costa Rica 2023 Dec 1 New
Puyehue-Cordon Caulle Central Chile New
Rincon de la Vieja Costa Rica 2021 Jun 28 New
Ruang Sangihe Islands 2024 Apr 16 New
Taal Luzon (Philippines) 2024 Apr 12 New
Tofua Tonga Ridge 2015 Oct 2 New
Aira Kyushu (Japan) 2017 Mar 25 Continuing
Ambrym Vanuatu Continuing
Dukono Halmahera 1933 Aug 13 Continuing
Ebeko Paramushir Island (Russia) 2022 Jun 11 Continuing
Fernandina Isla Fernandina (Galapagos) 2024 Mar 2 Continuing
Great Sitkin Andreanof Islands (USA) 2021 May 25 Continuing
Ibu Halmahera 2008 Apr 5 Continuing
Kanlaon Philippines Continuing
Kavachi Solomon Islands 2021 Oct 2 Continuing
Lateiki Tonga Ridge Continuing
Lewotobi Flores Island 2023 Dec 23 Continuing
Lewotolok Lembata Island 2020 Nov 27 Continuing
Marapi Central Sumatra 2023 Dec 3 Continuing
Masaya Nicaragua 2015 Oct 3 Continuing
Merapi Central Java 2020 Dec 31 Continuing
Reventador Ecuador 2008 Jul 27 Continuing
Reykjanes Reykjanes Peninsula 2023 Dec 18 Continuing
Sangay Ecuador 2019 Mar 26 Continuing
Semeru Eastern Java 2017 Jun 6 Continuing
Sheveluch Central Kamchatka (Russia) 1999 Aug 15 Continuing
Suwanosejima Ryukyu Islands (Japan) 2004 Oct 23 Continuing
Yasur Vanuatu 1270 ± 110 years Continuing
All times are local unless otherwise stated.
Weekly Reports Archive

Since the Weekly Volcanic Activity Report began in November 2000, there have been 20,047 individual reports over 1,217 weeks (average of 16 per week) on 332 different volcanoes.

Search by Date


Use the dropdowns to choose the year and week for archived Weekly Reports.

Use the dropdowns to choose the year and week for archived Weekly Reports.          


Search by Volcano


Agung Cuicocha Iliwerung Llaima Popocatepetl Sumbing
Ahyi Cumbal Inielika Lokon-Empung Purace Sundoro
Aira Dabbahu Ioto Lonquimay Puyehue-Cordon Caulle Suretamatai
Akan Davidof Irazu Lopevi Rabaul Suwanosejima
Alaid Dempo Iya Machin Raikoke Taal
Alu-Dalafilla Descabezado Grande Izu-Torishima Makushin Ranakah Tair, Jebel at
Ambae Dieng Volcanic Complex Jackson Segment Maly Semyachik Raoul Island Takawangha
Ambang Dukono Kaba Manam Rasshua Talang
Ambrym East Epi Kadovar Manda Hararo Raung Tambora
Anatahan Ebeko Kaitoku Seamount Marapi Redoubt Tanaga
Aniakchak Ebulobo Kama'ehuakanaloa Maroa Reventador Tandikat-Singgalang
Antillanca Volcanic Complex Edgecumbe Kambalny Martin Reykjanes Tangkoko-Duasudara
Antuco Egon Kanaga Masaya Rincon de la Vieja Tangkuban Parahu
Apoyeque Ekarma Kanlaon Maule, Laguna del Rinjani Tara, Batu
Arenal Eldey Karangetang Mauna Loa Ritter Island Ta'u
Asamayama Erebus Karkar Mayon Rotorua Taupo
Askja Erta Ale Karthala McDonald Islands Ruang Telica
Asosan Etna Karymsky Melebingoy Ruapehu Tenerife
Atka Volcanic Complex Etorofu-Yakeyama [Grozny Group] Kasatochi Melimoyu Ruby Tengger Caldera
Augustine Eyjafjallajokull Katla Merapi Ruiz, Nevado del Three Sisters
Avachinsky Fagradalsfjall Katmai Midagahara Sabancaya Tinakula
Awu Fernandina Kavachi Misti, El Sakar Tofua
Axial Seamount Fogo Kelimutu Miyakejima Salak Tokachidake
Azul, Cerro Fonualei Kelud Momotombo San Cristobal Tolbachik
Azumayama Fournaise, Piton de la Kerinci Monowai San Miguel Toliman
Bagana Fourpeaked Ketoi Montagu Island San Vicente Tongariro
Balbi Fuego Kharimkotan Moyorodake [Medvezhia] Sangay Trident
Bamus Fujisan Kick 'em Jenny Mutnovsky Sangeang Api Tungurahua
Banda Api Fukutoku-Oka-no-Ba Kie Besi Myojinsho Santa Ana Turrialba
Bardarbunga Galeras Kikai Nabro Santa Maria Ubinas
Barren Island Galunggung Kilauea Negra, Sierra Sao Jorge Ugashik-Peulik
Batur Gamalama Kirishimayama Negro, Cerro Sarigan Ukinrek Maars
Bezymianny Gamkonora Kita-Ioto Nightingale Island Sarychev Peak Ulawun
Bogoslof Gareloi Kizimen Nishinoshima Saunders Unnamed
Brava Gaua Klyuchevskoy Nisyros Savo Unnamed
Bristol Island Gorely Kolokol Group Novarupta Semeru Veniaminof
Bulusan Great Sitkin Koryaksky NW Rota-1 Semisopochnoi Villarrica
Calbuco Grimsvotn Krakatau Nyamulagira Seulawah Agam Vulcano
Callaqui Guagua Pichincha Krummel-Garbuna-Welcker Nyiragongo Sheveluch West Mata
Cameroon Guallatiri Krysuvik-Trolladyngja Ofu-Olosega Shishaldin Westdahl
Campi Flegrei del Mar di Sicilia Guntur Kuchinoerabujima Okataina Simbo Whakaari/White Island
Cayambe Hachijojima Kurikomayama Okmok Sinabung Witori
Chachadake [Tiatia] Hakoneyama Kusatsu-Shiranesan Ontakesan Sinarka Wolf
Chaiten Heard Kverkfjoll Oraefajokull Siple Wrangell
Chiginagak Hekla La Palma Osorno Sirung Yakedake
Chikurachki Helgrindur Lamington Pacaya Slamet Yasur
Chiles-Cerro Negro Hierro Lamongan Pagan Snaefellsjokull Yufu-Tsurumi
Chillan, Nevados de Hokkaido-Komagatake Langila Palena Volcanic Group Soputan Zaozan [Zaosan]
Chirinkotan Home Reef Lanin Paluweh Sorikmarapi Zavodovski
Chirpoi Hood Lascar Panarea Sotara Zhupanovsky
Ciremai Huaynaputina Late Papandayan Soufriere Hills Zubair Group
Cleveland Hudson, Cerro Lateiki Pavlof Soufriere St. Vincent
Colima Huila, Nevado del Lengai, Ol Doinyo Pelee South Sarigan Seamount
Colo Hunga Tonga-Hunga Ha'apai Leroboleng Peuet Sague Spurr
Concepcion Ibu Lewotobi Pinatubo St. Helens
Copahue Ijen Lewotolok Planchon-Peteroa Stromboli
Cotopaxi Iliamna Little Sitkin Poas Sulu Range
 News Feeds and Google Placemarks


Download Smithsonian / USGS Weekly Volcanic Activity Report Network RSS Feed

The RSS (Really Simple Syndication) feed is identical to the Weekly Volcanic Activity Report minus some features including the header information (latitude and longitude and summit elevation), the Geologic Summary, and a link to the volcano's page from the Global Volcanism Program. At the end of each report is a list of the sources used. Each volcano report includes a link from the volcano's name back to the more complete information in the Weekly Volcanic Activity Report on the Smithsonian website. This feature was first made available on 5 March 2008.


Download Smithsonian / USGS Weekly Volcanic Activity Report Network CAP Feed

The CAP (Common Alerting Protocol) feeds are XML files specifically formatted for disaster management. They are similar in content to the RSS feed, but contain no active links.


Download Smithsonian/USGS Weekly Volcanic Activity Report Network Link Download Smithsonian / USGS Weekly Volcanic Activity Report Network Link

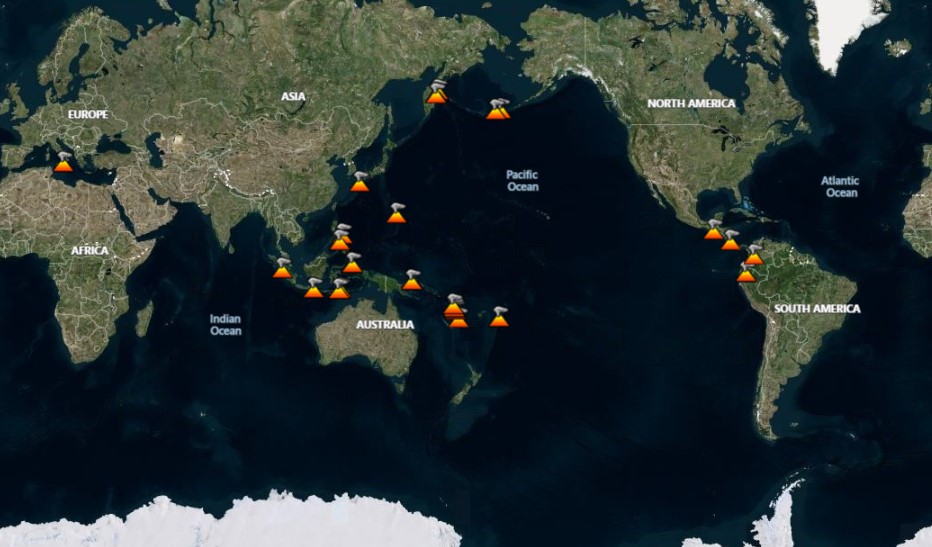
A Google Earth network link for the Weekly Volcanic Activity Report can be loaded into the free Google Earth software, and in turn will load placemarks for volcanoes in the current weekly report. Placemark balloons include the volcano name, report date, report text, sources, and links back to the GVP volcano profile page and to the complete Weekly Report for that week. This feature was first made available on 1 April 2009.

 Criteria & Disclaimers

Criteria


The Weekly Volcanic Activity Report does not necessarily include all volcanic activity that occurred on Earth during the week. More than a dozen volcanoes globally have displayed more-or-less continuous eruptive activity for decades or longer, and such routine activity is typically not reported here. Moreover, Earth's sea-floor volcanism is seldom reported even though in theory it represents the single most prolific source of erupted material. The Weekly Volcanic Activity Report summarizes volcanic activity that meets one or more of the following criteria:

- A volcano observatory raises or lowers the alert level at the volcano.
- A volcanic ash advisory has been released by a volcanic ash advisory center (VAAC) stating that an ash cloud has been produced from the volcano.
- A verifiable news report of new activity or a change in activity at the volcano has been issued.
- Observers have reported a significant change in volcanic activity. Such activity can include, but is not restricted to, pyroclastic flows, lahars, lava flows, dome collapse, or increased unrest.

Volcanoes are included in the "New Activity/Unrest" section of the Weekly Volcanic Activity Report if the activity occurs after at least 3 months of quiescence. Once a volcano is included in the "New Activity/Unrest" section, updates will remain in that section unless the activity continues for more than 1 month without escalating, after which time updates will be listed in the "Continuing Activity" section. Volcanoes are also included in the "New Activity/Unrest" section if the volcano is undergoing a period of relatively high unrest, or increasing unrest. This is commonly equal to Alert Level Orange on a scale of Green, Yellow, Orange, Red, where Red is the highest alert. Or alert level 3 on a scale of 1-4 or 1-5.

It is important to note that volcanic activity meeting one or more of these criteria may occur during the week, but may not be included in the Weekly Volcanic Activity Report because we did not receive a report.

Disclaimers


1. The Weekly Volcanic Activity Report is intended to provide timely information about global volcanism on a weekly basis. Consequently, the report is generated rapidly by summarizing volcanic reports from various sources, with little time for fact checking. The accuracy of the Weekly Volcanic Activity Report is dependent upon the quality of the volcanic activity reports we receive. Reports published in the Bulletin of the Global Volcanism Network are cover longer time periods and are more carefully reviewed, although all of the volcanoes discussed in the Weekly Volcanic Activity Report are not necessarily reported in the Bulletin. Because of our emphasis on rapid reporting on the web we have avoided diacritical marks. Reports are updated on the Weekly Volcanic Activity Report web page as they are received, therefore information may be included regarding events that occurred before the current report period.

2. Rapidly developing events lead to coverage that is often fragmentary. Volcanoes, their eruptions, and their plumes and associated atmospheric effects are complex phenomena that may require months to years of data analysis in order to create a comprehensive summary and interpretation of events.

3. Preliminary accounts sometimes contain exaggerations and "false alarms," and accordingly, this report may include some events ultimately found to be erroneous or misleading.

4. Many news agencies do not archive the articles they post on the Internet, and therefore the links to some sources may not be active. To obtain information about the cited articles that are no longer available on the Internet contact the source.

5. USGS Disclaimer Statement for this Website:

Information presented on this website is considered public information and may be distributed or copied. Use of appropriate byline/photo/image credit is requested. We strongly recommend that USGS data be acquired directly from a USGS server and not through other sources that may change the data in some way. While USGS makes every effort to provide accurate and complete information, various data such as names, telephone numbers, etc. may change prior to updating. USGS welcomes suggestions on how to improve our home page and correct errors. USGS provides no warranty, expressed or implied, as to the accuracy, reliability or completeness of furnished data.

Some of the documents on this server may contain live references (or pointers) to information created and maintained by other organizations. Please note that USGS does not control and cannot guarantee the relevance, timeliness, or accuracy of these outside materials.

For site security purposes and to ensure that this service remains available to all users, this government computer system employs software programs to monitor network traffic to identify unauthorized attempts to upload or change information, or otherwise cause damage. Unauthorized attempts to upload information or change information on this website are strictly prohibited and may be punishable under the Computer Fraud and Abuse Act of 1986 and the National Information Infrastructure Protection Act. Information may also be used for authorized law enforcement investigations. (Last modified September 21, 1999.)

U.S. Department of the Interior, U.S. Geological Survey, Reston, VA, USA
URL: https://volcano.si.edu/reports_weekly.cfm

 Acronyms and Abbreviations

a.s.l. - above sea level

AVO - Alaska Volcano Observatory

AVHRR - Advanced Very High Resolution Radiometer

CENAPRED - Centro Nacionale de Prevencion de Desastres (México)

CONRED - Coordinadora Nacional para la Reducción de Desastres

COSPEC - Correlation Spectrometer

CVGHM (formerly VSI) - Center of Volcanology and Geological Hazard Mitigation

CVO - Cascades Volcano Observatory (USGS)

GMS - Geostationary Meteorological Satellite

GOES - Geostationary Operational Environmental Satellite

GVO - Goma Volcano Observatory

GVP - Global Volcanism Program (Smithsonian Institution)

HVO - Hawaiian Volcano Observatory (USGS)

ICE - Instituto Costarricense de Electricidad (Costa Rica)

IG - Instituto Geofísico (Ecuador)

IGNS - Institute of Geological and Nuclear Sciences (New Zealand) - now GNS Science

INETER - Instituto Nicaragüense de Estudios Territoriales (Nicaragua)

INGEMMET - Instituto Geológical Minero y Metalúrgico (Peru)

INGEOMINAS - Instituto Colombiano de Geología y Minería (Colombia)

INGV-CT - Istituto Nazionale di Geofisica e Vulcanologia - Sezione di Catania (Italy)

INSIVUMEH - Instituto Nacional de Sismologia, Vulcanologia, Meteorologia e Hidrologia (Guatemala)

IRD - Institut de Recherche pour le Développement (France)

JMA - Japanese Meteorological Agency

KEMSD - Kamchatkan Experimental and Methodical Seismilogical Department

KVERT - Kamchatkan Volcanic Eruption Response Team

M - magnitude

METEOSAT - Meteorological Satellite

MEVO - Mount Erebus Volcano Observatory

MODIS - Moderate Resolution Imaging Spectroradiometer

MVO - Montserrat Volcano Observatory

MWO - Meteorological Watch Office

NEIC - National Earthquake Information Center

NIED - National Research Institute for Earth Science and Disaster Prevention (Japan)

NOAA - National Oceanic and Atmospheric Administration

NOTAM - Notice to Airmen

OVDAS - Observatorio Volcanologico de los Andes del Sur (Chile)

OFDA - Office of US Foreign Disaster Assistance

ONEMI - Oficina Nacional de Emergencia - Ministerio del Interior (Chile)

OVPDLF - Observatoire Volcanologique du Piton de la Fournaise (France)

OVSICORI-UNA - Observatorio Vulcanologico y Sismologico de Costa Rica, Universidad Nacional (Costa Rica)

PHIVOLCS - Philippine Institute of Volcanology and Seismology (Philippines)

RSAM - Real-time Seismic Amplitude Measurement

RVO - Rabaul Volcano Observatory

SERNAGEOMIN - Servicio Nacional de Geologia y Mineria (Chile)

SIGMET - Significant Meteorological Information

SNET - Servicio Nacional de Estudios Territoriales (El Salvador)

SVERT - Sakhalin Volcanic Eruption Response Team (Russia)

USAID - US Agency for International Development

USGS - United States Geological Survey

UTC - Coordinated Universal Time

VAAC - Volcanic Ash Advisory Center

VAFTAD - Volcanic Ash Forecast Transport And Dispersion

VDAP - Volcano Disaster Assistance Program (USGS)

VHP - Volcano Hazards Program (USGS)

VRC - Volcano Research Center (Japan)

Report for Poas
OVSICORI-UNA reported continuing gas-and-steam emissions from vents Boca A and Boca C on the crater floor of Poás during 24-30 April. Although emissions from Boca C often contained low ash content, no ash was present for a period of time during 25-27 April. Plumes intensified on 28 April and rose several hundred meters high. A sulfur odor was reported in Sarchí and Grecia (both about 17 km SW) on 25 April. Incandescence from Boca A was visible at night during 27-28 April and from both Boca A and Boca C at night during 29-30 April.
Source: Observatorio Vulcanologico y Sismologico de Costa Rica-Universidad Nacional (OVSICORI-UNA)
Report for Puyehue-Cordon Caulle
SERNAGEOMIN reported that inflation had been detected at the Puyehue-Cordón Caulle volcanic complex since 2011 based on GNSS satellite and radar data. The inflation is centered about 6 km WNW of the 2011 eruption vents. The rate of inflation had increased during the first few months of 2024, reaching a maximum average of 2.4 cm per month, which was the highest rate detected since GNSS equipment was installed in 2017. Seismicity began to slightly increase in mid-2020 and was characterized by volcano-tectonic and hybrid events from a shallow source near the 2011 vents. Gas emissions rose from the 2011 vents and were nearly 90 degrees Celsius. The Alert Level was raised to Yellow (the second lowest color on a four-color scale) on 26 April based on the high deformation rates.
Source: Servicio Nacional de Geología y Minería (SERNAGEOMIN)
Report for Rincon de la Vieja
OVSICORI-UNA reported that the amplitude of seismic tremor at Rincón de la Vieja intensified on 17 April and then increased again on 25 April. The tremor signals were accompanied by long-period events occurring at a rate of sometimes hundreds per day. The intensities of the earthquakes were the highest recorded within the last five years. A total of 19 small eruptive events were recorded during 17-25 April and produced steam-and-gas plumes that rose as high as 2 km. Sulfur dioxide emissions began to increase on 21 April and increased more notably during 24-25 April, rising from around 77 tonnes per day (t/d) to around 493 t/d. Tremor amplitude fluctuated at high levels during 26-29 April, reaching a new peak at around 0200 on 28 April. Gas-and-steam emissions were continuous. The Alert Level remained at Level 3, Orange, the third highest level on a four-level scale.
Source: Observatorio Vulcanologico y Sismologico de Costa Rica-Universidad Nacional (OVSICORI-UNA)
Report for Ruang
PVMBG reported that seismicity significantly increased at Ruang on 29 April and the signals indicated magma moving towards the surface. Earthquakes began to be felt at 0015 on 30 April. At 0115 the earthquakes intensified; residents in neighboring Tagulandang Island reportedly felt continuous shaking, heard loud roaring, and saw an ash plume rising about 2 km above the summit. Activity continued to escalate and at 0130 the Alert Level was raised to 4 (the highest level on a scale of 1-4). The public was warned to stay 7 km away from the active crater and residents on Tagulandang within 6 km were instructed to evacuate. A webcam photo from 0232 on 30 April showed lava being ejected above the summit; an eruptive event was recorded in seismic data at 0235. According to the Darwin VAAC ash plumes had risen to 15.2 km (50,000 ft) a.s.l. by 0300 and to 19.2 km (63,000 ft) a.s.l. by 0320, and by 0620 were expanding radially; the plumes may have risen to 23 km (75,400 ft) a.s.l. or more based on other expert analysis.

PVMBG noted that at 0835 dense gray-to-black ash plumes rose at least 5 km and drifted E and S. A webcam photo from 0827 showed multiple pyroclastic density currents descending the flanks. According to a characterization by BNPB the eruption ejected incandescent lava high above the summit and lightning was frequently seen in the plumes. Tephra fell over a more extensive area compared the 16-18 April eruption phase; gravel-sized tephra fell in Apengsala, about 8 km NNE from Ruang’s central vent, and outside of the exclusion zone. According to a news report residents felt shock waves from the explosions. At least three eruptive events were recorded during 1200-1800 that produced gray-and-black ash plumes at least as high as 1.5 km. The VAAC noted that by 1510 the high-level plume had detached from the summit and was drifting W and SW, and ash between 13.7-19.2 km (45,000-63,000 ft) a.s.l. continued to be identified drifting WNW at least through 0940 on 1 May. Ash plumes continued to be identified in satellite images, rising to 3 km (10,000 ft) a.s.l. and drifting N and SE at least through 1240 on 1 May.

According to a news report the eruption and the presence of ash and ashfall caused the closure of seven airports, scheduled to reopen on 1 May: the Sam Ratulangi International Airport (98 km SW in Manado, North Sulawesi), the Gorontalo Airport (371 km SW), the Siau/Sitaro Airport (40 km N), the Bolaang Mongondow Airport (215 km SW), the Tahuna/Naha Airport (150 km N), the Pohuwato Airport (445 SW), and the Pogogul Airport (460 km WSW). On 1 May about 123 residents were evacuated to Bitung City by boat. Ashfall was notable at the Sam Ratulangi International Airport with delays affecting about 7,000 passengers.
Sources: Pusat Vulkanologi dan Mitigasi Bencana Geologi (PVMBG, also known as CVGHM), Badan Nacional Penanggulangan Bencana (BNPB), Darwin Volcanic Ash Advisory Centre (VAAC), Andrew Tupper, Natural Hazards Consulting, Antara News, Antara News, Antara News, Antara News, Antara News
Report for Taal
PHIVOLCS reported ongoing unrest at Taal during 23-30 April. Upwelling gasses and hot fluids in the lake were visible during daily observations. Daily emissions of gas-and-steam rose from Main Crater Lake as high as 1.8 km, were sometimes voluminous, and drifted generally NW and SW. There were 0-14 daily earthquakes recorded by the seismic network including a few periods of volcanic tremor lasting 2-4 minutes. One phreatic event lasting two minutes long was recorded during 28-29 April. The Alert Level remained at 1 (on a scale of 0-5), and PHIVOLCS reminded the public that the entire Taal Volcano Island was a Permanent Danger Zone (PDZ) and to take extra precautions around Main Crater, when boating on Taal Lake, and along the Daang Kastila fissure.
Source: Philippine Institute of Volcanology and Seismology (PHIVOLCS)
Report for Tofua
Tonga Geological Services reported that activity at Tofua increased on 26 April and was characterized as having an unusual pattern of activity. A total of 45 eruptive events were identified in data from 0956 on 26 April to 0246 on 28 April. An intensifying thermal anomaly was also identified in satellite images. At 2200 on 28 April an ash plume was identified in a satellite image rising 4-6 km above the summit and drifting NW; it was no longer visible 4 hours later. A SW-drifting plume of sulfur dioxide was also identified in a few satellite images. The number of thermal anomalies over the volcano decreased during 28-30 April, and though sulfur dioxide emissions continued to be detected, the flux had decreased. Mariners were advised to stay 2 km away from the island.
Source: Tonga Geological Services, Government of Tonga
Report for Aira
JMA reported ongoing eruptive activity at Minamidake Crater (Aira Caldera’s Sakurajima volcano) during 22-29 April with nighttime crater incandescence. Sulfur dioxide emissions averaged 1,800 tons per day on 22 April. Very small eruptive events were occasionally recorded during 22-26 April. The Alert Level remained at 3 (on a 5-level scale), and the public was warned to stay 2 km away from both craters.
Source: Japan Meteorological Agency (JMA)
Report for Ambrym
On 25 April the Vanuatu Meteorology and Geo-Hazards Department (VMGD) reported that small fumarolic steam emissions were ongoing in both of Ambrym’s Benbow and Marum craters. A satellite image from 20 April showed minor amounts of gas emissions. Incandescence at Marum was visible at night during 20-21 April and a low- to moderate-intensity thermal anomaly was identified in a satellite image on 23 April. Seismic data also confirmed ongoing unrest. The Alert Level remained at 2 (on a scale of 0-5). VMGD warned the public to stay outside of Permanent Danger Zone A, defined as a 1-km radius around Benbow Crater and a 2-km radius around Marum Crater, and to stay 500 m away from the ground cracks created by the December 2018 eruption.
Source: Vanuatu Meteorology and Geohazards Department (VMGD)
Report for Dukono
PVMBG reported that the eruption at Dukono was ongoing during 24-30 April. Gray-and-white ash plumes rose 100-1,500 m above the summit and drifted NW, W, and SW almost daily; emissions were not observed on 26 April. The Alert Level remained at Level 2 (on a scale of 1-4), and the public was warned to remain outside of the 3-km exclusion zone.
Source: Pusat Vulkanologi dan Mitigasi Bencana Geologi (PVMBG, also known as CVGHM)
Report for Ebeko
KVERT reported that moderate explosive activity was ongoing at Ebeko during 18-25 April. According to volcanologists in Severo-Kurilsk (Paramushir Island, about 7 km E), explosions during 22-25 April generated ash plumes that rose as high as 3 km (11,500 ft) a.s.l. and drifted S, SE, and NE. A thermal anomaly was identified in satellite images during 22-24 April; on other days either no activity was observed or weather conditions prevented views. The Aviation Color Code remained at Orange (the third level on a four-color scale). Dates are UTC; specific events are in local time where noted.
Source: Kamchatkan Volcanic Eruption Response Team (KVERT)
Report for Fernandina
Instituto Geofísico-Escuela Politécnica Nacional (IG-EPN) reported that the eruption at Fernandina continued during 24-30 April. Daily thermal anomalies along the lava flow were identified in satellite images and gas-and-steam emissions rose from the area where lava entered the ocean. Sulfur dioxide emissions, measured using satellite data, fluctuated between about 343 and 1,362 tons per day.
Source: Instituto Geofísico-Escuela Politécnica Nacional (IG-EPN)
Report for Great Sitkin
AVO reported that slow lava effusion in Great Sitkin’s summit crater was last confirmed in a 21 April radar satellite image with continuing inflation over the vent and advancement of the NW lava lobe. Effusion likely continued during 24-30 April. Seismicity was low. Weather clouds fully or partly obscured satellite and webcam views, though weakly elevated surface temperatures were observed in satellite images during 26-27 April. The Volcano Alert Level remained at Watch (the third level on a four-level scale) and the Aviation Color Code remained at Orange (the third color on a four-color scale).
Source: US Geological Survey Alaska Volcano Observatory (AVO)
Report for Ibu
PVMBG reported that Ibu continued to erupt during 24-30 April. Daily white-and-gray ash plumes generally rose as high as 2 km above the summit and drifted in multiple directions. According to a social media post a loud boom followed by a roar accompanied the eruptive event on 26 April. Ash plumes rose as high as 2 km and incandescence emanated in the plume up to 700 m. At 0037 on 28 April a dense gray-to-black plume rose as high as 3.5 km and drifted W. Incandescence emanated from the summit was visible in a webcam image from 29 April. The Alert Level remained at 2 (the second highest level on a four-level scale), with the public advised to stay outside of the 2 km hazard zone and 3.5 km away from the N area of the active crater.
Sources: Pusat Vulkanologi dan Mitigasi Bencana Geologi (PVMBG, also known as CVGHM), FPMKI
Report for Kanlaon
PHIVOLCS issued a special notice for Kanlaon at 1530 on 30 April noting increased sulfur dioxide emissions. On 30 April a Flyspec instrument measured an average of 2,707 tonnes per day (t/d) of sulfur dioxide emissions at the summit crater, the second highest value recorded in 2024; sulfur dioxide emissions average 3,098 t/d on 19 January. The report noted that higher sulfur dioxide gas fluxes had been recorded for a year with an overall average of 1,300 t/d. The rate of volcanic earthquakes remained at baseline levels of three events per day, though episodes of increased activity had occurred several times during the previous year. Ground deformation data from continuous GPS and electronic tilt data indicated inflation of the volcano since March 2022 and specifically at the E flank starting in 2023. The Alert Level remained at 1 (on a scale of 0-5) and PHIVOLCS reminded the public to remain outside of the 4-km-radius Permanent Danger Zone.
Source: Philippine Institute of Volcanology and Seismology (PHIVOLCS)
Report for Kavachi
Satellite data showed an area of yellow-green discolored water in the vicinity of the submarine Kavachi volcano that extended about 5.3 km SSW, became diffuse and curved NE, extending for another 6.5 km.
Source: Copernicus
Report for Lateiki
Satellite data showed an area of yellowish-green discolored water in the vicinity of the submarine Lateiki volcano on 26 April. The area of discolored water was narrow and drifted about 2 km SE and curved to the W, becoming more diffuse, and extending another 8.5 km before dissipating.
Source: Copernicus
Report for Lewotobi
PVMBG reported that during 24-25 and 27 April white steam-and-gas plumes rose as high as 100 m above the summit of Lewotobi’s Laki-laki volcano and drifted W and SW. On 28 April white-and-gray ash plumes rose 100-300 m and drifted SW and W. Emissions were not observed on 26 April. The Alert Level remained at 2 (the second lowest level on a scale of 1-4) and the public was warned to stay outside of the exclusion zone, defined as a 2-km radius around Laki-laki crater, 3 km to the NNE, and 5 km on the NE flanks.
Source: Pusat Vulkanologi dan Mitigasi Bencana Geologi (PVMBG, also known as CVGHM)
Report for Lewotolok
PVMBG reported that the eruption at Lewotolok continued during 24-30 April. White-and-gray ash plumes rose as high as 400 m above the summit and drifted W and NW during 25-26 April. White emissions rose up to 500 m above the summit and drifted W and NW on the other days. The Alert Level remained at 3 (on a scale of 1-4) and visitors and residents of Lamawolo, Lamatokan, and Jontona were warned to stay 2 km away from the vent and 3 km away from the vent on the S and SE flanks.
Source: Pusat Vulkanologi dan Mitigasi Bencana Geologi (PVMBG, also known as CVGHM)
Report for Marapi
PVMBG reported that eruptive activity at Marapi (on Sumatra) was ongoing during 24-30 April. White-and-gray ash plumes rose 300-1,000 m above the summit and drifted N, NW, and W on 24, 27, and 29 April. White steam-and-gas plumes rose 300 m above the summit and drifted NW on 26 April; emissions were not visible on the other days, though an eruptive event was recorded on 25 April. The Alert Level remained at 3 (on a scale of 1-4), and the public was warned to stay 4.5 km away from the active crater.
Source: Pusat Vulkanologi dan Mitigasi Bencana Geologi (PVMBG, also known as CVGHM)
Report for Masaya
On 18 April INETER reported that there continued to be no signs of lava-lake activity at the bottom of Masaya’s Santiago Crater after material from a landslide had covered the lake on 2 March. Small landslides continued to occur periodically, and one was shown in a webcam photo from 17 April. Continuous diffuse gas emissions rose from a vent on the crater floor and from a new vent located on the inner SW wall.
Source: Instituto Nicaragüense de Estudios Territoriales (INETER)
Report for Merapi
BPPTKG reported that the eruption at Merapi (on Java) continued during 19-25 April. Seismicity remained at high levels. The SW lava dome produced 152 lava avalanches that traveled as far as 2 km down the SW flank. Morphological changes to the SW lava dome were due to continuing effusion and collapses of material. The Alert Level remained at 3 (on a scale of 1-4), and the public was warned to stay 3-7 km away from the summit, based on location.
Source: Balai Penyelidikan dan Pengembangan Teknologi Kebencanaan Geologi (BPPTKG)
Report for Reventador
IG-EPN reported that a moderate eruption at Reventador was ongoing during 23-30 April. Seismicity was unknown due to data transmission problems. Even though cloudy weather conditions often prevented webcam and satellite observations, daily ash-and-gas plumes were visible rising as high as 1.4 km above the crater rim and drifting NW, W, and SW. Secretaría de Gestión de Riesgos maintained the Alert Level at Orange (the second highest level on a four-color scale).
Sources: Instituto Geofísico-Escuela Politécnica Nacional (IG-EPN), Secretaría de Gestión de Riesgos (SGR)
Report for Reykjanes
IMO reported that the cone just E of Sundhnúk and along the fissure within the Reykanes volcanic system continued to erupt lava. The average effusion rate was 0.9 (± 0.4) cubic meters per second during 15-25 April, whereas during the first half of April the rate was an estimated 3-4 cubic meters per second. By 25 April the lava-flow field was an estimated 6.16 square kilometers with an approximate volume of 34 (± 1.9) million cubic meters. The average thickness of the flows was 5.5 (± 0.3) m.

During 24-30 April lava flowed S through an open channel near the cone and, more distally, through lava tubes. The tubes transported lava to the area NE of Grindavík, inflating the flow field along the constructed barriers there; on 27 April a small flow overtopped the barrier and flowed down to its base. Gas emissions continued to drift downwind and residents were advised to monitor air quality. Inflation from magma accumulation beneath Svartsengi was first detected at the beginning of April and has continued based on modeling of GPS and satellite data, though on 30 April IMO noted that the rate had slowed during the previous few days.
Source: Icelandic Meteorological Office (IMO)
Report for Sangay
IG-EPN reported that high levels of eruptive activity continued at Sangay during 23-30 April. The seismic network recorded 388-1,167 daily explosions during the week. Daily gas-and-ash plumes visible in webcam and/or satellite images generally rose as high as 2 km above the summit and drifted NW, W, and SW; weather conditions often hindered views during the week. Incandescent material was visible daily during dark hours descending the SE flank as far as 1.8 km. Several episodes of explosions were visible in webcam images during 25-28 April and pyroclastic density currents descended the SE flank during 27-29 April. Ash plumes possibly rose as high as 7 km above the summit and drifted W and SW during 28-29 April. Secretaría de Gestión de Riesgos (SGR) maintained the Alert Level at Yellow (the second highest level on a four-color scale).
Sources: Instituto Geofísico-Escuela Politécnica Nacional (IG-EPN), Secretaría de Gestión de Riesgos (SGR)
Report for Semeru
PVMBG reported that eruptive activity continued at Semeru during 24-30 April. Almost daily white-and-gray ash plumes rose 100-1,000 m above the summit and drifted in multiple directions; an eruptive event was recorded on 30 April though no emissions were observed. The Alert Level remained at 3 (the third highest level on a scale of 1-4). The public was warned to stay at least 5 km away from the summit in all directions, 13 km from the summit to the SE, 500 m from the banks of the Kobokan drainage as far as 17 km from the summit, and to avoid other drainages including the Bang, Kembar, and Sat, due to lahar, avalanche, and pyroclastic flow hazards.
Source: Pusat Vulkanologi dan Mitigasi Bencana Geologi (PVMBG, also known as CVGHM)
Report for Sheveluch
KVERT reported that eruptive activity at Sheveluch continued during 18-26 April with a daily thermal anomaly identified in satellite images. A plume of resuspended ash drifted 195 km S and SE during 22-24 April. The Aviation Color Code remained at Orange (the third level on a four-color scale). Dates are based on UTC times; specific events are in local time where noted.
Source: Kamchatkan Volcanic Eruption Response Team (KVERT)
Report for Suwanosejima
JMA reported that eruptive activity at Suwanosejima's Ontake Crater continued during 22-29 April. Crater incandescence was observed in webcam images nightly. Emissions rose as high as 800 m above the crater rim; no explosions were detected. The Alert Level remained at 2 (on a 5-level scale) and the public was warned to stay at least 1.5 km away from the crater.
Source: Japan Meteorological Agency (JMA)
Report for Yasur
On 25 April the Vanuatu Meteorology and Geohazards Department (VMGD) reported that activity at Yasur continued at a level of “major unrest,” as defined by the Alert Level 2 status (on a scale of 0-5). Recent visual observations and photos taken in the field indicated that explosions continued, producing emissions of gas, steam, and/or ash. Gas emissions were identified in satellite images during the previous few days. The report warned that some of the explosions may eject material that falls in and around the crater. The public was reminded to not enter the restricted area within 600 m around the boundaries of the Permanent Exclusion Zone, defined by Danger Zone A on the hazard map.
Source: Vanuatu Meteorology and Geohazards Department (VMGD)