Aira (Japan) | 17 November-23 November 2021 | Continuing Activity Cite this Report Cite this Report |
 Aira Aira
Ryukyu Volcanic Arc
|
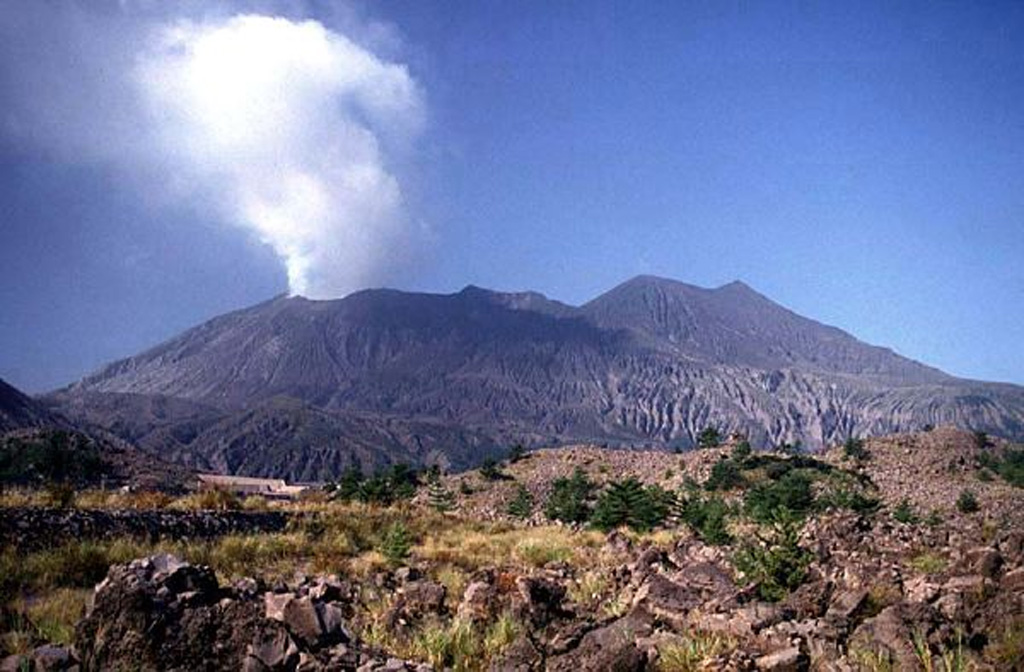
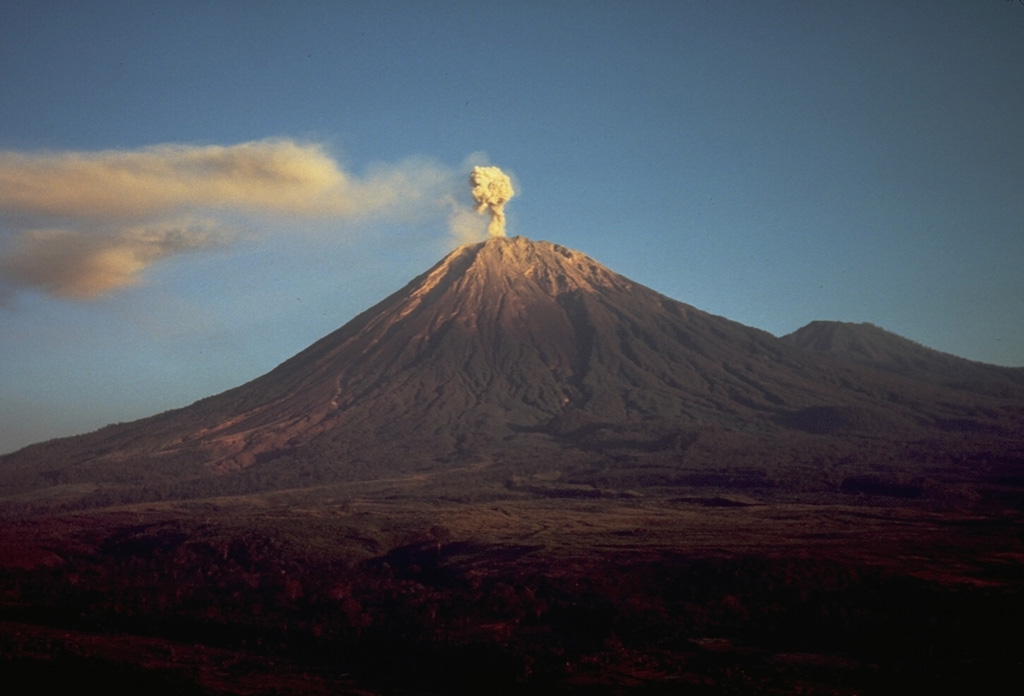
JMA reported that incandescence from Minamidake Crater (at Aira Caldera’s Sakurajima volcano) was visible at night during 15-22 November. Three eruptive events were recorded during 15-19 November. The sulfur dioxide emission rate was 700 tons per day on 16 November. The Alert Level remained at 3 (on a 5-level scale), and residents were warned to stay 2 km away from the crater.
Source: Japan Meteorological Agency (JMA)
|
Dukono (Indonesia) | 17 November-23 November 2021 | Continuing ActivityCite this Report |
 Dukono Dukono
Halmahera Volcanic Arc
|
Based on satellite and wind model data, the Darwin VAAC reported that on 17 November ash plumes from Dukono rose to 2.1 km (7,000 ft) a.s.l. and drifted NE and ENE. Dense white plumes rose as high as 500 m and drifted NW, W, and SW during 18-23 November according to PVMBG. The Alert Level remained at 2 (on a scale of 1-4), and the public was warned to remain outside of the 2-km exclusion zone.
Sources: Pusat Vulkanologi dan Mitigasi Bencana Geologi (PVMBG, also known as CVGHM), Darwin Volcanic Ash Advisory Centre (VAAC)
|
Fagradalsfjall (Iceland) | 17 November-23 November 2021 | Continuing ActivityCite this Report |
 Fagradalsfjall Fagradalsfjall
Iceland Neovolcanic Rift Volcanic Province
|
Icelandic Meteorological Office (IMO) reported that no eruptive activity at the Krýsuvík-Trölladyngja volcanic system had been visible since 18 September. Small quantities of volcanic gases continued to be detected in the atmosphere. At the end of September, after the eruption had ceased, inflation of the Reykjanes Peninsula began to be detected and broadly correlated with an area that deflated during the eruption. The inflation was thought to be most likely caused by further intrusion of magma; the earthquake swarm detected S of Keilir in late September may be related to such an intrusion, though no deformation was detected at the surface during the swarm. IMO noted that such an influx of magma following an eruption was not uncommon, and that the inflation did not necessarily mean that another eruption was imminent.
Source: Icelandic Meteorological Office (IMO)
|
Great Sitkin (United States) | 17 November-23 November 2021 | Continuing ActivityCite this Report |
 Great Sitkin Great Sitkin
Aleutian Ridge Volcanic Arc
|
AVO reported that lava effusion at Great Sitkin had slowed or paused based on a 17 November satellite image that showed no advancement of the lava flows since 10 November. Seismicity remained elevated during 17-23 November and elevated surface temperatures were visible in occasionally clear satellite images. Steam emissions were sometimes visible in webcam images. The Aviation Color Code and the Volcano Alert Level remained at Orange and Watch, respectively.
Source: US Geological Survey Alaska Volcano Observatory (AVO)
|
Katmai (United States) | 17 November-23 November 2021 | Continuing ActivityCite this Report |
 Katmai Katmai
Alaska Peninsula Volcanic Arc
|
AVO reported that during 17-18 November strong winds in the vicinity of Katmai and the Valley of Ten Thousand Smokes blew unconsolidated ash SE over Shelikof Strait and Kodiak Island at an altitude up to 2.1 km (7,000 ft) a.s.l. The ash was originally deposited during the Novarupta eruption in 1912. The Volcano Alert Level remained at Normal and the Aviation Color Code remained at Green.
Source: US Geological Survey Alaska Volcano Observatory (AVO)
|
Kilauea (United States) | 17 November-23 November 2021 | Continuing ActivityCite this Report |
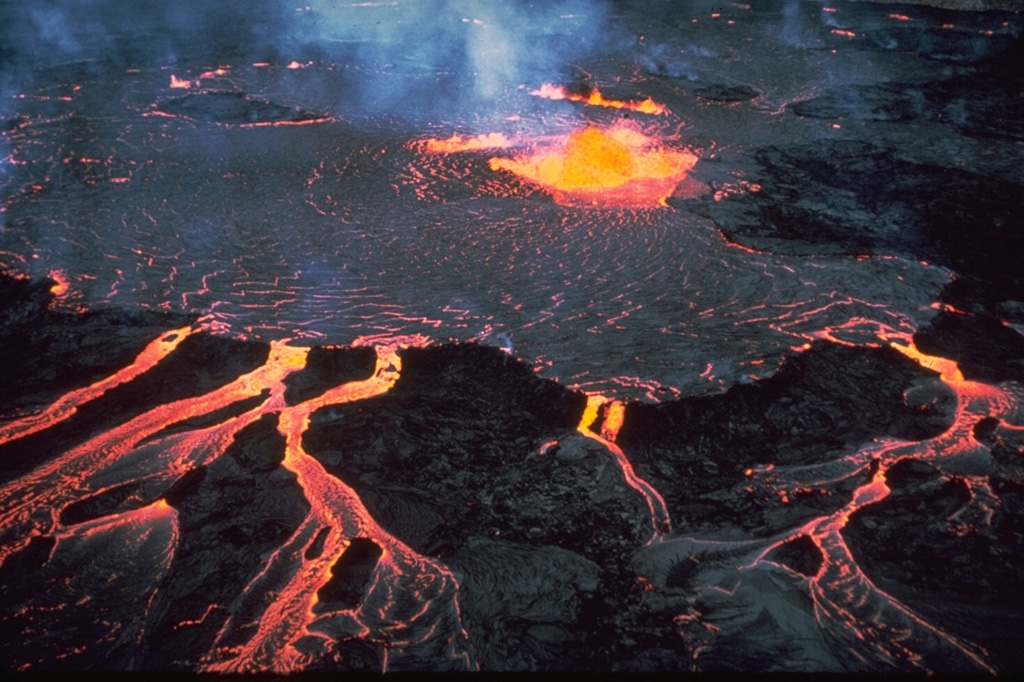 Kilauea Kilauea
Hawaiian-Emperor Hotspot Volcano Group
|
HVO reported that the summit eruption at Kilauea continued at a vent in the lower W wall of Halema`uma`u Crater. By 16 November the total volume of erupted lava was an estimated 30 million cubic meters, and the lake which had risen a total of 60 m since 29 September. During 17-23 November earthquake activity remained below background levels but volcanic tremor was elevated. Spattering and ponded lava within the vent were visible; lava entered the lake through the E part of the W wall cone, feeding an active area of the lake. Lava periodically oozed from the cooler, outer margins of the lake onto the lowest of the exposed down-dropped caldera floor blocks. The sulfur dioxide emission rate remained above background levels, and was 3,000-3,800 tonnes per day on 18 and 23 November. The Aviation Color Code and the Volcano Alert Level remained at Orange and Watch, respectively.
Source: US Geological Survey Hawaiian Volcano Observatory (HVO)
|
La Palma (Spain) | 17 November-23 November 2021 | Continuing ActivityCite this Report |
 La Palma La Palma
Canary Volcanic Province
|
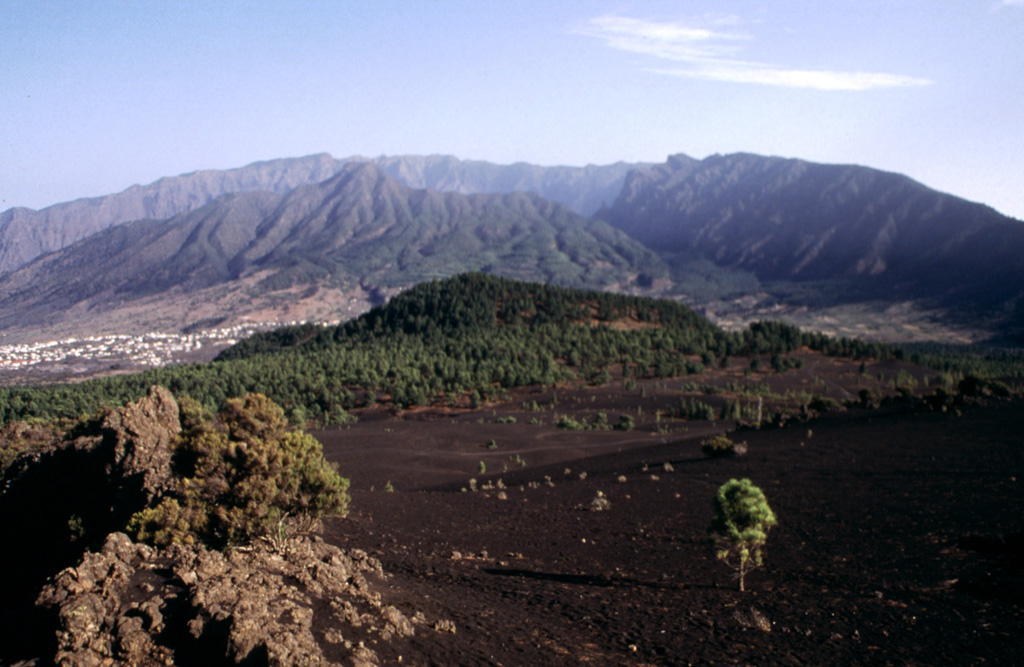
The eruption at La Palma continued during 17-23 November, characterized by Strombolian explosions and lava fountaining/jetting from multiple vents, advancing and sometimes branching lava flows, and daily ash emissions. Eruption details are based on official sources including daily PEVOLCA (Plan de Emergencias Volcánicas de Canarias) steering committee summaries. Volcanic tremor levels increased during 16-17 November then returned to low levels. Seismicity persisted at variable but elevated levels, with earthquake locations distributed at depths of 10-15 km and 30-40 km. The number of located earthquakes peaked at 230 during 17-18 November, which was the highest daily total recorded since the beginning of the eruption. Additionally, a M 5.1 earthquake was detected at 0208 on 19 November at a depth of 36 km; this event was the largest earthquake recorded since the swarm heralding the magmatic intrusion began on 11 September. Dozens of events were felt by residents during the week.
Several vents in the main cone continued to effuse lava, eject tephra, and emit ash-and-gas plumes at varying intensities. Lava was transported W through pre-existing lava channels and tubes or descended over older flows and over new ground, increasing the area of the flow field, which was made up of overlapping flows numbered 1-11. Flows 1, 2, and 9 had merged and contributed lava to the main delta, which had grown more than 0.43 square kilometers by 23 November.
In the evening of 18 November lava overflowed one of the craters in the main cone and increased the lava-flow rate; crater overflows were again visible on 21 November. Lava filled in some gaps between the N flows, numbers 4 and 7. During 17-18 November flow 5 advanced along the N base of Montaña de Todoque and along the S edge of flow 4 which had also advanced and widened. By 21 November flow 4 had merged with flow 7, the branch to the N. Flow 7 advanced W and by 1303 on 22 November lava reached the sea at La Viña Beach. Plumes ranging from white to dark gray rising from the new ocean entry prompted an air quality warning to be issued for about 3,000 people living in areas of San Borondón, Tazacorte, El Cardón, and Camino Los Palomares, all within about a 2 km radius to the N and NE. A ban on maritime activities near the entry also went into effect, though it was lifted the next morning. By 23 November the width of the flow field had grown to 3.3 km and lava covered an estimated 10.73 square kilometers.
Sulfur dioxide emissions fluctuated at high levels between 900 and 32,000 tons per day, remaining at levels lower than the peak values of 50,000 tons per day recorded on 23 September. Suspended ash and high concentrations of volcanic gases triggered a few air-quality alerts mostly affecting the W part of the island; authorities warned residents of some affected areas (Los Llanos de Aridane, Tazacorte, El Paso, Puntagorda, and Tijarafe in particular) to stay indoors. High values of volcanic gases led to the evacuation of essential personnel working in plants in the exclusion zone during 16-17 November. After a lull in activity for a period of time on 17 November, Strombolian activity and ash emissions resumed later in the day and prompted a VONA the next day. Video posted at 1615 on 18 November showed jetting lava and billowing ash plumes containing some lightning flashes. Sometimes dense and billowing ash-and-gas plumes rose 2-3.7 km (6,600-12,100 ft) a.s.l. and drifted NE, E, ESE, and SW during the rest of the week. The 20 November PEVOLCA reported that the total volume of emitted tephra during the eruption had surpassed 10 million cubic meters. Ash deposits on runways and unfavorable flying conditions disrupted flights at La Palma airport during 21-23 November.
Sources: Instituto Volcanológico de Canarias (INVOLCAN), Instituto Geográfico Nacional (IGN), Gobierno de Canaries, Aena
|
Lewotolok (Indonesia) | 17 November-23 November 2021 | Continuing ActivityCite this Report |
 Lewotolok Lewotolok
Sunda Volcanic Arc
|
PVMBG reported that the eruption at Lewotolok continued during 17-23 November. White-and-gray plumes that were sometimes dense rose as high as 2 km above the summit. Incandescent material was ejected 200 m E from the vent during 19-20 November. Crater incandescence was visible during 22-23 November. The Alert Level remained at 3 (on a scale of 1-4) and the public was warned to stay 3 km away from the summit crater.
Source: Pusat Vulkanologi dan Mitigasi Bencana Geologi (PVMBG, also known as CVGHM)
|
Merapi (Indonesia) | 17 November-23 November 2021 | Continuing ActivityCite this Report |
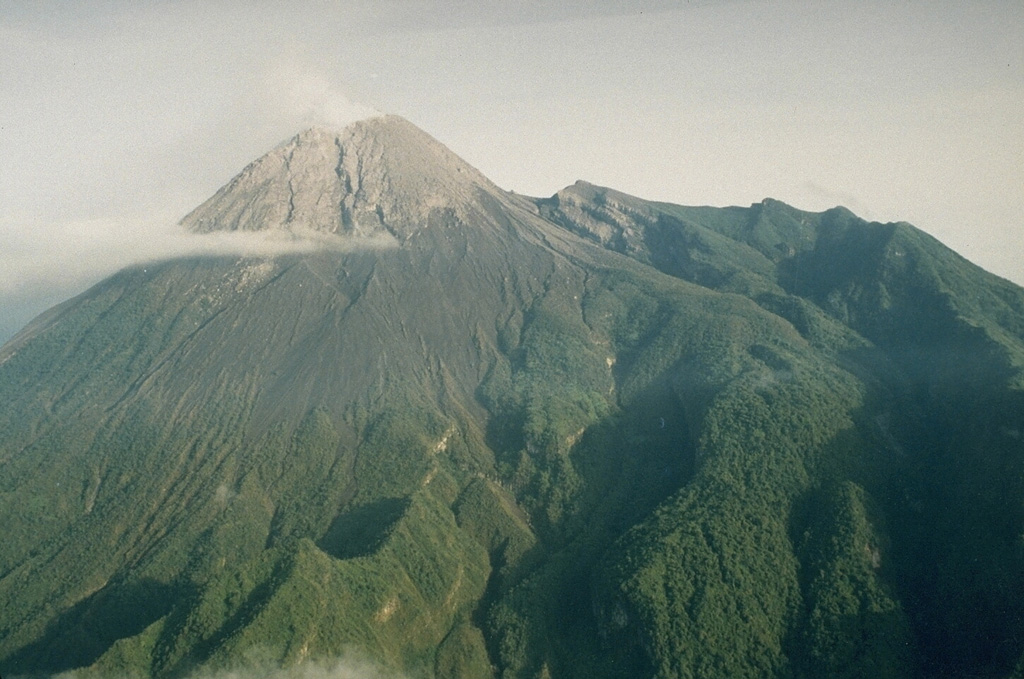 Merapi Merapi
Sunda Volcanic Arc
|
BPPTKG reported no notable morphological changes to Merapi’s SW lava dome, located just below the SW rim, or the dome in the summit crater during 12-18 November. The estimated dome volumes remained stable at 1.61 million cubic meters for the SW dome and almost 2.93 million cubic meters for the summit dome. As many as 212 lava avalanches traveled a maximum of 2 km SW. One pyroclastic flow traveled 1.8 km SW on 13 November. The Alert Level remained at 3 (on a scale of 1-4), and the public was warned to stay 3-5 km away from the summit based on location.
Source: Balai Penyelidikan dan Pengembangan Teknologi Kebencanaan Geologi (BPPTKG)
|
Nevados de Chillan (Chile) | 17 November-23 November 2021 | Continuing ActivityCite this Report |
 Nevados de Chillan Nevados de Chillan
Southern Andean Volcanic Arc
|
SERNAGEOMIN reported continuing explosive and effusive activity at Nevados de Chillán’s Nicanor Crater during 1-15 November. Explosions generated both plumes with moderate ash content and white steam-rich plumes that rose as high as 2 km above the crater rim. Explosions occasionally ejected incandescent material onto the N side of the crater and the N flank.
A new dome, which had emerged around 28 October at the L7 vent, was partially destroyed by explosions on 8 November, and then regrew to 80 m long and 55 m wide. Pyroclastic flows descended the NE flank, traveling as far as 700 m on 8 and 10 November. The L7 lava flow, between the inactive L5 and L6 flows, slowly advanced and was 930 m long; a NE branch of L7 had not advanced since 14 October, though SE and E branches formed on 9 and 14 November, respectively. A second active flow, L8, had not lengthened past 385 m. Sulfur dioxide emissions averaged 300 tons per day, peaking at 462 tons per day on 14 November, and were lower than rates recorded during the last half of September. The Alert Level remained at Yellow, the second lowest level on a four-color scale. ONEMI stated that Alert Level Yellow (the middle level on a three-color scale) remained in place for the communities of Pinto and Coihueco, noting that the public should stay at least 2 km away from the crater.
Sources: Servicio Nacional de Geología y Minería (SERNAGEOMIN), Oficina Nacional de Emergencia-Ministerio del Interior (ONEMI)
|
Pavlof (United States) | 17 November-23 November 2021 | Continuing ActivityCite this Report |
 Pavlof Pavlof
Aleutian Ridge Volcanic Arc
|
AVO reported that the eruption at Pavlof continued during 14-23 November and was focused at a vent on the upper NE flank. Seismicity remained elevated and signals were periodically recorded that were likely explosions. Lava fountaining began on 14 November and had built a small, unstable cone. Hot debris from the cone traveled a few hundred meters down the flanks, melting snow and ice that resulted in narrow lahars which traveled several kilometers down the flanks. Elevated surface temperatures were observed in satellite data at least through 23 November, suggesting that the lava fountaining continued. The Volcano Alert Level remained at Watch and the Aviation Color Code remained at Orange.
Source: US Geological Survey Alaska Volcano Observatory (AVO)
|
Popocatepetl (Mexico) | 17 November-23 November 2021 | Continuing ActivityCite this Report |
 Popocatepetl Popocatepetl
Trans-Mexican Volcanic Arc
|
CENAPRED reported that each day during 16-23 November there were 9-29 steam-and-gas emissions from Popocatépetl that drifted NW, NE, and E. At 1714 on 19 November an explosion generated an ash plume that rose 2 km above the crater rim and drifted NE. A minor explosion at 0230 on 21 November generated an ash plume that rose 600 m and drifted NW, and at 0136 the next morning another small explosion produced an ash plume that rose 800 m and drifted NE. The Alert Level remained at Yellow, Phase Two (the middle level on a three-color scale).
Source: Centro Nacional de Prevencion de Desastres (CENAPRED)
|
Sabancaya (Peru) | 17 November-23 November 2021 | Continuing ActivityCite this Report |
 Sabancaya Sabancaya
Central Andean Volcanic Arc
|
Instituto Geofísico del Perú (IGP) reported a daily average of 74 explosions at Sabancaya during 15-21 November. Gas-and-ash plumes rose as high as 2 km above the summit and drifted NE, S, SW, and W. Eight thermal anomalies originating from the lava dome in the summit crater were identified in satellite data. Minor inflation continued to be detected near Hualca Hualca (4 km N). The Alert Level remained at Orange (the second highest level on a four-color scale) and the public were warned to stay outside of a 12-km radius.
Source: Instituto Geofísico del Perú (IGP)
|
Semeru (Indonesia) | 17 November-23 November 2021 | Continuing ActivityCite this Report |
 Semeru Semeru
Sunda Volcanic Arc
|
PVMBG reported that gray-and-white emissions rose 200-700 m above Semeru’s summit and drifted SW, N, and E during 16-23 November. The emissions were visible almost daily; weather clouds occasionally prevented visual observations of the summit. The Alert Level remained at 2 (on a scale of 1-4), with a general exclusion zone of 1 km and extensions to 5 km in the SSE sector.
Source: Pusat Vulkanologi dan Mitigasi Bencana Geologi (PVMBG, also known as CVGHM)
|
Semisopochnoi (United States) | 17 November-23 November 2021 | Continuing ActivityCite this Report |
 Semisopochnoi Semisopochnoi
Aleutian Ridge Volcanic Arc
|
AVO reported that eruptive activity at Semisopochnoi's North Cerberus crater continued during 17-23 November. Daily minor explosions were detected in seismic and infrasound data. Small ash plumes rising no higher than 3 km (10,000 ft) a.s.l. likely continued to be emitted, though weather clouds obscured satellite and webcam views of the volcano on most days. The Aviation Color Code remained at Orange and the Volcano Alert Level remained at Watch.
Source: US Geological Survey Alaska Volcano Observatory (AVO)
|
Sheveluch (Russia) | 17 November-23 November 2021 | Continuing ActivityCite this Report |
 Sheveluch Sheveluch
Eastern Kamchatka Volcanic Arc
|
KVERT reported that a thermal anomaly over Sheveluch was identified in satellite images during 12-19 November. The Aviation Color Code remained at Orange (the second highest level on a four-color scale).
Source: Kamchatkan Volcanic Eruption Response Team (KVERT)
|
Suwanosejima (Japan) | 17 November-23 November 2021 | Continuing ActivityCite this Report |
 Suwanosejima Suwanosejima
Ryukyu Volcanic Arc
|
JMA reported that plumes from Suwanosejima's Ontake Crater rose 180-200 m above the crater rim during 15-22 November. Large blocks were ejected 300 m from the crater and were deposited in a ballistic pattern during 15-19 November, and ashfall was reported in Toshima village (4 km SSW). The Alert Level remained at 3 and the public was warned to stay 2 km away from the crater.
Source: Japan Meteorological Agency (JMA)
|
Taal (Philippines) | 17 November-23 November 2021 | Continuing ActivityCite this Report |
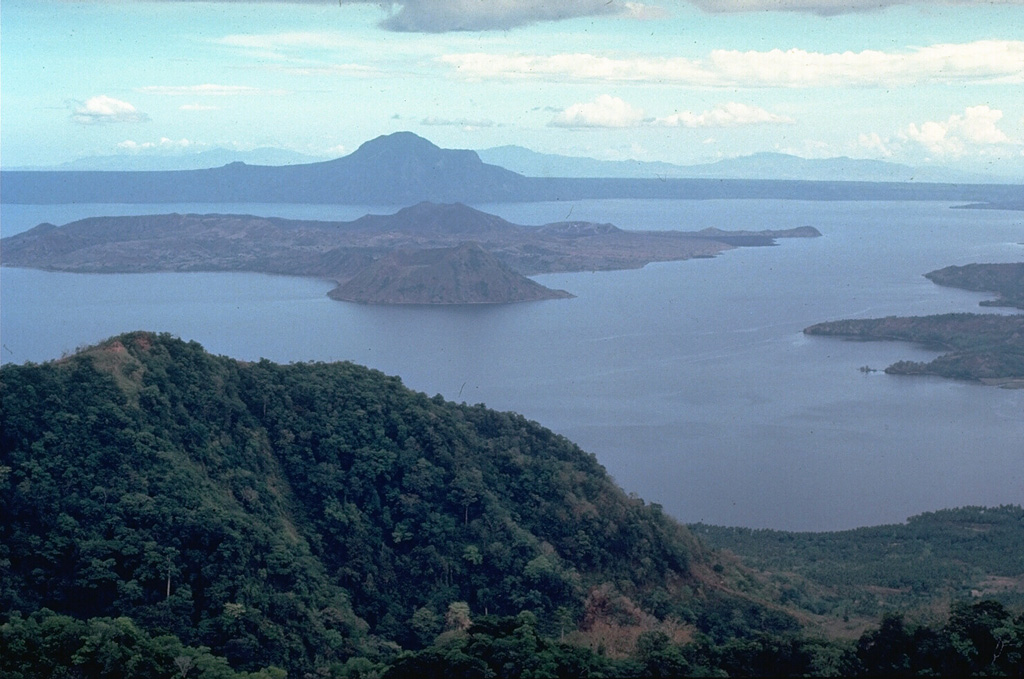 Taal Taal
Luzon Volcanic Arc
|
PHIVOLCS reported that unrest at Taal continued during 17-23 November. Sulfur dioxide emissions continued to be elevated, averaging 6,643-12,168 tonnes/day. Upwelling hot volcanic fluids were visible in the crater lake, and daily gas-and-steam plumes rose 1-3 km above the lake and drifted WNW, WSW, and SW. Low-level background tremor persisted along with 5-30 volcanic earthquakes per day, 2-4 low-frequency volcanic earthquakes per day, and 1-23 daily episodes of volcanic tremor, each lasting 1-5 minutes. One hybrid earthquake was recorded during 19-20 November and three were detected during 22-23 November. No earthquakes were recorded for a period during 18-19 November. Three short (1-5 minutes) phreatomagmatic bursts were recorded at 0811, 0817, and 0834 on 22 November. The events generated plumes that rose 200-1,500 m based on thermal camera images. PHIVOLCS stated that the events were likely driven by fracturing and gas release from magma beneath the Taal Volcano Island. The Volcano Alert Level remained at a 2 (on a scale of 0-5). PHIVOLCS reminded the public that the entire Taal Volcano Island is a Permanent Danger Zone (PDZ) and that boating on Taal Lake was prohibited.
Source: Philippine Institute of Volcanology and Seismology (PHIVOLCS)
|
Vulcano (Italy) | 17 November-23 November 2021 | Continuing ActivityCite this Report |
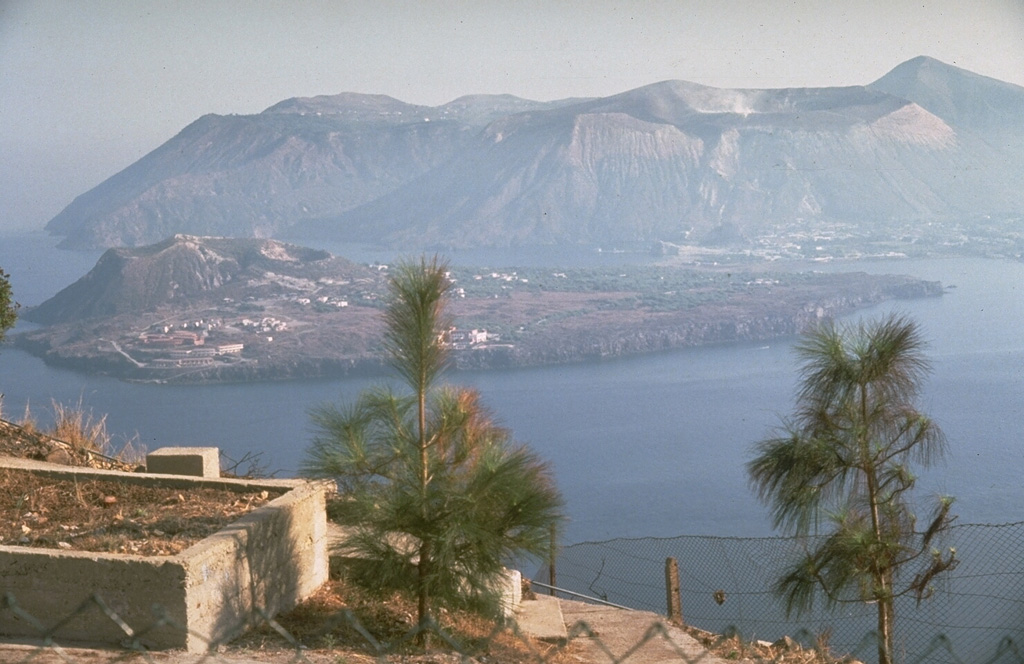 Vulcano Vulcano
Aeolian Volcanic Arc
|
According to an order issued by the Municipality of Lipari that went into effect on 22 November, residents within three high-risk zones (with an exception for the Lentia village) on Vulcano were not allowed to stay overnight in their homes between the hours of 2300-0600 due to an increase in carbon dioxide emissions in area to the N of La Fossa Crater. Residents in a lower-risk zone were allowed to stay in their homes but not sleep on the first floor. In addition, non-residents were banned from visiting the island for 30 days except for essential workers. The Dipartimento della Protezione Civile maintained the Alert Level at Yellow (the second lowest level on a four-color scale).
Sources: Municipality of Lipari, Dipartimento della Protezione Civile
|
Whakaari/White Island (New Zealand) | 17 November-23 November 2021 | Continuing ActivityCite this Report |
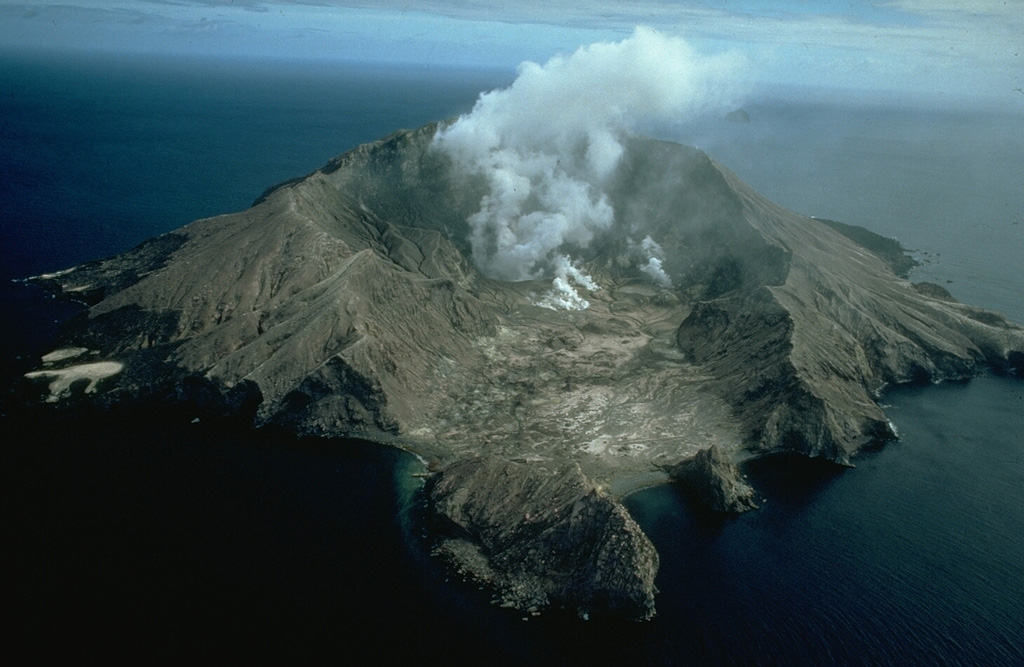 Whakaari/White Island Whakaari/White Island
Taupo Volcanic Arc
|
GeoNet reported results from an 18 November overflight of Whakaari/White Island, noting a decrease in gas emissions and the lake level. Gas measurements showed that sulfur dioxide emissions had decreased from 681 tons per day recorded on 2 November to 484 tons per day. Additionally, both carbon dioxide and hydrogen sulfide decreased from 2712 to 1416 tons per day and from 38 to 19 tons per day, respectively. The gas data suggested that molten material at depth continued to degas. Temperatures in the main vent area were 243-264 degrees Celsius, similar to the range (202-264 degrees Celsius) measured both in September and earlier in November. Very minor ash emissions were visible and deposits only extended around the active vents. A new vent was observed, located S of the main vent and near the base of the 2019 landslide area. Deposits around the new vent suggested that it formed by an energetic, steam-driven ejection of mud. The Volcanic Alert Level remained at 2 and the Aviation Color Code remained at Yellow.
Source: GeoNet
|
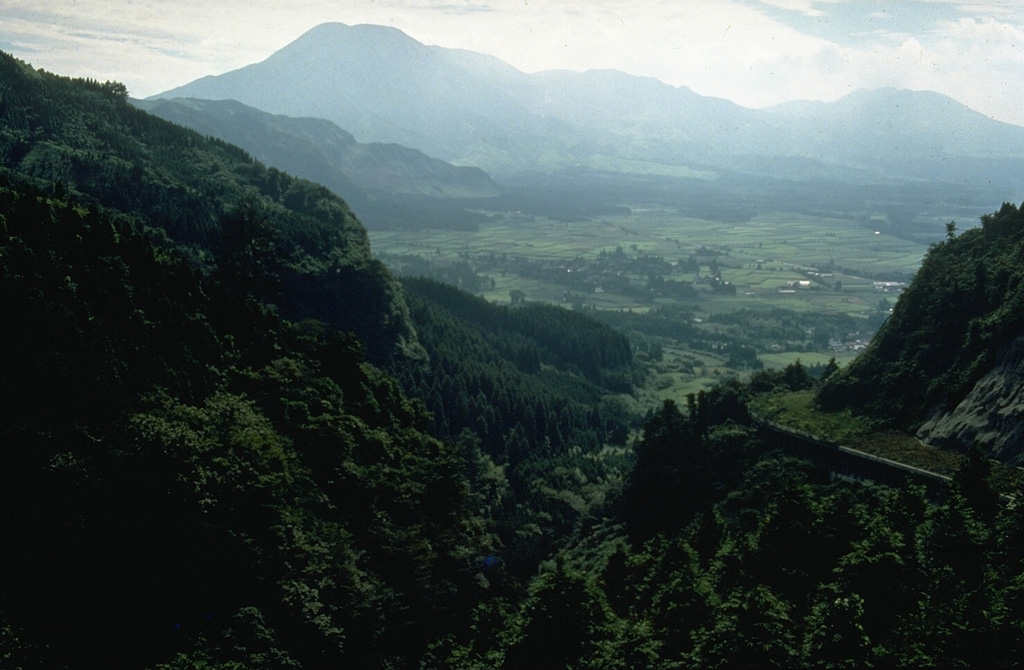 Asosan
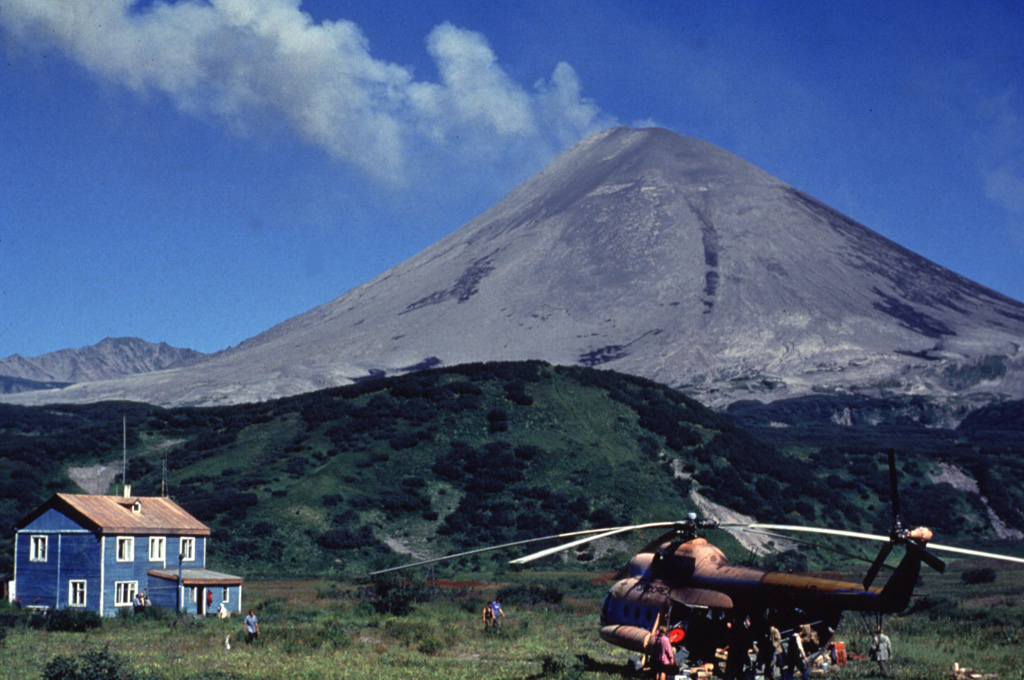 Karymsky
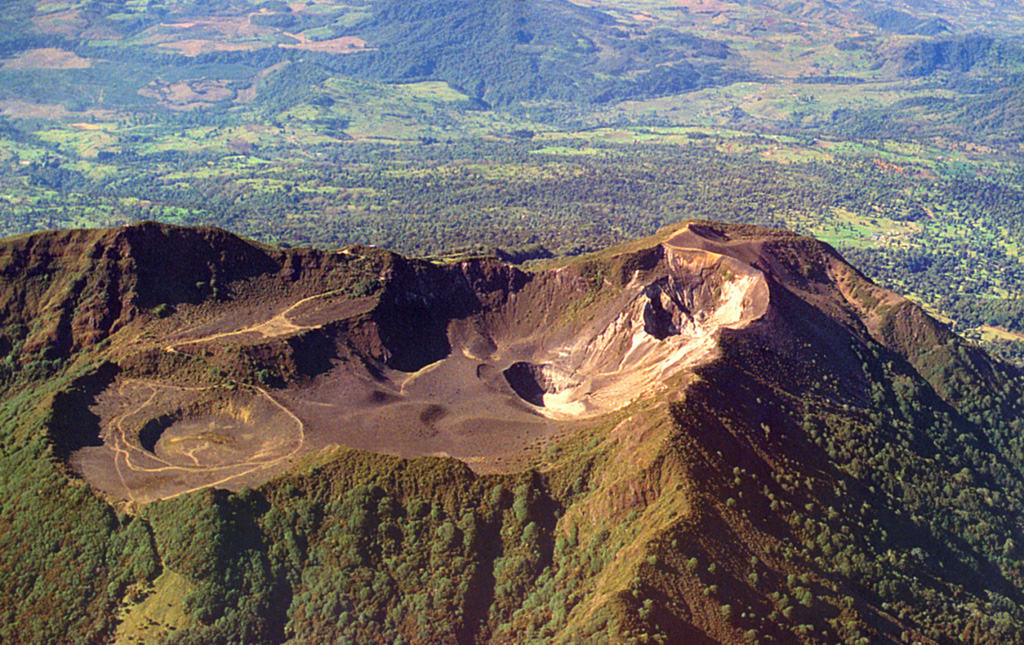 Turrialba