Manam
Papua New Guinea
4.08°S, 145.037°E; summit elev. 1807 m
All times are local (unless otherwise noted)
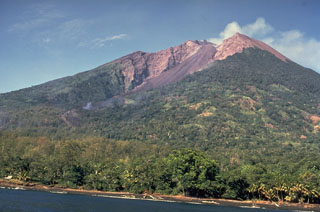
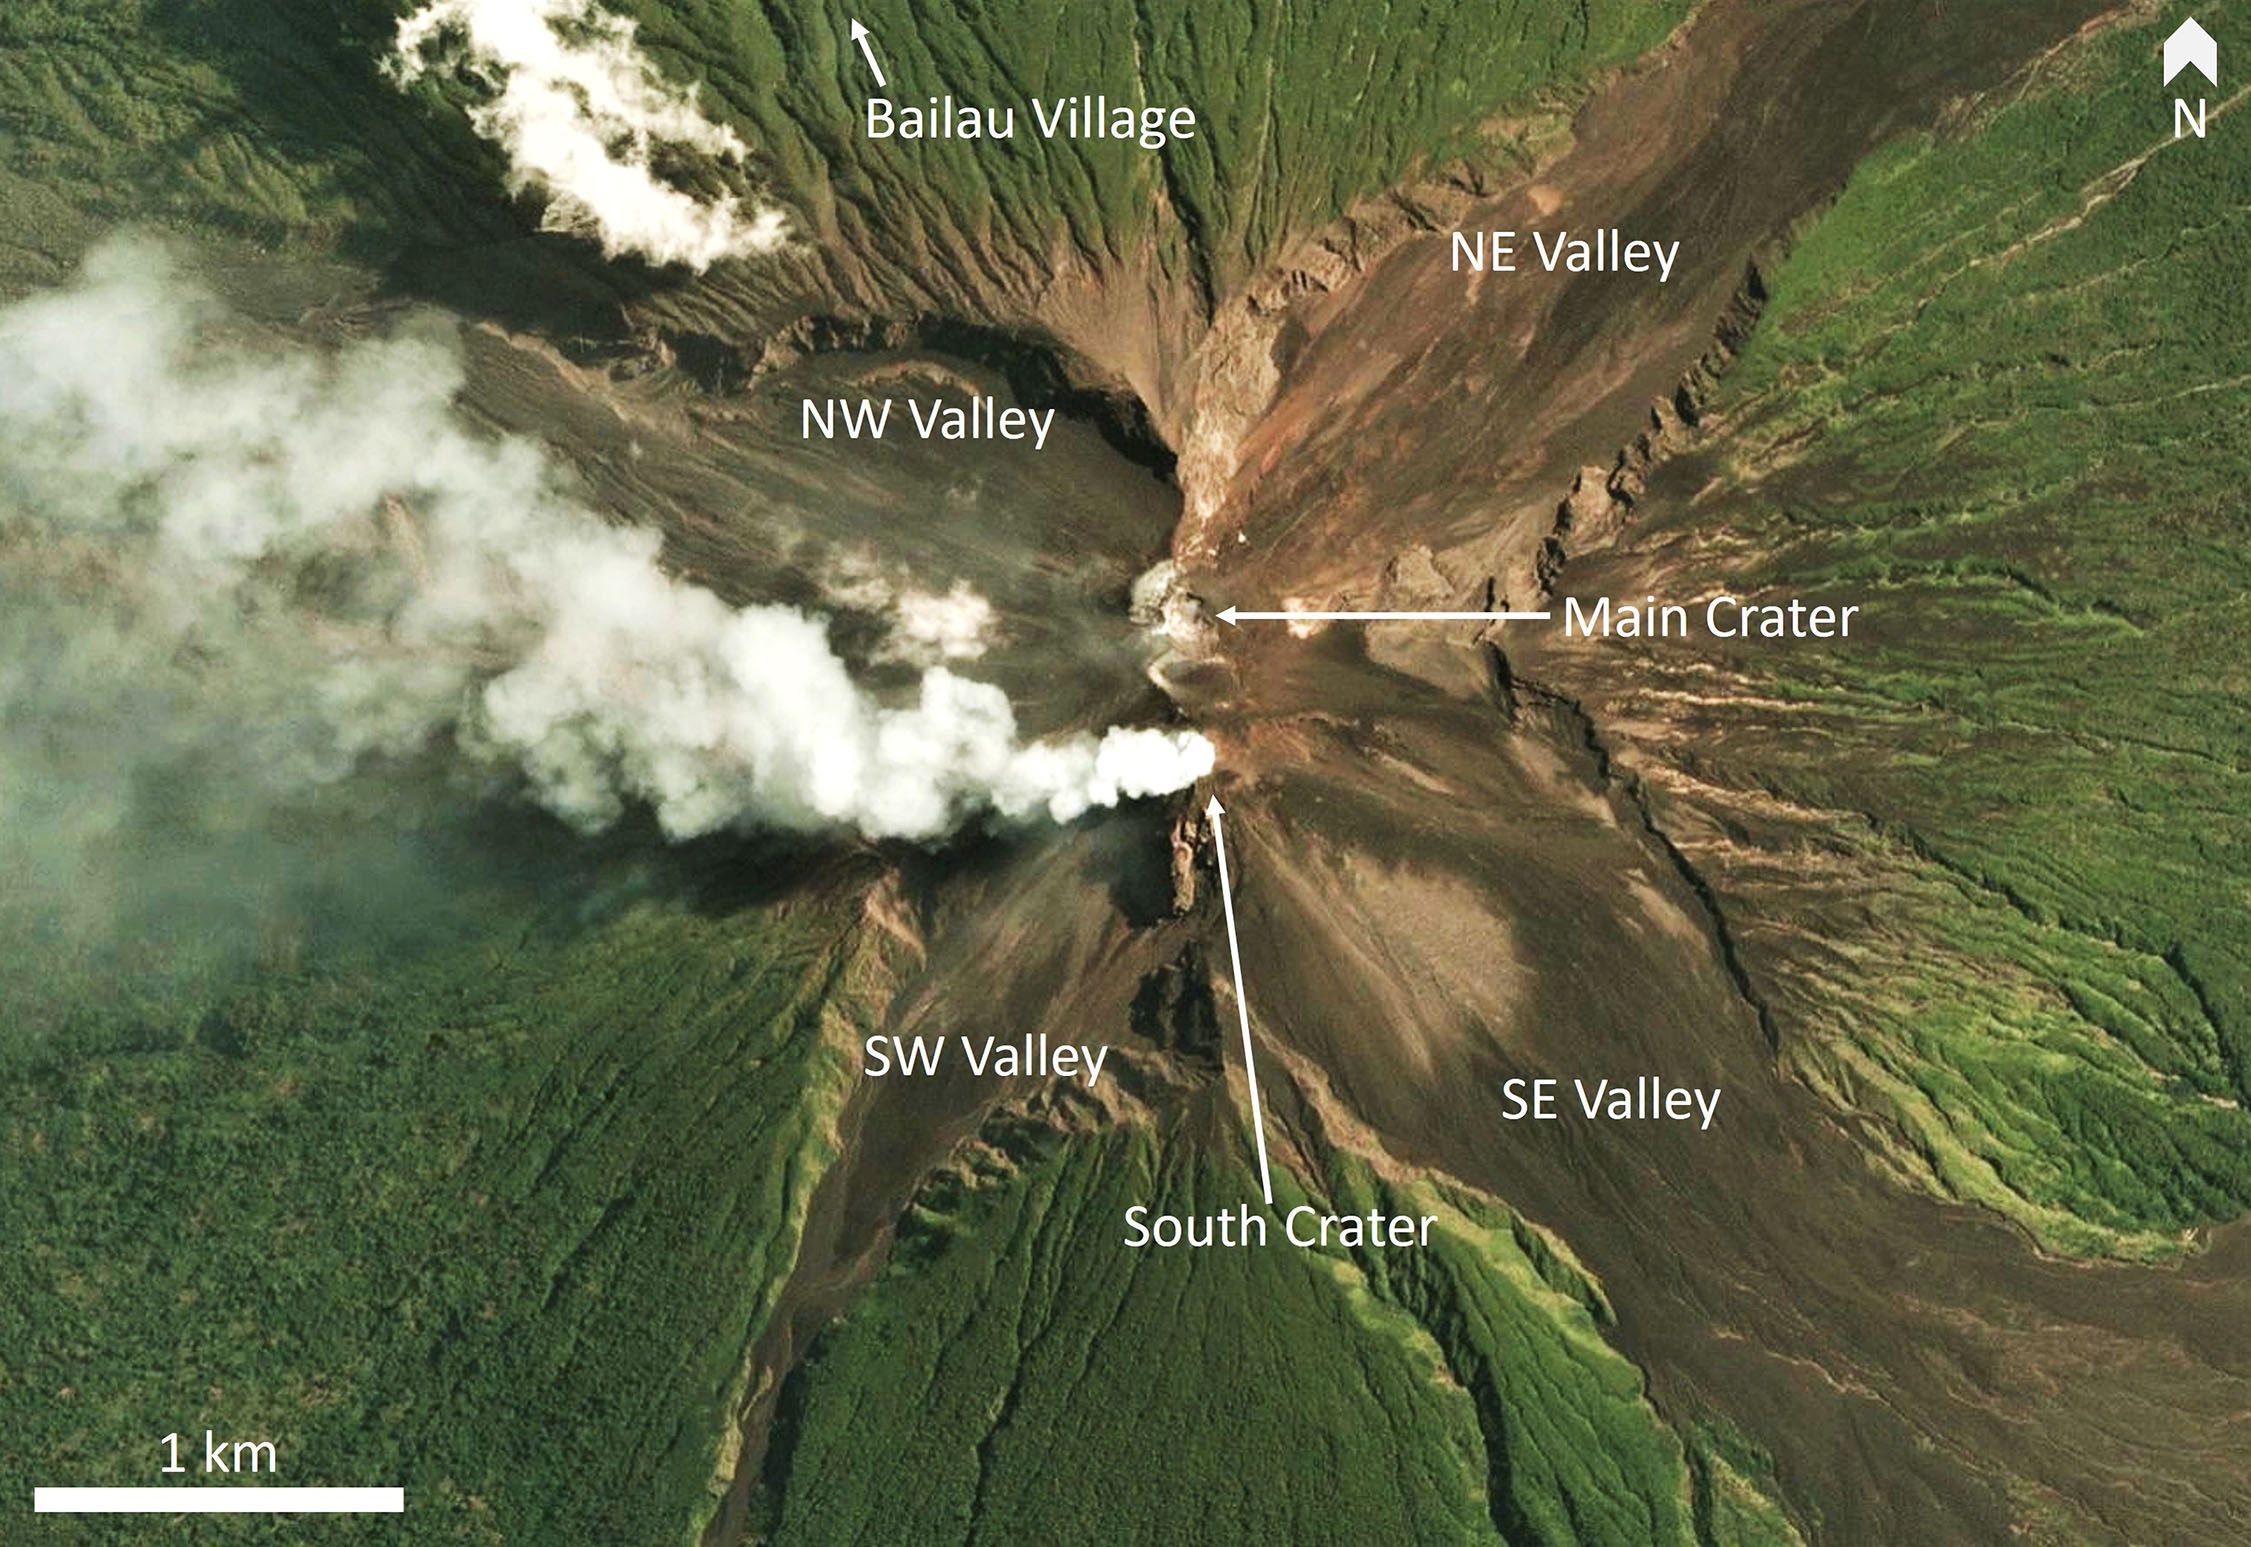
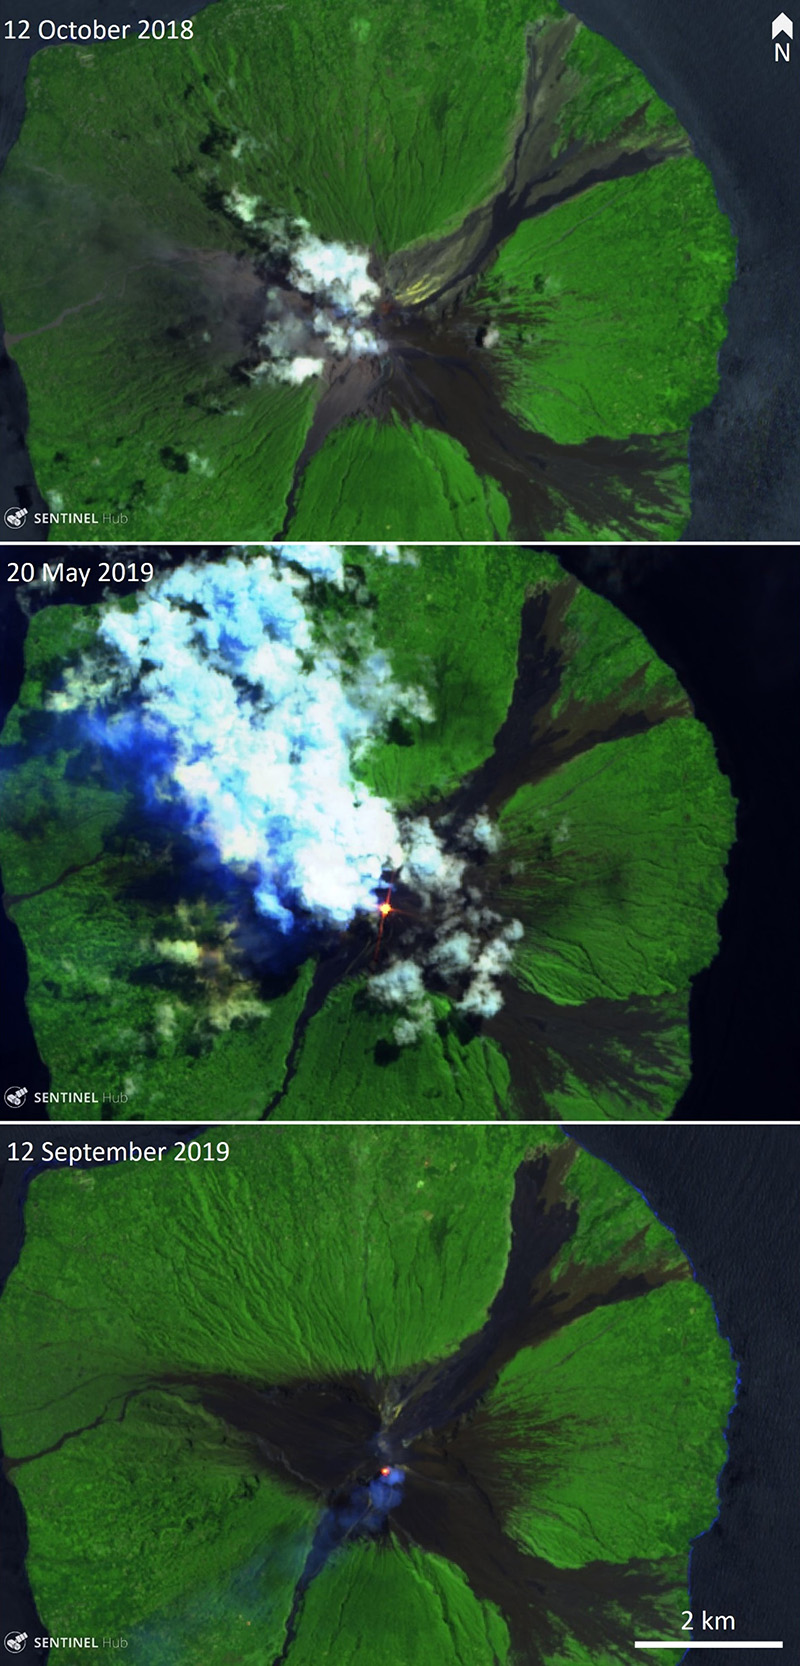
Manam is a frequently active volcano forming an island approximately 10 km wide, located 13 km north of the main island of Papua New Guinea. At the summit are the Main Crater and South Crater, with four valleys down the NE, SE, SW, and NW flanks (figure 57). Recent activity has occurred at both summit craters and has included gas and ash plumes, lava flows, and pyroclastic flows. Activity in December 2018 prompted the evacuation of nearby villages and the last reported activity for 2018 was ashfall on 8 December. Activity from January through September 2019 summarized below is based on information from the Rabaul Volcano Observatory (RVO), the Darwin Volcanic Ash Advisory Center (VAAC), the University of Hawai'i's MODVOLC thermal alert system, Sentinel-5P/TROPOMI and NASA Aqua/AIRS SO2 data, MIROVA thermal data, Sentinel-2 satellite images, and observations by visiting scientists. A significant eruption in June resulted in evacuations, airport closure, and damage to local crops and infrastructure.
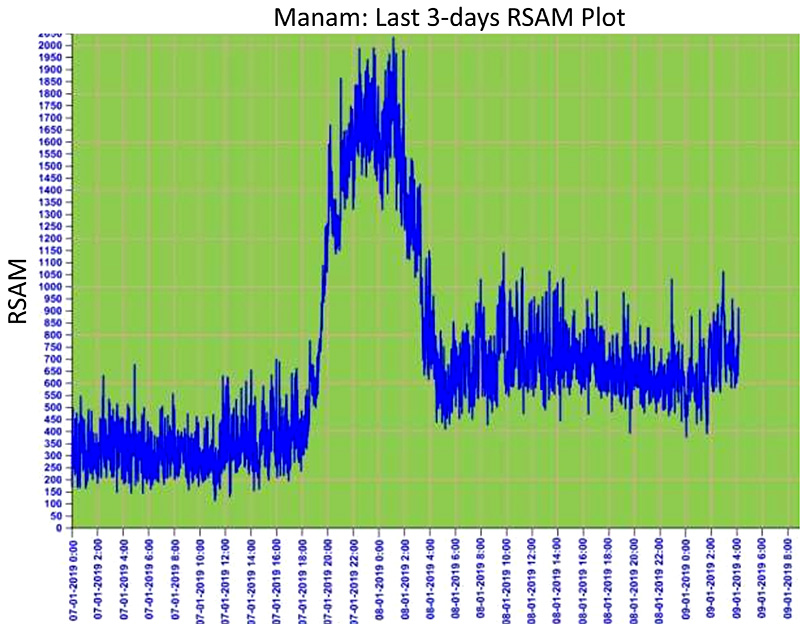
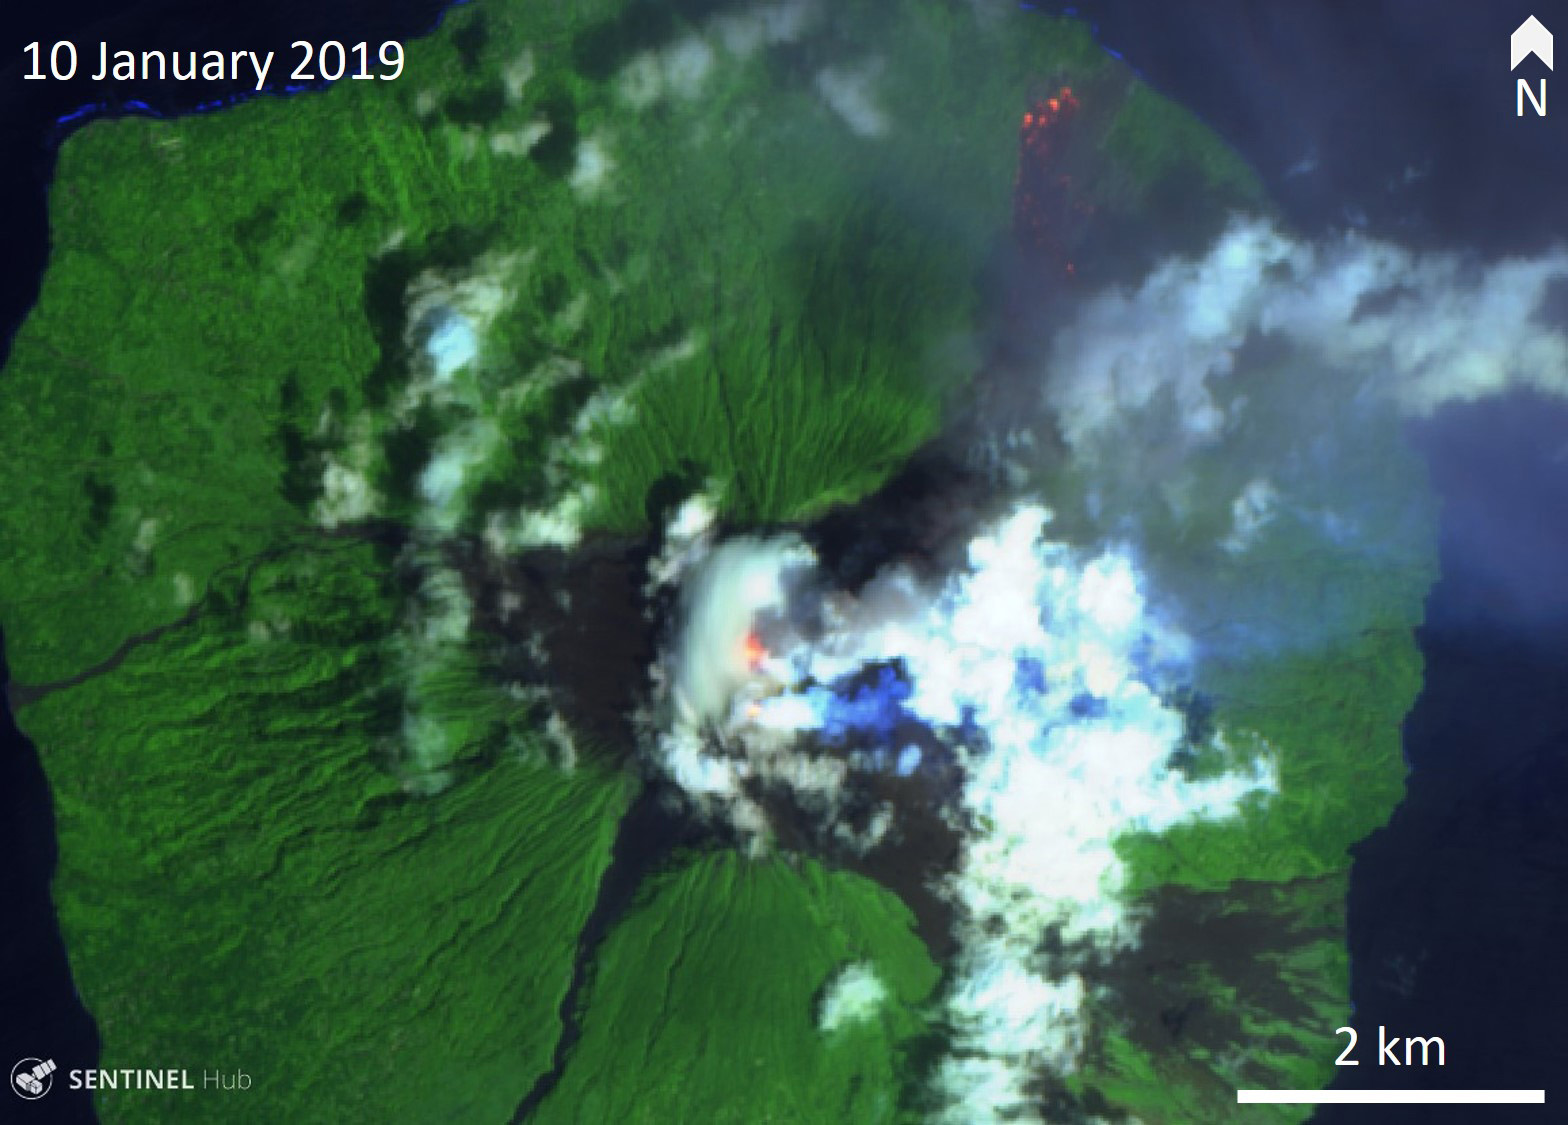
Activity during January-May 2019. Several explosive eruptions occurred during January 2019 according to Darwin VAAC reports, including an ash plume that rose to around 15 km and dispersed to the W on the 7th. RVO reported that an increase in seismic activity triggered the warning system shortly before the eruption commenced (figure 58). Small explosions were observed through to the next day with ongoing activity from the Main Crater and a lava flow in the NE valley observed from around 0400. Intermittent explosions ejected scoria after 0600, depositing ejecta up to 2 cm in diameter in two villages on the SE side of the island. Incandescence at both summit craters and hot deposits at the terminus of the NE valley are visible in Sentinel-2 TIR data acquired on the 10th (figure 59).
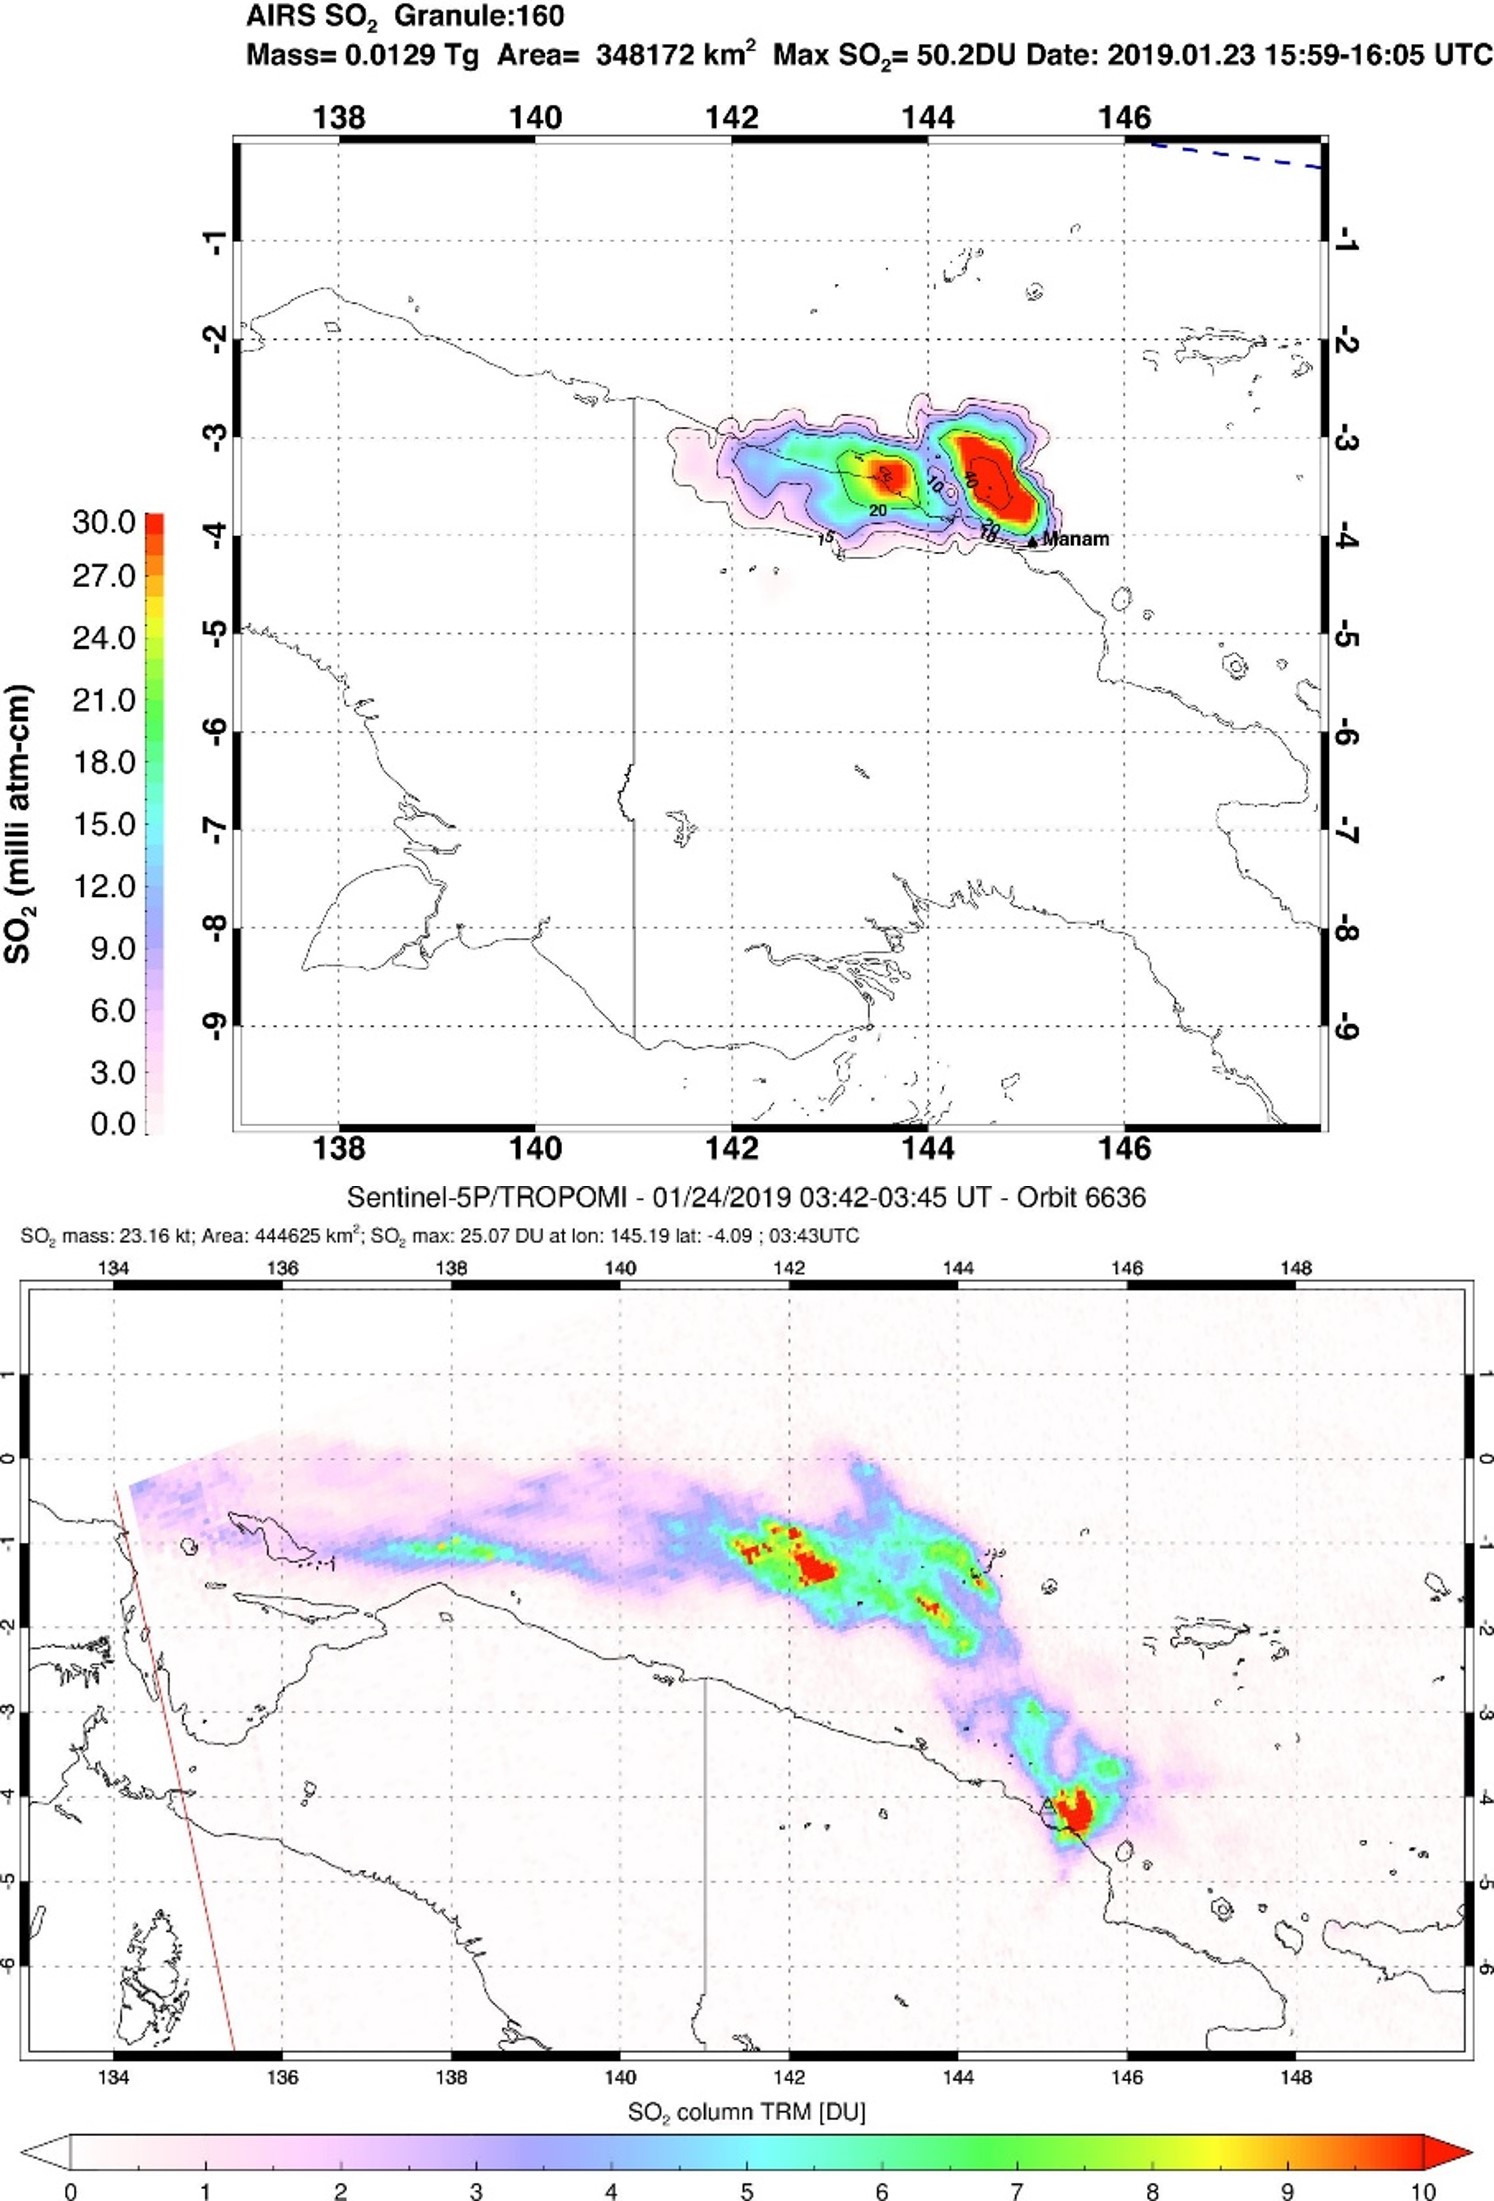
Another explosion generated an ash plume to around 15 km on the 11th that dispersed to the SW. An explosive eruption occurred around 4 pm on the 23rd with the Darwin VAAC reporting an ash plume to around 16.5 km altitude, dispersing to the E. Activity continued into the following day, with satellites detecting SO2 plumes on both 23 and 24 January (figure 60). Activity declined by February with one ash plume reported up to 4.9 km altitude on 15 February.
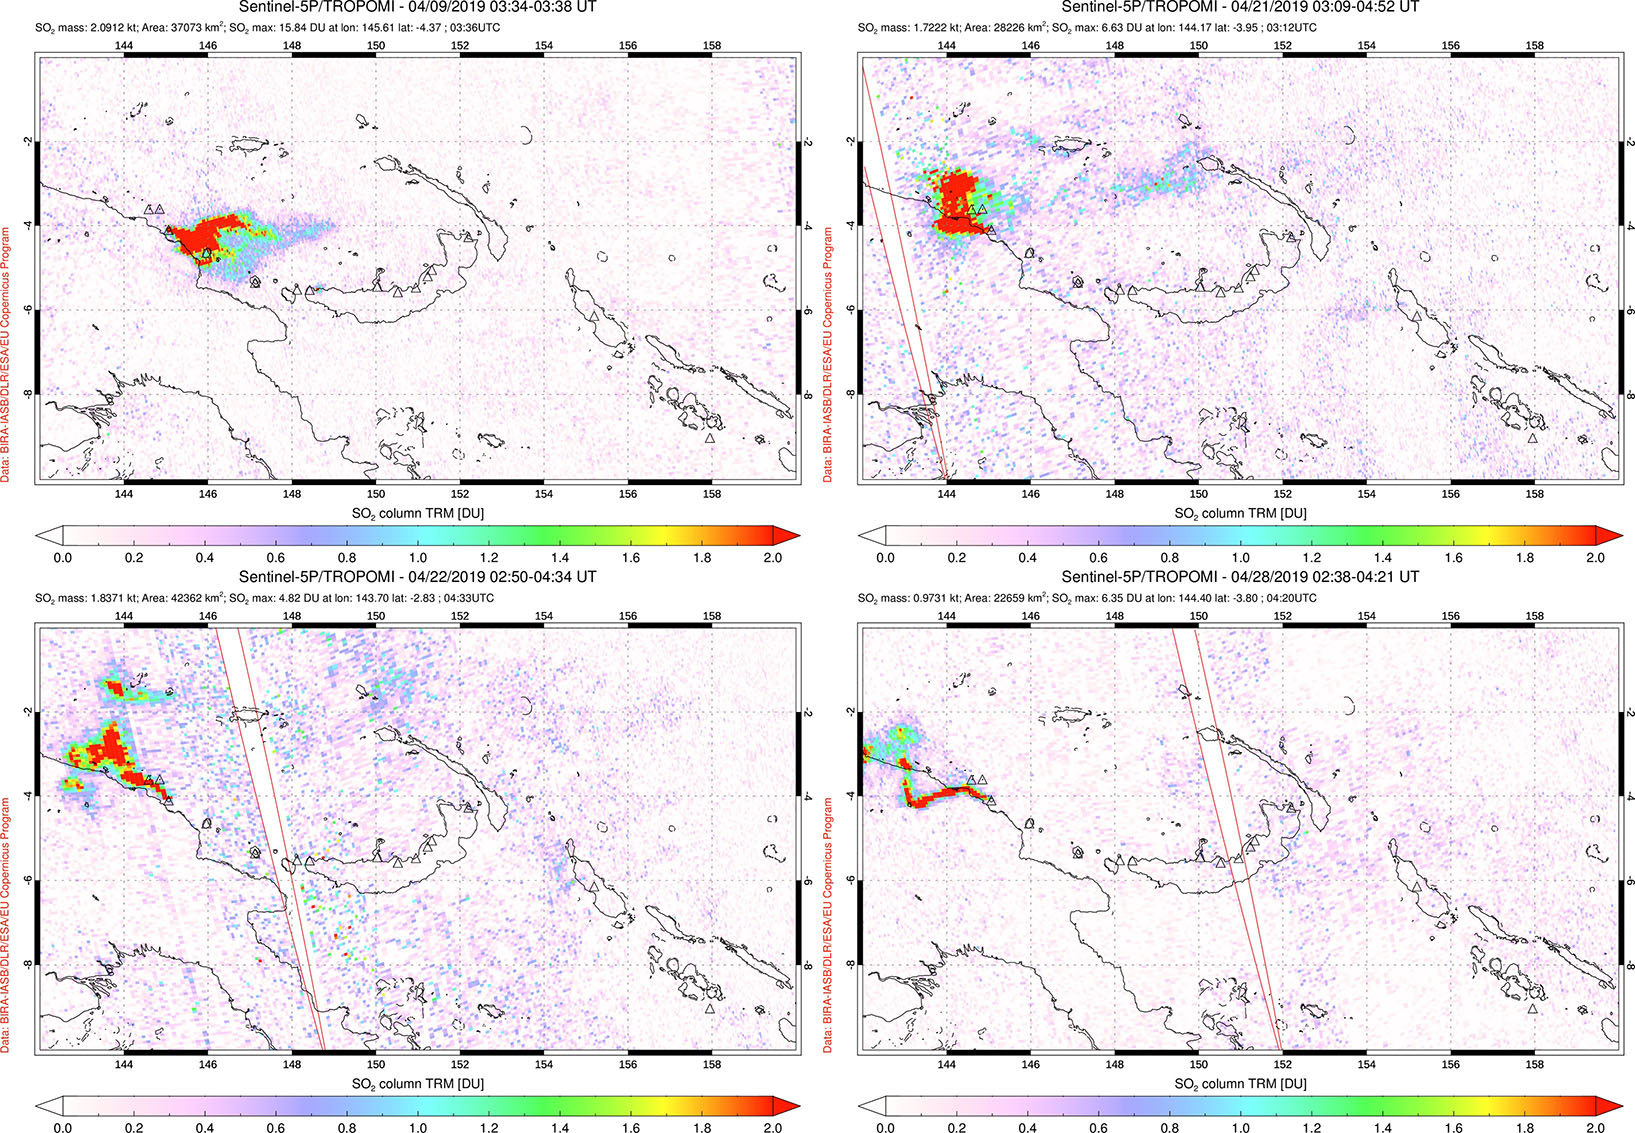
Ash plumes rose up to 3 km between 1 and 5 March, and dispersed to the SE, ESE, and E. During 5-6 March the plumes moved E, and the events were accompanied by elevated seismicity and significant thermal anomalies detected in satellite data. During 19-22 March explosions produced ash plumes up to 4.6 km altitude, which dispersed to the E and SE. Simon Carn of the Michigan Technological University noted a plume in Aqua/AIRS data at around 15 km altitude at 0400 UTC on 23 January with approximately 13 kt measured, similar to other recent eruptions. Additional ash plumes were detected on 29 March, reaching 2.4-3 km and drifting to the E, NE, and N. Multiple SO2 plumes were detected throughout April (figure 61).
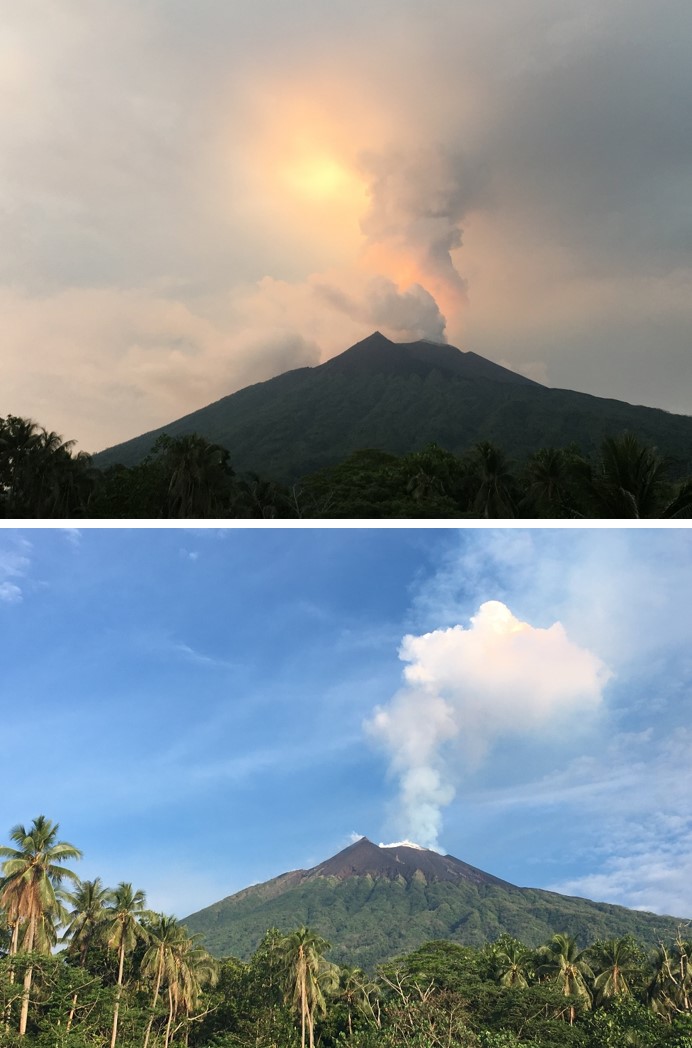
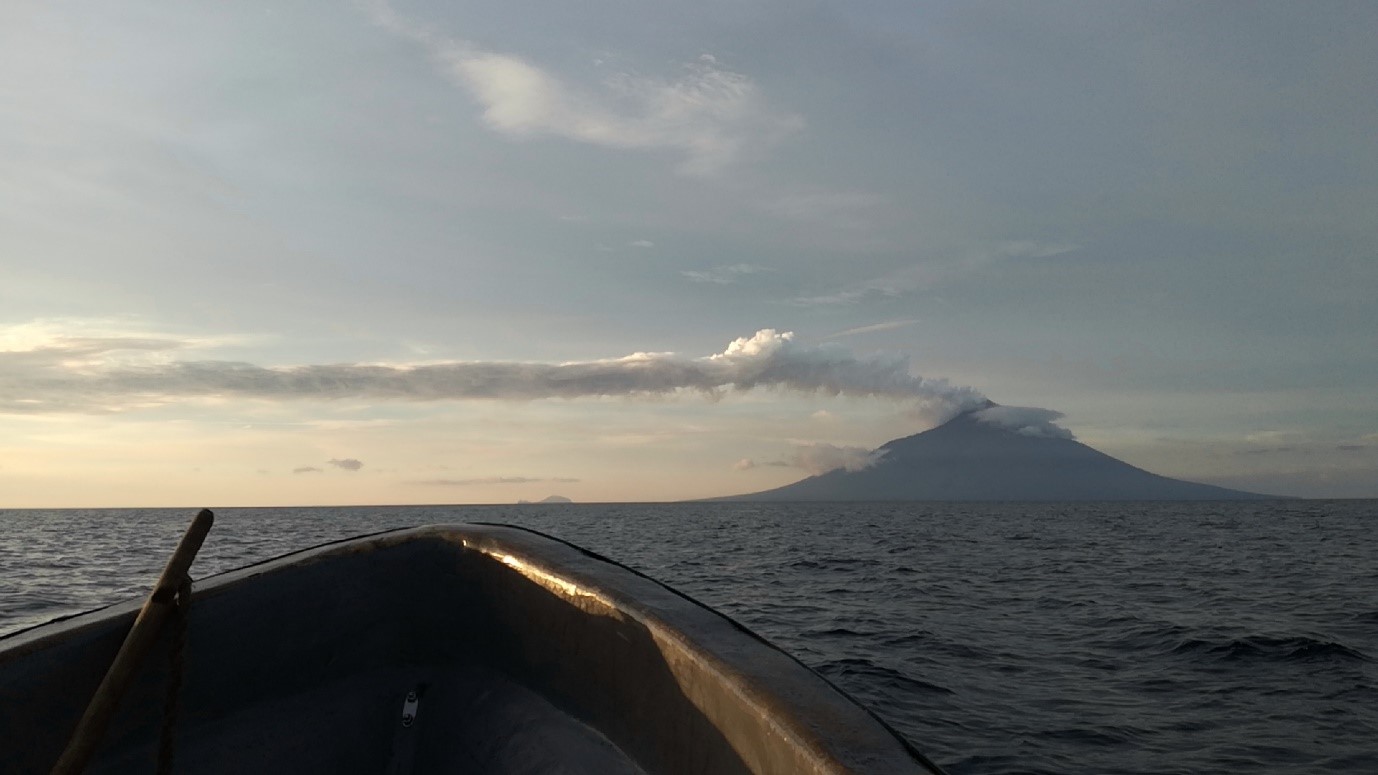
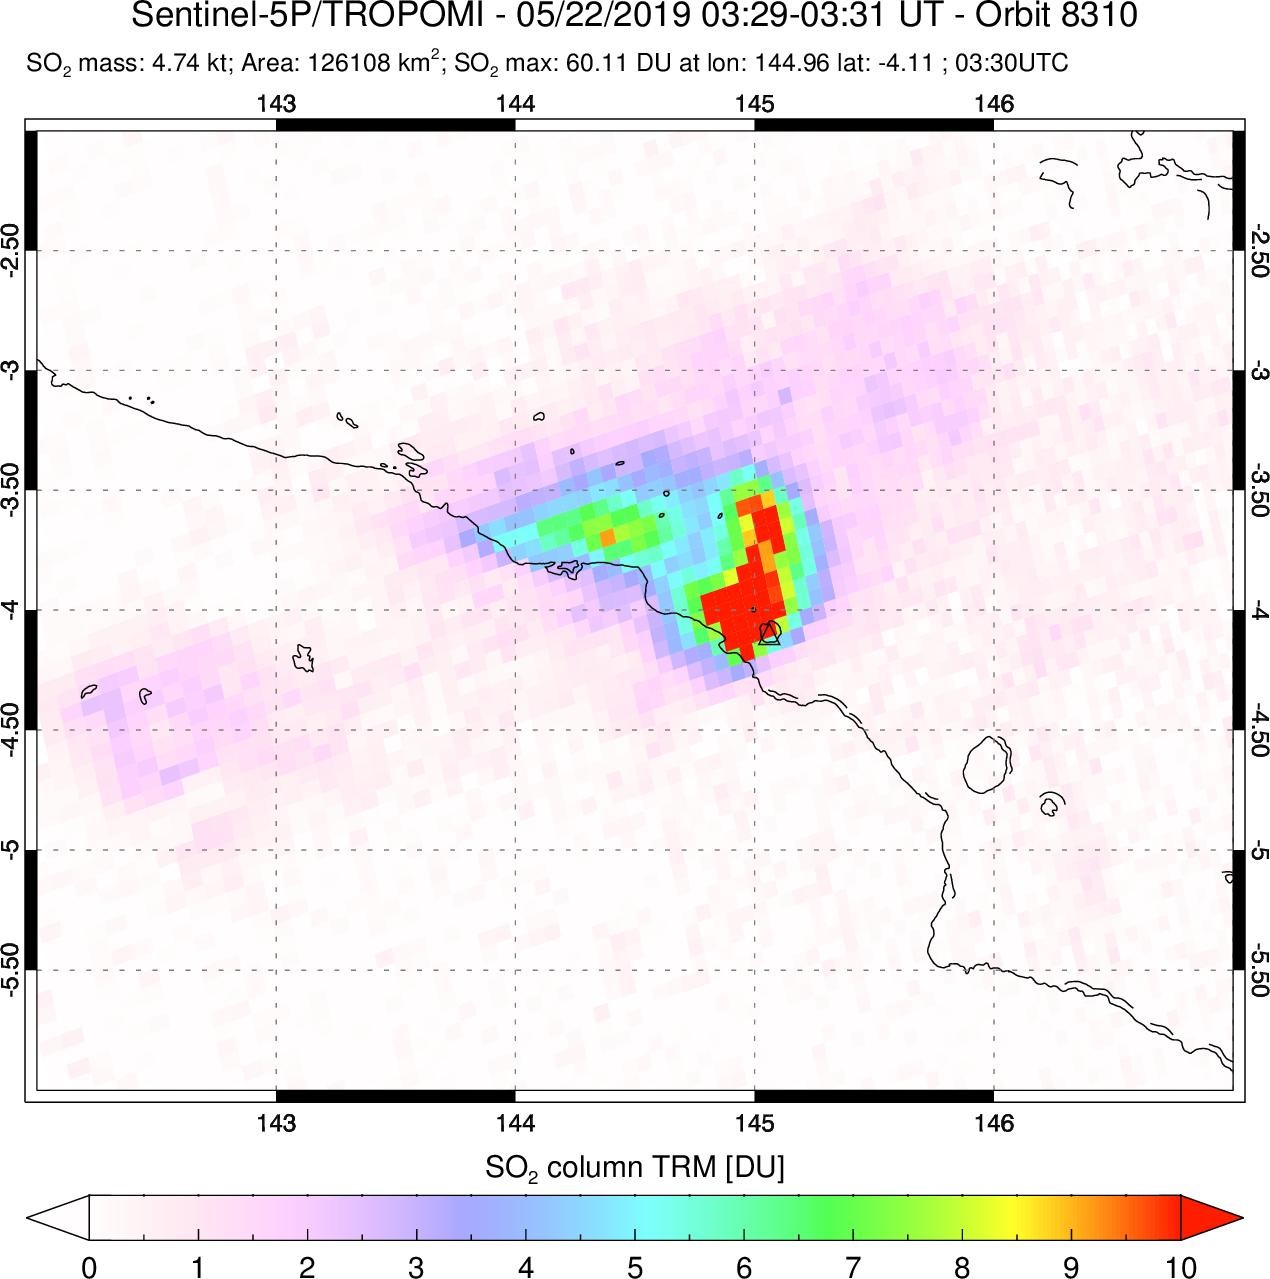
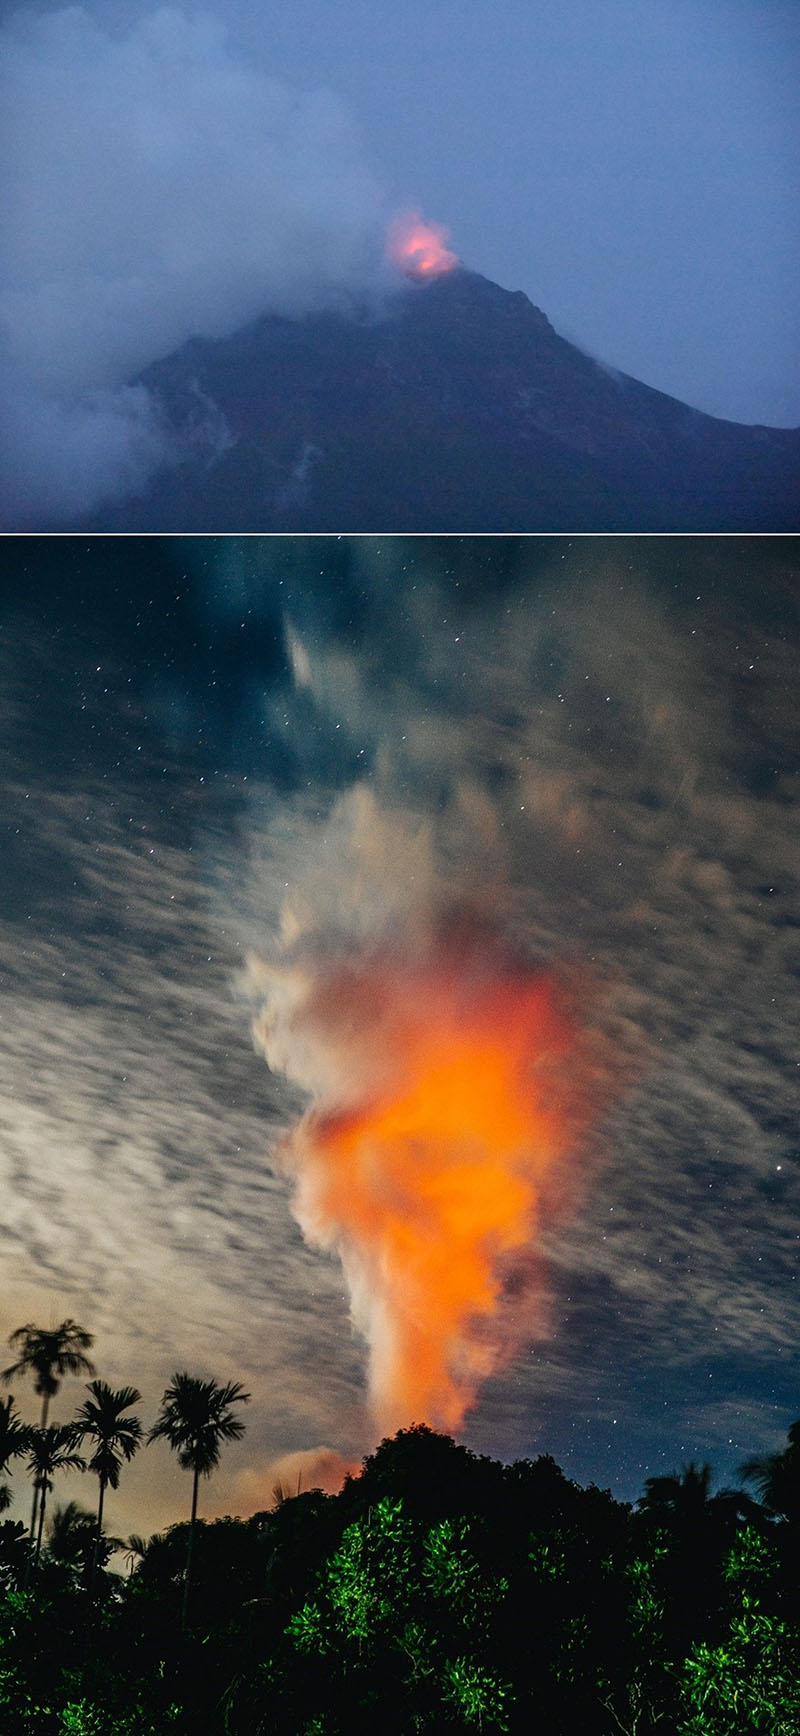
During 19-28 May the Deep Carbon Observatory ABOVE (Aerial-based Observations of Volcanic Emissions) scientific team observed activity at Manam and collected gas data using drone technology. They recorded degassing from the South Crater and Main Crater (figure 63 and 64), which was also detected in Sentinel-5P/TROPOMI data (figure 65). Later in the day the plumes rose vertically up to 3-4 km above sea level and appeared stronger due to condensation. Incandescence was observed each night at the South Crater (figure 66). The Darwin VAAC reported an ash plume on 10 May, reaching 5.5 km altitude and drifting to the NE. Smaller plumes up to 2.4 km were noted on the 11th.
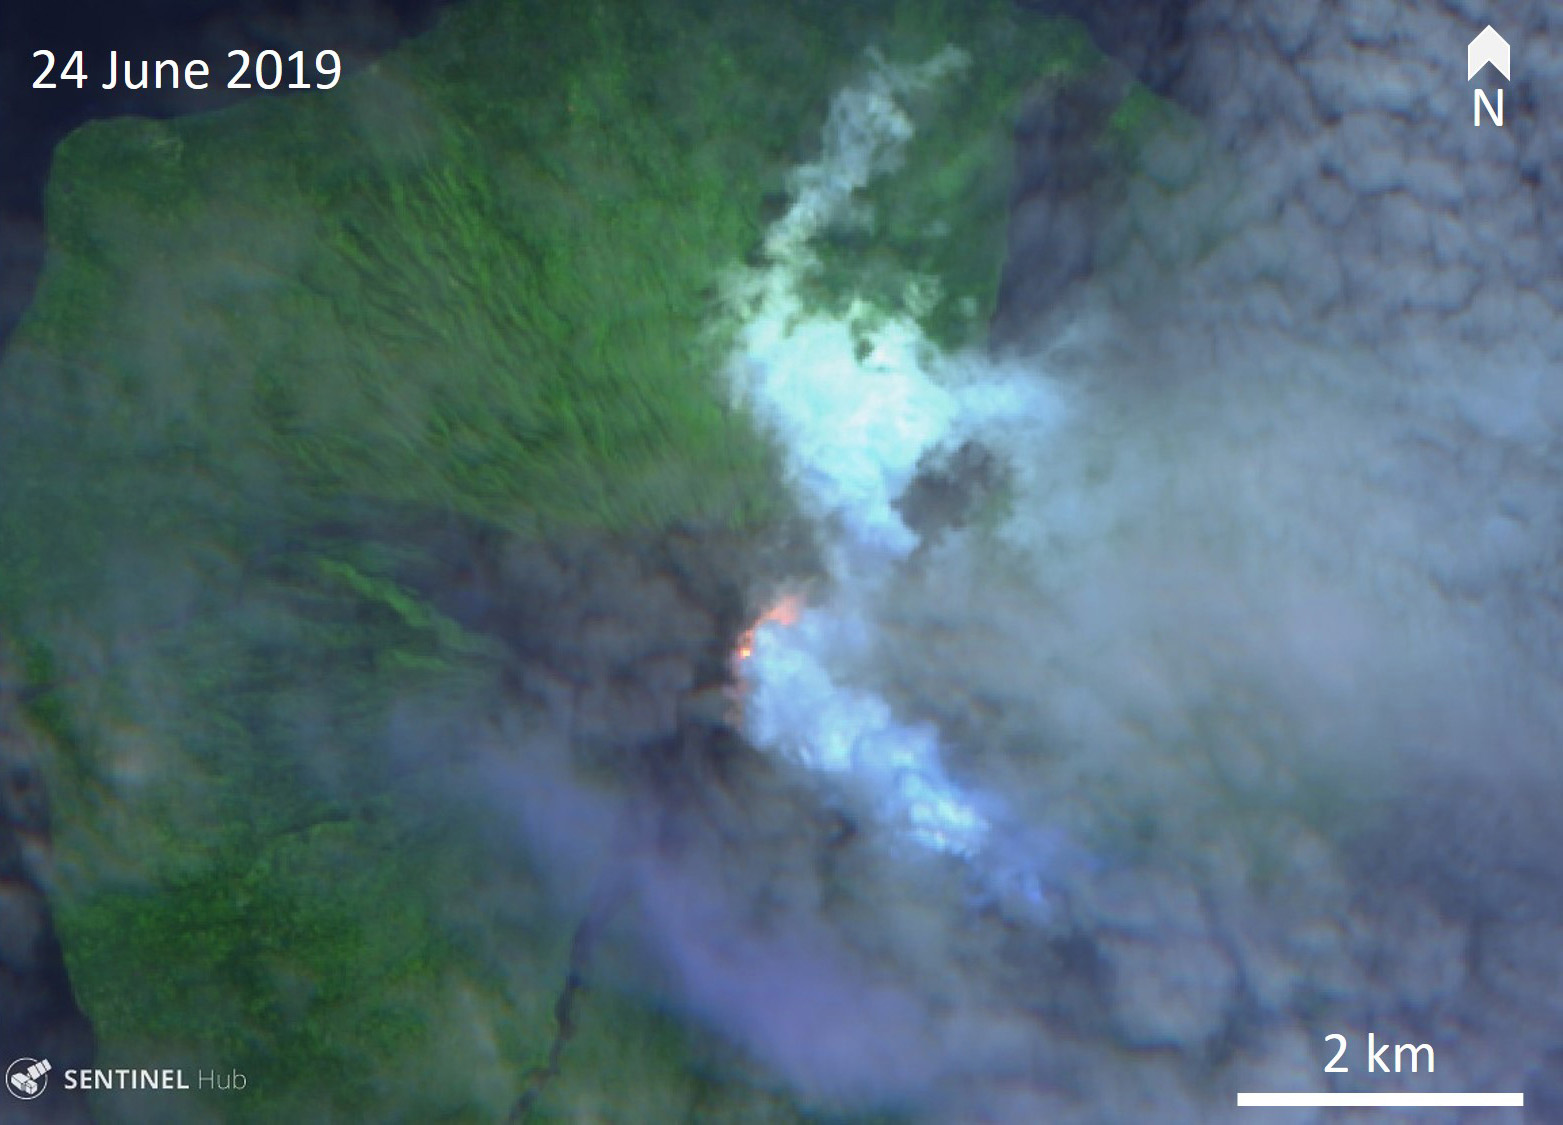
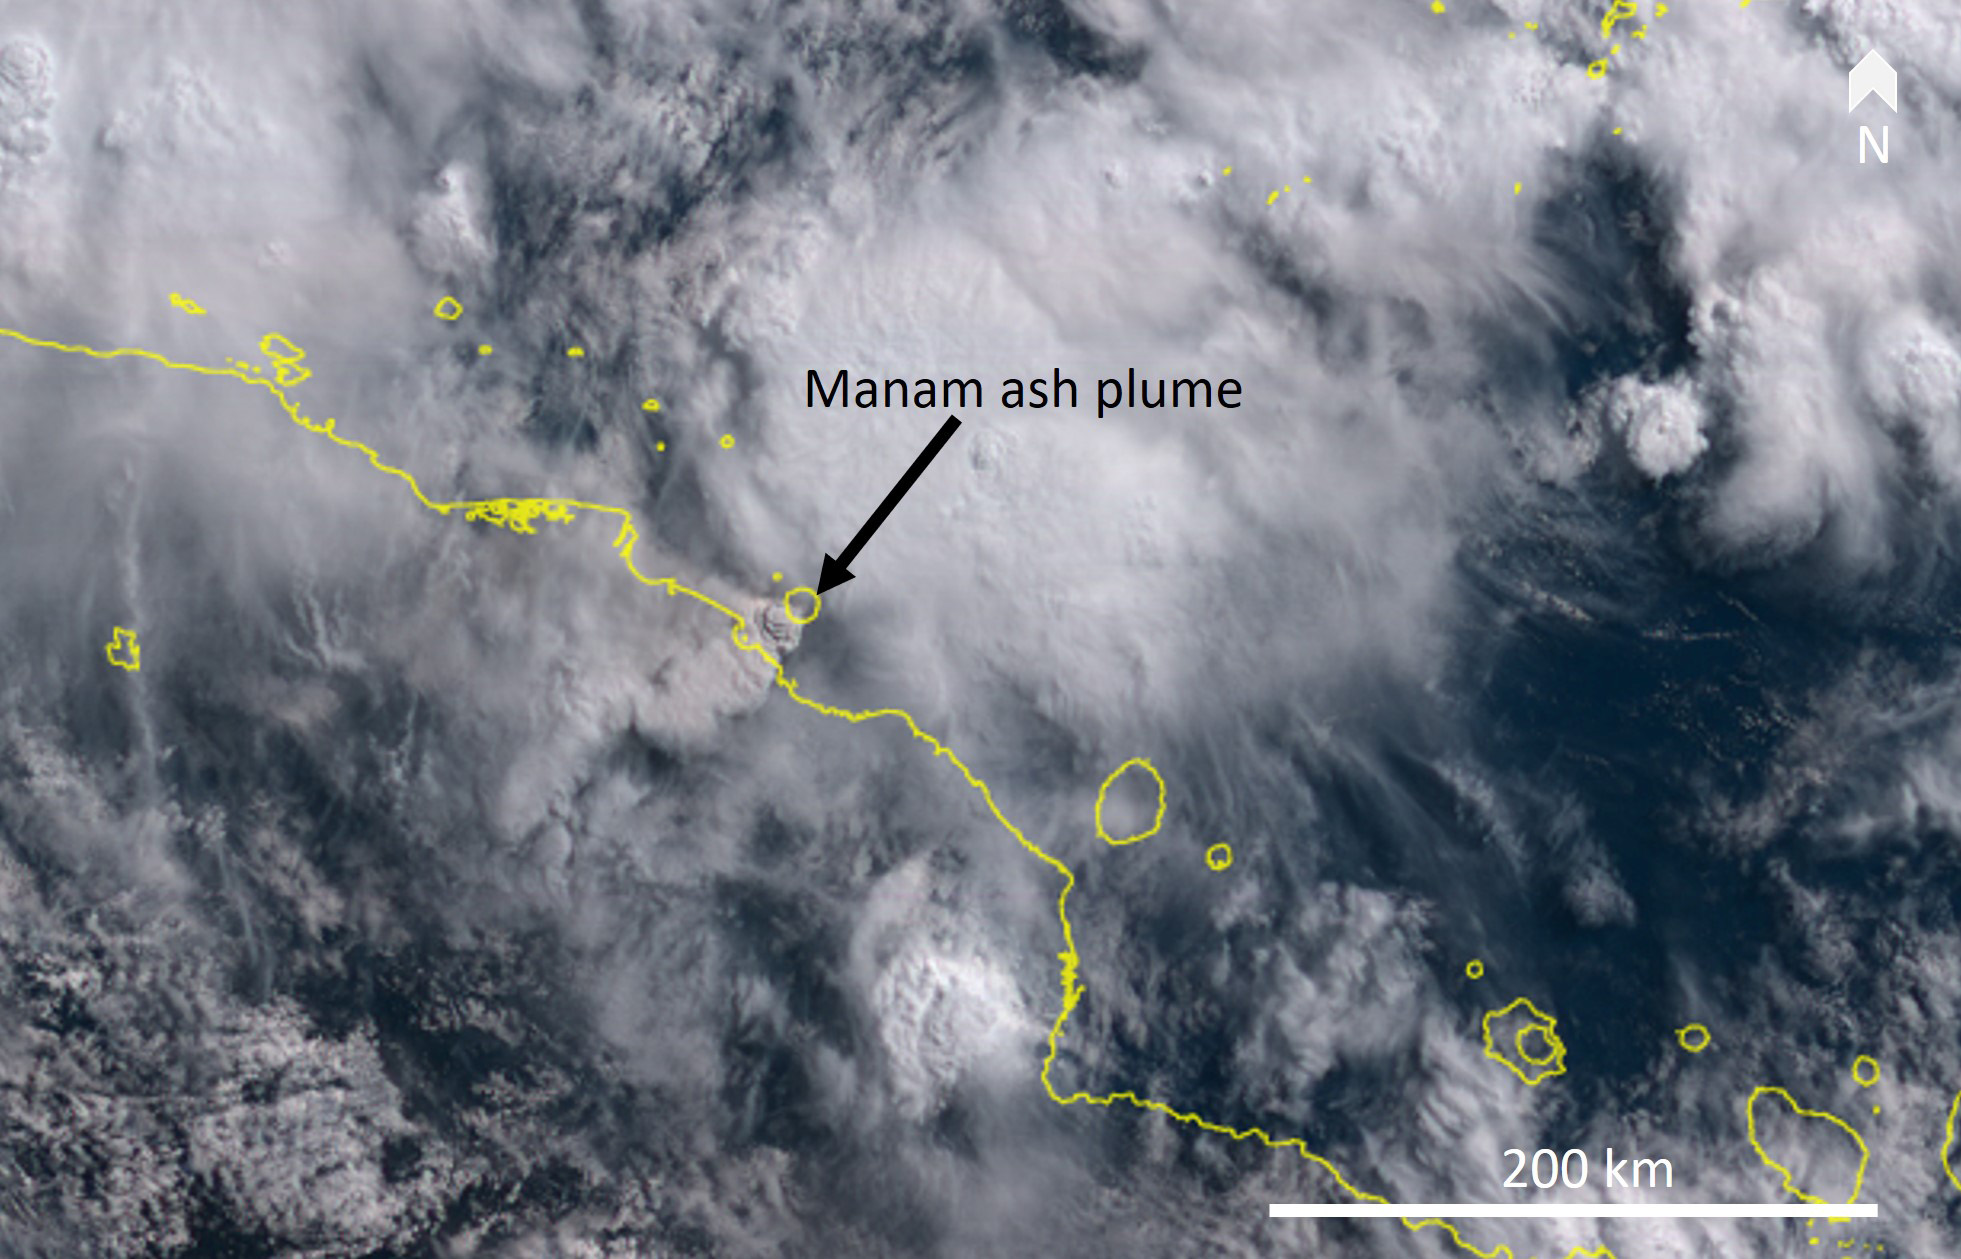
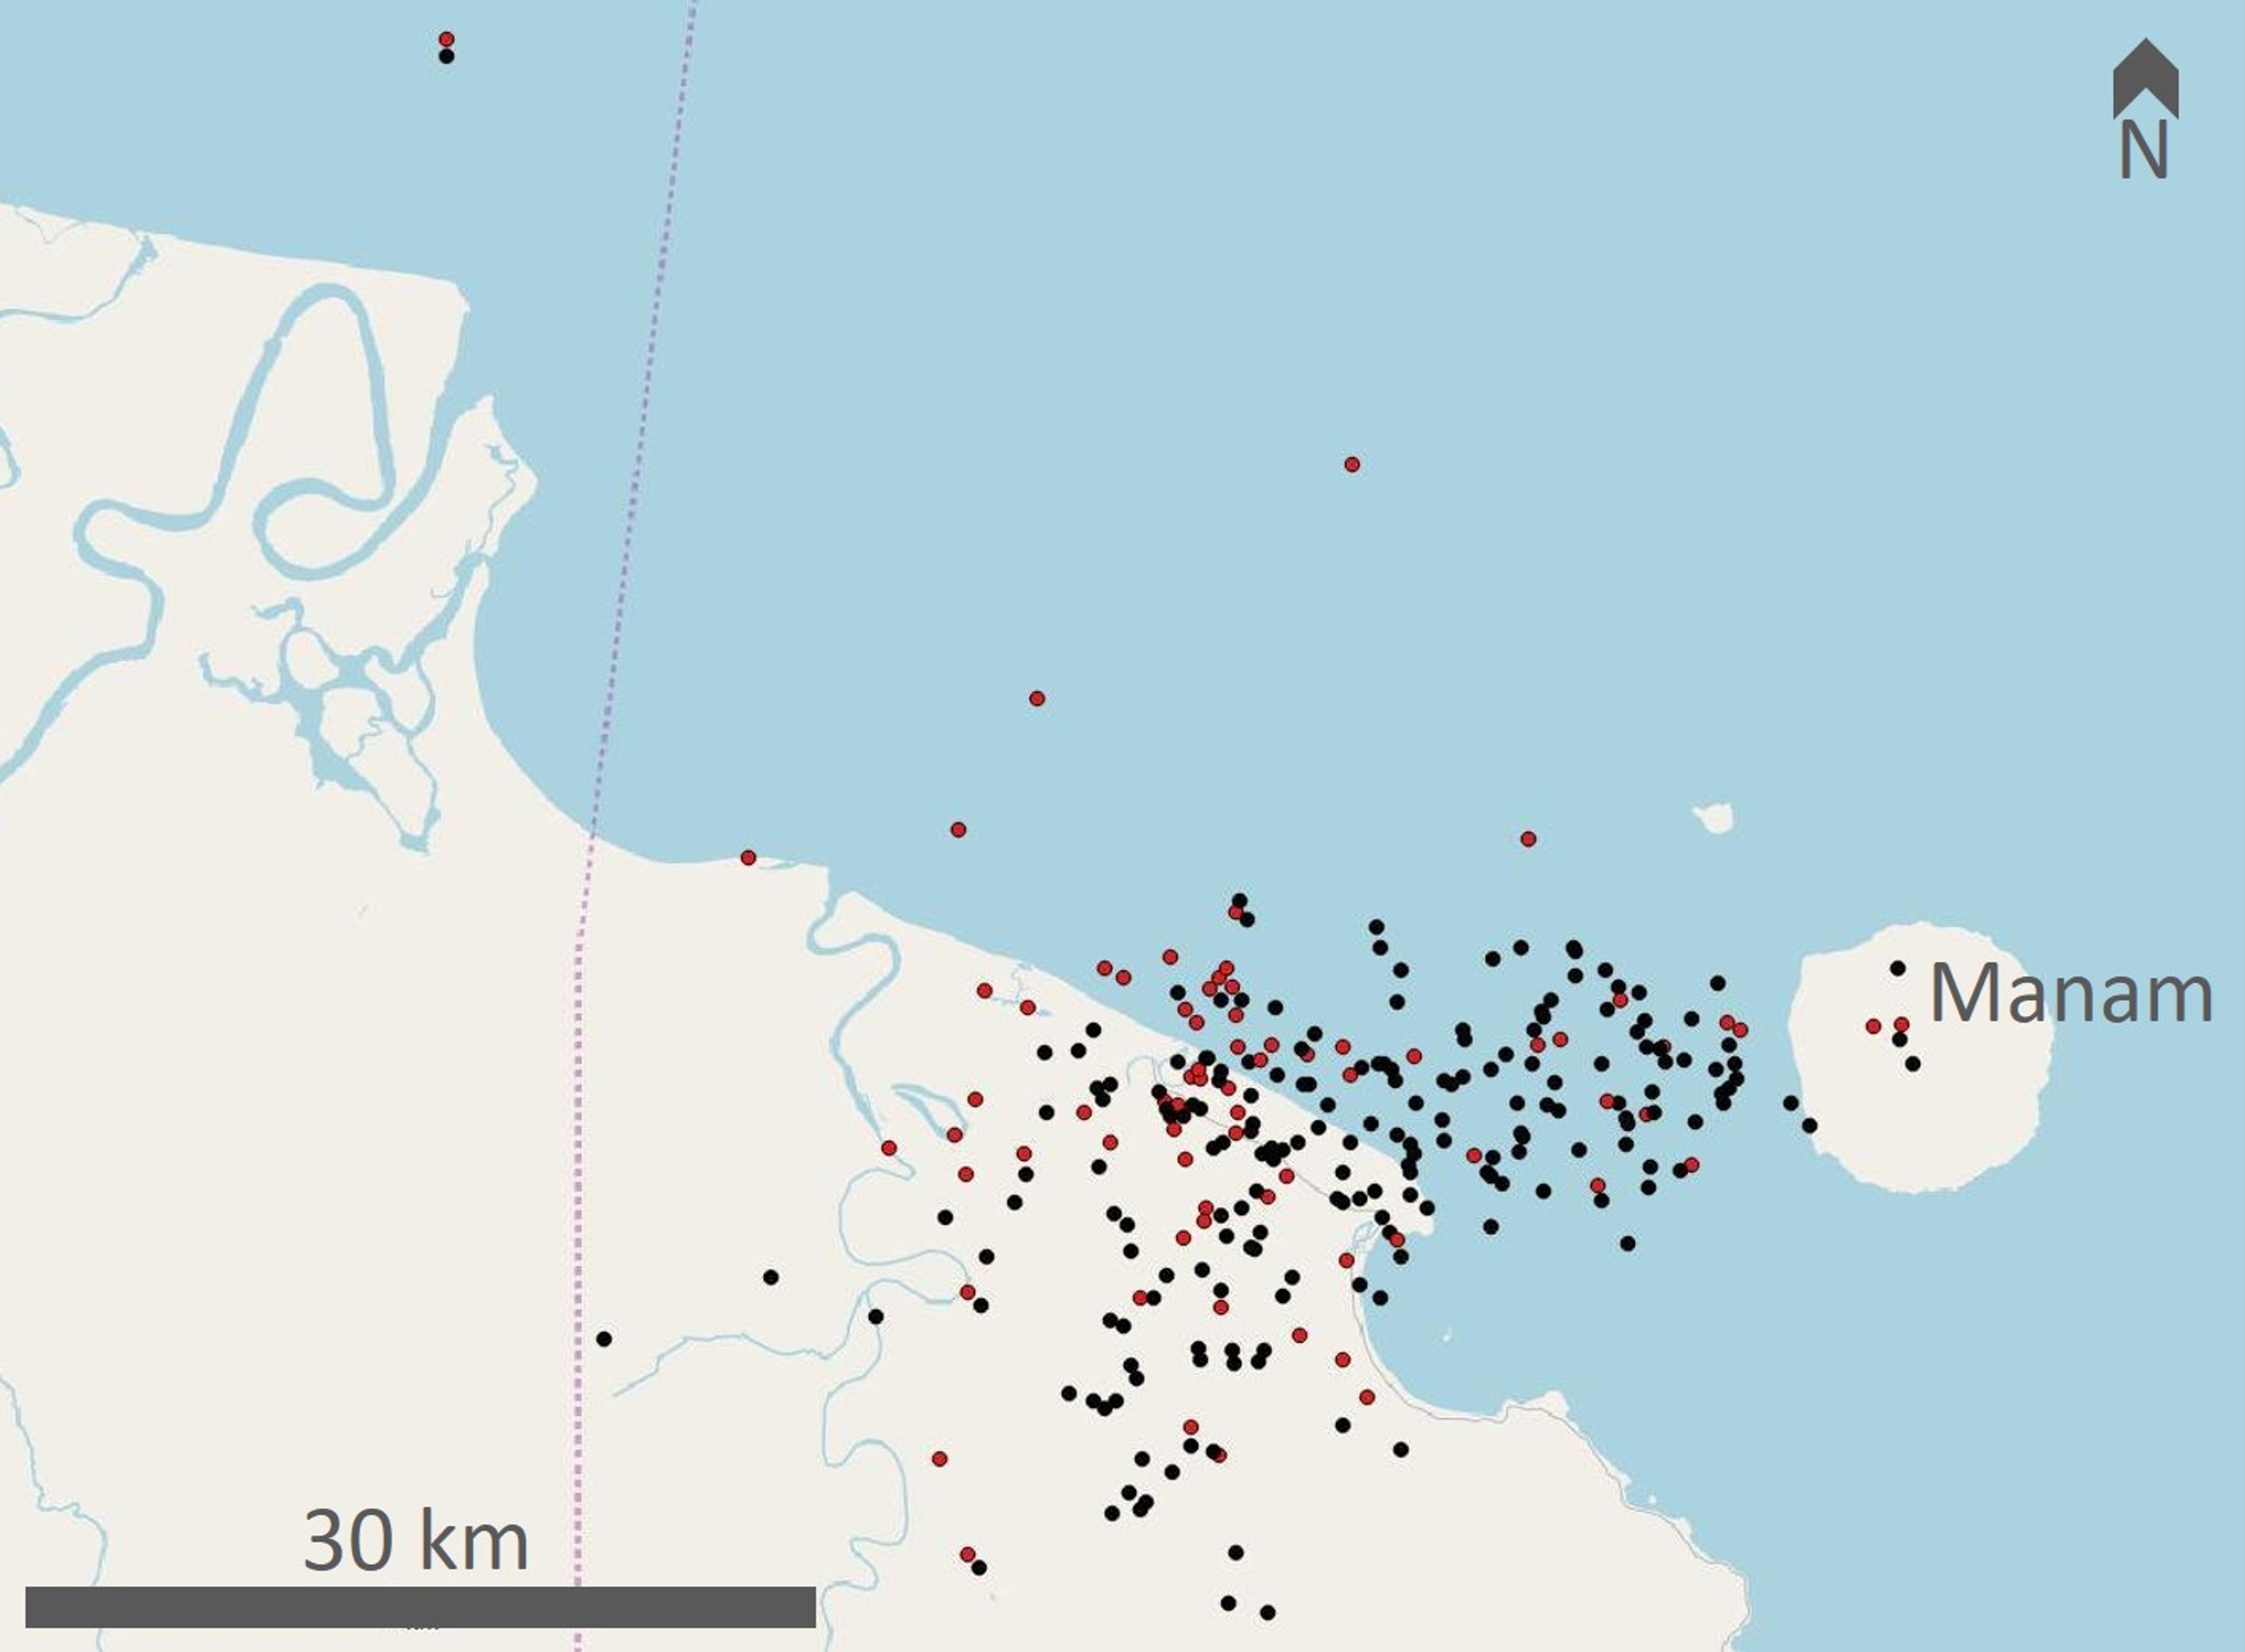
Activity during June 2019. Ash plumes rose to 4.3 km and drifted SW on 7-8 June, and up to 3-3.7 km and towards the E and NE on 18 June. Sentinel-2 thermal satellite data show hot material around the Main Crater on 24 June (figure 66). On 27 June RVO reported that RSAM (Real-time Seismic Amplitude Measurement, a measure of seismic activity through time) increased from 540 to over 1,400 in 30 minutes. "Thundering noise" was noted by locals at around 0100 on the 28th. An ash plume drifting SW was visible in satellite images acquired after 0620, coinciding with reported sightings by nearby residents (figure 67). The Darwin VAAC noted that by 0910 the ash plume had reached 15.2 km altitude and was drifting SW. When seen in satellite imagery at 1700 that day the large ash plume had detached and remained visible extending SW. There were 267 lightning strokes detected within 75 km during the event (figure 68) and pyroclastic flows were generated down the NE and W flanks. At 0745 on 29 June an ash plume reached up to 4.8 km.
Villages including Dugulava, Yassa, Budua, Madauri, Waia, Dangale, and Bokure were impacted by ashfall and approximately 3,775 people had evacuated to care centers. Homes and crops were reportedly damaged due to falling ash and scoria. Flights through Madang airport were also disrupted due to the ash until they resumed on the 30th. The Office of the Resident Coordinator in Papua New Guinea reported that as many as 455 homes and gardens were destroyed. Humanitarian resources were strained due to another significant eruption at nearby Ulawun that began on 26 June.
Activity during July-September 2019. Activity was reduced through July and September. The Darwin VAAC reported an ash plume to approximately 6 km altitude on 6 July that drifted W and NW, another plume that day to 3.7 km that drifted N, and a plume on the 21st that rose to 4.3 km and drifted SW and W. Diffuse plumes rose to 2.4-2.7 km and drifted towards the W on 29 September. Thermal anomalies in the South Crater persisted through September.
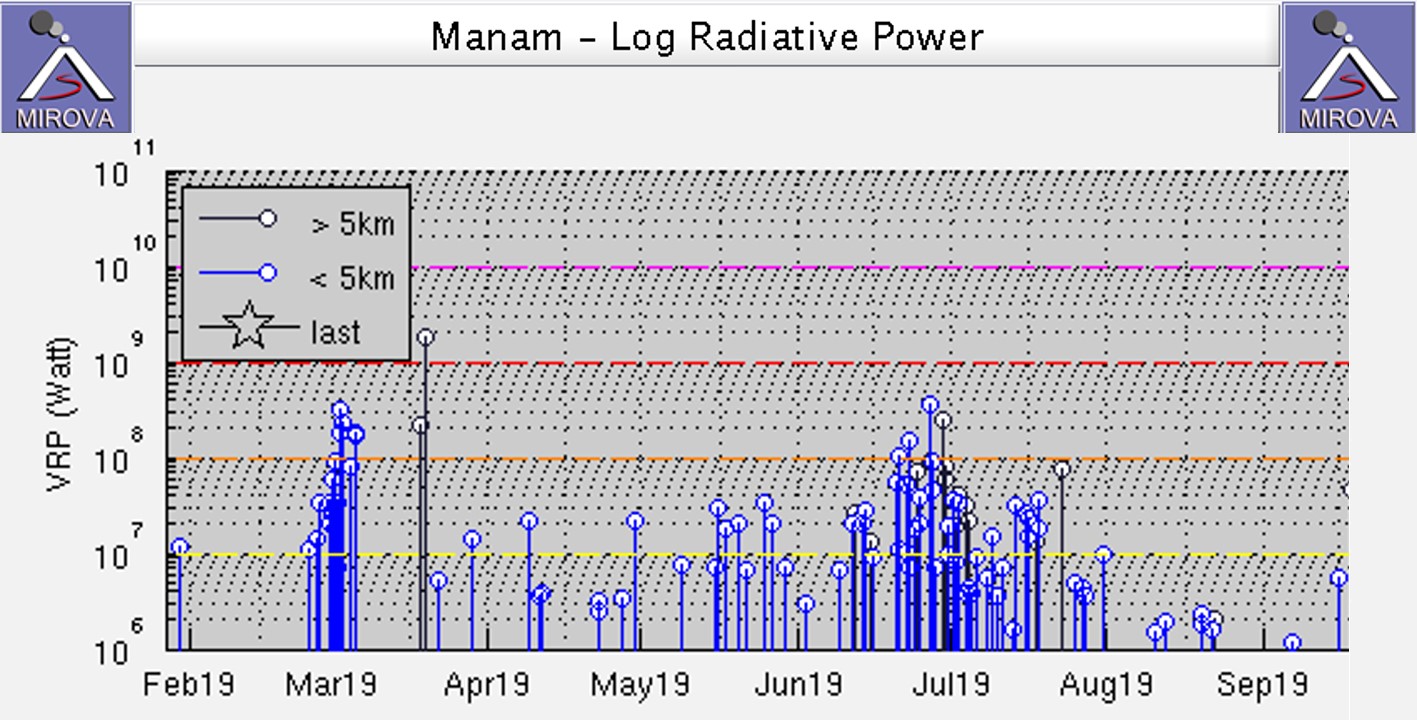
Fresh deposits from recent events are visible in satellite deposits, notably in the NE after the January activity (figure 69). Satellite TIR data reflected elevated activity with increased energy detected in March and June-July in MODVOLC and MIROVA data (figure 70).
Geological Summary. The 10-km-wide island of Manam, lying 13 km off the northern coast of mainland Papua New Guinea, is one of the country's most active volcanoes. Four large radial valleys extend from the unvegetated summit of the conical basaltic-andesitic stratovolcano to its lower flanks. These valleys channel lava flows and pyroclastic avalanches that have sometimes reached the coast. Five small satellitic centers are located near the island's shoreline on the northern, southern, and western sides. Two summit craters are present; both are active, although most observed eruptions have originated from the southern crater, concentrating eruptive products during much of the past century into the SE valley. Frequent eruptions, typically of mild-to-moderate scale, have been recorded since 1616. Occasional larger eruptions have produced pyroclastic flows and lava flows that reached flat-lying coastal areas and entered the sea, sometimes impacting populated areas.
Information Contacts: Rabaul Volcano Observatory (RVO), Geohazards Management Division, Department of Mineral Policy and Geohazards Management (DMPGM), PO Box 3386, Kokopo, East New Britain Province, Papua New Guinea; Global Sulfur Dioxide Monitoring Page, Atmospheric Chemistry and Dynamics Laboratory, NASA Goddard Space Flight Center (NASA/GSFC), 8800 Greenbelt Road, Goddard, Maryland, USA (URL: https://SO2.gsfc.nasa.gov/); Sentinel Hub Playground (URL: https://www.sentinel-hub.com/explore/sentinel-playground); MIROVA (Middle InfraRed Observation of Volcanic Activity), a collaborative project between the Universities of Turin and Florence (Italy) supported by the Centre for Volcanic Risk of the Italian Civil Protection Department (URL: http://www.mirovaweb.it/); Hawai'i Institute of Geophysics and Planetology (HIGP) - MODVOLC Thermal Alerts System, School of Ocean and Earth Science and Technology (SOEST), Univ. of Hawai'i, 2525 Correa Road, Honolulu, HI 96822, USA (URL: http://modis.higp.hawaii.edu/); Office of the Resident Coordinator, United Nations, Port Moresby, National Capital District, Papua New Guinea (URL: https://papuanewguinea.un.org/en/about/about-the-resident-coordinator-office, https://reliefweb.int/report/papua-new-guinea/papua-new-guinea-volcanic-activity-office-resident-coordinator-flash-2); Himawari-8 Real-time Web, developed by the NICT Science Cloud project in NICT (National Institute of Information and Communications Technology), Japan, in collaboration with JMA (Japan Meteorological Agency) and CEReS (Center of Environmental Remote Sensing, Chiba University) (URL: https://himawari8.nict.go.jp/); Simon Carn, Geological and Mining Engineering and Sciences, Michigan Technological University, 1400 Townsend Drive, Houghton, MI 49931, USA (URL: http://www.volcarno.com/, Twitter: @simoncarn); Chris Vagasky, Vaisala Inc., Louisville, Colorado, USA (URL: https://www.vaisala.com/en?type=1, Twitter: @COweatherman, URL: https://twitter.com/COweatherman); Emma Liu, University College London Earth Sciences, London WC1E 6BS (URL: https://www.ucl.ac.uk/earth-sciences/people/academic/dr-emma-liu); Matthew Wordell, Boise, ID, USA (URL: https://www.matthhew.com/biocontact); Julian Rüdiger, Johannes Gutenberg University Mainz, Saarstr. 21, 55122 Mainz, Germany (URL: https://www.uni-mainz.de/); Planet Labs, Inc. (URL: https://www.planet.com/);.