A large sulfur dioxide plume and several thermal anomalies from Manda Hararo that were detected in satellite imagery during 28-30 June prompted a science team to visit the area on 4 July. After conducting ground-based and aerial observations for approximately 2 hours, they reported that the eruption occurred near the August 2007 eruption site, and was possibly bigger than that event. No active lava effusion was seen, but steaming was observed from the 4-5 km-long fissure that, because of high temperatures, had to be observed from a distance. They also saw new predominantly 'a'a lava flows that were 2-3 m thick. The fissure was lined with scoria ramparts 30-50 m high. Temperature measurements taken with a FLIR (Forward Looking Infrared Radiometer) indicated that the lava flow had cooled significantly with temperatures between 30 and 120 degrees Celsius at the surface. A maximum temperature of 238 degrees Celsius was measured during aerial observations.
Sources: Simon Carn, Gezahegn Yirgu, Department of Earth Sciences, Addis Ababa University
Fissure eruption generates lava flows and large SO2 plume
A large SO2 cloud in southern Afar, Ethiopia was detected by the OMI instrument aboard NASA's EOS-AURA satellite on 29 June 2009 (figure 4). The cloud appeared to originate from the Karbahi region of the Manda Hararo rift segment, a graben area with numerous active faults, fissures, and basalt flows. The cloud was similar in size to that observed during a basaltic fissure eruption in August 2007 (BGVN 32:07). As reported by Simon Carn, the 29 June 2009 cloud had a total mass of 3.864 kt, an area of 186,710 km2, and an SO2 max of 4.75 DU (Dobson Units). Other clouds were also seen, including a large one on 30 June.
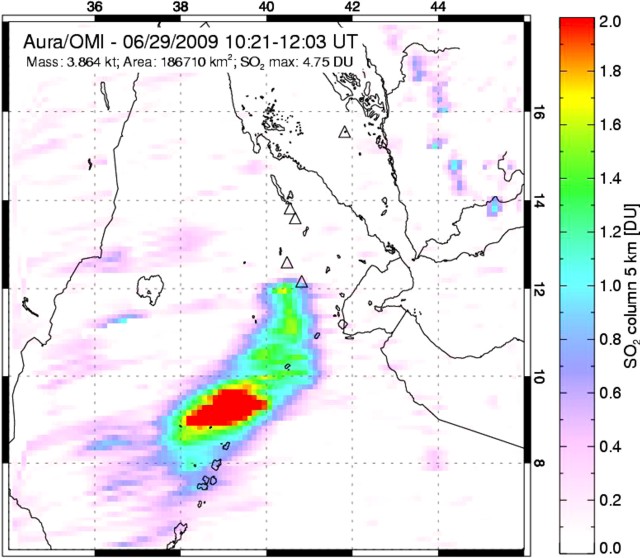 |
Figure 4. The eruptive SO2 cloud from Manda hararo over southern Afar region detected by the OMI instrument. Image acquired during 1021-1203 UTC on 29 June 2009. Courtesy of Simon Carn, Michigan Technological University. |
MODIS satellite imagery from 2320 UTC on 28-29 June confirmed that the SO2 cloud was associated with thermal anomalies appearing in the immediate vicinity of the August 2007 eruption. According to Charles Holliday, METEOSAT real time Active Fire Monitoring data derived from METEOSAT imagery suggests the eruption began within 15 minutes of 1715 UTC on 28 June 2009, about 7 hours after a magnitude 4.4 earthquake, identified by the Addis Ababa Geophysical Observatory and the European-Mediterranean Seismological Centre.
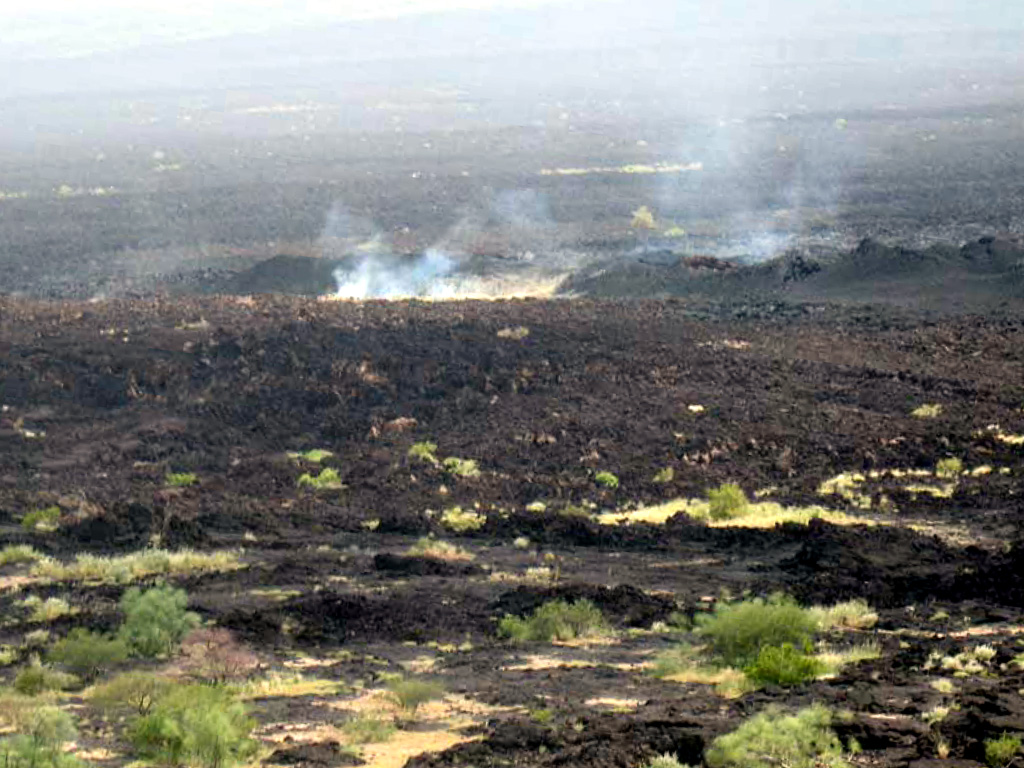
A field team of scientists, including Gezahegn Yirgu, Tesfaye Kidane, Elias Lewi, Tesfaye Chernet, Girma Wolde Tinsae, David Ferguson, Talfan Barnie, and Osman Mohammed, reached the site of the thermal anomalies by helicopter on 4 July 2009 and spent about two hours on the scene. They found the eruption had emitted predominantly a'a basalt flows, approximately 2-3 m thick that originated from fissures approximately 4-5 km long. The vent areas contained scoria ramparts approximately 30-50 m high. The field team collected rock and gas samples and surveyed the erupted material using visible and FLIR (Forward-Looking Infrared) cameras from both the air and the ground. Hand samples suggested the erupted lava was feldspar-bearing porphyritic basalt. No lava effusion was observed, although some steam was seen at the fissure (figure 5).
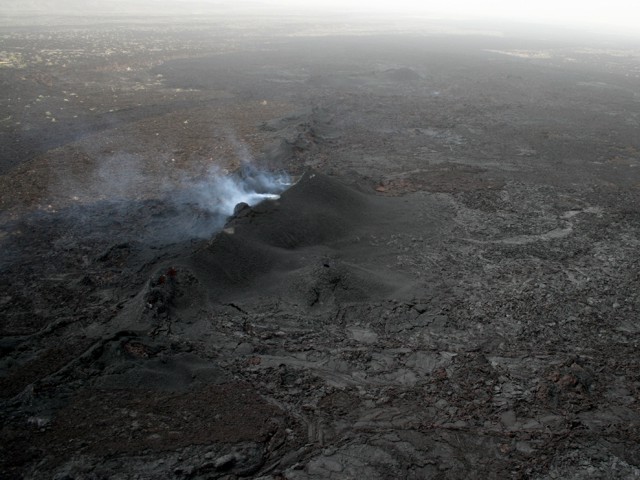 |
Figure 5. Oblique aerial photograph of Manda Hararo showing the eruptive fissure, scoria ramparts, and gas plume on 4 July 2009. Courtesy of Talfan Barnie, University of Cambridge. |
The fissure itself was inaccessible over land because it was surrounded by hot rock and could only be observed from a distance. Only a small part of the margins of the flow were visited on the ground due to limited time, rough terrain, and high temperature and humidity. The lava flows appeared to have cooled significantly, with the FLIR recording typical temperatures of between 30 and 120°C for the flow surfaces, and a maximum temperature of 238°C observed from the air (figure 6). The team made gas measurements at hot cracks in the flow front where they smelled volcanic gases and the FLIR registered temperatures over 100°C. According to David Ferguson, the group used FLIR thermal images to determine a safe route for walking. While the front of the lava flow had a dark black crust, similar to that of much colder flows, the FLIR camera on land recorded temperatures of up to 162°C around the cracks and fissures of the flow surface.
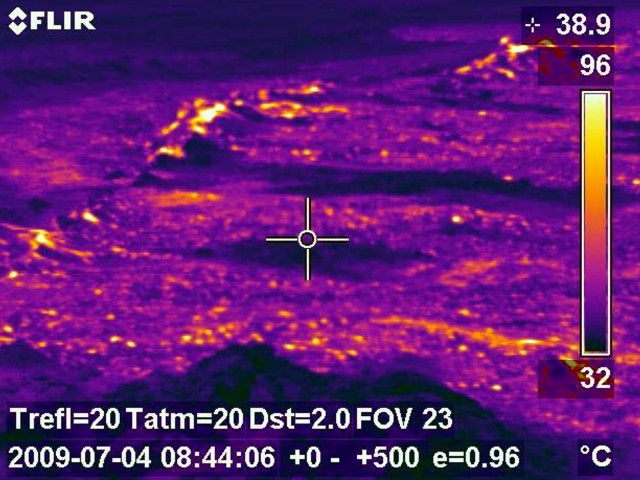 |
Figure 6. FLIR image of the 4 July 2009 eruption at Manda Hararo showing temperature distribution in and around the fissure. Courtesy of Talfan Barnie, University of Cambridge. |
A 6 July ASTER (Advanced Spaceborne Thermal Emission and Reflection Radiometer) image from the eruption site shows a warm 6.3 x 1.4 km flow erupted from a NW-SE trending fissure (figure 7). The area of the flow field is 4.0 km2. The coordinates of the center of the flow field are 40.655, 12.256. A 9 July EO-1 ALI panchromatic image shows the flow at a higher resolution (figure 8).
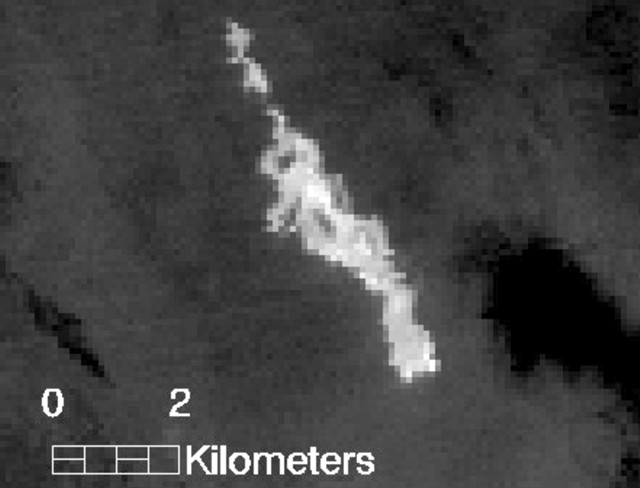 |
Figure 7. ASTER infrared image at Manda Hararo taken on 6 July 2009. The image shows a warm flow, 6.3 x 1.4 km, erupted from what looks like a NW-SE trending fissure. A clear pre-eruptive image from May 2009 shows nothing anomalous at this spot, indicating that the lava flow is new. The coordinates of the center of the flow field are 12.256°N, 40.655°E. Courtesy of Matt Patrick. |
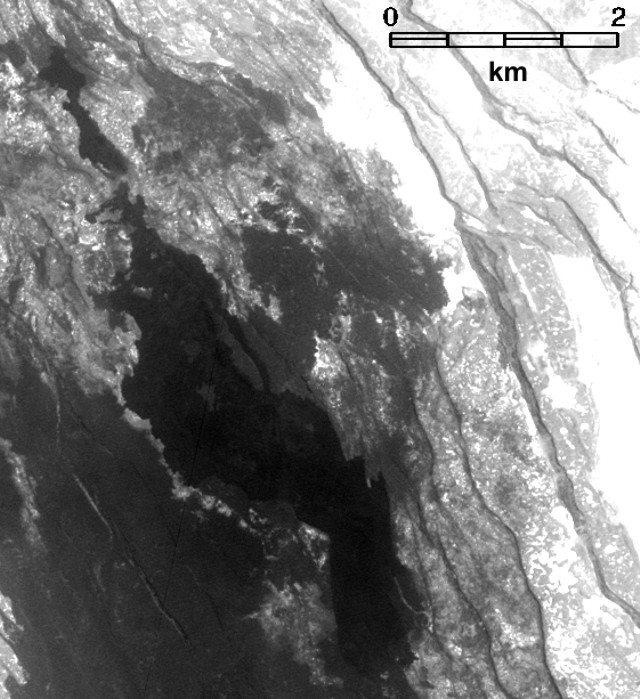 |
Figure 8. An EO-1 ALI panchromatic image (10-m pixel size) showing the flow at Manda Hararo on 9 July 2009. Courtesy of Matt Patrick. |
Information Contacts: Gezahegn Yirgu, Dept of Earth Sciences, Addis Ababa University, P.O. Box 729/1033, Addis Ababa, Ethiopia; Simon Carn, Dept of Geological and Mining Engineering and Sciences, Michigan Technological Univ, 1400 Townsend Dr., Houghton, MI 49931, USA (URL: https://so2.gsfc.nasa.gov/); Afar Rift Consortium (URL: http://www.see.leeds.ac.uk/afar/); Charles Holliday, U.S. Air Force Weather Agency (AFWA)/XOGM, Offutt Air Force Base, NE 68113, USA; Hawai'i Institute of Geophysics and Planetology (HIGP) Thermal Alerts System, School of Ocean and Earth Science and Technology (SOEST), Univ. of Hawai'i, 2525 Correa Road, Honolulu, HI 96822, USA (URL: http://modis.higp.hawaii.edu/); guardian.co.uk Science Blog (URL: https://www.theguardian.com/science/blog); David Ferguson, Dept of Earth Sciences, Univ of Oxford, Parks Road, Oxford, OX1 3PR, United Kingdom; Talfan Barnie, Dept of Geography, Univ of Cambridge, Downing Place, Cambridge CB2 3EN, United Kingdom (URL: http://www.geog.cam.ac.uk/people/barnie/); Afar Rift Consortium, School of Earth and Environment, Univ of Leeds, Woodhouse Lane, Leeds, LS2 9JT, United Kingdom (URL: http://www.see.leeds.ac.uk/afar/); Matt Patrick, HIGP/SOEST, Univ of Hawaii-Manoa, 1680 East-West Road, Honolulu, HI 96822, USA.
A large sulfur dioxide plume and several thermal anomalies from Manda Hararo that were detected in satellite imagery during 28-30 June prompted a science team to visit the area on 4 July. After conducting ground-based and aerial observations for approximately 2 hours, they reported that the eruption occurred near the August 2007 eruption site, and was possibly bigger than that event. No active lava effusion was seen, but steaming was observed from the 4-5 km-long fissure that, because of high temperatures, had to be observed from a distance. They also saw new predominantly 'a'a lava flows that were 2-3 m thick. The fissure was lined with scoria ramparts 30-50 m high. Temperature measurements taken with a FLIR (Forward Looking Infrared Radiometer) indicated that the lava flow had cooled significantly with temperatures between 30 and 120 degrees Celsius at the surface. A maximum temperature of 238 degrees Celsius was measured during aerial observations.
Sources: Simon Carn; Gezahegn Yirgu, Department of Earth Sciences, Addis Ababa University
A large sulfur dioxide plume and several thermal anomalies from Manda Hararo were detected in satellite imagery during 28-30 June. Thermal anomalies detected in satellite imagery indicated a surface lava flow in the Karbahi region. Karbahi is a graben area with numerous active faults, fissures, and basalt flows, NW of the center of the broad Manda Hararo volcanic complex. Preliminary data suggested that the eruption was larger than the previous eruption in August 2007. On 8 July, a scientist that visited the area reported fresh lava flows, an eruptive fissure that was about 5 km long, and gas emitting from multiple cones.
Sources: Hawai'i Institute of Geophysics and Planetology (HIGP) Thermal Alerts Team; Simon Carn; The Guardian News
A large sulfur dioxide plume and several thermal anomalies from Manda Hararo were detected in satellite imagery on 13 August. On 16 August, a field team conducted aerial and ground observations of a locality known as Karbahi, a graben area with numerous active faults, fissures, and basalt flows, NW of the center of Manda Hararo. Observations revealed active volcanism, including isolated areas of intense gas emission and visible sulfur deposits. Basaltic lava flowed from long fissures, predominantly to the W of the graben floor. Each fissure was covered by a continuous row of small and closely spaced spatter and scoria cones 2-10 m high. Spatter and scoria deposits ranged in size from coarse lapilli to bombs. Incandescence and occasionally small flames were emitted from the tops of some of the cones.
Observed 'a'a and pahoehoe flows traveled a few hundred meters from the vents. The overall thickness of the flows varied but reached several meters in places. Lava channels and lava tubes were abundant. Fault scarps with fresh breaks and rockfalls were noted. The area affected by tectonic and volcanic activity was an estimated 5-7 km long and 1 km wide.
According to eye-witness accounts, a cracking sound was heard and a tremor was felt on 12 August. On 13 August, "fire" was seen that lit up a large area. "Fire and smoke" continued with variable intensity until 16 August. No damage to life or property was reported.
Sources: Gezahegn Yirgu, Atalay Ayele, Shimeles Fisseha, Tadiwos Chernet and Ato Kifle Damtew, Addis Ababa University, Ethiopia; Simon Carn
Reports are organized chronologically and indexed below by Month/Year (Publication Volume:Number), and include a one-line summary. Click on the index link or scroll down to read the reports.
First historical eruption?lava flows/SO2 plume from rift fissure?August 2007
On 13 August at 1315 a large sulfur-dioxide (SO2) cloud was detected over Ethiopia and Sudan by the Ozone Monitoring Instrument (OMI) on NASA's Aura satellite. This was presumed to be the result of a volcanic eruption in western Afar, Ethiopia, though the source was then unclear. Preliminary analysis indicated that the cloud contained ~ 8,000 tons of SO2, although a more precise estimate depends on the altitude of the cloud, which was not known.
MODIS satellite imagery, interpreted at the University of Hawaii, showed the presence of a cluster of hot-spots centered at 12.25°N, 40.65°E late on 12 August, presumably corresponding to an active lava flow. The eruption site appears to lie within the Manda Hararo volcanic complex around 40 km SSE of Dabbahu volcano, which had its first historical eruption in September 2005. The massive 105-km-long, 20-30 km-wide Manda Hararo complex consists of basaltic shield volcanoes cut by regional fissures with no previously recorded historical eruptions. It is the southernmost axial range of the western Afar region. OMI data on 14 August showed continuing SO2 emissions, although by that day the extent of the MODIS thermal anomaly had diminished.
Local residents reported that there had been no precursory activity of any kind during the days preceding the eruptions. The first sign of activity was noted on 12 August when a sudden heavy cracking sound was heard in the affected area. The sound was heard first in the N part and propagated continuously toward the S. Only a small ground tremor was felt at that time. At about 1730 on 13 August, "fire" started to be seen from the N in the direction of Gommoyta and continued to the N, lighting up the entire area. A curtain of "fire and smoke" rose high into the sky in the area and this activity continued with variable intensity until it subsided on the morning of 16 August. The frightened local inhabitants evacuated the area and therefore did not observe effusion of the lava flows. So far no damage to life or property has been reported.
A field team was able to investigate the area of new eruptions in the Manda Hararo region on 20 August (figure 1). Karbahi is the name given to the rift's axial segment/graben, a region with numerous active normal faults, fissures, and recent basalt flows, bounded by large normal faults. Prominent features in the Karbahi graben area include Gommoyta and Diyyilu felsic volcanoes, which are found immediately to the N of this locality.
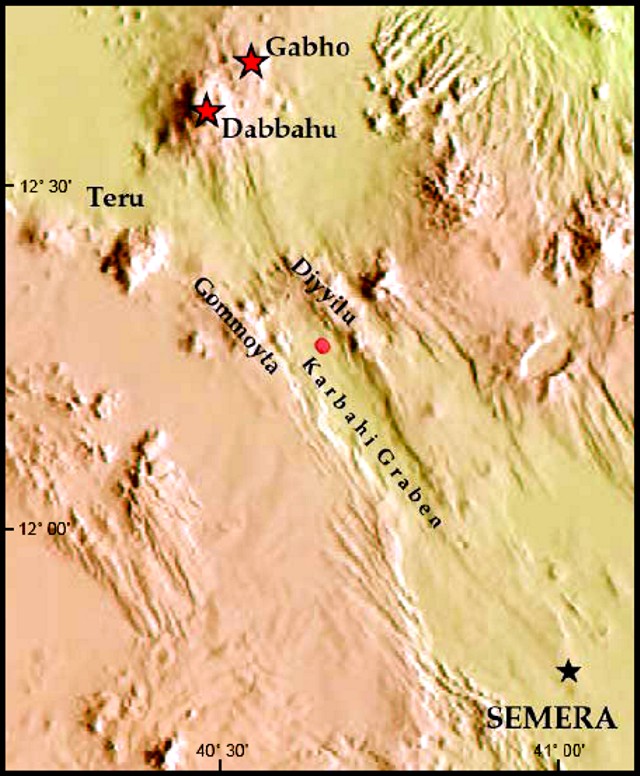 |
Figure 1. Location of the Manda Hararo fissure eruption (round dot). Other features shown include the Gabho and Dabbahu volcanoes, and the city of Semera. Courtesy of Gezahegn Yirgu, Addis Ababa University. |
Aerial observations showed isolated spots where intense emission of gas (with distinct smell of sulfur dioxide) was taking place. In few places, white and yellowish deposits of sulfur were visible. Long, discontinuous fissures, arranged en echelon, from which lavas had flowed on either side, predominantly traveling W to the graben floor (figure 2). Numerous small spatter and scoria cones were aligned on the fissures. Reddish glow and rare flames were also observed on top of some of the tiny craters of these cones. Fault scarps with fresh breaks and rock falls were also visible from the air, probably showing evidence of recent movement. A narrow graben-like collapse structure oblique to one of the fissures was also observed. The segment affected by tectonic and volcanic activity was estimated (with the help of a helicopter pilot) to measure 5-7 km long and 1 km wide.
 |
Figure 2. Steam rises from new fissures that fed lava flows at Manda Hararo, as seen on 20 August 2007. Courtesy of Gezahegn Yirgu, Addis Ababa University. |
Ground investigations found basalt lava flows and steam emissions ongoing on 20 August. While walking on top of the lavas, scientists felt immense heat emanating from the flow surface. Each fissure was covered by a continuous row of small and closely spaced spatter and scoria cones. Many of the cones themselves had tiny pits from which both heat and gas escaped. The pits could not be entered due to the heat and high noxious gas concentrations. As seen from the air, a reddish glow and flames were seen at some distant cones. One fissure with its row of cones is oriented about N7°W to N10°W.
The observed aa and pahoehoe flows were relatively viscous and did not travel beyond a few hundred meters from their fissure vents (figure 3). The overall thickness of the flows was variable and reached several meters in places. Lava channels and tubes were abundant. The spatter ramparts and scoria cones varied in height from 2 to 10 m. Spatter and scoria fragments varied from coarse lapilli to bombs. The new lava was moderately porphyritic with small and sparse plagioclase phenocrysts. Field observations found that the older lavas at the site exhibited the same features. Representative lava samples were collected.
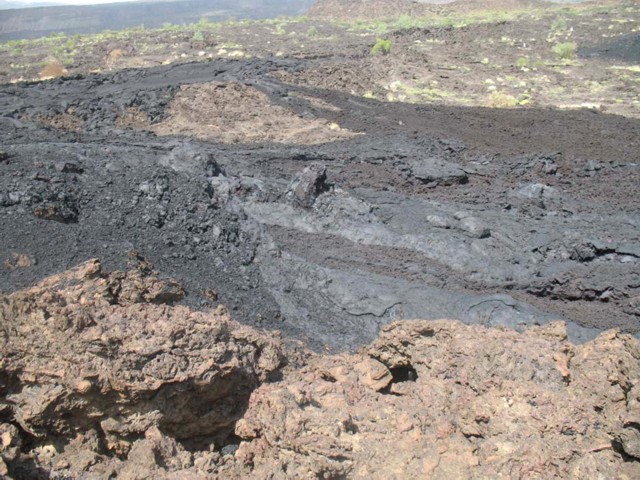 |
Figure 3. A closer view of the August 2007 lava at Manda Hararo. The dark-colored basaltic flows display aa and pahoehoe textures. Courtesy of Gezahegn Yirgu, Addis Ababa University. |
Information Contacts: Gezahegn Yirgu, Atalay Ayele, Shimeles Fisseha, Tadiwos Chernet, and Ato Kifle Damtew, Department of Earth Sciences, Addis Ababa University, Addis Ababa, Ethiopia; Simon Carn, Joint Center for Earth Systems Technology (JCET), University of Maryland Baltimore County (UMBC), 1000 Hilltop Circle, Baltimore, MD 21250, USA (URL: https://so2.gsfc.nasa.gov/); Hawai'i Institute of Geophysics and Planetology (HIGP) Thermal Alerts System, School of Ocean and Earth Science and Technology (SOEST), Univ. of Hawai'i, 2525 Correa Road, Honolulu, HI 96822, USA (URL: http://modis.higp.hawaii.edu/).
Fissure eruption generates lava flows and large SO2 plume
A large SO2 cloud in southern Afar, Ethiopia was detected by the OMI instrument aboard NASA's EOS-AURA satellite on 29 June 2009 (figure 4). The cloud appeared to originate from the Karbahi region of the Manda Hararo rift segment, a graben area with numerous active faults, fissures, and basalt flows. The cloud was similar in size to that observed during a basaltic fissure eruption in August 2007 (BGVN 32:07). As reported by Simon Carn, the 29 June 2009 cloud had a total mass of 3.864 kt, an area of 186,710 km2, and an SO2 max of 4.75 DU (Dobson Units). Other clouds were also seen, including a large one on 30 June.
|
Figure 4. The eruptive SO2 cloud from Manda hararo over southern Afar region detected by the OMI instrument. Image acquired during 1021-1203 UTC on 29 June 2009. Courtesy of Simon Carn, Michigan Technological University. |
MODIS satellite imagery from 2320 UTC on 28-29 June confirmed that the SO2 cloud was associated with thermal anomalies appearing in the immediate vicinity of the August 2007 eruption. According to Charles Holliday, METEOSAT real time Active Fire Monitoring data derived from METEOSAT imagery suggests the eruption began within 15 minutes of 1715 UTC on 28 June 2009, about 7 hours after a magnitude 4.4 earthquake, identified by the Addis Ababa Geophysical Observatory and the European-Mediterranean Seismological Centre.
A field team of scientists, including Gezahegn Yirgu, Tesfaye Kidane, Elias Lewi, Tesfaye Chernet, Girma Wolde Tinsae, David Ferguson, Talfan Barnie, and Osman Mohammed, reached the site of the thermal anomalies by helicopter on 4 July 2009 and spent about two hours on the scene. They found the eruption had emitted predominantly a'a basalt flows, approximately 2-3 m thick that originated from fissures approximately 4-5 km long. The vent areas contained scoria ramparts approximately 30-50 m high. The field team collected rock and gas samples and surveyed the erupted material using visible and FLIR (Forward-Looking Infrared) cameras from both the air and the ground. Hand samples suggested the erupted lava was feldspar-bearing porphyritic basalt. No lava effusion was observed, although some steam was seen at the fissure (figure 5).
|
Figure 5. Oblique aerial photograph of Manda Hararo showing the eruptive fissure, scoria ramparts, and gas plume on 4 July 2009. Courtesy of Talfan Barnie, University of Cambridge. |
The fissure itself was inaccessible over land because it was surrounded by hot rock and could only be observed from a distance. Only a small part of the margins of the flow were visited on the ground due to limited time, rough terrain, and high temperature and humidity. The lava flows appeared to have cooled significantly, with the FLIR recording typical temperatures of between 30 and 120°C for the flow surfaces, and a maximum temperature of 238°C observed from the air (figure 6). The team made gas measurements at hot cracks in the flow front where they smelled volcanic gases and the FLIR registered temperatures over 100°C. According to David Ferguson, the group used FLIR thermal images to determine a safe route for walking. While the front of the lava flow had a dark black crust, similar to that of much colder flows, the FLIR camera on land recorded temperatures of up to 162°C around the cracks and fissures of the flow surface.
|
Figure 6. FLIR image of the 4 July 2009 eruption at Manda Hararo showing temperature distribution in and around the fissure. Courtesy of Talfan Barnie, University of Cambridge. |
A 6 July ASTER (Advanced Spaceborne Thermal Emission and Reflection Radiometer) image from the eruption site shows a warm 6.3 x 1.4 km flow erupted from a NW-SE trending fissure (figure 7). The area of the flow field is 4.0 km2. The coordinates of the center of the flow field are 40.655, 12.256. A 9 July EO-1 ALI panchromatic image shows the flow at a higher resolution (figure 8).
|
Figure 7. ASTER infrared image at Manda Hararo taken on 6 July 2009. The image shows a warm flow, 6.3 x 1.4 km, erupted from what looks like a NW-SE trending fissure. A clear pre-eruptive image from May 2009 shows nothing anomalous at this spot, indicating that the lava flow is new. The coordinates of the center of the flow field are 12.256°N, 40.655°E. Courtesy of Matt Patrick. |
|
Figure 8. An EO-1 ALI panchromatic image (10-m pixel size) showing the flow at Manda Hararo on 9 July 2009. Courtesy of Matt Patrick. |
Information Contacts: Gezahegn Yirgu, Dept of Earth Sciences, Addis Ababa University, P.O. Box 729/1033, Addis Ababa, Ethiopia; Simon Carn, Dept of Geological and Mining Engineering and Sciences, Michigan Technological Univ, 1400 Townsend Dr., Houghton, MI 49931, USA (URL: https://so2.gsfc.nasa.gov/); Afar Rift Consortium (URL: http://www.see.leeds.ac.uk/afar/); Charles Holliday, U.S. Air Force Weather Agency (AFWA)/XOGM, Offutt Air Force Base, NE 68113, USA; Hawai'i Institute of Geophysics and Planetology (HIGP) Thermal Alerts System, School of Ocean and Earth Science and Technology (SOEST), Univ. of Hawai'i, 2525 Correa Road, Honolulu, HI 96822, USA (URL: http://modis.higp.hawaii.edu/); guardian.co.uk Science Blog (URL: https://www.theguardian.com/science/blog); David Ferguson, Dept of Earth Sciences, Univ of Oxford, Parks Road, Oxford, OX1 3PR, United Kingdom; Talfan Barnie, Dept of Geography, Univ of Cambridge, Downing Place, Cambridge CB2 3EN, United Kingdom (URL: http://www.geog.cam.ac.uk/people/barnie/); Afar Rift Consortium, School of Earth and Environment, Univ of Leeds, Woodhouse Lane, Leeds, LS2 9JT, United Kingdom (URL: http://www.see.leeds.ac.uk/afar/); Matt Patrick, HIGP/SOEST, Univ of Hawaii-Manoa, 1680 East-West Road, Honolulu, HI 96822, USA.
|
|
||||||||||||||||||||||||||
There is data available for 2 confirmed Holocene eruptive periods.
2009 Jun 28 - 2009 Jul 1 (?) Confirmed Eruption (Explosive / Effusive) VEI: 2 (?)
| Episode 1 | Eruption (Explosive / Effusive) | |||||||||||||||||||||||||
|---|---|---|---|---|---|---|---|---|---|---|---|---|---|---|---|---|---|---|---|---|---|---|---|---|---|
| 2009 Jun 28 - 2009 Jul 1 (?) | Evidence from Observations: Reported | ||||||||||||||||||||||||
|
List of 3 Events for Episode 1
|
|||||||||||||||||||||||||
2007 Aug 12 - 2007 Aug 14 (?) Confirmed Eruption (Explosive / Effusive) VEI: 2
| Episode 1 | Eruption (Explosive / Effusive) | |||||||||||||||||||||||||||||||||||||||||||||
|---|---|---|---|---|---|---|---|---|---|---|---|---|---|---|---|---|---|---|---|---|---|---|---|---|---|---|---|---|---|---|---|---|---|---|---|---|---|---|---|---|---|---|---|---|---|
| 2007 Aug 12 - 2007 Aug 14 (?) | Evidence from Observations: Reported | ||||||||||||||||||||||||||||||||||||||||||||
|
List of 7 Events for Episode 1
|
|||||||||||||||||||||||||||||||||||||||||||||
This compilation of synonyms and subsidiary features may not be comprehensive. Features are organized into four major categories: Cones, Craters, Domes, and Thermal Features. Synonyms of features appear indented below the primary name. In some cases additional feature type, elevation, or location details are provided.
Synonyms |
||||
| Hararu | Hararo Manda | ||||
Cones |
||||
| Feature Name | Feature Type | Elevation | Latitude | Longitude |
| Da Ore | Tuff ring | 11° 56' 0.00" N | 41° 0' 0.00" E | |
| Gablaytu | Shield volcano | |||
| Unda Hararo | Shield volcano | |||
Craters |
||||
| Feature Name | Feature Type | Elevation | Latitude | Longitude |
| Gumatmali | Fissure vent | |||
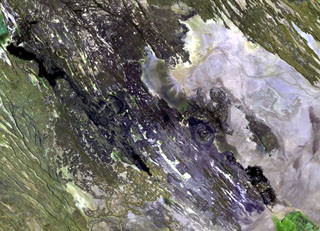 The Manda Hararo complex, which extends diagonally from the NW to SE across this Landsat image, represents an uplifted segment of a mid-ocean ridge spreading center. The complex is 105 x 20-30 km in size, and consists of small basaltic shield volcanoes and abundant fissure-fed lava flows. The dominant part of the complex lies to the south, where the Gumatmali-Gablaytu fissure system is located.
 Steam rises from new fissures that fed lava flows at the Manda Hararo complex, as seen on 20 August 2007. The Manda Hararo complex is the southernmost axial range of western Afar. The massive complex is 105 x 20-30 km and represents an uplifted segment of a mid-ocean ridge spreading center. Voluminous lava flows erupted from NNW-trending fissures.
 Dark basaltic lava flows that erupted from the Manda Hararo complex are seen here on 20 August 2007, about a week after the start of the eruption. This was the first historical eruption of Manda Hararo. The `a`a and pahoehoe lava flows traveled only a few hundred meters from a fissure lined with small spatter ramparts and scoria cones.
There are no samples for Manda Hararo in the Smithsonian's NMNH Department of Mineral Sciences Rock and Ore collection.
| Copernicus Browser | The Copernicus Browser replaced the Sentinel Hub Playground browser in 2023, to provide access to Earth observation archives from the Copernicus Data Space Ecosystem, the main distribution platform for data from the EU Copernicus missions. |
| MIROVA | Middle InfraRed Observation of Volcanic Activity (MIROVA) is a near real time volcanic hot-spot detection system based on the analysis of MODIS (Moderate Resolution Imaging Spectroradiometer) data. In particular, MIROVA uses the Middle InfraRed Radiation (MIR), measured over target volcanoes, in order to detect, locate and measure the heat radiation sourced from volcanic activity. |
| MODVOLC Thermal Alerts | Using infrared satellite Moderate Resolution Imaging Spectroradiometer (MODIS) data, scientists at the Hawai'i Institute of Geophysics and Planetology, University of Hawai'i, developed an automated system called MODVOLC to map thermal hot-spots in near real time. For each MODIS image, the algorithm automatically scans each 1 km pixel within it to check for high-temperature hot-spots. When one is found the date, time, location, and intensity are recorded. MODIS looks at every square km of the Earth every 48 hours, once during the day and once during the night, and the presence of two MODIS sensors in space allows at least four hot-spot observations every two days. Each day updated global maps are compiled to display the locations of all hot spots detected in the previous 24 hours. There is a drop-down list with volcano names which allow users to 'zoom-in' and examine the distribution of hot-spots at a variety of spatial scales. |
|
WOVOdat
Single Volcano View Temporal Evolution of Unrest Side by Side Volcanoes |
WOVOdat is a database of volcanic unrest; instrumentally and visually recorded changes in seismicity, ground deformation, gas emission, and other parameters from their normal baselines. It is sponsored by the World Organization of Volcano Observatories (WOVO) and presently hosted at the Earth Observatory of Singapore.
GVMID Data on Volcano Monitoring Infrastructure The Global Volcano Monitoring Infrastructure Database GVMID, is aimed at documenting and improving capabilities of volcano monitoring from the ground and space. GVMID should provide a snapshot and baseline view of the techniques and instrumentation that are in place at various volcanoes, which can be use by volcano observatories as reference to setup new monitoring system or improving networks at a specific volcano. These data will allow identification of what monitoring gaps exist, which can be then targeted by remote sensing infrastructure and future instrument deployments. |
| Volcanic Hazard Maps | The IAVCEI Commission on Volcanic Hazards and Risk has a Volcanic Hazard Maps database designed to serve as a resource for hazard mappers (or other interested parties) to explore how common issues in hazard map development have been addressed at different volcanoes, in different countries, for different hazards, and for different intended audiences. In addition to the comprehensive, searchable Volcanic Hazard Maps Database, this website contains information about diversity of volcanic hazard maps, illustrated using examples from the database. This site is for educational purposes related to volcanic hazard maps. Hazard maps found on this website should not be used for emergency purposes. For the most recent, official hazard map for a particular volcano, please seek out the proper institutional authorities on the matter. |
| IRIS seismic stations/networks | Incorporated Research Institutions for Seismology (IRIS) Data Services map showing the location of seismic stations from all available networks (permanent or temporary) within a radius of 0.18° (about 20 km at mid-latitudes) from the given location of Manda Hararo. Users can customize a variety of filters and options in the left panel. Note that if there are no stations are known the map will default to show the entire world with a "No data matched request" error notice. |
| UNAVCO GPS/GNSS stations | Geodetic Data Services map from UNAVCO showing the location of GPS/GNSS stations from all available networks (permanent or temporary) within a radius of 20 km from the given location of Manda Hararo. Users can customize the data search based on station or network names, location, and time window. Requires Adobe Flash Player. |
| DECADE Data | The DECADE portal, still in the developmental stage, serves as an example of the proposed interoperability between The Smithsonian Institution's Global Volcanism Program, the Mapping Gas Emissions (MaGa) Database, and the EarthChem Geochemical Portal. The Deep Earth Carbon Degassing (DECADE) initiative seeks to use new and established technologies to determine accurate global fluxes of volcanic CO2 to the atmosphere, but installing CO2 monitoring networks on 20 of the world's 150 most actively degassing volcanoes. The group uses related laboratory-based studies (direct gas sampling and analysis, melt inclusions) to provide new data for direct degassing of deep earth carbon to the atmosphere. |
| Large Eruptions of Manda Hararo | Information about large Quaternary eruptions (VEI >= 4) is cataloged in the Large Magnitude Explosive Volcanic Eruptions (LaMEVE) database of the Volcano Global Risk Identification and Analysis Project (VOGRIPA). |
| EarthChem | EarthChem develops and maintains databases, software, and services that support the preservation, discovery, access and analysis of geochemical data, and facilitate their integration with the broad array of other available earth science parameters. EarthChem is operated by a joint team of disciplinary scientists, data scientists, data managers and information technology developers who are part of the NSF-funded data facility Integrated Earth Data Applications (IEDA). IEDA is a collaborative effort of EarthChem and the Marine Geoscience Data System (MGDS). |

