
Based on visual observations and seismic data, CVGHM raised the Alert Level for Tambora to 2 (on a scale of 1-4) on 5 April.
Source: Pusat Vulkanologi dan Mitigasi Bencana Geologi (PVMBG, also known as CVGHM)
Increased seismicity and minor steam venting in 2011
Beginning in April 2011, Tambora volcano, Indonesia (figure 1), experienced increased seismic activity and minor steam venting. As a result, the Center for Volcanology and Geological Hazard Mitigation (CVGHM) raised the Alert Level for Tambora. This report will summarize the increased activity from April 2011 through 8 September 2011, as reported by CVGHM.
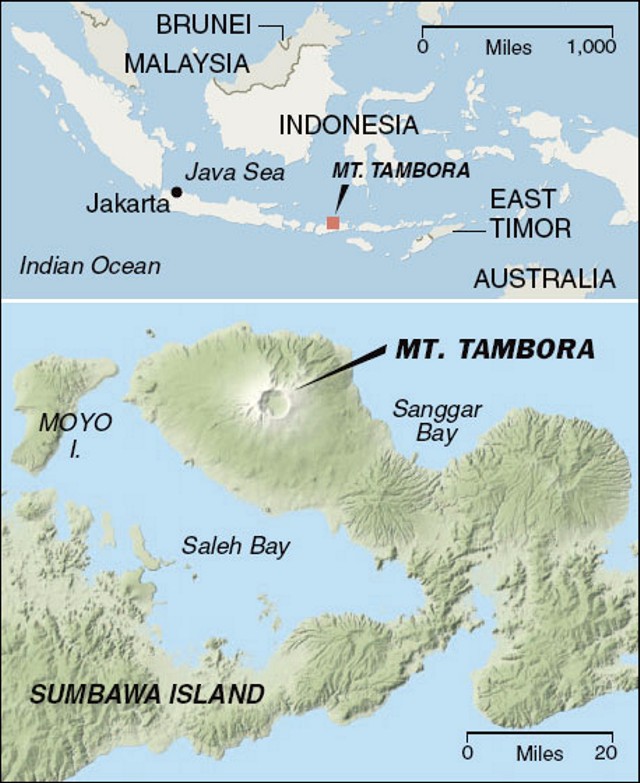 |
Figure 1. Regional (top) and local (bottom) geographic setting of Tambora volcano, Indonesia. Courtesy of Wilford (2006) and the New York Times. |
Seismicity at Tambora increased steadily from April 2011 to at least 8 September. CVGHM reported six seismic signals that were monitored: volcanic earthquakes (VA), shallow volcanic earthquakes (VB), distant tectonic earthquakes (TJ), local tectonic earthquakes (TL), low-frequency earthquakes (LF), and volcanic tremor. Seismic activity from April through August is summarized in figure 2. In addition to increased seismicity, ground-based observers described dense white plumes rising 50-75 m above the caldera rim in April and June.
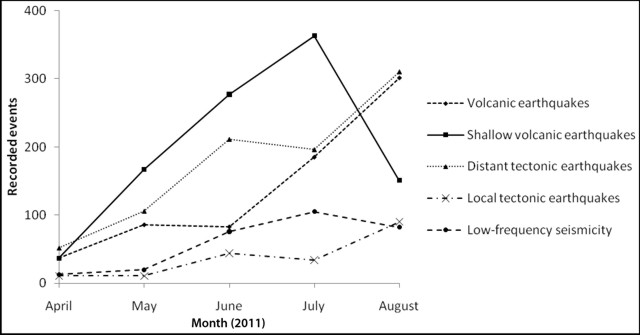 |
Figure 2. Reported seismic activity at Tambora cumulative by month from April through August 2011. Onset of continuous volcanic tremor on 29 August is not represented. Data from CVGHM. |
Volcanic tremor started 29 August and continued every day since, with the exception of 3 September (table 1). The tremor was accompanied by diffuse plumes rising 10-20 m above the caldera rim on 29 August and 5 September. Based on seismic activity and visual observations, CVGHM raised the Alert Level to 2 (on a scale from 1 to 4) on 30 August, and forbade access to the peak of Tambora.
Table 1. Summary of seismicity at Tambora since the onset of volcanic tremor on 29 August 2011. On both 29 August and 5 September seismicity was accompanied by plumes rising 10-20 m above the caldera rim. Data from CVGHM.
| Date | Volcanic A-type | Volcanic B-type | Local tectonic | Low-frequency | Tremor |
| 29 Aug 2011 | 14 | -- | 3 | -- | continuous |
| 30 Aug 2011 | 9 | 5 | 2 | 1 | continuous |
| 31 Aug 2011 | 6 | 5 | -- | 2 | continuous |
| 01 Sep 2011 | 15 | -- | 2 | 2 | continuous |
| 02 Sep 2011 | 6 | 4 | 4 | 6 | 11 |
| 03 Sep 2011 | 5 | 5 | 4 | 4 | -- |
| 04 Sep 2011 | 6 | 1 | 3 | 4 | 11 |
| 05 Sep 2011 | 11 | 7 | 3 | 1 | 4 |
| 06 Sep 2011 | 7 | 4 | -- | -- | continuous |
| 07 Sep 2011 | 40 | 6 | 1 | -- | continuous |
Along with the continuation of the tremor after 29 August, CVGHM reported an increase in other types of seismic activity from 30 August to 7 September. On 5 September an earthquake was felt by residents (exact location undisclosed). Instruments recorded 40 volcanic earthquakes on 7 September (table 1); 32 of those were recorded within 6 hours. On 8 September, CVGHM raised the Alert Level to 3, invoked a 3 km exclusion zone, and prohibited access to Disaster Prone Areas III, summarized in table 2. The Disaster Prone Areas were largely based on the devastating 1815 eruption of Tambora. As of 21 September, the Alert Level remained at 3.
Table 2. Summary of Disaster Prone Areas at Tambora defined on the basis of radial distance from the peak of Tambora. Courtesy of CVGHM.
| Area | Radius from Tambora | Potential hazards |
| Disaster Prone Area I | 8 km | Lahars, ash fall, and incandescent bombs. |
| Disaster Prone Area II | 5 km | Pyroclastic flows, lava flows, toxic gases, incandescent bombs, ash fall, lahars/mudflows, and high acidity in water. |
| Disaster Prone Area III | 3 km | Pyroclastic flows, lava flows, toxic gases, incandescent bombs, and heavy ash fall. |
References. Wilford, J.N., 2006, Under an 1815 Volcano Eruption, Remains of a 'Lost Kingdom', the New York Times, URL: http://www.nytimes.com/2006/02/28/science/28volc.html; Posted 28 February 2006; accessed 26 September 2011.
Information Contacts: Center for Volcanology and Geological Hazard Mitigation (CVGHM), Jl. Diponegoro 57, Bandung, West Java, Indonesia, 40 122 (URL: http://www.vsi.esdm.go.id/).
2013: April
2012: April
2011: August
| September
| October
Based on visual observations and seismic data, CVGHM raised the Alert Level for Tambora to 2 (on a scale of 1-4) on 5 April.
Source: Pusat Vulkanologi dan Mitigasi Bencana Geologi (PVMBG, also known as CVGHM)
CVGHM reported that during January-8 April plumes did not rise from Tambora, no changes were observed around the caldera, and seismicity decreased. On 9 April the Alert Level was lowered to 1 (on a scale of 1-4).
Source: Pusat Vulkanologi dan Mitigasi Bencana Geologi (PVMBG, also known as CVGHM)
CVGHM reported that during 22 September-9 October plumes did not rise from Tambora; seismicity fluctuated, but declined overall. Based on visual observations, deformation data, and seismicity, the Alert Level was lowered to 2 (on a scale of 1-4) on 9 October.
Source: Pusat Vulkanologi dan Mitigasi Bencana Geologi (PVMBG, also known as CVGHM)
Based on visual observation and seismic data, CVGHM reported an increase in activity at Tambora that started in April. Therefore, on 30 August, the Alert Level was raised to 2 (on a scale of 1-4). During 30 August-8 September seismicity continued to increase. Diffuse white plumes were observed on 5 September and rose 10 m above the crater rim. On 8 September the Alert Level was raised to 3 (on a scale of 1-4).
Source: Pusat Vulkanologi dan Mitigasi Bencana Geologi (PVMBG, also known as CVGHM)
Based on visual observation and seismic data, CVGHM reported an increase in activity at Tambora during the previous five months. Ground-based observers at an observation post in Tambora village noted dense white plumes rising 50-75 m above the caldera rim during April and June, but no plumes during May or July. In August dense white plumes rose 20 m above the caldera rim. Seismicity started to increase in April and continued to increase through August. On 30 August the Alert Level was raised to 2 (on a scale of 1-4).
Source: Pusat Vulkanologi dan Mitigasi Bencana Geologi (PVMBG, also known as CVGHM)
Reports are organized chronologically and indexed below by Month/Year (Publication Volume:Number), and include a one-line summary. Click on the index link or scroll down to read the reports.
Increased seismicity and minor steam venting in 2011
Beginning in April 2011, Tambora volcano, Indonesia (figure 1), experienced increased seismic activity and minor steam venting. As a result, the Center for Volcanology and Geological Hazard Mitigation (CVGHM) raised the Alert Level for Tambora. This report will summarize the increased activity from April 2011 through 8 September 2011, as reported by CVGHM.
|
Figure 1. Regional (top) and local (bottom) geographic setting of Tambora volcano, Indonesia. Courtesy of Wilford (2006) and the New York Times. |
Seismicity at Tambora increased steadily from April 2011 to at least 8 September. CVGHM reported six seismic signals that were monitored: volcanic earthquakes (VA), shallow volcanic earthquakes (VB), distant tectonic earthquakes (TJ), local tectonic earthquakes (TL), low-frequency earthquakes (LF), and volcanic tremor. Seismic activity from April through August is summarized in figure 2. In addition to increased seismicity, ground-based observers described dense white plumes rising 50-75 m above the caldera rim in April and June.
|
Figure 2. Reported seismic activity at Tambora cumulative by month from April through August 2011. Onset of continuous volcanic tremor on 29 August is not represented. Data from CVGHM. |
Volcanic tremor started 29 August and continued every day since, with the exception of 3 September (table 1). The tremor was accompanied by diffuse plumes rising 10-20 m above the caldera rim on 29 August and 5 September. Based on seismic activity and visual observations, CVGHM raised the Alert Level to 2 (on a scale from 1 to 4) on 30 August, and forbade access to the peak of Tambora.
Table 1. Summary of seismicity at Tambora since the onset of volcanic tremor on 29 August 2011. On both 29 August and 5 September seismicity was accompanied by plumes rising 10-20 m above the caldera rim. Data from CVGHM.
| Date | Volcanic A-type | Volcanic B-type | Local tectonic | Low-frequency | Tremor |
| 29 Aug 2011 | 14 | -- | 3 | -- | continuous |
| 30 Aug 2011 | 9 | 5 | 2 | 1 | continuous |
| 31 Aug 2011 | 6 | 5 | -- | 2 | continuous |
| 01 Sep 2011 | 15 | -- | 2 | 2 | continuous |
| 02 Sep 2011 | 6 | 4 | 4 | 6 | 11 |
| 03 Sep 2011 | 5 | 5 | 4 | 4 | -- |
| 04 Sep 2011 | 6 | 1 | 3 | 4 | 11 |
| 05 Sep 2011 | 11 | 7 | 3 | 1 | 4 |
| 06 Sep 2011 | 7 | 4 | -- | -- | continuous |
| 07 Sep 2011 | 40 | 6 | 1 | -- | continuous |
Along with the continuation of the tremor after 29 August, CVGHM reported an increase in other types of seismic activity from 30 August to 7 September. On 5 September an earthquake was felt by residents (exact location undisclosed). Instruments recorded 40 volcanic earthquakes on 7 September (table 1); 32 of those were recorded within 6 hours. On 8 September, CVGHM raised the Alert Level to 3, invoked a 3 km exclusion zone, and prohibited access to Disaster Prone Areas III, summarized in table 2. The Disaster Prone Areas were largely based on the devastating 1815 eruption of Tambora. As of 21 September, the Alert Level remained at 3.
Table 2. Summary of Disaster Prone Areas at Tambora defined on the basis of radial distance from the peak of Tambora. Courtesy of CVGHM.
| Area | Radius from Tambora | Potential hazards |
| Disaster Prone Area I | 8 km | Lahars, ash fall, and incandescent bombs. |
| Disaster Prone Area II | 5 km | Pyroclastic flows, lava flows, toxic gases, incandescent bombs, ash fall, lahars/mudflows, and high acidity in water. |
| Disaster Prone Area III | 3 km | Pyroclastic flows, lava flows, toxic gases, incandescent bombs, and heavy ash fall. |
References. Wilford, J.N., 2006, Under an 1815 Volcano Eruption, Remains of a 'Lost Kingdom', the New York Times, URL: http://www.nytimes.com/2006/02/28/science/28volc.html; Posted 28 February 2006; accessed 26 September 2011.
Information Contacts: Center for Volcanology and Geological Hazard Mitigation (CVGHM), Jl. Diponegoro 57, Bandung, West Java, Indonesia, 40 122 (URL: http://www.vsi.esdm.go.id/).
|
|
||||||||||||||||||||||||||||
There is data available for 7 confirmed eruptive periods.
1967 Jul 2 ± 20 years ± 182 days Confirmed Eruption (Explosive / Effusive) VEI: 0
| Episode 1 | Eruption (Explosive / Effusive) | NE part of caldera floor | ||||||||||||||||||
|---|---|---|---|---|---|---|---|---|---|---|---|---|---|---|---|---|---|---|---|
| 1967 Jul 2 ± 20 years ± 182 days - Unknown | Evidence from Observations: Reported | ||||||||||||||||||
|
List of 2 Events for Episode 1 at NE part of caldera floor
|
|||||||||||||||||||
1880 ± 30 years Confirmed Eruption (Explosive / Effusive) VEI: 2
| Episode 1 | Eruption (Explosive / Effusive) | SW part of caldera (Doro Afi Toi) | |||||||||||||||||||||||||||||||||
|---|---|---|---|---|---|---|---|---|---|---|---|---|---|---|---|---|---|---|---|---|---|---|---|---|---|---|---|---|---|---|---|---|---|---|
| 1880 ± 30 years - Unknown | Evidence from Observations: Reported | |||||||||||||||||||||||||||||||||
|
List of 5 Events for Episode 1 at SW part of caldera (Doro Afi Toi)
|
||||||||||||||||||||||||||||||||||
1819 Aug Confirmed Eruption (Explosive / Effusive) VEI: 2
| Episode 1 | Eruption (Explosive / Effusive) | |||||||||||||||||||
|---|---|---|---|---|---|---|---|---|---|---|---|---|---|---|---|---|---|---|---|
| 1819 Aug - Unknown | Evidence from Observations: Reported | ||||||||||||||||||
|
List of 2 Events for Episode 1
|
|||||||||||||||||||
1812 - 1815 Jul 15 (?) Confirmed Eruption (Explosive / Effusive) VEI: 7
| Episode 1 | Eruption (Explosive / Effusive) | ||||||||||||||||||||||||||||||||||||||||||||||||||||||||||||||||||||||||||||||||||||||||||||||
|---|---|---|---|---|---|---|---|---|---|---|---|---|---|---|---|---|---|---|---|---|---|---|---|---|---|---|---|---|---|---|---|---|---|---|---|---|---|---|---|---|---|---|---|---|---|---|---|---|---|---|---|---|---|---|---|---|---|---|---|---|---|---|---|---|---|---|---|---|---|---|---|---|---|---|---|---|---|---|---|---|---|---|---|---|---|---|---|---|---|---|---|---|---|---|
| 1812 - 1815 Jul 15 (?) | Evidence from Observations: Reported | |||||||||||||||||||||||||||||||||||||||||||||||||||||||||||||||||||||||||||||||||||||||||||||
|
List of 17 Events for Episode 1
|
||||||||||||||||||||||||||||||||||||||||||||||||||||||||||||||||||||||||||||||||||||||||||||||
0740 ± 150 years Confirmed Eruption (Explosive / Effusive)
| Episode 1 | Eruption (Explosive / Effusive) | ||||||||||||||
|---|---|---|---|---|---|---|---|---|---|---|---|---|---|---|
| 0740 ± 150 years - Unknown | Evidence from Isotopic: 14C (uncalibrated) | |||||||||||||
|
List of 1 Events for Episode 1
|
||||||||||||||
3050 BCE (?) Confirmed Eruption (Explosive / Effusive)
| Episode 1 | Eruption (Explosive / Effusive) | |||||||||||||||||||
|---|---|---|---|---|---|---|---|---|---|---|---|---|---|---|---|---|---|---|---|
| 3050 BCE (?) - Unknown | Evidence from Isotopic: 14C (uncalibrated) | ||||||||||||||||||
|
List of 2 Events for Episode 1
|
|||||||||||||||||||
3910 BCE ± 200 years Confirmed Eruption (Explosive / Effusive)
| Episode 1 | Eruption (Explosive / Effusive) | |||||||||||||||||||
|---|---|---|---|---|---|---|---|---|---|---|---|---|---|---|---|---|---|---|---|
| 3910 BCE ± 200 years - Unknown | Evidence from Isotopic: 14C (uncalibrated) | ||||||||||||||||||
|
List of 2 Events for Episode 1
|
|||||||||||||||||||
This compilation of synonyms and subsidiary features may not be comprehensive. Features are organized into four major categories: Cones, Craters, Domes, and Thermal Features. Synonyms of features appear indented below the primary name. In some cases additional feature type, elevation, or location details are provided.
Synonyms |
||||
| Tomboro | ||||
Cones |
||||
| Feature Name | Feature Type | Elevation | Latitude | Longitude |
| Molo | Cone | |||
| Tahe | Cone | |||
Domes |
||||
| Feature Name | Feature Type | Elevation | Latitude | Longitude |
| Doro Afi Toi | Dome | |||
| Kadiendi Nae | Dome | |||
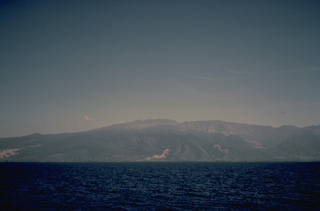 Seen from the sea, Tambora volcano presents a broad, flat profile. The volcano, forming the 60-km-wide Sanggar Peninsula, is truncated by a 6-km-wide caldera. One of the world's largest eruptions during the last 10,000 years produced the present-day caldera in 1815.
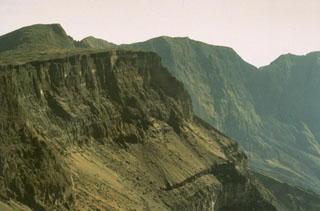 Tambora's serrated NE caldera rim towers 1,250 m above the caldera floor. The 6-km-wide caldera was formed in 1815, during one of the world's most powerful eruptions of the past 10,000 years. Since 1815 only a few minor eruptions have occurred on the caldera floor.
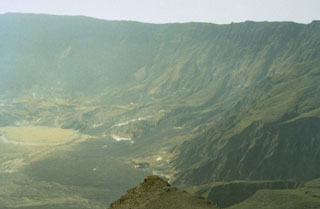 Tambora's caldera, seen here from the western rim, was formed during the eruption of 1815 following the ejection of about 30-50 km3 DRE (dense rock equivalent) of ashfall and pyroclastic flows. This was history's largest explosive eruption and followed low-level eruptive activity that began in 1812. Only a few minor eruptions have taken place since formation of the 6-km-wide and 1,250-m-deep caldera. The last eruption produced a lava flow on the caldera floor and is known only to have occurred sometime between 1947 and 1968.
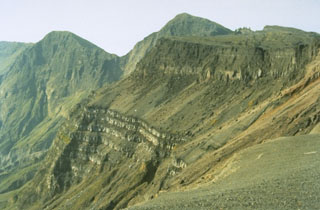 The bottom portion of this cliff section in the W wall of the Tambora caldera shows a thick sequence of bedded lava flows that filled an earlier caldera that formed 43,000 years ago. The sloping surface above it consists of pyroclastic material erupted between about 5,900 and 1,210 years ago. This is overlain by unit about 200 m thick that was produced during the 1815 eruption. These upper cliffs expose pumice deposits that originated from the eruption plume at the base, overlain by a thick sequence of pyroclastic flow deposits.
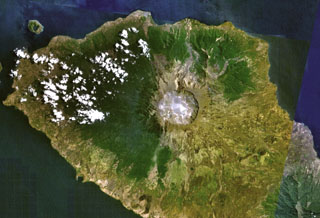 Tambora volcano on Indonesia's Sumbawa Island produced of the world's largest historical eruption in April 1815. This NASA Landsat mosaic shows the 6-km-wide caldera at the top of the 2,850-m-high summit. Pyroclastic flows during the 1815 eruption reached the sea on all sides of the 60-km-wide volcanic peninsula, and the ejection of large amounts of volcanic gas (aerosols) caused world-wide temperature declines in 1815 and 1816.
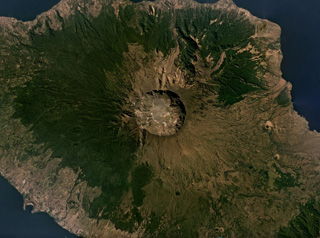 The 6-km-wide and 1-km-deep Tambora caldera that formed during the 1815 eruption is seen in this July 2019 Planet Labs satellite image mosaic (N is at the top). The 1815 eruption ejected around 41 km3 of magma and formed pyroclastic flows that reached the sea on all sides of the 60-km-wide volcanic peninsula of Sumbawa Island, triggering a tsunami.
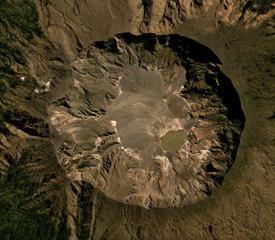 The Tambora caldera formed during the 1815 eruption, after 41 km3 of magma (dense rock equivalent) was expelled, leaving the 6-km-wide and 1-km-deep depression seen in this July 2019 Planet Labs satellite image mosaic (N is to the top). The current area of the caldera is approximately 34.5 km2, with erosion altering the surface and remobilizing material onto the caldera floor.
The following 1 samples associated with this volcano can be found in the Smithsonian's NMNH Department of Mineral Sciences collections, and may be availble for research (contact the Rock and Ore Collections Manager). Catalog number links will open a window with more information.
| Catalog Number | Sample Description | Lava Source | Collection Date |
|---|---|---|---|
| NMNH 116570 | Pumice | -- | -- |
| Copernicus Browser | The Copernicus Browser replaced the Sentinel Hub Playground browser in 2023, to provide access to Earth observation archives from the Copernicus Data Space Ecosystem, the main distribution platform for data from the EU Copernicus missions. |
| MIROVA | Middle InfraRed Observation of Volcanic Activity (MIROVA) is a near real time volcanic hot-spot detection system based on the analysis of MODIS (Moderate Resolution Imaging Spectroradiometer) data. In particular, MIROVA uses the Middle InfraRed Radiation (MIR), measured over target volcanoes, in order to detect, locate and measure the heat radiation sourced from volcanic activity. |
| MODVOLC Thermal Alerts | Using infrared satellite Moderate Resolution Imaging Spectroradiometer (MODIS) data, scientists at the Hawai'i Institute of Geophysics and Planetology, University of Hawai'i, developed an automated system called MODVOLC to map thermal hot-spots in near real time. For each MODIS image, the algorithm automatically scans each 1 km pixel within it to check for high-temperature hot-spots. When one is found the date, time, location, and intensity are recorded. MODIS looks at every square km of the Earth every 48 hours, once during the day and once during the night, and the presence of two MODIS sensors in space allows at least four hot-spot observations every two days. Each day updated global maps are compiled to display the locations of all hot spots detected in the previous 24 hours. There is a drop-down list with volcano names which allow users to 'zoom-in' and examine the distribution of hot-spots at a variety of spatial scales. |
|
WOVOdat
Single Volcano View Temporal Evolution of Unrest Side by Side Volcanoes |
WOVOdat is a database of volcanic unrest; instrumentally and visually recorded changes in seismicity, ground deformation, gas emission, and other parameters from their normal baselines. It is sponsored by the World Organization of Volcano Observatories (WOVO) and presently hosted at the Earth Observatory of Singapore.
GVMID Data on Volcano Monitoring Infrastructure The Global Volcano Monitoring Infrastructure Database GVMID, is aimed at documenting and improving capabilities of volcano monitoring from the ground and space. GVMID should provide a snapshot and baseline view of the techniques and instrumentation that are in place at various volcanoes, which can be use by volcano observatories as reference to setup new monitoring system or improving networks at a specific volcano. These data will allow identification of what monitoring gaps exist, which can be then targeted by remote sensing infrastructure and future instrument deployments. |
| Volcanic Hazard Maps | The IAVCEI Commission on Volcanic Hazards and Risk has a Volcanic Hazard Maps database designed to serve as a resource for hazard mappers (or other interested parties) to explore how common issues in hazard map development have been addressed at different volcanoes, in different countries, for different hazards, and for different intended audiences. In addition to the comprehensive, searchable Volcanic Hazard Maps Database, this website contains information about diversity of volcanic hazard maps, illustrated using examples from the database. This site is for educational purposes related to volcanic hazard maps. Hazard maps found on this website should not be used for emergency purposes. For the most recent, official hazard map for a particular volcano, please seek out the proper institutional authorities on the matter. |
| IRIS seismic stations/networks | Incorporated Research Institutions for Seismology (IRIS) Data Services map showing the location of seismic stations from all available networks (permanent or temporary) within a radius of 0.18° (about 20 km at mid-latitudes) from the given location of Tambora. Users can customize a variety of filters and options in the left panel. Note that if there are no stations are known the map will default to show the entire world with a "No data matched request" error notice. |
| UNAVCO GPS/GNSS stations | Geodetic Data Services map from UNAVCO showing the location of GPS/GNSS stations from all available networks (permanent or temporary) within a radius of 20 km from the given location of Tambora. Users can customize the data search based on station or network names, location, and time window. Requires Adobe Flash Player. |
| DECADE Data | The DECADE portal, still in the developmental stage, serves as an example of the proposed interoperability between The Smithsonian Institution's Global Volcanism Program, the Mapping Gas Emissions (MaGa) Database, and the EarthChem Geochemical Portal. The Deep Earth Carbon Degassing (DECADE) initiative seeks to use new and established technologies to determine accurate global fluxes of volcanic CO2 to the atmosphere, but installing CO2 monitoring networks on 20 of the world's 150 most actively degassing volcanoes. The group uses related laboratory-based studies (direct gas sampling and analysis, melt inclusions) to provide new data for direct degassing of deep earth carbon to the atmosphere. |
| Large Eruptions of Tambora | Information about large Quaternary eruptions (VEI >= 4) is cataloged in the Large Magnitude Explosive Volcanic Eruptions (LaMEVE) database of the Volcano Global Risk Identification and Analysis Project (VOGRIPA). |
| EarthChem | EarthChem develops and maintains databases, software, and services that support the preservation, discovery, access and analysis of geochemical data, and facilitate their integration with the broad array of other available earth science parameters. EarthChem is operated by a joint team of disciplinary scientists, data scientists, data managers and information technology developers who are part of the NSF-funded data facility Integrated Earth Data Applications (IEDA). IEDA is a collaborative effort of EarthChem and the Marine Geoscience Data System (MGDS). |

