On 5 May IG reported that the eruption at Wolf’s SE flank was over. The eruption began at 2320 on 6 January from an approximately 8-km-long radial fissure, trending NW-SE, that had at least five active vents. Lava flows from the vents traveled SE then E, covering an area of more than 30 square kilometers. The maximum length of the flow field was 18.5 km, with the farthest-reaching flow stopping 150-200 m from the coastline. The highest levels of heat, sulfur dioxide emissions, seismicity, and deformation were recorded in the early days of the eruption. Sulfur dioxide emissions had been absent for the previous 30 days.
Source: Instituto Geofísico-Escuela Politécnica Nacional (IG-EPN)
First eruption in seven years; lava effusion on the SE flank during January-April 2022
The first known observed eruption in the Galapagos occurred at Volcán Wolf on Isabela Island in August of 1797. Basaltic lava flows have occurred within the summit crater and on the flanks a few times each century since then. The most recent eruptions in 1982 (SEAN 07:08) and 2015 (BGVN 41:10) produced lava fountains and flows within the crater and on the flanks. A new eruption beginning on 7 January 2022 produced a large SO2 plume, a small amount of ash, and lava flows on the SE flank that lasted through April 2022. Details of the 2022 eruption are provided with information primarily from the Geophysical Institute of the National Polytechnic School (IG-EPN) in Quito, Ecuador. IG maintains a broadband seismic network and a DOAS (Differential Optical Absorption Spectrometer) SO2 monitoring station on the islands that transmits data to the mainland. The Washington Volcanic Ash Advisory Center (VAAC) is responsible for aviation warnings, and satellite data provide valuable remote thermal and SO2 information.
Summary of January-April 2022 eruption. The 6 January through 14 April 2022 eruption lasted longer than the eruptions in 1982 and 2015. The eruption began with a very large SO2 plume, a moderate-size ash plume, and multiple vents that produced lava flows. IG-EPN officials noted that the lava flows originated from an 8-km-long SE-flank radial fissure with at least five vents. The flows reached a maximum distance of about 18.5 km; they stopped 150-200 m from the coastline, covering an area of more than 30 km2.
Description of January-April 2022 eruption. After seven years of no activity, a new eruption at Wolf was first reported shortly late on 6 January 2022, Galápagos time. Within the hour, a plume of gas and ash had reached 3.8 km altitude and drifted NE while a second plume drifted W at 1.9 km altitude. Lava flows were observed descending the SE flank. Seismicity had been detected at the FER1 station on Fernandina Island a few hours earlier that likely signaled the start of the eruption. Twenty-nine MODVOLC thermal alerts appeared on 7 January on the SE flank, confirming a significant thermal event from the lava flow. Rangers from Parque Nacional Galápagos reported that a fissure on the S flank was the source of the flow. They witnessed the flow descending the SE flank and burning vegetation (figures 12 and 13).
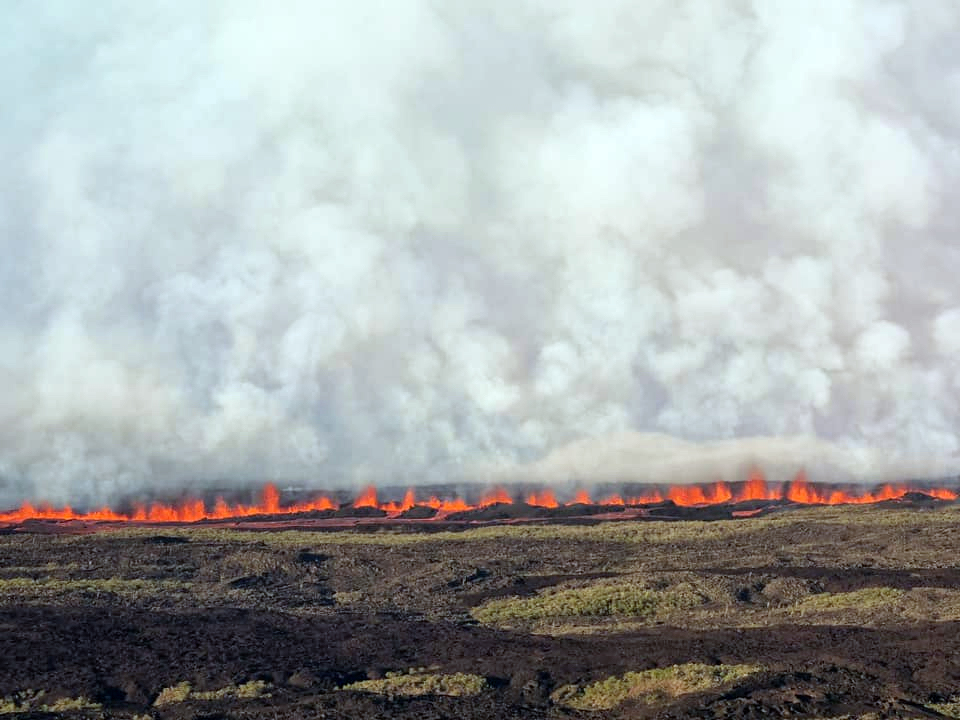 |
Figure 12. A new lava flow at Wolf descends the SE slope on 7 January 2022 burning adjacent vegetation and creating white smoke. Courtesy of Parque Nacional Galápagos. |
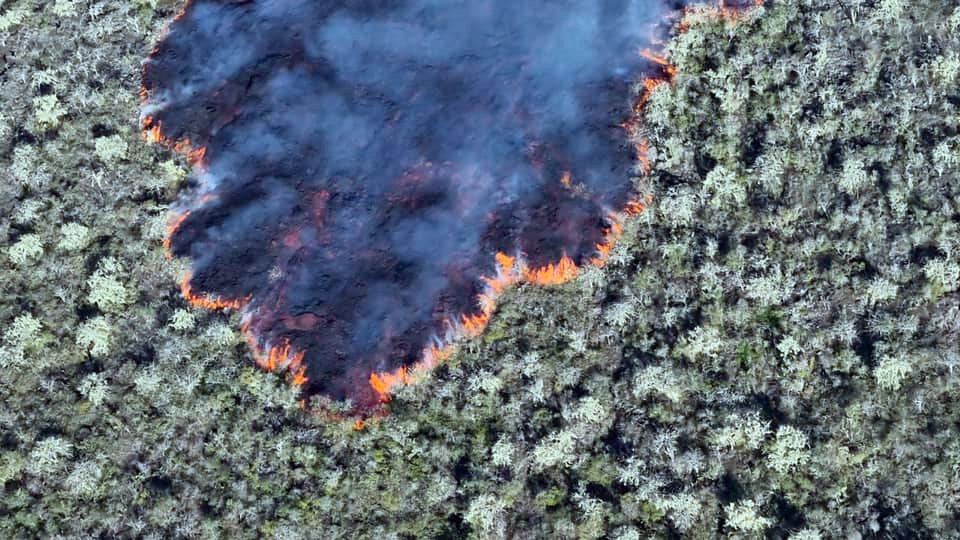 |
Figure 13. Lava flows descended the SE flank of Wolf on 7 January 2022, burning shrubs and grasses in their path. Courtesy of Parque Nacional Galápagos. |
The Washington VAAC issued its first report of ash emissions on 7 January 2022; plumes initially rose to two altitudes: 3.7 km drifting W, and 5.6 km altitude drifting NE. Later the plumes dropped to 2.4 km drifting W and 4.6 km drifting NE. The plume drifting to the W extended over 80 km. The VAAC noted reports of a large SO2 plume later in the day reaching approximately 185 km W of the summit before dissipating. By the next day, they reported that emissions were primarily gas, drifting W at 1.3 km altitude. During 8-9 January gas emissions drifted SW at 700 m altitude. By 9 January, only an SO2 plume was reported moving SW from the summit, and no further ash advisories were issued. Sulfur dioxide degassing decreased substantially from 60 million tons measured on 7 January to 8 million tons measured on 12 January (figure 14).
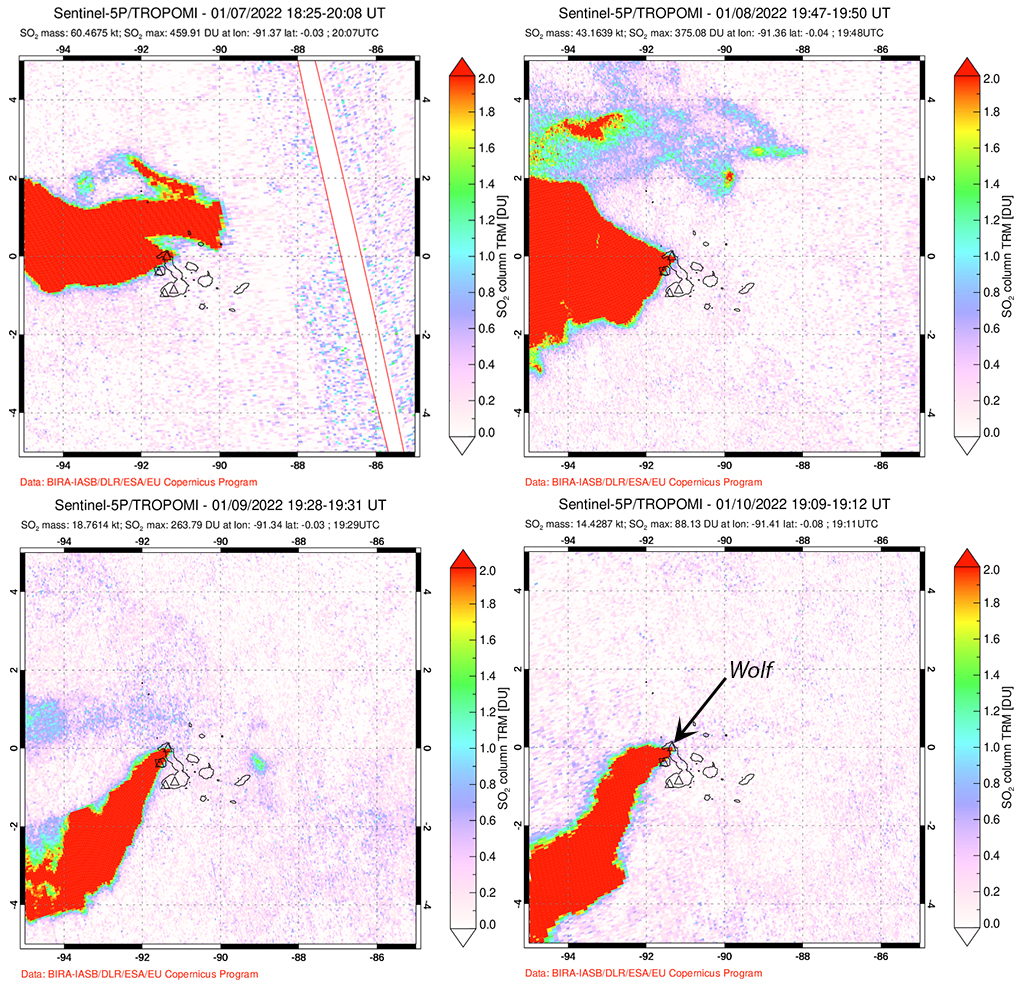 |
Figure 14. A large SO2 plume with a mass over 60 kilotons emerged from Wolf on 7 January 2022 at the beginning of the eruption as recorded by the TROPOMI instrument on the Sentinel-5P satellite. The mass decreased each subsequent day but remained very large for several days and measurable each day until early February 2022. Courtesy of NASA Global Sulfur Dioxide Monitoring Page. |
During a flyover on 11 January 2022, the Park Minister noted continuing volcanic activity, and that the flow had traveled about 15 km from its source on the SE flank. IG-EPN reported that the lava flow was emerging from at least three fissures. The initial fissure from 7 January was at 1,290 m elevation and the subsequent fissures were located at 1,090 m elevation. By 11 January the flow was about 3 km from the coast (figure 15). IG-EPN produced the first map of the 7.4 km2 flow on 12 January 2022 based on satellite data from 7 and 11 January (figure 16). The maximum length of the flow was estimated at 16.5 km from the initial vent, and 15 km from the two subsequent active fissures. The numbers of daily thermal alerts decreased steadily between 7 and 13 January, interpreted by IG-EPN as a decrease in the lava flow rate.
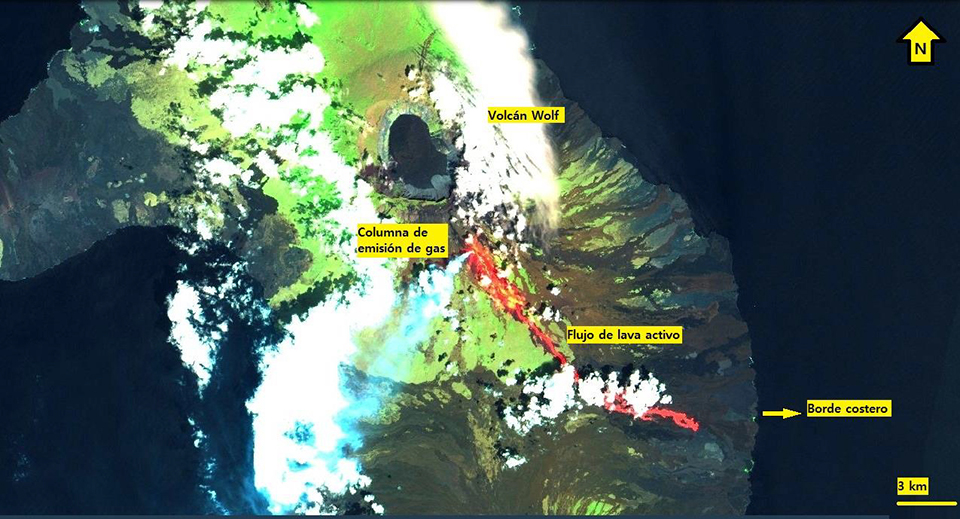 |
Figure 15. A Sentinel satellite image annotated by IG-EPN from 11 January 2022 showing gas emissions and the active lava flow at Wolf. Courtesy of IG-EPN, Informe Volcánico Especial – GALÁPAGOS – 2022 No. 02, Actualización de la actividad del volcán Wolf – Isla Isabela, Archipiélago de Galápagos, Quito, 13 de enero de 2022. |
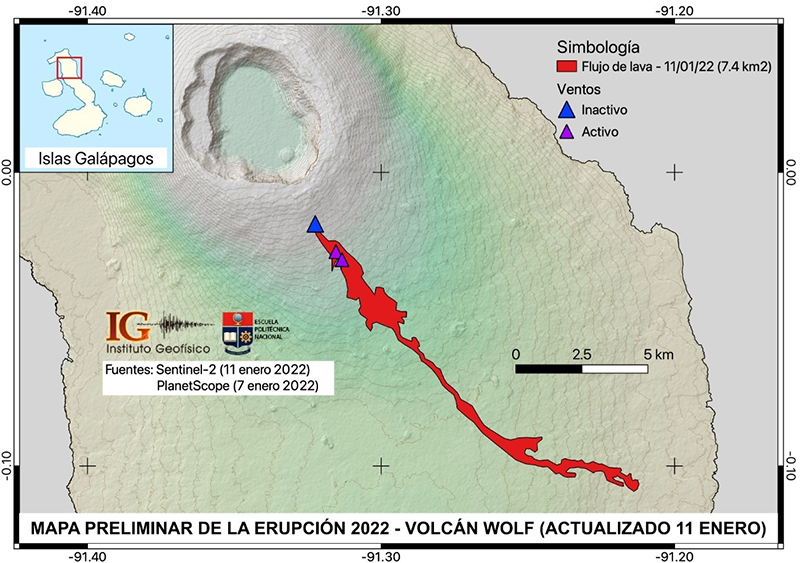 |
Figure 16. A preliminary map of the lava flow at Volcán Wolf on Isabela Island in the Galápagos as of 11 January 2022. The map was created from Sentinel-2 and PlanetScope satellite images. The flow covered an area of approximately 7.4 km2 and reached a maximum length of about 16.5 km. Courtesy of IG-EPN, Informe Volcánico Especial – GALÁPAGOS – 2022 – No. 02, Actualización de la actividad del volcán Wolf – Isla Isabela, Archipiélago de Galápagos, Quito, 13 de enero de 2022. |
By 17 January the lava flow had advanced to slightly more than 2 km from the ocean. By early February the active vent was downslope from the original vents, and IG-EPN was able to map multiple flow fronts on the S and SE flanks (figure 17). Multiple near-daily MODVOLC thermal alerts continued throughout February, with pulses of lava flow activity producing tens of alerts on some days. The lava flows remained active on the SE flank, slowly advancing towards the coast; satellite imagery helped IG-EPN scientists to map the track of the lava flow (figure 18).
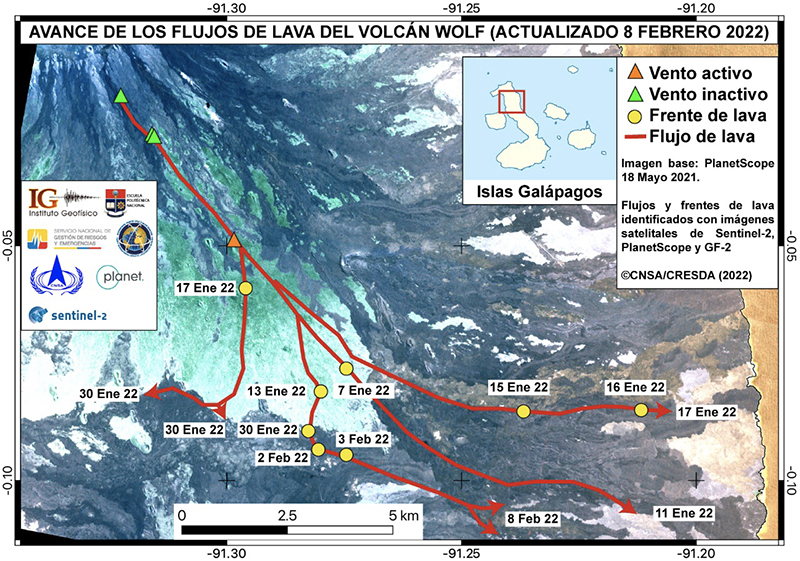 |
Figure 17. A map of the lava flow at Volcán Wolf as of 8 February 2022 shows the active flow fronts as of various dates (yellow dots, red arrows). The original, inactive vents are shown with a green triangle and the active vent as of that date is shown in orange. Courtesy of IG-EPN, INFORME DIARIO DEL VOLCAN WOLF No. 2022-034, Quito, miércoles 09 de febrero de 2022. |
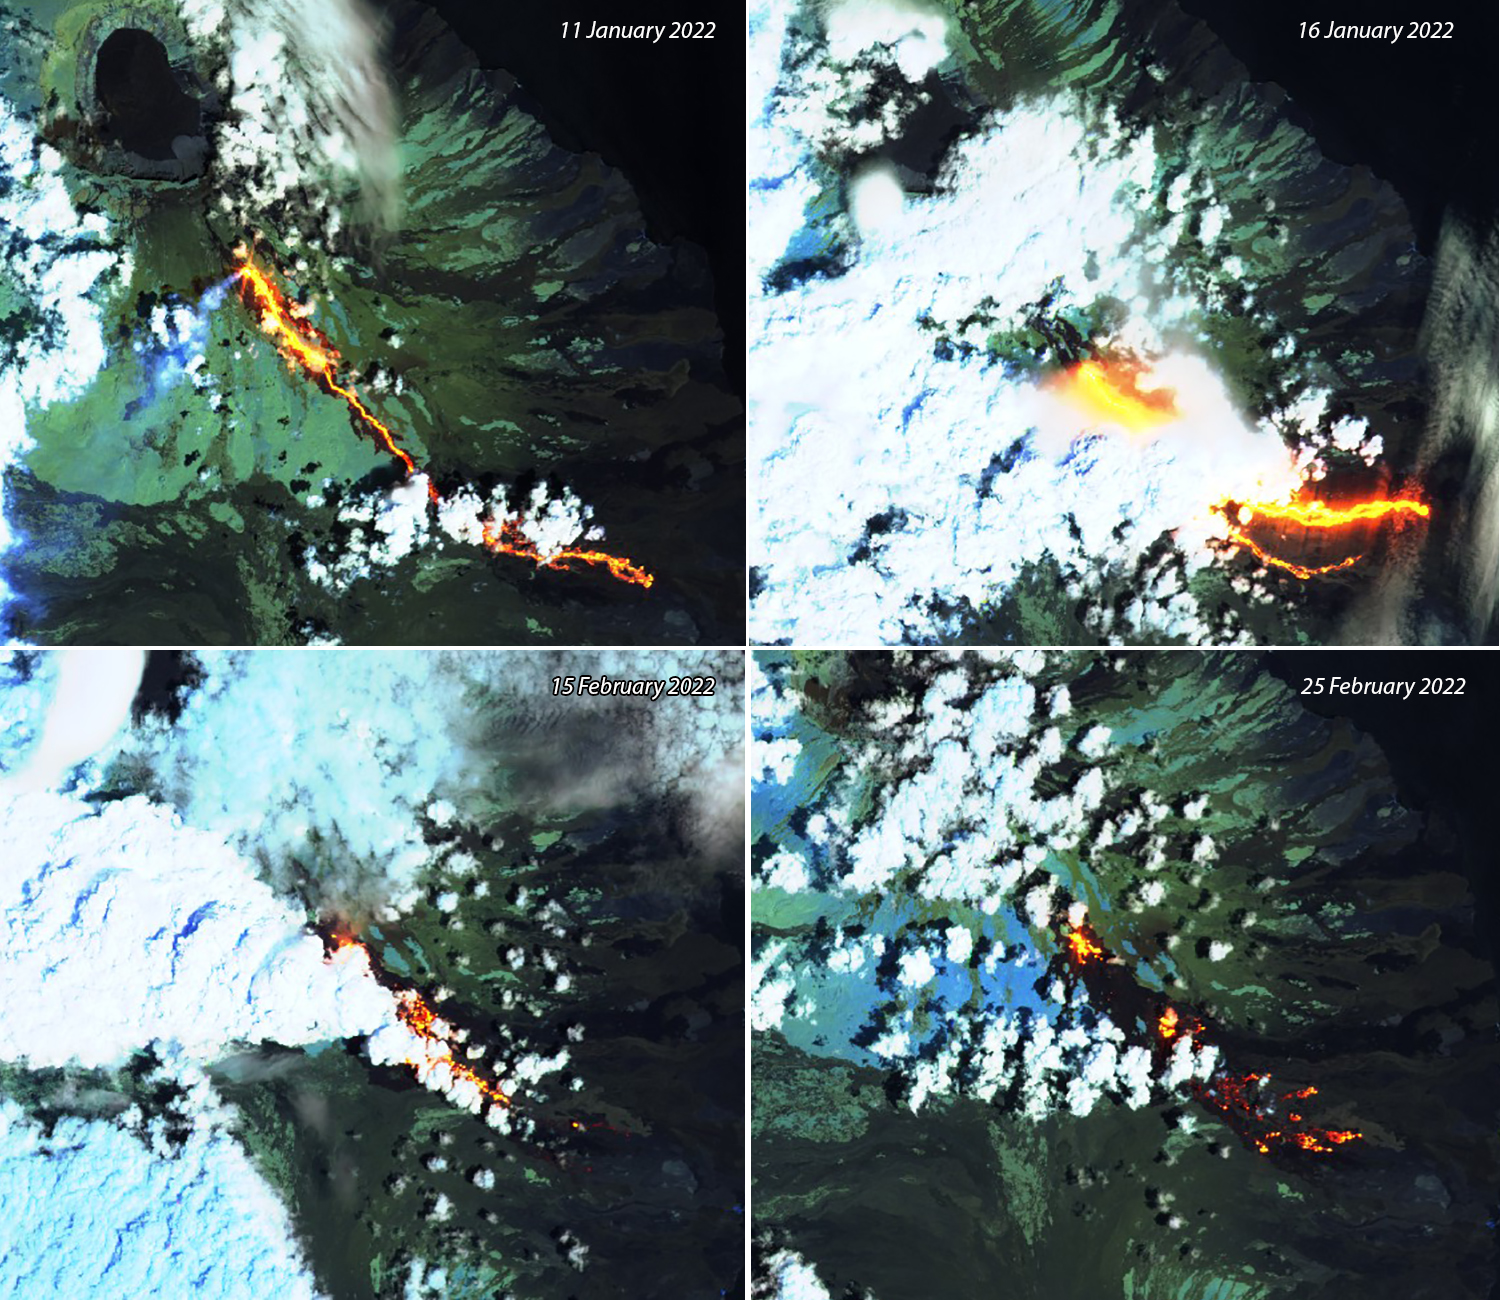 |
Figure 18. Sentinel-2 satellite imagery of Volcán Wolf from 11 and 16 January (top), and 15 and 25 February (bottom), show the active area of the lava flow changing over the first seven weeks of the eruption. Images use Atmospheric penetration rendering (bands 12, 11, 8a). Courtesy of Sentinel Hub Playground. |
Lava flows remained active on the SE flank throughout March 2022; IG-EPN scientists used the location of the FIRMS thermal anomalies to map the active areas of the flow over time (figure 19). By the end of March, the number of daily thermal alerts had diminished significantly, suggesting a further decrease in the flow rate. Parque Nacional Galápagos personnel reported at the end of March that lava flow activity continued on the SE flank but had not reached the ocean. Multiple hot spots in satellite images suggested that lava was flowing through tubes that were visible to the park rangers patrolling the coast.
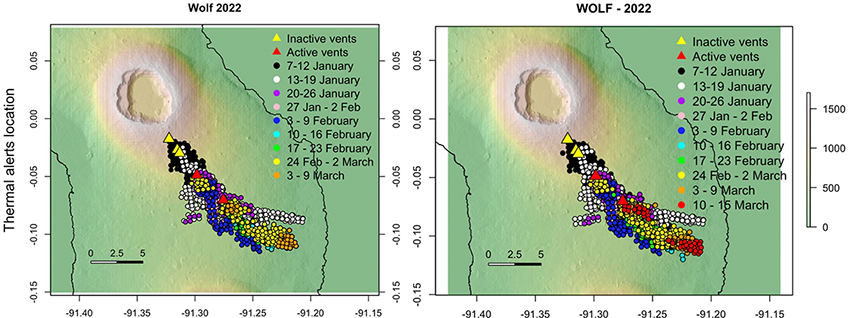 |
Figure 19. Maps of the advance of the lava flows at Volcán Wolf from 9 and 15 March 2022 show the progress of the different branches over time. Data is based on thermal anomalies reported by FIRMS. Courtesy of IG-EPN, INFORME DIARIO DEL VOLCAN WOLF No. 2022-062 and 2022-068, Quito, miércoles 09 y 15 de marzo de 2022. |
MODVOLC thermal alerts were issued on 13 days during April 2022, with the number of daily alerts significantly fewer than previous months since January. Thermal anomalies continued to be present in satellite imagery through 21 April, and then briefly on 29 and 30 April (figure 20). IG-EPN scientists plotted the advance of the flow as the location of thermal alerts on a satellite image base several times during April; no advance was detectible after 14 April (figure 21). No surface activity was observed after 21 April. An updated map of the lava flow was published on 20 April 2022 (figure 22). Single MODVOLC thermal alerts were issued on 3 and 7 May, and two alerts on 16 May were the last recorded for the eruption.
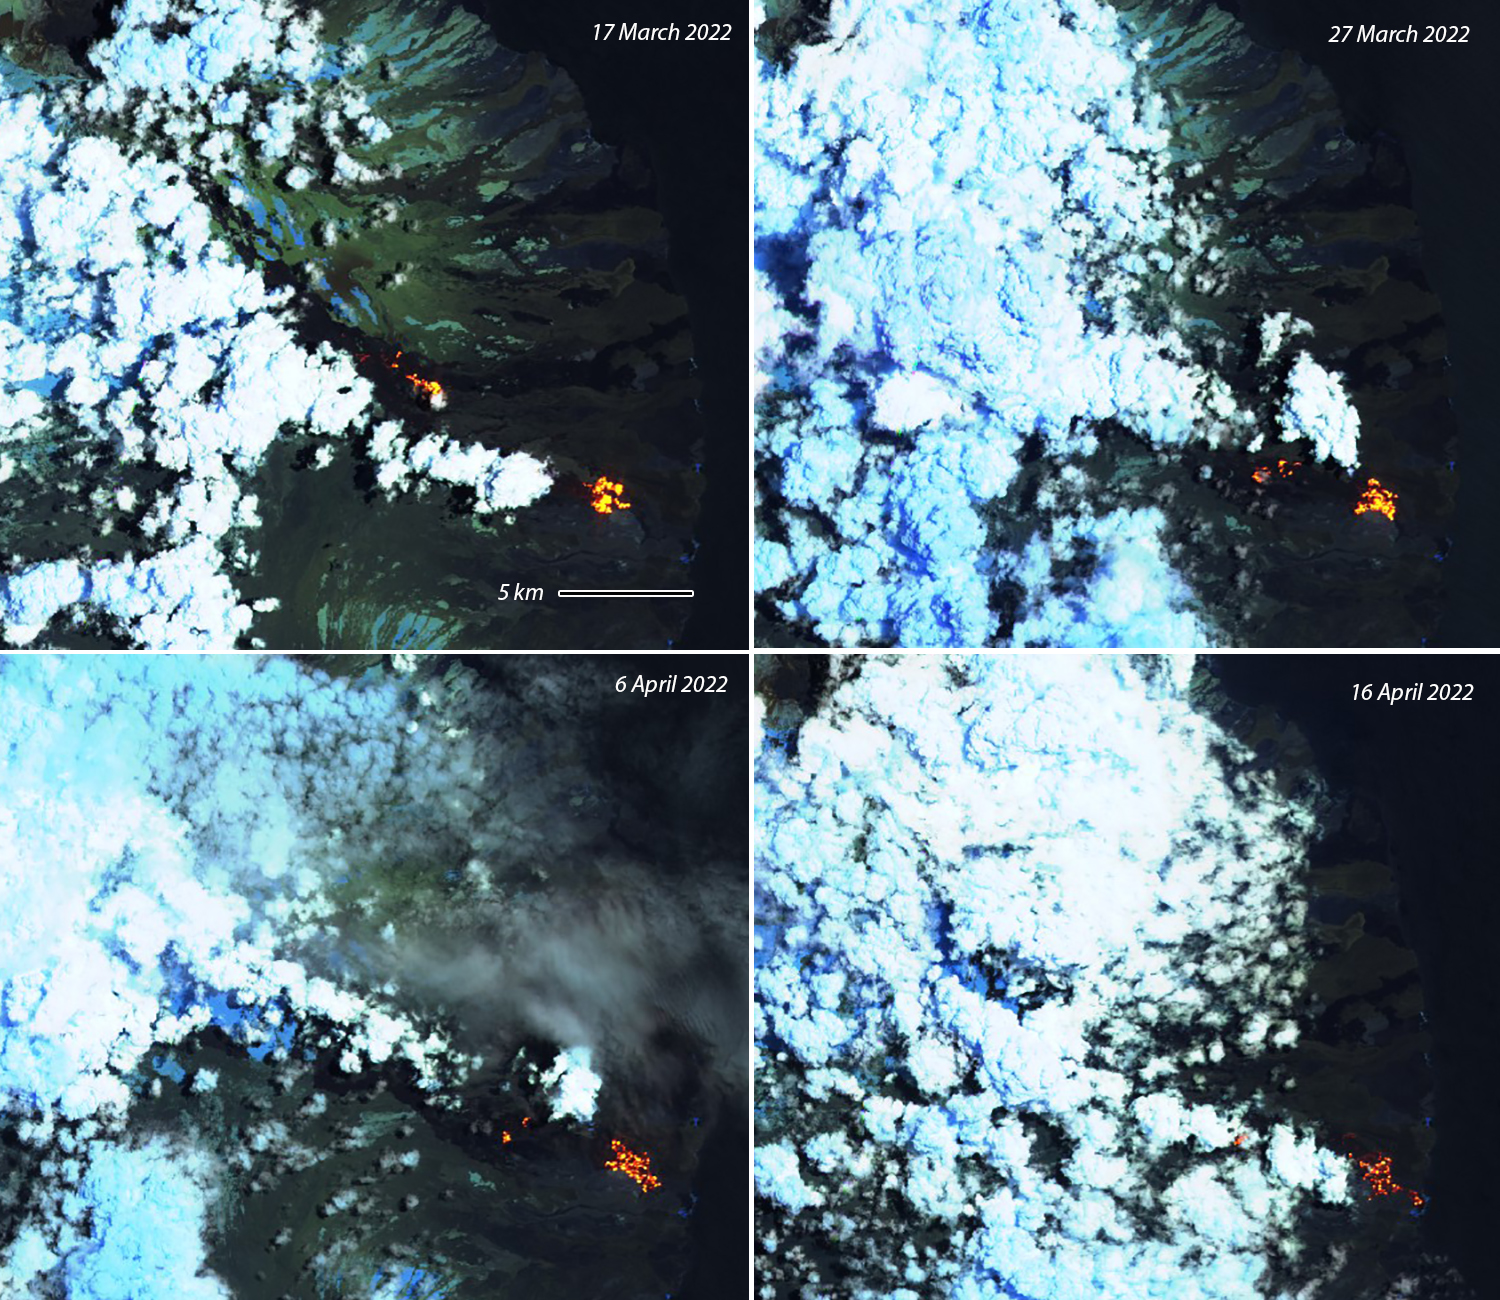 |
Figure 20. Thermal anomalies in Sentinel-2 satellite imagery of Volcán Wolf on 17 March, 27 March, 6 April and 16 April 2022 show the slow advance and decrease in thermal energy from the flow. Images use Atmospheric penetration rendering (12, 11, 8a). The summit crater in the upper left is about 4 km across. Courtesy of Sentinel Hub Playground. |
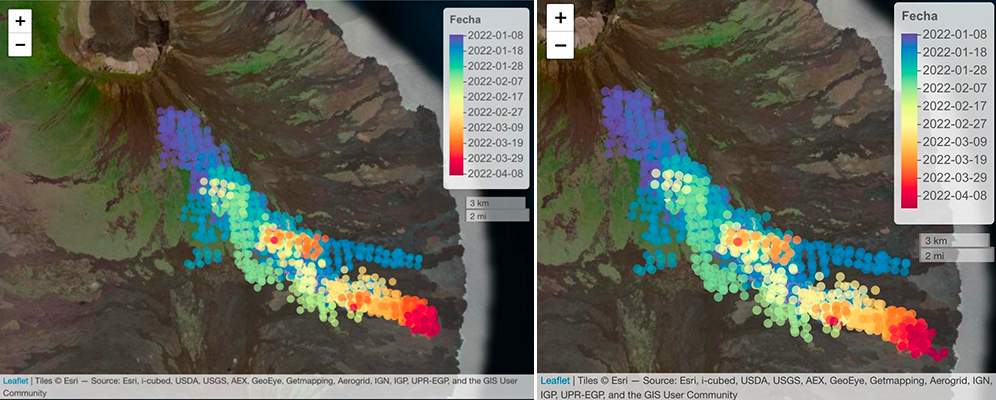 |
Figure 21. Maps from Volcán Wolf plot the advance of the thermal alerts through 8 April (left) and 14 April 2022 (right) on a satellite image base, indicating the decrease in flow. No further advances were mapped after 14 April. Courtesy of IG-EPN, INFORME DIARIO DEL VOLCAN WOLF No. 2022-092 and 2022-098, Quito, viernes 08 y 14 de abril de 2022. |
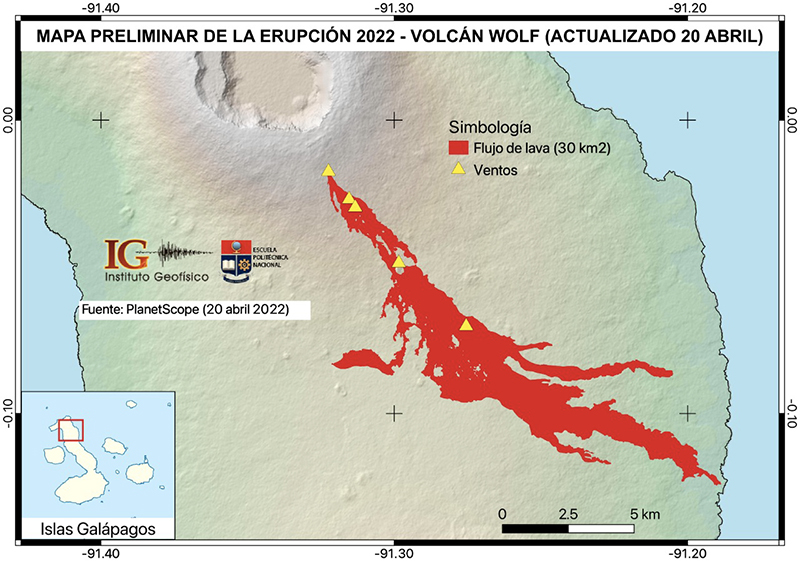 |
Figure 22. The preliminary map from 20 April 2022 of the lava flows emitted during the eruption of Volcán Wolf that began in January. The map was made based on satellite images from PlanetScope. The lava flows covered more than 30 km2, and the maximum length covered was approximately 18.5 km from the highest vent; the flow did not reach the coast. Courtesy of IG-EPN and F.J. Vasconez, INFORME ESPECIAL VOLCÁN WOLF No. 2022-003 APARENTE FINAL DEL PERIODO ERUPTIVO Quito, 05 de mayo de 2022. |
Eruption review using satellite data. Sulfur dioxide emissions that were initially as high as 60 kilotons, gradually tapered off during January and none were recorded in satellite data after early February (figure 23); they decreased steadily throughout the period and ended in early April (figure 24). Hundreds of thermal alerts from satellite data created rough maps of the 2015 and 2022 flow areas showing the difference in their relative locations. The 2015 flow started on the crater rim and flowed both into the crater and down the E flank and into the ocean, while the 2022 flow started about 1.5 km down the SE flank from the caldera rim and stopped a few hundred meters from the coastline (figure 25).
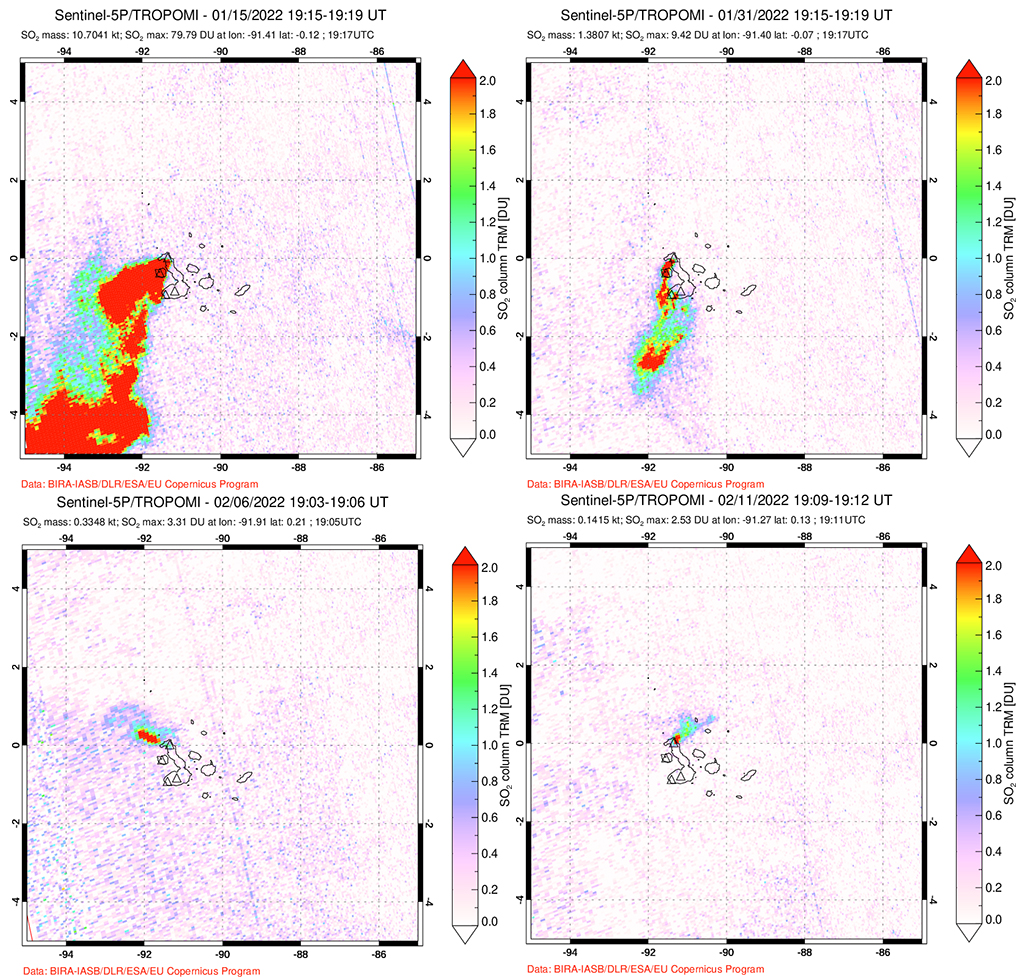 |
Figure 23. Sulfur dioxide emissions at Volcán Wolf decreased significantly after 15 January 2022, the last day where the mass of the SO2 plume exceeded 10 kilotons. Only very faint emissions were recorded by satellite instruments after early February. Courtesy of NASA Global Sulfur Dioxide Monitoring Page. |
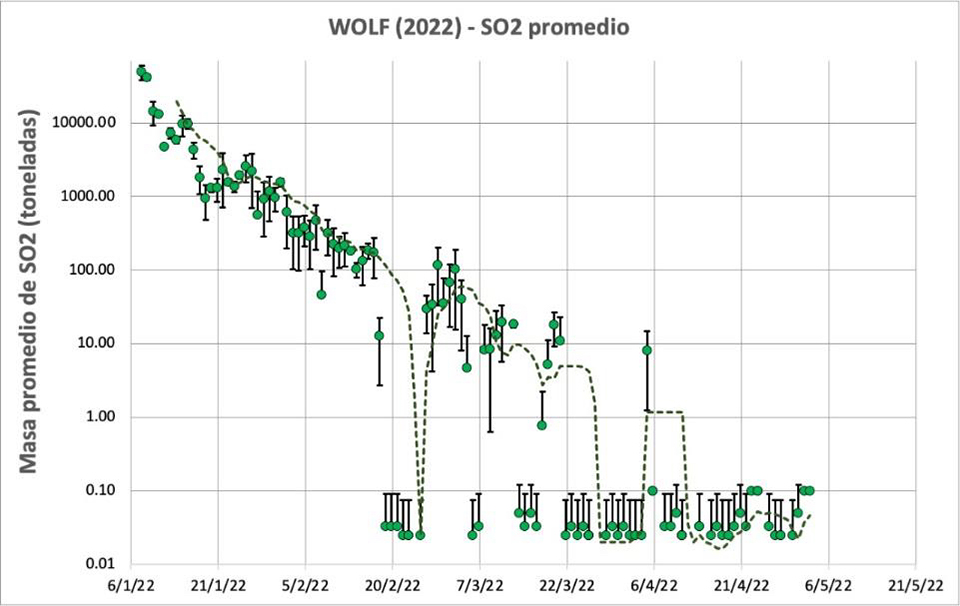 |
Figure 24. Sulfur dioxide emissions in tons per day for Volcán Wolf from 6 January through 2 April 2022. Data from Mounts and NASA (F.J. Vasconez). Courtesy of IG-EPN, INFORME ESPECIAL VOLCÁN WOLF No. 2022-003 APARENTE FINAL DEL PERIODO ERUPTIVO Quito, 05 de mayo de 2022. |
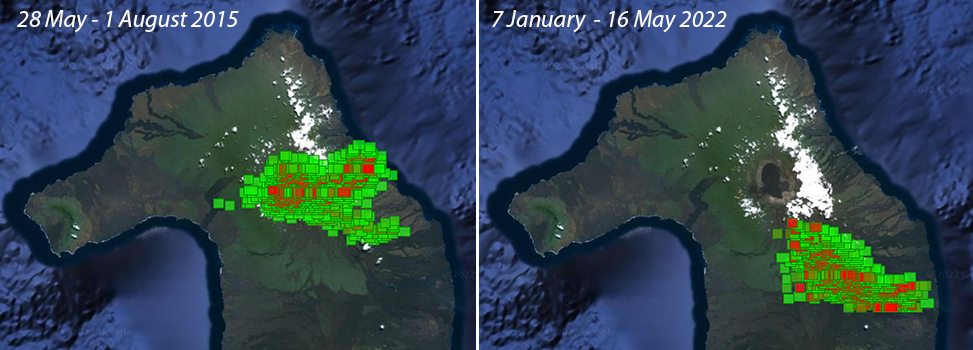 |
Figure 25. The MODVOLC thermal alerts plotted on a Google Earth base from eruptions at Wolf during 2015 (left) and 2022 (right) show how the thermal alerts roughly outline the area affected by lava flows. Lava during the 2015 eruption effused from the crater rim and flowed into crater and down the E flank into the ocean. The 2022 flow started about 1.5 km down the SE flank from the caldera rim and traveled about 18.5 km before stopping a few hundred meters from the coastline. Courtesy of MODVOLC. |
The MIROVA Log Radiative Power graph of MODIS data shows the onset of the eruption in early January 2022 with high levels of heat initially, followed by a period with more fluctuations, and then a period of gradual decrease through mid-April 2022 before dropping off quickly to low levels (figure 26). The MIROVA distance graph based on the central caldera location shows how the lava flow initially quickly extended 10 km beyond SE-flank vent location, was then restricted to higher on the flank, and then gradually moved farther away over time.
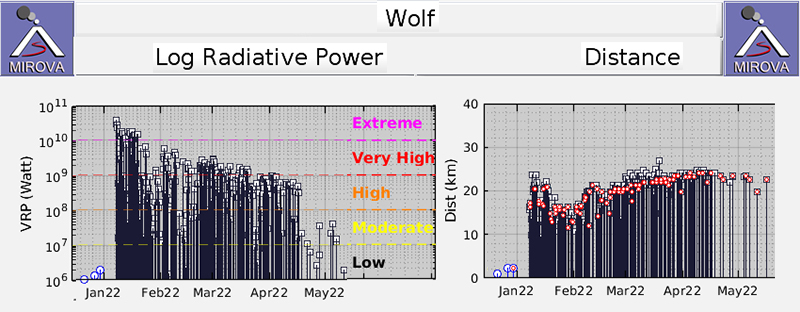 |
Figure 26. The MIROVA data shows both the intensity of the Radiative Power (left) and the distance from the summit of the volcano (right). The graph of Log Radiative Power from December 2021 through May 2022 shows the onset of the eruption in early January 2022 followed by an overall decrease in heat emissions. The Distance graph of the eruption shows the onset of activity more than 10 km from the caldera center, then activity higher up the flank and gradually moving farther away as the eruption continued. Courtesy of MIROVA. |
IG-EPN scientists plotted the hundreds of daily thermal alerts recorded by different satellite sensors such as MODIS (Moderate Resolution Imaging Spectroradiometer) and VIIRS (Visible Infrared Imaging Radiometer Suite), which are processed by different platforms (e.g., MIROVA , FIRMS, WORLDVIEW). The plot indicated a decreasing trend in thermal alerts, in both quantity and intensity from the beginning of the eruption in early January 2022 through the end of April (figure 27). This decrease reflected the decline in the rate of lava emission, as well as the progressive cooling of the lava flows.
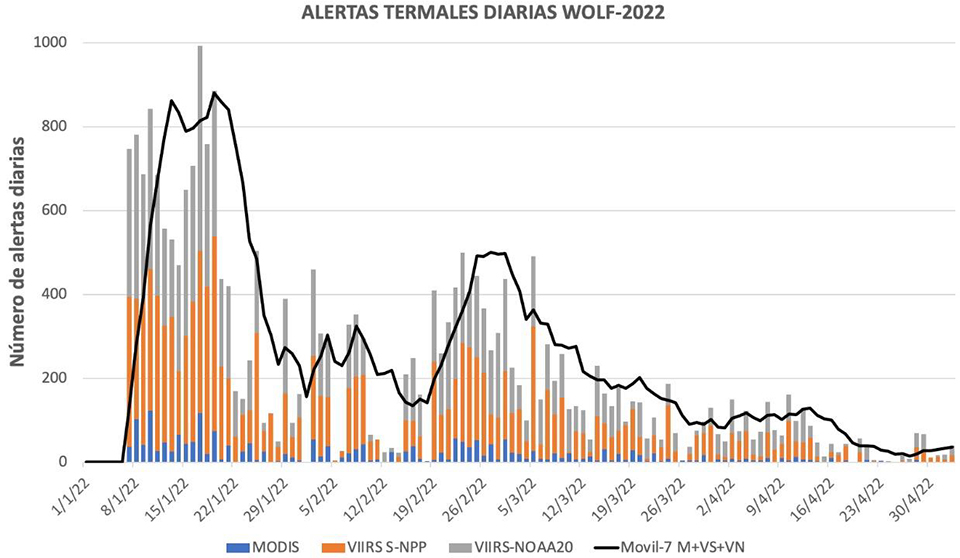 |
Figure 27. A time series plot of thermal alerts from several different instruments for Volcán Wolf from January through April 2022 has a moving average of 7 days plotted as a black line over the primary data. After an initial peak at the start of the eruption, the activity gradually decreases through the end of April (F.J. Vasconez). Courtesy of IG-EPN, INFORME ESPECIAL VOLCÁN WOLF No. 2022-003, APARENTE FINAL DEL PERIODO ERUPTIVO Quito, 05 de mayo de 2022. |
Information Contacts: Instituto Geofísico, Escuela Politécnica Nacional (IG-EPN), Casilla 17-01-2759, Quito, Ecuador (URL: http://www.igepn.edu.ec/); Parque Nacional Galápagos (URL: https://galapagos.gob.ec/noticias/, https://www.facebook.com/parquegalapagos/posts/290645263104217); Hawai'i Institute of Geophysics and Planetology (HIGP) - MODVOLC Thermal Alerts System, School of Ocean and Earth Science and Technology (SOEST), Univ. of Hawai'i, 2525 Correa Road, Honolulu, HI 96822, USA (URL: http://modis.higp.hawaii.edu/); MIROVA (Middle InfraRed Observation of Volcanic Activity), a collaborative project between the Universities of Turin and Florence (Italy) supported by the Centre for Volcanic Risk of the Italian Civil Protection Department (URL: http://www.mirovaweb.it/); Sentinel Hub Playground (URL: https://www.sentinel-hub.com/explore/sentinel-playground); NASA Global Sulfur Dioxide Monitoring Page, Atmospheric Chemistry and Dynamics Laboratory, NASA Goddard Space Flight Center (NASA/GSFC), 8800 Greenbelt Road, Goddard MD 20771, USA (URL: https://so2.gsfc.nasa.gov/); Washington Volcanic Ash Advisory Center (VAAC), Satellite Analysis Branch (SAB), NOAA/NESDIS OSPO, NOAA Science Center Room 401, 5200 Auth Rd, Camp Springs, MD 20746, USA (URL: www.ospo.noaa.gov/Products/atmosphere/vaac, archive at: http://www.ssd.noaa.gov/VAAC/archive.html).
2022: January
| February
| March
| April
| May
2015: May
On 5 May IG reported that the eruption at Wolf’s SE flank was over. The eruption began at 2320 on 6 January from an approximately 8-km-long radial fissure, trending NW-SE, that had at least five active vents. Lava flows from the vents traveled SE then E, covering an area of more than 30 square kilometers. The maximum length of the flow field was 18.5 km, with the farthest-reaching flow stopping 150-200 m from the coastline. The highest levels of heat, sulfur dioxide emissions, seismicity, and deformation were recorded in the early days of the eruption. Sulfur dioxide emissions had been absent for the previous 30 days.
Source: Instituto Geofísico-Escuela Politécnica Nacional (IG-EPN)
IG reported that thermal anomalies over Wolf were periodically identified in satellite images during 26 April-3 May, indicating active lava flows.
Source: Instituto Geofísico-Escuela Politécnica Nacional (IG-EPN)
IG reported that thermal anomalies over Wolf were periodically identified in satellite images during 19-26 April, though were absent on several of the days. Lava advancement was identified in images during 19-21 April; no surface activity was visible the rest of the week.
Source: Instituto Geofísico-Escuela Politécnica Nacional (IG-EPN)
IG reported that the eruption at Wolf continued during 13-18 April. Lava flows continued to advance towards the coast based on thermal data; satellite images showed minor advancement during 11-16 April and the end of the flow near the coastline.
Sources: Instituto Geofísico-Escuela Politécnica Nacional (IG-EPN); Sentinel Hub
IG reported that the eruption at Wolf continued during 5-12 April. Minor sulfur dioxide emissions were recorded during 5-6 April. Thermal data captured and mapped on 6 April indicated that lava flows were getting closer to the coast; daily thermal alert counts, as many as around 154, indicated active and advancing lava flows during the rest of the week.
Source: Instituto Geofísico-Escuela Politécnica Nacional (IG-EPN)
IG reported that the eruption at Wolf continued during 30 March through 5 April. Daily thermal alert counts, as many as around 145, indicated active and advancing lava flows.
Source: Instituto Geofísico-Escuela Politécnica Nacional (IG-EPN)
IG reported that the eruption at Wolf continued during 22-29 March. Daily thermal alert counts, as many as around 200, indicated active and advancing lava flows on the SSE flank.
Source: Instituto Geofísico-Escuela Politécnica Nacional (IG-EPN)
IG reported that the eruption at Wolf continued during 15-22 March. Daily thermal alert counts, as many as around 176, indicated active and advancing lava flows on the SSE flank.
Source: Instituto Geofísico-Escuela Politécnica Nacional (IG-EPN)
IG reported that the eruption at Wolf continued during 8-15 March. Daily thermal alert counts, as many as around 230, indicated active and advancing lava flows on the SSE flank. Diffuse sulfur dioxide gas plumes were detected in satellite data almost daily.
Source: Instituto Geofísico-Escuela Politécnica Nacional (IG-EPN)
IG reported that the eruption at Wolf continued during 1-8 March. Daily thermal alert counts, as many as 125, indicated active and advancing lava flows on the SSE flank.
Source: Instituto Geofísico-Escuela Politécnica Nacional (IG-EPN)
IG reported that the eruption at Wolf continued during 23 February-1 March. Daily thermal alert counts, as high as around 253, indicated active and advancing lava flows on the SE flank.
Source: Instituto Geofísico-Escuela Politécnica Nacional (IG-EPN)
IG reported that the eruption at Wolf continued during 15-22 February. Daily thermal alert counts, as high as around 250, indicated active and advancing lava flows on the SE flank.
Source: Instituto Geofísico-Escuela Politécnica Nacional (IG-EPN)
IG reported that the eruption at Wolf continued during 8-15 February. Daily thermal alert counts, anywhere from a few to over three hundred, indicated active and advancing lava flows on the SE flank.
Source: Instituto Geofísico-Escuela Politécnica Nacional (IG-EPN)
IG reported that the eruption at Wolf continued during 1-8 February. Daily thermal alert counts, anywhere from a few to well over two hundred, indicated active and advancing lava flows on the SE flank. Gas emissions were identified in satellite images on most days.
Source: Instituto Geofísico-Escuela Politécnica Nacional (IG-EPN)
IG reported that the eruption at Wolf continued during 26 January-1 February. Daily thermal alert counts, anywhere from a few to well over one hundred, indicated advancing lava flows on the SE flank.
Source: Instituto Geofísico-Escuela Politécnica Nacional (IG-EPN)
IG reported that the eruption at Wolf continued during 18-25 January. Daily thermal alerts counts were in the hundreds, centered over the advancing lava flows on the SE flank. Diffuse gas emissions were visible drifting SW during 18-20 January. Activity levels were stable during the beginning of the week then began to trend downward by 21 January.
Source: Instituto Geofísico-Escuela Politécnica Nacional (IG-EPN)
On 13 January IG reported that the eruption at Wolf was continuing, but at decreasing levels. Lava from at least three fissures had traveled about 16.5 km SE, and covered an estimated 7.4 square kilometers, but had not reached the coast. Daily counts of thermal anomalies were in the hundreds but had progressively decreased in quantity and intensity in recent days, interpreted as a decrease in the effusion rate and cooling flows. Notices of ash-and-gas plumes were issued by the Washington VAAC on 7-8 January, noting that plumes decreased from 2.6 km to 300 m above the vent. Additionally, sulfur dioxide emissions decreased from 60,000 tons per days recorded on 7 January to 8,100 tons per day on 12 January. Seismicity also trended downward.
Source: Instituto Geofísico-Escuela Politécnica Nacional (IG-EPN)
IG reported that a seismic swarm at Wolf began at 2100 on 6 January, followed by a M 2.4 earthquake recorded at 2135, and tremor at 2315. Fissures opened in an area SE of the summit caldera within five minutes of the onset of tremor and a new eruption began. At 0020 on 7 January satellite images showed ash-and-gas plumes rising to varying altitudes between 1.9 km (6,200 ft) and 3.8 km (12,500 ft) a.s.l., with the lower parts of the plume drifting NE and the higher parts drifting W. Thermal anomalies indicated advancing lava flows down the S and SE flanks. The Parque Nacional Galápagos and the Galapagos Conservancy evacuated eight people by helicopter, including park rangers and scientists that were working near the rim, as a precaution and noted that habitat for a population of critically endangered Pink Land Iguana was far from the eruption. Photos showed a line of lava fountains rising along the fissure and lava flows advancing over vegetation. Thermal anomalies continued to indicate advancing lava during 8-11 January. Plumes mostly consisting of gas rose as high as 1.3 km (4,300 ft) a.s.l. and drifted W and SW. The lava flows were not far from the ocean by 10 January. Photos posted on 11 January by Parque Nacional Galápagos showed lava fountaining at a growing cone and fluid lava flows advancing from the base of the cone. The lava flows had traveled 15 km SE, then E, by 11 January.
Sources: Instituto Geofísico-Escuela Politécnica Nacional (IG-EPN); Parque Nacional Galápagos; Galapagos Conservancy
IG reported that the eruption at Wolf that began on 25 May continued through 2 June. Lava flows first reached the sea on 28 May. During an overflight on 29 May scientists observed a gas plume rising 2-3 km above the volcano and drifting NW, and smelled a strong sulfur odor. Active lava flows descended the E and NE flanks; cloud cover prevented views of the other areas but thermal images showed anomalies from lava flows on the SE and S flanks. The sulfur dioxide emission rate was 40,600 tons per day based on data collected during the flight. Satellite data collected since the beginning of the eruption indicated very minimal ash present in the plume. In addition, no ashfall was reported in the Galapagos Islands. The report also noted that activity had decreased during the recent few days.
Source: Instituto Geofísico-Escuela Politécnica Nacional (IG-EPN)
According to IG the seismic station located on Fernandina Island recorded several events at Wolf (on Isabela Island) starting at 2350 on 24 May. The most significant signal occurred at 0058 on 25 May, corresponding to an explosion and the start of an eruption. At 0215 the Washington VAAC detected an ash plume that rose to an altitude of 10.7 km (35,000 ft) a.s.l. and drifted 65 km SW. At 0345 one ash plume drifted 250 km ENE at an altitude of 15.2 km (50,000 ft) a.s.l., and another drifted 250 km S at an altitude of 13.7 km (45,000 ft) a.s.l. Starting at 0428 the Hawai'i Institute of Geophysics and Planetology (HIGP) reported intense thermal anomalies on Wolf's SE flank based on MODIS satellite data. Galapagos National Park staff reported an arcuate fissure along the upper SSE rim and several lava flows descending the flanks. Later that day the VAAC noted a smaller ash emission that drifted 150 km SW, and a bright thermal anomaly that had persisted. Satellites detecting sulfur dioxide showed that the cloud was sulfur-dioxide rich and ash poor; ~100-200 kt of sulfur dioxide had been emitted during the first 13 hours of the eruption.
Sources: Instituto Geofísico-Escuela Politécnica Nacional (IG-EPN); Washington Volcanic Ash Advisory Center (VAAC); Galapagos Conservancy; Simon Carn; Hawai'i Institute of Geophysics and Planetology (HIGP) Thermal Alerts Team
Reports are organized chronologically and indexed below by Month/Year (Publication Volume:Number), and include a one-line summary. Click on the index link or scroll down to read the reports.
Aerial reconnaissance shows caldera unchanged
Card 1249 (07 July 1971) Aerial reconnaissance shows caldera unchanged
Information Contacts: Educational Expeditions International Research Team, Galapagos Islands, Ecuador; T. Simkin, SI.
Earthquake swarm near Isla Isabella
Card 1588 (21 March 1973) Earthquake swarm near Isla Isabella
A small earthquake swarm took place in the Galapagos Islands in late January 1973. The Charles Darwin Research Station reported 57 events on its seismograph (GIE) from 23 through 28 January and estimated an epicentral distance of 110-160 km. The NOS/NOAA National Earthquake Information Center has located hypocenters for three events (Mb 4.4 and 4.5). These fit the Research Station's estimates, and are 15 km E, 26 km E, and 5 km SW of the center of Wolf, Isla Isabella. Dr. John Filson reports additional events (Mb 4.0-4.3) detected by LASA on 16 January and 18 February; the latter events are confirmed by NOS/NOAA but reliable hypocenters have not yet been located. The Charles Darwin Research Station reports no visible activity associated with this earthquake swarm.
Information Contacts: R. Sievers, Charles Darwin Research Station, Galapagos Islands, Ecuador; W. Person, U.S. National Earthquake Information Center; J. Filson, Massachusetts Institute of Technology; T. Simkin, SI.
Park wardens hear strong and constant rumbling from the caldera
Card 1749 (30 November 1973) Park wardens hear strong and constant rumbling from the caldera
"Galapagos National Park Wardens on W flank of Wolf two weeks ago heard strong and constant rumbling from caldera. The roar could be heard at the coast 6 km from the caldera rim and continued through the night. No reports of eruptive cloud, but clouds frequently obscure summit and volcano cannot be seen from inhabited parts of the archipelago. Darwin Station seismograph reports no unusual activity, but earthquake swarm early this year (see Event Card 1588) appeared centered on the SE flank of Wolf, the site of the last, largest (Mb 4.9), and best-located event on 19 March 1973. Darwin Station party is en route to investigate and SKYLAB will photograph.
"The last recorded eruptions of this, the northernmost shield volcano on the largest Galapagos Island, were on the SE flank in 1948 and 1963. The equator crosses the S end of the caldera at 91.3°W and the rim is 6 km in diameter, 1,710 m above the sea, and 670 m above the caldera floor. Reports of Galapagos volcanism in early August of this year appear to have been influenced by NASA press release on successful SKYLAB photography of 'Galapagos Eruptive Centers.' No Galapagos eruption was sighted by SKYLAB II but shortly after the press release emerged from Ecuadorian newspapers clouds and lights were reported from the volcano at Cape Berkeley, NW Isabella. These reports have been investigated on the volcano by Darwin Station personnel and no evidence of an August eruption has been found. The only other Galapagos volcanism known since the 1968 Fernandina caldera collapse is the 1972 Fernandina eruption reported in June of this year (Event Card 1659). . . ."
Information Contacts: Peter Kramer, Charles Darwin Research Station, Galapagos Islands, Ecuador; Tom Simkin, SI.
Thermal anomalies, but no confirmed activity
Card 1752 (13 December 1973) Space-based observations of activity
Observations from space... support previous indication of eruption on Wolf (Event Card 1749), and suggest strong thermal activity on Darwin. . . . NOAA-2 [satellite imagery] shows additional hot spots on E flank of Wolf . . . .
Card 1757 (17 December 1973) Infrared hot-spot probably not eruption related
Close inspection of NOAA-2 imagery shows hot spots reported on Event Card 1752 coincide with caldera floors, not outer flanks, and can probably be explained by normal daytime temperature differences. . . . Darwin Station party "saw nothing on Wolf" but gave no further details on that eruption (Event Card 1749).
Information Contacts:
Card 1752 (13 December 1973) F. Parmenter, NOAA; M. McEwen, NASA; J. Filson, MIT; T. Simkin, SI.
Card 1757 (17 December 1973) A. Krueger and F. Parmenter, NOAA; J. Filson, MIT; P. Kramer, Darwin Research Station; T. Simkin, SI.
Lava fountaining and flows in caldera and on SE flank
Eruption clouds began to emerge from the volcano during the afternoon of 28 August. Plume emission was first detected on visible band satellite images between 1300 and 1400, and feeding continued until nightfall. The plume, which drifted W, could not be seen on infrared imagery, indicating that it remained at low altitudes. Observers on a tour ship first saw clouds issuing from the summit about 1430-1500 and reported strong summit glow that night. Activity on the SE flank was first observed at 0830 the next morning, but heavy weather clouds had obscured this area the previous afternoon, and flank vents may have been active then as well.
Tui DeRoy Moore and others arrived at the SE flank late 31 August. Lava fountained from a radial fissure that extended 1 km or more downslope from 875 m altitude. Fresh lava covered the area near the fissure. Lava flowed SE then turned toward the E, reaching about 280 m altitude. This flow had stopped advancing by 1 September and fountaining had ended by that evening, although some SE flank glow remained visible. As the flank activity declined, summit activity increased. Summit glow had been visible since 28 August, but strengthened during the night of 1-2 September and a large convecting cloud was present over the caldera. Moore reached the caldera rim on 3 September and found several vents active in the caldera, the strongest on its floor at the base of the steep SW wall. Lava fountaining from this vent was continuous and the fountains occasionally rose as high as the caldera rim, approximately 700 m above the floor. Intermittent, relatively weak fountaining (less than 50 m estimated height) occurred from four small vents along a 100-200-m-long fissure on the S caldera floor. Thick-looking pahoehoe lava covered slightly more than half of the caldera floor, or approximately 6 km2, and was mainly on the N and NW side. Gases emerging from the base of the convecting eruption cloud formed a haze that drifted W, away from the observers. By early 4 September, when Moore left the volcano, a cone had begun to form around the main vent. Activity appeared to be dominated by scoria ejection, with little lava being added to the caldera floor flows. No earthquakes were felt by the observers, and Moore reported that there seemed to be little effect on the flora and fauna. Glow was still visible in the eruption cloud late 5 September and airplane passengers saw a strong plume 6 September.
Wolf has been one of the more active Galápagos volcanoes. Flank eruptions from the same SE vent area took place in 1948 and 1963, but summit caldera activity had not been documented since 1800. A probable SE flank eruption was heard but not seen in 1973. The present eruption is a two-hemisphere event, with the caldera lying mostly N of the equator and the SE vent, less than 10 km distant, in the Southern Hemisphere.
Further Reference. Schatz, H., and Schatz, I., 1983, Der ausbruch des Vulkanes Wolf (Inseln Isabela, Galápagos-Inseln Ecuador) im Jahre 1982—Ein Augenzeugenbericht; Ber. Nat. Med. Verein Innsbruck; v. 70, p. 17-28.
Information Contacts: T. Moore, Isla Santa Cruz, Galápagos.
Explosion on 25 May 2015; lava flows down the E and SE flanks, and into the caldera
The first documented historical eruption in the Galapagos was at Wolf in 1797, and basaltic lava flows have spilled down its flanks a number of times since then. The most recent previous eruption began with an ash plume on 28 August 1982, and continued with lava fountains and flows from a fissure on the SE flank and inside the summit caldera into the first weeks of September 1982 (SEAN 07:08).
Volcan Wolf erupted with a 15-km-high plume of mostly water vapor and SO2 on 25 May 2015. This was followed by the emission of lava flows from a fissure on the SE edge of the caldera down the NE, E, and SE flanks to the ocean for several weeks. Beginning on 13 June, the first lava flows were observed within the crater, and flows down the outer flanks decreased. Lava flows were also observed within the crater via satellite in late June, and strong daily thermal anomalies from the crater continued through 4 July before tapering off.
The volcanoes on the Galapagos Islands are monitored by the Geophysical Institute of the National Polytechnic School (IG-EPN) in Quito, Ecuador, and the Washington Volcanic Ash Advisory Center (VAAC) is responsible for aviation warnings. IG maintains a broadband seismic network and a DOAS (Differential Optical Absorption Spectrometer) SO2 monitoring station on the islands that transmits data to the mainland.
Ecuador's Instituto Geofisico (IG) reported that its seismic station FER1, located on Fernandina Island approximately 38 km SW of Wolf, began recording seismic events in the vicinity of Wolf at 2350 (local Galapagos time) on 24 May 2015. The most significant signal occurred at 0058 on 25 May, corresponding to an explosion and the start of an eruption. This was followed by other smaller seismic events in the following hours. At 0215 local time the Washington VAAC detected a plume that rose to an altitude of 10.7 km and drifted 65 km SW. Ongoing emissions at 0345 were drifting in two directions, S at 13.7 km altitude and ENE as high as 15.2 km. By 0600 the plumes were observed 250 km from the volcano. Later in the day at 1245 a remnant of the original plume was observed 186 km SSE of the summit, while a new emission at 10.7 km was detected 150 km SW. There was no report of ashfall in the Galapagos Islands, leading IG scientists to infer a low ash content for the plume, although a large SO2 plume was identified by satellite instruments.
At first light, personnel from the Galapagos National Park (PNG) were able to photograph the plume and a lava flow erupting from a fissure on the SSE flank (figure 1). A strong thermal anomaly on the SE flank was also detected in MODIS data analyzed by the Hawai'i Institute of Geophysics and Planetology (HIGP) MODVOLC system early on 25 May, and grew stronger in subsequent days. A very strong SO2 plume, eventually releasing around 200 kt of sulfur dioxide, was also captured by the Aura/OMI satellite SO2 instrument on 25 and 26 May (figure 2).
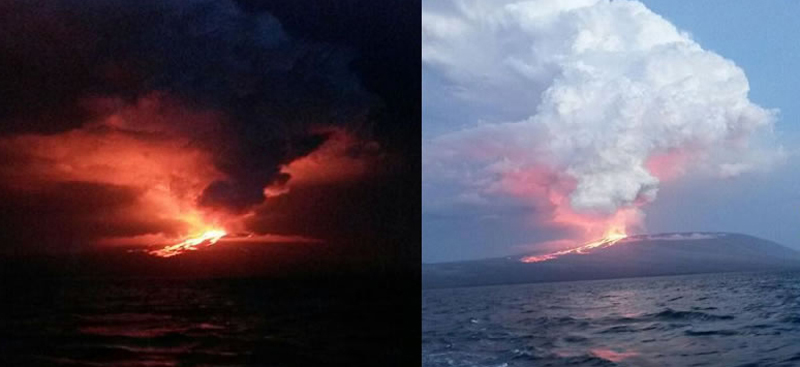 |
Figure 1. The first images of the eruption taken in the early morning on 25 May 2015 show lava flowing down the SSE flank of Wolf. Courtesy of Dr. Galo Quezada, Galapagos National Park (PNG) (IG-EPN, Informe Volcanico Especial Galapagos No. 2, 25 May 2015). |
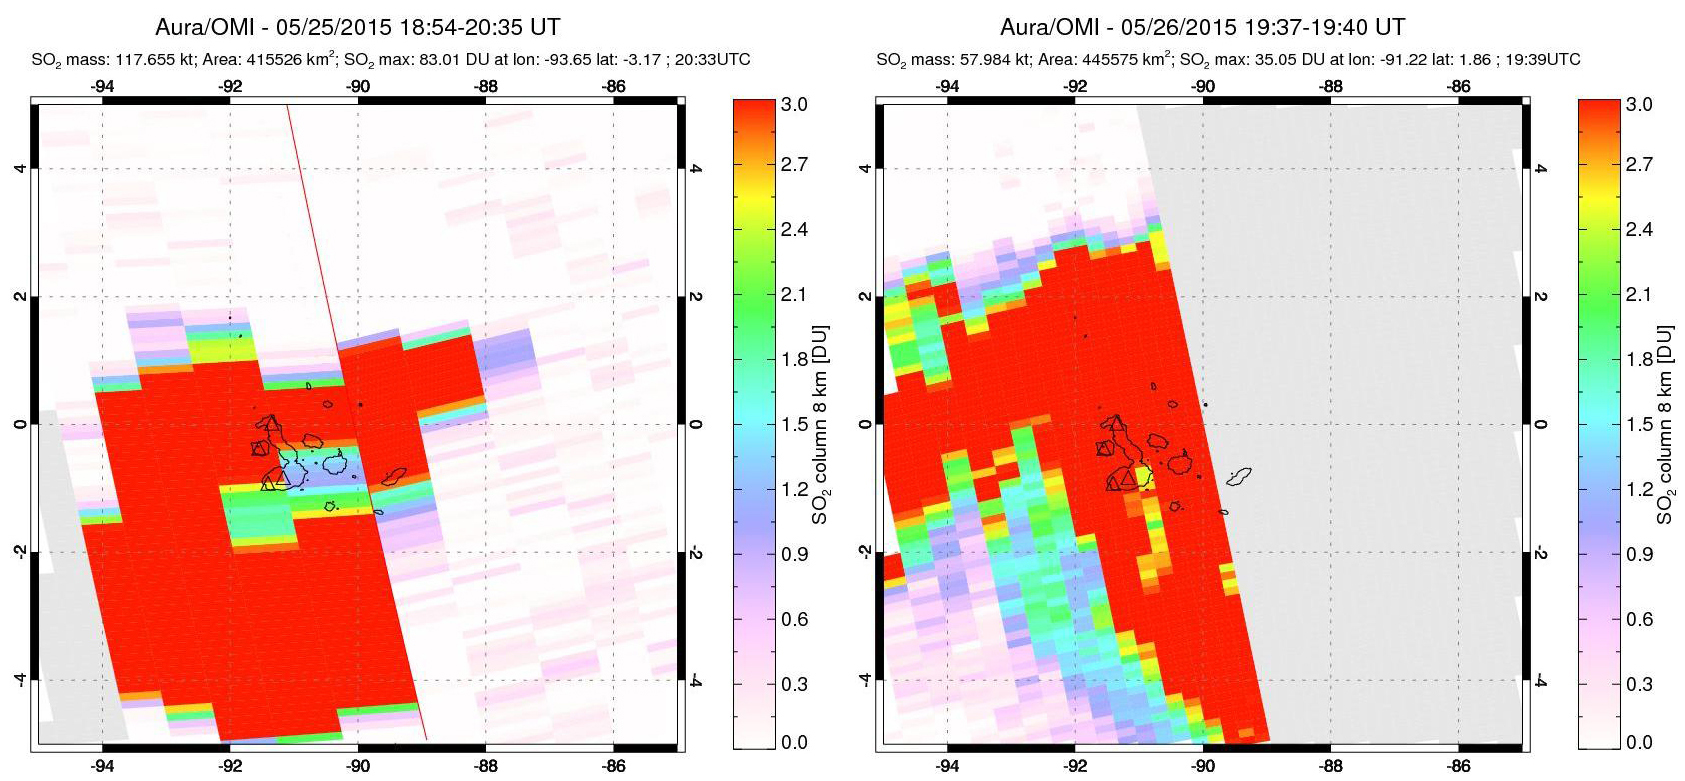 |
Figure 2. Sulfur dioxide emissions from Wolf captured by the OMI instrument on the Aura satellite on 25 and 26 May 2015. The total release for the event was around 200 kilotons of SO2. Courtesy of NASA Goddard Space Flight Center (GSFC). |
In the days following the explosion, lava flows descended the NE, E, and SE flanks from a fissure located near the edge of the caldera. IG scientists were able to observe the flowing lava during an overflight on 29 May (figures 3 and 4). They noted a steam plume rising 2-3 km above the volcano with no visible ash, and a strong sulfur odor.
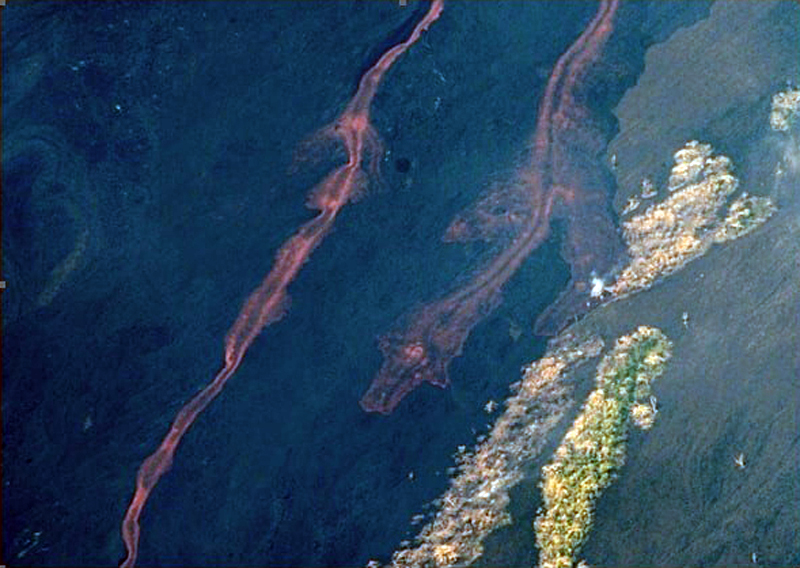 |
Figure 3. Incandescent lava flows down the NE flank of Wolf on 29 May 2015. Courtesy of B. Bernard, IG-EPN (Informe Volcanico Especial Galapagos No. 3, 2 June 2015). |
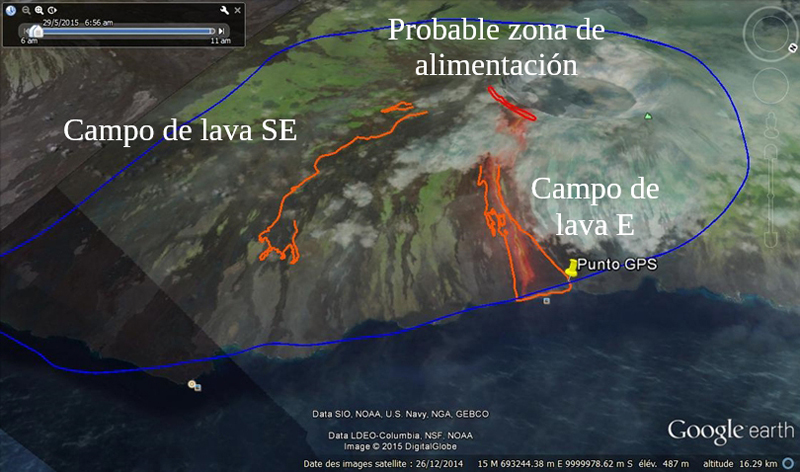 |
Figure 4. Oblique satellite image from the NE of the lava field on the E flank of Wolf. The two incandescent flows are outlined in orange with the probable fissure vent shown in red. The blue line is the flight path taken on 29 May 2015. Image was taken by the ALI (Advanced Land Imager) camera on board the EOS-1 satellite on 28 May 2015, and superimposed on Google Earth imagery by IG-EPN scientists. Courtesy of B. Bernard, IG-EPN (Informe Volcanico Especial Galapagos No. 3, 2 June 2015). |
By 28 May the E lava field was approximately 7 km long and flows had reached the ocean. Thermal imaging during the overflight revealed two areas with apparent maximum temperatures (TMA) greater than 500°C, one at the site of the fissure near the caldera rim, and one in the lava field on the E flank. SO2 emissions measured during the overflight were 40.6 kt/day. Satellite images gathered on 5 and 11 June confirmed the source of the lava flows as an arcuate fissure around the SE and E edges of the caldera in a similar location to the 1982 fissure.
Another overflight by IG-EPN scientists on 12 June confirmed the continuing emission of lava flows down the SE and E flanks. The helicopter landed on the north rim of the crater with a view to the south of the lava flow from the 1982 eruption and gases emitting from the active fissure zone (figure 5). IG scientists heard at least five explosions during their visit to the crater rim. Thermal images gathered during the 12 June flight revealed that temperatures of the flows on the SE flank had dropped to less than 100°C, but temperatures at the fissure vent were still greater than 500°C, and steaming lava was observed near the emission zone (figure 6).
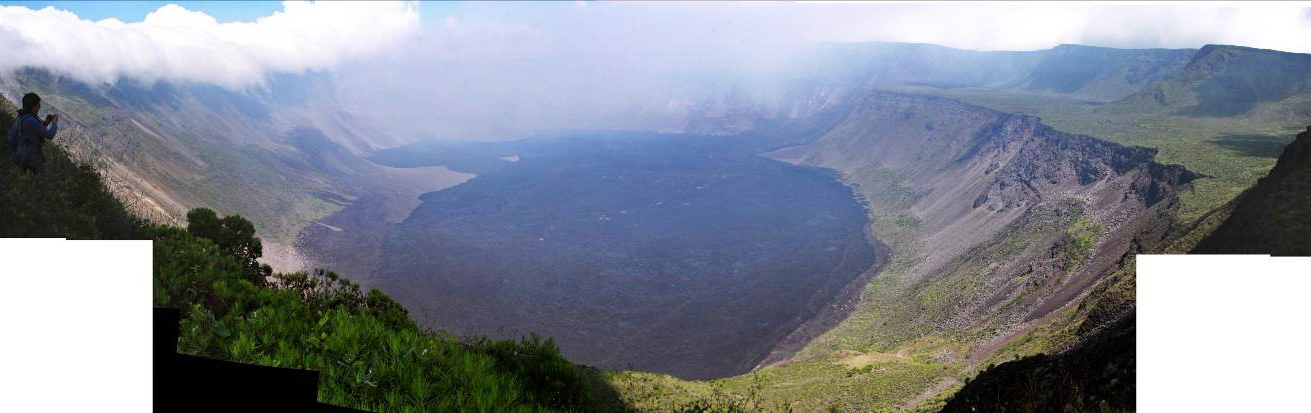 |
Figure 5. Panorama of the interior of the Wolf caldera on 12 June 2015 showing the lava flow from the 1982 eruption covering the floor, and gas clouds from the active fissure on the SE side of the caldera rim. Courtesy of P. Ramon, IG-EPN (Informe Volcanico Especial Galapagos No. 4, 26 June 2015). |
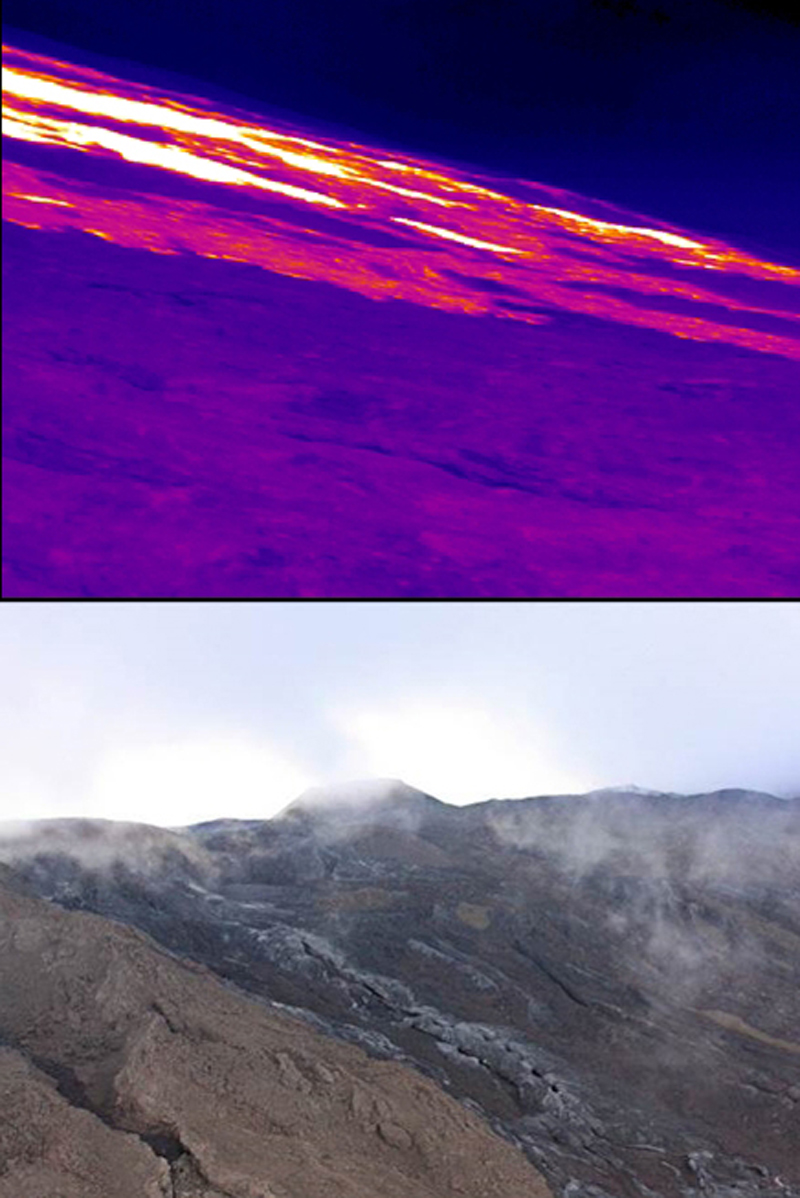 |
Figure 6. Lava flows near the source vent at Wolf on 12 June 2015 seen in a thermal image (top) and regular photograph (bottom). Courtesy of P. Ramon, IG-EPN (Informe Volcanico Especial Galapagos No. 4, 26 June 2015). |
On 13 June 2015 satellite imagery showed new thermal anomalies inside the crater, suggesting active lava flowing into the crater in addition to the flows on the E and SE flanks. This was confirmed with visible low-resolution imagery from the WorldView 3 satellite on 16 June which showed an area of likely incandescence near the S rim. An image from the WorldView 1 satellite on 18 June showed a new lava flow on the floor of the caldera (figure 7). IG-EPN scientists combined the thermal data from their overflights with satellite imagery to define the areas of new lava flow through late June (figure 8).
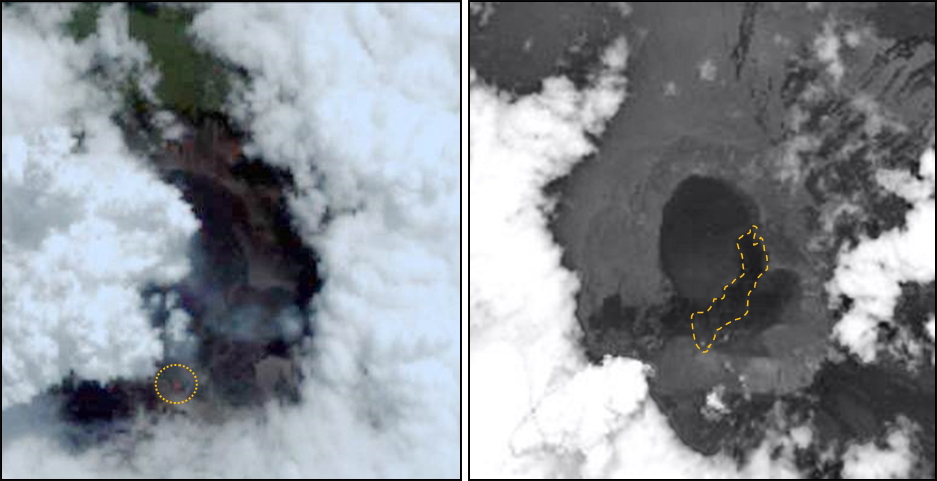 |
Figure 7. Satellite images of Wolf showing an incandescent zone and possible new vent on 16 June 2015 (circle at left; image from WV3 satellite), and a new lava flow inside the caldera on 18 June (right, image from WV1 satellite). Courtesy of IG-EPN (Informe Volcanico Especial Galapagos No. 4, 26 June 2015). |
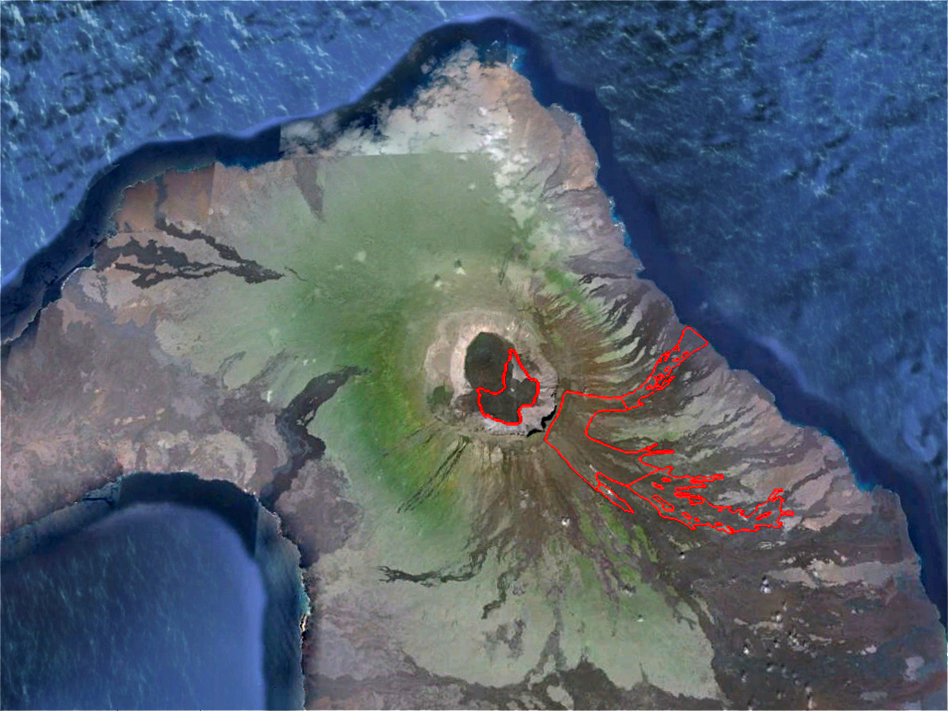 |
Figure 8. Preliminary estimate of areas covered by lava flows from the eruption at Wolf beginning 25 May 2015 through 25 June. Base from Google Earth. Courtesy of IG-EPN (Informe Volcanico Especial Galapagos No. 4, 26 June 2015). |
The thermal alert pixels from the MODVOLC system show an evolution of the heat anomalies from the MODIS infrared satellite data that corresponds well with the satellite imagery and ground observations. The first anomalies were recorded on 25 May 2015. Strong multi-pixel anomalies (in some cases, more than 50 per day) were mapped daily until 4 July. After this, they become intermittent, and the daily number dropped below 11, tapering to one or two pixels every few days between 17 July, with the last two observed on 1 August. Two lobes of lava flows to the E and SE can be distinguished on the MODVOLC maps between 25 May and 12 June; anomalies within the crater appear on 13 June, increase to a maximum in the third week of June, and then taper off during July (figure 9).
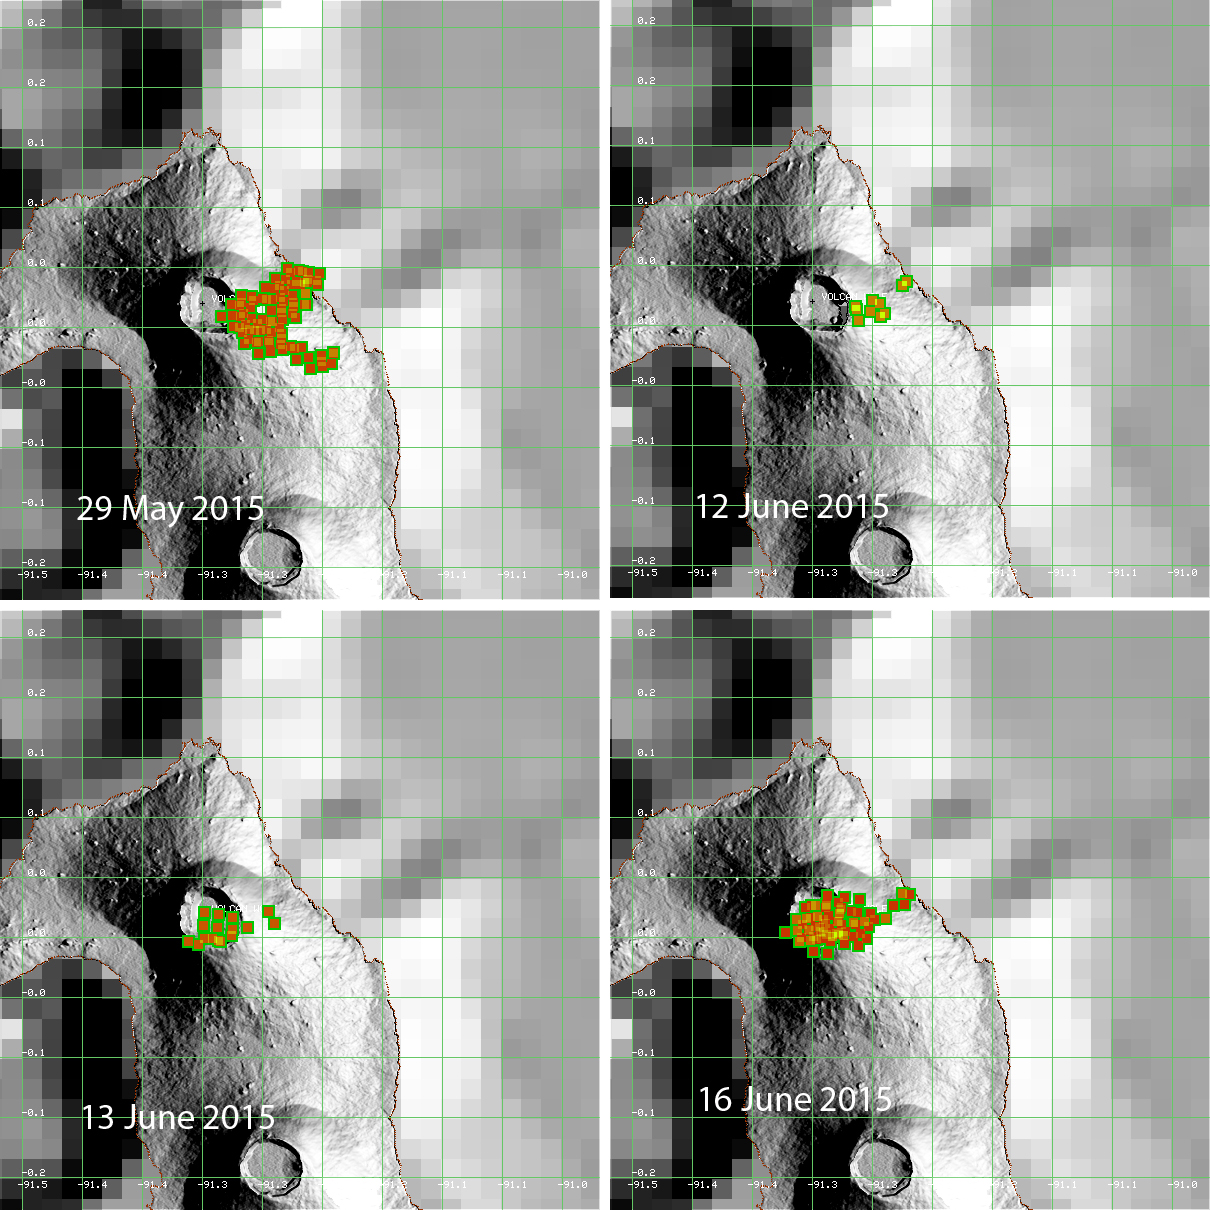 |
Figure 9. Four MODVOLC thermal anomaly maps of Wolf showing the evolution from lava flows down the E and SE flanks (29 May and 12 June 2015) to the active flows inside the crater (13 and 16 June). Green grid lines represent decimal degrees of longitude and latitude. Data courtesy of MODVOLC. |
MODIS data processed by MIROVA recorded a large thermal energy signature between 25 and 30 May, which then decreased for several days before increasing again in the second week of June (figure 10). The MIROVA radiative power data showed that the anomalies continued to decrease, suggestive of cooling lava flows, through November 2015, however, they picked up again early in 2016 (figure 11), indicating some continuing source of heat from the volcano.
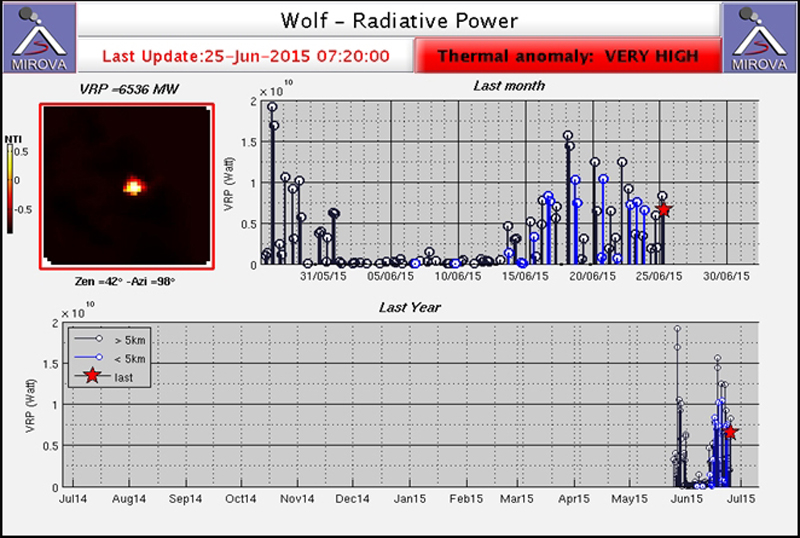 |
Figure 10. Radiant energy of thermal anomalies at Wolf detected by MIROVA from 25 May through 25 June 2015. Note the spike on 25 May followed by the decrease in values until after 15 June when they again increased (upper graph). Courtesy of MIROVA, taken from IG-EPN (Informe Volcanico Especial Galapagos No. 4, 26 June 2015). |
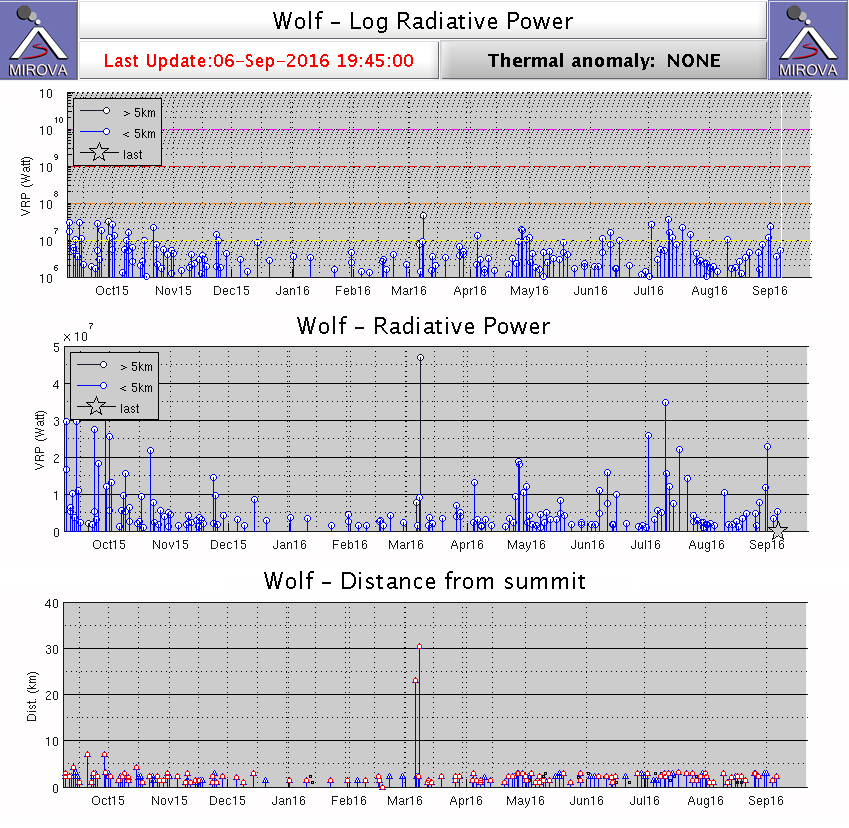 |
Figure 11. MIROVA analysis of MODIS infrared satellite data from Wolf between 6 September 2015 and 6 September 2016 showing Log Radiative Power (top), Radiative Power (middle), and Distance from summit (bottom). Virtually all of the anomalies are located within 5 km of the summit (lower graph). A gradual decrease in the anomalies between September and 1 December 2015 is consistent with cooling lava flows. Waxing and waning anomalies between March and September 2016 indicate some continued source of heat from Wolf. Courtesy of MIROVA. |
No further special reports were issued by the Instituto Geofisico after June 2015 and available evidence suggests active lava flows ceased by late July 2015.
Information Contacts: Instituto Geofísico, Escuela Politécnica Nacional (IG-EPN), Casilla 17-01-2759, Quito, Ecuador (URL: http://www.igepn.edu.ec/); Washington Volcanic Ash Advisory Center (VAAC), Satellite Analysis Branch (SAB), NOAA/NESDIS OSPO, NOAA Science Center Room 401, 5200 Auth Rd, Camp Springs, MD 20746, USA (URL: http://www.ospo.noaa.gov/Products/atmosphere/vaac/) [Archive at: http://www.ssd.noaa.gov/VAAC/archive.html]; Hawai'i Institute of Geophysics and Planetology (HIGP), MODVOLC Thermal Alerts System, School of Ocean and Earth Science and Technology (SOEST), Univ. of Hawai'i, 2525 Correa Road, Honolulu, HI 96822, USA (URL: http://modis.higp.hawaii.edu/, http://modis.higp.hawaii.edu/cgi-bin/modisnew.cgi); NASA Goddard Space Flight Center (NASA/GSFC), Global Sulfur Dioxide Monitoring Page, Atmospheric Chemistry and Dynamics Laboratory, Goddard, Maryland, USA (URL: https://so2.gsfc.nasa.gov/); MIROVA (Middle InfraRed Observation of Volcanic Activity), a collaborative project between the Universities of Turin and Florence (Italy) supported by the Centre for Volcanic Risk of the Italian Civil Protection Department (URL: http://www.mirovaweb.it/).
First eruption in seven years; lava effusion on the SE flank during January-April 2022
The first known observed eruption in the Galapagos occurred at Volcán Wolf on Isabela Island in August of 1797. Basaltic lava flows have occurred within the summit crater and on the flanks a few times each century since then. The most recent eruptions in 1982 (SEAN 07:08) and 2015 (BGVN 41:10) produced lava fountains and flows within the crater and on the flanks. A new eruption beginning on 7 January 2022 produced a large SO2 plume, a small amount of ash, and lava flows on the SE flank that lasted through April 2022. Details of the 2022 eruption are provided with information primarily from the Geophysical Institute of the National Polytechnic School (IG-EPN) in Quito, Ecuador. IG maintains a broadband seismic network and a DOAS (Differential Optical Absorption Spectrometer) SO2 monitoring station on the islands that transmits data to the mainland. The Washington Volcanic Ash Advisory Center (VAAC) is responsible for aviation warnings, and satellite data provide valuable remote thermal and SO2 information.
Summary of January-April 2022 eruption. The 6 January through 14 April 2022 eruption lasted longer than the eruptions in 1982 and 2015. The eruption began with a very large SO2 plume, a moderate-size ash plume, and multiple vents that produced lava flows. IG-EPN officials noted that the lava flows originated from an 8-km-long SE-flank radial fissure with at least five vents. The flows reached a maximum distance of about 18.5 km; they stopped 150-200 m from the coastline, covering an area of more than 30 km2.
Description of January-April 2022 eruption. After seven years of no activity, a new eruption at Wolf was first reported shortly late on 6 January 2022, Galápagos time. Within the hour, a plume of gas and ash had reached 3.8 km altitude and drifted NE while a second plume drifted W at 1.9 km altitude. Lava flows were observed descending the SE flank. Seismicity had been detected at the FER1 station on Fernandina Island a few hours earlier that likely signaled the start of the eruption. Twenty-nine MODVOLC thermal alerts appeared on 7 January on the SE flank, confirming a significant thermal event from the lava flow. Rangers from Parque Nacional Galápagos reported that a fissure on the S flank was the source of the flow. They witnessed the flow descending the SE flank and burning vegetation (figures 12 and 13).
|
Figure 12. A new lava flow at Wolf descends the SE slope on 7 January 2022 burning adjacent vegetation and creating white smoke. Courtesy of Parque Nacional Galápagos. |
|
Figure 13. Lava flows descended the SE flank of Wolf on 7 January 2022, burning shrubs and grasses in their path. Courtesy of Parque Nacional Galápagos. |
The Washington VAAC issued its first report of ash emissions on 7 January 2022; plumes initially rose to two altitudes: 3.7 km drifting W, and 5.6 km altitude drifting NE. Later the plumes dropped to 2.4 km drifting W and 4.6 km drifting NE. The plume drifting to the W extended over 80 km. The VAAC noted reports of a large SO2 plume later in the day reaching approximately 185 km W of the summit before dissipating. By the next day, they reported that emissions were primarily gas, drifting W at 1.3 km altitude. During 8-9 January gas emissions drifted SW at 700 m altitude. By 9 January, only an SO2 plume was reported moving SW from the summit, and no further ash advisories were issued. Sulfur dioxide degassing decreased substantially from 60 million tons measured on 7 January to 8 million tons measured on 12 January (figure 14).
|
Figure 14. A large SO2 plume with a mass over 60 kilotons emerged from Wolf on 7 January 2022 at the beginning of the eruption as recorded by the TROPOMI instrument on the Sentinel-5P satellite. The mass decreased each subsequent day but remained very large for several days and measurable each day until early February 2022. Courtesy of NASA Global Sulfur Dioxide Monitoring Page. |
During a flyover on 11 January 2022, the Park Minister noted continuing volcanic activity, and that the flow had traveled about 15 km from its source on the SE flank. IG-EPN reported that the lava flow was emerging from at least three fissures. The initial fissure from 7 January was at 1,290 m elevation and the subsequent fissures were located at 1,090 m elevation. By 11 January the flow was about 3 km from the coast (figure 15). IG-EPN produced the first map of the 7.4 km2 flow on 12 January 2022 based on satellite data from 7 and 11 January (figure 16). The maximum length of the flow was estimated at 16.5 km from the initial vent, and 15 km from the two subsequent active fissures. The numbers of daily thermal alerts decreased steadily between 7 and 13 January, interpreted by IG-EPN as a decrease in the lava flow rate.
|
Figure 15. A Sentinel satellite image annotated by IG-EPN from 11 January 2022 showing gas emissions and the active lava flow at Wolf. Courtesy of IG-EPN, Informe Volcánico Especial – GALÁPAGOS – 2022 No. 02, Actualización de la actividad del volcán Wolf – Isla Isabela, Archipiélago de Galápagos, Quito, 13 de enero de 2022. |
|
Figure 16. A preliminary map of the lava flow at Volcán Wolf on Isabela Island in the Galápagos as of 11 January 2022. The map was created from Sentinel-2 and PlanetScope satellite images. The flow covered an area of approximately 7.4 km2 and reached a maximum length of about 16.5 km. Courtesy of IG-EPN, Informe Volcánico Especial – GALÁPAGOS – 2022 – No. 02, Actualización de la actividad del volcán Wolf – Isla Isabela, Archipiélago de Galápagos, Quito, 13 de enero de 2022. |
By 17 January the lava flow had advanced to slightly more than 2 km from the ocean. By early February the active vent was downslope from the original vents, and IG-EPN was able to map multiple flow fronts on the S and SE flanks (figure 17). Multiple near-daily MODVOLC thermal alerts continued throughout February, with pulses of lava flow activity producing tens of alerts on some days. The lava flows remained active on the SE flank, slowly advancing towards the coast; satellite imagery helped IG-EPN scientists to map the track of the lava flow (figure 18).
|
Figure 17. A map of the lava flow at Volcán Wolf as of 8 February 2022 shows the active flow fronts as of various dates (yellow dots, red arrows). The original, inactive vents are shown with a green triangle and the active vent as of that date is shown in orange. Courtesy of IG-EPN, INFORME DIARIO DEL VOLCAN WOLF No. 2022-034, Quito, miércoles 09 de febrero de 2022. |
|
Figure 18. Sentinel-2 satellite imagery of Volcán Wolf from 11 and 16 January (top), and 15 and 25 February (bottom), show the active area of the lava flow changing over the first seven weeks of the eruption. Images use Atmospheric penetration rendering (bands 12, 11, 8a). Courtesy of Sentinel Hub Playground. |
Lava flows remained active on the SE flank throughout March 2022; IG-EPN scientists used the location of the FIRMS thermal anomalies to map the active areas of the flow over time (figure 19). By the end of March, the number of daily thermal alerts had diminished significantly, suggesting a further decrease in the flow rate. Parque Nacional Galápagos personnel reported at the end of March that lava flow activity continued on the SE flank but had not reached the ocean. Multiple hot spots in satellite images suggested that lava was flowing through tubes that were visible to the park rangers patrolling the coast.
|
Figure 19. Maps of the advance of the lava flows at Volcán Wolf from 9 and 15 March 2022 show the progress of the different branches over time. Data is based on thermal anomalies reported by FIRMS. Courtesy of IG-EPN, INFORME DIARIO DEL VOLCAN WOLF No. 2022-062 and 2022-068, Quito, miércoles 09 y 15 de marzo de 2022. |
MODVOLC thermal alerts were issued on 13 days during April 2022, with the number of daily alerts significantly fewer than previous months since January. Thermal anomalies continued to be present in satellite imagery through 21 April, and then briefly on 29 and 30 April (figure 20). IG-EPN scientists plotted the advance of the flow as the location of thermal alerts on a satellite image base several times during April; no advance was detectible after 14 April (figure 21). No surface activity was observed after 21 April. An updated map of the lava flow was published on 20 April 2022 (figure 22). Single MODVOLC thermal alerts were issued on 3 and 7 May, and two alerts on 16 May were the last recorded for the eruption.
|
Figure 20. Thermal anomalies in Sentinel-2 satellite imagery of Volcán Wolf on 17 March, 27 March, 6 April and 16 April 2022 show the slow advance and decrease in thermal energy from the flow. Images use Atmospheric penetration rendering (12, 11, 8a). The summit crater in the upper left is about 4 km across. Courtesy of Sentinel Hub Playground. |
|
Figure 21. Maps from Volcán Wolf plot the advance of the thermal alerts through 8 April (left) and 14 April 2022 (right) on a satellite image base, indicating the decrease in flow. No further advances were mapped after 14 April. Courtesy of IG-EPN, INFORME DIARIO DEL VOLCAN WOLF No. 2022-092 and 2022-098, Quito, viernes 08 y 14 de abril de 2022. |
|
Figure 22. The preliminary map from 20 April 2022 of the lava flows emitted during the eruption of Volcán Wolf that began in January. The map was made based on satellite images from PlanetScope. The lava flows covered more than 30 km2, and the maximum length covered was approximately 18.5 km from the highest vent; the flow did not reach the coast. Courtesy of IG-EPN and F.J. Vasconez, INFORME ESPECIAL VOLCÁN WOLF No. 2022-003 APARENTE FINAL DEL PERIODO ERUPTIVO Quito, 05 de mayo de 2022. |
Eruption review using satellite data. Sulfur dioxide emissions that were initially as high as 60 kilotons, gradually tapered off during January and none were recorded in satellite data after early February (figure 23); they decreased steadily throughout the period and ended in early April (figure 24). Hundreds of thermal alerts from satellite data created rough maps of the 2015 and 2022 flow areas showing the difference in their relative locations. The 2015 flow started on the crater rim and flowed both into the crater and down the E flank and into the ocean, while the 2022 flow started about 1.5 km down the SE flank from the caldera rim and stopped a few hundred meters from the coastline (figure 25).
|
Figure 23. Sulfur dioxide emissions at Volcán Wolf decreased significantly after 15 January 2022, the last day where the mass of the SO2 plume exceeded 10 kilotons. Only very faint emissions were recorded by satellite instruments after early February. Courtesy of NASA Global Sulfur Dioxide Monitoring Page. |
|
Figure 24. Sulfur dioxide emissions in tons per day for Volcán Wolf from 6 January through 2 April 2022. Data from Mounts and NASA (F.J. Vasconez). Courtesy of IG-EPN, INFORME ESPECIAL VOLCÁN WOLF No. 2022-003 APARENTE FINAL DEL PERIODO ERUPTIVO Quito, 05 de mayo de 2022. |
|
Figure 25. The MODVOLC thermal alerts plotted on a Google Earth base from eruptions at Wolf during 2015 (left) and 2022 (right) show how the thermal alerts roughly outline the area affected by lava flows. Lava during the 2015 eruption effused from the crater rim and flowed into crater and down the E flank into the ocean. The 2022 flow started about 1.5 km down the SE flank from the caldera rim and traveled about 18.5 km before stopping a few hundred meters from the coastline. Courtesy of MODVOLC. |
The MIROVA Log Radiative Power graph of MODIS data shows the onset of the eruption in early January 2022 with high levels of heat initially, followed by a period with more fluctuations, and then a period of gradual decrease through mid-April 2022 before dropping off quickly to low levels (figure 26). The MIROVA distance graph based on the central caldera location shows how the lava flow initially quickly extended 10 km beyond SE-flank vent location, was then restricted to higher on the flank, and then gradually moved farther away over time.
|
Figure 26. The MIROVA data shows both the intensity of the Radiative Power (left) and the distance from the summit of the volcano (right). The graph of Log Radiative Power from December 2021 through May 2022 shows the onset of the eruption in early January 2022 followed by an overall decrease in heat emissions. The Distance graph of the eruption shows the onset of activity more than 10 km from the caldera center, then activity higher up the flank and gradually moving farther away as the eruption continued. Courtesy of MIROVA. |
IG-EPN scientists plotted the hundreds of daily thermal alerts recorded by different satellite sensors such as MODIS (Moderate Resolution Imaging Spectroradiometer) and VIIRS (Visible Infrared Imaging Radiometer Suite), which are processed by different platforms (e.g., MIROVA , FIRMS, WORLDVIEW). The plot indicated a decreasing trend in thermal alerts, in both quantity and intensity from the beginning of the eruption in early January 2022 through the end of April (figure 27). This decrease reflected the decline in the rate of lava emission, as well as the progressive cooling of the lava flows.
|
Figure 27. A time series plot of thermal alerts from several different instruments for Volcán Wolf from January through April 2022 has a moving average of 7 days plotted as a black line over the primary data. After an initial peak at the start of the eruption, the activity gradually decreases through the end of April (F.J. Vasconez). Courtesy of IG-EPN, INFORME ESPECIAL VOLCÁN WOLF No. 2022-003, APARENTE FINAL DEL PERIODO ERUPTIVO Quito, 05 de mayo de 2022. |
Information Contacts: Instituto Geofísico, Escuela Politécnica Nacional (IG-EPN), Casilla 17-01-2759, Quito, Ecuador (URL: http://www.igepn.edu.ec/); Parque Nacional Galápagos (URL: https://galapagos.gob.ec/noticias/, https://www.facebook.com/parquegalapagos/posts/290645263104217); Hawai'i Institute of Geophysics and Planetology (HIGP) - MODVOLC Thermal Alerts System, School of Ocean and Earth Science and Technology (SOEST), Univ. of Hawai'i, 2525 Correa Road, Honolulu, HI 96822, USA (URL: http://modis.higp.hawaii.edu/); MIROVA (Middle InfraRed Observation of Volcanic Activity), a collaborative project between the Universities of Turin and Florence (Italy) supported by the Centre for Volcanic Risk of the Italian Civil Protection Department (URL: http://www.mirovaweb.it/); Sentinel Hub Playground (URL: https://www.sentinel-hub.com/explore/sentinel-playground); NASA Global Sulfur Dioxide Monitoring Page, Atmospheric Chemistry and Dynamics Laboratory, NASA Goddard Space Flight Center (NASA/GSFC), 8800 Greenbelt Road, Goddard MD 20771, USA (URL: https://so2.gsfc.nasa.gov/); Washington Volcanic Ash Advisory Center (VAAC), Satellite Analysis Branch (SAB), NOAA/NESDIS OSPO, NOAA Science Center Room 401, 5200 Auth Rd, Camp Springs, MD 20746, USA (URL: www.ospo.noaa.gov/Products/atmosphere/vaac, archive at: http://www.ssd.noaa.gov/VAAC/archive.html).
|
|
||||||||||||||||||||||||||
There is data available for 16 confirmed eruptive periods.
2022 Jan 6 - 2022 Apr 14 Confirmed Eruption (Explosive / Effusive) VEI: 2
| Episode 1 | Eruption (Explosive / Effusive) | |||||||||||||||||||
|---|---|---|---|---|---|---|---|---|---|---|---|---|---|---|---|---|---|---|---|
| 2022 Jan 6 - 2022 Apr 14 | Evidence from Observations: Reported | ||||||||||||||||||
|
List of 2 Events for Episode 1
|
|||||||||||||||||||
2015 May 25 - 2015 Jul 16 Confirmed Eruption (Explosive / Effusive) VEI: 4
| Episode 1 | Eruption (Explosive / Effusive) | a fissure on the SE edge of the caldera, on the NE, E, and SE flanks, and within the summit caldera | ||||||||||||||||||||||||||||||||||||||||||||||||||||||||||||||||||||||||||||||||||||||||
|---|---|---|---|---|---|---|---|---|---|---|---|---|---|---|---|---|---|---|---|---|---|---|---|---|---|---|---|---|---|---|---|---|---|---|---|---|---|---|---|---|---|---|---|---|---|---|---|---|---|---|---|---|---|---|---|---|---|---|---|---|---|---|---|---|---|---|---|---|---|---|---|---|---|---|---|---|---|---|---|---|---|---|---|---|---|---|---|---|---|
| 2015 May 25 - 2015 Jul 16 | Evidence from Observations: Reported | ||||||||||||||||||||||||||||||||||||||||||||||||||||||||||||||||||||||||||||||||||||||||
|
List of 16 Events for Episode 1 at a fissure on the SE edge of the caldera, on the NE, E, and SE flanks, and within the summit caldera
|
|||||||||||||||||||||||||||||||||||||||||||||||||||||||||||||||||||||||||||||||||||||||||
1982 Aug 28 - 1982 Sep 6 (?) Confirmed Eruption (Explosive / Effusive) VEI: 1
| Episode 1 | Eruption (Explosive / Effusive) | Caldera and SE flank (875 m) | ||||||||||||||||||||||||||||||||||||||
|---|---|---|---|---|---|---|---|---|---|---|---|---|---|---|---|---|---|---|---|---|---|---|---|---|---|---|---|---|---|---|---|---|---|---|---|---|---|---|---|
| 1982 Aug 28 - 1982 Sep 6 (?) | Evidence from Observations: Reported | ||||||||||||||||||||||||||||||||||||||
|
List of 6 Events for Episode 1 at Caldera and SE flank (875 m)
|
|||||||||||||||||||||||||||||||||||||||
[ 1973 Oct 25 - 1973 Oct 29 ] Uncertain Eruption
| Episode 1 | Eruption (Explosive / Effusive) | ||||||||||||||
|---|---|---|---|---|---|---|---|---|---|---|---|---|---|---|
| 1973 Oct 25 - 1973 Oct 29 | Evidence from Unknown | |||||||||||||
|
List of 1 Events for Episode 1
|
||||||||||||||
1963 Mar 4 - 1963 Mar 16 (on or after) Confirmed Eruption (Explosive / Effusive) VEI: 0
| Episode 1 | Eruption (Explosive / Effusive) | SE flank (610 m) | ||||||||||||||||||||||||||||
|---|---|---|---|---|---|---|---|---|---|---|---|---|---|---|---|---|---|---|---|---|---|---|---|---|---|---|---|---|---|
| 1963 Mar 4 - 1963 Mar 16 (on or after) | Evidence from Observations: Reported | ||||||||||||||||||||||||||||
|
List of 4 Events for Episode 1 at SE flank (610 m)
|
|||||||||||||||||||||||||||||
1948 Jan 24 - 1948 Jan 31 (on or after) Confirmed Eruption (Explosive / Effusive) VEI: 2
| Episode 1 | Eruption (Explosive / Effusive) | SE flank (1200 m) | |||||||||||||||||||||||||||||||||||||||||||
|---|---|---|---|---|---|---|---|---|---|---|---|---|---|---|---|---|---|---|---|---|---|---|---|---|---|---|---|---|---|---|---|---|---|---|---|---|---|---|---|---|---|---|---|---|
| 1948 Jan 24 - 1948 Jan 31 (on or after) | Evidence from Observations: Reported | |||||||||||||||||||||||||||||||||||||||||||
|
List of 7 Events for Episode 1 at SE flank (1200 m)
|
||||||||||||||||||||||||||||||||||||||||||||
1938 Confirmed Eruption (Explosive / Effusive)
| Episode 1 | Eruption (Explosive / Effusive) | ||||
|---|---|---|---|---|
| 1938 - Unknown | Evidence from Observations: Reported | |||
1935 Feb Confirmed Eruption (Explosive / Effusive)
| Episode 1 | Eruption (Explosive / Effusive) | ||||
|---|---|---|---|---|
| 1935 Feb - Unknown | Evidence from Observations: Reported | |||
1933 Confirmed Eruption (Explosive / Effusive) VEI: 0
| Episode 1 | Eruption (Explosive / Effusive) | |||||||||||||||||||
|---|---|---|---|---|---|---|---|---|---|---|---|---|---|---|---|---|---|---|---|
| 1933 - Unknown | Evidence from Observations: Reported | ||||||||||||||||||
|
List of 2 Events for Episode 1
|
|||||||||||||||||||
1925 Apr 11 - 1926 Mar 26 (on or after) Confirmed Eruption (Explosive / Effusive) VEI: 1
| Episode 1 | Eruption (Explosive / Effusive) | ESE flank | ||||||||||||||||||
|---|---|---|---|---|---|---|---|---|---|---|---|---|---|---|---|---|---|---|---|
| 1925 Apr 11 - 1926 Mar 26 (on or after) | Evidence from Observations: Reported | ||||||||||||||||||
|
List of 2 Events for Episode 1 at ESE flank
|
|||||||||||||||||||
1859 Aug 26 - 1859 Aug 29 Confirmed Eruption (Explosive / Effusive)
| Episode 1 | Eruption (Explosive / Effusive) | |||||||||||||||||||
|---|---|---|---|---|---|---|---|---|---|---|---|---|---|---|---|---|---|---|---|
| 1859 Aug 26 - 1859 Aug 29 | Evidence from Observations: Reported | ||||||||||||||||||
|
List of 2 Events for Episode 1
|
|||||||||||||||||||
1849 Sep 27 - 1849 Sep 27 Confirmed Eruption (Explosive / Effusive)
| Episode 1 | Eruption (Explosive / Effusive) | Volcano Uncertain: either Wolf or Darwin | |||||||||||||
|---|---|---|---|---|---|---|---|---|---|---|---|---|---|---|
| 1849 Sep 27 - 1849 Sep 27 | Evidence from Observations: Reported | |||||||||||||
|
List of 1 Events for Episode 1 at Volcano Uncertain: either Wolf or Darwin
|
||||||||||||||
1800 Aug 21 - 1800 Aug 21 Confirmed Eruption (Explosive / Effusive) VEI: 2 (?)
| Episode 1 | Eruption (Explosive / Effusive) | ||||||||||||||||||||||||
|---|---|---|---|---|---|---|---|---|---|---|---|---|---|---|---|---|---|---|---|---|---|---|---|---|
| 1800 Aug 21 - 1800 Aug 21 | Evidence from Observations: Reported | |||||||||||||||||||||||
|
List of 3 Events for Episode 1
|
||||||||||||||||||||||||
1797 Aug Confirmed Eruption (Explosive / Effusive)
| Episode 1 | Eruption (Explosive / Effusive) | ||||
|---|---|---|---|---|
| 1797 Aug - Unknown | Evidence from Observations: Reported | |||
1450 (in or after) Confirmed Eruption (Explosive / Effusive) VEI: 0
| Episode 1 | Eruption (Explosive / Effusive) | Lower NE and SE flanks | ||||||||||||||||||
|---|---|---|---|---|---|---|---|---|---|---|---|---|---|---|---|---|---|---|---|
| 1450 (in or after) - Unknown | Evidence from Isotopic: Cosmic Ray Exposure | ||||||||||||||||||
|
List of 2 Events for Episode 1 at Lower NE and SE flanks
|
|||||||||||||||||||
0950 (in or after) Confirmed Eruption (Explosive / Effusive) VEI: 0
| Episode 1 | Eruption (Explosive / Effusive) | Lower NE flank | ||||||||||||||||||
|---|---|---|---|---|---|---|---|---|---|---|---|---|---|---|---|---|---|---|---|
| 0950 (in or after) - Unknown | Evidence from Isotopic: Cosmic Ray Exposure | ||||||||||||||||||
|
List of 2 Events for Episode 1 at Lower NE flank
|
|||||||||||||||||||
0150 ± 800 years Confirmed Eruption (Explosive / Effusive) VEI: 0
| Episode 1 | Eruption (Explosive / Effusive) | Lower SW flank | ||||||||||||||||||
|---|---|---|---|---|---|---|---|---|---|---|---|---|---|---|---|---|---|---|---|
| 0150 ± 800 years - Unknown | Evidence from Isotopic: Cosmic Ray Exposure | ||||||||||||||||||
|
List of 2 Events for Episode 1 at Lower SW flank
|
|||||||||||||||||||
This compilation of synonyms and subsidiary features may not be comprehensive. Features are organized into four major categories: Cones, Craters, Domes, and Thermal Features. Synonyms of features appear indented below the primary name. In some cases additional feature type, elevation, or location details are provided.
Synonyms |
| Whiton, Mount |
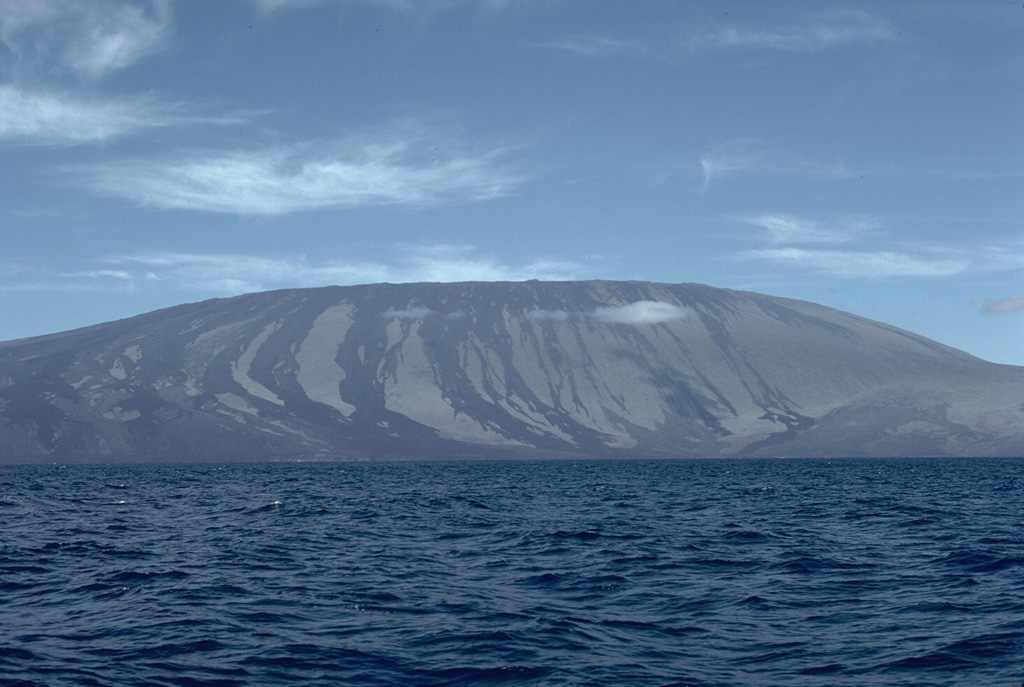
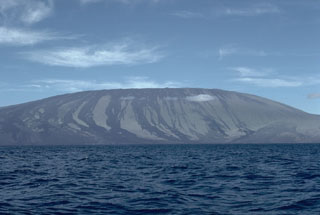 Wolf, the highest volcano of the Galápagos Islands, is located near the equator at the N end of the archipelago's largest island, Isabela. The summit caldera is 5.5 x 7 km and 600 m deep, with recent lava flows covering the broad caldera floor. Prominent unvegetated lava flows are visible on the flanks to the sea. Wolf's 1797 eruption was the first documented in the Galápagos Islands.
 A radial fissure on the NE flank of Volcán Wolf has produced extensive lava flows that in part lap onto the flanks of the main shield volcano. A sharp break in slope separates the low-angle flank rift zone, whose smooth profile is interrupted by a few small cinder cones, from the upper shield volcano, which has some of the steepest slopes of Galápagos shield volcanoes. A fresh unvegetated lava flow from the main shield at the extreme left was deflected to the south by the lava produced from the NE rift.
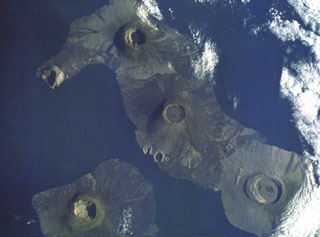 This dramatic Space Shuttle photo from a 1988 mission shows five major calderas of the Galápagos Islands. Caldera diameters capping these basasltic shield volcanoes range up to 8 km. At the lower left is Fernandina volcano. At the lower right is mostly vegetated Alcedo volcano on Isabela Island. Above and to the left is Darwin volcano, with the two prominent breached tuff cones, Tagus and Beagle, on its SW flank. Volcán Wolf is at the top of the photo, and Volcán Ecuador with its breached caldera forms the NW tip of Isabela Island.
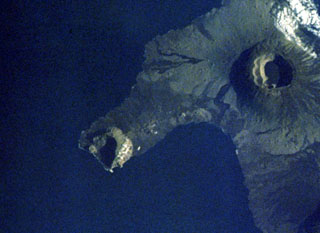 Volcán Ecuador (left center) forms the tip of a peninsula straddling the equator at the NW end of Isabela Island. The western side of the volcano, the smallest of the six large shield volcanoes on Isabela, is breached nearly to sea level. A line of fissure-fed vents on the outer eastern flank can be seen connecting Volcán Ecuador with Volcán Wolf (upper right). Despite the absence of historical eruptions from Volcán Ecuador, the youthful morphology of its most recent lava flows resembles those of very recent flows on other Isabela Island volcanoes.
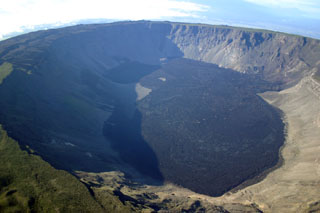 An aerial view from the north looks across the 6 x 7 km wide summit caldera of Volcán Wolf. Fresh-looking, dark-colored lava flows, erupted from fissures on the eastern and western caldera walls, cover much of the caldera floor. At 1710 m, Wolf is the highest of the Isabella Island shield volcanoes.
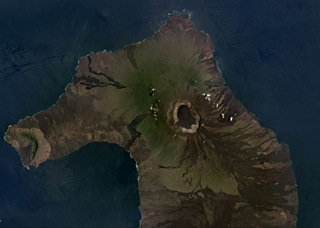 The 700-m-deep summit caldera of the Volcán Wolf shield volcano on Isabela Island, Galapagos Islands, is near the center of this March 2019 Planet Labs satellite image monthly mosaic (N is at the top; this image is approximately 50 km across). Lava flows have erupted from radial and circumferential fissures from the summit to the lower flanks. Volcán Ecuador and its East Rift zone forms the western peninsula, and the northern flank of Volcán Darwin is to the south.
There are no samples for Wolf in the Smithsonian's NMNH Department of Mineral Sciences Rock and Ore collection.
| Copernicus Browser | The Copernicus Browser replaced the Sentinel Hub Playground browser in 2023, to provide access to Earth observation archives from the Copernicus Data Space Ecosystem, the main distribution platform for data from the EU Copernicus missions. |
| MIROVA | Middle InfraRed Observation of Volcanic Activity (MIROVA) is a near real time volcanic hot-spot detection system based on the analysis of MODIS (Moderate Resolution Imaging Spectroradiometer) data. In particular, MIROVA uses the Middle InfraRed Radiation (MIR), measured over target volcanoes, in order to detect, locate and measure the heat radiation sourced from volcanic activity. |
| MODVOLC Thermal Alerts | Using infrared satellite Moderate Resolution Imaging Spectroradiometer (MODIS) data, scientists at the Hawai'i Institute of Geophysics and Planetology, University of Hawai'i, developed an automated system called MODVOLC to map thermal hot-spots in near real time. For each MODIS image, the algorithm automatically scans each 1 km pixel within it to check for high-temperature hot-spots. When one is found the date, time, location, and intensity are recorded. MODIS looks at every square km of the Earth every 48 hours, once during the day and once during the night, and the presence of two MODIS sensors in space allows at least four hot-spot observations every two days. Each day updated global maps are compiled to display the locations of all hot spots detected in the previous 24 hours. There is a drop-down list with volcano names which allow users to 'zoom-in' and examine the distribution of hot-spots at a variety of spatial scales. |
|
WOVOdat
Single Volcano View Temporal Evolution of Unrest Side by Side Volcanoes |
WOVOdat is a database of volcanic unrest; instrumentally and visually recorded changes in seismicity, ground deformation, gas emission, and other parameters from their normal baselines. It is sponsored by the World Organization of Volcano Observatories (WOVO) and presently hosted at the Earth Observatory of Singapore.
GVMID Data on Volcano Monitoring Infrastructure The Global Volcano Monitoring Infrastructure Database GVMID, is aimed at documenting and improving capabilities of volcano monitoring from the ground and space. GVMID should provide a snapshot and baseline view of the techniques and instrumentation that are in place at various volcanoes, which can be use by volcano observatories as reference to setup new monitoring system or improving networks at a specific volcano. These data will allow identification of what monitoring gaps exist, which can be then targeted by remote sensing infrastructure and future instrument deployments. |
| Volcanic Hazard Maps | The IAVCEI Commission on Volcanic Hazards and Risk has a Volcanic Hazard Maps database designed to serve as a resource for hazard mappers (or other interested parties) to explore how common issues in hazard map development have been addressed at different volcanoes, in different countries, for different hazards, and for different intended audiences. In addition to the comprehensive, searchable Volcanic Hazard Maps Database, this website contains information about diversity of volcanic hazard maps, illustrated using examples from the database. This site is for educational purposes related to volcanic hazard maps. Hazard maps found on this website should not be used for emergency purposes. For the most recent, official hazard map for a particular volcano, please seek out the proper institutional authorities on the matter. |
| IRIS seismic stations/networks | Incorporated Research Institutions for Seismology (IRIS) Data Services map showing the location of seismic stations from all available networks (permanent or temporary) within a radius of 0.18° (about 20 km at mid-latitudes) from the given location of Wolf. Users can customize a variety of filters and options in the left panel. Note that if there are no stations are known the map will default to show the entire world with a "No data matched request" error notice. |
| UNAVCO GPS/GNSS stations | Geodetic Data Services map from UNAVCO showing the location of GPS/GNSS stations from all available networks (permanent or temporary) within a radius of 20 km from the given location of Wolf. Users can customize the data search based on station or network names, location, and time window. Requires Adobe Flash Player. |
| DECADE Data | The DECADE portal, still in the developmental stage, serves as an example of the proposed interoperability between The Smithsonian Institution's Global Volcanism Program, the Mapping Gas Emissions (MaGa) Database, and the EarthChem Geochemical Portal. The Deep Earth Carbon Degassing (DECADE) initiative seeks to use new and established technologies to determine accurate global fluxes of volcanic CO2 to the atmosphere, but installing CO2 monitoring networks on 20 of the world's 150 most actively degassing volcanoes. The group uses related laboratory-based studies (direct gas sampling and analysis, melt inclusions) to provide new data for direct degassing of deep earth carbon to the atmosphere. |
| Large Eruptions of Wolf | Information about large Quaternary eruptions (VEI >= 4) is cataloged in the Large Magnitude Explosive Volcanic Eruptions (LaMEVE) database of the Volcano Global Risk Identification and Analysis Project (VOGRIPA). |
| EarthChem | EarthChem develops and maintains databases, software, and services that support the preservation, discovery, access and analysis of geochemical data, and facilitate their integration with the broad array of other available earth science parameters. EarthChem is operated by a joint team of disciplinary scientists, data scientists, data managers and information technology developers who are part of the NSF-funded data facility Integrated Earth Data Applications (IEDA). IEDA is a collaborative effort of EarthChem and the Marine Geoscience Data System (MGDS). |

