

IMO reported that the eruption that began on 29 May near Sundhnúk, NE of Sýlingarfell within the Reykanes volcanic system, decreased over a few days and then ended on 24 June, with the eruption spanning a total of 24 days. According to a news article, earlier in the week lava flowed mostly N along Sýlingarfell and thickened in some areas, rising higher than the earthen barriers N of Svartsengi; on 18 June lava flowed over the barrier between Sýlingarfell and Grindavíkurvegar, prompting workers to try to stop the advancement of the lava by spraying water on the flows as an experimental defense. By 20 June lava was flowing over the barrier in three places. Firefighters sprayed water on the lava causing steam-and-gas plumes to rise from the slow-moving flows. Large machinery was also utilized to move dirt and strengthen the barrier. The westernmost flow that overtopped the barrier was the most active and continued to advance and thicken during 20-21 June. Tremor levels decreased, indicating that the eruption was decreasing, though a decreasing rate of uplift in the Svartsengi area continued to be recorded in GPS data.
Images from a drone overflight conducted during the morning of 21 June by Almannavarnadeild ríkislögreglustjóra (National Commissioner of the Icelandic Police and Department of Civil Protection and Emergency Management) showed decreased activity at the main crater. Areas of incandescent lava in the crater were visible; lava flows from the crater were not seen, though flows through lava tubes may have been active. Sulfur dioxide emissions were very low. During a drone survey around noon on 22 June no activity in the crater was visible, indicating that the eruption had ceased. Additionally, tremor levels had decreased to levels similar to those recorded before the eruption began. On 24 June IMO noted that still-molten lava continued to advance over the barrier at Sýlingarfell and on the lava field N of the barrier. At 1410 on 25 June IMO lowered the Aviation Color Code to Yellow (the second lowest level on a four-color scale).
Sources: Icelandic Meteorological Office (IMO), Icelandic National Broadcasting Service (RUV), Icelandic National Broadcasting Service (RUV)
2024: January
| February
| March
| April
| May
| June
2023: October
| November
| December
2022: May
| June
2020: January
| February
| March
| April
| June
| October
IMO reported that the eruption that began on 29 May near Sundhnúk, NE of Sýlingarfell within the Reykanes volcanic system, decreased over a few days and then ended on 24 June, with the eruption spanning a total of 24 days. According to a news article, earlier in the week lava flowed mostly N along Sýlingarfell and thickened in some areas, rising higher than the earthen barriers N of Svartsengi; on 18 June lava flowed over the barrier between Sýlingarfell and Grindavíkurvegar, prompting workers to try to stop the advancement of the lava by spraying water on the flows as an experimental defense. By 20 June lava was flowing over the barrier in three places. Firefighters sprayed water on the lava causing steam-and-gas plumes to rise from the slow-moving flows. Large machinery was also utilized to move dirt and strengthen the barrier. The westernmost flow that overtopped the barrier was the most active and continued to advance and thicken during 20-21 June. Tremor levels decreased, indicating that the eruption was decreasing, though a decreasing rate of uplift in the Svartsengi area continued to be recorded in GPS data.
Images from a drone overflight conducted during the morning of 21 June by Almannavarnadeild ríkislögreglustjóra (National Commissioner of the Icelandic Police and Department of Civil Protection and Emergency Management) showed decreased activity at the main crater. Areas of incandescent lava in the crater were visible; lava flows from the crater were not seen, though flows through lava tubes may have been active. Sulfur dioxide emissions were very low. During a drone survey around noon on 22 June no activity in the crater was visible, indicating that the eruption had ceased. Additionally, tremor levels had decreased to levels similar to those recorded before the eruption began. On 24 June IMO noted that still-molten lava continued to advance over the barrier at Sýlingarfell and on the lava field N of the barrier. At 1410 on 25 June IMO lowered the Aviation Color Code to Yellow (the second lowest level on a four-color scale).
Sources: Icelandic Meteorological Office (IMO); Icelandic National Broadcasting Service (RUV); Icelandic National Broadcasting Service (RUV)
IMO reported that the eruption that began on 29 May near Sundhnúk, NE of Sýlingarfell within the Reykanes volcanic system, continued through mid-June. The flow field was an estimated 9.2 square kilometers on 10 June, and the erupted volume was an estimated 41 million cubic meters. The eruption continued during 11-18 June, with lava from one active crater that traveled mostly N alongside Sýlingarfell, fed a lava lake, and then flowed onto the N part of the flow field causing it to thicken. Lava also accumulated S of the crater. Sulfur dioxide pollution from the eruption was notable during 12-13 June, especially near Blue Lagoon and Hafnir, and was expected to continue to impact areas downwind. As of 13 June, the lava flow at Grindavík road advanced very slowly and continued to thicken. Around noon on 17 June a small opening appeared on the W crater rim and fed a lava flow that traveled a short distance W. Drone data collected on 10 June indicated that this is the largest of the five eruptive episodes that have occurred in the area since December 2023, both in terms of area and volume.
Source: Icelandic Meteorological Office (IMO)
IMO reported that the eruption that began on 29 May near Sundhnúk, NE of Sýlingarfell, within the Reykanes volcanic system, continued through 11 June. The lava field had an estimated area of 8.6 square kilometers and the erupted volume was about 36 million cubic meters based on a 3 June drone survey. The estimated flow rate during 29 May-3 June was 30 cubic meters per second. Only one crater was active by the morning of 4 June, and the flow rate had likely decreased. Lava flows advanced NW towards Sýlingarfell and S towards Hagafell on 5 June. On 7 June flows continued to advance N towards Sýlingarfell, causing the flow field in that area to thicken, and continued on expand N and W. Deformation data indicated that deflation had ceased. A small collapse of the crater wall was visible according to a news source. The rate of lava advancement increased during 7-8 June in an area N of Sýlingarfell, towards Grindavíkurvegur. By 1030 on 8 June lava had crossed Grindavík road just to the N of where work was being done to close a gap in an earthen barrier. Lava also moved along the barrier and in some areas flowed over the top. The flows had slowed by noon, reaching 800 m from hot water pipelines. Inflation began to be detected sometime during 8-9 June though the rate of uplift had not been determined. The eruption continued during 9-11 June. Lava continued to accumulate in a lava pond just SE of Sýlingarfell. Notable sulfur dioxide pollution from the eruption was measured in many parts of Reykjavík and in the W part of South Iceland. Vog was noticeable in the W part of the country during the morning of 11 June.
Sources: Icelandic Meteorological Office (IMO); Icelandic National Broadcasting Service (RUV)
IMO reported that the fissure eruption that began at 1246 on 29 May near Sundhnúk, NE of Sýlingarfell, within the Reykanes volcanic system, continued to effuse lava during 30 May-4 June. The fissure consisted of several segments and had a total length of 3.4 km. Just before 1600 explosive activity occurred near Hagafell where magma contacted ground water, producing plumes of steam and brownish ash. Based on data collected during an aerial survey the area of new lava was about 8.7 square kilometers and the erupted volume was an estimated 24 million cubic meters by 1706. The active part of the fissure was 2.4 km long by 1910 and continued to produce lava fountains. Lava flows from the fissure segment just S of Hagafell advanced S and W; part of the S flows advanced into a fissure, traveled beneath the surface, and emerged N of the barrier located NE of Grindavík. Lava flowed over Grindavík road towards Mt. Thorbjorn and along the barriers W of Grindavík, inundating part of Nesvegur road.
Activity significantly declined during 29-30 May and the ground surface in the Svartsengi area had subsided about 15 cm. Volcanic tremor stabilized and explosions were not detected since the afternoon of 29 May. IMO warned that the gas plume could impact areas downwind and had received reports of vog in several areas of the country during 29-31 May. During 30-31 May lava flows from the N end of the fissure flowed E, and flows W of Grindavík did not advance. According to a news report the effusion rate had slowed to around 50 cubic meters per second by 31 May. The lava flows minimally advanced and the flow field inflated. Areas of ponded lava were visible. Three cones had built up along the fissure and lava from two or three cones flowed SW and E during 2-3 June based on news articles. Two cones were active on 3 June and sometime during 0200-0300 on 4 June one of the cones ceased to be active. Lava advanced NW towards Sýlingarfell and then flowed N. An additional 4-6 cm of ground subsidence was detected at Svartsengi.
Sources: Icelandic Meteorological Office (IMO); Iceland Monitor; Iceland Monitor
IMO reported that seismicity increased on 28 May in an area near the Sundhnúkagígar crater row and, along with continuing inflation, possibly indicated rising magma within the Reykanes volcanic system. According to news articles seismicity intensified during the morning of 29 May, prompting the evacuation of workers at the Svartsengi power plant, 35-38 residents of Grindavík (three remained), and visitors and residents at the Blue Lagoon spa area. At 1109 on 29 May IMO reported that the seismic swarm was likely related to a new dike intrusion. The Aviation Color Code was raised to Red (the highest level on a four-color scale) and then decreased back to Orange at 1115 because no additional geophysical data indicated significant changes. An effusive eruption began at 1246 near Sundhnúk, NE of Sýlingarfell, with the propagation of a 1-km-long fissure that produced lava fountains at least 30-50 m high and dense, gas-rich plumes rose along the fissure. Radar data indicated that particulates were present in the plume up to 2 km and gases rose as high as 3 km. By 1415 lava had advanced about 1 km W and to the S, towards Grindavík road. A second fissure opened just W of the main fissure and eruption plumes rose as high as 3.4 km. The extrusion rate was estimated to be 1,500-2,000 cubic meters per second. The fissure continued to propagate and by 1450 it was 3.4 km long. Lava surrounded Hagafell to the E and advanced S towards Melhólsnáma based on an overflight conducted by the Coast Guard. The southernmost part of the fissure was less than 1 km from the lava barriers N of Grindavík, and lava flowed over Grindavík road.
Sources: Icelandic Meteorological Office (IMO); Icelandic National Broadcasting Service (RUV)
IMO reported that no active lava in the cone just E of Sundhnúk and along the fissure within the Reykanes volcanic system was visible in aerial photos taken during the evening of 8 May, indicating that the eruption was over. The Aviation Color Code remained at Orange (the second highest level on a four-color scale) because magma continued to accumulate at depth at a consistent rate, increasing the likelihood of a new eruption. Seismicity was relatively stable with 50-80 earthquakes recorded each day during the previous week. Most of the earthquakes were below M 1, though a few earthquakes had magnitudes close to 2.
Source: Icelandic Meteorological Office (IMO)
On 7 May IMO reported that the cone just E of Sundhnúk and along the fissure within the Reykanes volcanic system continued to erupt lava, though activity had decreased during the previous few days. Lava flowed short distances from the vent; no significant changes were observed at the S part of the flow field near the earthen barriers at Grindavík. Inflation from magma accumulation beneath Svartsengi was first detected at the beginning of April and the rate of inflation was unchanged for the past few weeks based on modeling of GPS and satellite data. Seismicity increased steadily during the past week. Most of the earthquakes were below M 1 and located N of the vent between Sundhnúk and Stóra Skógfell, S of Mt. Thorbjorn in a valley near Grindavík, and in an area between the vent and Grindavík.
Source: Icelandic Meteorological Office (IMO)
IMO reported that the cone just E of Sundhnúk and along the fissure within the Reykanes volcanic system continued to erupt lava. The average effusion rate was 0.9 (± 0.4) cubic meters per second during 15-25 April, whereas during the first half of April the rate was an estimated 3-4 cubic meters per second. By 25 April the lava-flow field was an estimated 6.16 square kilometers with an approximate volume of 34 (± 1.9) million cubic meters. The average thickness of the flows was 5.5 (± 0.3) m.
During 24-30 April lava flowed S through an open channel near the cone and, more distally, through lava tubes. The tubes transported lava to the area NE of Grindavík, inflating the flow field along the constructed barriers there; on 27 April a small flow overtopped the barrier and flowed down to its base. Gas emissions continued to drift downwind and residents were advised to monitor air quality. Inflation from magma accumulation beneath Svartsengi was first detected at the beginning of April and has continued based on modeling of GPS and satellite data, though on 30 April IMO noted that the rate had slowed during the previous few days.
Source: Icelandic Meteorological Office (IMO)
IMO reported that the cone just E of Sundhnúk and along the fissure within the Reykanes volcanic system continued to erupt lava during 15-23 April. Gas emissions continued to drift downwind and residents were advised to monitor air quality. Lava flowed a short distance from the crater mostly S and the flows thickened near the crater. Lava tubes in an area about 1 km SE transported lava to an active flow field N of Hagafell; webcam images showed inflation of the part of the flow field located along the barriers E of Grindavík during 18-23 April. Inflation from magma accumulation beneath Svartsengi was first detected at the beginning of April and continued at a steady rate based on modeling of GPS and satellite data.
The average effusion rate was 3-4 cubic meters per second during 1-15 April. Results from a 15 April overflight where scientists acquired images for mapping showed that the lava-flow field was an estimated 6.15 square kilometers with an approximate volume of 33.2 (± 0.8) million cubic meters.
Source: Icelandic Meteorological Office (IMO)
IMO reported that the eruption at a cone along the fissure within the Reykanes volcanic system continued during 10-15 April. Lava flowed short distance mostly S and the flows thickened near the crater. Inflation continued to be detected and gas emissions continued to drift downwind. Video posted by a news outlet showed lava roiling and spattering in the crater.
Sources: Icelandic Meteorological Office (IMO); Icelandic National Broadcasting Service (RUV)
IMO reported that the eruption along the fissure within the Reykanes volcanic system continued during 3-9 April. Two cones produced lava flows during the beginning of the week, but by 8 April only the larger, main cone was active. Lava flowed mostly S and the flows thickened near the crater and slightly to the S where the flows were most active. On 7 April lava filled the main crater, overflowed the crater rim, and cascaded down the cone’s flank. Part of N crater rim collapsed at 2130 causing lava to flow N; the lava built up a mound, blocking the path, and by the next day most of the lava again flowed S.
The average lava effusion rate decreased from about 6.6 cubic meters per second during 27 March-3 April to about 3.6 cubic meters per second during 3-8 April. During an overflight on 8 April observers confirmed that there had been a gradual decrease in the intensity of the eruption. The lava-flow field was an estimated 6.14 square kilometers with an approximate volume of 31.1 million cubic meters. Concurrent with a decrease in eruption intensity, inflation had accelerated. Seismicity continued to be at low levels and was concentrated between Sylingarfell and Stóra-Skógfell, and in the W part of Grindavík. Sulfur dioxide emissions continued to be high around the eruption site and were detected in residential areas downwind. On 3 April the Civil Protection Emergency Level was lowered to the middle level on a three-level scale. The Aviation Color Code remained at Orange (the second highest level on a four-color scale).
Sources: Icelandic Meteorological Office (IMO); Almannavarnadeild ríkislögreglustjóra (National Commissioner of the Icelandic Police and Department of Civil Protection and Emergency Management)
IMO reported that an average lava effusion rate from vents along the fissure within the Reykanes volcanic system was estimated to be 7.8 (plus or minus 0.7) cubic meters per second during 20-27 March, based on a 27 March satellite image. The lava-flow field was about 5.99 square kilometers with an approximate volume of 25.7 (plus or minus 1.9) million cubic meters. Lava flows continued to advance S over older flows emplaced during the beginning of the eruption. Satellite data from 26 March showed that the flow field was expanding to the W in the area S of Hagafell as well as in areas E and S of the active vents. Almost no seismicity was detected. Lava continued to erupt from vents during 27 March-2 April, though by 31 March two of three vents were active and the cones continued to grow. Inflation ceased to be detected during the week. IMO warned that the margins of the lava flows were tall in some places and that sudden breakouts of lava or collapses of material were possible. Wildfires had been noted near the margins of the flow field. The Aviation Color Code remained at Orange (the second highest level on a four-color scale).
Source: Icelandic Meteorological Office (IMO)
According to the Icelandic Meteorological Office (IMO), eruptive activity along the fissure that opened on 16 March began to stabilize on 20 March, with vents remaining in the same locations as previous days where cones had been built. The lava flows traveled S on top of older flows from the previous episodes in December 2023 and January-February 2024. Little or no change was observed at the flow fronts near Suðurstrandarvegur (the southern coast road) and Svartsengi. Lava began to flow into Melhólsnáma mine during 23-24 March, eventually filling it. Seismicity remained low. Early SO2 flux measurements from 17 March were up to 50 kg/s, but preliminary results from a more recent measurement indicated that the rate had decreased substantially. On the morning of 20 March, the National Land Survey of Iceland and the Institute of Natural History conducted aerial photography flights. Based on image analysis, an average discharge rate of 14.5 cubic meters per second during 17-20 March was estimated, and the new lava field was about 5.58 square kilometers with a volume of 20.9 million cubic meters. By 25 March the eruptive activity had decreased and possibly ceased at the smaller cones. The cones that remained active continued to grow, and the main lava flow extended south and bent westward. Seismicity and volcanic tremor gradually decreased. GPS monitoring continued to detect inflation at Svartsengi, but at a slower rate. High levels of SO2 were measured in Höfn and Grindavík over the past few days, and IMO warned of risk associated with gas emissions.
Sources: Icelandic Meteorological Office (IMO); Almannavarnadeild ríkislögreglustjóra (National Commissioner of the Icelandic Police and Department of Civil Protection and Emergency Management)
After about 40 minutes of increased seismicity and ground deformation, a fissure eruption within the Reykanes volcanic system began at 2023 on 16 March near the older Sundhnúkagígar crater row on the Reykjanes Peninsula, prompting IMO to raise the Aviation Color Code to Red (the highest level on a four-color scale). According to a news report about 700 people at the Blue Lagoon spa and the few people in Grindavík were evacuated within about a 30-minute period. IMO noted that the fissure quickly lengthened to 2.9 km and that the length and location was similar to the 8 February fissure eruption. The fissure was oriented roughly NE-SW and small fissure segments were aligned in the same orientation but offset at each end. A steam-and-gas-rich plume rose above 3 km; no ash was evident in the plume so IMO lowered the Aviation Color Code to Orange at 2122. Lava fountaining occurred along the length of the fissure and lava flows advanced E, SE, SW, and NW at a rate of about 1 km per hour. By 2210 the S flow was about 200 m from the earthen barriers constructed to protect the E part of Grindavík. Lava advanced NW, curved around the Stóra Skógfell cones, and then flowed SW; by 2220 lava was 700-800 m from Grindavíkurvegur (Road 43) and advancing towards the road at a rate of about 660 m per hour. At around 0030 on 17 March lava flowed W over the road, along the earthen barrier, and towards the water distribution pipe from the Svartsengi power plant; the flow slowed during the morning about 200 m from the pipe, only advancing minimally.
Eruptive activity decreased overnight during 16-17 March. Seismicity significantly decreased with only a few earthquakes recorded after 0300 on 17 March, coinciding with decreased tremor. Lava flows to the S were diverted from Grindavík along the barriers towards the SE. The effusion rate decreased substantially at around 0400, and lava was produced by a segment near the middle of the fissure that was 500 m long. By 1300 lava fountaining was concentrated at three areas along the fissure. The S flow advanced at a rate of about 12 m per hour during 1015-1630 and a few hours later the leading lobe was about 330 m from Suðurstrandarvegur, the main road along the S coast of the Reykjanes Peninsula. During the morning sulfur dioxide emissions peaked at 15,000 micrograms per cubic meter and emissions detected by satellite that day were the highest measured of the recent 2023-2024 eruptions. Sulfur dioxide fluxes were as high as 50 kilograms per second. A news articles noted that some small lava ponds formed near the Grindavík barriers and at the flow near Suðurstrandarvegur. The area of the flow field was an estimated 5.85 square kilometers based on a satellite image acquired at 1456 on 17 March.
The eruption continued at stable levels during 18-19 March. Lava activity was concentrated at a series of vents which had built cones at the S end of the fissure; occasional fountaining was observed. The lava flows that had crossed Grindavíkurvegur and stopped near Suðurstrandarvegur were slow moving. Deformation data suggested that magma continued to flow into the dyke system. According to Almannavarnadeild ríkislögreglustjóra (National Commissioner of the Icelandic Police and Department of Civil Protection and Emergency Management) Grindavík residents were permitted to return to town on 19 March, though it was not recommended that they stay overnight. The Blue Lagoon remained closed.
Sources: Icelandic Meteorological Office (IMO); Almannavarnadeild ríkislögreglustjóra (National Commissioner of the Icelandic Police and Department of Civil Protection and Emergency Management); Icelandic National Broadcasting Service (RUV); Simon Carn
IMO reported that magma continued to accumulate beneath Svartsengi after the 8-9 February eruption and by 1230 on 29 February had reached an estimated 8.5-9 million cubic meters. The accumulated volume of magma before previous recent eruptions near the Sundhnúkar crater row was 8-13 million cubic meters. The rate of inflation had been relatively constant; the inflation had decreased just before the start of previous eruptions.
An intense seismic swarm began at 1555 on 2 March near the southern end of the fissure that formed on 18 December 2023. The seismic data suggested that magma was migrating S and not propagating to the surface. IMO raised the Aviation Color Code to Orange (the second highest level on a four-color scale) at 1651. According to a news article the Blue Lagoon tourist area and Grindavík were evacuated, though not many people were in Grindavík at the time. Deformation changes were noted by 1730, followed by a decline in seismicity around 1800 and the end of the swarm by 2000; the intrusion had stopped beneath Hagafell cone. The Aviation Color Code was lowered to Yellow at 0812 on 3 March. The volume of lava that propagated out of Svartsengi was small compared to previous episode that culminated in eruptions. The Blue Lagoon reopened to visitors on 4 March.
Sources: Icelandic Meteorological Office (IMO); Icelandic National Broadcasting Service (RUV)
A fissure eruption in the area between Sundhnúkur and Stóra Skógfell on the Reykjanes peninsula began at 0602 on 8 February after around 30 minutes of intense seismic activity, prompting IMO to raise the Aviation Color Code to Red (the highest level on a four-color scale). During a helicopter overflight the location of the fissure was confirmed to be near the 18 December 2023 fissure, less than 1 km NE of Sylingarfell. The fissure lengthened to 3 km N-S, with lava flows moving W and E. Lava fountains along the fissure rose 50-80 m high and a volcanic plume mainly comprised of gas and steam rose to 3 km. IMO lowered the Aviation Color Code to Orange at 0626, noting that ash was not present in the plume. Tephra fall was reported in parts of Grindavík, 3-5 km S of the fissure. Visitors to the Blue Lagoon were evacuated; there were no residents in Grindavík due to previous evacuations.
Deformation in the dike area had significantly decreased by noon, and the intensity of the eruption had also declined, with only three active craters along the fissure. Emissions from the fissure drifted SW. Lava advanced N, curving around the Stóra Skógfell cones and branching to the SW. The SW branch advanced at a rate of about 500 m per hour, according to a news article, and flowed over both Grindavíkurvegur (Road 43) and Bláalóns-road, at the exit for the Blue Lagoon, at around noon. Lava also advanced over the pipeline that supplied hot water to Svartsengi. Power lines were also affected by the flows, though electricity was restored later that day.
Minor explosive activity generated from the interaction of magma and ground water began during 1300-1400 on 8 February and produced dark plumes rising as high as 2.5 km from the middle of the fissure and drifting S. The explosive activity was mainly over by 1715 and the intensity of the eruption continued to decrease. Deformation was no longer being detected, suggesting that magma was no longer ascending at the same pressure as at the beginning of the eruption. Seismic activity significantly decreased after the onset of the eruption and remained at low levels with only about 20 small earthquakes recorded during 0800-1715. Lava flowed as far as 4.5 km W of the fissure. Activity and tremor levels fluctuated at low levels during the evening of the 8th and further decreased during 0700-0800 on 9 February, with only two craters active. No fountains were visible mid-morning; a drone overflight at around noon confirmed that activity had ceased. IMO lowered the Aviation Color Code to Yellow at 1713.
Deformation data suggested that inflation began again after the eruption had ended; model calculations showed that during 9-14 February an estimated two million cubic meters of magma had accumulated beneath the Svartsengi area, or about 20% of the volume of magma that had accumulated before the 8 February eruption. The hot water pipeline was restored by 12 February and the Blue Lagoon reopened to visitors on 16 February.
Sources: Icelandic Meteorological Office (IMO); Icelandic National Broadcasting Service (RUV); Icelandic National Broadcasting Service (RUV)
IMO reported that a seismic swarm began near the older Sundhnúkagígar crater row on the Reykjanes peninsula around 0230 on 14 January. Both GPS data and borehole pressure readings indicated that magma was moving. IMO raised the Aviation Color Code to Orange (the third level on a four-color scale), noting an increased likelihood of an eruption. The locations of the earthquakes shifted towards the town of Grindavík where, according to Almannavarnadeild ríkislögreglustjóra (National Commissioner of the Icelandic Police and Department of Civil Protection and Emergency Management), evacuations started around 0300.
A fissure eruption began at around 0757 just N of Grindavík, SE of Hagafell, and was visible on webcams. The Aviation Color Code was raised to Red, but then lowered back to Orange at 0826 because no ash was detected in radar data. A Coast Guard helicopter was dispatched to investigate the eruption site. A NE-SW-trending fissure was visible and notably lengthened within about 10 minutes according to a news article. The fissure grew to about 900 m long and crossed through the eastern part of a curving E-W-oriented earthen berm built to deflect lava flows away from the town. Lava fountaining occurred along the length of the fissure. Lava spread perpendicular from the fissure and to the SW, covering the E half of the berm, though the longest flow traveled WSW along the berm and away from the town. Construction workers managed to reach their heavy equipment that was being used to build the berm and drive them to safety away from the lava flows. Lava covered part of Grindavíkurvegur road and overtopped a small area of the berm at the road, flowing S.
A shorter second fissure that was about 100 m long opened at 1210 on 14 January to the SW of the first and S of the berm, about 200 m from the Efrahópi neighborhood in Grindavík. Lava flows traveled S, entering the town and setting at least three houses on fire. This fissure was no longer active by 1640 on 15 January and the effusion rate at the larger, main fissure had decreased. Seismicity and the rate of deformation had also decreased, though deformation near the S part of the magmatic dike near Grindavík continued to be detected. Displacement within the town was as high as 1.4 m during 14-15 January; ground cracks had developed, and existing ones had expanded. Thermal images from a 15 January drone flight indicated that previously mapped fissures SW of Grindavík had significantly enlarged. Lava effusion at the longer fissure was concentrated at two of four main vents. Lava effusion at the main fissure ceased around 0100 on 16 January. Seismicity continued to decrease, though event locations indicated that magma movement continued. Most of the seismic activity was concentrated near Hagafell, close to the main fissure. IMO lowered the Aviation Color Code to Yellow at 2105, noting the ongoing decline of seismicity.
A man working on filling cracks in Grindavík fell into one of the cracks on 10 January and was unable to be located. Hundreds of rescue workers searched for the man but due to unsafe conditions and landslides occurring inside the crack the search was stopped on 12 January.
Sources: Independent; Icelandic Meteorological Office (IMO); Almannavarnadeild ríkislögreglustjóra (National Commissioner of the Icelandic Police and Department of Civil Protection and Emergency Management); Icelandic National Broadcasting Service (RUV)
IMO reported that the eruption on the Reykjanes peninsula from fissures that had opened on 18 December near the older Sundhnúkagígar crater row, about 3 km NE of the town of Grindavík, had stopped by the morning of 21 December. There was a significant decrease in seismicity during 19-20 December, and by 1700 on 20 December lava was erupting from only two craters located at the central part of the fissure. Lava mainly flowed E, though to the N of Stóra-Skógfell a flow to the W continued to be fed but was no longer advancing. Eruptive activity declined later that night or early on 21 December and seismicity continued to decline. Scientists on an overflight during the morning of 21 December confirmed that no eruptive activity was visible and that lava effusion at the craters had ceased. Some areas on the lava-flow field were incandescent, and it was possible that lava continued to flow through tubes. At 1459 on 22 December IMO lowered the Aviation Color Code to Yellow (the second level on a four-color scale) noting that there were no active vents. A total of about 12 million cubic meters of lava had erupted, covering an area of about 3.4 square kilometers.
Seismicity persisted in the Grindavík, Sundhnúksgígar, and Svartsengi regions, was variable daily, though low overall. Ground deformation data from GPS and satellite-based measurements indicated that magma accumulation beneath the Svartsengi region continued. A new hazard assessment and updated map went into effect on 22 December; the areas around the fissure were reduced from very high to high, and the assessment for Grindavík was unchanged (remaining “considerable”).
Source: Icelandic Meteorological Office (IMO)
IMO reported that a new eruption on the Reykjanes peninsula began at 2217 on 18 December from fissures that opened in a location close to the older Sundhnúkagígar crater row, about 3 km NE of the town of Grindavík. A magmatic dike began intruding beneath the area in late October based on seismic and deformation data; magma continued to flow into the dike causing ground cracking in areas along its axis. The eruption was immediately preceded by an earthquake swarm that began at 2100 on 18 December and the opening of the fissure was accompanied by significant ground deformation.
Increased seismicity and a burst of incandescence indicating the start of the eruption was seen in webcam images. IMO raised the Aviation Color Code to Red (the highest level on a four-color scale) until the situation was able to be evaluated and in case ash was present in any emissions. After the first fissure opened, it propagated S in a series of four additional segments, slightly offset from each other but aligned with the previous dike intrusion. The total length of the fissure was estimated to be 4 km, with the north end just E of the Stóra-Skógfell cones and the south end E of the Sundhnúk cone. Large lava fountains possibly rose hundreds of meters high along the fissures, feeding lava flows in multiple directions. The rate of lava discharge during the first two hours of the eruption was about 100-200 cubic meters per second. The tallest lava fountains were located on the N end of the fissure. The largest earthquake, a M 4.1, was recorded at 2325. The Aviation Color Code was lowered to Orange. By midnight seismicity had declined and the eruption was less intense.
During a second overflight with the Iceland Coast Guard at around 0400 on 19 December scientists noted that the fissure had stopped extending and that most of the activity was concentrated in the central portion. There was minor activity at the S end, near the Hagafell cone, and most of the lava was advancing E towards Fagradalsfjall. Two branches traveled W, remaining N of Stóra-Skógfell. Gas plumes drifted W and NW. Residents of Grindavík, evacuated in November due to ground cracking and unsafe conditions, had recently been allowed to return and allowed to stay until 2100, but not overnight; they again fully evacuated the town due to the eruption. The recently reopened Blue Lagoon resort closed again. Some area roads were also temporarily closed.
Eruptive activity concentrated at five vents during the early part of 19 December. By 1430 the lava discharge rate was about one-fourth the rate measured at the beginning of the eruption and about one-third of the fissure was active. Lava fountains were lower, rising as high as about 30 m. The eruption intensity continued to decline and by 1830 only three vents were erupting. About 5 cm of deflation was detected in Svartsengi; a total of 35 cm of uplift had been recorded there since the beginning of the dike intrusion in November. The power plant in Svartsengi, W of the fissure, was not threatened by the current lava flows, though construction of an earthen barrier around it and the Blue Lagoon continued.
Sources: Icelandic Meteorological Office (IMO); Icelandic National Broadcasting Service (RUV)
On 22 November the Icelandic Meteorological Office (IMO) lowered the Aviation Color Code for Reykjanes to Yellow (the second level on a four-color scale), noting that seismicity associated with the magmatic dike intrusion had decreased during the previous week. Although inflation continued to be detected at Svartsengi, they determined that the likelihood of an eruption had decreased. During 22-27 November seismic activity was relatively stable at a rate of about 500 earthquakes per day, with most events concentrated near Sýlingarfell and Hagafell. Sometimes around midnight on 27 November an hour-long seismic swarm occurred in the vicinity of Sýlingarfell. A total of 170 earthquakes were recorded and located at depths of 3-5 km; the largest event was an M 3. Seismicity slowly decreased during 28-29 November and most of the events were small, below M 1. The rate of deformation also declined, though uplift at Svartsengi continued at around 1 cm per day. The seismic and deformation data suggested that magma continued to flow into the middle portion of the dike.
Source: Icelandic Meteorological Office (IMO)
Icelandic Meteorological Office (IMO) reported that intense seismicity and deformation at the Reykjanes volcanic system, caused by a magmatic dike intrusion with no surface eruption, was ongoing during 15-21 November. Seismicity during the week was relatively stable with 1,500-2,000 daily earthquakes; the number of events decreased during 20-21 November with only 165 recorded during 0000-1530. Earthquakes were mostly located at depths averaging 4 km.
Most of the earthquakes were located near the middle of the dike, near Hagafell, 3.5 km NNE of Grindavík, and near Sundhnúk, about 1 km NE of Hagafell and about 2 km ENE of Mt. Thorbjorn. Most earthquakes were less than M 2 during 15-16 November and less than M 1 during 16-17 November; the largest event during the week was an M 3 recorded on 17 November. On 16 November sulfur dioxide gas was measured from a borehole located at Svartsengi, N of Mt. Thorbjorn, and extended E to a notable depth. The presence of sulfur dioxide was another indication of the magma intrusion N of Hagafell. In addition to earthquake detected by the seismic network, new technology using the high-sensitivity fiber optic cable that runs from Svartsengi, W of Mt. Thorbjorn, to Arfadalsvík was also collecting seismic data.
Deformation data was consistent with magma flowing into the dyke at depths greater than 5 km. On 17 November GPS data from instruments in and around Grindavík, near the center of the subsidence zone, indicated about 3-4 cm of subsidence per day. Analysis of COSMO-SkyMed radar interferogram data from 18-19 November showed that 30 mm of uplift was centered in the vicinity of Svartsengi, about 2 km N of Hagafell. Uplift was recorded in that same area before the 10 November magmatic intrusion, thought the rate had accelerated. The uplift aligned with the margins of the intrusion, whereas subsidence was located above the intrusion itself. The deformation and seismic data indicated that Hagafell, where the intrusion was modeled to be the widest, was the most likely location for an eruption.
The Blue Lagoon geothermal pool was closed on 9 November and planned to remain closed at least until 30 November. Residents of Grindavík evacuated on 10 November, due to the uncertainty of an eruption and the onset of ground cracking and damaged infrastructure; access to the town continued to be restricted with only periodic entry allowed for residents to collect belongings. During the week ground cracks and sinkholes opened in and around Grindavík, affecting streets and buildings. Construction of earthen barriers began by 15 November to protect the Svartsengi power station, which supplies tens of thousands of people with electricity and hot water; new wells were being drilled to produce a back-up water supply. An 18 November news report indicated that most of the houses in Grindavík were undamaged, but some had been damaged along a big crack that goes through the town; a few homes were destroyed.
Sources: Icelandic Meteorological Office (IMO); Icelandic National Broadcasting Service (RUV); Almannavarnadeild ríkislögreglustjóra (National Commissioner of the Icelandic Police and Department of Civil Protection and Emergency Management); mbl.is
The Icelandic Meteorological Office (IMO) reported increased seismic activity and deformation caused by a magmatic dike intrusion with no surface eruption through 14 November in the eastern Reykjanes-Svartsengi volcanic system on the Reykjanes Peninsula, W of the Fagradalsfjall fissure system that produced lava flows during eruptions over the previous three years. Due to increased local seismicity recorded since 25 October, the onset of ground inflation on 27 October, geophysical models of the magma intrusion, and uncertainties associated with a possible eruption site, the National Police Commissioner evacuated approximately 4,000 residents from the coastal town of Grindavík on 10 November. IMO is responsible for volcano monitoring in Iceland, in coordination with scientists from the University of Iceland, and the Department of Civil Protection and Emergency Management.
An intense seismic swarm occurred during the night of 8-9 November; seven earthquakes (max. M 4.0) were centered in the area from Eldvörp to E of Sýlingarfell, with the largest measuring M 4.8 at 0046 on the 9th located W of Mt. Þorbjörn. Ground uplift continued to be detected in GPS and satellite data, with the highest rates occurring NW of Þorbjörn. Geophysical models estimated the depth to the top of the intrusion was estimated to be ~800 m. On 10 November an intense seismic swarm at a depth of 5 km began near Sundhnjúkagigar, NE of Þorbjörn, around 0700 and increased further at 1500. More than 800 earthquakes were detected on 11 November at depths of 3-3.5 km and seismic activity migrated S towards Grindavík. IMO attributed the shallow seismicity to the intrusion extending from Stóra-Skógsfell, ~6 km NNE of Grindavík, to beneath Grindavík, and offshore. Data acquired from satellite radar showed a graben-like are of deflation cutting through Grindavík. Analysis of COSMO-SkyMed (CSK) radar interferogram data from 3-11 November indicated that the intrusion was about 15 km long at a minimum depth of less than 1 km.
Geodetic models on 12 November showed that an area of inflation was located 3.5 km N of Grindavík, close to Sundhnúkur. Approximately 1,000 earthquakes, less than M 3.0, were detected N of Grindavík at 3-5 km depths between 0000 and 1230 on 12 November. On 13 November, the size and intensity of earthquakes decreased, when approximately 900 earthquakes were detected at depths of 2-5 km between 0000 and 1620 in the area between Sundhnúkur and Grindavík. During 12-13 November, calculations estimated that the magma inflow to the intrusion was 75 cubic meters per second. Between 0000 and 1240 on 14 November, 700 earthquakes occurred at depths of 3-5 km along the intrusion; the largest was M 3.1. After IMO installed two Differential Optical Absorption Spectrometers (DOAS, remote sensing gas instruments) on Húsafell, one of them detected SO2 at the graben-like feature between Sundhnúkagígar and Grindavík, but the source was unknown. Additional GPS stations have also been installed to monitor deformation.
Sources: Icelandic Meteorological Office (IMO); Icelandic National Broadcasting Service (RUV); Almannavarnadeild ríkislögreglustjóra (National Commissioner of the Icelandic Police and Department of Civil Protection and Emergency Management)
IMO reported that increased seismicity and deformation at the Reykjanes Peninsula were ongoing during 1-7 November and indicated magma accumulation at depths of 4-5 km in an area NW of Mt. Thorbjorn. A total of 7 cm of uplift was recorded in satellite data and by the Global Navigation Satellite System (GNSS) station near Mt. Thorbjorn during 27 October-6 November. The rate of inflation was fairly constant though it began to accelerate on 3 November. Data models indicated that the volume change associated with the uplift was double that of the four previous inflation events recorded during 2020-2022; the inflow of magma was estimated at 7 cubic meters per second, or four times greater than the highest inflow rate recorded during the previous events.
Intense seismicity continued. Over 10,500 earthquakes were detected during 25 October-1 November, out of which more than 26 exceeded M 3 and the largest was a M 4.5 recorded at 0818 on 25 October. Seismicity increased for early on 3 November, and then notably decreased around 1730. The signals were located along previously known faults, aligned in a N-S direction W of Mt. Thorbjorn. There was no indication of magma migrating to the surface. During 4-7 November there were around 2,200 earthquakes, which were located between Mt. Thorbjorn and Sýlingafell during 6-7 November.
Source: Icelandic Meteorological Office (IMO)
IMO reported that an intense earthquake swarm on the Reykjanes Peninsula began on 24 October. By 1700 on 26 October more than 4,000 earthquakes had been located at depths of 2-6 km. A total of 14 earthquakes had a magnitude over M 3; the largest event, a M 4.5, was recorded at 0818 on 25 October. Most of the activity occurred between Stóra-Skogafell and an area NE of Eldvörp. No ground deformation was recorded, though a single GPS station (FEFC), E of Festarfjall, recorded localized movement to the SE. During 25-26 October the displacement recorded by the FEFC station totaled about 2 cm and movement was also detected at a station in Selatangar. The swarm continued and by 1400 on 27 October more than 5,800 earthquakes had been recorded; a M 4 earthquake occurred at 0402 on 27 October and was located about 2 km N of Grindavík.
Seismicity decreased considerably by 1330 on 28 October, though the swarm was ongoing with a total of more than 7,000 earthquakes. Uplift centered around Svartsengi, 1.5 km NW of Mt. Thorbjorn, was clearly evident in satellite radar and GPS data. The uplift had begun at some point the previous day and likely signified a magmatic intrusion at depth. IMO raised the Aviation Color Code for Reykjanes to Yellow (the second level on a four-color scale) at 1518 on 28 October. During 1130 on 29 October to 1130 on 30 October about 1,300 earthquakes occurred at depths of 2-4 km. The largest event was a M 2.7 at 1140 on 29 October. Uplift continued during 28-31 October, though the rates began to decrease. Modeling suggested that magma was accumulating at a depth of about 4 km. An earthquake swarm began at 0840 on 31 October and lasted about two hours. The events were located at depths of 1.5-5 km and indicted that magma was moving.
Source: Icelandic Meteorological Office (IMO)
On 2 June IMO reported that the rate of uplift on the Reykjanes Peninsula had significantly decreased, and seismicity had been declining, with only about 150 earthquakes recorded the previous day. The Aviation Color Code was lowered to Green because the data indicated no magma movement.
Source: Icelandic Meteorological Office (IMO)
IMO reported an ongoing seismic swarm and uplift on the Reykjanes Peninsula, indicative of a magma intrusion. Satellite data analysis indicated that 4-4.5 cm of uplift occurred during 27 April-21 May centered just NW of Mt. Thorbjorn. Magma was accumulating at depths of 4-5 km, and the intrusion was possibly 7-8 km long. During 22-23 May about 400 earthquakes were recorded; a M 3 earthquake was recorded at 1113 on 22 May and a M 3.5 earthquake was recorded at 0715 on 23 May, both were located about 3 km E of Mt. Thorbjorn. The Aviation Color Code for Reykjanes remained at Yellow.
Sources: Icelandic Meteorological Office (IMO); Icelandic National Broadcasting Service (RUV)
The National Commissioner of the Icelandic Police declared a level of “uncertainty” for the Reykjanes Peninsula on 15 May, noting that the declaration meant that responders and agencies were to review their preparedness plans in response to recent increases in seismicity and deformation. IMO raised the Aviation Color Code for Reykjanes to Yellow on 16 May, stating that more than 3,000 earthquakes had been detected near Eldvörp in the Reykjanes/Svartsengi volcanic system during the past week. Nine earthquakes above M 3 and two earthquakes above M 4 were recorded during 15-16 May; the largest event was a M 4.3 which was recorded at 1738 on 15 May. The earthquakes were located at depths of 4-6 km. GPS and InSAR data detected inflation W of Thorbjörn during the previous two weeks, likely caused by a magmatic intrusion at 4-5 km depth.
Sources: Icelandic Meteorological Office (IMO); Almannavarnadeild ríkislögreglustjóra (National Commissioner of the Icelandic Police and Department of Civil Protection and Emergency Management)
IMO reported that a M 5.6 earthquake was recorded at 1343 on 20 October beneath Nupshlidarhals, a hill about 5 km W of the geothermal area in Seltun. This was the largest earthquake since 2003 recorded in the Reykjanes peninsula. There were about 1,700 aftershocks recorded in the following 24-hour period. IMO received reports of rockfalls in steep areas and increased gas odors in the vicinity of Graenavatn at Nupshlidarhals. Four landslides were noted near the epicenter; some existing ground cracks were displaced and new cracks had formed in Krysuvikurbjarg. On 26 October IMO stated that seismic activity had significantly decreased in recent days; about 180 earthquakes below M 2.2 had been detected during the previous two days.
Source: Icelandic Meteorological Office (IMO)
IMO reported that a third injection of magma since the beginning of the year was occurring beneath the Reykjanes peninsula. Data suggested that the current inflationary period began in mid-May, though earthquake activity did not increase until around 30 May. During 30 May-15 June the seismic network recorded more than 2,000 events, with the largest, an M 3.4, recorded on 13 June. The intrusion was located about 1 km W of Thorbjorn at a depth of 3-4 km, and had an estimated volume of about 1.2 million cubic meters. This third intrusion was similar to the previous two intrusions, characterized as a sill that was a few hundred meters wide and about 6 km long. In total about 12 cm of uplift has been recorded since January. The Svartsengi geothermal plant noted no chemical changes in the geothermal system, though measurements showed increased fluid flow in the rocks within the system, along with the opening of old cracks and the formation of new ones.
Source: Icelandic Meteorological Office (IMO)
IMO reported that uplift detected in the Thorbjorn area decreased in the beginning of April and stopped later in the month. Seismicity, which had occurred across three main volcanic systems: Eldey, Reykjanes-Svartsengi, and Krýsuvík, had significantly decreased. These data indicated that the injection of magma beneath Thorbjorn had stopped, though there were indications of deformation over a larger area. On 4 May the Aviation Color Code was lowered to Green.
Source: Icelandic Meteorological Office (IMO)
There were more than 6,000 earthquakes recorded beneath the Reykjanes peninsula as of 26 March, making this period of unrest the largest seismic crisis ever recorded in this part of the country since digital monitoring started in 1991, according to IMO. The seismicity occurred across three main volcanic systems: Eldey, Reykjanes-Svartsengi, and Krýsuvík. Uplift continued to be detected in the Thorbjorn area totaling about 70-80 mm; the deformation rate was lower than in January and February. Deformation modeling suggested that recent inflation was caused by a second magmatic intrusion at a depth of 3-4 km in an area W of Thorbjorn, close to the intrusion that occurred at the beginning of the year. GPS data suggested a small deformation pattern detectable over a regional area, far beyond the Thorbjorn area.
Source: Icelandic Meteorological Office (IMO)
On 18 March IMO raised the Aviation Color Code for Reykjanes to Yellow noting that recent InSAR and GPS data indicated that during the second week of March deformation had restarted. The uplift was concentrated in the same place as that recorded in January-February, though at a slower rate. The cause of the deformation was likely an intrusion of magma at 4.5 km depth.
A large (M 4.6) earthquake was recorded on 12 March and located 3.5 km NE of Thorbjorn, possibly connected to the inflation. A sequence of aftershocks lasted for a few days and was characterized by eight earthquakes over M 3 and about 80 events with magnitudes between 2 and 3. Since the large event a total of 850 earthquakes were recorded in the area.
Source: Icelandic Meteorological Office (IMO)
On 25 February IMO reported that seismic activity at Reykjanes, in an area N of the town of Grindavík, had significantly decreased during the previous few days, and inflation was not detected in GPS and InSAR data. The Aviation Color Code was lowered to Green. Preliminary data suggested a small deflation signal beginning mid-February, though further analysis was needed for confirmation. The report warned the public not to explore lava tubes in the Eldvörp area as gas measurements showed a dangerous level of oxygen depletion; there are no pre-unrest measurements existing for comparison.
Source: Icelandic Meteorological Office (IMO)
On 15 February IMO reported that seismicity at Reykjanes, in an area N of the town of Grindavík, remained above background levels even though activity had been decreasing since the end of January. Two earthquakes larger than M 3 were detected; one of them, an M 3.1, was recorded at 0826 on 14 February. The rate of deformation had slightly increased. The Aviation Code remained at Yellow.
Source: Icelandic Meteorological Office (IMO)
On 7 February IMO reported that data collected during the previous week indicated that a magma body was located 3-5 km beneath Reykjanes. Earthquake activity had decreased during the previous two days, though inflation was ongoing, reaching 5 cm. The Aviation Code remained at Yellow.
Source: Icelandic Meteorological Office (IMO)
IMO reported possible magma accumulation beneath Reykjanes, centered along the plate boundary below the Svartsengi fissure system, just W of Thorbjorn. Deformation began on 21 January and was unusually rapid, with the rate of inflation occurring at 3-4 mm per day (3 cm total by 29 January), as detected by InSAR and continuous GPS data. Magma accumulation, if that was causing the inflation, was small with an estimate volume of 1 million cubic meters, at 3-5 km depth. Deformation on the Reykjanes peninsula had been measured for three decades with no previously comparable signals.
An earthquake swarm accompanied the deformation, just E of the center of the inflation. The largest earthquakes were M 3.6 and 3.7, recorded on 22 January, and felt widely on the Reykjanes peninsula and all the way to Borgarnes region. Earthquake swarms are relatively common, though coupled with deformation caused IMO to raise the Aviation Code to Yellow on 26 January. The swarm was declining by 26 January. On 29 January IMO stated that data showed continuing uplift and the earthquake swarm was ongoing.
Source: Icelandic Meteorological Office (IMO)
The Global Volcanism Program has no Bulletin Reports available for Reykjanes.
This compilation of synonyms and subsidiary features may not be comprehensive. Features are organized into four major categories: Cones, Craters, Domes, and Thermal Features. Synonyms of features appear indented below the primary name. In some cases additional feature type, elevation, or location details are provided.
Cones |
||||
| Feature Name | Feature Type | Elevation | Latitude | Longitude |
| Bergholl | Shield volcano | 37 m | 63° 53' 0" N | 22° 44' 0" W |
| Haleyjabunga | Shield volcano | 30 m | 63° 49' 0" N | 22° 39' 0" W |
| Hrolfsvikurhraun | Shield volcano | 63° 50' 0" N | 22° 20' 0" W | |
| Lagafell | Shield volcano | 91 m | 63° 53' 0" N | 22° 33' 0" W |
| Langholl | Shield volcano | 73 m | 63° 53' 0" N | 22° 40' 0" W |
| Sandfellshaed | Shield volcano | 74 m | 63° 52' 0" N | 22° 35' 0" W |
| Skalafell | Shield volcano | 76 m | 63° 49' 0" N | 22° 42' 0" W |
| Thrainsskjöldur | Shield volcano | 63° 53' 0" N | 22° 12' 0" W | |
| Vatnsheidi | Shield volcano | 140 m | 63° 51' 0" N | 22° 23' 0" W |
Craters |
||||
| Feature Name | Feature Type | Elevation | Latitude | Longitude |
| Arnarsetur | Crater Row | 80 m | 63° 53' 0" N | 22° 25' 0" W |
| Badsvallagigir | Crater Row | 63° 53' 0" N | 22° 25' 0" W | |
| Borgarhraun | Crater Row | 121 m | 63° 50' 0" N | 22° 19' 0" W |
| Dalahraun | Crater Row | 63° 52' 0" N | 22° 20' 0" W | |
| Eldeyjarbodi | Submarine crater | 63° 26' 0" N | 23° 50' 0" W | |
| Eldvorp | Crater Row | 60 m | 63° 51' 0" N | 22° 35' 0" W |
| Fellshraun | Crater Row | 63° 53' 0" N | 22° 25' 0" W | |
| Geirfugladrangur | Submarine crater | 63° 26' 0" N | 23° 17' 0" W | |
| Grjothryggur | Submarine crater | |||
| Gullholl | Submarine crater | |||
| Haugur | Crater Row | 63° 52' 0" N | 22° 37' 0" W | |
| Hreidhur | Crater Row | 63° 50' 0" N | 22° 40' 0" W | |
| Illahraun | Crater Row | 40 m | 63° 52' 0" N | 22° 28' 0" W |
| Kalfellshraun | Crater Row | 63° 56' 0" N | 22° 19' 0" W | |
| Klofningahraun | Crater Row | 63° 50' 0" N | 22° 33' 0" W | |
| Langagrunn | Submarine crater | |||
| Melholl | Crater Row | 140 m | 63° 50' 0" N | 22° 25' 0" W |
| Raudholar | Crater Row | 40 m | 63° 50' 0" N | 22° 40' 0" W |
| Reykjaneshyggur | Fissure vent | 80 m | 63° 40' 0" N | 22° 20' 0" W |
| Stampar | Crater Row | 30 m | 63° 50' 0" N | 22° 42' 0" W |
| Steinaholl | Submarine crater | |||
| Stori-Brandur | Submarine crater | |||
| Sundhnukar | Crater Row | 100 m | 63° 53' 0" N | 22° 23' 0" W |
| Svartsengi | Fissure vent | |||
| Syrfellshraun | Crater Row | 63° 49' 0" N | 22° 40' 0" W | |
| Tjaldstadagja | Crater Row | 30 m | 63° 51' 0" N | 22° 39' 0" W |
|
|
||||||||||||||||||||||||||
There is data available for 20 confirmed Holocene eruptive periods.
2023 Dec 18 - 2024 Jun 6 (continuing) Confirmed Eruption VEI: 1
| Episode 1 | Eruption | Sundhnúkagígar, Svartsengi fissure swarm | |||||||||||||||||||||||||||||
|---|---|---|---|---|---|---|---|---|---|---|---|---|---|---|---|---|---|---|---|---|---|---|---|---|---|---|---|---|---|---|
| 2023 Dec 18 - 2023 Dec 21 | Evidence from Observations: Reported | |||||||||||||||||||||||||||||
|
List of 4 Events for Episode 1 at Sundhnúkagígar, Svartsengi fissure swarm
| ||||||||||||||||||||||||||||||
| Episode 2 | Eruption | Sundhnúkagígar | |||
|---|---|---|---|---|
| 2024 Jan 14 - 2024 Jan 16 | Evidence from Observations: Reported | |||
| Episode 3 | Eruption | Between Sundhnúkur and Stóra Skógfell | |||
|---|---|---|---|---|
| 2024 Feb 8 - 2024 Feb 9 | Evidence from Observations: Reported | |||
| Episode 4 | Eruption | Sundhnúkagígar, Svartsengi fissure swarm | |||
|---|---|---|---|---|
| 2024 Mar 16 - 2024 May 8 | Evidence from Observations: Reported | |||
| Episode 5 | Eruption | Sundhnúkagígar, Svartsengi fissure swarm | ||||||||||||||||||||||||||||||||||
|---|---|---|---|---|---|---|---|---|---|---|---|---|---|---|---|---|---|---|---|---|---|---|---|---|---|---|---|---|---|---|---|---|---|---|---|
| 2024 May 29 - 2024 Jun 6 (continuing) | Evidence from Observations: Reported | ||||||||||||||||||||||||||||||||||
|
List of 5 Events for Episode 5 at Sundhnúkagígar, Svartsengi fissure swarm
| |||||||||||||||||||||||||||||||||||
[ 1970 Jul 2 (?) ± 182 days ] Uncertain Eruption
| Episode 1 | Eruption (Submarine) | Reykjaneshryggur (Eldeyjarbodi) | ||||||||||||||
|---|---|---|---|---|---|---|---|---|---|---|---|---|---|---|---|
| 1970 Jul 2 (?) ± 182 days - Unknown | Evidence from Unknown | ||||||||||||||
| Samples dredged in June 1971 were described as "extremely fresh-looking" and were inferred to be from a 1970 or 1971 submarine eruption (Jakobsson, 1974). | |||||||||||||||
|
List of 1 Events for Episode 1 at Reykjaneshryggur (Eldeyjarbodi)
| |||||||||||||||
[ 1966 Jul 2 ± 182 days ] Uncertain Eruption
| Episode 1 | Eruption (Submarine) | Reykjaneshryggur (Eldeyjarbodi) | ||||||||||||||
|---|---|---|---|---|---|---|---|---|---|---|---|---|---|---|---|
| 1966 Jul 2 ± 182 days - Unknown | Evidence from Unknown | ||||||||||||||
| Pilots reported a minor eruption in 1966 (Jakobsson, 1974). | |||||||||||||||
|
List of 1 Events for Episode 1 at Reykjaneshryggur (Eldeyjarbodi)
| |||||||||||||||
1830 Mar 13 (?) - 1831 Mar (?) Confirmed Eruption VEI: 3
| Episode 1 | Eruption (Submarine) | Reykjaneshryggur (Eldeyjarbodi) | |||||||||||||||||||||||||||||
|---|---|---|---|---|---|---|---|---|---|---|---|---|---|---|---|---|---|---|---|---|---|---|---|---|---|---|---|---|---|---|
| 1830 Mar 13 (?) - 1831 Mar (?) | Evidence from Observations: Reported | |||||||||||||||||||||||||||||
| An eruption was first observed on 15 March 1830 that lasted about one year, with quiet intervals. Abundant tephra production indicates probable temporary island formation, although none was reported. | ||||||||||||||||||||||||||||||
|
List of 4 Events for Episode 1 at Reykjaneshryggur (Eldeyjarbodi)
| ||||||||||||||||||||||||||||||
1783 May 1 (in or before) - 1783 Aug 15 ± 60 days Confirmed Eruption VEI: 3
| Episode 1 | Eruption (Submarine) | Reykjaneshryggur (Nyey) | |||||||||||||||||||||||||||||
|---|---|---|---|---|---|---|---|---|---|---|---|---|---|---|---|---|---|---|---|---|---|---|---|---|---|---|---|---|---|---|
| 1783 May 1 (in or before) - 1783 Aug 15 ± 60 days | Evidence from Observations: Reported | |||||||||||||||||||||||||||||
| An eruption column was first seen from a ship on 1 May 1783. On 3 May the new island of Nyey was seen. Its diameter was about 1 km in mid-June, but by the time of an expedition in autumn, it had disappeared. | ||||||||||||||||||||||||||||||
|
List of 4 Events for Episode 1 at Reykjaneshryggur (Nyey)
| ||||||||||||||||||||||||||||||
[ 1661 Dec ] Discredited Eruption
An eruption reported in Grindavik during December 1661 (Gudmundsson and Saemundsson, 1980) is not considered valid (Steinthorsson, pers. comm. 1992).
1583 Jul 15 ± 45 days Confirmed Eruption VEI: 2 (?)
| Episode 1 | Eruption (Submarine) | Reykjaneshryggur (near Eldeyjar Islands) | |||||||||||||||||||
|---|---|---|---|---|---|---|---|---|---|---|---|---|---|---|---|---|---|---|---|---|
| 1583 Jul 15 ± 45 days - Unknown | Evidence from Observations: Reported | |||||||||||||||||||
| "Fires" were reported burning near the Eldeyjar Islands by traders from Bremen in the summer of 1583. | ||||||||||||||||||||
|
List of 2 Events for Episode 1 at Reykjaneshryggur (near Eldeyjar Islands)
| ||||||||||||||||||||
1240 Confirmed Eruption VEI: 1
| Episode 1 | Eruption | Reykjaneshryggur, Arnarsetur, Illahraun | |||||||||||||||||||||||||||||
|---|---|---|---|---|---|---|---|---|---|---|---|---|---|---|---|---|---|---|---|---|---|---|---|---|---|---|---|---|---|---|
| 1240 - Unknown | Evidence from Observations: Reported | |||||||||||||||||||||||||||||
| "Fire" was reported off Reykjanes in 1240 (Thorarinsson, 1965). The Arnarsetur (H-36, 0.33 km3), Illahraun (H-19, 0.036 km3), Eldvorp (H-16, 0.28 km3), and Klofningahraun (H-15, 0.16 km3) lava flows were considered to have originated in 1226 CE (Johannesson and Einarsson, 1988b and CAVW), but Thordarson (pers. comm. 2008) considered at least the latter two flows to have originated in 1240 CE. | ||||||||||||||||||||||||||||||
|
List of 4 Events for Episode 1 at Reykjaneshryggur, Arnarsetur, Illahraun
| ||||||||||||||||||||||||||||||
1238 Confirmed Eruption VEI: 0
| Episode 1 | Eruption (Submarine) | Reykjaneshryggur | ||||||||||||||
|---|---|---|---|---|---|---|---|---|---|---|---|---|---|---|---|
| 1238 - Unknown | Evidence from Observations: Reported | ||||||||||||||
| "Fire" was reported off Reykjanes in 1238 CE. | |||||||||||||||
|
List of 1 Events for Episode 1 at Reykjaneshryggur
| |||||||||||||||
1231 Confirmed Eruption VEI: 3
| Episode 1 | Eruption (Submarine) | Reykjaneshryggur, R-10 tephra | |||||||||||||||||||||||||||||
|---|---|---|---|---|---|---|---|---|---|---|---|---|---|---|---|---|---|---|---|---|---|---|---|---|---|---|---|---|---|---|
| 1231 - Unknown | Evidence from Observations: Reported | |||||||||||||||||||||||||||||
| "Fire" off Reykjanes was reported in 1231 CE. Heavy tephra (layer R-10) fell on the Reykjanes Peninsula (Sigurgeirsson, 1992), stunting grass. A temporary island was likely formed. | ||||||||||||||||||||||||||||||
|
List of 4 Events for Episode 1 at Reykjaneshryggur, R-10 tephra
| ||||||||||||||||||||||||||||||
1226 Jul 15 ± 45 days - 1227 (?) Confirmed Eruption VEI: 4
| Episode 1 | Eruption (Submarine) | Reykjaneshryggur, R-9 tephra | ||||||||||||||||||||||||
|---|---|---|---|---|---|---|---|---|---|---|---|---|---|---|---|---|---|---|---|---|---|---|---|---|---|
| 1226 Jul 15 ± 45 days - 1227 (?) | Evidence from Observations: Reported | ||||||||||||||||||||||||
| Heavy ashfall was reported in the summer of 1226 CE and the following winter was referred to as the "sandwinter". The "Medieval tephra", found over the entire Reykjanes Peninsula, is considered to have originated from a submarine eruption immediately off the SW tip of the peninsula in 1226 (Johannesson and Einarsson, 1988). Remants of the crater can still be seen along the coast. The Arnarsetur (H-36, 0.33 km3), Illahraun (H-19, 0.036 km3), Eldvorp (H-16, 0.28 km3), and Klofningahraun (H-15, 0.16 km3) lava flows also were considered to have originated at this time (Johannesson and Einarsson, 1988b and CAVW), but Thordarson (pers. comm. 2008) considered the latter two flows to have originated in 1240. | |||||||||||||||||||||||||
|
List of 3 Events for Episode 1 at Reykjaneshryggur, R-9 tephra
| |||||||||||||||||||||||||
1223 Confirmed Eruption VEI: 3
| Episode 1 | Eruption (Submarine) | Reykjaneshryggur, R-8 tephra | ||||||||||||||||||||||||
|---|---|---|---|---|---|---|---|---|---|---|---|---|---|---|---|---|---|---|---|---|---|---|---|---|---|
| 1223 - Unknown | Evidence from Observations: Reported | ||||||||||||||||||||||||
| An eruption was reported off Reykjanes in 1223 CE; tephra (layer R-8) fell on the Reykjanes Peninsula (Sigurgeirsson, 1992). | |||||||||||||||||||||||||
|
List of 3 Events for Episode 1 at Reykjaneshryggur, R-8 tephra
| |||||||||||||||||||||||||
1211 Confirmed Eruption
| Episode 1 | Eruption | Stampar, Karlsgigur | |||||||||||||||||||||||||||||
|---|---|---|---|---|---|---|---|---|---|---|---|---|---|---|---|---|---|---|---|---|---|---|---|---|---|---|---|---|---|---|
| 1211 - Unknown | Evidence from Observations: Reported | |||||||||||||||||||||||||||||
| The younger Stampar lava flow (H-2) was erupted in 1211 CE along with the R-7 tephra layer (Jonsson, 1978; Sigurgeirsson, 1992). The Karl tuff cone just off the peninsula was also formed in 1211 CE (Thordarson, pers. comm. 2008). | ||||||||||||||||||||||||||||||
|
List of 4 Events for Episode 1 at Stampar, Karlsgigur
| ||||||||||||||||||||||||||||||
1210 Confirmed Eruption VEI: 3 (?)
| Episode 1 | Eruption | Vatnsfellsgigur | ||||||||||||||||||||||||
|---|---|---|---|---|---|---|---|---|---|---|---|---|---|---|---|---|---|---|---|---|---|---|---|---|---|
| 1210 - Unknown | Evidence from Observations: Reported | ||||||||||||||||||||||||
| An eruption from Vatnsfellsgigur in 1210 CE produced a tuff cone (Thordarson, pers. comm. 2008). | |||||||||||||||||||||||||
|
List of 3 Events for Episode 1 at Vatnsfellsgigur
| |||||||||||||||||||||||||
1179 (in or before) Confirmed Eruption VEI: 2
| Episode 1 | Eruption (Submarine) | Reykjaneshryggur, R-5 and R-6 tephras | ||||||||||||||||||||||||
|---|---|---|---|---|---|---|---|---|---|---|---|---|---|---|---|---|---|---|---|---|---|---|---|---|---|
| 1179 (in or before) - Unknown | Evidence from Observations: Reported | ||||||||||||||||||||||||
| The "Book of Wonders", written between 1178 and 1180 CE, describes submarine eruptions off Iceland (presumably off Reykjanes) in past years in which "fire" rose high above the sea. Two tephra falls (layers R-5 and R-6) on the Reykjanes Peninsula occurred during the 12th century (Sigurgeirsson, 1992). | |||||||||||||||||||||||||
|
List of 3 Events for Episode 1 at Reykjaneshryggur, R-5 and R-6 tephras
| |||||||||||||||||||||||||
0920 (?) Confirmed Eruption
| Episode 1 | Eruption (Submarine) | Reykjaneshryggur (near Eldey), R-4 tephra | |||||||||||||||||||
|---|---|---|---|---|---|---|---|---|---|---|---|---|---|---|---|---|---|---|---|---|
| 0920 (?) - Unknown | Evidence from Correlation: Tephrochronology | |||||||||||||||||||
| The R-4 tephra, from a submarine eruption near Eldey, fell on the Reykjanes Peninsula about 920 CE (Sigurgeirsson, 1992). | ||||||||||||||||||||
|
List of 2 Events for Episode 1 at Reykjaneshryggur (near Eldey), R-4 tephra
| ||||||||||||||||||||
0200 BCE (?) Confirmed Eruption VEI: 0
| Episode 1 | Eruption | Lambagjá | |||||||||||||||||||
|---|---|---|---|---|---|---|---|---|---|---|---|---|---|---|---|---|---|---|---|---|
| 0200 BCE (?) - Unknown | Evidence from Isotopic: 14C (uncalibrated) | |||||||||||||||||||
| A lava flow at Lambagja, 14C dated about 2,150 years BP, is mostly covered by the younger Eldvorp and Klofningahraun lava flows (Jonsson, 1986). The flow at Lambagja was previously considered to be part of the H-16 Eldvorp flow, but is distinguished by the presence of faults that do not cut the Eldvorp. | ||||||||||||||||||||
|
List of 2 Events for Episode 1 at Lambagjá
| ||||||||||||||||||||
0400 BCE ± 100 years Confirmed Eruption VEI: 2
| Episode 1 | Eruption | Sundhnukar | ||||||||||||||||||||||||||||||||||
|---|---|---|---|---|---|---|---|---|---|---|---|---|---|---|---|---|---|---|---|---|---|---|---|---|---|---|---|---|---|---|---|---|---|---|---|
| 0400 BCE ± 100 years - Unknown | Evidence from Isotopic: 14C (uncalibrated) | ||||||||||||||||||||||||||||||||||
| The eruption of the 0.52 km3 Sundhnukahraun lava flow (H-26) from the Sundhnukar crater row is 14C dated at 2,420 ± 100 BP (Jonsson, 1974). Jonsson (1983), citing his 1974 paper, lists a 2,350 ± 90 BP 14C date, but with an incorrect calender year conversion to 1300 BCE. The Sundhnukahraun lava flow (the Grindavik flow of Jakobsson et al., 1978) reached the coast east of Grindavik, forming the Thorkotlustadanes Peninsula. | |||||||||||||||||||||||||||||||||||
|
List of 5 Events for Episode 1 at Sundhnukar
| |||||||||||||||||||||||||||||||||||
1800 BCE ± 300 years Confirmed Eruption VEI: 2
| Episode 1 | Eruption | Reykjaneshryggur, Stampar, R-2, R-3 tephras | ||||||||||||||||||||||||||||||||||
|---|---|---|---|---|---|---|---|---|---|---|---|---|---|---|---|---|---|---|---|---|---|---|---|---|---|---|---|---|---|---|---|---|---|---|---|
| 1800 BCE ± 300 years - Unknown | Evidence from Correlation: Tephrochronology | ||||||||||||||||||||||||||||||||||
| The older Stampar lava flow (H-3) was erupted at the time of the R-2 and R-3 tephras from Reykjaneshryggur about 3,500-4,000 years BP (Sigurgeirsson, 1992). | |||||||||||||||||||||||||||||||||||
|
List of 5 Events for Episode 1 at Reykjaneshryggur, Stampar, R-2, R-3 tephras
| |||||||||||||||||||||||||||||||||||
3800 BCE ± 300 years Confirmed Eruption
| Episode 1 | Eruption (Submarine) | Reykjaneshryggur, R-1 tephra | |||||||||||||||||||
|---|---|---|---|---|---|---|---|---|---|---|---|---|---|---|---|---|---|---|---|---|
| 3800 BCE ± 300 years - Unknown | Evidence from Correlation: Tephrochronology | |||||||||||||||||||
| Tephra layer R-1, from a submarine eruption off Reykjanes, fell on the Peninsula between about 5,500 and 6,000 years BP (Sigurgeirsson, 1992). | ||||||||||||||||||||
|
List of 2 Events for Episode 1 at Reykjaneshryggur, R-1 tephra
| ||||||||||||||||||||
4000 BCE (?) Confirmed Eruption VEI: 0
| Episode 1 | Eruption | Sandfellshaed | |||||||||||||||||||||||||||||
|---|---|---|---|---|---|---|---|---|---|---|---|---|---|---|---|---|---|---|---|---|---|---|---|---|---|---|---|---|---|---|
| 4000 BCE (?) - Unknown | Evidence from Correlation: Tephrochronology | |||||||||||||||||||||||||||||
| The Sandfellshaed lava shield was assigned a calibrated age of about 6,000 years before 2000 CE (Thordarson et al., 2008). | ||||||||||||||||||||||||||||||
|
List of 4 Events for Episode 1 at Sandfellshaed
| ||||||||||||||||||||||||||||||
5040 BCE ± 90 years Confirmed Eruption VEI: 0
| Episode 1 | Eruption | Hopsnes | ||||||||||||||||||||||||
|---|---|---|---|---|---|---|---|---|---|---|---|---|---|---|---|---|---|---|---|---|---|---|---|---|---|
| 5040 BCE ± 90 years - Unknown | Evidence from Isotopic: 14C (uncalibrated) | ||||||||||||||||||||||||
| The Hopsnes lava flows, which reached the sea, were erupted from fissures cutting the flanks of Hagafell and were 14C dated at 6,989 ± 90 years BP (Jennes and Clifton, 2009). | |||||||||||||||||||||||||
|
List of 3 Events for Episode 1 at Hopsnes
| |||||||||||||||||||||||||
8000 BCE (?) Confirmed Eruption VEI: 0
| Episode 1 | Eruption | Thrainskjöldur | |||||||||||||||||||||||||||||
|---|---|---|---|---|---|---|---|---|---|---|---|---|---|---|---|---|---|---|---|---|---|---|---|---|---|---|---|---|---|---|
| 8000 BCE (?) - Unknown | Evidence from Correlation: Tephrochronology | |||||||||||||||||||||||||||||
| The Thrainsjöldur shield volcano was assigned a calibrated age of about 10,000 years before 2000 CE (Thordarson et al., 2008). | ||||||||||||||||||||||||||||||
|
List of 4 Events for Episode 1 at Thrainskjöldur
| ||||||||||||||||||||||||||||||
There is no Deformation History data available for Reykjanes.
There is no Emissions History data available for Reykjanes.
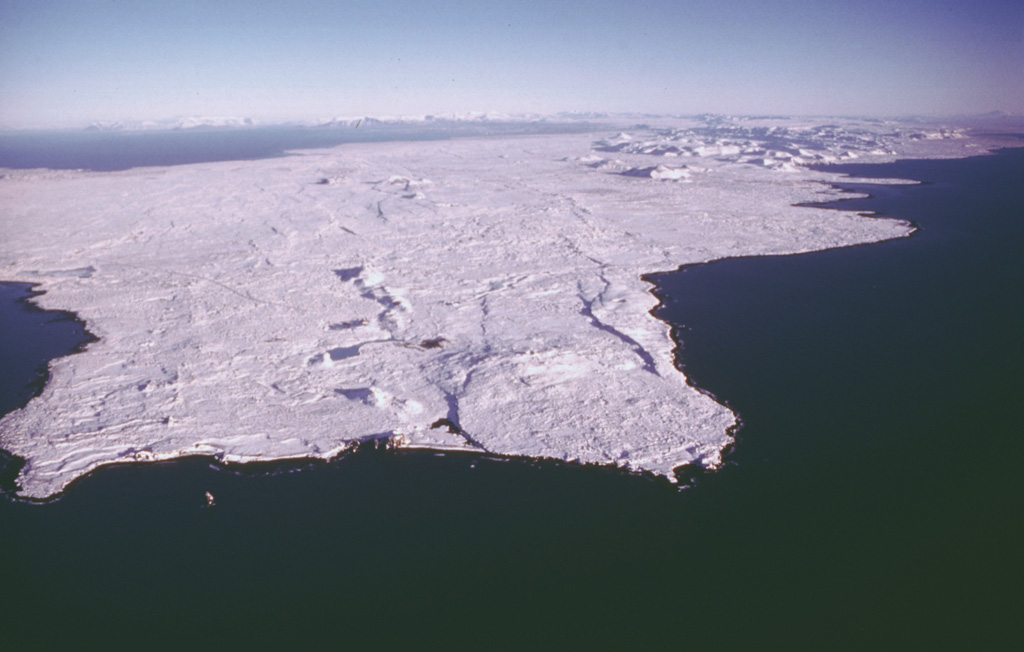
 The Reykjanes volcanic system at the SW tip of the Reykjanes Peninsula in Iceland comprises a broad area of postglacial crater rows and small shield volcanoes. Snow-covered Sandfellshæd shield volcano (lower center), capped by a small crater of approximately 400 m diameter, rises less than 100 m above the Atlantic Ocean to the south (background). Most of the volcanic system is covered by Holocene lava flows. Eruptions have occurred in historical time. Eruptions during the 13th century distributed tephra across the Reykjanes peninsula and lava covered about 50 km2.
  The snow-covered Reykjanes volcanic system forms the SW tip of the Reykjanes Peninsula, where the Mid-Atlantic Ridge rises above sea level. It is the westernmost of a series of four closely spaced, NE-SW-trending, en-echelon fissure systems that extend diagonally across the Reykjanes Peninsula. Most of this system is covered by Holocene lavas, and eruptions occurred during the 13th century at several locations.
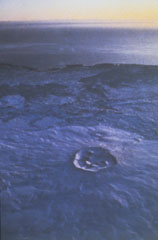
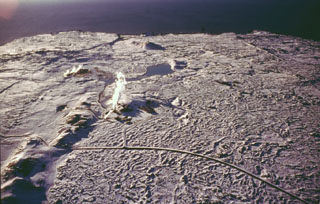 The submarine Reykjaneshryggur volcanic system, lying off the southwest tip of Iceland, is part of the Mid-Atlantic Ridge, which extends onto the Reykjanes Peninsula (foreground). A small plume of steam from geothermal activity is visible (middle left). Numerous submarine eruptions at Reykjaneshryggur dating back to the 13th century have been observed, some of which have formed short-lived islands. Submarine eruptions have been characterized by phreatomagmatic or Surtseyan explosive activity, depositing tephra on land. Subaerial eruptions have been typified by effusive activity, producing lava flows on Reykjanes Peninsula.
 Maps are not currently available due to technical issues.
The maps shown below have been scanned from the GVP map archives and include the volcano on this page. Clicking on the small images will load the full 300 dpi map. Very small-scale maps (such as world maps) are not included.
The following 17 samples associated with this volcano can be found in the Smithsonian's NMNH Department of Mineral Sciences collections, and may be availble for research (contact the Rock and Ore Collections Manager). Catalog number links will open a window with more information.
| Catalog Number | Sample Description | Lava Source | Collection Date |
|---|---|---|---|
| NMNH 115614 | Tholeiite | ARNARSETUR | -- |
| NMNH 115616 | Tholeiite | -- | -- |
| NMNH 115618 | Tholeiite | TJALDSTADAGJA | -- |
| NMNH 115619 | Tholeiite | SYRFELLSHRAUN | -- |
| NMNH 115621 | Tholeiite | STAMPAR | -- |
| NMNH 115622 | Olivine Tholeiite | LANGHOLL | -- |
| NMNH 115625 | Picrite Basalt | -- | -- |
| NMNH 115626 | Picrite Basalt | -- | -- |
| NMNH 115627 | Olivine Tholeiite | THRAINSSKJOLDUR | -- |
| NMNH 115628 | Olivine Tholeiite | THRAINSSKJOLDUR | -- |
| NMNH 115629 | Olivine Tholeiite | LANGHOLL | -- |
| NMNH 115630 | Olivine Tholeiite | LANGHOLL | -- |
| NMNH 115631 | Olivine Tholeiite | THRAINSSKJOLDUR | -- |
| NMNH 115632 | Olivine Tholeiite | THRAINSSKJOLDUR | -- |
| NMNH 115633 | Tholeiite | -- | -- |
| NMNH 115634 | Picrite Basalt | VATNSHEIDI | -- |
| NMNH 115636 | Picrite Basalt | HROLFSVIKURHRAUN | -- |
| Catalogue of Icelandic Volcanoes (Link to Reykjanes) | The Catalogue of Icelandic Volcanoes is an interactive, web-based tool, containing information on volcanic systems that belong to the active volcanic zones of Iceland. It is a collaboration of the Icelandic Meteorological Office (the state volcano observatory), the Institute of Earth Sciences at the University of Iceland, and the Civil Protection Department of the National Commissioner of the Iceland Police, with contributions from a large number of specialists in Iceland and elsewhere. This official publication is intended to serve as an accurate and up-to-date source of information about active volcanoes in Iceland and their characteristics. The Catalogue forms a part of an integrated volcanic risk assessment project in Iceland GOSVÁ (commenced in 2012), as well as being part of the effort of FUTUREVOLC (2012-2016) on establishing an Icelandic volcano supersite. |
| Copernicus Browser | The Copernicus Browser replaced the Sentinel Hub Playground browser in 2023, to provide access to Earth observation archives from the Copernicus Data Space Ecosystem, the main distribution platform for data from the EU Copernicus missions. |
| MIROVA | Middle InfraRed Observation of Volcanic Activity (MIROVA) is a near real time volcanic hot-spot detection system based on the analysis of MODIS (Moderate Resolution Imaging Spectroradiometer) data. In particular, MIROVA uses the Middle InfraRed Radiation (MIR), measured over target volcanoes, in order to detect, locate and measure the heat radiation sourced from volcanic activity. |
| MODVOLC Thermal Alerts | Using infrared satellite Moderate Resolution Imaging Spectroradiometer (MODIS) data, scientists at the Hawai'i Institute of Geophysics and Planetology, University of Hawai'i, developed an automated system called MODVOLC to map thermal hot-spots in near real time. For each MODIS image, the algorithm automatically scans each 1 km pixel within it to check for high-temperature hot-spots. When one is found the date, time, location, and intensity are recorded. MODIS looks at every square km of the Earth every 48 hours, once during the day and once during the night, and the presence of two MODIS sensors in space allows at least four hot-spot observations every two days. Each day updated global maps are compiled to display the locations of all hot spots detected in the previous 24 hours. There is a drop-down list with volcano names which allow users to 'zoom-in' and examine the distribution of hot-spots at a variety of spatial scales. |
|
WOVOdat
Single Volcano View Temporal Evolution of Unrest Side by Side Volcanoes |
WOVOdat is a database of volcanic unrest; instrumentally and visually recorded changes in seismicity, ground deformation, gas emission, and other parameters from their normal baselines. It is sponsored by the World Organization of Volcano Observatories (WOVO) and presently hosted at the Earth Observatory of Singapore.
GVMID Data on Volcano Monitoring Infrastructure The Global Volcano Monitoring Infrastructure Database GVMID, is aimed at documenting and improving capabilities of volcano monitoring from the ground and space. GVMID should provide a snapshot and baseline view of the techniques and instrumentation that are in place at various volcanoes, which can be use by volcano observatories as reference to setup new monitoring system or improving networks at a specific volcano. These data will allow identification of what monitoring gaps exist, which can be then targeted by remote sensing infrastructure and future instrument deployments. |
| Volcanic Hazard Maps | The IAVCEI Commission on Volcanic Hazards and Risk has a Volcanic Hazard Maps database designed to serve as a resource for hazard mappers (or other interested parties) to explore how common issues in hazard map development have been addressed at different volcanoes, in different countries, for different hazards, and for different intended audiences. In addition to the comprehensive, searchable Volcanic Hazard Maps Database, this website contains information about diversity of volcanic hazard maps, illustrated using examples from the database. This site is for educational purposes related to volcanic hazard maps. Hazard maps found on this website should not be used for emergency purposes. For the most recent, official hazard map for a particular volcano, please seek out the proper institutional authorities on the matter. |
| IRIS seismic stations/networks | Incorporated Research Institutions for Seismology (IRIS) Data Services map showing the location of seismic stations from all available networks (permanent or temporary) within a radius of 0.18° (about 20 km at mid-latitudes) from the given location of Reykjanes. Users can customize a variety of filters and options in the left panel. Note that if there are no stations are known the map will default to show the entire world with a "No data matched request" error notice. |
| UNAVCO GPS/GNSS stations | Geodetic Data Services map from UNAVCO showing the location of GPS/GNSS stations from all available networks (permanent or temporary) within a radius of 20 km from the given location of Reykjanes. Users can customize the data search based on station or network names, location, and time window. Requires Adobe Flash Player. |
| DECADE Data | The DECADE portal, still in the developmental stage, serves as an example of the proposed interoperability between The Smithsonian Institution's Global Volcanism Program, the Mapping Gas Emissions (MaGa) Database, and the EarthChem Geochemical Portal. The Deep Earth Carbon Degassing (DECADE) initiative seeks to use new and established technologies to determine accurate global fluxes of volcanic CO2 to the atmosphere, but installing CO2 monitoring networks on 20 of the world's 150 most actively degassing volcanoes. The group uses related laboratory-based studies (direct gas sampling and analysis, melt inclusions) to provide new data for direct degassing of deep earth carbon to the atmosphere. |
| Large Eruptions of Reykjanes | Information about large Quaternary eruptions (VEI >= 4) is cataloged in the Large Magnitude Explosive Volcanic Eruptions (LaMEVE) database of the Volcano Global Risk Identification and Analysis Project (VOGRIPA). |
| EarthChem | EarthChem develops and maintains databases, software, and services that support the preservation, discovery, access and analysis of geochemical data, and facilitate their integration with the broad array of other available earth science parameters. EarthChem is operated by a joint team of disciplinary scientists, data scientists, data managers and information technology developers who are part of the NSF-funded data facility Integrated Earth Data Applications (IEDA). IEDA is a collaborative effort of EarthChem and the Marine Geoscience Data System (MGDS). |