

IMO stated that the Fagradalsfjall and Krýsuvík-Trölladyngja volcanic systems have been designated as two separate systems based on previous scientific research combined with data collected and analyzed from the two recent eruptions (2021 and 2022). On 15 September the Aviation Color Code for Krýsuvík-Trölladyngja was changed to Green, reflecting that the activity was at known background levels.
2022: September
IMO stated that the Fagradalsfjall and Krýsuvík-Trölladyngja volcanic systems have been designated as two separate systems based on previous scientific research combined with data collected and analyzed from the two recent eruptions (2021 and 2022). On 15 September the Aviation Color Code for Krýsuvík-Trölladyngja was changed to Green, reflecting that the activity was at known background levels.
Source: Icelandic Meteorological Office (IMO)
The Global Volcanism Program has no Bulletin Reports available for Krýsuvík-Trölladyngja.
|
|
||||||||||||||||||||||||||
There is data available for 11 confirmed Holocene eruptive periods.
1340 (?) Confirmed Eruption (Explosive / Effusive) VEI: 1
| Episode 1 | Eruption (Explosive / Effusive) | Tradarfjöll | ||||||||||||||||||||||||||||||||||
|---|---|---|---|---|---|---|---|---|---|---|---|---|---|---|---|---|---|---|---|---|---|---|---|---|---|---|---|---|---|---|---|---|---|---|---|
| 1340 (?) - Unknown | Evidence from Correlation: Tephrochronology | ||||||||||||||||||||||||||||||||||
|
List of 5 Events for Episode 1 at Tradarfjöll
|
|||||||||||||||||||||||||||||||||||
1325 (?) Confirmed Eruption (Explosive / Effusive) VEI: 1
| Episode 1 | Eruption (Explosive / Effusive) | Elborg vid Trolladyngju | |||||||||||||||||||||||||||||
|---|---|---|---|---|---|---|---|---|---|---|---|---|---|---|---|---|---|---|---|---|---|---|---|---|---|---|---|---|---|---|
| 1325 (?) - Unknown | Evidence from Correlation: Tephrochronology | |||||||||||||||||||||||||||||
|
List of 4 Events for Episode 1 at Elborg vid Trolladyngju
|
||||||||||||||||||||||||||||||
1188 Confirmed Eruption (Explosive / Effusive) VEI: 1
| Episode 1 | Eruption (Explosive / Effusive) | Mavahlidargigir | ||||||||||||||||||||||||
|---|---|---|---|---|---|---|---|---|---|---|---|---|---|---|---|---|---|---|---|---|---|---|---|---|---|
| 1188 - Unknown | Evidence from Observations: Reported | ||||||||||||||||||||||||
|
List of 3 Events for Episode 1 at Mavahlidargigir
|
|||||||||||||||||||||||||
1151 Confirmed Eruption (Explosive / Effusive) VEI: 1
| Episode 1 | Eruption (Explosive / Effusive) | Ogmundargigar and other vents | |||||||||||||||||||||||||||||||||||||||
|---|---|---|---|---|---|---|---|---|---|---|---|---|---|---|---|---|---|---|---|---|---|---|---|---|---|---|---|---|---|---|---|---|---|---|---|---|---|---|---|---|
| 1151 - Unknown | Evidence from Observations: Reported | |||||||||||||||||||||||||||||||||||||||
|
List of 6 Events for Episode 1 at Ogmundargigar and other vents
|
||||||||||||||||||||||||||||||||||||||||
1075 ± 75 years Confirmed Eruption (Explosive / Effusive) VEI: 0
| Episode 1 | Eruption (Explosive / Effusive) | Gvendarselsgigar | |||||||||||||||||||
|---|---|---|---|---|---|---|---|---|---|---|---|---|---|---|---|---|---|---|---|---|
| 1075 ± 75 years - Unknown | Evidence from Isotopic: 14C (uncalibrated) | |||||||||||||||||||
|
List of 2 Events for Episode 1 at Gvendarselsgigar
|
||||||||||||||||||||
0900 (?) Confirmed Eruption (Explosive / Effusive) VEI: 2
| Episode 1 | Eruption (Explosive / Effusive) | Melholl, Afstapahraun | |||||||||||||||||||||||||||||||||||||||
|---|---|---|---|---|---|---|---|---|---|---|---|---|---|---|---|---|---|---|---|---|---|---|---|---|---|---|---|---|---|---|---|---|---|---|---|---|---|---|---|---|
| 0900 (?) - Unknown | Evidence from Correlation: Tephrochronology | |||||||||||||||||||||||||||||||||||||||
|
List of 6 Events for Episode 1 at Melholl, Afstapahraun
|
||||||||||||||||||||||||||||||||||||||||
0190 BCE ± 75 years Confirmed Eruption (Explosive / Effusive) VEI: 2
| Episode 1 | Eruption (Explosive / Effusive) | Obrinnisholar | ||||||||||||||||||||||||||||||||||
|---|---|---|---|---|---|---|---|---|---|---|---|---|---|---|---|---|---|---|---|---|---|---|---|---|---|---|---|---|---|---|---|---|---|---|---|
| 0190 BCE ± 75 years - Unknown | Evidence from Isotopic: 14C (uncalibrated) | ||||||||||||||||||||||||||||||||||
|
List of 5 Events for Episode 1 at Obrinnisholar
|
|||||||||||||||||||||||||||||||||||
1060 BCE ± 75 years Confirmed Eruption (Explosive / Effusive) VEI: 0
| Episode 1 | Eruption (Explosive / Effusive) | Sandfellskofagigir | |||||||||||||||||||
|---|---|---|---|---|---|---|---|---|---|---|---|---|---|---|---|---|---|---|---|---|
| 1060 BCE ± 75 years - Unknown | Evidence from Isotopic: 14C (uncalibrated) | |||||||||||||||||||
|
List of 2 Events for Episode 1 at Sandfellskofagigir
|
||||||||||||||||||||
5290 BCE ± 150 years Confirmed Eruption (Explosive / Effusive) VEI: 2
| Episode 1 | Eruption (Explosive / Effusive) | Burfell | |||||||||||||||||||||||||||||||||||||||
|---|---|---|---|---|---|---|---|---|---|---|---|---|---|---|---|---|---|---|---|---|---|---|---|---|---|---|---|---|---|---|---|---|---|---|---|---|---|---|---|---|
| 5290 BCE ± 150 years - Unknown | Evidence from Isotopic: 14C (uncalibrated) | |||||||||||||||||||||||||||||||||||||||
|
List of 6 Events for Episode 1 at Burfell
|
||||||||||||||||||||||||||||||||||||||||
6000 BCE (?) Confirmed Eruption (Explosive / Effusive) VEI: 0
| Episode 1 | Eruption (Explosive / Effusive) | Hrútagjár | |||||||||||||||||||||||||||||
|---|---|---|---|---|---|---|---|---|---|---|---|---|---|---|---|---|---|---|---|---|---|---|---|---|---|---|---|---|---|---|
| 6000 BCE (?) - Unknown | Evidence from Correlation: Tephrochronology | |||||||||||||||||||||||||||||
|
List of 4 Events for Episode 1 at Hrútagjár
|
||||||||||||||||||||||||||||||
8500 BCE (?) Confirmed Eruption (Explosive / Effusive) VEI: 0
| Episode 1 | Eruption (Explosive / Effusive) | Hagafell | |||||||||||||||||||||||||||||
|---|---|---|---|---|---|---|---|---|---|---|---|---|---|---|---|---|---|---|---|---|---|---|---|---|---|---|---|---|---|---|
| 8500 BCE (?) - Unknown | Evidence from Correlation: Tephrochronology | |||||||||||||||||||||||||||||
|
List of 4 Events for Episode 1 at Hagafell
|
||||||||||||||||||||||||||||||
This compilation of synonyms and subsidiary features may not be comprehensive. Features are organized into four major categories: Cones, Craters, Domes, and Thermal Features. Synonyms of features appear indented below the primary name. In some cases additional feature type, elevation, or location details are provided.
Synonyms |
||||
| Trölladyngjukerfid | Krísuvík | ||||
Cones |
||||
| Feature Name | Feature Type | Elevation | Latitude | Longitude |
| Hagafell
Fagradals-Hagafell |
Shield volcano | 286 m | 63° 55' 29.00" N | 22° 15' 7.00" W |
| Hraunssels-Vatnsfell | Shield volcano | 264 m | 63° 54' 11.00" N | 22° 11' 21.00" W |
| Hrútagjár
Hrútagjárdyngja |
Shield volcano | 63° 58' 0.00" N | 22° 0' 0.00" W | |
Craters |
||||
| Feature Name | Feature Type | Elevation | Latitude | Longitude |
| Burfell | Crater Row | 160 m | 64° 2' 0.00" N | 21° 50' 0.00" W |
| Dyngnahraun | Crater Row | 63° 57' 0.00" N | 22° 6' 0.00" W | |
| Eldborg-Trolladyngja | Crater Row | 378 m | 63° 58' 0.00" N | 22° 5' 0.00" W |
| Gestsstadavatn | Maar | 180 m | 63° 53' 0.00" N | 22° 5' 0.00" W |
| Graenavatn | Maar | 183 m | 63° 53' 0.00" N | 22° 4' 0.00" W |
| Gvendarselsgigar | Crater Row | 64° 0' 0.00" N | 21° 52' 0.00" W | |
| Helgafellsgigir | Crater Row | 64° 0' 0.00" N | 21° 52' 0.00" W | |
| Hofdarhraun | Crater Row | |||
| Hrafnshildargigir | Crater Row | |||
| Hraunholl | Crater Row | 140 m | 63° 58' 0.00" N | 21° 57' 0.00" W |
| Kapellugigar | Crater Row | 120 m | 63° 58' 0.00" N | 21° 57' 0.00" W |
| Katlar | Crater Row | 64° 0' 0.00" N | 21° 53' 0.00" W | |
| Mavahlidargigir | Crater Row | 229 m | 63° 57' 0.00" N | 22° 3' 0.00" W |
| Melholl | Crater Row | 63° 53' 0.00" N | 22° 9' 0.00" W | |
| Melrakkahraun | Crater Row | 63° 59' 0.00" N | 22° 0' 0.00" W | |
| Obrinnisholar | Crater Row | 200 m | 64° 0' 0.00" N | 21° 55' 0.00" W |
| Ogmundargigar | Crater Row | 150 m | 63° 52' 0.00" N | 22° 10' 0.00" W |
| Raudholl-Hafnarfjordur | Crater Row | 64° 3' 0.00" N | 21° 59' 0.00" W | |
| Raudimelur | Crater Row | 64° 2' 0.00" N | 22° 4' 0.00" W | |
| Sandfellsklofagigir | Crater Row | 63° 57' 0.00" N | 22° 4' 0.00" W | |
| Selhraunsgigir | Crater Row | 64° 2' 0.00" N | 22° 1' 0.00" W | |
| Sogagigir | Crater Row | 63° 55' 0.00" N | 22° 8' 0.00" W | |
| Sveiflugigir | Crater Row | 63° 53' 0.00" N | 22° 5' 0.00" W | |
| Tardarfjoll | Crater Row | 200 m | 63° 54' 0.00" N | 22° 6' 0.00" W |
| Trolladyngja | Crater Row | 378 m | 63° 58' 0.00" N | 22° 5' 0.00" W |
Thermal |
||||
| Feature Name | Feature Type | Elevation | Latitude | Longitude |
| Krysuvik | Thermal | 63° 53' 0.00" N | 22° 4' 0.00" W | |
The following 2 samples associated with this volcano can be found in the Smithsonian's NMNH Department of Mineral Sciences collections, and may be availble for research (contact the Rock and Ore Collections Manager). Catalog number links will open a window with more information.
| Catalog Number | Sample Description | Lava Source | Collection Date |
|---|---|---|---|
| NMNH 115620 | Tholeiite | -- | -- |
| NMNH 115637 | Olivine Tholeiite | HRUTAGJARDYNGJA | -- |
| Catalogue of Icelandic Volcanoes (Link to Krýsuvík-Trölladyngja) | The Catalogue of Icelandic Volcanoes is an interactive, web-based tool, containing information on volcanic systems that belong to the active volcanic zones of Iceland. It is a collaboration of the Icelandic Meteorological Office (the state volcano observatory), the Institute of Earth Sciences at the University of Iceland, and the Civil Protection Department of the National Commissioner of the Iceland Police, with contributions from a large number of specialists in Iceland and elsewhere. This official publication is intended to serve as an accurate and up-to-date source of information about active volcanoes in Iceland and their characteristics. The Catalogue forms a part of an integrated volcanic risk assessment project in Iceland GOSVÁ (commenced in 2012), as well as being part of the effort of FUTUREVOLC (2012-2016) on establishing an Icelandic volcano supersite. |
| Copernicus Browser | The Copernicus Browser replaced the Sentinel Hub Playground browser in 2023, to provide access to Earth observation archives from the Copernicus Data Space Ecosystem, the main distribution platform for data from the EU Copernicus missions. |
| MIROVA | Middle InfraRed Observation of Volcanic Activity (MIROVA) is a near real time volcanic hot-spot detection system based on the analysis of MODIS (Moderate Resolution Imaging Spectroradiometer) data. In particular, MIROVA uses the Middle InfraRed Radiation (MIR), measured over target volcanoes, in order to detect, locate and measure the heat radiation sourced from volcanic activity. |
| MODVOLC Thermal Alerts | Using infrared satellite Moderate Resolution Imaging Spectroradiometer (MODIS) data, scientists at the Hawai'i Institute of Geophysics and Planetology, University of Hawai'i, developed an automated system called MODVOLC to map thermal hot-spots in near real time. For each MODIS image, the algorithm automatically scans each 1 km pixel within it to check for high-temperature hot-spots. When one is found the date, time, location, and intensity are recorded. MODIS looks at every square km of the Earth every 48 hours, once during the day and once during the night, and the presence of two MODIS sensors in space allows at least four hot-spot observations every two days. Each day updated global maps are compiled to display the locations of all hot spots detected in the previous 24 hours. There is a drop-down list with volcano names which allow users to 'zoom-in' and examine the distribution of hot-spots at a variety of spatial scales. |
|
WOVOdat
Single Volcano View Temporal Evolution of Unrest Side by Side Volcanoes |
WOVOdat is a database of volcanic unrest; instrumentally and visually recorded changes in seismicity, ground deformation, gas emission, and other parameters from their normal baselines. It is sponsored by the World Organization of Volcano Observatories (WOVO) and presently hosted at the Earth Observatory of Singapore.
GVMID Data on Volcano Monitoring Infrastructure The Global Volcano Monitoring Infrastructure Database GVMID, is aimed at documenting and improving capabilities of volcano monitoring from the ground and space. GVMID should provide a snapshot and baseline view of the techniques and instrumentation that are in place at various volcanoes, which can be use by volcano observatories as reference to setup new monitoring system or improving networks at a specific volcano. These data will allow identification of what monitoring gaps exist, which can be then targeted by remote sensing infrastructure and future instrument deployments. |
| Volcanic Hazard Maps | The IAVCEI Commission on Volcanic Hazards and Risk has a Volcanic Hazard Maps database designed to serve as a resource for hazard mappers (or other interested parties) to explore how common issues in hazard map development have been addressed at different volcanoes, in different countries, for different hazards, and for different intended audiences. In addition to the comprehensive, searchable Volcanic Hazard Maps Database, this website contains information about diversity of volcanic hazard maps, illustrated using examples from the database. This site is for educational purposes related to volcanic hazard maps. Hazard maps found on this website should not be used for emergency purposes. For the most recent, official hazard map for a particular volcano, please seek out the proper institutional authorities on the matter. |
| IRIS seismic stations/networks | Incorporated Research Institutions for Seismology (IRIS) Data Services map showing the location of seismic stations from all available networks (permanent or temporary) within a radius of 0.18° (about 20 km at mid-latitudes) from the given location of Krýsuvík-Trölladyngja. Users can customize a variety of filters and options in the left panel. Note that if there are no stations are known the map will default to show the entire world with a "No data matched request" error notice. |
| UNAVCO GPS/GNSS stations | Geodetic Data Services map from UNAVCO showing the location of GPS/GNSS stations from all available networks (permanent or temporary) within a radius of 20 km from the given location of Krýsuvík-Trölladyngja. Users can customize the data search based on station or network names, location, and time window. Requires Adobe Flash Player. |
| DECADE Data | The DECADE portal, still in the developmental stage, serves as an example of the proposed interoperability between The Smithsonian Institution's Global Volcanism Program, the Mapping Gas Emissions (MaGa) Database, and the EarthChem Geochemical Portal. The Deep Earth Carbon Degassing (DECADE) initiative seeks to use new and established technologies to determine accurate global fluxes of volcanic CO2 to the atmosphere, but installing CO2 monitoring networks on 20 of the world's 150 most actively degassing volcanoes. The group uses related laboratory-based studies (direct gas sampling and analysis, melt inclusions) to provide new data for direct degassing of deep earth carbon to the atmosphere. |
| Large Eruptions of Krýsuvík-Trölladyngja | Information about large Quaternary eruptions (VEI >= 4) is cataloged in the Large Magnitude Explosive Volcanic Eruptions (LaMEVE) database of the Volcano Global Risk Identification and Analysis Project (VOGRIPA). |
| EarthChem | EarthChem develops and maintains databases, software, and services that support the preservation, discovery, access and analysis of geochemical data, and facilitate their integration with the broad array of other available earth science parameters. EarthChem is operated by a joint team of disciplinary scientists, data scientists, data managers and information technology developers who are part of the NSF-funded data facility Integrated Earth Data Applications (IEDA). IEDA is a collaborative effort of EarthChem and the Marine Geoscience Data System (MGDS). |
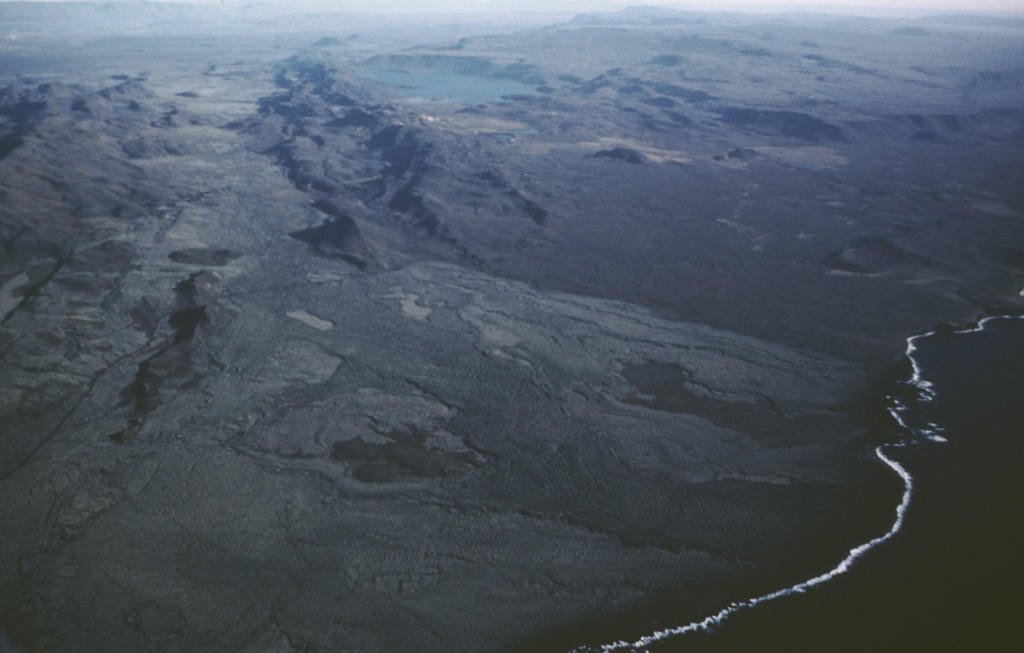
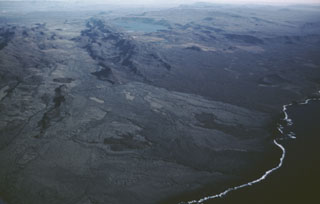 The Krýsuvík-Trölladyngja volcanic system consists of NE-SW-trending crater rows and small shield volcanoes cutting the central Reykjanes Peninsula west of Kleifarvatn lake (top center). Several eruptions have taken place since the settlement of Iceland, including the emplacement of a large lava flow from the Ogmundargigar crater row around the 12th century. The lava flow was confined to the valley between the two parallel ridges (top left), before reaching the southern coast of the Reykjanes Peninsula (lower right) along a broad front.