According to the Mt. Erebus activity log, several "small- to medium-sized" eruptions occurred during 12-18 October, with a "very large" eruption occurring on 14 October. The eruption sizes were based on comparisons of seismic data for known Erebus eruptions.
Source: Mount Erebus Volcano Observatory
Continuing lava lake; slightly decreased thermal activity recorded in 2022 compared to 2021
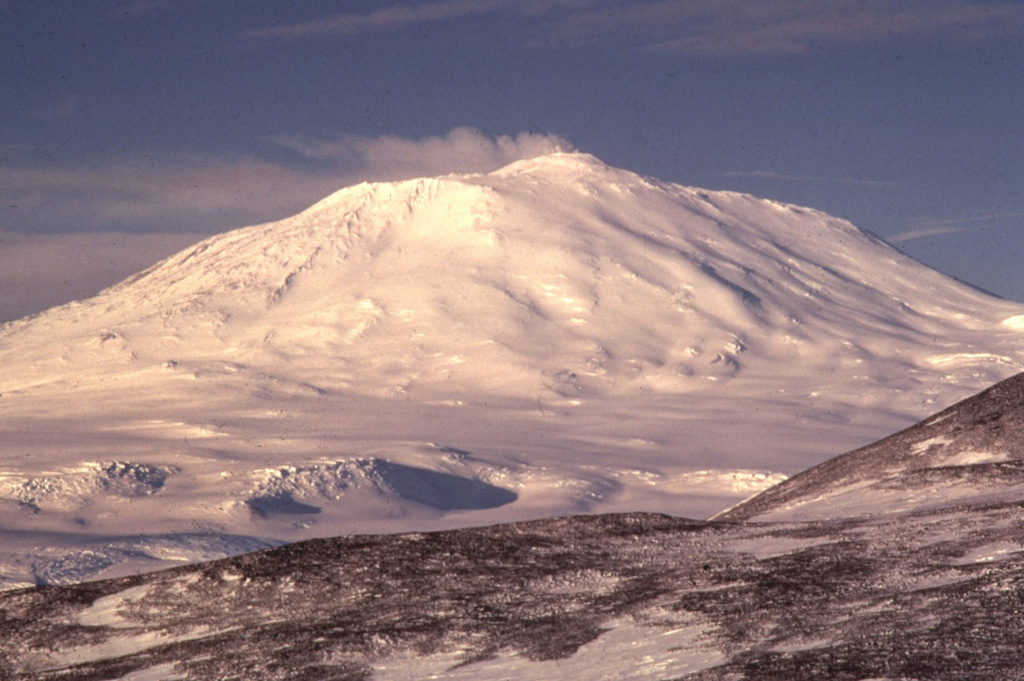
Erebus, Antarctica’s best known and world’s southernmost active volcano, overlooks the McMurdo research station on Ross Island. It has a lava lake in the summit crater that has been active since at least 1972. Because of the remote location, activity is primarily monitored by satellites. This report covers activity during 2022.
During 2022 the Sentinel-2 satellite only captured images of Erebus during 1 January-8 March and 27 September-26 December (figure 31). The images showed at least three distinct thermal sources within the summit crater. The HIGP MODVOLC Thermal Alerts System recorded more thermal activity during January-May, and lower activity during June-December compared to 2021 (table 8).
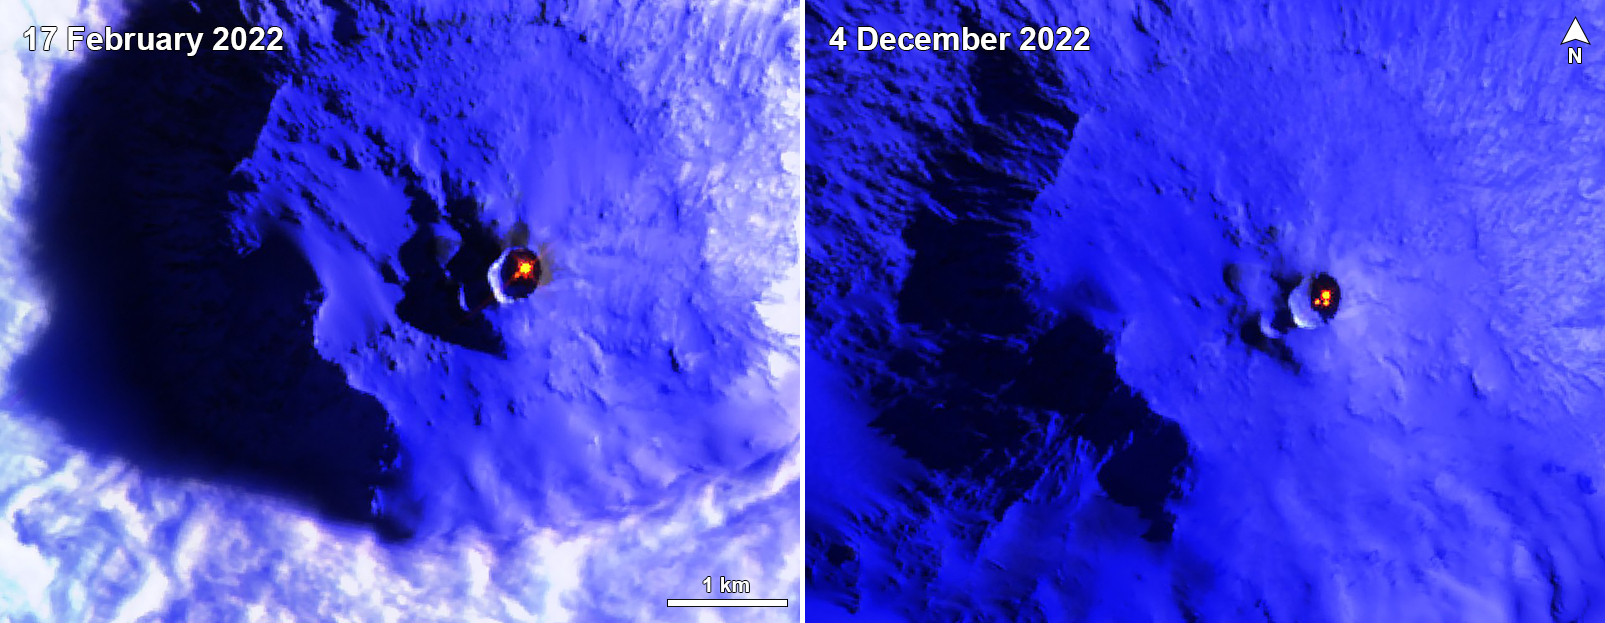 |
Figure 31. Sentinel-2 infrared satellite images showing the active lava lake in the summit crater of Erebus during 2022. The image on 17 February shows a single lava lake, while the image on 4 December shows a larger lake and at least two smaller thermal areas immediately SW. Images use Atmospheric Penetration rendering (bands 12, 11, 8A). Courtesy of Sentinel Hub Playground. |
Table 8. Number of monthly MODIS-MODVOLC thermal alert pixels recorded at Erebus during 2017-2022. See BGVN 42:06 for data from 2000 through 2016. The table was compiled using data provided by the HIGP – MODVOLC Thermal Alerts System.
| Year | Jan | Feb | Mar | Apr | May | Jun | Jul | Aug | Sep | Oct | Nov | Dec | SUM |
| 2017 | 0 | 21 | 9 | 0 | 0 | 1 | 11 | 61 | 76 | 52 | 0 | 3 | 234 |
| 2018 | 0 | 21 | 58 | 182 | 55 | 17 | 137 | 172 | 103 | 29 | 0 | 0 | 774 |
| 2019 | 2 | 21 | 162 | 151 | 55 | 56 | 75 | 53 | 29 | 19 | 1 | 0 | 624 |
| 2020 | 0 | 2 | 16 | 18 | 4 | 4 | 1 | 3 | 18 | 3 | 1 | 6 | 76 |
| 2021 | 0 | 9 | 1 | 0 | 2 | 56 | 46 | 47 | 35 | 52 | 5 | 3 | 256 |
| 2022 | 1 | 13 | 55 | 22 | 15 | 32 | 39 | 19 | 31 | 11 | 0 | 0 | 238 |
Information Contacts: Hawai'i Institute of Geophysics and Planetology (HIGP) - MODVOLC Thermal Alerts System, School of Ocean and Earth Science and Technology (SOEST), Univ. of Hawai'i, 2525 Correa Road, Honolulu, HI 96822, USA (URL: http://modis.higp.hawaii.edu/); Sentinel Hub Playground (URL: https://www.sentinel-hub.com/explore/sentinel-playground).
2005: October
2001: May
| November
According to the Mt. Erebus activity log, several "small- to medium-sized" eruptions occurred during 12-18 October, with a "very large" eruption occurring on 14 October. The eruption sizes were based on comparisons of seismic data for known Erebus eruptions.
Source: Mount Erebus Volcano Observatory
As of 23 November, frequent Strombolian eruptions (~1-10 per day) occurred from a persistent ~15-m-diameter summit lava lake at Erebus. In addition, infrequent small ash eruptions took place at a vent adjacent to the lava lake.
Source: Mount Erebus Volcano Observatory
Geologic Summary. Mount Erebus, the world's southernmost historically active volcano, overlooks the McMurdo research station on Ross Island. The 3,794-m-high Erebus is the largest of three major volcanoes forming the crudely triangular Ross Island. The summit of Mount Erebus has been modified by several generations of caldera formation. A summit plateau at about 3,200 m altitude marks the rim of the youngest caldera, within which the modern cone was constructed. An elliptical 500 x 600 m wide, 110-m-deep crater truncates the summit and contains an active lava lake within a 250-m-wide, 100-m-deep inner crater. The glacier-covered volcano was erupting when first sighted by Captain James Ross in 1841. Continuous lava-lake activity has been documented since 1972, punctuated by occasional Strombolian explosions that eject bombs onto the crater rim.
Source: Mount Erebus Volcano Observatory
Reports are organized chronologically and indexed below by Month/Year (Publication Volume:Number), and include a one-line summary. Click on the index link or scroll down to read the reports.
Ash eruption with gray cloud rising 300 m above summit
Card 2026 (10 December 1974) Ash eruption with gray cloud rising 300 m above summit
A violent rock and ash eruption from Mt. Erebus . . . was reported by Samuel Treves, a University of Nebraska geologist. Erebus . . . produced a gray ash cloud that extended 300 m above its summit. Treves and P. Kyle, of Victoria University, New Zealand, first noticed increased activity in the volcano in the austral summer of 1972-73 when they observed a lava lake in the crater. A year later the lava lake had increased to a height of 120 m. During austral summer 1974-75, a team of volcanologists from France, New Zealand, and the United States will try to enter the crater to collect gas and lava.
Information Contacts: Samuel Treves, University of Nebraska, USA; William C. Buell IV, Arlington VA, USA.
Crater lava lake increases in size since 1974-75 summe
The following information was extracted from the November/December issue of the Antarctic Journal of the United States. "The lava lake dimensions in Mount Erebus' inner crater (figure 1) has increased in size since the 1974-75 austral summer. This observation was made by four New Zealand scientists who camped near the volcano's summit 30 November-7 December 1975.
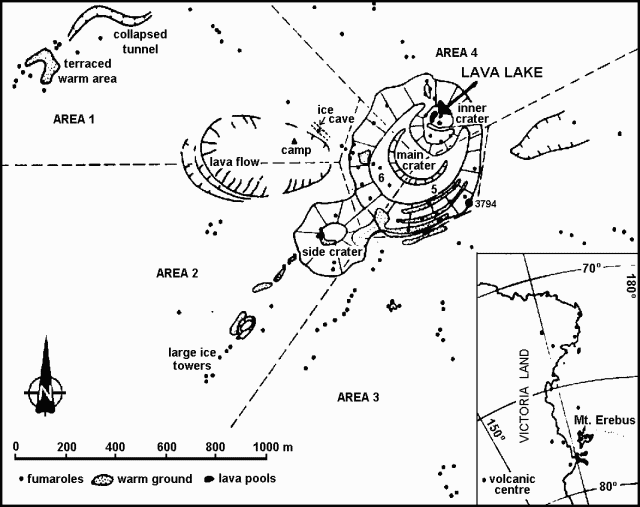 |
Figure 1. Summit region of Mt. Erebus, and its location. Ice towers are marked as fumaroles. After Lyon and Giggenbach, 1974. |
"Last season the lava covered only part of the N half of the inner crater, moving along a curved path originating at the E end and disappearing in a tunnel at the W end. A 14-person French-New Zealand-U.S. team made the observations during 1974-75, and attempted unsuccessfully to enter the inner crater. According to P.R. Kyle and W.F. Giggenbach, lava now fills the entire N half of the inner crater with the previously circular movement having been replaced by a series of overlapping areas where lava is welling up. An average of about two explosions per day were heard in the camp area; they appeared to be less violent, and were characterized by a more prolonged, whooshing noise compared to the short, sharp bangs heard during last season's visit. Only small pools of lava were observed 3 years ago. Since then a steady expansion in the area of exposed lava has taken place."
Reference. Lyon, G.L., and Giggenbach, W.F., 1974, Geothermal activity in Victoria Land, Antarctica: New Zealand Journal of Geology and Geophysics, v. 17, p. 511-521.
Information Contacts: P. Kyle, Inst. of Polar Studies, Ohio State Univ.; W. Giggenbach, DSIR, Wellington.
Vigorous convection in 100-m-diameter anorthoclase phonolite lava lake
On 20 December 1976, a team visited the crater of Mt. Erebus. They reported the continued existence of the anorthoclase phonolite lava lake first discovered in December 1972. During the 4 years of its existence, the lava lake has slowly increased in size and is now ~100 m in diameter. A temperature of 980 ± 20°C was obtained using an optical pyrometer. Vigorous convection occurred over part of the lava lake.
Information Contacts: P. Kyle, Ohio State Univ.
No apparent change in the lava lake; two small Strombolian eruptions
Philip Kyle and two associates visited the summit crater on 28 November. The persistent anorthoclase phonolite lava lake did not appear to have changed substantially since the previous observation in December 1976. The semicircular lake was ~130 m long and covered by an olive green crust, which was continuously being disturbed by minor upwellings. No major convective flow was noted.
Two small Strombolian eruptions originating from the lava lake and a small adjacent vent occurred during 5 hours of observation. One bomb was projected onto the main crater floor, 100 m above the inner crater floor. Large fresh bombs, up to 2 m long, were numerous around the NE main crater rim and were randomly scattered across the entire main crater floor, indicating that moderate Strombolian eruptions had occurred recently, probably during the previous 2-3 weeks. . . .
Information Contacts: P. Kyle, Ohio State Univ.
Lava lake persists; Strombolian eruptions from nearby vent
Geologists from France, New Zealand, and the U.S. conducted studies on Mt. Erebus between 2 and 17 January. The anorthoclase phonolite lava lake, which has persisted since its discovery in December 1972, occupied the entire N half of the inner crater. There were two zones of upwelling in the 130-m-long, oval-shaped lake: one at the extreme SW end (often obscured by fumes) and a second ~30 m from the E end. Doming of the lava lake surface was occasionally observed, including one large blister that grew to ~80 m height before bursting.
Between two and six moderate Strombolian eruptions occurred daily (54 during the 16-day observation period) from a vent ~30 m S of the lava lake. The eruptions lasted 1-15 seconds and were frequently followed by emission of fume clouds containing Pelé's hair up to 15 mm long and 3 mm in diameter. Bombs up to 0.3 m in diameter were thrown over the main crater rim (~270 m higher than the vent) and bombs as large as 10 m in diameter were found near the vent. The vent had built a small spatter cone with an orifice 2-3 m across containing a small lava pool (briefly absent after eruptions).
Oscillations of the lava lake level were observed three times on 16 January. The oscillations were periodic, with an amplitude of about 2 m and a period of between 14 and 18 minutes. There was no apparent correlation with explosive activity.
Geothermal activity had changed little from previous observations. However, large cracks were developing above geothermal features on the N wall of the main crater and may lead to collapse in this area. The cracks, 30-100 mm wide and 1.5 m deep in many places, were traced about 200 m around the N main crater rim. Material falling from this area would land in the lava lake.
Information Contacts: B. Scott, NZGS, Rotorua.
Strombolian activity increases and 15 years of lava lake history are summarized
The following is excerpted from Kyle and McIntosh (1978). "The most significant change in the activity during 1977-78 was an increase in explosive Strombolian eruptions. In the 1976-77 field season (22-31 December 1976) no explosive eruptions were heard, although in previous years they were frequent (Kyle and others, 1982). Compared to the 1972-75 period, eruptions during 1977-78 were more frequent and possibly larger in size. It is believed that most of the eruptions originated from the Active Vent. The number and size of the bombs were greater than observed in any previous season since observations began in 1971-72. Pelé's hair up to 100 mm in length was particularly common and was found lying on the snowy N flanks over 3 km from the crater.
"The persistent lava lake showed no apparent increase in size over that observed last year (figure 2). Subsidence along a large depression parallel to the ridge that divides the Inner Crater in half may be due to a slight lowering in the level of the magma column. On the E end of the lava lake, two raised benches of consolidated lava are also suggestive of a slight lowering in the lava lake.
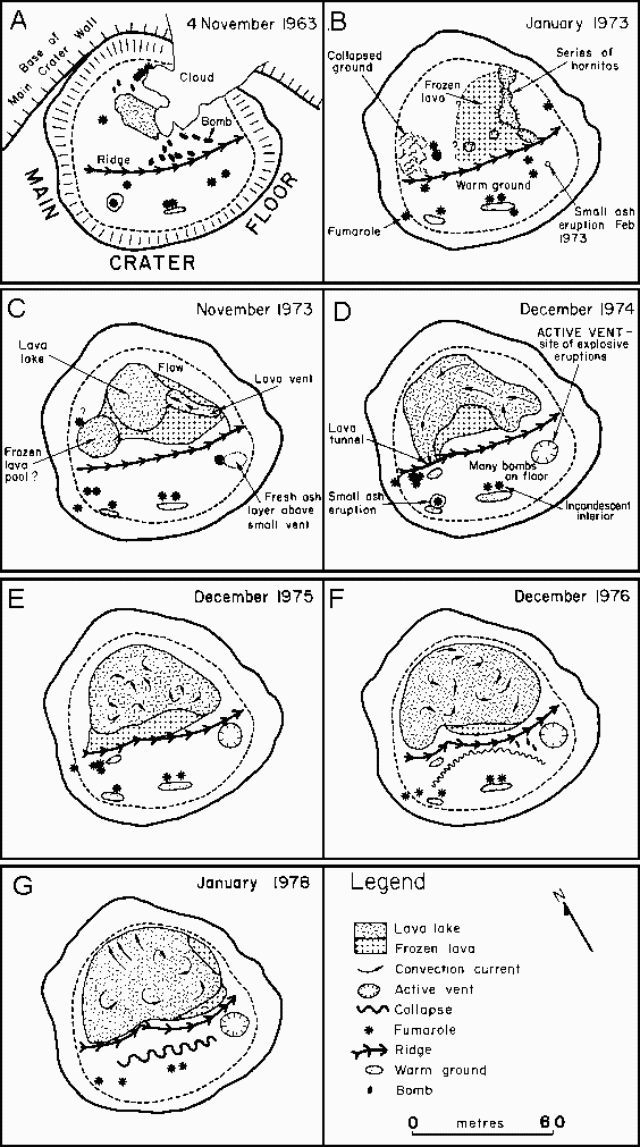 |
Figure 2. Summary of lava lake development, Mt. Erebus, November 1963-January 1978. From Kyle and McIntosh, 1978. |
"Activity within the lava lake consists of three main features: 1) lava upwelling in nearly circular areas; 2) small bubble-like degassing eruptions; and 3) downwelling of the consolidated crust along planar troughs or 'subduction zones.' While there was moderate and steady downwelling along the N wall, downwelling along central 'subduction' cracks was more rapid or at least more apparent. Migration of subduction zones themselves was the most easily observed surface movement. Upwelling was difficult to detect as it did not usually involve bubble formation; instead, a slight increase of incandescence and cracking of the lava crust was the main surface manifestation.
"Major element analyses of four bombs collected in 1977/78 are indistinguishable (within analytical error) from analyses of ejecta collected in previous years. The magma column is therefore not undergoing rapid changes due to crystal fractionation or influxes of new magma. Apparently the lava lake is the surface expression of a stable convecting column of magma."
References. Kyle, P.R.,. and McIntosh, W., 1978, Obervations of volcanic activity at Mt. Erebus, 1978: Antarctic Journal of the United States, v. 13, no. 4, p. 32-34.
Kyle, P.R., Dibble, R.R., Giggenbach, W., and Keys, J., 1982, Volcanic activity associated with the anorthoclase phonolite lava lake, Mount Erebus, Antarctica, in Craddock, C. (ed.), Antarctic Geoscience: Univ. of Wisconsin Press, Madison, p. 735-745.
Information Contacts: P. Kyle, Ohio State Univ.
Lava lake activity persists; two small congealed lava flows, but reduced Strombolian activity
"The persistent anorthoclase phonolite lava lake at Mt. Erebus was observed on 26 October during a 5-hour visit to the summit crater by Philip R. Kyle and others. First discovered in December 1972 by Giggenbach and others, the lava lake gradually increased in size over a 3-year period, but has shown little change for the last 2 years. Two small congealed lava flows were visible on the S side of the inner crater. One flow originated from a small vent in the SW quadrant of the inner crater, the other flow apparently came from the lava lake.
"The general appearance of the lava lake was one of increased heat flow. The consolidated crust on the lake appeared to be less continuous and was broken by numerous E-W cracks. Larger areas of incandescent lava were visible compared to observations made in January 1978. The lava lake appeared to have increased in temperature, but no quantitative measurements are available. Small bubble-like degassing eruptions were common over most of the lake, with a greater concentration toward the W. The level of the lava lake appeared similar to that in January, although the surface area may have been reduced due to the collapse of the N crater wall. Minor collapse is common around the whole inner crater wall.
"Only a few small bombs were found on the crater rim and none were observed on the main crater floor, which suggests that there has been a considerable decrease in Strombolian eruptions compared to January, when up to six eruptions per day occurred. . . ."
Information Contacts: P. Kyle, Ohio State Univ.
Lava lake and Strombolian activity persist
The following is excerpted from Kyle (1979). "An average of 1.6 eruptions per day occurred during December 1978, compared to 3.6/day in January 1978 and an average of about 2.5 eruptions daily between December 1972 and January 1976.
"During an attempt on 23 December 1978 by a joint U.S.-New Zealand team to get a member into the Inner Crater, an eruption occurred from a small vent (termed the active vent) adjacent to the lava lake. Lava was observed to rise rapidly in the active vent, and as it reached the rim the explosion occurred. At the time of the eruption, New Zealand volcanologist W.F. Giggenbach had descended to ~25 m above the Inner Crater floor. One small bomb hit him above his knee, burning his woolen pants but causing no injury. Other bombs rose ~200 m above the Main Crater rim, many landing on the Main Crater floor. After the eruption there was a drop in the general level of the lava lake, which returned to its original level in about 15 minutes. It is believed that a subterranean connection exists between the active vent and the lava lake.
"The overall pattern of activity at Mt. Erebus is unchanged. The small Strombolian eruptions are likely to continue as long as the active vent is open and connected to the main magma column. Since 1976 there has been no increase in the size of the lava lake; collapse of the N crater wall has probably reduced the overall size. It is apparent from observations made inside the Inner Crater that the lava is perched above the floor in the Inner Crater. A ridge and small levee retain the lava to the N half of the Inner Crater."
Reference. Kyle, P.R., 1979, Volcanic activity of Mt. Erebus, 1978/79: Antarctic Journal of the United States, v. 14, no. 5, p. 35-36.
Information Contacts: P. Kyle, Ohio State Univ.
Lava lake revisited
"The summit was visited by a Japan-New Zealand-U.S. group in December. The pattern of volcanic activity remains similar to that observed a year ago. Almost no change in the shape of the persistent anorthoclase phonolite (Kenyte) lava lake was noted. . . . The lake is oval, ~100 m long and 60 m wide, with total surface area approximately 4,500 m2. The lava lake level appears to be slightly lower, by ~3-5 m, compared to 1 year ago. A small distinct bench, l-5 m wide, occurs at several places around the perimeter of the lake and probably marks a former lake level, possibly that of last year. Five conspicuous fumarole vents were observed on the bench. Each vent was zoned by concentric bands of differently colored sublimates. Incandescent lava was observed beneath each vent.
"Convection of the lava lake was variable, with upwelling occurring about 1/3 of the distance from both ends of the lake. During periods of moderate convection, degassing was quiet and spread more evenly over the lava lake. Degassing bubbles were fewer, larger, and reached about 5-10 m in diameter. However, during stages of more active convection, degassing of the lava lake was noisy with more rapid upwelling. Explosive eruptions from the active vent continued at a frequency of ~2/day. One eruption was seen to eject bombs about 300 m above the vent. Minor ash eruptions occurred on two occasions.
"A tri-partite seismic array consisting of one horizontal and two vertical seismometers was operated for one week at the summit. The system detected explosive earthquakes as well as other shallow events not accompanied by explosive activity. Some of the larger explosions could be seen on the WWSSN station at Scott Base, 30 km away.
"Major element analyses of whole rock and interstitial glasses indicate no variation in chemical composition of the anorthoclase phonolite between December 1972 and December 1978. The lava lake probably represents the top of an extremely stable convection system, presumably connected at depth to a major magma chamber. No attempt was made to descend into the Main or Inner Craters this year."
Information Contacts: P. Kyle, Ohio State Univ.
Lava lake revisited; seismic and acoustic monitoring begin
"The summit crater was visited by Japanese, New Zealand and U.S. scientists during late December and early January. A 1-day visit was also made in November. The anorthoclase phonolite lava lake was still present, although its level may have been slightly lower than that observed over the last 2 years. The 120-m-long oval-shaped lava lake still showed a simple convection pattern with lava apparently welling up from two centers about 1/3 of the way from each end.
"Small Strombolian eruptions continued at a frequency of 2-6/day. The noise associated with the eruptions consisted of a long drawn-out roar, contrasted with the strong explosive eruptions heard in previous years. Although no eruptions were witnessed they are believed to occur from the small Active Vent, adjacent to the lava lake. Very few bombs were found on the main crater rim during December, but in January there were a few sharper explosive eruptions and these ejected material onto the rim.
"The three nations commenced a new project and installed three permanent seismometers on the mountain. The seismometers have radio-telemetry links with Scott Base (the New Zealand research station on Ross Island). Two seismometer are on the W flank of the volcano at altitudes between 1,500 and 1,900 m about 5 km from the crater rim. It is anticipated that these stations will run until April, when darkness sets in. The stations should be reactivated in October, when new batteries will be installed and the solar panels will function. The third station is at the summit, and has its batteries buried in warm ground. It is hoped that it will operate all year round. The summit station is also transmitting the output from an acoustic sensor (a microphone which monitors the sounds of volcanic eruptions) and a large wire loop around the crater, which monitors induced currents. A fourth permanent seismic station will be installed in December 1981.
"Preliminary observations from the seismic network, which can detect events with magnitudes less than 1, indicate a surprisingly high level of microearthquake activity, with up to 10 events/day. Some of these are apparently tectonic earthquakes occurring some distance from Mt. Erebus. Antarctica has been considered aseismic, but this is apparently not the case, at least not for microearthquakes with magnitudes less than 3."
Information Contacts: P. Kyle, Ohio State Univ.
Lava lake level lower
"The summit crater was visited by New Zealand and U.S. scientists during late November and December 1981, and on one day in late January 1982. The anorthoclase phonolite lava lake was still present and the pattern of activity was similar to that observed over the last 5 years.
"The lake was undergoing simple convection. Small Strombolian explosions continued at a frequency of 4-6/day. The eruptions were believed to originate from the Active Vent, adjacent to the lava lake. Many fresh bomb were found on the crater rim, suggesting that the eruptions were the strongest observed in the last 3 years. This may reflect an increase in distance between the lip of the Active Vent and the underlying magma level.
"The lava lake grew from small hornitos in 1972 to a semi-circular lake ~100 m long by 1976. Since then there has been little change in surface area, but a slight lowering in the lake level has occurred. No measurements of the magma column withdrawal were available but it was small, perhaps 5-10 m over the last 3 years. The withdrawal was possibly equivalent to the amount of material ejected by the small Strombolian eruptions. A deformation survey pattern set up in December 1980 was remeasured in December 1981; . . . data indicate [little change in the width] of the crater rim, [despite the] lowering of the column. Withdrawal was [however] suggested by the development of a semi-radial fracture, on the main crater floor, that parallels the inner crater rim."
Further References. Dibble, R.R., Kienle, J., Kyle, P.R., and Shibuya, K., 1984, Geophysical studies of Erebus volcano, Antarctica, from 1974 December to 1982 January, in Lynch, R.P. (ed.), Tenth Antarctic Issue: New Zealand Journal of Geology and Geophysics, v. 27, no. 4, p. 425-455.
Wiesnet, D.R., and D'Aguanno, J., 1982, Thermal imagery of Mount Erebus from the NOAA-6 satellite: Antarctic Journal of the United States, v. 17, no. 5, p. 32-34.
Information Contacts: P. Kyle, New Mexico Inst. of Mining & Tech.; P. Otway, NZGS, Wairakei.
Lava lake level drops slightly; explosion earthquakes; earthquake swarm near area of 1908 thermal activity
The following report from Juergen Kienle summarizes work by U.S., New Zealand, and Japanese scientists. "Surveillance of the activity associated with the anorthoclase phonolite lava lake continued during the 1982-83 austral field season. The summit crater was visited by New Zealand, U.S., and Japanese scientists on several occasions between November 1982 and February 1983. The approximately 100-m-long semicircular lava lake was still present. Its level had dropped by ~3 m, a loss of roughly 9,000 m3 of lava since the previous visit a year earlier. Since 1976, the lake area has stayed fairly constant. However, its level has been dropping at an average rate of ~2-3 m over the past 4 years.
"An original tripartite array of short-period seismic stations was installed in December 1980. During the 1981-82 field season, this array was expanded by two stations. All stations have single-component vertical seismometers. The summit station also transmits acoustic data to monitor explosive gas discharge from the lava lake. Another data channel is used to monitor electromagnetic signals induced in a wire loop laid around the summit crater by the eruption of conducting magma in the static field of the earth.
"Over the past 2 years many of the microearthquakes we recorded were located immediately beneath the summit lava lake. For example, figure 3 shows the epicenters and hypocenters of events located between December 1981 and January 1982. All but one of these events were explosion earthquakes that positively correlated with acoustic and sometimes electromagnetic signals. Explosive gas discharges from the lava lake typically occurred 2-6 times per day. Observers living in the summit hut commonly reported hearing several explosions per day.
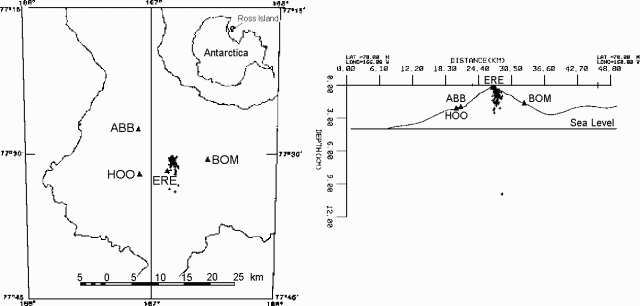 |
Figure 3. Locations (left) and E-W cross-section (right) of 75 earthquakes recorded 23 December 1981-18 January 1982 in map view. All shallow (<3 km) events were associated with an acoustic signal. Large triangles indicate positions of seismic stations. Inset shows the position of Ross Island. New determination of the velocity structure of Mt. Erebus will cause significant revision in earthquake locations. |
"Over the past 2 years we have also recorded microearthquake swarms that show a negative correlation with acoustic and electromagnetic signals. Typical daily counts of about 20 events during quiet periods rise by factors of about 5-10 in swarm periods. Again, most of these events were located beneath the summit region at depths shallower than 3 km.
"On 8 October 1982 an unusual earthquake swarm was recorded from a new source region on Ross Island. On that day almost 700 events occurred near Abbott Peak, a station 10 km NNE of the summit of Mt. Erebus. At this time we do not have reliable magnitudes for the events, but the fact that some of them were recorded at Scott Base and Mt. Terror suggest that the largest events had a local magnitude of 2-3. Figure 4 shows epicenters and a hypothetical cross section of the October events. It is interesting to note that the epicentral area is located halfway between Mt. Bird and Mt. Erebus and roughly correlates with an area that apparently was hydrothermally active in 1908. T.W. Edgeworth, David R. Priestley, and J. Murray, all members of the 1908 Shackelton expedition, reported steam clouds in April 1908 and a major steam eruption ('geysir') on 17 June 1908, rising from a source region at the 600-m level on the SSW slope of Mt. Bird. A tall jet of steam erupted from the same place on 8 September 1908. Philip Kyle has investigated rock outcrops in this area in recent years but could not find any sign of hydrothermal activity. The 8 October earthquake swarm may be related to renewed magma movement (dike injection?) at depth between Mt. Erebus and Mt. Bird. Preliminary hypocentral determinations suggest a clustering of events at 12-15 km depth. [Data compiled] by the Japanese participants in the International Mt. Erebus Seismic Study (IMESS) [included] the number of earthquakes recorded per hour and day at Abbott Peak, September-November 1982. On 8-9 October, the Abbott seismic station also recorded volcanic tremor from presently unknown depths."
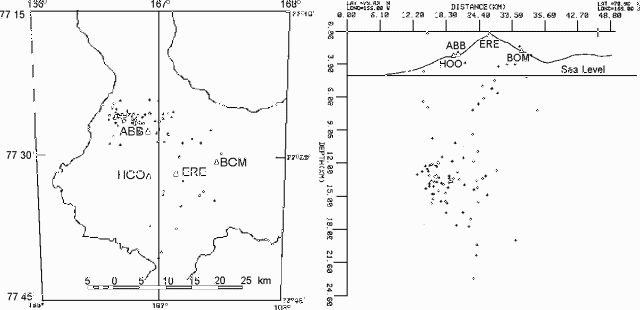 |
Figure 4. Epicenters of 92 earthquakes recorded at Erebus during 4-13 October 1982 in map view (left) and E-W cross section (right). New determination of the velocity structure of Mt. Erebus will cause significant revision in earthquake locations. |
Information Contacts: J. Kienle and D. Marshall, Univ. of Alaska; P. Kyle, New Mexico Inst. of Mining. & Tech.; K. Kaminuma, Nat. Inst. of Polar Research, Tokyo; R. Dibble, Victoria Univ., Wellington, New Zealand.
Dimensions of active lava lake from photo data; seismicity normal; SO2 flux measured
"Volcanic activity at Mt. Erebus was observed in November and December 1983 by scientists from New Zealand and the U.S. The persistent convecting anorthoclase phonolite lava lake still existed and displayed activity similar to that observed over the last few years. Since 1976 its surface area has remained relatively constant. A recent airphoto showing the lava lake allowed a more precise determination of its size. The photo showed that the lake was ovoid and ~60 m long by ~45 m wide, considerably smaller than other ground-based observations have suggested.
"It has been previously reported that the level of the lava lake was dropping. A recent analysis of ground-based photographs makes it difficult to confirm a substantial lowering in the lake surface relative to other features seen on the Inner Crater floor. A small amount of lowering was documented in the 1979-80 austral summer field season, when a distinct bench with fumaroles rimmed the lake. However, the volcanic gas plume from the lake makes it extremely difficult to determine the lava lake height using simple visual estimates from the crater rim. Deformation studies currently in progress by NZGS personnel should give a better indication of the changes in the lava lake.
"The seismic network on Mt. Erebus was expanded by University of Alaska and Japanese personnel. Six radio-telemetry stations consisting of a single vertical-component seismometer are now situated on the flanks of the mountain. An additional station near the summit is presently inoperative. Three other stations are placed at sites 30-40 km from the summit of Mt. Erebus. Preliminary analysis of the seismic records show the level of seismicity to be normal.
"Airborne observations made using a C130 aircraft included sampling the plume for particle size distribution, and remote sensing using a COSPEC to determine SO2 flux, which was 230 ± 90 t/d [on 19 December]."
Further Reference. Chuan, R.L., Palais, J., and Rose, W.I., 1986, Fluxes, sizes, morphology, and compositions of particles in the Mt. Erebus volcanic plume, December 1983: Journal of Atmospheric Chemistry, v. 4, p. 467-477.
Information Contacts: P. Kyle, New Mexico Inst. of Mining & Tech.; W. Rose, Michigan Tech. Univ.
Vigorous explosions, clouds, and incandescent tephra
"Brief reports from technical staff operating seismic instruments at Scott Base and infrasonic equipment at McMurdo Sound indicate a significant change in eruptive activity at Mt. Erebus. Activity associated with the lava lake has consisted of quiet degassing with emission of ~230 t/d of SO2 and 21 t/d of aerosol particles. Two to six small Strombolian eruptions occurred per day, often ejecting bombs of anorthoclase phonolite onto the crater rim, ~220 m above the lava lake.
"The reports indicate that starting on 13 September a number of large explosions were recorded by the IMESS network situated on the volcano, by infrasonic detectors in Windless Bight (~29 km away), by the WWSSN seismograph at Scott Base (37 km distant), and by a tidal gravimeter at South Pole station (~1,400 km from Mt. Erebus). Previous Strombolian activity has generally been too weak to record except on the IMESS seismic stations.
"From 13 to 19 September, the volcano was very active with 8-19 large explosions (recorded on WWSSN, IMESS, and infrasound instruments) per day, decreasing to 2-8/day 20-25 September, then increasing again to 12-27 explosions per day 26-29 September. Numerous mushroom-shaped clouds were reported, and were estimated to rise as much as 2 km above the summit. Observers at McMurdo, 37 km SW of the volcano, reported hearing explosions on 16 September at 0459, and 26 September at 1133 and 1135. Slight earth tremors were also felt there. On 17 September at 1010, a bright summit glow was observed from McMurdo Sound. Six minutes later, incandescent bombs were ejected to ~600 m above the summit; observers at Butter Point, 70 km from the volcano, reported seeing incandescent tephra from this explosion, which produced one of the larger infrasonic and seismic signals of the eruption sequence.
"Ash covered the NW side of the volcano down to 3,400 m elevation. Fumaroles around the summit crater showed a substantial increase in activity. A 300-500-m-high very narrow plume was observed lower on the E flank (1,800 m?). Observers suggested that it might have been a geyser."
Information Contacts: P. Kyle, New Mexico Inst. of Mining & Tech.; J. Kienle and C. Wilson, Univ. of Alaska.
Large pumiceous bombs; lava lake frozen and uplifted
Vigorous explosive activity continued through the end of October. During the first half of October, there were about 15 large explosions per day, most of which were recorded by infrasonic detectors at Windless Bight and the WWSSN seismograph at Scott Base, as well as by the seismograph network on the volcano. Most explosions ejected a small number of very vesicular bombs that were typically 2-4 m in diameter but sometimes reached 6-8 m. Some of the bombs were ejected to heights of 500 m or more, possibly to as much as 1 km. Most fell on the upper 150 m of the outer crater rim. Continuous daylight in the area has prevented distant observers from seeing ejections of incandescent tephra after the early part of the increased activity.
The summit crater lava lake was ~100 m below the rim and actively convecting in late 1983. When Philip Kyle flew over the crater on 20 October, the lava lake surface had frozen and domed upward to within roughly 30 m of the rim, piling up against the N wall of the crater and sloping S. [Subsequent work has shown that the lake surface had not been domed upward. Instead, the crater had been partially filled by ejecta from the increased activity.] The bench area and fumaroles that formerly occupied the S part of the crater were covered. A small vent containing incandescent material was present near the center of the uplift and there were scattered fumaroles in the frozen lake surface. Kyle saw no explosions during his overflight but 500-1,000 bombs had accumulated on the outer crater rim in the 3-4 days since a heavy snowfall had covered earlier ejecta. Prior to the increased activity in September, few of the bombs ejected by the small Strombolian explosions that have accompanied lava lake activity since 1972 have reached the crater rim. Microprobe analyses of glass from bombs sampled by Kyle on 20 October were identical in composition to glasses in the anorthoclase phonolite bombs ejected since 1972.
Information Contacts: P. Kyle, New Mexico Inst. of Mining & Tech.
Explosions continue, ejecting large pumiceous bombs
During November and December, about 4-12 explosions occurred per day. Many threw bombs over the crater rim, especially on the N side. The character of the activity changed in early December to high-velocity gas streaming episodes that lasted about 30 seconds each. A few bombs were entrained with the gas. Analysis of the bombs showed that they were of identical composition to the anorthoclase phonolite of previous years; no changes were noted in glass composition or SO2 content of the magma. No blocks were ejected. The explosions occurred from a small new vent in the center of the inner crater, on the S edge of the former lava lake. The vent seemed to increase in size, reaching ~30 m in diameter by late December. Sounds from the vent in late December were similar to those previously produced by degassing from the lava lake. Lava was not visible, but it was not possible to see the bottom of the vent.
In previous years, an active vent had been located just S of the SE edge of the lava lake. This vent was not present in November but reappeared in early December in a similar position. Gas streaming episodes were not observed in late December. However, the 8-16 explosion events/day recorded in February by the seismic network on the volcano were accompanied by about a dozen periods of seismicity that lasted more than a minute and appeared to be records of gas streaming episodes. Magnitudes were increasing in February after a decrease during the austral summer.
SO2 measurements using an airborne COSPEC were unsuccessful because the plume hugged the ground, dropping over the crater rim. Geologists estimated that a minimum of ~30 t/d of SO2 were being emitted, much less than the 230 t/d measured the previous austral summer. The odor of SO2 in the plume had decreased substantially from the previous year. . . . Reoccupation of a network of stations around the main crater rim (figure 5) suggested that there had been [minor but significant inflation (23 mm)] in the past year [bringing the total over the last 4 years to 45 mm (figure 6). No tilt has been detected from arrays on the outer slopes of the crater rim during that time.]
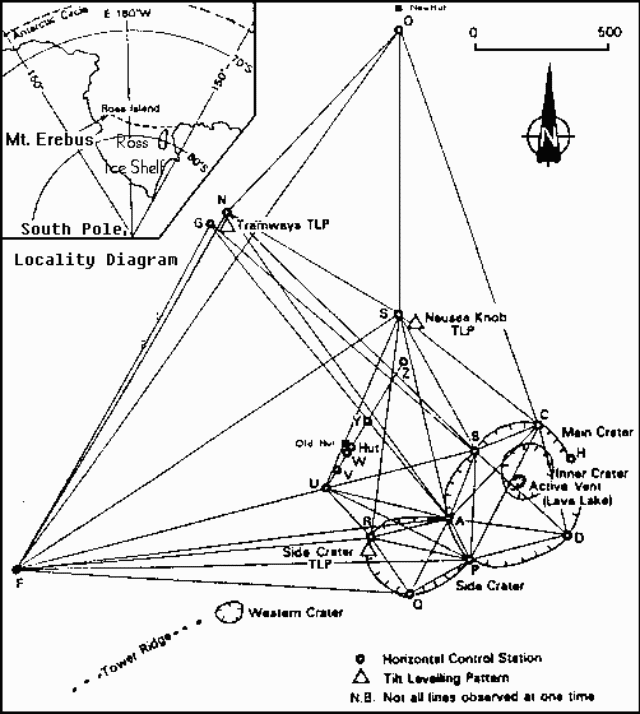 |
Figure 5. Deformation network and craters at Mt. Erebus. From Blick, 1987. |
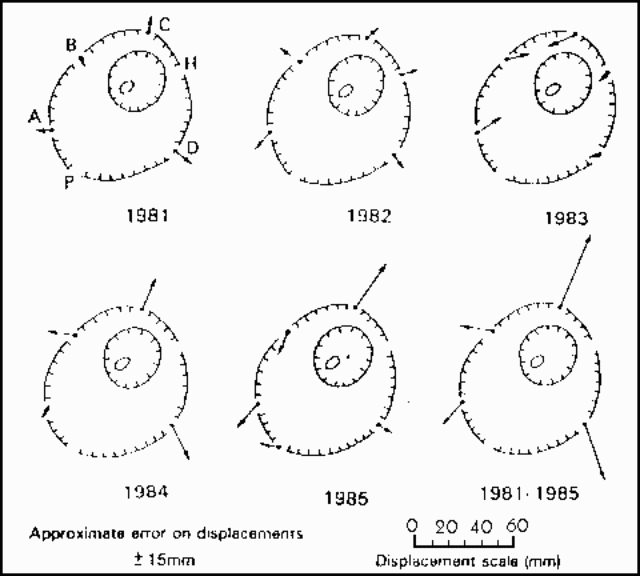 |
Figure 6. Displacements of stations around the main crater of Mt. Erebus, 1981-85. From Blick, 1987. |
Further References. Blick, G.H., 1987, Mt. Erebus, Antarctica: volcanological observations and deformation survey: New Zealand Volcanological Record, v. 15, p. 52-55.
Blick, G.H., Otway, P.M., and Scott, B.J., 1989, Deformation monitoring of Mt. Erebus, Antarctica, 1980-1985, in Latter, J.H. (ed.), Volcanic hazards; assessment and monitoring: Springer-Verlag, Berlin, Germany, p. 554-560..
Summaries of activity at Mt. Erebus in the Antarctic Journal of the United States (year described: citation); 1975: v. 11, no. 4, p. 270-271; 1977-78: v. 13, no. 4, p. 32-34; 1978-79: v. 14, no. 5, p. 35-36; 1980-81: v. 16, no. 5, p. 34; 1981-82: v. 17, no. 5, p. 29-31; 1982-83: v. 18, no. 5, p. 41-44; 1983-84: v. 19, no. 5, p. 25-27; 1984-85: v. 20, no. 5, p. 25-28.
Information Contacts: P. Kyle, New Mexico Inst. of Mining & Tech.; J. Kienle, Univ. of Alaska; W. Rose, Michigan Tech. Univ.; P. Otway, DSIR, Wairakei, New Zealand.
Lava lake returns; weak SO2 emission
"Mt. Erebus has been in a continuous eruptive phase since 1972, when a small anorthoclase phonolite lava lake was discovered. From 1972 until about 1976 the lava lake expanded to a semi-circle about 60 m in diameter (figure 7, left). There was little change until 13 September 1984, when a significant increase in activity occurred, peaking during September and early October but remaining at significantly higher levels than the preceding 12 years until January 1985 (9:9-10 and 10:3). Previously, small Strombolian eruptions, which occurred 2-6 times/day, had occasionally ejected bombs from the 220-m-deep inner crater floor onto the main crater rim. During the increased activity, bombs averaging 2 m long and reaching more than 10 m in length were dispersed radially around the crater rim, to 1.2 km (horizontally) from the center of eruption in the inner crater. The eruptions were witnessed from 60 km distance and the explosions could be heard from 2 km.
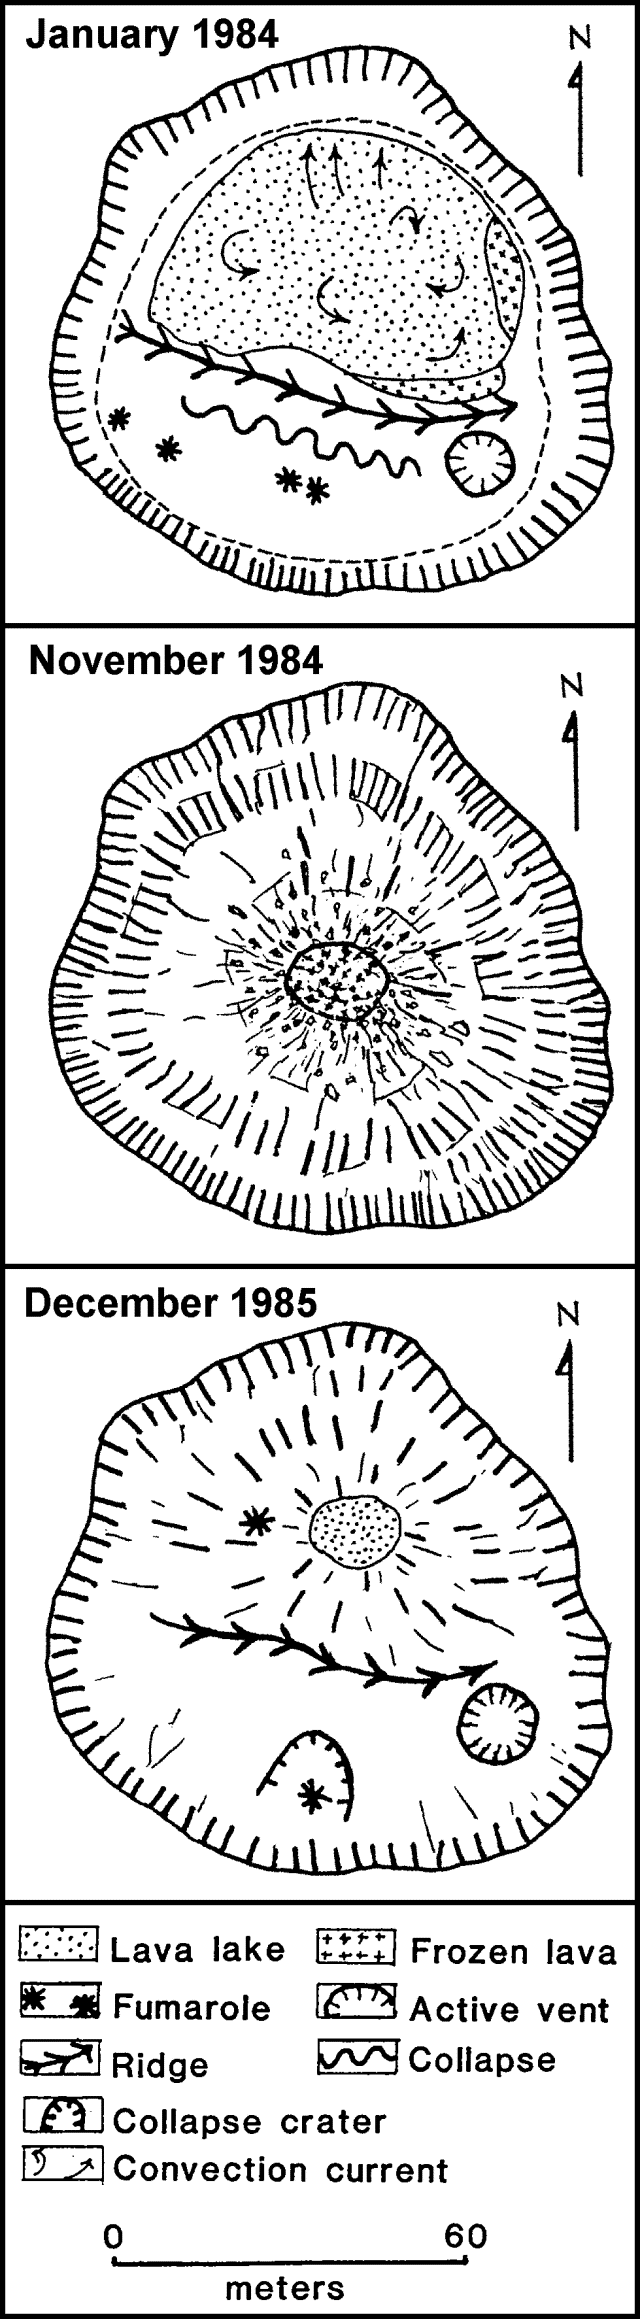 |
Figure 7. Sketch map showing the inner crater at Mt. Erebus in January 1984 (top), November 1984 (middle), and December 1985 (bottom). Courtesy of Philip Kyle. |
"Inspection of the volcano in October, November, and December 1984 showed that the lava lake was gone (figure 7, middle). An initial interpretation was that the lava lake had frozen over and was domed up. However, observations in December 1985 suggest that the inner crater was partially filled with ejecta from the eruptions.
"By December 1985, the inner crater showed some resemblance to its morphology and form prior to September 1984 (figure 7, bottom). A small lava lake, ~15 m in diameter, was in a site similar to that of the former lake. The elevation of the new lake was not measured, but it appeared similar to the 1983 lake. The active vent, a small explosion crater adjacent to the lava lake, had re-formed and a small crater was seen around the site of a fumarole that had been active prior to September 1984. The overall impression of the activity was that the magma column height and position had not changed significantly for the past 14 years. The late 1984 eruption partially filled the inner crater with ejecta that obscured the magma column. Since then, the ejecta have been assimilated back into the magma column or ejected by small eruptions from the lava lake and active vent.
"Ground-based COSPEC SO2 flux measurements made on 17 December 1985 showed cyclic variations of 5-20 t/d with a period of about 2.5 hours. The average SO2 flux was ~12-15 t/d. Seismicity during 1985 was variable (figure 8), showing high levels from mid-February to early April and throughout June and July. From August to December, the activity was extremely quiet."
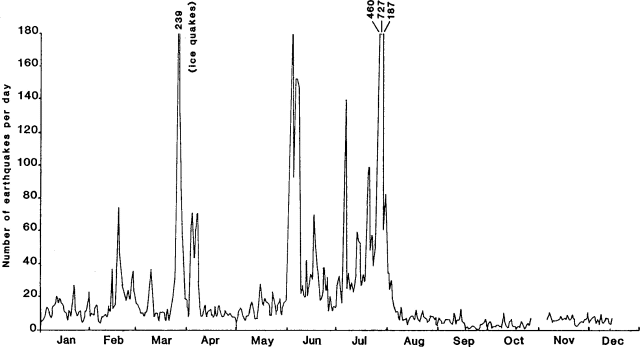 |
Figure 8. Number of local earthquakes/day at Mt. Erebus recorded by the seismometer at Hooper Shoulder during 1985. Courtesy of K. Kaminuma. |
Further Reference. Kaminuma, K., 1987, Seismic activity of Mt. Erebus volcano, Antarctica, in Okal, E.A., ed., Advances in Volcanic Seismology: Pure and Applied Geophysics, v. 125, p. 993-1008.
Information Contacts: P. Kyle, New Mexico Institute of Mining and Technology; K. Kaminuma, National Institute of Polar Research, Japan.
Frequent explosions from lava lake
Video surveillance showed that the lava lake that was first sighted in 1963 and has occupied the crater since 1972, remained active during the austral summer of 1986-87. From mid-November through early January about two strong eruptions were recorded/day. The center of the lava lake was continuously active and almost all eruptive activity occurred within the nearly 50-m-wide lake. During eruptions the active area bulged up, then exploded, throwing bombs to hundreds of meters height. Earthquakes accompanied even the small explosions. Present activity was similar to that of previous years, except that the vent above the lava lake was no longer active.
The inner crater floor and lava lake were being monitored by a black-and-white, heat-sensitive, mounted camera that transmits continuously to Scott Base, where data are recorded for at least 4 hours/day. The camera is expected to operate well into the Antarctic winter before the batteries fail.
Further Reference. Kaminuma, K., and Dibble, R., 1988, An eruption process of Mt. Erebus, Antarctica: Proceedings, Kagoshima International Conference on Volcanoes, p. 66-70.
Information Contacts: R. Dibble, Victoria Univ.
Mild Strombolian activity at lava lake
"Mount Erebus has been in continuous eruption since 1972, when a small anorthoclase phonolite lava lake was discovered. The semi-circular lava lake reached about 60 m in diameter. A major increase in the size and number of Strombolian eruptions occurred September-December 1984 and buried the lake with ejecta. A rough estimate suggests 100,000 m3 of phonolite was ejected.
"Since late 1984, activity has reverted to the daily mild Strombolian eruptions observed prior to that time. The former lava lake and associated vents are slowly being exhumed. Observations in December 1986 showed a small, pear-shaped lava lake about 20 m long, and several associated small hornitos and/or small lava pools. The Active Vent, a small explosive vent adjacent to the lava lake, commenced minor ash eruptions. SO2 emissions were monitored in December by COSPEC and ranged from 4 to 40 t/d with an average emission of about 20 t/d.
"The 10-station seismic array established as part of the International Mount Erebus Seismic Study was partially dismantled because of funding problems. Signals from a single seismic station are currently being recorded on a modified helicorder which will operate for 72 hours without maintenance."
Information Contacts: P. Kyle, New Mexico Institute of Mining and Technology.
Lava lakes; Strombolian activity; collapse; SO2 data
"Mt. Erebus was visited by New Zealand and U.S. scientists during November and December 1987. Activity generally remained unchanged from the previous year. The small active anorthoclase phonolite lava lake has increased in size, from about 20 m in diameter a year ago to about 30 m (figure 9). It fluctuated in height by as much as 2-5 m over periods of <1 hour. Such marked fluctuations have not been previously recorded during periods of quiet degassing. Two other small lava lakes, both <10 m in diameter, were observed. One was transient, and only appeared when the lava level was high in the main lake.
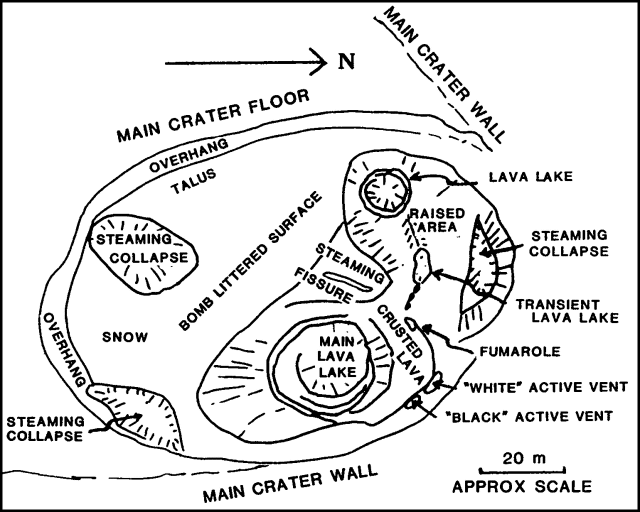 |
Figure 9. Sketch map of the inner crater of Mt. Erebus on 1 December 1987. Courtesy of Philip Kyle. |
"For about a month, from mid-November to mid-December, explosive activity was mild and consisted of small Strombolian eruptions, primarily from the main lava lake. Small eruptions also occurred from two possibly inclined vents at the base of the crater wall, NE of the main lava lake. During this period, no bombs were ejected from the inner crater. In late December, the Strombolian eruptions increased in size, with bombs landing on the main crater floor and rim.
"In early December, a crescent-shaped segment of the main crater floor and inner crater wall, ~60 m long and 10 m wide, collapsed into the southern part of the inner crater. It filled the large steaming collapse site SW of the main lava lake, and covered the S half of the inner crater with talus and debris. Large steaming fissures on the main crater floor suggest that further collapse is imminent.
"COSPEC measurements indicated that the average SO2 emission rate has increased to ~50 t/d. The average flux seemed to be a function of the lava lake surface area. As the lakes have increased in size, so has the SO2 flux. Significant and regular variations in the SO2 emission rates were observed, and may be correlated with changes in the rate of convection within the lava lake."
Information Contacts: P. Kyle, Univ. of London.
Lava lake shrinks to three pools; Strombolian eruptions
Geologists from Victoria University and the New Mexico Institute of Mining and Technology visited the summit of Mt. Erebus during December 1988. The following is from Philip Kyle. "Activity was generally low compared to previous years. Anorthoclase phonolite magma, still present in the summit's Inner Crater, was confined to three small pools (to 10 m in diameter). The pools were within a larger congealed lava lake that once exceeded about 25 m in diameter. Small Strombolian eruptions were rare, averaging <4/week. Several observed eruptions from the largest lava pool ejected a small number of bombs onto the Main Crater floor. Collapse of the southern Inner Crater wall continued to enlarge the crater slowly. SO2 emissions were ~30 t/d as measured by COSPEC. A video camera, permanently mounted on the crater rim, is being used to monitor and record eruptions."
Information Contacts: P. Kyle, New Mexico Institute of Mining and Technology; R. Dibble, Victoria Univ.
Occasional Strombolian explosions from two small lava lakes; stronger SO2emission
Scientists visited the summit of Mt. Erebus several times from mid-November 1989 through mid-January 1990. Activity was at a low level compared to that of the early 1980s. Anorthoclase phonolite lava in the summit inner crater was mainly confined to two small convecting lakes; one circular and about 20 m in diameter, and the other irregular and ~20 m long. This was the largest area of convecting lava seen at Mt. Erebus since late 1984, when eruptions buried an older, larger, lava lake system. Three hornitos were actively degassing around the lava lakes, and small fumaroles were present within the inner crater.
From mid-November to mid-December, infrequent small Strombolian explosions ejected bombs to a few tens of meters from the lava lakes. A small gas bubble burst was observed in one of the hornitos. In mid-December, an increase in the frequency and size of small Strombolian eruptions was recorded by Victoria University's remote video camera mounted on the crater rim 220 m above the lava lakes. Images transmitted to Scott base, 35 km from the volcano, showed bombs being ejected to more than 100 m height.
SO2 emission, monitored by COSPEC, has increased substantially over the previous 5 years, commonly exceeding 100 t/d. This increase was consistent with previous observations suggesting that the surface area of the lava lakes correlates with SO2 emission rates.
Information Contacts: P. Kyle and W. McIntosh, New Mexico Institute of Mining and Technology; R. Dibble, Victoria Univ.
Lava lake activity continues; remote camera documents strong explosion
"A team from New Mexico Tech visited the summit of Mt. Erebus 12-25 January 1991. Activity remained similar to that observed over the last three years. Two small convecting anorthoclase phonolite lava lakes were present, in positions similar to last year's, although minor changes in the size, shape, and positions of the lakes have occurred. The area of exposed convecting lava on the surface of the lakes probably exceeds that observed in December 1989. During a one-day visit on 26 December 1990, a small ash eruption was observed, feeding a cloud that rose several hundred meters above the crater rim. A light dusting of ash was apparent on the snow around the rim in January 1991. These minor ash eruptions appear to be related to vent clearing from the 'Active Vent' adjacent to the lava lakes. This vent has been inactive for the last few years, but was the site of frequent (1-6/day) small Strombolian eruptions from 1972 to 1984. A few fresh (<2 weeks old) bombs were found on the crater rim in January 1991. These are the first new bombs to be found on the rim in three years and suggest an increase in explosive activity. COSPEC measurements of SO2 emissions were about 70 t/d on 13 January, and similar values were measured on five other days.
"In March 1990, a remote video camera operated by R. Dibble (Victoria Univ, New Zealand) recorded a larger-than-normal eruption that temporarily consumed the two lava lakes. Bombs from the eruption were still falling up to 25 seconds after the initial explosion. [Although bombs from this activity are likely to have reached the rim, rapid alteration by the gas plume makes new bombs indistinguishable from older ones within a few weeks.] The camera was removed from the crater rim in December 1990. A 6-station seismic array on Mt. Erebus showed no anomalous activity during 1990."
Information Contacts: P. Kyle, New Mexico Institute of Mining and Technology.
Gas plume analyses reported
Since 1974 several expeditions have been organized to evaluate the mass and energy transfer from the magma in the lava lake to the atmosphere. Results have been in the range of 3-230 tons/day (t/d) of SO2. During this time, both the volcanic activity and the methods used to evaluate the gas output have changed. For the 1993-94 campaign both the COSPEC method and the SF6 tracer-gas method were used. A bottle of SF6 gas was driven into the crater and injected into the volcanic plume at a rate of 1.2 l/min. Seventeen sampling bottles installed downwind on the crater rim each sampled the plume for ~1 hour. Analyzing the SF6 concentration in each bottle allowed calculation of the atmospheric transfer coefficient: equal to the ratio of the concentration in the flask to the source SF6 flow rate. By analyzing the concentration of gas or aerosols collected at the same time and place it has been possible to determine the volcanic source output, assuming that the diffusion laws are the same for the artificial and the natural products.
The following results were obtained using the SF6 method (in tons/day): S, 50-80; Cl, 150-240; F, 50-80; Pb, 0.35; Zn, 0.53; As, 0.009; Bi, 0.0011; Cd, 0.01; Mo, 0.003; Cu, 0.19; Au, 0.002. COSPEC results obtained from a distance gave a SO2 flux of 120-150 t/d; an average of 60-75 t/d of sulfur.
CO was analyzed automatically during the cruise between Australia, Antarctica, and New Zealand, at the same time that samples were collected using a metallic cylinder on the crater rim and in the ice cave on the outer slopes of the volcano. The gas samples were analyzed using a trace analytical reduction gas detector connected with a gas chromatograph containing a 2-m molecular sieve column. Reduction gas detection occurs as a result of the passage of certain species through a heated bed of mercuric oxide (HgO); this method allows detection of reducing gases from the low parts per billion (ppb) to low percentages. The average concentration of CO varied between 80 and 120 ppb on the sea between Australia and Antarctica, but in the ice cave the CO concentration reached 152-456 ppb, and in the volcanic plume on the crater rim it reached 1,000-3,000 ppb.
Erebus, the world's southernmost historically active volcano, overlooks the McMurdo research station on Ross Island. The summit has been modified by several generations of caldera formation. The glacier-covered volcano was erupting when first sighted in 1841 and has had an active lava lake in its summit crater since late 1972.
Information Contacts: R. Faivre-Pierret, Institut de Protection et de Surete Nucleaire, Grenoble, France; F. LeGuern, B. Bonsang, E. Demont, M. Le Cloarec, E. Nho, and B. Ardouin, CNRS Centre des Faibles Radioactivites, Gif sur Yvette, France.
No significant activity from the active lava lake; gas measurements
Significant collapse of the Inner Crater was occurring in late 1995, although the lava lake remained fairly constant in size at ~20 m diameter and generally in the same location. No significant eruptions have occurred from the lava lake over the last 5 years and no bombs have been observed on the crater rim. Magma composition has shown no change over the last 20 years. A recent volume of 12 papers (Kyle, 1994) summarizes some aspects of the volcanic activity and environmental effects of Erebus through the 1980's and early 1990's.
Passive degassing from the lake contributes a small plume and the SO2 content has usually been monitored in December by COSPEC (see Kyle and others, 1994 for COSPEC data up to 1991). Since 1991 the SO2 emissions have ranged between 40 and 70 Mg/day (megagrams/day is the SI unit equivalent to metric tons/day); bad weather limited measurements in December 1995. FTIR (Fourier Transform Infrared) open-field spectrometry measurements in December confirmed the HCl/SO2 ratio of the emitted gases to be in agreement with measurements made by impregnated filters over the last 8 years. However, high CO levels significantly exceeded those of both HCl and SO2. Although CO2 in the plume has not been measured it is assumed to be high due to the alkalic nature of the magma. The high CO may be a function of the presumed high CO2 concentrations in the magma and its fairly low oxygen fugacity.
A network of eight seismic stations are operated as part of the Erebus Volcano Observatory by the New Mexico Institute of Mining and Technology. Seven stations have 1-Hz vertical single-component instruments, and the eighth is a 1-Hz three-component station. The stations have radio telemetry links to McMurdo Station where a digital event detection system and several analog helirecorders record the data, which are automatically transferred daily via the Internet to New Mexico for analysis and archiving. Details about the seismic network and associated seismicity can be accessed on the WWW Erebus page (see below).
Magmatic eruptive activity has been continuous since the discovery of a anorthoclase phonolite lava lake in 1972 (Giggenbach and others, 1973). Activity has been relatively uniform over the last 15 years with the exception of two significant events. In 1984 there was a 3-4 month period of larger and more frequent Strombolian eruptions which ejected bombs >2 km from the summit crater. On 19 October 1993 two moderate phreatic eruptions blasted a new crater ~80 m in diameter on the Main Crater floor and ejected debris over the northern Main Crater rim. These are the first known phreatic eruptions at Erebus, and probably resulted from steam build-up associated with melting snow in the crater.
References. Giggenbach, W.F., Kyle, P.R., and Lyons, G., 1973, Present volcanic activity on Erebus, Ross Island, Antarctica: Geology, v. 1, p. 135-136.
Kyle, P.R., Sybeldon, L.M., McIntosh, W.C., Meeker, K., and Symonds, R., 1994, Sulfur dioxide emissions rates from Mount Erebus, Antarctica, in Kyle (1994), p. 69-82.
Kyle, P.R., ed., 1994, Volcanological and Environmental Studies of Erebus, Antarctica: Antarctic Research Series, American Geophysical Union, v. 66.
Information Contacts: Philip R. Kyle, Dept. of Earth and Environmental Sciences, New Mexico Institute of Mining and Technology, Socorro, NM 87801 USA.
Large eruptions stop in June 2006
The Mt. Erebus Volcano Observatory (MEVO) website contains a graph showing activity measured at the volcano since 1992 (figure 10). The most substantial peaks in the number of eruptions recorded appeared in 1995, 1997, 1998, 2000, and a broad peak beginning in late 2005 that continued into late 2006. It is important to note that the graph reports events of all sizes, including periods of extremely frequent and small (
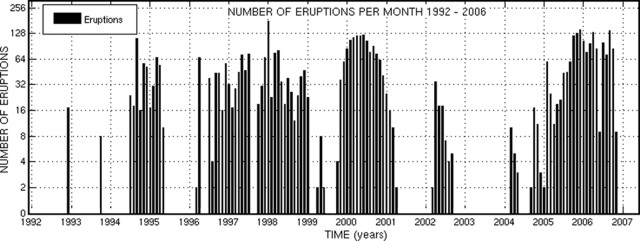 |
Figure 10. Collective vent and lava lake eruptions per month from January 1992 to September 2006 at Erebus (plotted on a vertical log scale). Note that significant incompleteness may exist due to variable reporting criteria and/or instrumentation outages. Quantitative assessment of eruption sizes using infrasonic recordings started in 2006. Courtesy of MEVO web site ("Current Erebus Activity Plot"). |
The older records are based on interpretation of short-period seismographs, and many of the events could have been icequakes (seismic events related to the stick and slip nature of glacial ice movement) and not eruptions. In recent years the use of a video camera, infrasound, and broadband seismic records have allowed better recognition of eruptions. Because of extreme weather, the seismic network is subject to power loss during the darkness of winter.
The MEVO activity log gives information on each eruption measured and shows daily activity that usually includes several eruptions. Erebus eruption sizes are based on the infrasonic overpressure at Station E1S.IS1, measured in pascals (Pa) (see references articles on infrasound measurements). This eruption index scale is divided into small (0-19), medium (20-39), large (40-59), and very large (>=60) events. Although the total number of eruptions remained high during most months of 2006, large or very large events were rarely recorded after 1 June (table 1). The largest event had an index of 116.6 on 26 February.
Table 1. Large and very large eruptions recorded at Erebus, January-November 2006. Data courtesy of MEVO.
| Month | Large Eruptions | Very Large Eruptions |
| Jan 2006 | 22 | 0 |
| Feb 2006 | 18 | 5 |
| Mar 2006 | 13 | 7 |
| Apr 2006 | 11 | 9 |
| May 2006 | 12 | 3 |
| Jun 2006 | 1 | 0 |
| Jul 2006 | 0 | 0 |
| Aug 2006 | 0 | 1 |
| Sep 2006 | 1 | 0 |
| Oct 2006 | 1 | 0 |
| Nov 2006 | 0 | 0 |
General References. Wilson, C.R., J.V. Olson, D.L. Oborne, and A. Le Pichon, 2003 (December), Infrasound from Erebus Volcano at 155US in Antarctica, Inframatics-The Newsletter of Subaudible Sound, no. 04, p.1-8.
Johnson, J.B., and Aster, R.C., 2005, Relative partitioning of acoustic and seismic energy during Strombolian eruptions: Journal of Volcanology and Geothermal Research, v. 148, p. 334-354.
Johnson, J.B., Aster, R.C., and Kyle, P.R., 2004, Volcanic eruptions observed with infrasound: Geophysics Research Letters, v. 31, no. L14604, 4 p.
Johnson, J.B., Aster, R.C., Ruiz, M.C., Malone, S.D., McChesney, P.J., Lee, J.M., and Kyle, P.R., 2003, Interpretation and utility of infrasonic records from erupting volcanoes: Journal of Volcanology and Geothermal Research, v. 121, p. 15-63.
Information Contacts: Philip R. Kyle and Kyle Jones, Mt. Erebus Volcano Observatory, New Mexico Institute of Mining and Technology, Socorro, NM 87801, USA (URL: https://nmtearth.com/); Hawai'i Institute of Geophysics and Planetology (HIGP) MODIS Thermal Alerts, School of Ocean and Earth Science and Technology (SOEST), Univ of Hawai'i, 2525 Correa Road, Honolulu, HI 96822, USA (URL: http://modis.higp.hawaii.edu/).
Significant eruptions tabulated for 2007
The Mt. Erebus Volcano Observatory (MEVO) website activity log gives information on each eruption of the volcano detected. Daily activity that usually includes several eruptions. Erebus eruption sizes are measured in the pressure unit of Pascals (Pa) from the infrasonic overpressure (at Station E1S.IS1). The eruption size index scale is divided into events classified as small (0-19 Pa), medium (20-39 Pa), large (40-59 Pa), and very large (>= 60 Pa).
Table 2 lists large and very large eruptions for the period December 2006 through 23 October 2007 (BGVN 31:12 gave a similar list for the year 2006 through November). The absence of recorded eruptions from 13 April 2007 to 29 August 2007 is notable. No eruptions were reported on the website during 23 October 2007 to 29 April 2008.
Table 2. Eruptions recorded at Erebus in the instrumentally derived categories "large" and "very large" during December 2006-23 October 2007. Courtesy of MEVO.
| Month | Large Eruptions | Very Large Eruptions |
| Dec 2006 | 2 | 0 |
| Jan 2007 | 29 | 24 |
| Feb 2007 | 8 | 39 |
| Mar 2007 | 7 | 11 |
| Apr 2007 | 2 | 7 |
| May 2007 | 0 | 0 |
| Jun 2007 | 0 | 0 |
| Jul 2007 | 0 | 0 |
| Aug 2007 | 0 | 1 |
| Sep 2007 | 0 | 2 |
| Oct 2007 | 1 | 1 |
Thermal anomalies over Erebus, measured from the MODIS (Moderate Resolution Imaging Spectroradiometer) satellite images were analyzed by the Hawai'i Institute of Geophysics and Planetology (HIGP) MODVOLC algorithm. They commonly appeared throughout the 2007 due to the presence of a molten lava lake within the crater.
Information Contacts: Philip R. Kyle and Kyle Jones, Mt. Erebus Volcano Observatory (MEVO), New Mexico Institute of Mining and Technology, Socorro, NM 87801, USA (URL: https://nmtearth.com/); Hawai'i Institute of Geophysics and Planetology (HIGP) MODIS Thermal Alerts, School of Ocean and Earth Science and Technology (SOEST), Univ of Hawai'i, 2525 Correa Road, Honolulu, HI 96822, USA (URL: http://modis.higp.hawaii.edu/).
Lava lake convects and spews spatter and gases in December 2010
This report includes first-hand observations of Erebus's crater, which includes the persistent Ray lava lake, a body that remained molten, though considerably crusted over, in December 2010. Several recent studies on Erebus presented maps and gas emissions measured by open-path FTIR spectroscopy in December 2004. Our last report on Erebus covered ongoing lava lake activity through October 2007 (BGVN 33:03). MODVOLC thermal alerts occurred during 2007 and continued at least into late 2011. Mt. Erebus is located on the western half of Ross Island (figure 11).
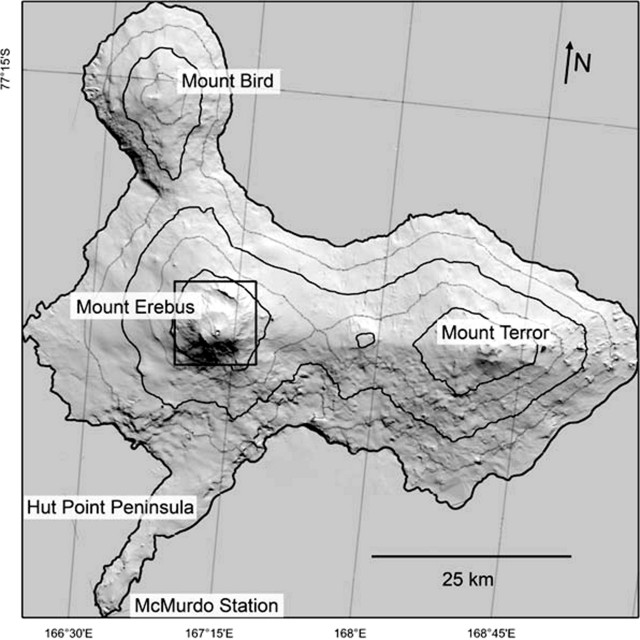 |
Figure 11. Shaded relief map of Ross Island showing Erebus, created from a digital elevation map. Taken from Csatho and others (2008). |
December 2010 observations. Csatho and others (2008) used laser scanning (LIDAR) acquired from aircraft in 2001 to study the morphology of the Erebus summit area (figure 12). The crater contains the persistent and convecting Ray lava lake. A second lava lake is occasionally active in the Werner vent (Werner lava lake). The authors noted the elevation of the surfaces of the inner crater's two lava lakes, both at ~3,515 m, was about the same as another active vent in the crater. Ray lava lake (~750 m2), which was discovered in 1972, sits in the inner crater's NE sector, and is larger than Werner lava lake (~166 m2).
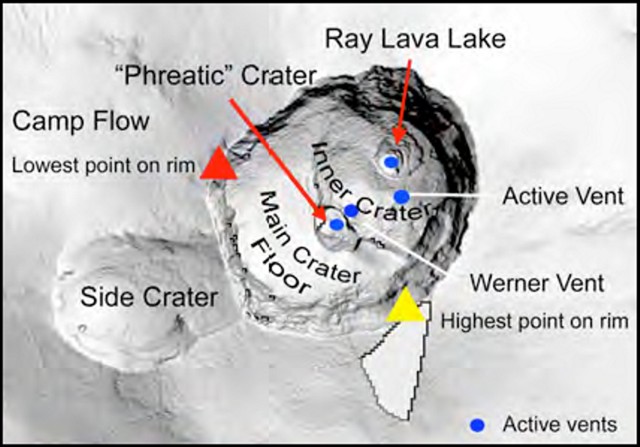 |
Figure 12. Morphology of the summit crater of Erebus compiled from laser imagery (ALS-LIDAR) acquired 30 December 2001. Taken from Csatho and others (2008). |
Kayla Iacovino posted a blog on 15 December 2010 about then-recent conditions on the summit of Erebus (Iacovino, 2011). She noted that the weather for the past few days was unusually clear (figure 13). In addition, she presented a shot of a churning lava lake (by Clive Oppenheimer) which was somewhat obscured by steam over the lake. Iacovino noted that during her 2010 visit, only Ray lava lake was active. It had shrunk in size (some of it had crusted over) since December 2009. She commented that "There were a lot of bursts of activity in the lake, including some bomb-throwing eruptions (although no bombs made it out of the crater) and a couple of very active fumaroles on the lava lake's perimeter. The plume was essentially constant."
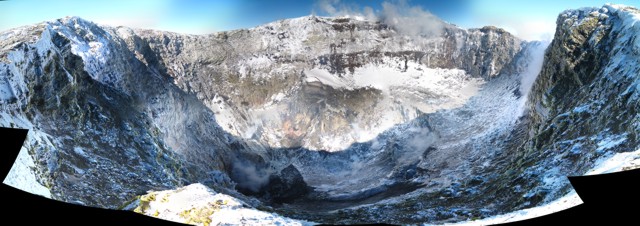 |
Figure 13. A December 2010 photo composite showing the inner crater at Erebus. The Ray lava lake lies to the left side of the crater floor. Courtesy of Laura Jones (New Mexico Tech; posted online at Iacovino, 2010). |
Oppenheimer provided two other views during the same December 2010 field season. One shows the crater, and the other, the active lava lake, large portions of which were covered by crust (figures 14 and 15).
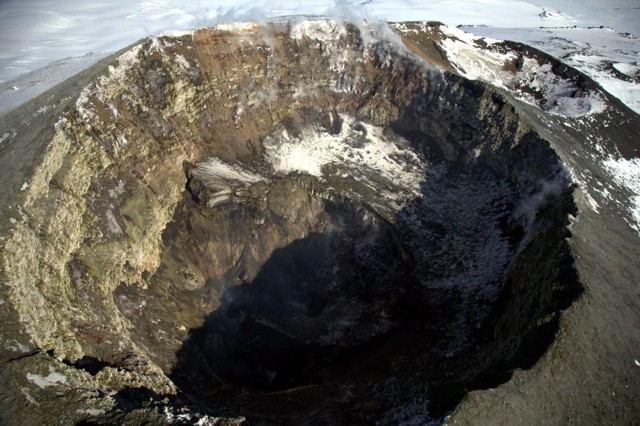 |
Figure 14. An aerial photo of Erebus taken from a helicopter looking at the main crater and its inner crater from an oblique angle. Courtesy of Clive Oppenheimer. |
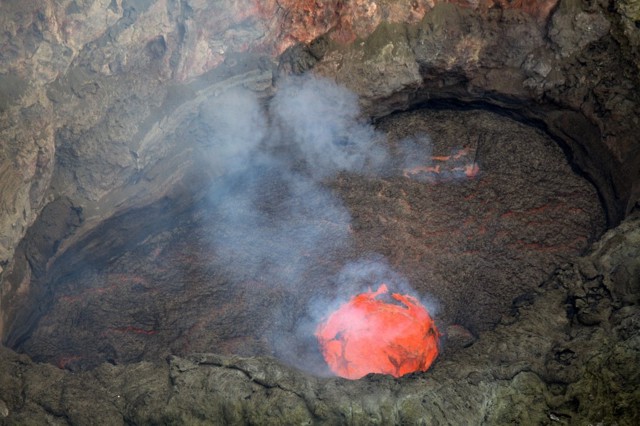 |
Figure 15. A photo of the floor and portions of the confining walls of the Ray lava lake, which contained a bright orange-red circular area with exposed molten material at the surface. As seen here, the exposed molten material discharged ample spatter and gases. Note the network of glowing cracks bounding and crossing the chilled darker portions of the lava lake. Courtesy of Clive Oppenheimer. |
2004 gas measurements. A study of the gas emissions conducted in December 2004 (Oppenheimer and Kyle, 2008) concluded with the statements below.
"We measured the emissions of seven gas species from Werner and Ray lava lakes at Erebus volcano by open-path FTIR spectroscopy. The results are among the few available for a highly alkalic magmatic system. Compared to typical subduction zone related volcanoes, Erebus gas is CO2-rich (consistent with abundant CO2 in olivine hosted melt inclusions sampled from Erebus basanite), and the CO2/CO ratio is lower (and perfectly consistent with the oxygen fugacity of Erebus phonolite estimated from the composition of component minerals). Combination of the measured gas proportions with the estimated SO2 flux carried by the plume provides estimates of the fluxes of all the other species. This yields the first measurements of the fluxes of H2O (~860 Mg per day) and carbonyl sulfide (~0.5 Mg per day). By mass, CO2 is the major component of the plume, and the estimated CO2 flux is ~1,300 Mg per day....
"The H2O/CO2 ratio and HF content of the individual plumes emitted by the two lava lakes are distinct, and point to a more 'evolved' gas released from Werner lake. This could indicate that the Werner lake is fed by a shallow offshoot of the conduit that supplies the Ray lake, or that magma feeding Werner lake is more comprehensively degassed due to a higher degree of crystallization....
References. Oppenheimer, C., Kyle, P.R., 2008, Probing the magma plumbing of Erebus volcano, Antarctica, by open-path FTIR spectroscopy of gas emissions, Journal of Volcanology and Geothermal Research, v. 177, p. 743-754.
Csatho, B., Schenk, T., Kyle, P., Wilson, T. and Krabill, W. B., 2008, Airborne laser swath mapping of the summit of Erebus volcano, Antarctica: Applications to geological mapping of a volcano, Journal of Volcanology and Geothermal Research, v. 177, no. 3, 531-548.
Iacovino, K., 2010, A view from the top: great weather on Erebus, Science Friday, posted 15 December 2010; accessed 24 October 2011.(URL: http://www.sciencefriday.com/blog/2010/12/a-view-from-the-top-great-weather-on-erebus/
Information Contacts: Kayla Iacovino and Clive Oppenheimer, Cambridge University, Department of Geography, Downing Place, Cambridge, CB2 3EN, UK; Laura K. Jones, Department of Earth and Environmental Science, New Mexico Tech, Socorro, NM 87801, USA; Hawai'i Institute of Geophysics and Planetology (HIGP) MODVOLC Thermal Alerts System, School of Ocean and Earth Science and Technology (SOEST), Univ of Hawai'i, 2525 Correa Road, Honolulu, HI 96822, USA (URL: http://modis.higp.hawaii.edu/).
Phonolitic lava lakes remain active during 2011-2016
The existence of an anorthoclase phonolite lava lake in the summit crater of Mount Erebus was first reported in 1972, and it has been thought to be continuously active since that time. Antarctica's best known volcano is located on Ross Island, 90 km E of the continent, offshore of the Scott Coast. McMurdo station, run by the United States Antarctic Program, is about 40 km S on the tip of Ross Island (figure 16). During the history of observations, lava lake(s) have generally persisted, although changes in size and shape over time reflect variations in volcanic activity.
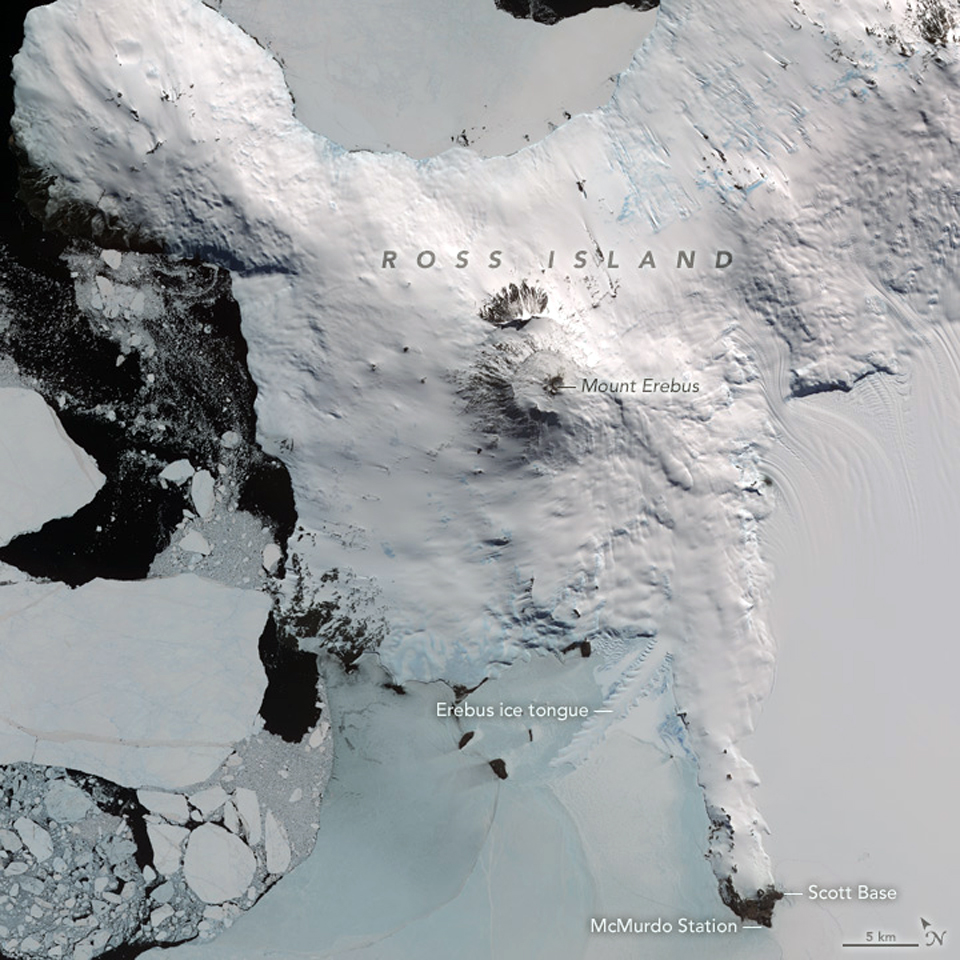 |
Figure 16. On 31 December 2013, the Advanced Spaceborne Thermal Emission and Reflection Radiometer (ASTER) on NASA's Terra satellite acquired visible near-infrared images of the western end of Ross Island in austral mid-summer. McMurdo Station is about 40 km S of the summit of Mount Erebus. Courtesy of NASA Earth Observatory. |
This report briefly summarizes research activity at Mount Erebus, and volcanic activity observed since 1972. Photographs from expeditions between 2010 and 2016 show more recent activity at the volcano. Observations from MODVOLC data collected from 2000 through 2016 are also discussed.
Summary of research activity. For most years since the 1970's, scientists have visited Erebus during the austral summer (November-February) and gathered samples, taken SO2 and other geochemical measurements, collected GPS data, and made observations and overflights to evaluate the condition of the volcano.
Seismometers were initially installed by a joint project of United States, New Zealand, and Japanese scientists in 1980-1981. Between 1980 and 2016 as many as 10 seismic stations were recording activity at Erebus; they were monitored by the Mount Erebus Volcano Observatory (MEVO) run by the New Mexico Institute of Mining and Technology (New Mexico Tech). During the early 2000s MEVO also used infrasonic recordings to capture data on the frequency of eruptions. Researchers from New Mexico Tech, the University of Cambridge, and University College London made yearly expeditions there between 2003 and 2016.
The Mount Erebus Volcano Observatory closed in 2016. A final report was submitted to the National Science Foundation (NSF) on the past research and ideas for future research (Mattioli and LaFemina, 2016), and includes a comprehensive list of scientific publications about Erebus. One area of ongoing volcanology research relates to studying the behavior of the lava lake with a variety of on-site monitoring equipment (figure 17).
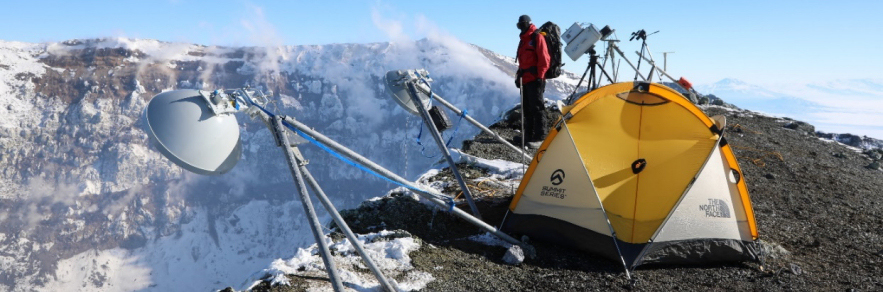 |
Figure 17. Radar altimeter installed at the crater rim of Erebus in December 2016. There are two dishes, to both transmit and receive data. Several other devices are seen in the background, all trained on the lava lake on the floor of the crater. Courtesy of the University of Cambridge Department of Geography. |
Summary of activity, 1972-2009. During the 1970's, the lava lake was observed to be about 130 m long and oval shaped, producing occasional Strombolian explosions. Bombs up to 10 m in in diameter were ejected near the vent, and ones up to 30 cm in diameter were thrown out over the main crater. Oscillations of the lake level of up to 2 m were observed.
During a period of increased activity between September 1984 and January 1985, several large explosions were recorded by the seismic network, and there were reports of mushroom-shaped clouds rising as much as 2 km above the summit. During September 1984, numerous large explosions sent ejecta as high as 600 m above the summit, and incandescence was visible from 70 km away. Ash also covered the NW flank down to 3,400 m elevation. Observations in October 1984 indicated that much of the lava lake had solidified, and that the surface was covered with ejecta from the recent explosions. Seismicity remained above average through January 1985. During this period of increased activity, bombs averaging 2 m in diameter (but some as large as 10 m in diameter) were ejected up to 1.2 km from within the inner crater. The eruptions were witnessed from 60 km away and explosions could be heard up to 2 km from the volcano (SEAN 11:03). A small lava lake about 15 m in diameter reappeared late in 1985.
Two primary lakes of phonolitic lava, and a third transient lake, were present inside the crater during the late 1980s (see figure 9, SEAN 13:02), and infrequent Strombolian eruptions with small bombs were captured by a remote video camera mounted on the crater rim. Small ash eruptions were observed from an active vent near the lava lakes in January 1991. On 19 October 1993, two moderate phreatic eruptions created a new crater ~80 m in diameter on the main crater floor and ejected debris over the northern crater rim. These were the first known phreatic eruptions at Erebus, and probably resulted from steam build-up associated with melting snow in the crater (BGVN 20:11).
Vent and lava lake eruptions were recorded by MEVO during the late 1990s and early 2000s. The largest peaks in terms of numbers of eruptions were during 1995, 1997, 1998, 2000, and a broad peak beginning in late 2005 that continued into late 2006 (BGVN 31:12).
Activity during 2010-2016. The two primary lava lakes remained active at Erebus. The one in the NE sector of the inner crater has been persistent almost continuously since first reported in 1972. The second lake is more in the center of the main crater and is intermittently active. During a visit in 2010, only the NE sector lake was active (BGVN 36:09). During clear weather, a steady steam plume is often observed (figure 18).
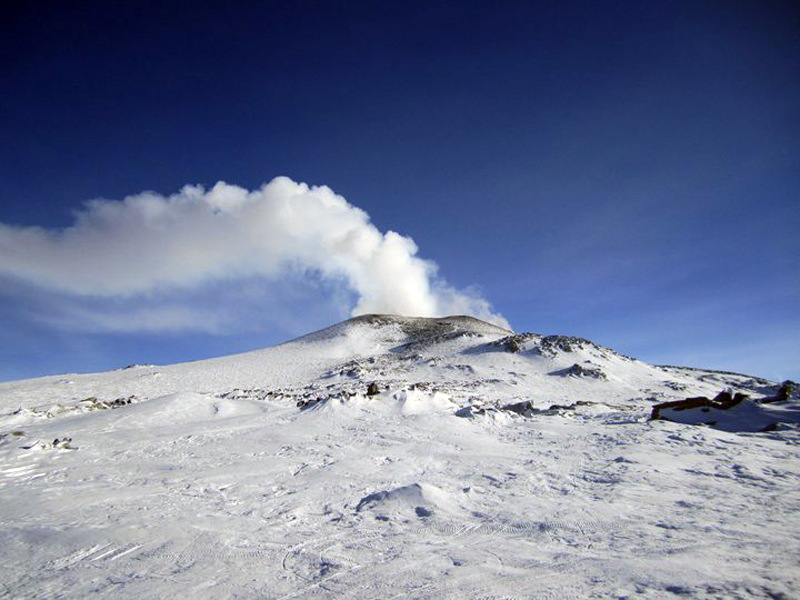 |
Figure 18. Mount Erebus with a steam plume rising from the summit crater, viewed from the Lower Erebus Hut (LEH), 6 December 2010. Courtesy of Mount Erebus Volcano Observatory. |
Visits during 2011-2016 have confirmed the ongoing Strombolian activity and convection at the lava lakes nearly every year. During 2011 the glowing lava lake emitted steam and magmatic gases from the bottom of a vent at the main crater (figure 19). An eruption on 2 January 2012 at the lava lake was captured by the remote video cameras managed by MEVO (figure 20). Several bombs were ejected on 18 December 2013 and landed close to monitoring equipment run by MEVO. Researchers were able to open a hot bomb and see the molten interior (figure 21).
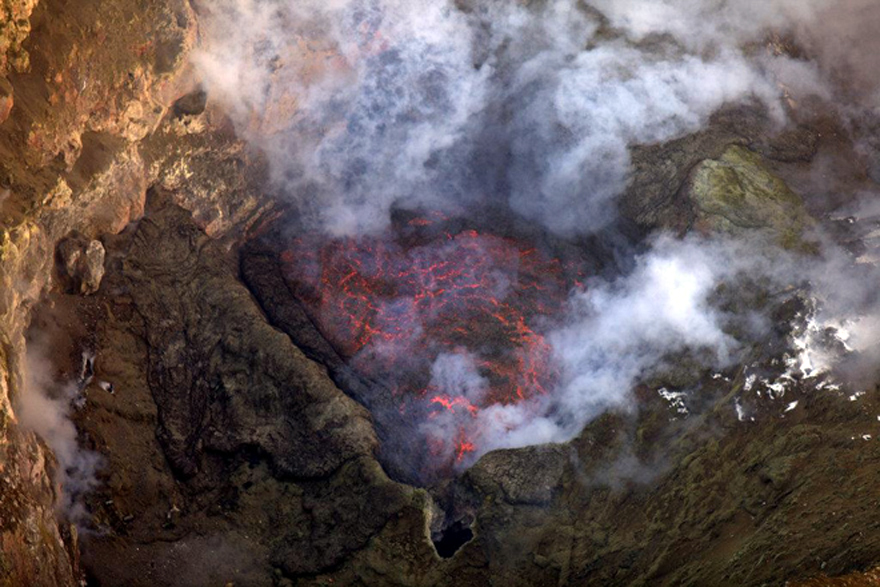 |
Figure 19. The lava lake at Erebus, photographed in December 2011. Image by Clive Oppenheimer/Volcanofiles; courtesy of Erik Klemetti. |
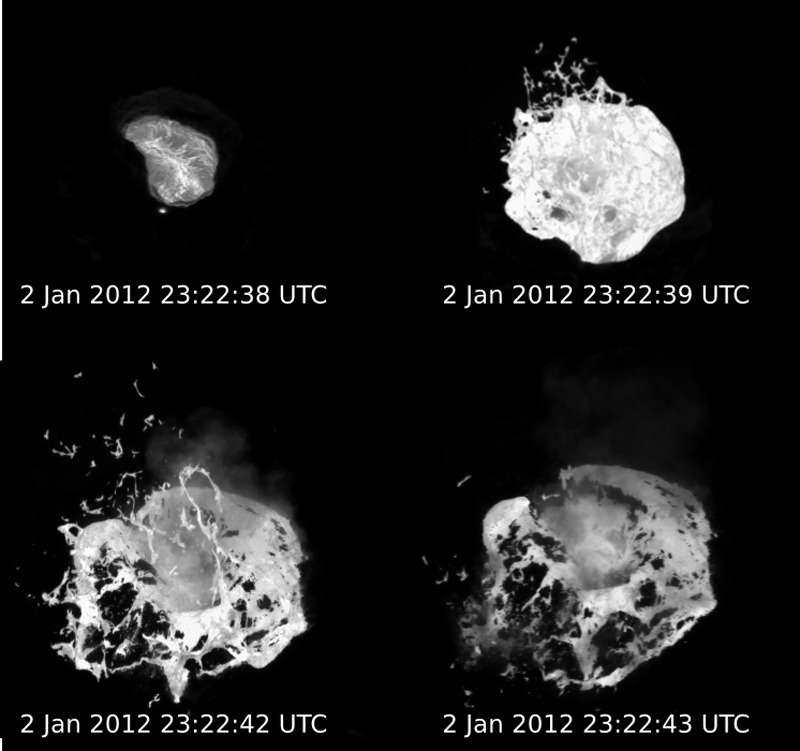 |
Figure 20. An eruption from the lava lake at Erebus, captured on the MEVO video cameras on 2 January 2012. Courtesy of MEVO and Volcano Discovery. |
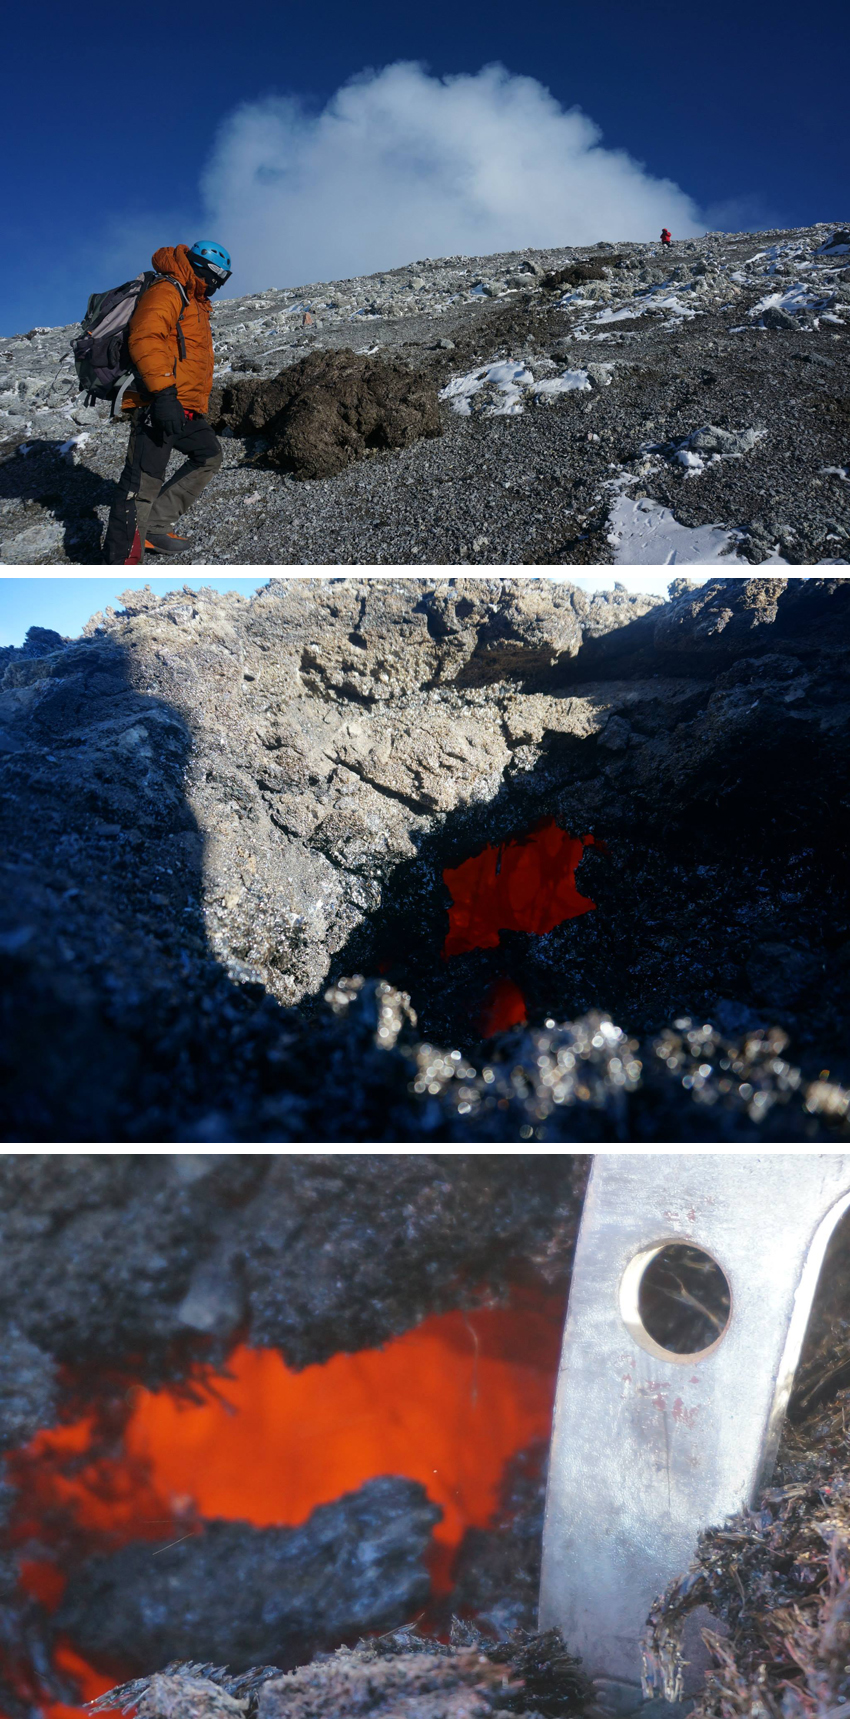 |
Figure 21. Several bombs erupted from Erebus on 18 December 2013 and landed close to monitoring equipment run by MEVO. Researchers were able to open a hot bomb and see the molten interior. Images courtesy of Aaron Curtis, MEVO, 18 December 2013 (posted on Facebook). |
When UNAVCO (a non-profit university-governed consortium) flew over Erebus in December 2015, steam and magmatic gas plumes indicated that both lava lakes were active (figure 22). The two incandescent crater vents at were observed in greater detail during January 2016 by researchers associated with the University of Cambridge (figure 23).
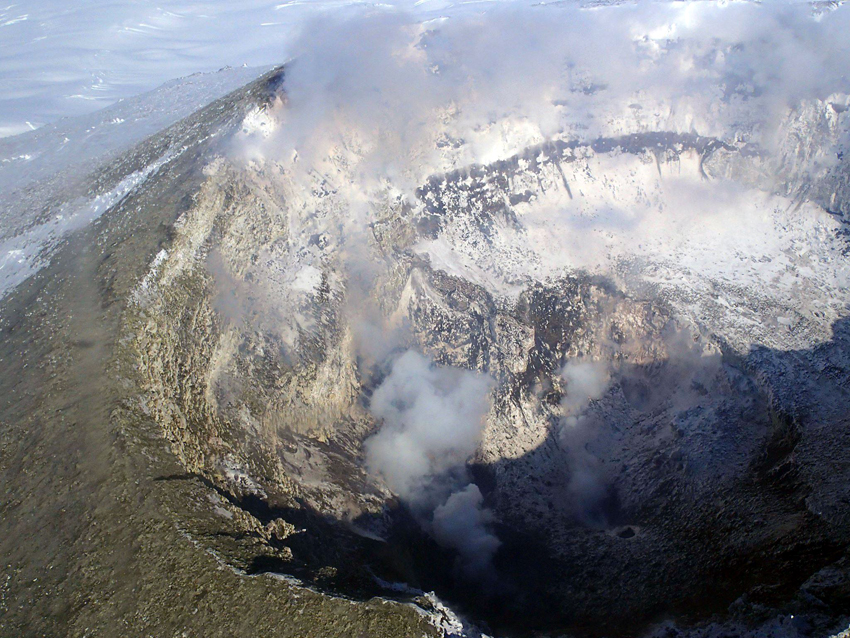 |
Figure 22. The crater of Erebus, with active steam plumes from two lava lakes on 7 December 2015, photographed during an overflight by UNAVCO (a non-profit university-governed consortium). Photo by Annie Zaino, UNAVCO (posted on Facebook). |
 |
Figure 23. Two lava lakes at Erebus were observed on 14 January 2016 by researchers associated with the University of Cambridge. Lower image is a close-up of the right vent in the upper image. Courtesy of Kayla Iacovino and Tehnuka Ilanko (posted on Facebook). |
MODVOLC data, 2000-2016. With the remoteness of Erebus, satellite imagery serves as one of the few year-round tools currently available to assess longer-term activity. The University of Hawaii's MODVOLC thermal alert system has been processing MODIS infrared satellite data since 2000. Mount Erebus has had a strong and nearly continuous MODVOLC signature throughout 2000-2016 (table 3), confirming its ongoing eruptive activity.
Table 3. Number of MODVOLC thermal alert pixels recorded per month from 1 January 2000 to 31 December 2016 by the University of Hawaii's thermal alert system for Erebus. Table compiled by GVP from data provided by MODVOLC. Spurious data from 25 October 2014 was omitted.
| Year | Jan | Feb | Mar | Apr | May | Jun | Jul | Aug | Sep | Oct | Nov | Dec | SUM |
| 2000 | 0 | 6 | 16 | 3 | 10 | 7 | 8 | 12 | 7 | 4 | 1 | 0 | 74 |
| 2001 | 2 | 16 | 90 | 70 | 78 | 24 | 70 | 71 | 57 | 30 | 1 | 5 | 514 |
| 2002 | 1 | 19 | 53 | 71 | 96 | 133 | 148 | 122 | 188 | 62 | 28 | 28 | 949 |
| 2003 | 19 | 41 | 103 | 125 | 168 | 231 | 195 | 213 | 121 | 62 | 30 | 19 | 1327 |
| 2004 | 40 | 48 | 143 | 90 | 131 | 279 | 133 | 288 | 113 | 67 | 39 | 131 | 1502 |
| 2005 | 125 | 98 | 217 | 158 | 159 | 212 | 256 | 191 | 209 | 91 | 30 | 21 | 1767 |
| 2006 | 12 | 27 | 78 | 89 | 131 | 85 | 145 | 30 | 39 | 36 | 11 | 32 | 715 |
| 2007 | 18 | 42 | 142 | 268 | 243 | 178 | 184 | 199 | 118 | 98 | 10 | 33 | 1533 |
| 2008 | 91 | 116 | 199 | 267 | 286 | 180 | 269 | 458 | 149 | 148 | 95 | 141 | 2399 |
| 2009 | 86 | 114 | 386 | 162 | 436 | 270 | 341 | 208 | 253 | 116 | 76 | 66 | 2514 |
| 2010 | 53 | 58 | 207 | 132 | 185 | 154 | 89 | 100 | 142 | 62 | 10 | 2 | 1194 |
| 2011 | 3 | 23 | 81 | 112 | 36 | 1 | 1 | 0 | 4 | 25 | 0 | 0 | 286 |
| 2012 | 0 | 24 | 52 | 56 | 31 | 93 | 27 | 1 | 1 | 0 | 0 | 0 | 285 |
| 2013 | 0 | 1 | 11 | 11 | 11 | 20 | 56 | 85 | 28 | 19 | 0 | 1 | 243 |
| 2014 | 2 | 1 | 0 | 9 | 49 | 62 | 78 | 10 | 28 | 3 | 0 | 1 | 243 |
| 2015 | 1 | 17 | 14 | 4 | 15 | 2 | 7 | 12 | 2 | 3 | 0 | 0 | 77 |
| 2016 | 0 | 4 | 13 | 34 | 46 | 33 | 19 | 1 | 3 | 0 | 0 | 0 | 153 |
| SUM | 453 | 655 | 1805 | 1661 | 2111 | 1964 | 2026 | 2001 | 1462 | 826 | 331 | 480 |
The MODVOLC thermal alert data show that thermal activity at Erebus has waxed and waned several times during the 2000-2016 interval (figure 24). Activity was very low during 2000, but increased steadily through mid-2005 to more than 20 times as many annual thermal alert pixels since 2000. Activity dropped off substantially from late 2005 and remained low through early 2007, when another increase began that peaked at an even higher level (2514 pixels during 2009) in mid-2009. Another drop in activity occurred during 2010, and since 2011 there have been fewer than 300 pixels per year, with numbers below 200 for 2015 and 2016.
 |
Figure 24. The number of MODVOLC thermal alert pixels per year, colored by month, reported for Erebus from 2000 through 2016. Activity was very low during 2000, but increased steadily through mid-2005. Activity dropped off substantially from late 2005 through early 2007, when another increase began that peaked at an even higher level in mid-2009. Another drop in activity occurred during 2010, and since 2011, there have been fewer than 300 pixels per year. Data courtesy of MODVOLC. |
Another trend in the MODVOLC data is also apparent when the number of pixels are plotted by month, as opposed to year, for this time period (figure 25). From November through February, during the austral summer, the number of pixels per month never exceeds 150 (see table 3, highest value is 125). From March through October, during the Austral winter, the number of pixels recorded per month can be much higher (the highest value is 458). The average number of 'summer' pixels per month (November-February, 2000-2016) is 30. The average number of 'winter' pixels per month for the same period (March-October) is 108, more than three times greater.
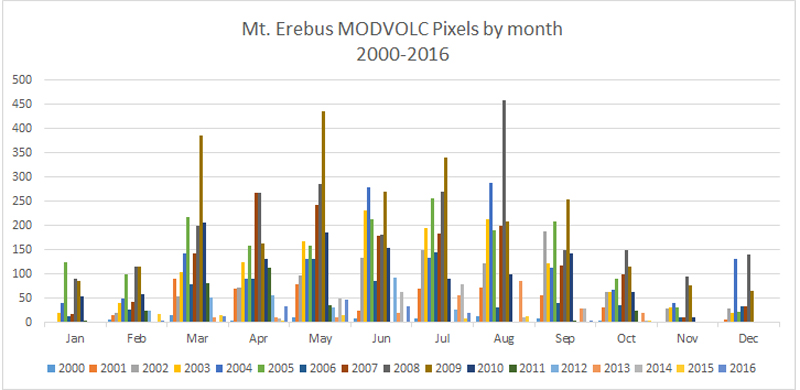 |
Figure 25. The number of MODVOLC thermal alert pixels per month for the period 2000-2016, colored by year. The total average number of pixels per month from 1 March through 31 October (1732) is three times the average total number of pixels per month from 1 November through 28 February (480). Data courtesy of MODVOLC. |
References: Mattioli, G.S., and LaFemina, P.C., 2016, Final Report submitted to the National Science Foundation, Community Workshop: "Scientific Drivers and Future of Mount Erebus Volcano Observatory (MEVO)" (URL: https://www.unavco.org/community/meetings-events/2016/mevo/2016-MEVO-Final-Report.pdf)
Information Contacts: Mt. Erebus Volcano Observatory (MEVO), New Mexico Institute of Mining and Technology, Socorro, NM 87801, USA; Hawai'i Institute of Geophysics and Planetology (HIGP), MODVOLC Thermal Alerts System, School of Ocean and Earth Science and Technology (SOEST), Univ. of Hawai'i, 2525 Correa Road, Honolulu, HI 96822, USA (URL: http://modis.higp.hawaii.edu/); The University of Cambridge Department of Geography (URL: http://www.geog.cam.ac.uk/research/projects/lavalakes/); Erik Klemetti, Eruptions Blog, Wired (URL: https://www.wired.com/author/erikvolc/); Tom Pfeiffer, Volcano Discovery (URL: http://www.volcanodiscovery.com/); UNAVCO, 6350 Nautilus Drive, Boulder, CO 80301-5394 (URL: http://www.unavco.org/); Kayla Iacovino and Tehnuka Ilanko, The Volcanofiles (URL: http://www.volcanofiles.com/).
Lava lakes persist through 2017 and 2018
Between the early 1980's through 2016, activity at Erebus was monitored by the Mount Erebus Volcano Observatory (MEVO), using seismometers, infrasonic recordings to measure eruption frequency, and annual scientific site visits. MEVO recorded occasional explosions propelling ash up to 2 km above the summit of this Antarctic volcano and the presence of two, sometimes three, lava lakes (figure 26). However, MEVO closed in 2016 (BGVN 42:06).
Activity at the lava lakes in the summit crater can be detected using MODIS infrared detectors aboard the Aqua and Terra satellites and analyzed using the MODVOLC algorithm. A compilation of thermal alert pixels during 2017-2018 (table 4, a continuation of data in the previous report) shows a wide range of detected activity, with a high of 182 alert pixels in April 2018. Although no MODVOLC anomalies were recorded in January 2017, detectors on the Sentinel-2 satellite imaged two active lava lakes on 25 January.
Table 4. Number of MODVOLC thermal alert pixels recorded per month from 1 January 2017 to 31 December 2018 for Erebus by the University of Hawaii's thermal alert system. Table compiled by GVP from data provided by MODVOLC.
| Year | Jan | Feb | Mar | Apr | May | Jun | Jul | Aug | Sep | Oct | Nov | Dec | SUM |
| 2017 | 0 | 21 | 9 | 0 | 0 | 1 | 11 | 61 | 76 | 52 | 0 | 3 | 234 |
| 2018 | 0 | 21 | 58 | 182 | 55 | 17 | 137 | 172 | 103 | 29 | 0 | 0 | 774 |
| SUM | 0 | 42 | 67 | 182 | 55 | 18 | 148 | 233 | 179 | 81 | 0 | 3 | 1008 |
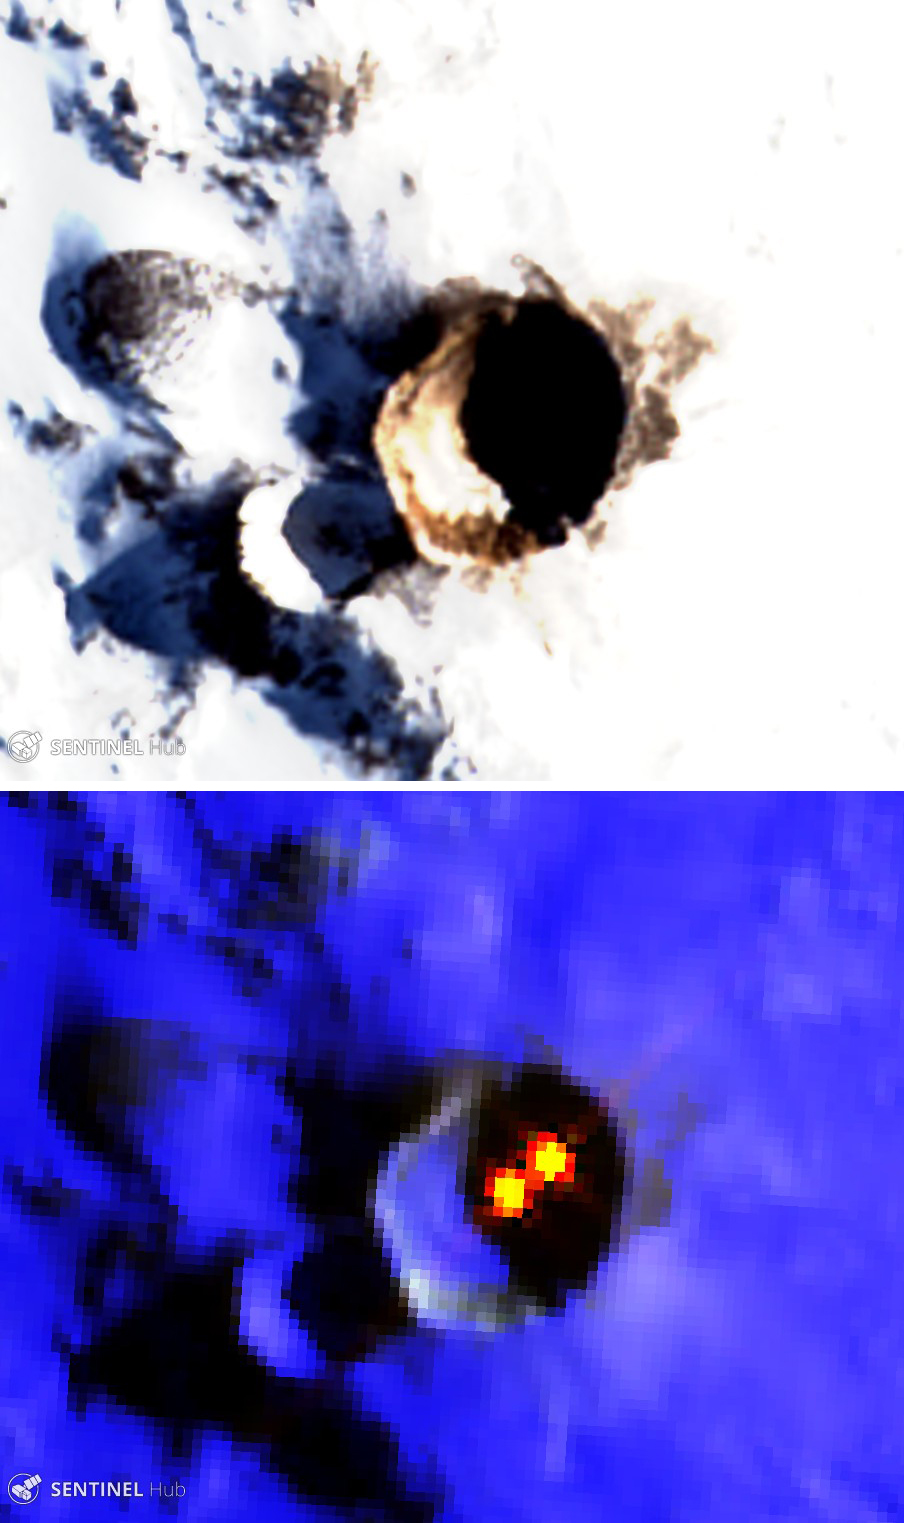 |
Figure 26. Sentinel-2 images of the summit crater area of Erebus on 25 January 2017. Top: Natural color filter (bands 4, 3, 2). Bottom: Atmospheric penetration filter (bands 12, 11, 8A) in which two distinct lava lakes can be observed. The main crater is 500 x 600 m wide. Courtesy of Sentinel Hub Playground. |
Information Contacts: Hawai'i Institute of Geophysics and Planetology (HIGP) - MODVOLC Thermal Alerts System, School of Ocean and Earth Science and Technology (SOEST), Univ. of Hawai'i, 2525 Correa Road, Honolulu, HI 96822, USA (URL: http://modis.higp.hawaii.edu/); Sentinel Hub Playground (URL: https://www.sentinel-hub.com/explore/sentinel-playground).
Lava lakes persist through 2019
Erebus, the world's southernmost historically active volcano, overlooks the McMurdo research station on Antarctica's Ross Island, 35 km SSW. Because of the remoteness of the volcano, activity is primarily monitored using satellites (figure 27), including MODIS infrared detectors aboard the Aqua and Terra satellites and analyzed using the MODVOLC algorithm.
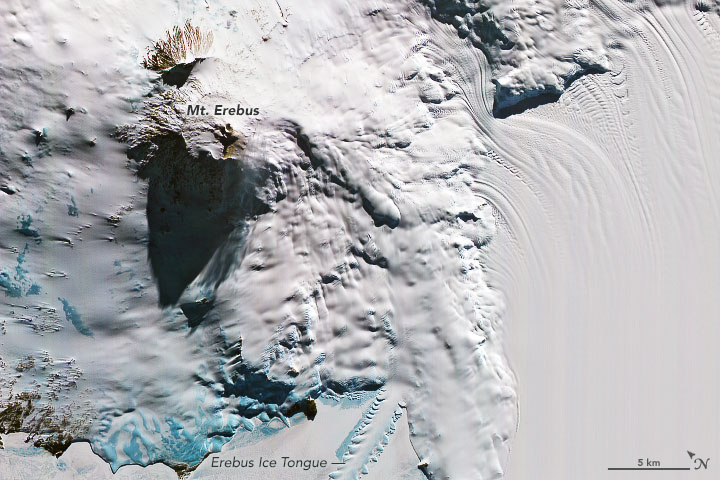 |
Figure 27. Satellite image of Erebus (on left) acquired on 19 October 2019 by the Advanced Spaceborne Thermal Emission and Reflection Radiometer (ASTER) on NASA's Terra satellite. The false-color combines visible and near-infrared wavelengths of light (ASTER bands 3, 2, 1). The area was just days away from constant 24-hour sunlight when this image was acquired, with the Sun angle low enough to cast a long shadow towards the west. The blue patches are areas clear of surface snow, exposing glacial ice. Nearby areas that appear smooth are the snow- and ice-topped waters of McMurdo Sound. Courtesy of NASA Earth Observatory: image by Joshua Stevens, using data from NASA/METI/AIST/Japan Space Systems and U.S./Japan ASTER Science Team; description by Kathryn Hansen. |
Available since 2000, MODIS-MODVOLC data have shown a strong and nearly continuous thermal signal through 2019. A compilation of thermal alert pixels during 2017-2019 (table 5, continuing the table in BGVN 44:01) shows a wide range of detected activity in 2019, with a high of 162 in April. Infrared satellite imagery from Sentinel-2 identified one or two lava lakes during January-March and September-December 2019; a few of the images showed gas emissions, possibly from melted snow (figure 28).
Table 5. Number of monthly MODVOLC thermal alert pixels recorded at Erebus from 1 January 2017 to 31 December. Table compiled using data provided by the Hawai'i Institute of Geophysics and Planetology (HIGP) - MODVOLC Thermal Alerts System.
| Year | Jan | Feb | Mar | Apr | May | Jun | Jul | Aug | Sep | Oct | Nov | Dec | SUM |
| 2017 | 0 | 21 | 9 | 0 | 0 | 1 | 11 | 61 | 76 | 52 | 0 | 3 | 234 |
| 2018 | 0 | 21 | 58 | 182 | 55 | 17 | 137 | 172 | 103 | 29 | 0 | 0 | 774 |
| 2019 | 2 | 21 | 162 | 151 | 55 | 56 | 75 | 53 | 29 | 19 | 1 | 0 | 624 |
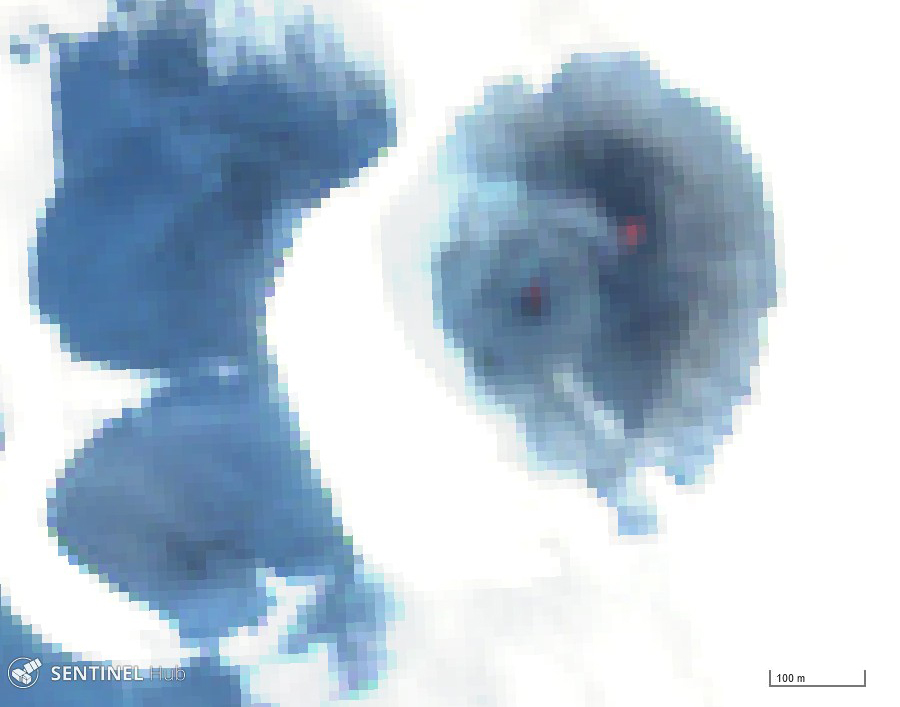 |
Figures 28. Sentinel-2 satellite image of Erebus in color infrared (bands 8, 4, 3) on 20 October 2019 showing two lava lakes in the summit crater. Courtesy of Sentinel Hub Playground. |
Information Contacts: Hawai'i Institute of Geophysics and Planetology (HIGP) - MODVOLC Thermal Alerts System, School of Ocean and Earth Science and Technology (SOEST), Univ. of Hawai'i, 2525 Correa Road, Honolulu, HI 96822, USA (URL: http://modis.higp.hawaii.edu/); Sentinel Hub Playground (URL: https://www.sentinel-hub.com/explore/sentinel-playground); NASA Earth Observatory, EOS Project Science Office, NASA Goddard Space Flight Center, Goddard, Maryland, USA (URL: http://earthobservatory.nasa.gov/).
Fewer thermal anomalies during 2020 compared to recent years
Erebus, located on Ross Island, Antarctica, and overlooking the McMurdo research station, is the southernmost active volcano in the world. The stratovolcano, which frequently has active lava lakes in its 250-m wide summit crater, is primarily monitored by satellite.
Thermal activity during 2020 was at lower levels than in recent years. The total number of thermal pixels, as recorded by MODIS thermal emission instruments aboard NASA’s Aqua and Terra satellites, was 76 (table 6), similar to low totals recorded in 2000 and 2015.
Table 6. Number of monthly MODIS-MODVOLC thermal alert pixels recorded at Erebus during 2017-2020. See BGVN 42:06 for data from 2000 through 2016. The table was compiled using data provided by the Hawai'i Institute of Geophysics and Planetology (HIGP) - MODVOLC Thermal Alerts System.
| Year | Jan | Feb | Mar | Apr | May | Jun | Jul | Aug | Sep | Oct | Nov | Dec | SUM |
| 2017 | 0 | 21 | 9 | 0 | 0 | 1 | 11 | 61 | 76 | 52 | 0 | 3 | 234 |
| 2018 | 0 | 21 | 58 | 182 | 55 | 17 | 137 | 172 | 103 | 29 | 0 | 0 | 774 |
| 2019 | 2 | 21 | 162 | 151 | 55 | 56 | 75 | 53 | 29 | 19 | 1 | 0 | 624 |
| 2020 | 0 | 2 | 16 | 18 | 4 | 4 | 1 | 3 | 18 | 3 | 1 | 6 | 76 |
Sentinel-2 satellite images showed two lava lakes, with one diminishing in size during the year (figure 29). Occasionally a gas plume could be observed. The volcano was frequently covered by atmospheric clouds on days when the satellite passed over.
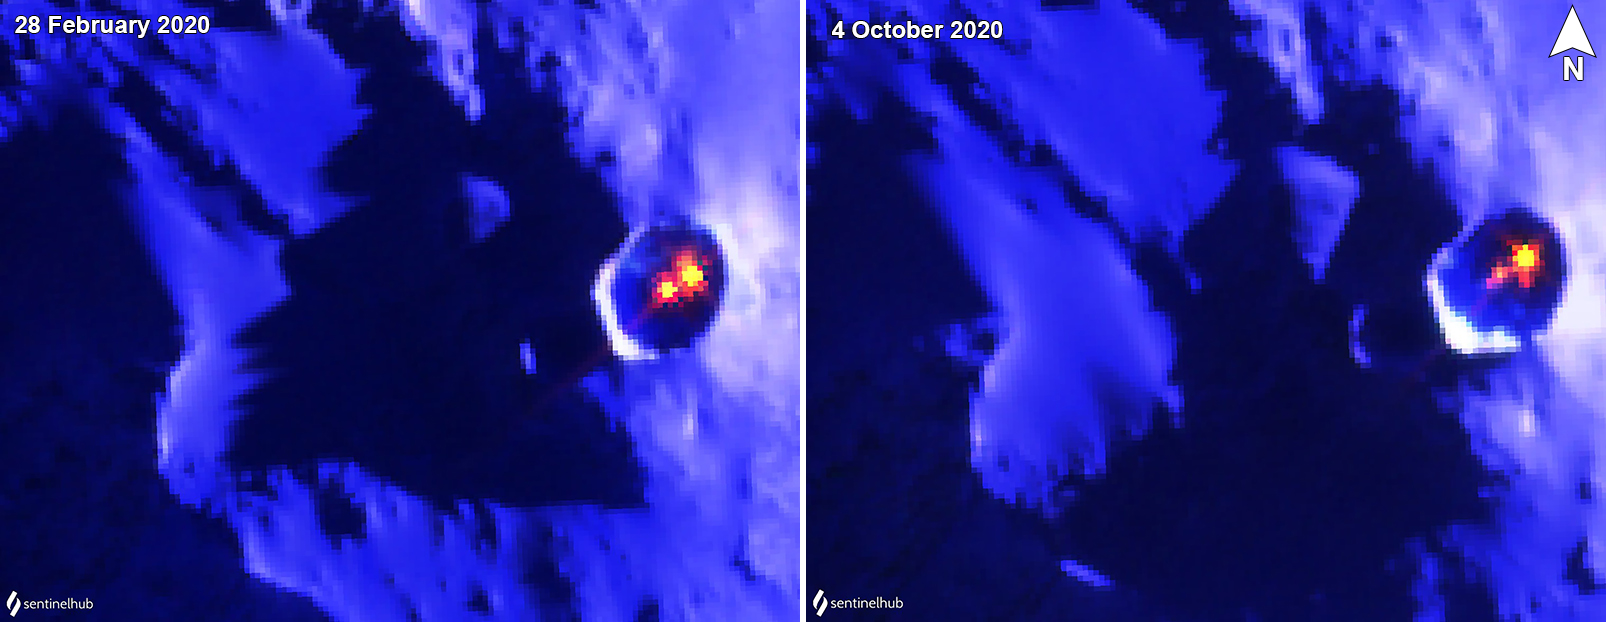 |
Figure 29. Infrared Sentinel-2 thermal images of the summit crater area of Erebus in 2020. Left: Image on 28 February 2020 showing two lava lakes in the summit crater. Right: Image on 4 October 2020 showing a single primary lake, with a much diminished second lake immediately SW. The main crater is 500 x 600 m wide. Both images are using the Atmospheric Penetration filter (bands 12, 11, 8A). Courtesy of Sentinel Hub Playground. |
Information Contacts: Hawai'i Institute of Geophysics and Planetology (HIGP) - MODVOLC Thermal Alerts System, School of Ocean and Earth Science and Technology (SOEST), Univ. of Hawai'i, 2525 Correa Road, Honolulu, HI 96822, USA (URL: http://modis.higp.hawaii.edu/); Sentinel Hub Playground (URL: https://www.sentinel-hub.com/explore/sentinel-playground).
Increased thermal activity during 2021 compared to 2020
Erebus, located on Ross Island, Antarctica, is one of the few volcanoes in the world with a persistent lava lake in its summit crater. Since 1972, and probably well before, minor explosions, punctuated by occasional larger Strombolian explosions, have been associated with the active lava lake. Since the Mt. Erebus Volcano Observatory suspended their seismic and infrasonic monitoring program in 2016, the volcano has been primarily monitored by satellite. This report documents activity during 2021.
Sentinel-2 satellite images during 2021 showed a single lava lake, except a much smaller second one on 30 October (figure 30). Occasionally, a white gas plume was visible. Based on MODIS infrared detectors aboard the Terra and Aqua satellites and analyzed using the MODVOLC algorithm, thermal activity during 2021 was much greater than the 2020 level (76) but much less than the 2018 and 2019 levels (774 and 624, respectively) (table 7).
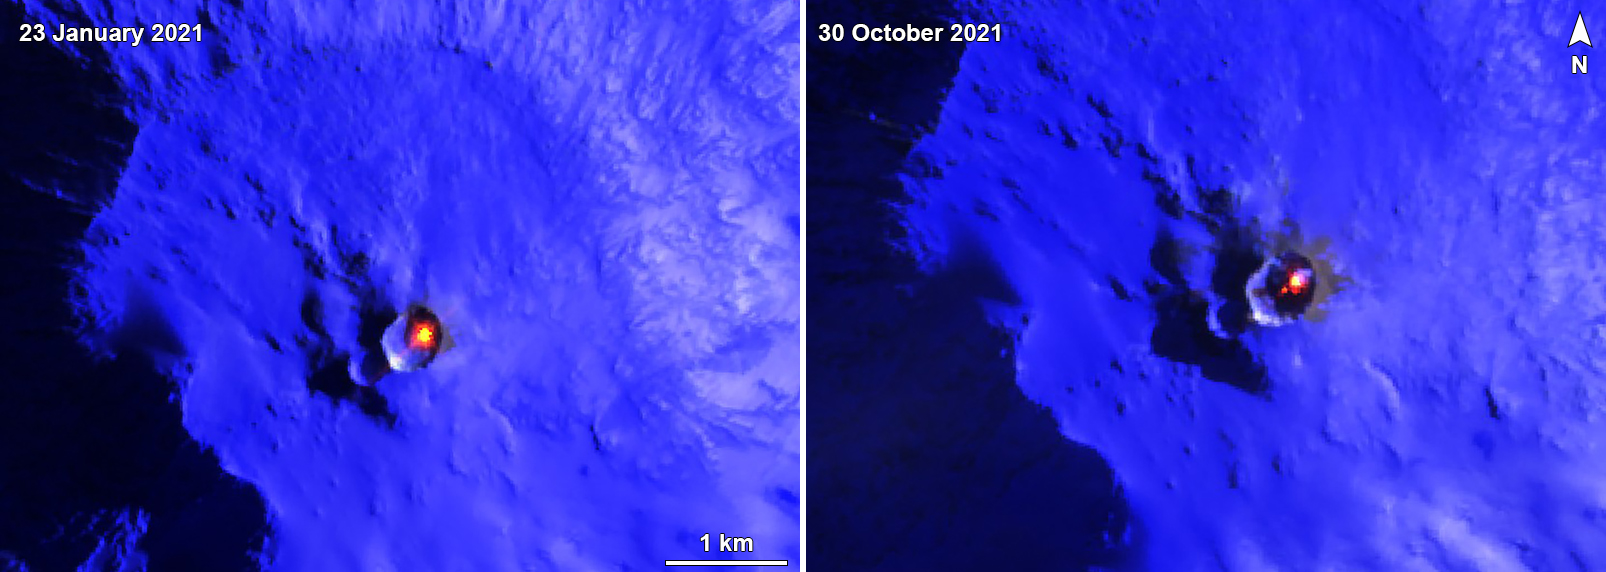 |
Figure 30. Sentinel-2 infrared satellite images showing the active lava lake in the summit crater of Erebus during 2021. The image on 23 January 2021 (left) shows a single lava lake, while the image on 30 October 2021 (right) shows a larger lake at least one smaller thermal area immediately SW. Images use False Color rendering (bands 12, 11, 4). Courtesy of Sentinel Hub Playground. |
Table 7. Number of monthly MODIS-MODVOLC thermal alert pixels recorded at Erebus during 2017-2021. See BGVN 42:06 for data from 2000 through 2016. The table was compiled using data provided by the HIGP - MODVOLC Thermal Alerts System.
| Year | Jan | Feb | Mar | Apr | May | Jun | Jul | Aug | Sep | Oct | Nov | Dec | SUM |
| 2017 | 0 | 21 | 9 | 0 | 0 | 1 | 11 | 61 | 76 | 52 | 0 | 3 | 234 |
| 2018 | 0 | 21 | 58 | 182 | 55 | 17 | 137 | 172 | 103 | 29 | 0 | 0 | 774 |
| 2019 | 2 | 21 | 162 | 151 | 55 | 56 | 75 | 53 | 29 | 19 | 1 | 0 | 624 |
| 2020 | 0 | 2 | 16 | 18 | 4 | 4 | 1 | 3 | 18 | 3 | 1 | 6 | 76 |
| 2021 | 0 | 9 | 1 | 0 | 2 | 56 | 46 | 47 | 35 | 52 | 5 | 3 | 256 |
Information Contacts: Hawai'i Institute of Geophysics and Planetology (HIGP) - MODVOLC Thermal Alerts System, School of Ocean and Earth Science and Technology (SOEST), Univ. of Hawai'i, 2525 Correa Road, Honolulu, HI 96822, USA (URL: http://modis.higp.hawaii.edu/); Sentinel Hub Playground (URL: https://www.sentinel-hub.com/explore/sentinel-playground).
Continuing lava lake; slightly decreased thermal activity recorded in 2022 compared to 2021
Erebus, Antarctica’s best known and world’s southernmost active volcano, overlooks the McMurdo research station on Ross Island. It has a lava lake in the summit crater that has been active since at least 1972. Because of the remote location, activity is primarily monitored by satellites. This report covers activity during 2022.
During 2022 the Sentinel-2 satellite only captured images of Erebus during 1 January-8 March and 27 September-26 December (figure 31). The images showed at least three distinct thermal sources within the summit crater. The HIGP MODVOLC Thermal Alerts System recorded more thermal activity during January-May, and lower activity during June-December compared to 2021 (table 8).
|
Figure 31. Sentinel-2 infrared satellite images showing the active lava lake in the summit crater of Erebus during 2022. The image on 17 February shows a single lava lake, while the image on 4 December shows a larger lake and at least two smaller thermal areas immediately SW. Images use Atmospheric Penetration rendering (bands 12, 11, 8A). Courtesy of Sentinel Hub Playground. |
Table 8. Number of monthly MODIS-MODVOLC thermal alert pixels recorded at Erebus during 2017-2022. See BGVN 42:06 for data from 2000 through 2016. The table was compiled using data provided by the HIGP – MODVOLC Thermal Alerts System.
| Year | Jan | Feb | Mar | Apr | May | Jun | Jul | Aug | Sep | Oct | Nov | Dec | SUM |
| 2017 | 0 | 21 | 9 | 0 | 0 | 1 | 11 | 61 | 76 | 52 | 0 | 3 | 234 |
| 2018 | 0 | 21 | 58 | 182 | 55 | 17 | 137 | 172 | 103 | 29 | 0 | 0 | 774 |
| 2019 | 2 | 21 | 162 | 151 | 55 | 56 | 75 | 53 | 29 | 19 | 1 | 0 | 624 |
| 2020 | 0 | 2 | 16 | 18 | 4 | 4 | 1 | 3 | 18 | 3 | 1 | 6 | 76 |
| 2021 | 0 | 9 | 1 | 0 | 2 | 56 | 46 | 47 | 35 | 52 | 5 | 3 | 256 |
| 2022 | 1 | 13 | 55 | 22 | 15 | 32 | 39 | 19 | 31 | 11 | 0 | 0 | 238 |
Information Contacts: Hawai'i Institute of Geophysics and Planetology (HIGP) - MODVOLC Thermal Alerts System, School of Ocean and Earth Science and Technology (SOEST), Univ. of Hawai'i, 2525 Correa Road, Honolulu, HI 96822, USA (URL: http://modis.higp.hawaii.edu/); Sentinel Hub Playground (URL: https://www.sentinel-hub.com/explore/sentinel-playground).
This compilation of synonyms and subsidiary features may not be comprehensive. Features are organized into four major categories: Cones, Craters, Domes, and Thermal Features. Synonyms of features appear indented below the primary name. In some cases additional feature type, elevation, or location details are provided.
Cones |
||||
| Feature Name | Feature Type | Elevation | Latitude | Longitude |
| Abbott Peak | Cone | 77° 29' 0" S | 166° 52' 0" E | |
| Bomb Peak | Cone | 77° 30' 0" S | 167° 27' 0" E | |
| Cis, Mount | Cone | 77° 32' 0" S | 166° 25' 0" E | |
| Fang | Stratovolcano | 3159 m | 77° 30' 0" S | 167° 20' 0" E |
| Hoopers Shoulder | Cone | 77° 31' 0" S | 166° 54' 0" E | |
| Three Sisters Cones | Cone | 77° 32' 0" S | 166° 56' 0" E | |
Craters |
||||
| Feature Name | Feature Type | Elevation | Latitude | Longitude |
| Main Crater | Crater | |||
| Side Crater | Crater | |||
| Western Crater | Crater | |||
|
|
||||||||||||||||||||||||||
There is data available for 20 confirmed Holocene eruptive periods.
1972 Dec 16 (in or before) ± 15 days - 2024 Apr 19 (continuing) Confirmed Eruption Max VEI: 2
| Episode 1 | Lava Lake Episode | ||||||||||||||||||||||||||||||||||||||||||||||||||||||||||||||||||||||||||||||||
|---|---|---|---|---|---|---|---|---|---|---|---|---|---|---|---|---|---|---|---|---|---|---|---|---|---|---|---|---|---|---|---|---|---|---|---|---|---|---|---|---|---|---|---|---|---|---|---|---|---|---|---|---|---|---|---|---|---|---|---|---|---|---|---|---|---|---|---|---|---|---|---|---|---|---|---|---|---|---|---|---|
| 1972 Dec 16 (in or before) ± 15 days - 2024 Apr 19 (continuing) | Evidence from Observations: Reported | |||||||||||||||||||||||||||||||||||||||||||||||||||||||||||||||||||||||||||||||
|
List of 14 Events for Episode 1
| ||||||||||||||||||||||||||||||||||||||||||||||||||||||||||||||||||||||||||||||||
1972 Jan 3 (?) Confirmed Eruption Max VEI: 1
| Episode 1 | Eruption Episode | |||||||||||||||||||||||||
|---|---|---|---|---|---|---|---|---|---|---|---|---|---|---|---|---|---|---|---|---|---|---|---|---|---|
| 1972 Jan 3 (?) - Unknown | Evidence from Observations: Reported | ||||||||||||||||||||||||
|
List of 3 Events for Episode 1
| |||||||||||||||||||||||||
1963 Nov 16 (in or before) ± 15 days Confirmed Eruption Max VEI: 0
| Episode 1 | Eruption Episode | ||||||||||||||||||||
|---|---|---|---|---|---|---|---|---|---|---|---|---|---|---|---|---|---|---|---|---|
| 1963 Nov 16 (in or before) ± 15 days - Unknown | Evidence from Observations: Reported | |||||||||||||||||||
|
List of 2 Events for Episode 1
| ||||||||||||||||||||
[ 1957 Jul 2 ± 182 days - 1958 Jul 2 ± 182 days ] Uncertain Eruption
| Episode 1 | Eruption Episode | |||||||||||||||
|---|---|---|---|---|---|---|---|---|---|---|---|---|---|---|---|
| 1957 Jul 2 ± 182 days - 1958 Jul 2 ± 182 days | Evidence from Unknown | ||||||||||||||
|
List of 1 Events for Episode 1
| |||||||||||||||
1955 Jul 2 ± 182 days Confirmed Eruption Max VEI: 2
| Episode 1 | Eruption Episode | ||||||||||||||||||||
|---|---|---|---|---|---|---|---|---|---|---|---|---|---|---|---|---|---|---|---|---|
| 1955 Jul 2 ± 182 days - Unknown | Evidence from Observations: Reported | |||||||||||||||||||
|
List of 2 Events for Episode 1
| ||||||||||||||||||||
1947 Feb Confirmed Eruption Max VEI: 2
| Episode 1 | Eruption Episode | |||||||||||||||||||||||||
|---|---|---|---|---|---|---|---|---|---|---|---|---|---|---|---|---|---|---|---|---|---|---|---|---|---|
| 1947 Feb - Unknown | Evidence from Observations: Reported | ||||||||||||||||||||||||
|
List of 3 Events for Episode 1
| |||||||||||||||||||||||||
1915 Aug Confirmed Eruption Max VEI: 2
| Episode 1 | Eruption Episode | ||||||||||||||||||||
|---|---|---|---|---|---|---|---|---|---|---|---|---|---|---|---|---|---|---|---|---|
| 1915 Aug - Unknown | Evidence from Observations: Reported | |||||||||||||||||||
|
List of 2 Events for Episode 1
| ||||||||||||||||||||
1915 Mar 22 Confirmed Eruption Max VEI: 2
| Episode 1 | Eruption Episode | |||||||||||||||||||||||||
|---|---|---|---|---|---|---|---|---|---|---|---|---|---|---|---|---|---|---|---|---|---|---|---|---|---|
| 1915 Mar 22 - Unknown | Evidence from Observations: Reported | ||||||||||||||||||||||||
|
List of 3 Events for Episode 1
| |||||||||||||||||||||||||
1912 Dec 12 Confirmed Eruption Max VEI: 2
| Episode 1 | Eruption Episode | ||||||||||||||||||||||||||||||
|---|---|---|---|---|---|---|---|---|---|---|---|---|---|---|---|---|---|---|---|---|---|---|---|---|---|---|---|---|---|---|
| 1912 Dec 12 - Unknown | Evidence from Observations: Reported | |||||||||||||||||||||||||||||
|
List of 4 Events for Episode 1
| ||||||||||||||||||||||||||||||
1911 Oct Confirmed Eruption Max VEI: 2
| Episode 1 | Eruption Episode | ||||||||||||||||||||
|---|---|---|---|---|---|---|---|---|---|---|---|---|---|---|---|---|---|---|---|---|
| 1911 Oct - Unknown | Evidence from Observations: Reported | |||||||||||||||||||
|
List of 2 Events for Episode 1
| ||||||||||||||||||||
1911 Apr - 1911 Jun Confirmed Eruption Max VEI: 2
| Episode 1 | Eruption Episode | ||||||||||||||||||||
|---|---|---|---|---|---|---|---|---|---|---|---|---|---|---|---|---|---|---|---|---|
| 1911 Apr - 1911 Jun | Evidence from Observations: Reported | |||||||||||||||||||
|
List of 2 Events for Episode 1
| ||||||||||||||||||||
1908 Mar - 1908 Nov Confirmed Eruption Max VEI: 2
| Episode 1 | Eruption Episode | |||||||||||||||||||||||||
|---|---|---|---|---|---|---|---|---|---|---|---|---|---|---|---|---|---|---|---|---|---|---|---|---|---|
| 1908 Mar - 1908 Nov | Evidence from Observations: Reported | ||||||||||||||||||||||||
|
List of 3 Events for Episode 1
| |||||||||||||||||||||||||
1903 Jan 1 ± 730 days Confirmed Eruption Max VEI: 0
| Episode 1 | Eruption Episode | ||||||||||||||||||||
|---|---|---|---|---|---|---|---|---|---|---|---|---|---|---|---|---|---|---|---|---|
| 1903 Jan 1 ± 730 days - Unknown | Evidence from Observations: Reported | |||||||||||||||||||
|
List of 2 Events for Episode 1
| ||||||||||||||||||||
[ 1900 Feb ] Uncertain Eruption
| Episode 1 | Eruption Episode | |||||||||||||||||||||||||
|---|---|---|---|---|---|---|---|---|---|---|---|---|---|---|---|---|---|---|---|---|---|---|---|---|---|
| 1900 Feb - Unknown | Evidence from Unknown | ||||||||||||||||||||||||
|
List of 3 Events for Episode 1
| |||||||||||||||||||||||||
1841 Jan 28 (?) - 1841 Feb Confirmed Eruption Max VEI: 1
| Episode 1 | Eruption Episode | |||||||||||||||||||||||||
|---|---|---|---|---|---|---|---|---|---|---|---|---|---|---|---|---|---|---|---|---|---|---|---|---|---|
| 1841 Jan 28 (?) - 1841 Feb | Evidence from Observations: Reported | ||||||||||||||||||||||||
|
List of 3 Events for Episode 1
| |||||||||||||||||||||||||
0950 ± 4000 years Confirmed Eruption Max VEI: 0
| Episode 1 | Eruption Episode | Northwest lava flow | |||||||||||||||||||
|---|---|---|---|---|---|---|---|---|---|---|---|---|---|---|---|---|---|---|---|---|
| 0950 ± 4000 years - Unknown | Evidence from Isotopic: Ar/Ar | |||||||||||||||||||
|
List of 2 Events for Episode 1 at Northwest lava flow
| ||||||||||||||||||||
2050 BCE ± 3000 years Confirmed Eruption Max VEI: 0
| Episode 1 | Eruption Episode | Western Crater (Upper Ice Tower flow) | |||||||||||||||||||
|---|---|---|---|---|---|---|---|---|---|---|---|---|---|---|---|---|---|---|---|---|
| 2050 BCE ± 3000 years - Unknown | Evidence from Isotopic: Ar/Ar | |||||||||||||||||||
|
List of 2 Events for Episode 1 at Western Crater (Upper Ice Tower flow)
| ||||||||||||||||||||
2950 BCE ± 300 years Confirmed Eruption Max VEI: 0
| Episode 1 | Eruption Episode | North flank (Lower Hut lava flow) | |||||||||||||||||||
|---|---|---|---|---|---|---|---|---|---|---|---|---|---|---|---|---|---|---|---|---|
| 2950 BCE ± 300 years - Unknown | Evidence from Isotopic: Cosmic Ray Exposure | |||||||||||||||||||
|
List of 2 Events for Episode 1 at North flank (Lower Hut lava flow)
| ||||||||||||||||||||
4050 BCE ± 500 years Confirmed Eruption Max VEI: 0
| Episode 1 | Eruption Episode | Lower Ice Tower Ridge, S lava flows | |||||||||||||||||||
|---|---|---|---|---|---|---|---|---|---|---|---|---|---|---|---|---|---|---|---|---|
| 4050 BCE ± 500 years - Unknown | Evidence from Isotopic: Cosmic Ray Exposure | |||||||||||||||||||
|
List of 2 Events for Episode 1 at Lower Ice Tower Ridge, S lava flows
| ||||||||||||||||||||
4550 BCE ± 500 years Confirmed Eruption Max VEI: 0
| Episode 1 | Eruption Episode | NE flank | |||||||||||||||||||
|---|---|---|---|---|---|---|---|---|---|---|---|---|---|---|---|---|---|---|---|---|
| 4550 BCE ± 500 years - Unknown | Evidence from Isotopic: Cosmic Ray Exposure | |||||||||||||||||||
|
List of 2 Events for Episode 1 at NE flank
| ||||||||||||||||||||
7050 BCE ± 2000 years Confirmed Eruption Max VEI: 0
| Episode 1 | Eruption Episode | NW flank, Tramway lava flow | |||||||||||||||||||
|---|---|---|---|---|---|---|---|---|---|---|---|---|---|---|---|---|---|---|---|---|
| 7050 BCE ± 2000 years - Unknown | Evidence from Isotopic: Ar/Ar | |||||||||||||||||||
|
List of 2 Events for Episode 1 at NW flank, Tramway lava flow
| ||||||||||||||||||||
8050 BCE ± 5000 years Confirmed Eruption Max VEI: 0
| Episode 1 | Eruption Episode | NNW flank, Nausea Knob lava flow | |||||||||||||||||||
|---|---|---|---|---|---|---|---|---|---|---|---|---|---|---|---|---|---|---|---|---|
| 8050 BCE ± 5000 years - Unknown | Evidence from Isotopic: Ar/Ar | |||||||||||||||||||
|
List of 2 Events for Episode 1 at NNW flank, Nausea Knob lava flow
| ||||||||||||||||||||
There is no Deformation History data available for Erebus.
There is no Emissions History data available for Erebus.
 Mount Erebus is seen here from the SW near the McMurdo research station on Ross Island and the world's southernmost active volcano. The summit has a 500 x 600 m wide, 110-m-deep crater that contains an active lava lake. The glaciated volcano was erupting when first sighted by Captain James Ross in 1841. Continuous lava lake activity has been documented since 1972, punctuated by occasional Strombolian explosions that eject bombs onto the crater rim.
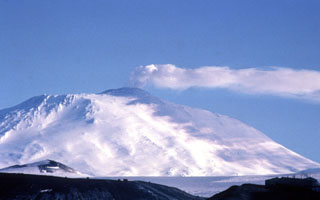 A gas plume from the Erebus summit crater casts a shadow on its western flank. There is an active lava lake in this crater and a caldera forms the plateau to the left of the summit cone. The McMurdo Station research facility on Hut Peninsula is in the foreground.
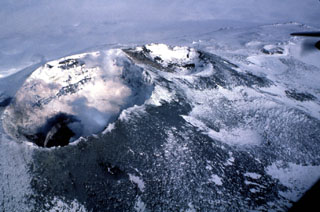 Two summit craters at Erebus are seen in this view, with the 500 x 600 m Main Crater (left) containing an active lava lake (lower left) within the Inner Crater. A smaller inactive crater (center), referred to as Side Crater, is located immediately SW of Main Crater. The smaller West Crater is to the upper right.
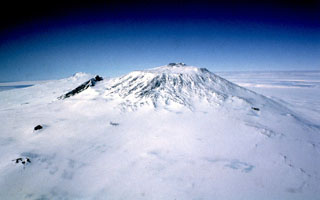 Mount Erebus is seen here from the west and is Earth's southernmost active volcano. A largely infilled caldera forms a plateau at the summit where the active cone is located. Fang Ridge is the dark area on the NE flank (left).
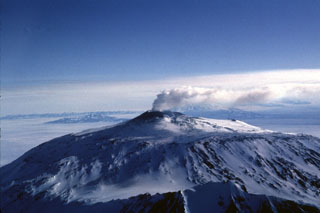 A gas-and-steam plume rises above the Mount Erebus summit crater in 1983. Fang Ridge is in the foreground of this view from the NE. The summit plateau across the center of the photo is the rim of a caldera containing the active summit cone.
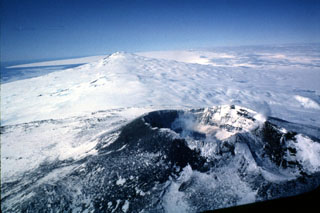 Two of the three volcanoes forming Ross Island are seen in this aerial view from the west. The Erebus summit crater that contains an active lava lake is in the foreground, with glaciated Mount Terror in the distance. Numerous scoria cones and lava domes have formed across the flanks.
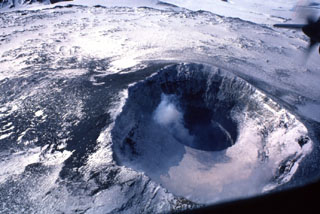 The summit of Antarctica's Mount Erebus is the world's southernmost active volcano. It contains an elliptical 500 x 600 m wide crater whose NE side contains a 250-m-wide, 100-m-deep inner crater. The flat, snow-covered floor of the Main Crater is about 100 m below its rim. A plume rises from the inner crater that has contained an active lava lake since 1972.
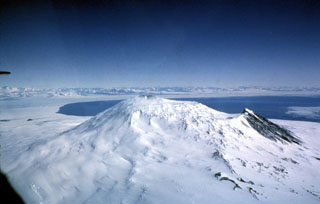 Mount Erebus is viewed here from the SE, with the water of the Ross Sea behind it and the mountains of Victoria Land in the distance. Fang Ridge is above the snow-free slope (right) on the NE flank. The plateau right of the summit is the lava flow-filled floor of the summit caldera, inside which the active summit cone was constructed. Hut Point Peninsula is the site of the McMurdo Station and is to the left of the Ross Sea.
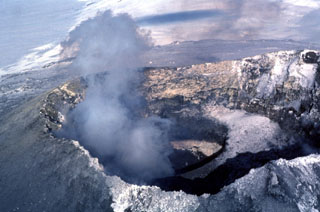 A gas plume rises above the active lava lake at the summit of Erebus in December 1983, which was first observed on 24 December 1972. Lava lake activity and intermittent Strombolian eruptions have been observed during annual scientific expeditions since then. The lava is located at the bottom of an inner 100-m-deep crater, whose snow-covered rim forms a bench at the right (SW) side of the Main Crater in this 1983 photo.
The maps shown below have been scanned from the GVP map archives and include the volcano on this page. Clicking on the small images will load the full 300 dpi map. Very small-scale maps (such as world maps) are not included. The maps database originated over 30 years ago, but was only recently updated and connected to our main database. We welcome users to tell us if they see incorrect information or other problems with the maps; please use the Contact GVP link at the bottom of the page to send us email.
The following 9 samples associated with this volcano can be found in the Smithsonian's NMNH Department of Mineral Sciences collections, and may be availble for research (contact the Rock and Ore Collections Manager). Catalog number links will open a window with more information.
| Catalog Number | Sample Description | Lava Source | Collection Date |
|---|---|---|---|
| NMNH 113083-1 | Unidentified | -- | -- |
| NMNH 113083-2 | Unidentified | -- | -- |
| NMNH 113083-3 | Unidentified | -- | -- |
| NMNH 113083-4 | Unidentified | -- | -- |
| NMNH 113083-5 | Unidentified | -- | -- |
| NMNH 77636 | Pumice | -- | -- |
| NMNH 77637 | Pumice | -- | -- |
| NMNH 91049 | Volcanic Rock | -- | -- |
| NMNH 91049 | Basalt | -- | -- |
| Copernicus Browser | The Copernicus Browser replaced the Sentinel Hub Playground browser in 2023, to provide access to Earth observation archives from the Copernicus Data Space Ecosystem, the main distribution platform for data from the EU Copernicus missions. |
| MIROVA | Middle InfraRed Observation of Volcanic Activity (MIROVA) is a near real time volcanic hot-spot detection system based on the analysis of MODIS (Moderate Resolution Imaging Spectroradiometer) data. In particular, MIROVA uses the Middle InfraRed Radiation (MIR), measured over target volcanoes, in order to detect, locate and measure the heat radiation sourced from volcanic activity. |
| MODVOLC Thermal Alerts | Using infrared satellite Moderate Resolution Imaging Spectroradiometer (MODIS) data, scientists at the Hawai'i Institute of Geophysics and Planetology, University of Hawai'i, developed an automated system called MODVOLC to map thermal hot-spots in near real time. For each MODIS image, the algorithm automatically scans each 1 km pixel within it to check for high-temperature hot-spots. When one is found the date, time, location, and intensity are recorded. MODIS looks at every square km of the Earth every 48 hours, once during the day and once during the night, and the presence of two MODIS sensors in space allows at least four hot-spot observations every two days. Each day updated global maps are compiled to display the locations of all hot spots detected in the previous 24 hours. There is a drop-down list with volcano names which allow users to 'zoom-in' and examine the distribution of hot-spots at a variety of spatial scales. |
|
WOVOdat
Single Volcano View Temporal Evolution of Unrest Side by Side Volcanoes |
WOVOdat is a database of volcanic unrest; instrumentally and visually recorded changes in seismicity, ground deformation, gas emission, and other parameters from their normal baselines. It is sponsored by the World Organization of Volcano Observatories (WOVO) and presently hosted at the Earth Observatory of Singapore.
GVMID Data on Volcano Monitoring Infrastructure The Global Volcano Monitoring Infrastructure Database GVMID, is aimed at documenting and improving capabilities of volcano monitoring from the ground and space. GVMID should provide a snapshot and baseline view of the techniques and instrumentation that are in place at various volcanoes, which can be use by volcano observatories as reference to setup new monitoring system or improving networks at a specific volcano. These data will allow identification of what monitoring gaps exist, which can be then targeted by remote sensing infrastructure and future instrument deployments. |
| Volcanic Hazard Maps | The IAVCEI Commission on Volcanic Hazards and Risk has a Volcanic Hazard Maps database designed to serve as a resource for hazard mappers (or other interested parties) to explore how common issues in hazard map development have been addressed at different volcanoes, in different countries, for different hazards, and for different intended audiences. In addition to the comprehensive, searchable Volcanic Hazard Maps Database, this website contains information about diversity of volcanic hazard maps, illustrated using examples from the database. This site is for educational purposes related to volcanic hazard maps. Hazard maps found on this website should not be used for emergency purposes. For the most recent, official hazard map for a particular volcano, please seek out the proper institutional authorities on the matter. |
| IRIS seismic stations/networks | Incorporated Research Institutions for Seismology (IRIS) Data Services map showing the location of seismic stations from all available networks (permanent or temporary) within a radius of 0.18° (about 20 km at mid-latitudes) from the given location of Erebus. Users can customize a variety of filters and options in the left panel. Note that if there are no stations are known the map will default to show the entire world with a "No data matched request" error notice. |
| UNAVCO GPS/GNSS stations | Geodetic Data Services map from UNAVCO showing the location of GPS/GNSS stations from all available networks (permanent or temporary) within a radius of 20 km from the given location of Erebus. Users can customize the data search based on station or network names, location, and time window. Requires Adobe Flash Player. |
| DECADE Data | The DECADE portal, still in the developmental stage, serves as an example of the proposed interoperability between The Smithsonian Institution's Global Volcanism Program, the Mapping Gas Emissions (MaGa) Database, and the EarthChem Geochemical Portal. The Deep Earth Carbon Degassing (DECADE) initiative seeks to use new and established technologies to determine accurate global fluxes of volcanic CO2 to the atmosphere, but installing CO2 monitoring networks on 20 of the world's 150 most actively degassing volcanoes. The group uses related laboratory-based studies (direct gas sampling and analysis, melt inclusions) to provide new data for direct degassing of deep earth carbon to the atmosphere. |
| Large Eruptions of Erebus | Information about large Quaternary eruptions (VEI >= 4) is cataloged in the Large Magnitude Explosive Volcanic Eruptions (LaMEVE) database of the Volcano Global Risk Identification and Analysis Project (VOGRIPA). |
| EarthChem | EarthChem develops and maintains databases, software, and services that support the preservation, discovery, access and analysis of geochemical data, and facilitate their integration with the broad array of other available earth science parameters. EarthChem is operated by a joint team of disciplinary scientists, data scientists, data managers and information technology developers who are part of the NSF-funded data facility Integrated Earth Data Applications (IEDA). IEDA is a collaborative effort of EarthChem and the Marine Geoscience Data System (MGDS). |

