Recently Published Bulletin Reports
Agung (Indonesia) Three eruptive events reported in April, May, and December 2022
Tengger Caldera (Indonesia) Minor ash emission in December 2023; persistent weak thermal anomaly in the Bromo crater
Saunders (United Kingdom) Persistent thermal anomalies from the summit crater lava lake during February 2023-January 2024
Shishaldin (United States) New eruption with significant Strombolian explosions, ash plumes, and ashfall
Ioto (Japan) New eruption with discolored water, ejecta, and floating pumice during October-December 2023
Purace (Colombia) Gas-and-ash emission on 16 November 2023
Etna (Italy) Strombolian explosions, lava fountains, and lava flows during July-August 2023
Suwanosejima (Japan) Eruption plumes, crater incandescence, and occasional explosions during July-October 2023
Aira (Japan) Explosions, ash plumes, ash fall, and crater incandescence during July-October 2023
Nishinoshima (Japan) Gray emissions during October 2023
Kilauea (United States) Strong lava fountains, lava flows, and spatter at Halema’uma’u during January-September 2023
Tinakula (Solomon Islands) Continued lava flows and thermal activity during June through November 2023
Agung (Indonesia) — January 2024  Cite this Report
Agung
Indonesia
8.343°S, 115.508°E; summit elev. 2997 m
All times are local (unless otherwise noted)
Three eruptive events reported in April, May, and December 2022
Mount Agung, located on the E end of the island of Bali, Indonesia, rises above the SE rim of the Batur caldera. The summit area extends 1.5 km E-W, with the highest point on the W and a steep-walled 800-m-wide crater on the E. Recorded eruptions date back to the early 19th century. A large and deadly explosive and effusive eruption occurred during 1963-64, which was characterized by voluminous ashfall, pyroclastic flows, and lahars that caused extensive damage and many fatalities. More recent activity was documented during November 2017-June 2019 that consisted of multiple explosions, significant ash plumes, lava flows at the summit crater, and incandescent ejecta. This report covers activity reported during April-May 2022 and December 2022 based on data from the Darwin Volcanic Ash Advisory Center (VAAC).
Activity during 2022 was relatively low and mainly consisted of a few ash plumes during April-May and December. An ash plume on 3 April rising to 3.7 km altitude (700 m above the summit) and drifting N was reported in a Darwin VAAC notice based on a ground report, with ash seen in HIMAWARI-8 visible imagery. Another ash plume was reported at 1120 on 27 May that rose to 5.5 km altitude (2.5 m above the summit); the plume was not visible in satellite or webcam images due to weather clouds. An eruption was reported based on seismic data at 0840 on 13 December, with an estimated plume altitude of 3.7 km; however, no ash was seen using satellite imagery in clear conditions before weather clouds obscured the summit.
Geologic Background. Symmetrical Agung stratovolcano, Bali's highest and most sacred mountain, towers over the eastern end of the island. The volcano, whose name means "Paramount," rises above the SE rim of the Batur caldera, and the northern and southern flanks extend to the coast. The summit area extends 1.5 km E-W, with the high point on the W and a steep-walled 800-m-wide crater on the E. The Pawon cone is located low on the SE flank. Only a few eruptions dating back to the early 19th century have been recorded in historical time. The 1963-64 eruption, one of the largest in the 20th century, produced voluminous ashfall along with devastating pyroclastic flows and lahars that caused extensive damage and many fatalities.
Information Contacts: Darwin Volcanic Ash Advisory Centre (VAAC), Bureau of Meteorology, Northern Territory Regional Office, PO Box 40050, Casuarina, NT 0811, Australia (URL: http://www.bom.gov.au/info/vaac/).
Tengger Caldera (Indonesia) — February 2024 Cite this Report
Tengger Caldera
Indonesia
7.942°S, 112.95°E; summit elev. 2329 m
All times are local (unless otherwise noted)
Minor ash emission in December 2023; persistent weak thermal anomaly in the Bromo crater
Tengger Caldera, located at the N end of a volcanic massif in Indonesia’s East Java, consists of five overlapping stratovolcanoes. The youngest and only active cone in the 16-km-wide caldera is Bromo, which typically produces gas-and-steam plumes, occasional ash plumes and explosions, and weak thermal signals (BGVN 44:05, 47:01). This report covers activity during January 2022-December 2023, consisting of mostly white gas-and-steam emissions and persistent weak thermal anomalies. Information was provided by the Pusat Vulkanologi dan Mitigasi Bencana Geologi (PVMBG, also known as Indonesian Center for Volcanology and Geological Hazard Mitigation, CVGHM) and satellite imagery. The Alert Level remained at 2 (on a scale of 1-4), and visitors were warned to stay at least 1 km from the crater.
Activity was generally low during the reporting period, similar to that in 2021. According to almost daily images from MAGMA Indonesia (a platform developed by PVMBG), white emissions and plumes rose from 50 to 900 m above the main crater during this period (figure 24). During several days in March and June 2022, white plumes reached heights of 1-1.2 km above the crater.
After an increase in activity at 2114 on 3 February 2023, a PVMBG team that was sent to observe white emissions rising as high as 300 m during 9-12 February and heard rumbling noises. A sulfur dioxide odor was also strong near the crater and measurements indicated that levels were above the healthy (non-hazardous) threshold of 5 parts per million; differential optical absorption spectroscopy (DOAS) measurements indicated an average flux of 190 metric tons per day on 11 February. Incandescence originating from a large fumarole in the NNW part of the crater was visible at night. The team observed that vegetation on the E caldera wall was yellow and withered. The seismic network recorded continuous tremor and deep and shallow volcanic earthquakes.
According to a PVMBG press release, activity increased on 13 December 2023 with white, gray, and brown emissions rising as high as 900 m above Bromo’s crater rim and drifting in multiple directions (figure 25). The report noted that tremor was continuous and was accompanied in December by three volcanic earthquakes. Deformation data indicated inflation in December. There was no observable difference in the persistent thermal anomaly in the crater between 11 and 16 December 2023.
All clear views of the Bromo crater throughout this time, using Sentinel-2 infrared satellite images, showed a weak persistent thermal anomaly; none of the anomalies were strong enough to cause MODVOLC Thermal Alerts. A fire in the SE part of the caldera in early September 2023 resulted in a brief period of strong thermal anomalies.
Geologic Background. The 16-km-wide Tengger caldera is located at the northern end of a volcanic massif extending from Semeru volcano. The massive volcanic complex dates back to about 820,000 years ago and consists of five overlapping stratovolcanoes, each truncated by a caldera. Lava domes, pyroclastic cones, and a maar occupy the flanks of the massif. The Ngadisari caldera at the NE end of the complex formed about 150,000 years ago and is now drained through the Sapikerep valley. The most recent of the calderas is the 9 x 10 km wide Sandsea caldera at the SW end of the complex, which formed incrementally during the late Pleistocene and early Holocene. An overlapping cluster of post-caldera cones was constructed on the floor of the Sandsea caldera within the past several thousand years. The youngest of these is Bromo, one of Java's most active and most frequently visited volcanoes.
Information Contacts: Pusat Vulkanologi dan Mitigasi Bencana Geologi (PVMBG, also known as Indonesian Center for Volcanology and Geological Hazard Mitigation, CVGHM), Jalan Diponegoro 57, Bandung 40122, Indonesia (URL: http://www.vsi.esdm.go.id/); MAGMA Indonesia, Kementerian Energi dan Sumber Daya Mineral (URL: https://magma.esdm.go.id/v1); Copernicus Browser, Copernicus Data Space Ecosystem, European Space Agency (URL: https://dataspace.copernicus.eu/browser/); Hawai'i Institute of Geophysics and Planetology (HIGP) - MODVOLC Thermal Alerts System, School of Ocean and Earth Science and Technology (SOEST), Univ. of Hawai'i, 2525 Correa Road, Honolulu, HI 96822, USA (URL: http://modis.higp.hawaii.edu/).
Saunders (United Kingdom) — February 2024 Cite this Report
Saunders
United Kingdom
57.8°S, 26.483°W; summit elev. 843 m
All times are local (unless otherwise noted)
Persistent thermal anomalies from the summit crater lava lake during February 2023-January 2024
Saunders is one of eleven islands that comprise the South Sandwich Islands in the South Atlantic. The active Mount Michael volcano has been in almost continuous eruption since November 2014 (BGVN 48:02). Recent activity has resulted in intermittent thermal anomalies and gas-and-steam emissions (BGVN 47:03, 48:02). Visits are infrequent due to its remote location, and cloud cover often prevents satellite observations. Satellite thermal imagery and visual observation of incandescence during a research expedition in 2019 (BGVN 28:02 and 44:08) and a finding confirmed by a National Geographic Society research team that summited Michael in November 2022 reported the presence of a lava lake.
Although nearly constant cloud cover during February 2023 through January 2024 greatly limited satellite observations, thermal anomalies from the lava lake in the summit crater were detected on clear days, especially around 20-23 August 2023. Anomalies similar to previous years (eg. BGVN 48:02) were seen in both MIROVA (Middle InfraRed Observation of Volcanic Activity) data from MODIS instruments and in Sentinel 2 infrared imagery. The only notable sulfur dioxide plume detected near Saunders was on 25 September 2023, with the TROPOMI instrument aboard the Sentinel-5P satellite.
Geologic Background. Saunders Island consists of a large central volcanic edifice intersected by two seamount chains, as shown by bathymetric mapping (Leat et al., 2013). The young Mount Michael stratovolcano dominates the glacier-covered island, while two submarine plateaus, Harpers Bank and Saunders Bank, extend north. The symmetrical Michael has a 500-m-wide summit crater and a remnant of a somma rim to the SE. Tephra layers visible in ice cliffs surrounding the island are evidence of recent eruptions. Ash clouds were reported from the summit crater in 1819, and an effusive eruption was inferred to have occurred from a N-flank fissure around the end of the 19th century and beginning of the 20th century. A low ice-free lava platform, Blackstone Plain, is located on the north coast, surrounding a group of former sea stacks. A cluster of cones on the SE flank, the Ashen Hills, appear to have been modified since 1820 (LeMasurier and Thomson, 1990). Analysis of satellite imagery available since 1989 (Gray et al., 2019; MODVOLC) suggests frequent eruptive activity (when weather conditions allow), volcanic clouds, steam plumes, and thermal anomalies indicative of a persistent, or at least frequently active, lava lake in the summit crater. Due to this observational bias, there has been a presumption when defining eruptive periods that activity has been ongoing unless there is no evidence for at least 10 months.
Information Contacts: MIROVA (Middle InfraRed Observation of Volcanic Activity), a collaborative project between the Universities of Turin and Florence (Italy) supported by the Centre for Volcanic Risk of the Italian Civil Protection Department (URL: http://www.mirovaweb.it/); NASA Global Sulfur Dioxide Monitoring Page, Atmospheric Chemistry and Dynamics Laboratory, NASA Goddard Space Flight Center (NASA/GSFC), 8800 Greenbelt Road, Goddard MD 20771, USA (URL: https://so2.gsfc.nasa.gov/); Copernicus Browser (URL: https://dataspace.copernicus.eu/browser).
Shishaldin (United States) — December 2023 Cite this Report
Shishaldin
United States
54.756°N, 163.97°W; summit elev. 2857 m
All times are local (unless otherwise noted)
New eruption with significant Strombolian explosions, ash plumes, and ashfall
Shishaldin is located on the eastern half of Unimak Island, one of the Aleutian Islands. Frequent explosive activity, primarily consisting of Strombolian ash eruptions from the small summit crater, but sometimes producing lava flows, has been recorded since the 18th century. The previous eruption ended in May 2020 and was characterized by intermittent thermal activity, increased seismicity and surface temperatures, ash plumes, and ash deposits (BGVN 45:06). This report covers a new eruption during July through November 2023, which consisted of significant explosions, ash plumes, ashfall, and lava fountaining. Information comes from daily, weekly, and special reports from the Alaska Volcano Observatory (AVO) and various satellite data. AVO monitors the volcano using local seismic and infrasound sensors, satellite data, web cameras, and remote infrasound and lightning networks.
AVO reported that intermittent tremor and low-frequency earthquakes had gradually become more regular and consistent during 10-13 July. Strongly elevated surface temperatures at the summit were identified in satellite images during 10-13 July. On 11 July AVO raised the Aviation Color Code (ACC) to Yellow (the second color on a four-color scale) and Volcano Alert Level (VAL) to Advisory (the second level on a four-level scale) at 1439. Later in the day on 11 July summit crater incandescence was observed in webcam images. Observations of the summit suggested that lava was likely present at the crater, which prompted AVO to raise the ACC to Orange (the second highest color on a four-color scale) and the VAL to Watch (the second highest level on a four-level scale). The US Coast Guard conducted an overflight on 12 July and confirmed that lava was erupting from the summit. That same day, sulfur dioxide emissions were detected in satellite images.
A significant explosion began at 0109 on 14 July that produced an ash plume that rose to 9-12 km altitude and drifted S over the Pacific Ocean (figure 43). Webcam images and photos taken around 0700 from a ship SW off Unimak Island showed small lahar deposits, which were the result of the interaction of hot pyroclastic material and snow and ice on the flanks. There was also ashfall on the SW and N flanks. A smaller explosion at 0710 generated an ash plume that rose to 4.5 km altitude. Webcam images and pilot reports showed continued low-level ash emissions during the morning, rising to less than 4.6 km altitude; those emissions included a small ash plume near the summit around 1030 resulting from a small explosion.
Seismic tremor amplitude began increasing at around 1700 on 15 July; strongly elevated surface temperatures were also reported. An ash plume rose to 4.6 km altitude and drifted SSE at 2100, based on a satellite image. A continuous ash plume during 2150 through 2330 rose to 5 km altitude and extended 125 km S. At 2357 AVO raised the ACC to Red (the highest color on a four-color scale) and the VAL to Warning (the highest level on a four-level scale), noting that seismicity remained elevated for more than six hours and explosion signals were frequently detected by regional infrasound (pressure sensor) networks. Explosions generated an ash plume that rose to 4.9 km altitude and drifted as far as 500 km SE. Activity throughout the night declined and by 0735 the ACC was lowered to Orange and the VAL to Watch. High-resolution satellite images taken on 16 July showed pyroclastic deposits extending as far as 3 km from the vent; these deposits generated lahars that extended further down the drainages on the flanks. Ash deposits were mainly observed on the SSE flank and extended to the shore of Unimak Island. During 16-17 July lava continued to erupt at the summit, which caused strongly elevated surface temperatures that were visible in satellite imagery.
Lava effusion increased at 0100 on 18 July, as noted in elevated surface temperatures identified in satellite data, increasing seismic tremor, and activity detected on regional infrasound arrays. A significant ash plume at 0700 rose to 7 km altitude and continued until 0830, eventually reaching 9.1 km altitude and drifting SSE (figure 44). As a result, the ACC was raised to Red and the VAL to Warning. By 0930 the main plume detached, but residual low-level ash emissions continued for several hours, remaining below 3 km altitude and drifting S. The eruption gradually declined and by 1208 the ACC was lowered to Orange and the VAL was lowered to Watch. High-resolution satellite images showed ash deposits on the SW flank and pyroclastic deposits on the N, E, and S flanks, extending as far as 3 km from the vent; lahars triggered by the eruption extended farther down the flanks (figure 45). Lava continued to erupt from the summit crater on 19 July.
Elevated surface temperatures were detected in satellite images during 19-25 July, despite occasional weather cloud cover, which was consistent with increased lava effusion. During 22-23 July satellite observations acquired after the eruption from 18 July showed pyroclastic flow and lahar deposits extending as far as 3 km down the N, NW, and NE flanks and as far as 1.5 km down the S and SE flanks. Ash deposits covered the SW and NE flanks. No lava flows were observed outside the crater. On 22 July a sulfur dioxide plume was detected in satellite data midday that had an estimated mass of 10 kt. In a special notice issued at 1653 on 22 July AVO noted that eruptive activity had intensified over the previous six hours, which was characterized by an hours-long steady increase in seismic tremor, intermittent infrasound signals consistent with small explosions, and an increase in surface temperatures that were visible in satellite data. Pilots first reported low-level ash plumes at around 1900. At 2320 an ash plume had risen to 9 km altitude based on additional pilot reports and satellite images. The ACC was increased to Red and the VAL to Warning at 2343. Satellite images indicated growth of a significantly higher ash plume that rose to 11 km altitude continued until 0030 and drifted NE. During the early morning hours of 23 July ash plumes had declined to 4.6 k altitude. Seismic tremor peaked at 0030 on 23 July and began to rapidly decline at 0109; active ash emissions were no longer visible in satellite data by 0130. The ACC was lowered to Orange and the VAL to Watch at 0418; bursts of increased seismicity were recorded throughout the morning, but seismicity generally remained at low levels. Elevated surface temperatures were visible in satellite data until about 0600. On 24 July pilots reported seeing vigorous gas-and-steam plumes rising to about 3 km altitude; the plumes may have contained minor amounts of ash.
During 24-25 July low level seismicity and volcanic tremor were detected at low levels following the previous explosion on 23 July. Strongly elevated surface temperatures were observed at the summit crater in satellite data. Around 2200 on 25 July seismicity began to increase, followed by infrasound signals of explosions after 0200 on 26 July. An ash plume rose to 3 km altitude at 0500 and drifted ENE, along with an associated sulfur dioxide plume that drifted NE and had an estimated mass of 22 kt. Diffuse ash emissions were visible in satellite data and rose to 6.1-7.6 km altitude and extended 125 km from the volcano starting around 1130. These ash events were preceded by about seven hours of seismic tremor, infrasound detections of explosions, and five hours of increased surface temperatures visible in satellite data. Activity began to decline around 1327, which included low-frequency earthquakes and decreased volcanic tremor, and infrasound data no longer detected significant explosions. Surface temperatures remained elevated through the end of the month.
Seismicity, volcanic tremor, and ash emissions remained at low levels during early August. Satellite images on 1 August showed that some slumping had occurred on the E crater wall due to the recent explosive activity. Elevated surface temperatures continued, which was consistent with cooling lava. On 2 August small explosive events were detected, consistent with low-level Strombolian activity. Some episodes of volcanic tremor were reported, which reflected low-level ash emissions. Those ash emissions rose to less than 3 km altitude and drifted as far as 92.6 km N. Pilots that were located N of the volcano observed an ash plume that rose to 2.7 km altitude. Seismicity began to increase in intensity around 0900 on 3 August. Seismicity continued to increase throughout the day and through the night with strongly elevated surface temperatures, which suggested that lava was active at the surface.
An ash cloud that rose to 7.6-7.9 km altitude and drifted 60-75 km NE was visible in a satellite image at 0520 on 4 August. Pilots saw and reported the plume at 0836 (figure 46). By 0900 the plume had risen to 9.1 km altitude and extended over 100 km NE. AVO raised the ACC to Red and the VAL to Warning as a result. Seismic tremor levels peaked at 1400 and then sharply declined at 1500 to slightly elevated levels; the plume was sustained during the period of high tremor and drifted N and NE. The ACC was lowered to Orange and the VAL to Watch at 2055. During 5-14 August seismicity remained low and surface temperatures were elevated based on satellite data due to cooling lava. On 9 August a small lava flow was observed that extended from the crater rim to the upper NE flank. It had advanced to 55 m in length and appeared in satellite imagery on 11 August. Occasional gas-and-steam plumes were noted in webcam images. At 1827 AVO noted that seismic tremor had steadily increased during the afternoon and erupting lava was visible at the summit in satellite images.
Strong explosion signals were detected at 0200 on 15 August. An ash cloud that was visible in satellite data extended 100 km NE and may have risen as high as 11 km altitude around 0240. By 0335 satellite images showed the ash cloud rising to 7.6 km altitude and drifting NE. Significant seismicity and explosions were detected by the local AVO seismic and infrasound networks, and volcanic lightning was detected by the World Wide Lightning Location Network (WWLLN). A sulfur dioxide plume associated with the eruption drifted over the S Bering Sea and parts of Alaska and western Canada. Seismicity was significantly elevated during the eruption but had declined by 1322. A pilot reported that ash emissions continued, rising as high as 4.9 km altitude. Elevated surface temperatures detected in satellite data were caused by hot, eruptive material (pyroclastic debris and lava) that accumulated around the summit. Eruptive activity declined by 16 August and the associated sulfur dioxide plume had mostly dissipated; remnants continued to be identified in satellite images at least through 18 August. Surface temperatures remained elevated based on satellite images, indicating hot material on the upper parts of the volcano. Small explosions were detected in infrasound data on the morning of 19 August and were consistent with pilot reports of small, short-lived ash plumes that rose to about 4.3 km altitude. Low-level explosive activity was reported during 20-24 August, according to seismic and infrasound data, and weather clouds sometimes prevented views. Elevated surface temperatures were observed in satellite images, which indicated continued hot material on the upper parts of the volcano.
Seismic tremor began to increase at around 0300 on 25 August and was followed by elevated surface temperatures identified in satellite images, consistent with erupting lava. Small explosions were recorded in infrasound data. The ACC was raised to Red and the VAL to Warning at 1204 after a pilot reported an ash plume that rose to 9.1 km altitude. Seismicity peaked at 1630 and began to rapidly decline at around 1730. Ash plumes rose as high as 10 km altitude and drifted as far as 400 km NE. By 2020 the ash plumes had declined to 6.4 km altitude and continued to drift NE. Ash emissions were visible in satellite data until 0000 on 26 August and seismicity was at low levels. AVO lowered the ACC to Orange and the VAL to Watch at 0030. Minor explosive activity within the summit crater was detected during 26-28 August and strongly elevated surface temperatures were still visible in satellite imagery through the rest of the month. An AVO field crew working on Unimak Island observed a mass flow that descended the upper flanks beginning around 1720 on 27 August. The flow produced a short-lived ash cloud that rose to 4.5 km altitude and rapidly dissipated. The mass flow was likely caused by the collapse of spatter that accumulated on the summit crater rim.
Similar variable explosive activity was reported in September, although weather observations sometimes prevented observations. A moderate resolution satellite image from the afternoon of 1 September showed gas-and-steam emissions filling the summit crater and obscuring views of the vent. In addition, hot deposits from the previous 25-26 August explosive event were visible on the NE flank near the summit, based on a 1 September satellite image. On 2 and 4 September seismic and infrasound data showed signals of small, repetitive explosions. Variable gas-and-steam emissions from the summit were visible but there was no evidence of ash. Possible summit crater incandescence was visible in nighttime webcam images during 3-4 September.
Seismicity began to gradually increase at around 0300 on 5 September and activity escalated at around 0830. A pilot reported an ash plume that rose to 7.6 km altitude at 0842 and continued to rise as high as possibly 9.7 km altitude and drifted SSE based on satellite images (figure 47). The ACC was raised to Red and the VAL to Warning at 0900. In addition to strong tremor and sustained explosions, the eruption produced volcanic lightning that was detected by the WWLLN. Around 1100 seismicity decreased and satellite data confirmed that the altitude of the ash emissions had declined to 7.6 km altitude. By 1200 the lower-altitude portion of the ash plume had drifted 125 km E. Significant ash emissions ended by 1330 based on webcam images. The ACC was lowered to Orange and the VAL to Watch at 1440. Satellite images showed extensive pyroclastic debris flows on most of the flanks that extended 1.2-3.3 km from the crater rim.
During 6-13 September elevated surface temperatures continued to be observed in satellite data, seismicity remained elevated with weak but steady tremor, and small, low-frequency earthquakes and small explosions were reported, except on 12 September. On 6 September a low-level ash plume rose to 1.5-1.8 km altitude and drifted SSE. Occasional small and diffuse gas-and-steam emissions at the summit were visible in webcam images. Around 1800 on 13 September seismic tremor amplitudes began to increase, and small explosions were detected in seismic and infrasound data. Incandescent lava at the summit was seen in a webcam image taken at 0134 on 14 September during a period of elevated tremor. No ash emissions were reported during the period of elevated seismicity. Lava fountaining began around 0200, based on webcam images. Satellite-based radar observations showed that the lava fountaining activity led to the growth of a cone in the summit crater, which refilled most of the crater. By 0730 seismicity significantly declined and remained at low levels.
Seismic tremor began to increase around 0900 on 15 September and rapidly intensified. An explosive eruption began at around 1710, which prompted AVO to raise the ACC to Red and the VAL to Warning. Within about 30 minutes ash plumes drifted E below a weather cloud at 8.2 km altitude. The National Weather Service estimated that an ash-rich plume rose as high as 12.8 km altitude and produced volcanic lightning. The upper part of the ash plume detached from the vent around 1830 and drifted E, and was observed over the Gulf of Alaska. Around the same time, seismicity dramatically decreased. Trace ashfall was reported in the community of False Pass (38 km ENE) between 1800-2030 and also in King Cove and nearby marine waters. Activity declined at around 1830 although seismicity remained elevated, ash emissions, and ashfall continued until 2100. Lightning was again detected beginning around 1930, which suggested that ash emissions continued. Ongoing explosions were detected in infrasound data, at a lower level than during the most energetic phase of this event. Lightning was last detected at 2048. By 2124 the intensity of the eruption had decreased, and ash emissions were likely rising to less than 6.7 km altitude. Seismicity returned to pre-eruption levels. On 16 September the ACC was lowered to Orange and the VAL to Watch at 1244; the sulfur dioxide plume that was emitted from the previous eruption event was still visible over the northern Pacific Ocean. Elevated surface temperatures, gas-and-steam emissions from the vent, and new, small lahars were reported on the upper flanks based on satellite and webcam images. Minor deposits were reported on the flanks which were likely the result of collapse of previously accumulated lava near the summit crater.
Elevated seismicity with tremor, small earthquakes, and elevated surface temperatures were detected during 17-23 September. Minor gas-and-steam emissions were visible in webcam images. On 20 September small volcanic debris flows were reported on the upper flanks. On 21 September a small ash deposit was observed on the upper flanks extending to the NE based on webcam images. Seismic tremor increased significantly during 22-23 September. Regional infrasound sensors suggested that low-level eruptive activity was occurring within the summit crater by around 1800 on 23 September. Even though seismicity was at high levels, strongly elevated surface temperatures indicating lava at the surface were absent and no ash emissions were detected; weather clouds at 0.6-4.6 km altitude obscured views. At 0025 on 24 September AVO noted that seismicity continued at high levels and nearly continuous small infrasound signals began, likely from low-level eruptive activity. Strongly elevated surface temperatures were identified in satellite images by 0900 and persisted throughout the day; the higher temperatures along with infrasound and seismic data were consistent with lava erupting at the summit. Around 1700 similarly elevated surface temperatures were detected from the summit in satellite data, which suggested that more vigorous lava fountaining had started. Starting around 1800 low-level ash emissions rose to altitudes less than 4.6 km altitude and quickly dissipated.
Beginning at midnight on 25 September, a series of seismic signals consistent with volcanic flows were recorded on the N side of the volcano. A change in seismicity and infrasound signals occurred around 0535 and at 0540 a significant ash cloud formed and quickly reached 14 km altitude and drifted E along the Alaska Peninsula. The cloud generated at least 150 lightning strokes with thunder that could be heard by people in False Pass. Seismicity rapidly declined to near background levels around 0600. AVO increased the ACC to Red and the VAL to Warning at 0602. The ash cloud detached from the volcano at around 0700, rose to 11.6 km altitude, and drifted ESE. Trace to minor amounts of ashfall were reported by the communities of False Pass, King Cove, Cold Bay, and Sand Point around 0700. Ash emissions continued at lower altitudes of 6-7.6 km altitude at 0820. Small explosions at the vent area continued to be detected in infrasound data and likely represented low-level eruptive activity near the vent. Due to the significant decrease in seismicity and ash emissions the ACC was lowered to Orange and the VAL to Watch at 1234. Radar data showed significant collapses of the crater that occurred on 25 September. Satellite data also showed significant hot, degassing pyroclastic and lahar deposits on all flanks, including more extensive flows on the ENE and WSW sections below two new collapse scarps. Following the significant activity during 24-25 September, only low-level activity was observed. Seismicity decreased notably near the end of the strong activity on 25 September and continued to decrease through the end of the month, though tremor and small earthquakes were still reported. No explosive activity was detected in infrasound data through 2 October. Gas-and-steam emissions rose to 3.7 km altitude, as reported by pilots and seen in satellite images. Satellite data from 26 September showed that significant collapses had occurred at the summit crater and hot, steaming deposits from pyroclastic flows and lahars were present on all the flanks, particularly to the ENE and WSW. A small ash cloud was visible in webcam images on 27 September, likely from a collapse at the summit cone. High elevated surface temperatures were observed in satellite imagery during 27-28 September, which were likely the result of hot deposits on the flanks erupted on 25 September. Minor steaming at the summit crater and from an area on the upper flanks was visible in webcam images on 28 September.
During October, explosion events continued between periods of low activity. Seismicity significantly increased starting at around 2100 on 2 October; around the same time satellite images showed an increase in surface temperatures consistent with lava fountaining. Small, hot avalanches of rock and lava descended an unspecified flank. In addition, a distinct increase in infrasound, seismicity, and lightning detections was followed by an ash plume that rose to 12.2 km altitude and drifted S and E at 0520 on 3 October, based on satellite images. Nighttime webcam images showed incandescence due to lava fountaining at the summit and pyroclastic flows descending the NE flank. AVO reported that a notable explosive eruption started at 0547 and lasted until 0900 on 3 October, which prompted a rise in the ACC to Red and the VAL to Warning. Subsequent ash plumes rose to 6-7.6 km altitude by 0931. At 1036 the ACC was lowered back to Orange and the VAL to Watch since both seismic and infrasound data quieted substantially and were slightly above background levels. Gas-and-steam emissions were observed at the summit, based on webcam images. Trace amounts of ashfall were observed in Cold Bay. Resuspended ash was present at several kilometers altitude near the volcano. During the afternoon, low-level ash plumes were visible at the flanks, which appeared to be largely generated by rock avalanches off the summit crater following the explosive activity. These ash plumes rose to 3 km altitude and drifted W. Trace amounts of ashfall were reported by observers in Cold Bay and Unalaska and flights to these communities were disrupted by the ash cloud. Satellite images taken after the eruption showed evidence of pyroclastic flows and lahar deposits in drainages 2 km down the SW flank and about 3.2 km down the NE flank, and continued erosion of the crater rim. Small explosion craters at the end of the pyroclastic flows on the NE flank were noted for the first time, which may have resulted from gas-and-steam explosions when hot deposits interact with underlying ice.
During 4 October seismicity, including frequent small earthquakes, remained elevated, but was gradually declining. Ash plumes were produced for over eight hours until around 1400 that rose to below 3.7 km altitude. These ash plumes were primarily generated off the sides of the volcano where hot rock avalanches from the crater rim had entered drainages to the SW and NE. Two explosion craters were observed at the base of the NE deposits about 3.2 km from the crater rim. Webcam images showed the explosion craters were a source of persistent ash emissions; occasional collapse events also generated ash. Seismicity remained elevated with sulfur dioxide emissions that had a daily average of more than 1,000 tons per day, and frequent small earthquakes through the end of the month. Frequent elevated surface temperatures were identified in satellite images and gas-and-steam plumes were observed in webcam images, although weather conditions occasionally prevented clear views of the summit. Emissions were robust during 14-16 October and were likely generated by the interaction of hot material and snow and ice. During the afternoon of 21 October a strong gas-and-steam plume rose to 3-4.6 km altitude and extended 40 km WSW, based on satellite images and reports from pilots. On 31 October the ACC was lowered to Yellow and the VAL was lowered to Advisory.
Activity in November was characterized by elevated seismicity with ongoing seismic tremor and small, low-frequency earthquakes, elevated surface temperatures, and gas-and-steam emissions. There was an increase in seismic and infrasound tremor amplitudes starting at 1940 on 2 November. As a result, the ACC was again raised to Orange and the VAL was increased to Watch, although ash was not identified in satellite data. An ash cloud rose to 6.1 km altitude and drifted W according to satellite data at 2000. By 0831 on 3 November ash emissions were no longer visible in satellite images. On 6 and 9 November air pressure sensors detected signals consistent with small explosions. Small explosions were detected in infrasound data consistent with weak Strombolian activity on 19 and 21 November. Seismicity started to decrease on 21 November. On 25 November gas-and-steam emissions were emitted from the vent as well as from a scarp on the NE side of the volcano near the summit. A gas-and-steam plume extended about 50 km SSE and was observed in satellite and webcam images on 26 November. On 28 November small explosions were observed in seismic and local infrasound data and gas-and-steam emissions were visible from the summit and from the upper NE collapse scarp based on webcam images. Possible small explosions were observed in infrasound data on 30 November. Weakly elevated surface temperatures and a persistent gas-and-steam plume from the summit and collapse scarps on the upper flanks. A passing aircraft reported the gas-and-steam plume rose to 3-3.4 km altitude on 30 November, but no significant ash emissions were detected.
Satellite data. MODIS thermal anomaly data provided through MIROVA (Middle InfraRed Observation of Volcanic Activity) showed a strong pulse of thermal activity beginning in July 2023 that continued through November 2023 (figure 48). This strong activity was due to Strombolian explosions and lava fountaining events at the summit crater. According to data from MODVOLC thermal alerts, a total of 101 hotspots were detected near the summit crater in July (11-14, 16-19, 23-24 and 26), August (4, 25-26, and 29), September (5, 12, and 17), and October (3, 4, and 8). Infrared satellite data showed large lava flows descending primarily the northern and SE flanks during the reporting period (figure 49). Sulfur dioxide plumes often exceeded two Dobson Units (DUs) and drifted in different directions throughout the reporting period, based on satellite data from the TROPOMI instrument on the Sentinel-5P satellite (figure 50).
Geologic Background. The symmetrical glacier-covered Shishaldin in the Aleutian Islands is the westernmost of three large stratovolcanoes in the eastern half of Unimak Island. The Aleuts named the volcano Sisquk, meaning "mountain which points the way when I am lost." Constructed atop an older glacially dissected edifice, it is largely basaltic in composition. Remnants of an older edifice are exposed on the W and NE sides at 1,500-1,800 m elevation. There are over two dozen pyroclastic cones on its NW flank, which is covered by massive aa lava flows. Frequent explosive activity, primarily consisting of Strombolian ash eruptions from the small summit crater, but sometimes producing lava flows, has been recorded since the 18th century. A steam plume often rises from the summit crater.
Information Contacts: Alaska Volcano Observatory (AVO), a cooperative program of a) U.S. Geological Survey, 4200 University Drive, Anchorage, AK 99508-4667 USA (URL: https://avo.alaska.edu/), b) Geophysical Institute, University of Alaska, PO Box 757320, Fairbanks, AK 99775-7320, USA, and c) Alaska Division of Geological & Geophysical Surveys, 794 University Ave., Suite 200, Fairbanks, AK 99709, USA (URL: http://dggs.alaska.gov/); MIROVA (Middle InfraRed Observation of Volcanic Activity), a collaborative project between the Universities of Turin and Florence (Italy) supported by the Centre for Volcanic Risk of the Italian Civil Protection Department (URL: http://www.mirovaweb.it/); Hawai'i Institute of Geophysics and Planetology (HIGP) - MODVOLC Thermal Alerts System, School of Ocean and Earth Science and Technology (SOEST), Univ. of Hawai'i, 2525 Correa Road, Honolulu, HI 96822, USA (URL: http://modis.higp.hawaii.edu/); NASA Global Sulfur Dioxide Monitoring Page, Atmospheric Chemistry and Dynamics Laboratory, NASA Goddard Space Flight Center (NASA/GSFC), 8800 Greenbelt Road, Goddard, Maryland, USA (URL: https://so2.gsfc.nasa.gov/); Copernicus Browser, Copernicus Data Space Ecosystem, European Space Agency (URL: https://dataspace.copernicus.eu/browser/).
Ioto
Japan
24.751°N, 141.289°E; summit elev. 169 m
All times are local (unless otherwise noted)
New eruption with discolored water, ejecta, and floating pumice during October-December 2023
Ioto (Iwo-jima), located about 1,200 km S of Tokyo, lies within a 9-km-wide submarine caldera along the Izu-Bonin-Mariana volcanic arc. Previous eruptions date back to 1889 and have consisted of dominantly phreatic explosions, pumice deposits during 2001, and discolored water. A submarine eruption during July through December 2022 was characterized by discolored water, pumice deposits, and gas emissions (BGVN 48:01). This report covers a new eruption during October through December 2023, which consisted of explosions, black ejecta, discolored water, and floating pumice, based on information from the Japan Meteorological Association (JMA), the Japan Coast Guard (JCG), and satellite data.
JMA reported that an eruption had been occurring offshore of Okinahama on the SE side of the island since 21 October, which was characterized by volcanic tremor, according to the Japan Maritime Self-Defense Force (JMSDF) Iwo Jima Air Base (figure 22). According to an 18 October satellite image a plume of discolored water at the site of this new eruption extended NE (figure 23). During an overflight conducted on 30 October, a vent was identified about 1 km off the coast of Okinahama. Observers recorded explosions every few minutes that ejected dark material about 20 m above the ocean and as high as 150 m. Ejecta from the vent formed a black-colored island about 100 m in diameter, according to observations conducted from the air by the Earthquake Research Institute of the University of Tokyo in cooperation with the Mainichi newspaper (figure 24). Occasionally, large boulders measuring more than several meters in size were also ejected. Observations from the Advanced Land Observing Satellite Daichi-2 and Sentinel-2 satellite images also confirmed the formation of this island (figure 23). Brown discolored water and floating pumice were present surrounding the island.
The eruption continued during November. During an overflight on 3 November observers photographed the island and noted that material was ejected 169 m high, according to a news source. Explosions gradually became shorter, and, by the 3rd, they occurred every few seconds; dark and incandescent material were ejected about 800 m above the vent. On 4 November eruptions were accompanied by explosive sounds. Floating, brown-colored pumice was present in the water surrounding the island. There was a brief increase in the number of volcanic earthquakes during 8-14 November and 24-25 November. The eruption temporarily paused during 9-11 November and by 12 November eruptions resumed to the W of the island. On 10 November dark brown-to-dark yellow-green discolored water and a small amount of black floating material was observed (figure 25). A small eruption was reported on 18 November off the NE coast of the island, accompanied by white gas-and-steam plumes (figure 23). Another pause was recorded during 17-19 November, which then resumed on 20 November and continued erupting intermittently. According to a field survey conducted by the National Institute for Disaster Prevention Science and Technology on 19 November, a 30-m diameter crater was visible on the NE coast where landslides, hot water, and gray volcanic ash containing clay have occurred and been distributed previously. Erupted blocks about 10 cm in diameter were distributed about 90-120 m from the crater. JCG made observations during an overflight on 23 November and reported a phreatomagmatic eruption. Explosions at the main vent generated dark gas-and-ash plumes that rose to 200 m altitude and ejected large blocks that landed on the island and in the ocean (figure 26). Discolored water also surrounded the island. The size of the new island had grown to 450 m N-S x 200 m E-W by 23 November, according to JCG.
The eruption continued through 11 December, followed by a brief pause in activity, which then resumed on 31 December, according to JMA. Intermittent explosions produced 100-m-high black plumes at intervals of several minutes to 30 minutes during 1-10 December. Overflights were conducted on 4 and 15 December and reported that the water surrounding the new island was discolored to dark brown-to-dark yellow-green (figure 27). No floating material was reported during this time. In comparison to the observations made on 23 November, the new land had extended N and part of it had eroded away. In addition, analysis by the Geospatial Information Authority of Japan using SAR data from Daichi-2 also confirmed that the area of the new island continued to decrease between 4 and 15 December. Ejected material combined with wave erosion transformed the island into a “J” shape, 500-m-long and with the curved part about 200 m offshore of Ioto. The island was covered with brown ash and blocks, and the surrounding water was discolored to greenish-brown and contained an area of floating pumice. JCG reported from an overflight on 4 December that volcanic ash-like material found around the S vent on the NE part of the island was newly deposited since 10 November (figure 28). By 15 December the N part of the “J” shaped island had separated and migrated N, connecting to the Okinahama coast and the curved part of the “J” had eroded into two smaller islands (figure 27).
References. Ukawa, M., Fujita, E., Kobayashi, T., 2002, Recent volcanic activity of Iwo Jima and the 2001 eruption, Monthly Chikyu, Extra No. 39, 157-164.
Geologic Background. Ioto, in the Volcano Islands of Japan, lies within a 9-km-wide submarine caldera. The volcano is also known as Ogasawara-Iojima to distinguish it from several other "Sulfur Island" volcanoes in Japan. The triangular, low-elevation, 8-km-long island narrows toward its SW tip and has produced trachyandesitic and trachytic rocks that are more alkalic than those of other volcanoes in this arc. The island has undergone uplift for at least the past 700 years, accompanying resurgent doming of the caldera; a shoreline landed upon by Captain Cook's surveying crew in 1779 is now 40 m above sea level. The Motoyama plateau on the NE half of the island consists of submarine tuffs overlain by coral deposits and forms the island's high point. Many fumaroles are oriented along a NE-SW zone cutting through Motoyama. Numerous recorded phreatic eruptions, many from vents on the W and NW sides of the island, have accompanied the uplift.
Information Contacts: Japan Meteorological Agency (JMA), 1-3-4 Otemachi, Chiyoda-ku, Tokyo 100-8122, Japan (URL: http://www.jma.go.jp/jma/indexe.html); Japan Coast Guard (JCG) Volcano Database, Hydrographic and Oceanographic Department, 3-1-1, Kasumigaseki, Chiyoda-ku, Tokyo 100-8932, Japan (URL: https://www1.kaiho.mlit.go.jp/GIJUTSUKOKUSAI/kaiikiDB/kaiyo22-2.htm); Copernicus Browser, Copernicus Data Space Ecosystem, European Space Agency (URL: https://dataspace.copernicus.eu/browser/); Asahi, 5-3-2, Tsukiji, Chuo Ward, Tokyo, 104-8011, Japan (URL: https://www.asahi.com/ajw/articles/15048458).
Purace (Colombia) — December 2023 Cite this Report
Purace
Colombia
2.3095°N, 76.3948°W; summit elev. 4650 m
All times are local (unless otherwise noted)
Gas-and-ash emission on 16 November 2023
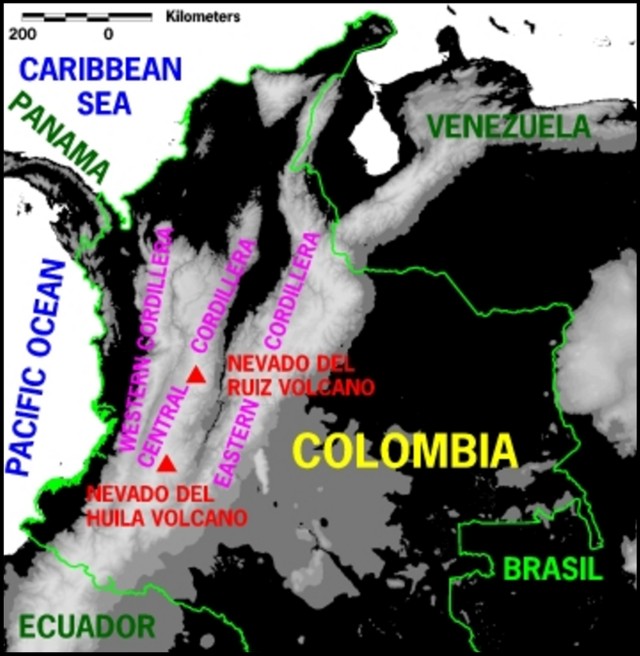
Puracé, located in Colombia, is a stratovolcano that contains a 500-m-wide summit crater. It is part of the Los Coconucos volcanic chain that is a NW-SE trending group of seven cones and craters. The most recent eruption occurred during March 2022 that was characterized by frequent seismicity and gas-and-steam emissions (BGVN 47:06). This report covers a brief eruption during November 2023 based on monthly reports from the Popayán Observatory, part of the Servicio Geologico Colombiano (SGC).
Activity during November 2022 through November 2023 primarily consisted of seismicity: VT-type events, LP-type events, HB-type events, and TR-type events (table 4). Maximum sulfur dioxide values were measured weekly and ranged from 259-5,854 tons per day (t/d) during November 2022 through April 2023. White gas-and-steam emissions were also occasionally reported.
SGC issued a report on 25 October that noted a significant increase in the number of earthquakes associated with rock fracturing. These earthquakes were located SE of the crater between Puracé and Piocollo at depths of 1-4 km. There were no reported variations in sulfur dioxide values, but SGC noted high carbon dioxide values, compared to those recorded in the first half of 2023.
SGC reported that at 1929 on 16 November the seismic network detected a signal that was possibly associated with a gas-and-ash emission, though it was not confirmed in webcam images due to limited visibility. On 17 November an observer confirmed ash deposits on the N flank. Webcam images showed an increase in degassing both inside the crater and from the NW flank, rising 700 m above the crater.
Table 4. Seismicity at Puracé during November 2022-November 2023. Volcano-tectonic (VT), long-period (LP), hybrid (HB), and tremor (TR) events are reported each month. Courtesy of SGC.
| Month |
Volcano-tectonic |
Long-period |
Hybrid |
Tremor |
| Nov 2022 |
429 |
2,023 |
5 |
831 |
| Dec 2022 |
423 |
1,390 |
9 |
834 |
| Jan 2023 |
719 |
1,622 |
0 |
957 |
| Feb 2023 |
598 |
1,701 |
2 |
1,124 |
| Mar 2023 |
331 |
2,408 |
147 |
607 |
| Apr 2023 |
614 |
4,427 |
33 |
148 |
| May 2023 |
620 |
3,717 |
170 |
109 |
| Jun 2023 |
467 |
3,293 |
86 |
148 |
| Jul 2023 |
1,116 |
5,809 |
183 |
542 |
| Aug 2023 |
692 |
2,927 |
94 |
321 |
| Sep 2023 |
887 |
1,505 |
82 |
848 |
| Oct 2023 |
2,373 |
2,949 |
135 |
692 |
| Nov 2023 |
1,212 |
2,302 |
69 |
293 |
Geologic Background. Puracé is an active andesitic volcano with a 600-m-diameter summit crater at the NW end of the Los Coconucos Volcanic Chain. This volcanic complex includes nine composite and five monogenetic volcanoes, extending from the Puracé crater more than 6 km SE to the summit of Pan de Azúcar stratovolcano. The dacitic massif which the complex is built on extends about 13 km NW-SE and 10 km NE-SW. Frequent small to moderate explosive eruptions reported since 1816 CE have modified the morphology of the summit crater, with the largest eruptions in 1849, 1869, and 1885.
Information Contacts: Servicio Geologico Colombiano (SGC), Diagonal 53 No. 34-53 - Bogotá D.C., Colombia (URL: https://www.sgc.gov.co/volcanes).
Etna
Italy
37.748°N, 14.999°E; summit elev. 3357 m
All times are local (unless otherwise noted)
Strombolian explosions, lava fountains, and lava flows during July-August 2023
Etna, located on the Italian island of Sicily, has had documented eruptions dating back to 1500 BCE. Activity typically originates from multiple cones at the summit, where several craters have formed and evolved. The currently active craters are Northeast Crater (NEC), Voragine (VOR), and Bocca Nuova (BN), and the Southeast Crater (SEC); VOR and BN were previously referred to as the “Central Crater”. The original Southeast crater formed in 1978, and a second eruptive site that opened on its SE flank in 2011 was named the New Southeast Crater (NSEC). Another eruptive site between the SEC and NSEC developed during early 2017 and was referred to as the "cono della sella" (saddle cone). The current eruption period began in November 2022 and has been characterized by intermittent Strombolian activity, lava flows, and ash plumes (BGVN 48:08). This report updates activity during July through October 2023, which includes primarily gas-and-steam emissions; during July and August Strombolian explosions, lava fountains, and lava flows were reported, based on weekly and special reports by the Osservatorio Etneo (OE), part of the Catania Branch of Italy's Istituo Nazionale di Geofisica e Vulcanologica (INGV) and satellite data.
Variable fumarolic degassing was reported at all summit craters (BN, VOR, NEC, and SEC) throughout the entire reporting period (table 15). The MIROVA (Middle InfraRed Observation of Volcanic Activity) volcano hotspot detection system based on the analysis of MODIS data showed frequent low-to-moderate power thermal anomalies during the reporting period (figure 399). During mid-August there was a pulse in activity that showed an increase in the power of the anomalies due to Strombolian activity, lava fountains, and lava flows. Infrared satellite imagery captured strong thermal anomalies at the central and southeast summit crater areas (figure 400). Accompanying thermal activity were occasional sulfur dioxide plumes that exceeded 2 Dobson Units (DUs) recorded by the TROPOMI instrument on the Sentinel-5P satellite (figure 401).
Table 15. Summary of activity at the four primary crater areas at the summit of Etna during July-October 2023. Information is from INGV weekly reports.
| Month |
Bocca Nuova (BN) |
Voragine (VOR) |
Northeast Crater (NEC) |
Southeast Crater (SEC) |
| Jul 2023 |
Continuous degassing. |
No observations. |
Weak gas emissions. |
Continuous degassing. Sporadic and weak-to-moderate ash emissions. Strombolian explosions. |
| Aug 2023 |
Continuous degassing. |
No observations. |
No observations. |
Continuous degassing. Occasional ash emissions. Strombolian activity, lava fountaining, and lava flows. |
| Sep 2023 |
Variable degassing. Crater incandescence. |
Weak fumarolic activity. |
Weak fumarolic activity. |
Variable degassing. |
| Oct 2023 |
Continuous degassing. |
Weak fumarolic activity. |
Weak fumarolic activity. |
Continuous degassing. |
Activity during July and August was relatively low and mainly consisted of degassing at the summit craters, particularly at SEC and BN. Cloudy weather prevented clear views of the summit during early July. During the night of 2 July some crater incandescence was visible at SEC. Explosive activity resumed at SEC during 9-10 July, which was characterized by sporadic and weak ash emissions that rapidly dispersed in the summit area (figure 402). INGV reported moderate Strombolian activity began at 2034 on 14 July and was confined to the inside of the crater and fed by a vent located in the E part of SEC. An ash emission was detected at 2037. A new vent opened on 15 July in the SE part of BN and began to produce continuous gas-and-steam emissions. During an inspection carried out on 28 July pulsating degassing, along with audible booms, were reported at two active vents in BN. Vigorous gas-and-steam emissions intermittently generated rings. On rare occasions, fine, reddish ash was emitted from BN1 and resuspended by the gas-and-steam emissions.
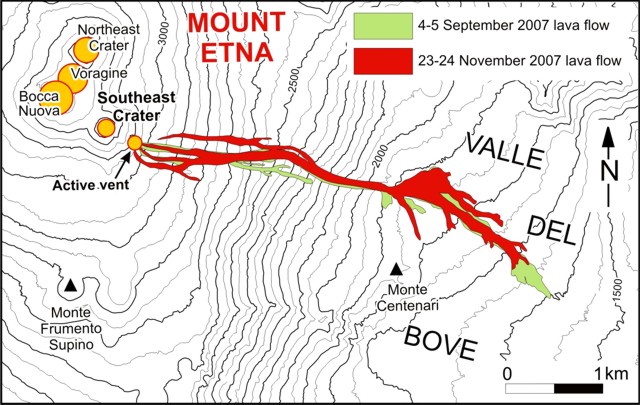
Around 2000 on 13 August INGV reported a sudden increase in volcanic tremor amplitude. Significant infrasonic activity coincided with the tremor increase. Incandescent flashes were visible through the cloud cover in webcam images of SEC (figure 403). Strombolian activity at SEC began to gradually intensify starting at 2040 as seismicity continued to increase. The Aviation Color Code (ACC) was raised to Yellow (the second lowest-level on a four-color scale) at 2126 and then to Orange (the second highest-level on a four-color scale) at 2129 due to above-background activity. The activity rapidly transitioned from Strombolian activity to lava fountains around 2333 that rose 300-400 m above the crater (figure 403). Activity was initially focused on the E vent of the crater, but then the vent located above the S flank of the cone also became active. A lava flow from this vent traveled SW into the drainage created on 10 February 2022, overlapping with previous flows from 10 and 21 February 2022 and 21 May 2023, moving between Monte Barbagallo and Monte Frumento Supino (figure 404). The lava flow was 350 m long, oriented NNE-SSW, and descended to an elevation of 2.8 km. Flows covered an area of 300,000 m2 and had an estimated volume of 900,000 m3. The ACC was raised to Red at 2241 based on strong explosive activity and ashfall in Rifugio Sapienza-Piano Vetore at 1.7 km elevation on the S flank. INGV reported that pyroclastic flows accompanied this activity.
Activity peaked between 0240 and 0330 on 14 August, when roughly 5-6 vents erupted lava fountains from the E to SW flank of SEC. The easternmost vents produced lava fountains that ejected material strongly to the E, which caused heavy fallout of incandescent pyroclastic material on the underlying flank, triggering small pyroclastic flows. This event was also accompanied by lightning both in the ash column and in the ash clouds that were generated by the pyroclastic flows. A fracture characterized by a series of collapse craters (pit craters) opened on the upper SW flank of SEC. An ash cloud rose a few kilometers above the crater and drifted S, causing ash and lapilli falls in Rifugio Sapienza and expanding toward Nicolosi, Mascalucia, Catania, and up to Syracuse. Ashfall resulted in operational problems at the Catania airport (50 km S), which lasted from 0238 until 2000. By 0420 the volcanic tremor amplitude values declined to background levels. After 0500 activity sharply decreased, although the ash cloud remained for several hours and drifted S. By late morning, activity had completely stopped. The ACC was lowered to Orange as volcanic ash was confined to the summit area. Sporadic, minor ash emissions continued throughout the day. At 1415 the ACC was lowered to Yellow and then to Green at 1417.
During the night of 14-15 August only occasional flashes were observed, which were more intense during avalanches of material inside the eruptive vents. Small explosions were detected at SEC at 2346 on 14 August and at 0900 on 26 August that each produced ash clouds which rapidly dispersed into the atmosphere (figure 405). According to a webcam image, an explosive event detected at 2344 at SEC generated a modest ash cloud that was rapidly dispersed by winds. The ACC was raised to Yellow at 2355 on 14 August due to increasing unrest and was lowered to Green at 0954 on 15 August.
Activity during September and October was relatively low and mainly characterized by variable degassing from BN and SEC. Intense, continuous, and pulsating degassing was accompanied by roaring sounds and flashes of incandescence at BN both from BN1 and the new pit crater that formed during late July (figure 406). The degassing from the new pit crater sometimes emitted vapor rings. Cloudy weather during 6-8 September prevented observations of the summit craters .
Geologic Background. Mount Etna, towering above Catania on the island of Sicily, has one of the world's longest documented records of volcanism, dating back to 1500 BCE. Historical lava flows of basaltic composition cover much of the surface of this massive volcano, whose edifice is the highest and most voluminous in Italy. The Mongibello stratovolcano, truncated by several small calderas, was constructed during the late Pleistocene and Holocene over an older shield volcano. The most prominent morphological feature of Etna is the Valle del Bove, a 5 x 10 km caldera open to the east. Two styles of eruptive activity typically occur, sometimes simultaneously. Persistent explosive eruptions, sometimes with minor lava emissions, take place from one or more summit craters. Flank vents, typically with higher effusion rates, are less frequently active and originate from fissures that open progressively downward from near the summit (usually accompanied by Strombolian eruptions at the upper end). Cinder cones are commonly constructed over the vents of lower-flank lava flows. Lava flows extend to the foot of the volcano on all sides and have reached the sea over a broad area on the SE flank.
Information Contacts: Sezione di Catania - Osservatorio Etneo, Istituto Nazionale di Geofisica e Vulcanologia (INGV), Sezione di Catania, Piazza Roma 2, 95123 Catania, Italy (URL: http://www.ct.ingv.it/it/); MIROVA (Middle InfraRed Observation of Volcanic Activity), a collaborative project between the Universities of Turin and Florence (Italy) supported by the Centre for Volcanic Risk of the Italian Civil Protection Department (URL: http://www.mirovaweb.it/); NASA Global Sulfur Dioxide Monitoring Page, Atmospheric Chemistry and Dynamics Laboratory, NASA Goddard Space Flight Center (NASA/GSFC), 8800 Greenbelt Road, Goddard MD 20771, USA (URL: https://so2.gsfc.nasa.gov/); Copernicus Browser, Copernicus Data Space Ecosystem, European Space Agency (URL: https://dataspace.copernicus.eu/browser/).
Suwanosejima (Japan) — December 2023 Cite this Report
Suwanosejima
Japan
29.638°N, 129.714°E; summit elev. 796 m
All times are local (unless otherwise noted)
Eruption plumes, crater incandescence, and occasional explosions during July-October 2023
Suwanosejima is an 8-km-long island that consists of a stratovolcano and two active summit craters, located in the northern Ryukyu Islands, Japan. Volcanism over the past century has been characterized by Strombolian explosions, ash plumes, and ashfall. The current eruption began in October 2004 and has more recently consisted of frequent eruption plumes, explosions, and incandescent ejecta (BGVN 48:07). This report covers similar activity of ash plumes, explosions, and crater incandescence during July through October 2023 using monthly reports from the Japan Meteorological Agency (JMA) and satellite data.
Thermal activity during the reporting period was relatively low; only one low-power thermal anomaly was detected during mid-July and one during early August, based on a MIROVA (Middle InfraRed Observation of Volcanic Activity) Log Radiative Power graph of the MODIS thermal anomaly data. On two clear weather days, a thermal anomaly was visible in infrared satellite images (figure 81).
Low-level activity was reported at the Otake crater during July and no explosions were detected. Eruption plumes rose as high as 1.8 km above the crater. On 13 July an ash plume rose 1.7 km above the crater rim, based on a webcam image. During the night of the 28th crater incandescence was visible in a webcam image. An eruptive event reported on 31 July produced an eruption plume that rose 2.1 km above the crater. Seismicity consisted of 11 volcanic earthquakes on the W flank, the number of which had decreased compared to June (28) and 68 volcanic earthquakes near the Otake crater, which had decreased from 722 in the previous month. According to observations conducted by the University of Tokyo Graduate School of Science, Kyoto University Disaster Prevention Research Institute, Toshima Village, and JMA, the amount of sulfur dioxide emissions released during the month was 400-800 tons per day (t/d).
Eruptive activity in the Otake crater continued during August and no explosions were reported. An eruptive event produced a plume that rose 1 km above the crater at 1447 on 12 August. Subsequent eruptive events were recorded at 0911 on 16 August, at 1303 on 20 August, and at 0317 on 21 August, which produced ash plumes that rose 1-1.1 km above the crater and drifted SE, SW, and W. On 22 August an ash plume was captured in a webcam image rising 1.4 km above the crater (figure 82). Multiple eruptive events were detected on 25 August at 0544, 0742, 0824, 1424, and 1704, which generated ash plumes that rose 1.1-1.2 km above the crater and drifted NE, W, and SW. On 28 August a small amount of ashfall was observed as far as 1.5 km from the crater. There were 17 volcanic earthquakes recorded on the W flank of the volcano and 79 recorded at the Otake crater during the month. The amount of sulfur dioxide emissions released during the month was 400-800 t/d.
Activity continued at the Otake crater during September. Occasionally, nighttime crater incandescence was observed in webcam images and ashfall was reported. An eruptive event at 1949 on 4 September produced an ash plume that rose 1 km above the crater and drifted SW. On 9 September several eruption events were detected at 0221, 0301, and 0333, which produced ash plumes that rose 1.1-1.4 km above the crater rim and drifted W; continuous ash emissions during 0404-0740 rose to a maximum height of 2 km above the crater rim (figure 83). More eruptive events were reported at 1437 on 10 September, at 0319 on 11 September, and at 0511 and 1228 on 15 September, which generated ash plumes that rose 1-1.8 km above the crater. During 25, 27, and 30 September, ash plumes rose as high as 1.3 km above the crater rim. JMA reported that large blocks were ejected as far as 300 m from the center of the crater. There were 18 volcanic earthquakes detected beneath the W flank and 82 volcanic earthquakes detected near the Otake crater. The amount of sulfur dioxide released during the month ranged from 600 to 1,600 t/d.
Activity during early-to-mid-October consisted of occasional explosions, a total number of 13, and ash plumes that rose as high as 1.9 km above the Otake crater rim on 29 October (figure 84). These explosions are the first to have occurred since June 2023. Continuous ash emissions were reported during 0510-0555 on 1 October. Explosions were recorded at 0304, 2141, and 2359 on 2 October, at 0112 on 3 October, and at 1326 on 6 October, which produced ash plumes that rose as high as 1 km above the crater rim and drifted SW and W. An explosion was noted at 0428 on 3 October, but emission details were unknown. A total of eight explosions were recorded by the seismic network at 1522 on 14 October, at 0337, 0433, 0555, 1008, and 1539 on 15 October, and at 0454 and 0517 on 16 October. Ash plumes from these explosions rose as high as 900 m above the crater and drifted SE. Eruptive events during 25-27 and 29-30 October generated plumes that rose as high as 1.9 km above the crater and drifted SE, S, and SW. Ash was deposited in Toshima village (3.5 km SSW). Eruptive activity occasionally ejected large volcanic blocks as far as 600 m from the crater. Nighttime crater incandescence was visible in webcams. Intermittent ashfall was reported as far as 1.5 km from the crater. There were 43 volcanic earthquakes detected on the W flank during the month, and 184 volcanic earthquakes detected near the Otake crater. The amount of sulfur dioxide emitted ranged between 400 and 900 t/d.
Geologic Background. The 8-km-long island of Suwanosejima in the northern Ryukyu Islands consists of an andesitic stratovolcano with two active summit craters. The summit is truncated by a large breached crater extending to the sea on the E flank that was formed by edifice collapse. One of Japan's most frequently active volcanoes, it was in a state of intermittent Strombolian activity from Otake, the NE summit crater, between 1949 and 1996, after which periods of inactivity lengthened. The largest recorded eruption took place in 1813-14, when thick scoria deposits covered residential areas, and the SW crater produced two lava flows that reached the western coast. At the end of the eruption the summit of Otake collapsed, forming a large debris avalanche and creating an open collapse scarp extending to the eastern coast. The island remained uninhabited for about 70 years after the 1813-1814 eruption. Lava flows reached the eastern coast of the island in 1884. Only about 50 people live on the island.
Information Contacts: Japan Meteorological Agency (JMA), 1-3-4 Otemachi, Chiyoda-ku, Tokyo 100-8122, Japan (URL: http://www.jma.go.jp/jma/indexe.html); MIROVA (Middle InfraRed Observation of Volcanic Activity), a collaborative project between the Universities of Turin and Florence (Italy) supported by the Centre for Volcanic Risk of the Italian Civil Protection Department (URL: http://www.mirovaweb.it/); Hawai'i Institute of Geophysics and Planetology (HIGP) - MODVOLC Thermal Alerts System, School of Ocean and Earth Science and Technology (SOEST), Univ. of Hawai'i, 2525 Correa Road, Honolulu, HI 96822, USA (URL: http://modis.higp.hawaii.edu/); Copernicus Browser, Copernicus Data Space Ecosystem, European Space Agency (URL: https://dataspace.copernicus.eu/browser/).
Aira
Japan
31.5772°N, 130.6589°E; summit elev. 1117 m
All times are local (unless otherwise noted)
Explosions, ash plumes, ash fall, and crater incandescence during July-October 2023
Aira caldera, located in the northern half of Kagoshima Bay, Japan, contains the post-caldera Sakurajima volcano. Eruptions typically originate from the Minamidake crater, and since the 8th century, ash deposits have been recorded in the city of Kagoshima (10 km W), one of Kyushu’s largest cities. The Minamidake summit cone and crater has had persistent activity since 1955; the Showa crater on the E flank has also been intermittently active since 2006. The current eruption period began during March 2017 and has recently been characterized by intermittent explosions, eruption plumes, and ashfall (BGVN 48:07). This report updates activity during July through October 2023 and describes explosive events, ash plumes, nighttime crater incandescence, and ashfall, according to monthly activity reports from the Japan Meteorological Agency (JMA) and satellite data.
Thermal activity remained at low levels during this reporting period, according to the MIROVA (Middle InfraRed Observation of Volcanic Activity) system (figure 149). There was a slight increase in the number of anomalies during September through October. Occasional thermal anomalies were visible in infrared satellite images mainly at the Minamidake crater (Vent A is located to the left and Vent B is located to the right) (figure 150).
Table 30. Number of monthly explosive events, days of ashfall, area of ash covered, and sulfur dioxide emissions from Sakurajima’s Minamidake crater at Aira during July-October 2023. Note that smaller ash events are not listed. Ashfall days were measured at Kagoshima Local Meteorological Observatory and ashfall amounts represent material covering all the Kagoshima Prefecture. Data courtesy of JMA monthly reports.
| Month |
Explosive events |
Days of ashfall |
Ashfall amount (g/m2) |
SO2 emissions (tons/day) |
| Jul 2023 |
3 |
0 |
0 |
1,600-3,200 |
| Aug 2023 |
3 |
10 |
7 |
1,800-3,300 |
| Sep 2023 |
3 |
7 |
3 |
1,600-2,300 |
| Oct 2023 |
33 |
8 |
61 |
2,200-4,200 |
JMA reported that during July, there were eight eruptions, three of which were explosion events in the Showa crater. Large blocks were ejected as far as 600 m from the Showa crater. Very small eruptions were occasionally reported at the Minamidake crater. Nighttime incandescence was observed in both the Showa and Minamidake crater. Explosions were reported on 16 July at 2314 and on 17 July at 1224 and at 1232 (figure 151). Resulting eruption plumes rose 700-2,500 m above the crater and drifted N. On 23 July the number of volcanic earthquakes on the SW flank of the volcano increased. A strong Mw 3.1 volcanic earthquake was detected at 1054 on 26 July. The number of earthquakes recorded throughout the month was 545, which markedly increased from 73 in June. No ashfall was observed at the Kagoshima Regional Meteorological Observatory during July. According to a field survey conducted during the month, the daily amount of sulfur dioxide emissions was 1,600-3,200 tons per day (t/d).
There were three eruptions reported at the Minamidake crater during August, each of which were explosive. The explosions occurred on 9 August at 0345, on 13 August at 2205, and on 31 August at 0640, which generated ash plumes that rose 800-2,000 m above the crater and drifted W. There were two eruptions detected at Showa crater; on 4 August at 2150 ejecta traveled 800 m from the Showa crater and associated eruption plumes rose 2.3 km above the crater. The explosion at 2205 on 13 August generated an ash plume that rose 2 km above the crater and was accompanied by large blocks that were ejected 600 m from the Minamidake crater (figure 152). Nighttime crater incandescence was visible in a high-sensitivity surveillance camera at both craters. Seismicity consisted of 163 volcanic earthquakes, 84 of which were detected on the SW flank. According to the Kagoshima Regional Meteorological Observatory there was a total of 7 g/m2 of ashfall over the course of 10 days during the month. According to a field survey, the daily amount of sulfur dioxide emitted was 1,800-3,300 t/d.
During September, four eruptions were reported, three of which were explosion events. These events occurred at 1512 on 9 September, at 0018 on 11 September, and at 2211 on 13 September. Resulting ash plumes generally rose 800-1,100 m above the crater. An explosion produced an ash plume at 2211 on 13 September that rose as high as 1.7 km above the crater. Large volcanic blocks were ejected 600 m from the Minamidake crater. Smaller eruptions were occasionally observed at the Showa crater. Nighttime crater incandescence was visible at the Minamidake crater. Seismicity was characterized by 68 volcanic earthquakes, 28 of which were detected beneath the SW flank. According to the Kagoshima Regional Meteorological Observatory there was a total of 3 g/m2 of ashfall over the course of seven days during the month. A field survey reported that the daily amount of sulfur dioxide emitted was 1,600-2,300 t/d.
Eruptive activity during October consisted of 69 eruptions, 33 of which were described as explosive. These explosions occurred during 4 and 11-21 October and generated ash plumes that rose 500-3,600 m above the crater and drifted S, E, SE, and N. On 19 October at 1648 an explosion generated an ash plume that rose 3.6 km above the crater (figure 153). No eruptions were reported in the Showa crater; white gas-and-steam emissions rose 100 m above the crater from a vent on the N flank. Nighttime incandescence was observed at the Minamidake crater. On 24 October an eruption was reported from 0346 through 0430, which included an ash plume that rose 3.4 km above the crater. Ejected blocks traveled 1.2 km from the Minamidake crater. Following this eruption, small amounts of ashfall were observed from Arimura (4.5 km SE) and a varying amount in Kurokami (4 km E) (figure 154). The number of recorded volcanic earthquakes during the month was 190, of which 14 were located beneath the SW flank. Approximately 61 g/m2 of ashfall was reported over eight days of the month. According to a field survey, the daily amount of sulfur dioxide emitted was 2,200-4,200 t/d.
Geologic Background. The Aira caldera in the northern half of Kagoshima Bay contains the post-caldera Sakurajima volcano, one of Japan's most active. Eruption of the voluminous Ito pyroclastic flow accompanied formation of the 17 x 23 km caldera about 22,000 years ago. The smaller Wakamiko caldera was formed during the early Holocene in the NE corner of the caldera, along with several post-caldera cones. The construction of Sakurajima began about 13,000 years ago on the southern rim and built an island that was joined to the Osumi Peninsula during the major explosive and effusive eruption of 1914. Activity at the Kitadake summit cone ended about 4,850 years ago, after which eruptions took place at Minamidake. Frequent eruptions since the 8th century have deposited ash on the city of Kagoshima, located across Kagoshima Bay only 8 km from the summit. The largest recorded eruption took place during 1471-76.
Information Contacts: Japan Meteorological Agency (JMA), 1-3-4 Otemachi, Chiyoda-ku, Tokyo 100-8122, Japan (URL: http://www.jma.go.jp/jma/indexe.html); MIROVA (Middle InfraRed Observation of Volcanic Activity), a collaborative project between the Universities of Turin and Florence (Italy) supported by the Centre for Volcanic Risk of the Italian Civil Protection Department (URL: http://www.mirovaweb.it/); Copernicus Browser, Copernicus Data Space Ecosystem, European Space Agency (URL: https://dataspace.copernicus.eu/browser/).
Nishinoshima (Japan) — November 2023 Cite this Report
Nishinoshima
Japan
27.247°N, 140.874°E; summit elev. 100 m
All times are local (unless otherwise noted)
Gray emissions during October 2023
Nishinoshima is a small island in the Ogasawara Arc, about 1,000 km S of Tokyo, Japan. It contains prominent submarine peaks to the S, W, and NE. Recorded eruptions date back to 1973, with the current eruption period beginning in October 2022. Eruption plumes and fumarolic activity characterize recent activity (BGVN 48:10). This report covers the end of the eruption for September through October 2023, based on information from monthly reports of the Japan Meteorological Agency (JMA) monthly reports, and satellite data.
No eruptive activity was reported during September 2023, although JMA noted that the surface temperature was slightly elevated compared to the surrounding area since early March 2023. The Japan Coast Guard (JCG) conducted an overflight on 20 September and reported white gas-and-steam plumes rising 3 km above the central crater of the pyroclastic cone, as well as multiple white gas-and-steam emissions emanating from the N, E, and S flanks of the crater to the coastline. In addition, dark reddish brown-to-green discolored water was distributed around almost the entire circumference of the island.
Similar low-level activity was reported during October. Multiple white gas-and-steam emissions rose from the N, E, and S flanks of the central crater of the pyroclastic cone and along the coastline; these emissions were more intense compared to the previous overflight observations. Dark reddish brown-to-green discolored water remained visible around the circumference of the island. On 4 October aerial observations by JCG showed a small eruption consisting of continuous gas-and-steam emissions emanating from the central crater, with gray emissions rising to 1.5 km altitude (figure 129). According to observations from the marine weather observation vessel Keifu Maru on 26 October, white gas-and-steam emissions persisted from the center of the pyroclastic cone, as well as from the NW, SW, and SE coasts of the island for about five minutes. Slightly discolored water was visible up to about 1 km.
Frequent low-to-moderate power thermal anomalies were recorded in the MIROVA graph (Middle InfraRed Observation of Volcanic Activity) during September (figure 130). Occasional anomalies were detected during October, and fewer during November through December. A thermal anomaly was visible in the crater using infrared satellite imagery on 6, 8, 11, 16, 18, 21, and 23 September and 8, 13, 21, 26, and 28 October (figure 131).
Geologic Background. The small island of Nishinoshima was enlarged when several new islands coalesced during an eruption in 1973-74. Multiple eruptions that began in 2013 completely covered the previous exposed surface and continued to enlarge the island. The island is the summit of a massive submarine volcano that has prominent peaks to the S, W, and NE. The summit of the southern cone rises to within 214 m of the ocean surface 9 km SSE.
Information Contacts: Japan Meteorological Agency (JMA), 1-3-4 Otemachi, Chiyoda-ku, Tokyo 100-8122, Japan (URL: http://www.jma.go.jp/jma/indexe.html); MIROVA (Middle InfraRed Observation of Volcanic Activity), a collaborative project between the Universities of Turin and Florence (Italy) supported by the Centre for Volcanic Risk of the Italian Civil Protection Department (URL: http://www.mirovaweb.it/); Copernicus Browser, Copernicus Data Space Ecosystem, European Space Agency (URL: https://dataspace.copernicus.eu/browser/).
Kilauea (United States) — October 2023 Cite this Report
Kilauea
United States
19.421°N, 155.287°W; summit elev. 1222 m
All times are local (unless otherwise noted)
Strong lava fountains, lava flows, and spatter at Halema’uma’u during January-September 2023
Kīlauea is on the island of Hawai’i and overlaps the E flank of the Mauna Loa volcano. Its East Rift Zone (ERZ) has been intermittently active for at least 2,000 years. An extended eruption period began in January 1983 and was characterized by open lava lakes and lava flows from the summit caldera and the East Rift Zone. During May 2018 magma migrated into the Lower East Rift Zone (LERZ) and opened 24 fissures along a 6-km-long NE-trending fracture zone that produced lava flows traveling in multiple directions. As lava emerged from the fissures, the lava lake at Halema'uma'u drained and explosions sent ash plumes to several kilometers altitude (BGVN 43:10).
The current eruption period started during September 2021 and has been characterized by low-level lava effusions in the active Halema’uma’u lava lake (BGVN 48:01). This report covers three notable eruption periods during February, June, and September 2023 consisting of lava fountaining, lava flows, and spatter during January through September 2023 using information from daily reports, volcanic activity notices, and abundant photo, map, and video data from the US Geological Survey's (USGS) Hawaiian Volcano Observatory (HVO).
Activity during January 2023. Small earthquake swarms were recorded on 2 January 2023; increased seismicity and changes in the pattern of deformation were noted on the morning of 5 January. At around 1500 both the rate of deformation and seismicity drastically increased, which suggested magma movement toward the surface. HVO raised the Volcano Alert Level (VAL) to Watch (the second highest level on a four-level scale) and the Aviation Color Code (ACC) to Orange (the second highest color on a four-color scale) at 1520.
Multiple lava fountains and lava effusions from vents in the central eastern portion of the Halema’uma’u crater began on 5 January around 0434; activity was confined to the eastern half of the crater and within the basin of the western half of the crater, which was the focus of the eruption in 2021-2022 (figure 525). Incandescence was visible in webcam images at 1634 on 5 January, prompting HVO to raise the VAL to Warning (the highest level on a four-level scale) and the ACC to Red (the highest color on a four-color scale). Lava fountains initially rose as high as 50 m above the vent at the onset of the eruption (figure 526) but then declined to a more consistent 5-6 m height in the proceeding days. By 1930 that same day, lava had covered most of the crater floor (an area of about 1,200,000 m2) and the lava lake had a depth of 10 m. A higher-elevation island that formed during the initial phase of the December 2020 eruption remained exposed, appearing darker in images, along with a ring of older lava around the lava lake that was active prior to December 2022. Overnight during 5-6 January the lava fountains continued to rise 5 m high, and the lava effusion rate had slowed.
On 6 January at 0815 HVO lowered the VAL to Watch and the ACC to Orange due to the declining effusion rates. Sulfur dioxide emission rates ranged from 3,000-12,500 tonnes per day (t/d), the highest value of which was recorded on 6 January. Lava continued to erupt from the vents during 6-8 January, although the footprint of the active area had shrunk; a similar progression has been commonly observed during the early stages of recent eruptions at Halema’uma’u. On 9 January HVO reported one dominant lava fountain rising 6-7 m high in the E half of the crater. Lava flows built up the margins of the lake, causing the lake to be perched. On 10 January the eastern lava lake had an area of approximately 120,000 m2 that increased to 250,000 m2 by 17 January. During 13-31 January several small overflows occurred along the margins of the E lake. A smaller area of lava was active within the basin in the W half of the crater that had been the focus of activity during 2021-2022. On 19 January just after 0200 a small ooze-out was observed on the crater’s W edge.
Activity during February 2023. Activity continued in the E part of Halema’uma’u crater, as well as in a smaller basin in the W part of the 2021-2022 lava lake (figure 527). The E lava lake contained a single lava fountain and frequent overflows. HVO reported that during the morning of 1 February the large E lava lake began to cool and crust over in the center of the lake; two smaller areas of lava were observed on the N and S sides by the afternoon. The dominant lava fountain located in the S part of the lava lake paused for roughly 45 minutes at 2315 and resumed by midnight, rising 1-2 m. At 0100 on 2 February lava from the S part was effusing across the entire E lava lake area, covering the crusted over portion in the center of the lake and continuing across the majority of the previously measured 250,000 m2 by 0400. A small lava pond near the E lake produced an overflow around 0716 on 2 February. On 3 February some lava crust began to form against the N and E levees, which defined the 250,000 m2 eastern lava lake. The small S lava fountain remained active, rising 1-6 m high during 3-9 February; around 0400 on 5 February occasional bursts doubled the height of the lava fountain.
A large breakout occurred overnight during 2100 on 4 February to 0900 on 5 February on the N part of the crater floor, equal to or slightly larger in size than the E lava lake. A second, smaller lava fountain appeared in the same area of the E lava lake between 0300 and 0700 on 5 February and was temporarily active. This large breakout continued until 7 February. A small, brief breakout was reported in the S of the E lava lake around midnight on 7 February. In the W lake, as well as the smaller lava pond in the central portion of the crater floor, contained several overflows during 7-10 February and intermittent fountaining. Activity at the S small lava pond and the small S lava fountain within the E lake declined during 9-10 February. The lava pond in the central portion of the crater floor had nearly continuous, expansive flows during 10-13 February; channels from the small central lava pond seemed to flow into the larger E lake. During 13-18 February a small lava fountain was observed in the small lava pond in the central portion of the crater floor. Continuous overflows persisted during this time.
Activity in the eastern and central lakes began to decline in the late afternoon of 17 February. By 18 February HVO reported that the lava effusions had significantly declined, and that the eastern and central lakes were no longer erupting. The W lake in the basin remained active but at a greatly reduced level that continued to decline. HVO reported that this decrease in activity is attributed to notable deflationary tilt that began early on the morning of 17 February and lasted until early 19 February. By 19 February the W lake was mostly crusted over although some weak lava flows remained, which continued through 28 February. The sulfur dioxide emission rates ranged 250-2,800 t/d, the highest value of which was recorded on 6 February.
Activity during March 2023. The summit eruption at Halema’uma’u crater continued at greatly reduced levels compared to the previous two months. The E and central vents stopped effusing lava, and the W lava lake remained active with weak lava flows; the lake was mostly crusted over, although slowly circulating lava intermittently overturned the crust. By 6 March the lava lake in the W basin had stopped because the entire surface was crusted over. The only apparent surface eruptive activity during 5-6 March was minor ooze-outs of lava onto the crater floor, which had stopped by 7 March. Several hornitos on the crater floor still glowed through 12 March according to overnight webcam images, but they did not erupt any lava. A small ooze-out of lava was observed just after 1830 in the W lava lake on 8 March, which diminished overnight. The sulfur dioxide emission rate ranged from 155-321 t/d on 21 March. The VAL was lowered to Advisory, and the ACC was lowered to Yellow (the second lowest on a four-color scale) on 23 March due to a pause in the eruption since 7 March.
Activity during April-May 2023. The eruption at Halema’uma’u crater was paused; no lava effusions were visible on the crater floor. Sulfur dioxide emission rates ranged from 75-185 t/d, the highest of which was measured on 22 April. During May and June summit seismicity was elevated compared to seismicity that preceded the activity during January.
Activity during June 2023. Earthquake activity and changes in the patterns of ground deformation beneath the summit began during the evening of 6 June. The data indicated magma movement toward the surface, prompting HVO to raise the VAL to Watch and the ACC to Orange. At about 0444 on 7 June incandescence in Halema’uma’u crater was visible in webcam images, indicating that a new eruption had begun. HVO raised the VAL to Warning and the ACC to Red (the highest color on a four-color scale). Lava flowed from fissures that had opened on the crater floor. Multiple minor lava fountains were active in the central E portion of the Halema’uma’u crater, and one vent opened on the W wall of the caldera (figure 528). The eruptive vent on the SW wall of the crater continued to effuse into the lava lake in the far SW part of the crater (figure 529). The largest lava fountain consistently rose 15 m high; during the early phase of the eruption, fountain bursts rose as high as 60 m. Lava flows inundated much of the crater floor and added about 6 m depth of new lava within a few hours, covering approximately 10,000 m2. By 0800 on 7 June lava filled the crater floor to a depth of about 10 m. During 0800-0900 the sulfur dioxide emission rate was about 65,000 t/d. Residents of Pahala (30 km downwind of the summit) reported minor deposits of fine, gritty ash and Pele’s hair. A small spatter cone had formed at the vent on the SW wall by midday, and lava from the cone was flowing into the active lava lake. Fountain heights had decreased from the onset of the eruption and were 4-9 m high by 1600, with occasional higher bursts. Inflation switched to deflation and summit earthquake activity greatly diminished shortly after the eruption onset.
At 0837 on 8 June HVO lowered the VAL to Watch and the ACC to Orange because the initial high effusion rates had declined, and no infrastructure was threatened. The surface of the lava lake had dropped by about 2 m, likely due to gas loss by the morning of 8 June. The drop left a wall of cooled lava around the margins of the crater floor. Lava fountain heights decreased during 8-9 June but continued to rise to 10 m high. Active lava and vents covered much of the W half of Halema’uma’u crater in a broad, horseshoe-shape around a central, uplifted area (figure 530). The preliminary average effusion rate for the first 24 hours of the eruption was about 150 cubic meters per second, though the estimate did not account for vesiculated lava and variations in crater floor topography. The effusion rate during the very earliest phases of the eruption appeared significantly higher than the previous three summit eruptions based on the rapid coverage of the entire crater floor. An active lava lake, also referred to as the “western lava lake” was centered within the uplifted area and was fed by a vent in the NE corner. Two small active lava lakes were located just SE from the W lava lake and in the E portion of the crater floor.
During 8-9 June the lava in the central lava lake had a thickness of approximately 1.5 m, based on measurements from a laser rangefinder. During 9-12 June the height of the lava fountains decreased to 9 m high. HVO reported that the previously active lava lake in the E part of the crater appeared stagnant during 10-11 June. The surface of the W lake rose approximately 1 m overnight during 11-12 June, likely due to the construction of a levee around it. Only a few small fountains were active during 12-13 June; the extent of the active lava had retreated so that all activity was concentrated in the SW and central parts of Halema’uma’u crater. Intermittent spattering from the vent on the SW wall was visible in overnight webcam images during 13-18 June. On the morning of 14 June a weak lava effusion originated from near the western eruptive vent, but by 15 June there were no signs of continued activity. HVO reported that other eruptive vents in the SW lava lake had stopped during this time, following several days of waning activity; lava filled the lake by about 0.5 m. Lava circulation continued in the central lake and no active lava was reported in the northern or eastern parts of the crater. Around 0800 on 15 June the top of the SW wall spatter cone collapsed, which was followed by renewed and constant spattering from the top vent and a change in activity from the base vent; several new lava flows effused from the top of the cone, as well as from the pre-existing tube-fed flow from its base. Accumulation of lava on the floor resulted in a drop of the central basin relative to the crater floor, allowing several overflows from the SW lava lake to cascade into the basin during the night of 15 June into the morning of 16 June.
Renewed lava fountaining was reported at the eruptive vent on the SW side of the crater during 16-19 June, which effused lava into the far SW part of the crater. This activity was described as vigorous during midday on 16 June; a group of observatory geologists estimated that the lava was consistently ejected at least 10 m high, with some spatter ejected even higher and farther. Deposits from the fountain further heightened and widened the spatter cone built around the original eruptive vent in the lower section of the crater wall. Multiple lava flows from the base of the cone were fed into the SW lava lake and onto the southwestern-most block from the 2018 collapse within Halema’uma’u on 17 June (figure 531); by 18 June they focused into a single flow feeding into the SW lava lake. On the morning of 19 June a second lava flow from the base of the eruptive cone advanced into the SW lava lake.
Around 1600 on 19 June there was a rapid decline in lava fountaining and effusion at the eruptive vent on the SW side of the crater; vent activity had been vigorous up to that point (figure 532). Circulation in the lava lake also slowed, and the lava lake surface dropped by several meters. Overnight webcam images showed some previously eruptive lava still flowing onto the crater floor, which continued until those flows began to cool. By 21 June no lava was erupting in Halema’uma’u crater. Overnight webcam images during 29-30 June showed some incandescence from previously erupted lava flows as they continued to cool. Seismicity in the crater declined to low levels. Sulfur dioxide emission rates ranged 160-21,000 t/d throughout the month, the highest measurement of which was recorded on 8 June. On 30 June the VAL was lowered to Advisory (the second level on a four-level scale) and the ACC was lowered to Yellow. Gradual inflation was detected at summit tiltmeters during 19-30 June.
Activity during July-August 2023. During July, the eruption paused; no lava was erupting in Halema’uma’u crater. Nighttime webcam images showed some incandescence from previously erupted lava as it continued to cool on the crater floor. During the week of 14 August HVO reported that the rate in seismicity increased, with 467 earthquakes of Mw 3.2 and smaller occurring. Sulfur dioxide emission rates remained low, ranging from 75-86 t/d, the highest of which was recorded on 10 and 15 August. On 15 August beginning at 0730 and lasting for several hours, a swarm of approximately 50 earthquakes were detected at a depth of 2-3 km below the surface and about 2 km long directly S of Halema’uma’u crater. HVO reported that this was likely due to magma movement in the S caldera region. During 0130-0500 and 1700-2100 on 21 August two small earthquake swarms of approximately 20 and 25 earthquakes, respectively, occurred at the same location and at similar depths. Another swarm of 50 earthquakes were recorded during 0430-0830 on 23 August. Elevated seismicity continued in the S area through the end of the month.
Activity during September 2023. Elevated seismicity persisted in the S summit with occasional small, brief seismic swarms. Sulfur dioxide measurements were relatively low and were 70 t/d on 8 September. About 150 earthquakes occurred during 9-10 September, and tiltmeter and Global Positioning System (GPS) data showed inflation in the S portion of the crater.
At 0252 on 10 September HVO raised the VAL to Watch and the ACC to Orange due to increased earthquake activity and changes in ground deformation that indicated magma moving toward the surface. At 1515 the summit eruption resumed in the E part of the caldera based on field reports and webcam images. Fissures opened on the crater floor and produced multiple minor lava fountains and flows (figure 533). The VAL and ACC were raised to Warning and Red, respectively. Gas-and-steam plumes rose from the fissures and drifted downwind. A line of eruptive vents stretched approximately 1.4 km from the E part of the crater into the E wall of the down dropped block by 1900. The lava fountains at the onset of the eruption had an estimated 50 m height, which later rose 20-25 m high. Lava erupted from fissures on the down dropped block and expanded W toward Halema’uma’u crater. Data from a laser rangefinder recorded about 2.5 m thick of new lava added to the W part of the crater. Sulfur dioxide emissions were elevated in the eruptive area during 1600-1500 on 10 September, measuring at least 100,000 t/d.
At 0810 on 11 September HVO lowered the VAL and ACC back to Watch and Orange due to the style of eruption and the fissure location had stabilized. The initial extremely high effusion rates had declined (but remained at high levels) and no infrastructure was threatened. An eruption plume, mainly comprised of sulfur dioxide and particulates, rose as high as 3 km altitude. Several lava fountains were active on the W side of the down dropped block during 11-15 September, while the easternmost vents on the down dropped block and the westernmost vents in the crater became inactive on 11 September (figure 534). The remaining vents spanned approximately 750 m and trended roughly E-W. The fed channelized lava effusions flowed N and W into Halema’uma’u. The E rim of the crater was buried by new lava flows; pahoehoe lava flows covered most of the crater floor except areas of higher elevation in the SW part of the crater. The W part of the crater filled about 5 m since the start of the eruption, according to data from a laser rangefinder during 11-12 September. Lava fountaining continued, rising as high as 15 m by the morning of 12 September. During the morning of 13 September active lava flows were moving on the N and E parts of the crater. The area N of the eruptive vents that had active lava on its surface became perched and was about 3 m higher than the surrounding ground surface. By the morning of 14 September active lava was flowing on the W part of the down dropped block and the NE parts of the crater. The distances of the active flows progressively decreased. Spatter had accumulated on the S (downwind) side of the vents, forming ramparts about 20 m high.
Vigorous spattering was restricted to the westernmost large spatter cone with fountains rising 10-15 m high. Minor spattering occurred within the cone to the E of the main cone, but HVO noted that the fountains remained mostly below the rim of the cone. Lava continued to effuse from these cones and likely from several others as well, traveled N and W, confined to the W part of the down-dropped block and the NE parts of Halema’uma’u. Numerous ooze-outs of lava were visible over other parts of the crater floor at night. Laser range-finder measurements taken of the W part of the crater during 14-15 September showed that lava filled the crater by 10 m since the start of the eruption. Sulfur dioxide emissions remained elevated after the onset of the eruption, ranging 20,000-190,000 t/d during the eruption activity, the highest of which occurred on 10 September.
Field crews observed the eruptive activity on 15 September; they reported a notable decrease or stop in activity at several vents. Webcam images showed little to no fountaining since 0700 on 16 September, though intermittent spattering continued from the westernmost large cone throughout the night of 15-16 September. Thermal images showed that lava continued to flow onto the crater floor. On 16 September HVO reported that the eruption stopped around 1200 and that there was no observable activity anywhere overnight or on the morning of 17 September. HVO field crews reported that active lava was no longer flowing onto Halema’uma’u crater floor and was restricted to a ponded area N of the vents on the down dropped block. They reported that spattering stopped around 1115 on 16 September. Nighttime webcam images showed some incandescence on the crater floor as lava continued to cool. Field observations supported by geophysical data showed that eruptive tremor in the summit region decreased over 15-16 September and returned to pre-eruption levels by 1700 on 16 September. Sulfur dioxide emissions were measured at a rate of 800 t/d on 16 September while the eruption was waning, and 200 t/d on 17 September, which were markedly lower compared to measurements taken the previous week of 20,000-190,000 t/d.
Geologic Background. Kilauea overlaps the E flank of the massive Mauna Loa shield volcano in the island of Hawaii. Eruptions are prominent in Polynesian legends; written documentation since 1820 records frequent summit and flank lava flow eruptions interspersed with periods of long-term lava lake activity at Halemaumau crater in the summit caldera until 1924. The 3 x 5 km caldera was formed in several stages about 1,500 years ago and during the 18th century; eruptions have also originated from the lengthy East and Southwest rift zones, which extend to the ocean in both directions. About 90% of the surface of the basaltic shield volcano is formed of lava flows less than about 1,100 years old; 70% of the surface is younger than 600 years. The long-term eruption from the East rift zone between 1983 and 2018 produced lava flows covering more than 100 km2, destroyed hundreds of houses, and added new coastline.
Information Contacts: Hawaiian Volcano Observatory (HVO), U.S. Geological Survey, PO Box 51, Hawai'i National Park, HI 96718, USA (URL: http://hvo.wr.usgs.gov/).
Tinakula (Solomon Islands) — December 2023 Cite this Report
Tinakula
Solomon Islands
10.386°S, 165.804°E; summit elev. 796 m
All times are local (unless otherwise noted)
Continued lava flows and thermal activity during June through November 2023
Tinakula is a remote 3.5 km-wide island in the Solomon Islands, located 640 km ESE of the capital, Honiara. The current eruption period began in December 2018 and has more recently been characterized by intermittent lava flows and thermal activity (BGVN 48:06). This report covers similar activity during June through November 2023 using satellite data.
During clear weather days (20 July, 23 September, 23 October, and 12 November), infrared satellite imagery showed lava flows that mainly affected the W side of the island and were sometimes accompanied by gas-and-steam emissions (figure 54). The flow appeared more intense during July and September compared to October and November. According to the MODVOLC thermal alerts, there were a total of eight anomalies detected on 19 and 21 July, 28 and 30 October, and 16 November. Infrared MODIS satellite data processed by MIROVA (Middle InfraRed Observation of Volcanic Activity) detected a small cluster of thermal activity occurring during late July, followed by two anomalies during August, two during September, five during October, and five during November (figure 55).
Geologic Background. The small 3.5-km-wide island of Tinakula is the exposed summit of a massive stratovolcano at the NW end of the Santa Cruz islands. It has a breached summit crater that extends from the summit to below sea level. Landslides enlarged this scarp in 1965, creating an embayment on the NW coast. The Mendana cone is located on the SE side. The dominantly andesitic volcano has frequently been observed in eruption since the era of Spanish exploration began in 1595. In about 1840, an explosive eruption apparently produced pyroclastic flows that swept all sides of the island, killing its inhabitants. Recorded eruptions have frequently originated from a cone constructed within the large breached crater. These have left the upper flanks and the steep apron of lava flows and volcaniclastic debris within the breach unvegetated.
Information Contacts: MIROVA (Middle InfraRed Observation of Volcanic Activity), a collaborative project between the Universities of Turin and Florence (Italy) supported by the Centre for Volcanic Risk of the Italian Civil Protection Department (URL: http://www.mirovaweb.it/); Hawai'i Institute of Geophysics and Planetology (HIGP) - MODVOLC Thermal Alerts System, School of Ocean and Earth Science and Technology (SOEST), Univ. of Hawai'i, 2525 Correa Road, Honolulu, HI 96822, USA (URL: http://modis.higp.hawaii.edu/); Copernicus Browser, Copernicus Data Space Ecosystem, European Space Agency (URL: https://dataspace.copernicus.eu/browser/).
Search Bulletin Archive by Publication Date
Select a month and year from the drop-downs and click "Show Issue" to have that issue displayed in this tab.
The default month and year is the latest issue available.
Bulletin of the Global Volcanism Network - Volume 33, Number 01 (January 2008)
Etna (Italy)
Tall sustained lava fountains, lava flows, and tephra blanket on 22-24 November 2007
Heard (Australia)
Rare thermal anomalies through March 2008 suggest eruptions
Huila, Nevado del (Colombia)
Eruptions in February, April, and May 2007; lahars take out bridges
Krakatau (Indonesia)
Repeated minor eruptions during October-November 2007
Llaima (Chile)
Ash plumes observed in May and August 2007; new eruption beginning 1 January 2008
Sheveluch (Russia)
Lava-dome growth and block-and-ash flows continue April-December 2007
Turrialba (Costa Rica)
Fumarolic increases during August 2007-January 2008
Ubinas (Peru)
Continuing ashfall during 2006-2007
Etna
Italy
37.748°N, 14.999°E; summit elev. 3357 m
All times are local (unless otherwise noted)
Tall sustained lava fountains, lava flows, and tephra blanket on 22-24 November 2007
After the 10-hour-long episode of sustained lava fountaining from the Southeast Crater (SEC) on 4-5 September 2007 (BGVN 32:09), Etna remained quiescent for about three weeks. Ash emissions then resumed from the vent on the eastern flank of the SEC cone, which had been the main focus of activity since mid-August 2007. During October, ash emissions occurred intermittently, at times with minor incandescent ejections. This activity persisted until mid-November, after which there was a week-long pause until the early morning of 22 November. That day around 0500, weak Strombolian activity and ash emission started from the vent on the E flank of the SEC and continued with increasing strength for the following 36 hours.
A series of explosions occurred at the Bocca Nuova between 1658 and 1705 on 23 November, ejecting dark gray ash plumes, and producing strong seismic signals on nearby stations. During the following hours, Strombolian explosions occurred from the SEC vent, ejecting incandescent bombs to several tens of meters high.
After 2020, the vigor increased, with bursts of bombs rising to 100 m high, accompanied by a sharp rise in tremor amplitude. By 2130, a broad, pulsating lava fountain rose from the vent. Then, 15 min later, observers saw sustained fountaining up to 600 m high. The fountains discharged from what appeared to be two closely spaced sources within the depression, often making a V-shape.
Lava spilled over the vent's rim in at least three locations (figure 129), feeding three narrow branches of lava that ran E and coalesced, before spreading down the steep W slope of the Valle del Bove. A fourth lava flow started from an area ~ 150 m NE of the active vent, where fountain-fed spatter rapidly accumulated and ultimately began to flow. This flow joined the main lava flow toward the Valle del Bove at about 2,500 m elevation.
The November lava flowed mostly on top of, or immediately adjacent to, the lava emitted during the eruption of early September 2007 (figure 129). At the base of the Valle del Bove slope, the November eruption's lava fanned out to form several minor lobes, the longest of which advanced to 1,670 m elevation, 4.2 km from the vent (figure 130; Burton and Neri, 2007).
The explosive activity fed a dense tephra plume. It blew NE and caused ash and lapilli falls as far as 80 km away in southern Calabria, (Andronico and Cristaldi, 2007). At Piano Provenzana (~ 6.5 km NNE of the summit), the deposit was about 3 cm thick. Coarse scoriae, up to 5 cm across, fell ~ 10 km NNE from the SEC (in Linguaglossa) during the first hour of the eruption. During the following hours, finer ash fell in areas adjacent Etna and to the W.
Shortly after 0300 on 24 November, the eruptive activity and volcanic tremor amplitude began to diminish gradually, and during the next 20 min the fountain height dropped from ~ 600 m to under 200 m. Subsequently, the fountaining gave way to a series of powerful explosions, which showered the entire SEC cone with meter-sized bombs. The last of these explosions occurred at 0338, and for another 45 min after this, only minor explosive ejections occurred from the vent.
During the following hours, material continued to crumble and collapse on the steep slopes around the vent, exposing incandescent rock in countless spots. By 0600, the tremor amplitude had dropped to background levels, and no further eruptive activity was noted at the vent.
For several days after the eruption, gravitational instability of the new pyroclastic deposit, which had accumulated to thicknesses of several tens of meters, especially on the N side of the vent, caused occasional slides of material, exposing the still-incandescent interior of the deposit. A particularly large collapse from the overhanging W rim of the vent at 1713 on 27 November may have been accompanied by minor explosive activity, with incandescent material rolling to the base of the SEC cone (Calvari, 2007).
Ash emissions from the same vent occurred on 10 January 2008 and again on 1-3 February (figure 131). In mid-February such emissions became more frequent; some produced plumes several hundreds of meters high.
References. Andronico, D. and Cristaldi, A., 2007, Il parossismo del 23-24 novembre 2007 al Cratere di SE: caratteristiche del deposito di caduta. Report published on-line at: http://www.ct.ingv.it/Report/RPTVETCEN20071123.pdf
Burton, M. and Neri, M., 2007, Stato attuale e osservazione dell'Etna 25 novembre 2007. Report published on-line at: http://www.ct.ingv.it/Report/WKRVGREP20071125.pdf
Calvari, S., 2007, Rapporto sull'attivit? dell'Etna del 27 novembre 2007. Report published on-line at: http://www.ct.ingv.it/Report/WKRVGREP20071127.pdf
Geologic Background. Mount Etna, towering above Catania on the island of Sicily, has one of the world's longest documented records of volcanism, dating back to 1500 BCE. Historical lava flows of basaltic composition cover much of the surface of this massive volcano, whose edifice is the highest and most voluminous in Italy. The Mongibello stratovolcano, truncated by several small calderas, was constructed during the late Pleistocene and Holocene over an older shield volcano. The most prominent morphological feature of Etna is the Valle del Bove, a 5 x 10 km caldera open to the east. Two styles of eruptive activity typically occur, sometimes simultaneously. Persistent explosive eruptions, sometimes with minor lava emissions, take place from one or more summit craters. Flank vents, typically with higher effusion rates, are less frequently active and originate from fissures that open progressively downward from near the summit (usually accompanied by Strombolian eruptions at the upper end). Cinder cones are commonly constructed over the vents of lower-flank lava flows. Lava flows extend to the foot of the volcano on all sides and have reached the sea over a broad area on the SE flank.
Information Contacts: Boris Behncke, Sonia Calvari, and Marco Neri, Istituto Nazionale di Geofisica e Vulcanologia (INGV), Sezione di Catania, Piazza Roma 2, 95123 Catania, Italy.
Heard (Australia) — January 2008 Cite this Report
Heard
Australia
53.106°S, 73.513°E; summit elev. 2745 m
All times are local (unless otherwise noted)
Rare thermal anomalies through March 2008 suggest eruptions
Due to its isolated location in the S Indian Ocean on the Kerguelen Plateau, Heard Island is rarely visited, and satellite imagery provides the only regular information on eruptive activity. The Hawai'i Institute of Geophysics and Planetology (HIGP) Thermal Alerts System MODVOLC provides an analysis of MODIS (Moderate Resolution Imaging Spectroradiometer) satellite thermal anomaly data, with 1-2 daily observations. That system remains the best source of evidence at isolated, glacier-covered volcanoes like Heard, though it is difficult to determine how often meteorological clouds may obscure thermal anomalies.
The last report summarized activity beginning in March 2000 (BGVN 32:06), describing three eruptive episodes (based on thermal anomalies). The last thermal anomaly mentioned was on 6 April 2007. As seen on table 5, the MODVOLC system recorded the next thermal anomaly on 24 July 2007. For the rest of 2007, there were anomalies recorded on two days in August and two days in November. During 2008 as late as 2 March, anomalies occurred in February and March.
Table 5. Thermal anomalies measured by MODIS/MODVOLC over Heard Island during 7 April 2007 through 2 March 2008. Courtesy of HIGP Thermal Anomalies Team.
| Date |
Time (UTC) |
Pixels |
Satellite |
| 24 Jul 2007 |
1750 |
1 |
Aqua |
| 12 Aug 2007 |
1820 |
1 |
Terra |
| 30 Aug 2007 |
1955 |
1 |
Aqua |
| 11 Nov 2007 |
1800 |
1 |
Terra |
| 11 Nov 2007 |
1945 |
2 |
Aqua |
| 22 Feb 2008 |
1955 |
3 |
Aqua |
| 02 Mar 2008 |
1950 |
1 |
Aqua |
Geologic Background. Heard Island on the Kerguelen Plateau in the southern Indian Ocean consists primarily of the emergent portion of two volcanic structures. The large glacier-covered composite basaltic-to-trachytic cone of Big Ben comprises most of the island, and the smaller Mt. Dixon lies at the NW tip of the island across a narrow isthmus. Little is known about the structure of Big Ben because of its extensive ice cover. The active Mawson Peak forms the island's high point and lies within a 5-6 km wide caldera breached to the SW side of Big Ben. Small satellitic scoria cones are mostly located on the northern coast. Several subglacial eruptions have been reported at this isolated volcano, but observations are infrequent and additional activity may have occurred.
Information Contacts: Hawai'i Institute of Geophysics and Planetology (HIGP) Thermal Alerts System, School of Ocean and Earth Science and Technology (SOEST), Univ. of Hawai'i, 2525 Correa Road, Honolulu, HI 96822, USA (URL: http://modis.higp.hawaii.edu/).
Nevado del Huila (Colombia) — January 2008 Cite this Report
Nevado del Huila
Colombia
2.93°N, 76.03°W; summit elev. 5364 m
All times are local (unless otherwise noted)
Eruptions in February, April, and May 2007; lahars take out bridges
Nevado del Huila was the scene of elevated seismicity during February and May 2000 (BGVN 25:05). In 1994, the M 6.4 Paéz earthquake triggered avalanches and lahars along the Paéz river, which took many lives (BGVN 19:05, 19:07). A more recent abstract summarized the losses from the Paéz earthquake as 271 reported deaths, 1,700 people missing, and more than 32,000 people evacuated during the crisis (Schuster, 1996). Correa and Pulgarín (2002a, b) wrote reviews of the volcano's geology, hazards, and related topics.
This report discusses the onset of eruptions during February 2007 and repeated eruptions during April and May 2007. During the most active intervals during February and April there were substantial ash plumes, lahars, earthquake swarms (and some individual earthquakes up to M ~ 3), and the growth of fissures, crevasses, and new fumaroles on the volcano's upper, glacier-covered slopes. During the April eruption thousands of residents evacuated. This report draws heavily on material issued by the Instituto Colombiano de Geología y Minería (INGEOMINAS), Observatory Vulcanológico and Sismológico de Popayán.
The andesitic-dacitic edifice (figure 6) is large and elongate (with a footprint of ~ 170 km2 ). Located in the Central Cordillera (figure 7), it forms Colombia's highest peak. This area only 3 degrees from the equator experiences periods of high precipitation. In 1995 its alpine glaciers covered ~ 13.4 km2 with an approximate volume of 800 x 106 m3 (Pulgarín and others, 2005).
The April 2007 activity impacted not only the immediate vicinity of the volcano, but also ten's of kilometers to the S, where rivers carried debris. In order to assess the impact of the lahars, INGEOMINAS compared calibrated Landsat images from before and after the 19 February eruption. They found clear visual evidence that the lahars had discolored the Betania Reservoir, ~ 150 km downstream.
The Símbola joins the Paéz river ~ 28 km (straight-line distance) S of Pico Central (figure 8). Adjacent that intersection sits the town of Belacázar (figure 9). Another ~ 15 km downstream, the Paéz merges into the Magdalena river, the 6th largest river the world in terms of sediment yield (~ 690 t / (km2 ? yr); Restrepo and others, 2005). A straight-line distance of ~ 50 km downslope from the intersection of the Paéz and Magdalena rivers, the Magdalena enters the Betania Reservoir.
Beyond the reservoir, the Magdalena flows NNE; it ultimately reaches the Carribean Sea at a large delta in N Colombia by the large city of Barranquilla (figure 7). According to Restrepo and Kjerfve (2000), "the Magdalena is the largest river discharging directly into the Caribbean sea [228 km3 water annually], and it has the highest sediment yield of any medium-sized or large river along the entire E coast of South America."
Unrest and 19 February eruption. Since 1994 the volcano has been monitored by multiple telemetered seismometers with data sent to the city of Popayán (~ 100 km SSW). Mumucué (2007) pointed out that people living around the volcano saw the appearance of fumaroles in October 2006.
From 22 November 2006, INGEOMINAS assigned an elevated hazard of Level II ('Eruption probable in the coming days or weeks'). Some fracture-related earthquakes took place at depths of 2 km below the summit. Some of these earthquakes reached MR 1.6-1.9.
A 13 February flight mainly found steam escaping both secondary craters and fumarole fields on the main crater's margin. The previous day, observers W of the volcano in Consacá saw steam emissions outside the crater.
A seismometer recorded an earthquake swarm during 1030-1259 on 18 February. The seismometer, located 2 km S of Pico Central (at station 'Cerro Negro') measured 108 earthquakes interpreted as rock fracture events in the upper part of the volcano. An M 3 earthquake followed, and at 0137 on 19 February a new swarm of 53 earthquakes occurred. In this swarm fracture earthquakes were accompanied by those of longer period; the amplitude and number of events increased into the next morning.
Seismic records also contained some long-period earthquakes called tornillos (events with long, gradually decreasing codas or tails, so that their seismic trace resembles the tapering profile of a wood screw; tornillo is Spanish for screw). During March 2006-February 2007, instruments had recorded 105 tornillos (an average of 9 per month). In contrast, during 1-19 February 2007, instruments recorded 20 tornillos, more than double the number usually seen during a full month.
INGEOMINAS reported two earthquakes on 19 February 2007, at 0830 and 0853, with probable explosive character. Aviation authorities reported ash-bearing columns over the edifice reaching ~ 0.6-0.7 km above the summit.
A later INGEOMINAS summary of events stated that the eruption began at 0856 on 19 February, manifested as a ~ 1.5 km tall eruption column blowing mainly W. Ashfall was noted by inhabitants of Toribio, Silvia, and Páez (in the Department of Cauca). Small mudflows came down the Bellavista and Azufrada rivers feeding into the Paéz river, but airborne observers found significant fresh deposits at higher elevations. Authorities advised inhabitants to move to higher ground. Inhabitants noticed the rise of the Paéz river at 1150 on 19 February.
A 20 February flight detected significant fresh ash, abundant crevasses in the ice, and a steaming fissure near the summit (figure 10). The fissure extended ~ 2 km between Pico Central and Pico la Cresta to the N. Observers noted that the fissure continually emitted gases along its entire length. The flight was a collaboration between INGEOMINAS and IGEFA (Inspección General de la Fuerza Aérea).
A VAAC report noted an eruption at about 1400 UTC on the 19th to approximately FL 200 (~ 6.1 km altitude) moving W and dissipating quickly. No ash was seen in satellite imagery the next day at either 0045 or 1100 UTC, however, around this latter time, a pilot observed an ash cloud. In addition, a local aircraft reported ash to ~ 6.1 km at 0500 UTC on the 21st.
During 30 March-16 April 2007 INGEOMINAS observers reported the initiation of noteworthy seismicity indicating rock fractures and movement of fluids. The fracture events were located at depths of 4-8 km E and SW from the central peak and at magnitudes of less than 1.0. Low gas columns were again seen on 11 April, moving W.
Seismicity further increased on 17 April, leading up to an eruption on the 18th. Early on 18 April, a cluster of 25 rock-fracture earthquakes occurred, M 0.5 to 1.5. These were located at a depth less than 2 km. Seismicity again increased later that morning.
April 2007 eruption. A brief summary of the 18 April eruption appeared on the website hosted by the International Charter "Space and Major Disasters" on 20 April). It stated, "The Nevado del Huila volcano erupted at 02:57 local time 18 April, causing avalanches and floods [lahars] which affected the villages of La Plata, Paicol, Tesalia, Natagá, [and] Belalcázar. About 5,000 people were evacuated." (That same website hosted more than 10 (Landsat, Radarsat, and Envisat) images shedding light on this remote volcano's behavior, hazards, and impacts).
According to an 18 April 2007 report from the Washington Volcanic Ash Advisory Center (VAAC), a pilot in Colombia saw an ash cloud. Two ash plumes were evident on GOES-10 (split window) satellite imagery for an eruption starting at 0815 UTC on 18 April. They rose to poorly constrained altitudes of ~ 9 and 11 km and drifted E at 9 km/hour. The lower ash cloud was ~ 37 km across and moved SW at 9-18 km/hour. The higher ash cloud was ~ 19 km across and moved E at 0-9 km/hour. These clouds had dissipated by 1034 UTC.
The 18 April eruption sent an a torrent of brown water and rocks down the volcano's sides and into the Paéz and Símbola rivers (figures 11 and 12), causing them to flood, destroying several kilometers of highway and endangering or sweeping away what some government reports stated were 15 bridges (although it is uncertain how many of those were footbridges, and new reports tended to indicate a slightly higher numbers). In an evaluation the lahars of 18 April, INGEOMINAS staff found them quite similar, though smaller, than those of the earthquake and disaster of 1994.
Videos. At least three videos taken chiefly from Colombian military or national guard helicopters were posted on the web during April-May 2007 (see Videos, under References). They featured either the volcano or the powerful lahars or both, as follows.
Video 1("Avalancha . . ."; posted 18 April 2007) contains lahar footage from a television newscast, much of it taken from a helicopter. The shots include several bridges destroyed or impacted by lahars and the dialog mentioned nineteen bridges affected. Segments also show closeups of sediments and considerable flooding. Few if any flooded or damaged buildings were shown. Footage shows segments of the river with various gradients; the dark water carrying considerable debris. In one scene of a threatened bridge taken from shore, the turbulent river races by and among the passing logs seemingly floats a large farm animal.
Video 2 ("Sobrevuelo . . ." [Overflight . . .]) was taken by INGEOMINAS on 3 March 2007. It shows the volcano in modest eruption. A dense, dark plume emerges from the complex ice-bound summit area. Somewhat surprisingly, the plume immediately descends one flank of the volcano.
Video 3 (Erupcion . . . 18 Abril) shows vigorous white plumes escaping from multiple vents and forming a dense white plume. The text says that the footage was taken hours after the eruption on 18 April 2007. The base of the volcano is shrouded in weather clouds. The footage credits "Ejercito Nacional-INGEOMINAS-FAC."
Further observations and assessments. Seismicity escalated during 19-20 April but decreased on the 21st. Two larger earthquakes soon took place, on the 22nd and 27th. Their respective seismic signals appeared to come from rock fracturing at shallow depths; they had epicenters at Pico Central, and they were M 3.0 and M 3.2. On 23 April instruments detected continuous low-frequency tremor, interpreted as continuing instability and possible eruptions.
On 22 April, the Colombian Air Force flew INGEOMINAS staff past the volcano. They observed the N-trending fissure seen in February and found it had extended to reach a length of 2.3 km and a width of ~ 200 m. It emitted a white, sulfurous smelling gas column to 5 km altitude. The 22 April observers also saw a second new fissure ~ 2 km long across the same region. Strong fumaroles also discharged. Some lahars remained active down both E and W flank drainages.
Associated with the eruptions and as recent as 28 April 2007, there had been a total of 5,708 seismic events. Of those, 2,861 had signals suggesting rock fracture and 2,847 had signals suggesting movement of fluids.
During late April and early May 2007 the seismicity generally decreased (except for a 6 May, M 3.2 earthquake). On 5 May, INGEOMINAS staff, using a land-based correlation spectrometer, measured an SO2 flux from the volcano at 3,000 tons per day.
Early on 14 May, INGEOMINAS recorded a cluster of 54 low magnitude earthquake events, possibly triggering or associated with an ash emission. Based on satellite imagery of 14 May, the Washington VAAC reported an ash plume 8 km wide in an area 45 km W; it drifted SW and dissipated.
Based on seismic interpretation, INGEOMINAS inferred ash emissions during 27 May. Aerial observations later that day confirmed the emissions. Tremor recorded on 28 May possibly indicated another pulse of ash emissions. The SO2 flux measured on 1 June continued at 3,000 metric tons per day and on 2 June increased to ~ 6,900 metric tons per day. Flights on 3, 6, and 10 June indicated no changes in the existing fissures nor changes in the fumarolic field. Seismicity was relatively quiet during June 2007.
Humanitarian concerns. Luz Amanda Pulido, director of the national disaster office said that there were no reports of deaths or injuries. According to a 22 May report of the UN Office for the Coordination of Human Affairs (OHCA), by 26 April authorities resolved to evacuate 2,307 families affected by the crisis.
A government document issued May 2007 discussed the displaced residents. According to that report (Mumucué, 2007) the number of indigenous inhabitants living around the volcano and affected by lahars or emissions or both totaled 26,949 people. The affected territory he discussed (the Municipio de Páez, which has Belacazar as the main urban center) had an area of ~ 161,000 hectares. The inhabitants losses included cultivated areas and farm animals, including horses and smaller livestock. Photos showed displaced families living in temporary camps with outdoor cooking facilities. Another photo showed workers installing a footbridge where a vehicle bridge was lost to the torrent. That photo, taken ~5 days after the 18 April lahars began showed that by this time the river had greatly receded. The report was also a plea for supplies, including children's clothing and two-way radios with solar panels. Total days of community work devoted to reconstruction after the disaster and as late as May 2007 amounted to 4,264 (Mumucué, 2007).
References. Correa, A.M., and Pulgarín, B.A, 2002a, Revisión histórica de los estudios geológicos y otros aspectos, sobre el volcán Nevado del Huila y su área de influenza, Instituto Colombiano de Geologia y Mineria, INGEOMINAS; Observatorio Vulcanológico y Sismológico, Popayán; Junio de 2002, 51 p.
Correa, A., and Pulgarín, B., 2002b, Morfología, estratigrafía y petrografía general del Complejo Volcánico Nevado del Huila (énfasis en el flanco occidental): INGEOMINAS, Centro Operativo, Popayán, Informe Interno, 104 p.
Mumucué, J.A., May 2007, Analisis de los diversos eventos de erupción volcánica en la región de Tierradentro Páez Cauca hasta el momento: Republica de Colombia, Departamento del Cauca - Region de Tierradentro, Asociación de Cabildos Nasa ?xh??xha.
Pulagarín, B.A., Jordan, E., and Linder, W., 2005, Aspectos geológicos y cambio glaciar del volcán Nevado del Huila entre 1961 y 1995: Proceedings I Conferencia Cambio Climático, Bogotá 2005, 17 p.
Restrepoa, J.D., Kjerfveb, B., Hermelina, M., and Restrepoa, J.C., 2005, Factors controlling sediment yield in a major South American drainage basin: the Magdalena River, Colombia: Journal of Hydrology, v. 316, nos. 1-4, 10 January 2006, p. 213-232.
Restrepoa, J.D., and Kjerfve, B., 2000, Magdalena river: interannual variability (1975-1995) and revised water discharge and sediment load estimates: Journal of Hydrology, v. 235, nos. 1-2, 22 August 2000, p. 137-149, Elsevier.
Schuster, R. L., 1996, Recent earthquake-induced catastrophic landslides in the Andes of Ecuador and Colombia; Abstract, Colorado Scientific Society (URL: http://www.coloscisoc.org/abstracts).
Video References. (1) "Avalancha del Volcan Nevado del Huila" [A newscast from a Colombian television station, www.youtube.com/watch?v=k6nW1DP5mqg
(2) INGEOMINAS, 3 March 2007, Sobrevuelo Ingeominas Nevado Huila pocos dias despues de la erupción" (posted 8 May 2007) [Overflight of summit area] http://www.youtube.com/watch?v=UPP0vzBzZ38 (00:39)
(3) INGEOMINAS, 2007, Erupcion Nevado del Huila Colombia 18 Abril; Video stamped with "Ejercito Nacional-INGEOMINAS-FAC"; http://www.youtube.com/watch?v=xUnYOALOCWg; (00:56) (Posted 8 May 2007)
Geologic Background. Nevado del Huila, the highest peak in the Colombian Andes, is an elongated N-S-trending volcanic chain mantled by a glacier icecap. The andesitic-dacitic volcano was constructed within a 10-km-wide caldera. Volcanism at Nevado del Huila has produced six volcanic cones whose ages in general migrated from south to north. The high point of the complex is Pico Central. Two glacier-free lava domes lie at the southern end of the volcanic complex. The first historical activity was an explosive eruption in the mid-16th century. Long-term, persistent steam columns had risen from Pico Central prior to the next eruption in 2007, when explosive activity was accompanied by damaging mudflows.
Information Contacts: Instituto Colombiano de Geología y Minería (INGEOMINAS), Observatorio Vulcanológico y Sismológico de Popayán, Popayán, Colombia; Washington Volcanic Ash Advisory Center (VAAC), Satellite Analysis Branch (SAB), NOAA/NESDIS E/SP23, NOAA Science Center Room 401, 5200 Auth road, Camp Springs, MD 20746, USA (URL: http://www.ospo.noaa.gov/Products/atmosphere/vaac/); Jorge Castilla Echenique, Salud para desplazados, Programa de Emergencias y Desastres OPS/OMS, PWR Colombia; Jorge E. Victoria R., Salud en Desastres y Emergencias Complejas, Organización Panamericana De La Salud, Oficina de Neiva, Carrera 10 No. 4-72, Huila, Colombia; International Charter-Space and Major Disasters (URL: http://www.disasterscharter.org/).
Krakatau (Indonesia) — January 2008 Cite this Report
Krakatau
Indonesia
6.1009°S, 105.4233°E; summit elev. 285 m
All times are local (unless otherwise noted)
Repeated minor eruptions during October-November 2007
During 23-26 October 2007, minor eruptions occurred at Anak Krakatau (BGVN 32:09), an island and active vent on the rim of the famous larger caldera whose name often is misspelled as "Krakatoa." This report continues coverage from late October through November 2007. The Center of Volcanology and Geological Hazard Mitigation (CVGHM) raised the Alert Level to 3 (on a scale of 1-4) for Krakatau on 26 October because of the presence of multiple gray plumes from the volcano and an increase in seismicity. Plumes rose to an altitude of ~ 1 km during 23-26 and 30 October. Villagers and tourists were advised not go within 3 km of the summit.
According to an Associated Press news article, "red-hot lava flares" from Anak Krakatau rose 500-700 m above the S crater on 6 November. Multiple ash clouds were also observed. On 9 November, CVGHM officials in Bandung, West Java, conducted seismic and visual monitoring. Officials said, that on that day there were 182 eruptions coupled with 11 volcanic earthquakes, 54 shallow volcanic shocks, eight deep volcanic tremors and 44 shallower tremors. The volcano spewed "smoke" 29 times. On 13-14 November, as reported by CVGHM, lava flows and incandescent rocks traveled 400 m down the flanks.
As reported by VolcanoDiscovery's Tom Pfeiffer, who visited there from 21-26 November, emissions were relatively constant. He noted that all activity occurred from the newly formed crater on the upper S flank just below the old summit crater (figure 18). On 21 November, the new crater had an oval shape, approximately 50 x 70 m. Dense, dark brown, billowing ash clouds escaped in pulses from the crater at near-constant intervals of about 2 minutes, rising typically 100-200 m above the crater and drifting E. A few blocks were ejected along with the ash clouds (figure 19).
Pfeiffer also reported that at more irregular intervals, about 10-30 min apart, more violent, small vulcanian explosions interrupted the weaker ash venting events. The more violent explosions consisted of a sudden spray of mostly solid rocks and few incandescent scoria, followed by more powerful and turbulent ash plumes that rose up to 1 km above the crater (figure 20). Generally, these vulcanian explosions occurred after a slightly longer quiet period and, in most cases, the length of the quiet period correlated with the force of the explosion.
Pfeiffer noted that several more powerful explosions occurred at intervals of approximately 16-24 hours. The strongest, on 21-22 November, showered the whole island with incandescent blocks, ignited bush fires, and produced a very loud cannon-shot noise that rattled windows on the W coast of Java, 40 km away (figure 21).
Other, unusually large blasts occurred at around 0200 on 21 November and at around 0900 and 1320 on 23 November (figure 22). Early on 23 November, activity became more ash-rich and the vigor of the individual events increased slightly over the next two days. The pace of single explosions stayed at near-constant intervals of about 2 minutes. During 24-25 November, ash plumes typically rose to over 1 km above the crater and were easily visible from the W coast of Java. Based on a pilot report, on 24 November, the Darwin Volcanic Ash Advisory Center noted that an ash plume rose to an altitude of 3 km and drifted NE.
Based on the University of Hawaii's Institute of Geophysics and Planetology (HIGP) Thermal Alerts System MODVOLC analysis of MODIS (Moderate Resolution Imaging Spectroradiometer) satellite thermal anomaly data, occasional hot spots were identified by Terra or Aqua satellites. The thermal alerts occurred on twelve occasions between 27 October and 9 December 2007. Seven of these took place between 16 and 26 November 2007.
Geologic Background. The renowned Krakatau (frequently mis-named as Krakatoa) volcano lies in the Sunda Strait between Java and Sumatra. Collapse of an older edifice, perhaps in 416 or 535 CE, formed a 7-km-wide caldera. Remnants of that volcano are preserved in Verlaten and Lang Islands; subsequently the Rakata, Danan, and Perbuwatan cones were formed, coalescing to create the pre-1883 Krakatau Island. Caldera collapse during the catastrophic 1883 eruption destroyed Danan and Perbuwatan, and left only a remnant of Rakata. This eruption caused more than 36,000 fatalities, most as a result of tsunamis that swept the adjacent coastlines of Sumatra and Java. Pyroclastic surges traveled 40 km across the Sunda Strait and reached the Sumatra coast. After a quiescence of less than a half century, the post-collapse cone of Anak Krakatau (Child of Krakatau) was constructed within the 1883 caldera at a point between the former Danan and Perbuwatan cones. Anak Krakatau has been the site of frequent eruptions since 1927.
Information Contacts: Center of Volcanology and Geological Hazard Mitigation (CVGHM), Saut Simatupang, 57, Bandung 40122, Indonesia (URL: http://vsi.esdm.go.id/); Darwin Volcanic Ash Advisory Center, Bureau of Meteorology, Australia (URL: http://www.bom.gov.au/info/vac); Tom Pfeiffer, Volcano Discovery (URL: http://www.decadevolcano.net/, http://www.volcanodiscovery.com/volcano-tours/krakatau/photos.html); Associated Press (URL: http://www.ap.org/).
Llaima
Chile
38.692°S, 71.729°W; summit elev. 3125 m
All times are local (unless otherwise noted)
Ash plumes observed in May and August 2007; new eruption beginning 1 January 2008
From January 2002 through April 2003 (BGVN 29:02) there were increases in seismicity and fumarolic activity, along with minor eruptions, pronounced glacial melting, and substantial ash and gas plumes. Renewed activity consisting of minor eruptions was reported in May and possibly August 2007, but a larger eruption began on 1 January 2008. The source for most of the following is the Observatorio Volcanológico de los Andes del Sur (OVDAS)-SERNAGEOMIN (Volcano Observatory of the Southern Andes-Chile National Service of Geology and Mining).
On 26 May 2007, the Buenos Aires Volcanic Ash Advisory Center (VAAC) reported that ash plumes from Llaima rose to altitudes of 3-4.3 km and were visible on satellite imagery drifting E. A pilot reported another ash plume on 28 May that rose to an altitude of 5.5-6.7 km and drifted E. On 29 May, an ash plume rose to an altitude of 3 km and drifted E. No further activity was reported until 8 August, when pilots observed a plume to an altitude of 5.2 km drifting E. Ash was not identified on satellite imagery for this date.
Eruption during January 2008. Based on pilot reports and observations of satellite imagery, the Buenos Aires VAAC reported that on 1 January 2008 an ash plume rose to an altitude of 12.5 km and drifted E and ESE. The eruption began at 1820 hours, according to the Chile National Emergency Office. Lava was reported to be visible on the E flank and fumaroles at the summit were noted. The strong explosive activity prompted authorities to raise the Alert level to Yellow. According to news media reports, around 700 people were evacuated from local communities following the initial eruption, including about 200 tourists and National Forest Service employees from the Conguillo National Park. Most of the residents returned the following day when activity declined.
SERNAGEOMIN reported that tremor coincided with the onset of the gas and pyroclastic emissions on 1 January. Lava and incandescent material initially emitted were confined to the crater, but within a few hours, a Strombolian phase began. Soon, brightly glowing material covered much of the previously ice-covered summit (figure 14). Around the time of the eruption, an increase in volume of the Captrén river on the N flank was observed; this was likely a response to the glacial melting.
On the following day, observers on an overflight saw small emissions of ash and gas (mainly steam) and three small lahars on the N and W flanks. Tremor decreased, though explosions continued. Based on pilot reports and satellite imagery, the Buenos Aires VAAC reported that an ash plume rose to an altitude of 12.5 km and drifted E (figure 15). A later overflight revealed that the explosion on 2 January occurred at an area high on the E flank, outside the summit crater. A lava flow on the E flank was also noted. On 3 January an ash plume was visible on satellite imagery at an altitude of 3.7 km drifting NE. Airborne observers noted small sporadic gas-and-ash emissions.
In addition to ash, Llaima's eruption released considerable sulfur dioxide (SO2), identified by satellite instruments in the days following the 1 January eruption (figure 16). The initially intense SO2 plume dispersed as it moved E. On 4 January, the plume passed over Tristan da Cunha, a remote archipelago in the South Atlantic Ocean (figure 16). According to Charles Holliday, Simon Carn, and Michon Scott, the SO2 dissipated after 6 January 2008.
Between 1835 and 1915 on 6 January 2008 a helicopter overflight was conducted, coordinated by Jaime Pinto, Director of the Araucania Region Emergency Office (OREMI). Observers noted that main crater vent was clogged with lava (figure 17), which, after the eruption, dropped a few dozen meters inside the crater. During the eruption, lava diverged into two areas in the main crater, draining flows to the W and NE and melting the ice. The melted ice produced three lahars toward the W flank, which merged into one that entered the Calbuco River. To the NE, the melted ice generated a single channel lahar that flowed into the Captrén River, cutting the road in several locations. A small lahar also traveled to the E. The dispersion of ash and gases was mainly to the E, although initially they went ESE. There were abundant cracks seen in the glaciers in the SW and SE of the main crater, particularly in the SE.
SERNAGEOMIN reported that during 10-14 January 2008 seismicity decreased in terms of energy, but increased in the number of events. Based on seismic interpretation, weak explosions produced plumes of gas and ash that drifted NE. On 11 January, the upper surface of lava flows on the W flank that were observed during an overflight were cooled and snow-covered near the crater, but snow-free, and therefore still hot, about 500 m farther downslope. Blocks of incandescent material rolled ~ 1.5 km downslope and caused steam emissions where they contacted the glacier. Abundant cracks in glaciers to the SW of the crater were noted. Based on observations of satellite imagery and pilot reports, the Buenos Aires VAAC reported that ash plumes rose to an altitude of 5.5-6.7 km and drifted NE on 11 January and SW on 13 January.
Eruptive activity continued during the second half of January from the main crater and from two craters and a fissure on the E flank. The main crater contained three active pyroclastic cones. On 16 January one of the craters, ~ 15 m in diameter, produced ash plumes that rose to an altitude of ~ 3.6 km. Glaciers on the NE slope and W flank were fractured and dislocated. Ash plumes rising from the E flank attained an altitude of 4.1 km. Ash emissions vented from a NE-trending fissure ~ 80 m long and ~ 10 m wide. On 16-17 January glowing rocks were emitted from the fissure's NE end; ash plumes caused by rolling rocks rose from multiple areas.
At 0732 on 18 January, an explosion from the E flank sent an ash plume to an altitude of 9.1 km that quickly dispersed NE. People later saw a small lateral explosion from the same area, ash-and-gas emissions from several points, and a new fissure.
On 19 January, an explosion produced an ash plume that rose to an altitude of 4.1 km. An overflight revealed Strombolian activity in the main crater from a new pyroclastic cone that was 120 m in diameter and 100 m high; the cone was absent during a 17 January overflight. A second crater to the SW emitted gas. Sporadic ash emissions were noted from the E sector and an explosion produced a pyroclastic flow and an ash plume that quickly dissipated. On 20 January, another explosion produced an ash plume that rose to an altitude of 4.1 km. Gas and ash emissions were again noted from multiple areas. On 21 January, cloud cover prevented visual observations, but one small ash emission was seen at the end of the day.
On 23 January, a brown ash plume rose to an altitude of 3.5 km and drifted W. Observers on an overflight later that day saw Strombolian eruptions from the pyroclastic cone in the main crater accompanied by emissions of brown ash. A small hornito emitting bluish gas and a lava field were noted between the pyroclastic cone and the inner margins of the crater. Explosions from the E flank were detected on 24 January, and on 26 January steam plumes were observed. Strombolian eruptions in the main crater accompanied by gas and ash emissions continued during through 27 January. Ash plumes rose to altitudes of 3.3-4.1 km and drifted NW, E, SE, and S.
MODVOLC Thermal Alerts. Numerous MODIS thermal anomalies were measured almost daily throughout the month of January 2008 (table 2). As shown by the number of pixels for various observing time, the anomalies covered a particularly large area on 2 January (24 pixels). In contrast, anomalies were absent during the previous intervals of 1 January 2002 through 26 April 2007, and 16 June 2007 through 1 January 2008.
Table 2. Thermal anomalies measured by MODIS/MODVOLC over Llaima from 27 April 2007 through 30 January 2008. No anomalies were detected from 2002 through 26 April 2007, or 16 June 2007 through 1 January 2008. Courtesy of HIGP Thermal Anomalies Team.
| Date |
Time (UTC) |
Pixels |
Satellite |
| 27 Apr 2007 |
1910 |
3 |
Aqua |
| 14 Jun 2007 |
1455 |
5 |
Terra |
| 15 Jun 2007 |
0515 |
1 |
Aqua |
| 02 Jan 2008 |
0250 |
2 |
Terra |
| 02 Jan 2008 |
0430 |
9 |
Terra |
| 02 Jan 2008 |
0605 |
24 |
Aqua |
| 02 Jan 2008 |
1355 |
2 |
Terra |
| 02 Jan 2008 |
1535 |
3 |
Terra |
| 02 Jan 2008 |
1810 |
2 |
Aqua |
| 03 Jan 2008 |
0335 |
4 |
Terra |
| 03 Jan 2008 |
0510 |
2 |
Aqua |
| 03 Jan 2008 |
1440 |
1 |
Terra |
| 03 Jan 2008 |
1850 |
1 |
Aqua |
| 04 Jan 2008 |
0555 |
3 |
Aqua |
| 05 Jan 2008 |
0320 |
1 |
Terra |
| 06 Jan 2008 |
0545 |
1 |
Aqua |
| 11 Jan 2008 |
0425 |
1 |
Terra |
| 11 Jan 2008 |
0600 |
2 |
Aqua |
| 12 Jan 2008 |
0330 |
1 |
Terra |
| 14 Jan 2008 |
0630 |
1 |
Aqua |
| 15 Jan 2008 |
0400 |
1 |
Terra |
| 15 Jan 2008 |
0535 |
1 |
Aqua |
| 16 Jan 2008 |
0620 |
2 |
Aqua |
| 17 Jan 2008 |
0345 |
1 |
Terra |
| 17 Jan 2008 |
0525 |
3 |
Aqua |
| 17 Jan 2008 |
1450 |
2 |
Terra |
| 18 Jan 2008 |
0605 |
1 |
Aqua |
| 20 Jan 2008 |
0555 |
1 |
Aqua |
| 22 Jan 2008 |
0405 |
1 |
Terra |
| 22 Jan 2008 |
0545 |
2 |
Aqua |
| 23 Jan 2008 |
0625 |
1 |
Aqua |
| 24 Jan 2008 |
0530 |
3 |
Aqua |
| 24 Jan 2008 |
1455 |
1 |
Terra |
| 25 Jan 2008 |
0255 |
3 |
Terra |
| 25 Jan 2008 |
0615 |
4 |
Aqua |
| 26 Jan 2008 |
0340 |
2 |
Terra |
| 26 Jan 2008 |
0520 |
2 |
Aqua |
| 26 Jan 2008 |
1445 |
1 |
Aqua |
| 27 Jan 2008 |
0425 |
2 |
Terra |
| 27 Jan 2008 |
0600 |
2 |
Aqua |
| 27 Jan 2008 |
1525 |
1 |
Terra |
| 28 Jan 2008 |
0330 |
4 |
Terra |
| 28 Jan 2008 |
0505 |
4 |
Aqua |
| 28 Jan 2008 |
1845 |
1 |
Aqua |
| 29 Jan 2008 |
0410 |
4 |
Terra |
| 29 Jan 2008 |
0550 |
2 |
Aqua |
| 30 Jan 2008 |
0315 |
2 |
Terra |
| 30 Jan 2008 |
0630 |
4 |
Aqua |
| 30 Jan 2008 |
1420 |
5 |
Terra |
| 31 Jan 2008 |
0400 |
6 |
Terra |
| 31 Jan 2008 |
0535 |
3 |
Aqua |
| 31 Jan 2008 |
1915 |
3 |
Aqua |
Geologic Background. Llaima, one of Chile's largest and most active volcanoes, contains two main historically active craters, one at the summit and the other, Pichillaima, to the SE. The massive, dominantly basaltic-to-andesitic, stratovolcano has a volume of 400 km3. A Holocene edifice built primarily of accumulated lava flows was constructed over an 8-km-wide caldera that formed about 13,200 years ago, following the eruption of the 24 km3 Curacautín Ignimbrite. More than 40 scoria cones dot the volcano's flanks. Following the end of an explosive stage about 7200 years ago, construction of the present edifice began, characterized by Strombolian, Hawaiian, and infrequent subplinian eruptions. Frequent moderate explosive eruptions with occasional lava flows have been recorded since the 17th century.
Information Contacts: Servico Nacional de Geologia y Mineria (SERNAGEOMIN), Avda Sta María N° 0104, Santiago, Chile (URL: http://www.sernageomin.cl/); Buenos Aires Volcanic Ash Advisory Center (VAAC), Servicio Meteorológico Nacional-Fuerza Aérea Argentina, 25 de mayo 658, Buenos Aires, Argentina (URL: http://www.smn.gov.ar/vaac/buenosaires/productos.php); Simon Carn, Joint Center for Earth Systems Technology (JCET), University of Maryland Baltimore County (UMBC); Charles Holliday, U.S. Air Force Weather Agency (AFWA)/XOGM, Offutt Air Force Base, NE 68113, USA; Hawai'i Institute of Geophysics and Planetology (HIGP) Thermal Alerts System, School of Ocean and Earth Science and Technology (SOEST), Univ. of Hawai'i, 2525 Correa Road, Honolulu, HI 96822, USA (URL: http://modis.higp.hawaii.edu/); Associated Press (URL: http://www.ap.org/); United Nations Office for the Coordination of Humanitarian Affairs (OCHA) (URL: https://reliefweb.int/); Antonio Vergara, Temuco, Chile (URL: http://www.flickr.com/people/odiofotolog/).
Sheveluch (Russia) — January 2008 Cite this Report
Sheveluch
Russia
56.653°N, 161.36°E; summit elev. 3283 m
All times are local (unless otherwise noted)
Lava-dome growth and block-and-ash flows continue April-December 2007
Shiveluch (also spelled Sheveluch), the scene of lava-dome growth, is one of the most active volcanoes on Kamchatka. It was last reported here discussing events through early April 2007 (BGVN 32:03). The following report covering the interval early April-December 2007 came from multiple sources.
Shiveluch's eruptions are of an explosive nature and the volcano has been in a state of heightened activity since 5 December 2006. Vigorous activity continued to the time of this report (March 2008). Small lava-dome collapse events produced ash plumes and short block-and-ash flows, which in turn generated mudflows when snow was present. This activity was recorded in shallow volcanic earthquakes and tremor and a large, ever-present thermal anomaly on satellite imagery.
The Level of Concern Color Code remained at Orange throughout this report period (early April through December 2007). The Kamchatka Branch of the Geophysical Service of the Russian Academy of Sciences (KB GS RAS) is monitoring the volcano and believes that it poses little danger for nearby populated localities.
During April 2007 growth of the lava dome continued, and hot lava extruded at the top of the dome. Hot avalanches from the top of the dome occurred daily. Ash and ash-and-steam plumes rose to altitudes of ~ 4.6-6.5 km. Some plumes were seen on satellite imagery drifting E, SE, and S. According to satellite data, ash plumes extended ~ 60 km on 28-29 April, mainly to the S and SW, and ~ 50 km to the E on 5 and 7 May. During 27-28 May, plumes were seen on satellite imagery drifting SW.
A large thermal anomaly was conspicious during the last week of April 2007, and hot avalanches originating from the dome were noted on 30 April, 4 May, and 6-7 May. Gas-steam emissions occurred repeatedly. On 7 May a mudflow traveled down Shiveluch's slope, reaching ~ 20 km beyond the lava dome and blocking ~ 30 m of a road, isolating the district center Ust-Kamchatsk on the E of the peninsula. There were no vehicles on this portion of the road when the mudflow descended, and no casualties occurred. Figure 12 contrasts the dome in 2006 and 2007.
During July, gas-steam plumes frequently reached 4.0-6.1 km altitude. Ash was not always identified on satellite imagery because clouds obscured visibility; however, on 16 July satellite imagery detected gas-steam and ash plumes that extended for about 7-40 km to the S and SW of the volcano. Seismic data suggested that gas-and-ash emissions were concurrent with hot avalanches (figure 13).
On 25 September 2007, video observations indicated ash plumes rising to 6 km altitude and drifting E. According to video for 27 September and 2 October 2007, gas-steam plumes rose up to 4.5 and 3.5 km altitude, respectively. Weak fumarolic activity was noted on both 1 and 8 October. KB GS RAS noted that there was no significant variation in the previous ongoing activity through December 2007 that might indicate any impending activity of greater significance. Frequent MODIS thermal alerts continued throughout 2007 into 2008.
Reference. Gorbach, N., 31 July 2007, Bulletin of activity at Sheveluch volcano, issued 31 July 2007 [title approximate (translated from Russian); available in Russian at URL: http://www.kscnet.ru/ivs/volcanoes/inform_messages/2007/Sheveluch_072007/Sheveluch_072007.html).
Geologic Background. The high, isolated massif of Sheveluch volcano (also spelled Shiveluch) rises above the lowlands NNE of the Kliuchevskaya volcano group. The 1,300 km3 andesitic volcano is one of Kamchatka's largest and most active volcanic structures, with at least 60 large eruptions during the Holocene. The summit of roughly 65,000-year-old Stary Shiveluch is truncated by a broad 9-km-wide late-Pleistocene caldera breached to the south. Many lava domes occur on its outer flanks. The Molodoy Shiveluch lava dome complex was constructed during the Holocene within the large open caldera; Holocene lava dome extrusion also took place on the flanks of Stary Shiveluch. Widespread tephra layers from these eruptions have provided valuable time markers for dating volcanic events in Kamchatka. Frequent collapses of dome complexes, most recently in 1964, have produced debris avalanches whose deposits cover much of the floor of the breached caldera.
Information Contacts: Yuri Demyanchuk, Natasha Gorbsch, and theKamchatka Volcanic Eruptions Response Team (KVERT), Institute of Volcanology and Seismology, Far East Division, Russian Academy of Sciences, Piip Ave. 9, Petropavlovsk-Kamchatsky, 683006, Russia (URL: http://www.kscnet.ru/ivs/); Kamchatka Branch of the Geophysical Service of the Russian Academy of Sciences (KB GS RAS), Russia (URL: http://www.emsd.ru/); Alaska Volcano Observatory (AVO), a cooperative program of the U.S. Geological Survey, 4200 University Drive, Anchorage, AK 99508-4667, USA (URL: http://www.avo.alaska.edu/), Geophysical Institute, University of Alaska, PO Box 757320, Fairbanks, AK 99775-7320, USA, and the Alaska Division of Geological and Geophysical Surveys, 794 University Ave., Suite 200, Fairbanks, AK 99709, USA.
Turrialba (Costa Rica) — January 2008 Cite this Report
Turrialba
Costa Rica
10.025°N, 83.767°W; summit elev. 3340 m
All times are local (unless otherwise noted)
Fumarolic increases during August 2007-January 2008
Enhanced fumarolic activity accompanied by new fractures at the summit was noted during June-September 2007 (BGVN 32:08). The earlier report noted that the fumaroles had spread over a larger area and contained molten sulfur, a condensate previously not seen here in more than 25 years of continuous monitoring by the Observatorio Vulcanológico y Sismológico de Costa Rica-Universidad Nacional (OVSICORI-UNA). By mid-August 2007, acute chemical burning of important patches of natural forest had occurred. This report covers the period from October 2007 through January 2008.
During October, new sites of gas discharge, small landslides, and accelerated vegetation die-off were noted from various locations within and around the crater. Fumaroles were active and widespread across the central crater. Many exhibited sulfur deposits and those in the S, SE, and SW reached a temperature of 91°C.
Areas burned by acute acidification extended during November. Fieldwork conducted by OVSICORI-UNA confirmed an unusual output of gas from several fumaroles along the S outer wall of the volcano. Pastures turned yellowish near the upper areas, and native and exotic tree species were impacted as well as birch tree patches along most drainage basins.
During December, within the W crater, fumarole temperatures reached 280°C and significant sulfur deposits were noted. Local residents confirmed an unusual output of gas from several fumaroles along the S outer wall of the volcano. Areas burned by acute acidification extended during the month. On 5 December, members of the media and local communities observed a gas-and-steam plume from Turrialba that rose to an altitude greater than 5.3 km (figure 12).
On a team visit between 30 and 31 January 2008, OVSICORI staff documented the progression of fumarolic activity in the W crater, the external W crater walls, and distant areas towards the W, NW, and SW. Some of the fumaroles correspond with two fractures. One to the SW of the W crater, trending SW, was 100 m in length and 2 to 3 cm wide, and deposited sulfur. The second crack to the NW of the W crater, also trending SW , had temperatures of 72°C and discharged steam and gas affecting the adjacent vegetation. To the NW of the W crater, the team studied an area of about 20 x 50 m with constant gas emission and a temperature of 88°C.
Geologic Background. Turrialba, the easternmost of Costa Rica's Holocene volcanoes, is a large vegetated basaltic-to-dacitic stratovolcano located across a broad saddle NE of Irazú volcano overlooking the city of Cartago. The massive edifice covers an area of 500 km2. Three well-defined craters occur at the upper SW end of a broad 800 x 2200 m summit depression that is breached to the NE. Most activity originated from the summit vent complex, but two pyroclastic cones are located on the SW flank. Five major explosive eruptions have occurred during the past 3500 years. A series of explosive eruptions during the 19th century were sometimes accompanied by pyroclastic flows. Fumarolic activity continues at the central and SW summit craters.
Information Contacts: Eliécer Duarte, Erick Fernández, and Vilma Barboza, Observatorio Vulcanológico y Sismológico de Costa Rica, Universidad Nacional (OVSICORI-UNA), Apdo. 2346-3000, Heredia, Costa Rica (URL: http://www.ovsicori.una.ac.cr/); Tellez and Francois Robichaud, Université de Sherbrooke, 2500 boul. de l'Université, Sherbrooke, Québec J1K 2R1, Canada.
Ubinas
Peru
16.345°S, 70.8972°W; summit elev. 5608 m
All times are local (unless otherwise noted)
Continuing ashfall during 2006-2007
Ubinas began erupting ash on 25 March 2006 (BGVN 31:03 and 31:05). As reported in BGVN 31:10, ash eruptions and steam emissions continued through 31 October 2006. This report discusses ongoing eruptions through December 2007 as drawn from Buenos Aires Volcanic Ash Advisory Center (VAAC) reports and the Instituto Geológical Minero y Metalúrgico (INGEMMET).
From November 2006 through December 2007, emissions of volcanic ash, rocks, and gases with water and steam were essentially continuous. INGEMMET authorities indicated that during March 2007 the volcano generated increased ashfall behavior that significantly affected people and the environment. At the beginning of the month, small explosions occurred every 6-8 days but the rate of activity increased toward the end. On 30 March 2007, nearby residents felt a strong explosion. A large ash plume vented from the volcano's summit and local communities were blanketed beneath falling ash. According to INGEMMET authorities, most of Querapi, a town ~ 4.5 km SE of the crater's active vent, was covered in volcanic ash, and the town of Anascapa, 6 km E, also experienced ashfall.
Volcanic ash clouds blown into the atmosphere also presented a hazard to aviation. As summarized in table 3, ash clouds were nearly continuously reported by the Buenos Aires VAAC and the INGEMMET. Plume heights reached as high as 9.1 km in May and again in November 2007. The aviation warning color code was generally Red through the period. The reports were based on satellite imagery and pilot reports. No thermal alerts were noted from the University of Hawaii's Institute of Geophysics and Planetology (HIGP) MODIS satellite-based thermal alert system during 2006 or 2007.
Table 3. Compilation of Volcanic Ash Advisories for aviation from Ubinas during November 2006 through December 2007. Courtesy of the Buenos Aires Volcanic Ash Advisory Center (VAAC) and the Instituto Geológical Minero y Metalúrgico (INGEMMET).
| Date |
Altitude of Plume (km) |
Flight Level (thousands of feet) |
Direction of Plume |
| 3-16 Nov 2006 |
5.5-7.3 |
190-260 |
SW, S, SW |
| 25 Nov 2006 |
5.5 |
180 |
NE |
| 2 Dec 2006 |
5.5 |
180 |
N |
| 27-30 Dec 2006 |
4.9-8.5 |
160-280 |
E |
| 28 Jan 2007 |
5.5-6.9 |
180-220 |
SE |
| 2-5 Feb 2007 |
5.5 |
180 |
S, SW |
| 18-21 Feb 2007 |
5.5-7.0 |
180-230 |
E, SW |
| 11, 14 Mar 2007 |
5.5-6.4 |
180-210 |
N, SW |
| 30 Mar 2007 |
5.5 |
180 |
E |
| 5, 7-9, 10-11 Apr 2007 |
5.5-7.8 |
180-270 |
E, SE, S, SW, W |
| 17-18, 22, 24 Apr 2007 |
5.5-7.2 |
180-280 |
NW, SW, SE |
| 2-5 May 2007 |
5.5-9.1 |
180/300 |
N, S, SE, SW |
| 12, 15-16 May 2007 |
5.5-8.2 |
180-270 |
SE, N, SW |
| 17, 19-22 May 2007 |
5.5-9.1 |
180-300 |
E, SE |
| 22-28 May 2007 |
5.5-7.3 |
180-240 |
NE, SE |
| 30 May-6 Jun 2007 |
3.7-7.6 |
120-250 |
NE, SE |
| 12-17 Jun 2007 |
5.5-6.7 |
180-230 |
NE, E, SW, W |
| 27-28 Jun 2007 |
5.5-6.7 |
180-230 |
SW, NW, E |
| 4 Jul 2007 |
5.5-6.1 |
180-200 |
S |
| 23-25 Jul 2007 |
5.9-6.1 |
190-200 |
SE, S |
| 9 Aug 2007 |
6.1 |
200 |
SE |
| 11-14 Sep 2007 |
5.5-7.6 |
180-250 |
E, SE |
| 20 Sep 2007 |
5.5-6.4 |
180-210 |
E |
| 5-7 Oct 2007 |
5.5-6.4 |
180-210 |
N, S |
| 11-13, 15 Oct 2007 |
5.5-7.6 |
180-250 |
N, SE |
| 19-27 Oct 2007 |
5.5-8.5 |
180-280 |
NW, NE |
| 1, 3-6 Nov 2007 |
5.5-7.6 |
180-250 |
NE, SE |
| 11-12 Nov 2007 |
5.5-6.7 |
180-220 |
NE |
| 16, 18, 20 Nov 2007 |
5.5-7.9 |
180-260 |
NE |
| 24-27 Nov 2007 |
6.1-9.1 |
200-300 |
SE, E, SW |
| 28-29 Nov 2007 |
6.7-7.6 |
220-250 |
SW, NE |
| 4-7, 10 Dec 2007 |
5.5-8.5 |
180-280 |
NE |
| 17 Dec 2007 |
5.5-6.7 |
180-220 |
N |
Geologic Background. The truncated appearance of Ubinas, Perú's most active volcano, is a result of a 1.4-km-wide crater at the summit. It is the northernmost of three young volcanoes located along a regional structural lineament about 50 km behind the main volcanic front. The growth and destruction of Ubinas I was followed by construction of Ubinas II beginning in the mid-Pleistocene. The upper slopes of the andesitic-to-rhyolitic Ubinas II stratovolcano are composed primarily of andesitic and trachyandesitic lava flows and steepen to nearly 45°. The steep-walled, 150-m-deep summit crater contains an ash cone with a 500-m-wide funnel-shaped vent that is 200 m deep. Debris-avalanche deposits from the collapse of the SE flank about 3,700 years ago extend 10 km from the volcano. Widespread Plinian pumice-fall deposits include one from about 1,000 years ago. Holocene lava flows are visible on the flanks, but activity documented since the 16th century has consisted of intermittent minor-to-moderate explosive eruptions.
Information Contacts: Instituto Geológical Minero y Metalúrgico (INGEMMET), Av. Canadá 1470, San Borja, Lima 41, Perú (URL: http://www.ingemmet.gob.pe/); Buenos Aires Volcanic Ash Advisory Center (VAAC), Argentina (URL: http://www.smn.gov.ar/vaac/buenosaires/productos.php).