Recently Published Bulletin Reports
Agung (Indonesia) Three eruptive events reported in April, May, and December 2022
Tengger Caldera (Indonesia) Minor ash emission in December 2023; persistent weak thermal anomaly in the Bromo crater
Saunders (United Kingdom) Persistent thermal anomalies from the summit crater lava lake during February 2023-January 2024
Shishaldin (United States) New eruption with significant Strombolian explosions, ash plumes, and ashfall
Ioto (Japan) New eruption with discolored water, ejecta, and floating pumice during October-December 2023
Purace (Colombia) Gas-and-ash emission on 16 November 2023
Etna (Italy) Strombolian explosions, lava fountains, and lava flows during July-August 2023
Suwanosejima (Japan) Eruption plumes, crater incandescence, and occasional explosions during July-October 2023
Aira (Japan) Explosions, ash plumes, ash fall, and crater incandescence during July-October 2023
Nishinoshima (Japan) Gray emissions during October 2023
Kilauea (United States) Strong lava fountains, lava flows, and spatter at Halema’uma’u during January-September 2023
Tinakula (Solomon Islands) Continued lava flows and thermal activity during June through November 2023
Agung (Indonesia) — January 2024  Cite this Report
Agung
Indonesia
8.343°S, 115.508°E; summit elev. 2997 m
All times are local (unless otherwise noted)
Three eruptive events reported in April, May, and December 2022
Mount Agung, located on the E end of the island of Bali, Indonesia, rises above the SE rim of the Batur caldera. The summit area extends 1.5 km E-W, with the highest point on the W and a steep-walled 800-m-wide crater on the E. Recorded eruptions date back to the early 19th century. A large and deadly explosive and effusive eruption occurred during 1963-64, which was characterized by voluminous ashfall, pyroclastic flows, and lahars that caused extensive damage and many fatalities. More recent activity was documented during November 2017-June 2019 that consisted of multiple explosions, significant ash plumes, lava flows at the summit crater, and incandescent ejecta. This report covers activity reported during April-May 2022 and December 2022 based on data from the Darwin Volcanic Ash Advisory Center (VAAC).
Activity during 2022 was relatively low and mainly consisted of a few ash plumes during April-May and December. An ash plume on 3 April rising to 3.7 km altitude (700 m above the summit) and drifting N was reported in a Darwin VAAC notice based on a ground report, with ash seen in HIMAWARI-8 visible imagery. Another ash plume was reported at 1120 on 27 May that rose to 5.5 km altitude (2.5 m above the summit); the plume was not visible in satellite or webcam images due to weather clouds. An eruption was reported based on seismic data at 0840 on 13 December, with an estimated plume altitude of 3.7 km; however, no ash was seen using satellite imagery in clear conditions before weather clouds obscured the summit.
Geologic Background. Symmetrical Agung stratovolcano, Bali's highest and most sacred mountain, towers over the eastern end of the island. The volcano, whose name means "Paramount," rises above the SE rim of the Batur caldera, and the northern and southern flanks extend to the coast. The summit area extends 1.5 km E-W, with the high point on the W and a steep-walled 800-m-wide crater on the E. The Pawon cone is located low on the SE flank. Only a few eruptions dating back to the early 19th century have been recorded in historical time. The 1963-64 eruption, one of the largest in the 20th century, produced voluminous ashfall along with devastating pyroclastic flows and lahars that caused extensive damage and many fatalities.
Information Contacts: Darwin Volcanic Ash Advisory Centre (VAAC), Bureau of Meteorology, Northern Territory Regional Office, PO Box 40050, Casuarina, NT 0811, Australia (URL: http://www.bom.gov.au/info/vaac/).
Tengger Caldera (Indonesia) — February 2024 Cite this Report
Tengger Caldera
Indonesia
7.942°S, 112.95°E; summit elev. 2329 m
All times are local (unless otherwise noted)
Minor ash emission in December 2023; persistent weak thermal anomaly in the Bromo crater
Tengger Caldera, located at the N end of a volcanic massif in Indonesia’s East Java, consists of five overlapping stratovolcanoes. The youngest and only active cone in the 16-km-wide caldera is Bromo, which typically produces gas-and-steam plumes, occasional ash plumes and explosions, and weak thermal signals (BGVN 44:05, 47:01). This report covers activity during January 2022-December 2023, consisting of mostly white gas-and-steam emissions and persistent weak thermal anomalies. Information was provided by the Pusat Vulkanologi dan Mitigasi Bencana Geologi (PVMBG, also known as Indonesian Center for Volcanology and Geological Hazard Mitigation, CVGHM) and satellite imagery. The Alert Level remained at 2 (on a scale of 1-4), and visitors were warned to stay at least 1 km from the crater.
Activity was generally low during the reporting period, similar to that in 2021. According to almost daily images from MAGMA Indonesia (a platform developed by PVMBG), white emissions and plumes rose from 50 to 900 m above the main crater during this period (figure 24). During several days in March and June 2022, white plumes reached heights of 1-1.2 km above the crater.
After an increase in activity at 2114 on 3 February 2023, a PVMBG team that was sent to observe white emissions rising as high as 300 m during 9-12 February and heard rumbling noises. A sulfur dioxide odor was also strong near the crater and measurements indicated that levels were above the healthy (non-hazardous) threshold of 5 parts per million; differential optical absorption spectroscopy (DOAS) measurements indicated an average flux of 190 metric tons per day on 11 February. Incandescence originating from a large fumarole in the NNW part of the crater was visible at night. The team observed that vegetation on the E caldera wall was yellow and withered. The seismic network recorded continuous tremor and deep and shallow volcanic earthquakes.
According to a PVMBG press release, activity increased on 13 December 2023 with white, gray, and brown emissions rising as high as 900 m above Bromo’s crater rim and drifting in multiple directions (figure 25). The report noted that tremor was continuous and was accompanied in December by three volcanic earthquakes. Deformation data indicated inflation in December. There was no observable difference in the persistent thermal anomaly in the crater between 11 and 16 December 2023.
All clear views of the Bromo crater throughout this time, using Sentinel-2 infrared satellite images, showed a weak persistent thermal anomaly; none of the anomalies were strong enough to cause MODVOLC Thermal Alerts. A fire in the SE part of the caldera in early September 2023 resulted in a brief period of strong thermal anomalies.
Geologic Background. The 16-km-wide Tengger caldera is located at the northern end of a volcanic massif extending from Semeru volcano. The massive volcanic complex dates back to about 820,000 years ago and consists of five overlapping stratovolcanoes, each truncated by a caldera. Lava domes, pyroclastic cones, and a maar occupy the flanks of the massif. The Ngadisari caldera at the NE end of the complex formed about 150,000 years ago and is now drained through the Sapikerep valley. The most recent of the calderas is the 9 x 10 km wide Sandsea caldera at the SW end of the complex, which formed incrementally during the late Pleistocene and early Holocene. An overlapping cluster of post-caldera cones was constructed on the floor of the Sandsea caldera within the past several thousand years. The youngest of these is Bromo, one of Java's most active and most frequently visited volcanoes.
Information Contacts: Pusat Vulkanologi dan Mitigasi Bencana Geologi (PVMBG, also known as Indonesian Center for Volcanology and Geological Hazard Mitigation, CVGHM), Jalan Diponegoro 57, Bandung 40122, Indonesia (URL: http://www.vsi.esdm.go.id/); MAGMA Indonesia, Kementerian Energi dan Sumber Daya Mineral (URL: https://magma.esdm.go.id/v1); Copernicus Browser, Copernicus Data Space Ecosystem, European Space Agency (URL: https://dataspace.copernicus.eu/browser/); Hawai'i Institute of Geophysics and Planetology (HIGP) - MODVOLC Thermal Alerts System, School of Ocean and Earth Science and Technology (SOEST), Univ. of Hawai'i, 2525 Correa Road, Honolulu, HI 96822, USA (URL: http://modis.higp.hawaii.edu/).
Saunders (United Kingdom) — February 2024 Cite this Report
Saunders
United Kingdom
57.8°S, 26.483°W; summit elev. 843 m
All times are local (unless otherwise noted)
Persistent thermal anomalies from the summit crater lava lake during February 2023-January 2024
Saunders is one of eleven islands that comprise the South Sandwich Islands in the South Atlantic. The active Mount Michael volcano has been in almost continuous eruption since November 2014 (BGVN 48:02). Recent activity has resulted in intermittent thermal anomalies and gas-and-steam emissions (BGVN 47:03, 48:02). Visits are infrequent due to its remote location, and cloud cover often prevents satellite observations. Satellite thermal imagery and visual observation of incandescence during a research expedition in 2019 (BGVN 28:02 and 44:08) and a finding confirmed by a National Geographic Society research team that summited Michael in November 2022 reported the presence of a lava lake.
Although nearly constant cloud cover during February 2023 through January 2024 greatly limited satellite observations, thermal anomalies from the lava lake in the summit crater were detected on clear days, especially around 20-23 August 2023. Anomalies similar to previous years (eg. BGVN 48:02) were seen in both MIROVA (Middle InfraRed Observation of Volcanic Activity) data from MODIS instruments and in Sentinel 2 infrared imagery. The only notable sulfur dioxide plume detected near Saunders was on 25 September 2023, with the TROPOMI instrument aboard the Sentinel-5P satellite.
Geologic Background. Saunders Island consists of a large central volcanic edifice intersected by two seamount chains, as shown by bathymetric mapping (Leat et al., 2013). The young Mount Michael stratovolcano dominates the glacier-covered island, while two submarine plateaus, Harpers Bank and Saunders Bank, extend north. The symmetrical Michael has a 500-m-wide summit crater and a remnant of a somma rim to the SE. Tephra layers visible in ice cliffs surrounding the island are evidence of recent eruptions. Ash clouds were reported from the summit crater in 1819, and an effusive eruption was inferred to have occurred from a N-flank fissure around the end of the 19th century and beginning of the 20th century. A low ice-free lava platform, Blackstone Plain, is located on the north coast, surrounding a group of former sea stacks. A cluster of cones on the SE flank, the Ashen Hills, appear to have been modified since 1820 (LeMasurier and Thomson, 1990). Analysis of satellite imagery available since 1989 (Gray et al., 2019; MODVOLC) suggests frequent eruptive activity (when weather conditions allow), volcanic clouds, steam plumes, and thermal anomalies indicative of a persistent, or at least frequently active, lava lake in the summit crater. Due to this observational bias, there has been a presumption when defining eruptive periods that activity has been ongoing unless there is no evidence for at least 10 months.
Information Contacts: MIROVA (Middle InfraRed Observation of Volcanic Activity), a collaborative project between the Universities of Turin and Florence (Italy) supported by the Centre for Volcanic Risk of the Italian Civil Protection Department (URL: http://www.mirovaweb.it/); NASA Global Sulfur Dioxide Monitoring Page, Atmospheric Chemistry and Dynamics Laboratory, NASA Goddard Space Flight Center (NASA/GSFC), 8800 Greenbelt Road, Goddard MD 20771, USA (URL: https://so2.gsfc.nasa.gov/); Copernicus Browser (URL: https://dataspace.copernicus.eu/browser).
Shishaldin (United States) — December 2023 Cite this Report
Shishaldin
United States
54.756°N, 163.97°W; summit elev. 2857 m
All times are local (unless otherwise noted)
New eruption with significant Strombolian explosions, ash plumes, and ashfall
Shishaldin is located on the eastern half of Unimak Island, one of the Aleutian Islands. Frequent explosive activity, primarily consisting of Strombolian ash eruptions from the small summit crater, but sometimes producing lava flows, has been recorded since the 18th century. The previous eruption ended in May 2020 and was characterized by intermittent thermal activity, increased seismicity and surface temperatures, ash plumes, and ash deposits (BGVN 45:06). This report covers a new eruption during July through November 2023, which consisted of significant explosions, ash plumes, ashfall, and lava fountaining. Information comes from daily, weekly, and special reports from the Alaska Volcano Observatory (AVO) and various satellite data. AVO monitors the volcano using local seismic and infrasound sensors, satellite data, web cameras, and remote infrasound and lightning networks.
AVO reported that intermittent tremor and low-frequency earthquakes had gradually become more regular and consistent during 10-13 July. Strongly elevated surface temperatures at the summit were identified in satellite images during 10-13 July. On 11 July AVO raised the Aviation Color Code (ACC) to Yellow (the second color on a four-color scale) and Volcano Alert Level (VAL) to Advisory (the second level on a four-level scale) at 1439. Later in the day on 11 July summit crater incandescence was observed in webcam images. Observations of the summit suggested that lava was likely present at the crater, which prompted AVO to raise the ACC to Orange (the second highest color on a four-color scale) and the VAL to Watch (the second highest level on a four-level scale). The US Coast Guard conducted an overflight on 12 July and confirmed that lava was erupting from the summit. That same day, sulfur dioxide emissions were detected in satellite images.
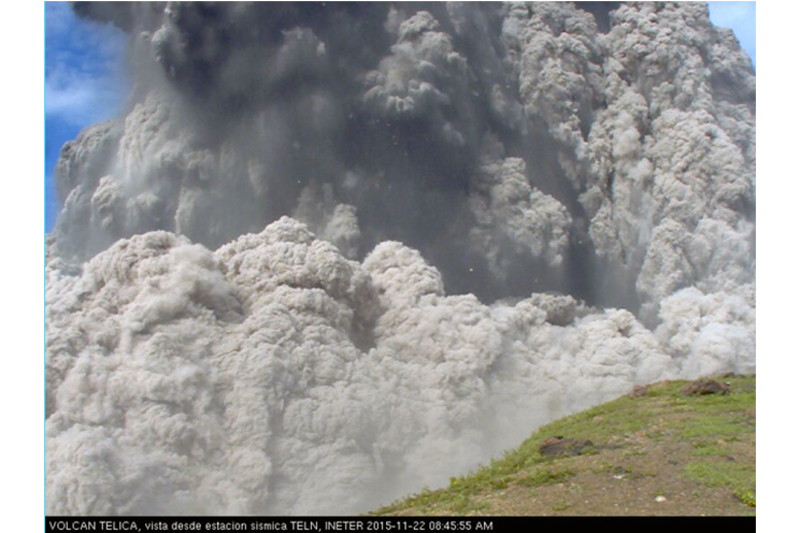
A significant explosion began at 0109 on 14 July that produced an ash plume that rose to 9-12 km altitude and drifted S over the Pacific Ocean (figure 43). Webcam images and photos taken around 0700 from a ship SW off Unimak Island showed small lahar deposits, which were the result of the interaction of hot pyroclastic material and snow and ice on the flanks. There was also ashfall on the SW and N flanks. A smaller explosion at 0710 generated an ash plume that rose to 4.5 km altitude. Webcam images and pilot reports showed continued low-level ash emissions during the morning, rising to less than 4.6 km altitude; those emissions included a small ash plume near the summit around 1030 resulting from a small explosion.
Seismic tremor amplitude began increasing at around 1700 on 15 July; strongly elevated surface temperatures were also reported. An ash plume rose to 4.6 km altitude and drifted SSE at 2100, based on a satellite image. A continuous ash plume during 2150 through 2330 rose to 5 km altitude and extended 125 km S. At 2357 AVO raised the ACC to Red (the highest color on a four-color scale) and the VAL to Warning (the highest level on a four-level scale), noting that seismicity remained elevated for more than six hours and explosion signals were frequently detected by regional infrasound (pressure sensor) networks. Explosions generated an ash plume that rose to 4.9 km altitude and drifted as far as 500 km SE. Activity throughout the night declined and by 0735 the ACC was lowered to Orange and the VAL to Watch. High-resolution satellite images taken on 16 July showed pyroclastic deposits extending as far as 3 km from the vent; these deposits generated lahars that extended further down the drainages on the flanks. Ash deposits were mainly observed on the SSE flank and extended to the shore of Unimak Island. During 16-17 July lava continued to erupt at the summit, which caused strongly elevated surface temperatures that were visible in satellite imagery.
Lava effusion increased at 0100 on 18 July, as noted in elevated surface temperatures identified in satellite data, increasing seismic tremor, and activity detected on regional infrasound arrays. A significant ash plume at 0700 rose to 7 km altitude and continued until 0830, eventually reaching 9.1 km altitude and drifting SSE (figure 44). As a result, the ACC was raised to Red and the VAL to Warning. By 0930 the main plume detached, but residual low-level ash emissions continued for several hours, remaining below 3 km altitude and drifting S. The eruption gradually declined and by 1208 the ACC was lowered to Orange and the VAL was lowered to Watch. High-resolution satellite images showed ash deposits on the SW flank and pyroclastic deposits on the N, E, and S flanks, extending as far as 3 km from the vent; lahars triggered by the eruption extended farther down the flanks (figure 45). Lava continued to erupt from the summit crater on 19 July.
Elevated surface temperatures were detected in satellite images during 19-25 July, despite occasional weather cloud cover, which was consistent with increased lava effusion. During 22-23 July satellite observations acquired after the eruption from 18 July showed pyroclastic flow and lahar deposits extending as far as 3 km down the N, NW, and NE flanks and as far as 1.5 km down the S and SE flanks. Ash deposits covered the SW and NE flanks. No lava flows were observed outside the crater. On 22 July a sulfur dioxide plume was detected in satellite data midday that had an estimated mass of 10 kt. In a special notice issued at 1653 on 22 July AVO noted that eruptive activity had intensified over the previous six hours, which was characterized by an hours-long steady increase in seismic tremor, intermittent infrasound signals consistent with small explosions, and an increase in surface temperatures that were visible in satellite data. Pilots first reported low-level ash plumes at around 1900. At 2320 an ash plume had risen to 9 km altitude based on additional pilot reports and satellite images. The ACC was increased to Red and the VAL to Warning at 2343. Satellite images indicated growth of a significantly higher ash plume that rose to 11 km altitude continued until 0030 and drifted NE. During the early morning hours of 23 July ash plumes had declined to 4.6 k altitude. Seismic tremor peaked at 0030 on 23 July and began to rapidly decline at 0109; active ash emissions were no longer visible in satellite data by 0130. The ACC was lowered to Orange and the VAL to Watch at 0418; bursts of increased seismicity were recorded throughout the morning, but seismicity generally remained at low levels. Elevated surface temperatures were visible in satellite data until about 0600. On 24 July pilots reported seeing vigorous gas-and-steam plumes rising to about 3 km altitude; the plumes may have contained minor amounts of ash.
During 24-25 July low level seismicity and volcanic tremor were detected at low levels following the previous explosion on 23 July. Strongly elevated surface temperatures were observed at the summit crater in satellite data. Around 2200 on 25 July seismicity began to increase, followed by infrasound signals of explosions after 0200 on 26 July. An ash plume rose to 3 km altitude at 0500 and drifted ENE, along with an associated sulfur dioxide plume that drifted NE and had an estimated mass of 22 kt. Diffuse ash emissions were visible in satellite data and rose to 6.1-7.6 km altitude and extended 125 km from the volcano starting around 1130. These ash events were preceded by about seven hours of seismic tremor, infrasound detections of explosions, and five hours of increased surface temperatures visible in satellite data. Activity began to decline around 1327, which included low-frequency earthquakes and decreased volcanic tremor, and infrasound data no longer detected significant explosions. Surface temperatures remained elevated through the end of the month.
Seismicity, volcanic tremor, and ash emissions remained at low levels during early August. Satellite images on 1 August showed that some slumping had occurred on the E crater wall due to the recent explosive activity. Elevated surface temperatures continued, which was consistent with cooling lava. On 2 August small explosive events were detected, consistent with low-level Strombolian activity. Some episodes of volcanic tremor were reported, which reflected low-level ash emissions. Those ash emissions rose to less than 3 km altitude and drifted as far as 92.6 km N. Pilots that were located N of the volcano observed an ash plume that rose to 2.7 km altitude. Seismicity began to increase in intensity around 0900 on 3 August. Seismicity continued to increase throughout the day and through the night with strongly elevated surface temperatures, which suggested that lava was active at the surface.
An ash cloud that rose to 7.6-7.9 km altitude and drifted 60-75 km NE was visible in a satellite image at 0520 on 4 August. Pilots saw and reported the plume at 0836 (figure 46). By 0900 the plume had risen to 9.1 km altitude and extended over 100 km NE. AVO raised the ACC to Red and the VAL to Warning as a result. Seismic tremor levels peaked at 1400 and then sharply declined at 1500 to slightly elevated levels; the plume was sustained during the period of high tremor and drifted N and NE. The ACC was lowered to Orange and the VAL to Watch at 2055. During 5-14 August seismicity remained low and surface temperatures were elevated based on satellite data due to cooling lava. On 9 August a small lava flow was observed that extended from the crater rim to the upper NE flank. It had advanced to 55 m in length and appeared in satellite imagery on 11 August. Occasional gas-and-steam plumes were noted in webcam images. At 1827 AVO noted that seismic tremor had steadily increased during the afternoon and erupting lava was visible at the summit in satellite images.
Strong explosion signals were detected at 0200 on 15 August. An ash cloud that was visible in satellite data extended 100 km NE and may have risen as high as 11 km altitude around 0240. By 0335 satellite images showed the ash cloud rising to 7.6 km altitude and drifting NE. Significant seismicity and explosions were detected by the local AVO seismic and infrasound networks, and volcanic lightning was detected by the World Wide Lightning Location Network (WWLLN). A sulfur dioxide plume associated with the eruption drifted over the S Bering Sea and parts of Alaska and western Canada. Seismicity was significantly elevated during the eruption but had declined by 1322. A pilot reported that ash emissions continued, rising as high as 4.9 km altitude. Elevated surface temperatures detected in satellite data were caused by hot, eruptive material (pyroclastic debris and lava) that accumulated around the summit. Eruptive activity declined by 16 August and the associated sulfur dioxide plume had mostly dissipated; remnants continued to be identified in satellite images at least through 18 August. Surface temperatures remained elevated based on satellite images, indicating hot material on the upper parts of the volcano. Small explosions were detected in infrasound data on the morning of 19 August and were consistent with pilot reports of small, short-lived ash plumes that rose to about 4.3 km altitude. Low-level explosive activity was reported during 20-24 August, according to seismic and infrasound data, and weather clouds sometimes prevented views. Elevated surface temperatures were observed in satellite images, which indicated continued hot material on the upper parts of the volcano.
Seismic tremor began to increase at around 0300 on 25 August and was followed by elevated surface temperatures identified in satellite images, consistent with erupting lava. Small explosions were recorded in infrasound data. The ACC was raised to Red and the VAL to Warning at 1204 after a pilot reported an ash plume that rose to 9.1 km altitude. Seismicity peaked at 1630 and began to rapidly decline at around 1730. Ash plumes rose as high as 10 km altitude and drifted as far as 400 km NE. By 2020 the ash plumes had declined to 6.4 km altitude and continued to drift NE. Ash emissions were visible in satellite data until 0000 on 26 August and seismicity was at low levels. AVO lowered the ACC to Orange and the VAL to Watch at 0030. Minor explosive activity within the summit crater was detected during 26-28 August and strongly elevated surface temperatures were still visible in satellite imagery through the rest of the month. An AVO field crew working on Unimak Island observed a mass flow that descended the upper flanks beginning around 1720 on 27 August. The flow produced a short-lived ash cloud that rose to 4.5 km altitude and rapidly dissipated. The mass flow was likely caused by the collapse of spatter that accumulated on the summit crater rim.
Similar variable explosive activity was reported in September, although weather observations sometimes prevented observations. A moderate resolution satellite image from the afternoon of 1 September showed gas-and-steam emissions filling the summit crater and obscuring views of the vent. In addition, hot deposits from the previous 25-26 August explosive event were visible on the NE flank near the summit, based on a 1 September satellite image. On 2 and 4 September seismic and infrasound data showed signals of small, repetitive explosions. Variable gas-and-steam emissions from the summit were visible but there was no evidence of ash. Possible summit crater incandescence was visible in nighttime webcam images during 3-4 September.
Seismicity began to gradually increase at around 0300 on 5 September and activity escalated at around 0830. A pilot reported an ash plume that rose to 7.6 km altitude at 0842 and continued to rise as high as possibly 9.7 km altitude and drifted SSE based on satellite images (figure 47). The ACC was raised to Red and the VAL to Warning at 0900. In addition to strong tremor and sustained explosions, the eruption produced volcanic lightning that was detected by the WWLLN. Around 1100 seismicity decreased and satellite data confirmed that the altitude of the ash emissions had declined to 7.6 km altitude. By 1200 the lower-altitude portion of the ash plume had drifted 125 km E. Significant ash emissions ended by 1330 based on webcam images. The ACC was lowered to Orange and the VAL to Watch at 1440. Satellite images showed extensive pyroclastic debris flows on most of the flanks that extended 1.2-3.3 km from the crater rim.
During 6-13 September elevated surface temperatures continued to be observed in satellite data, seismicity remained elevated with weak but steady tremor, and small, low-frequency earthquakes and small explosions were reported, except on 12 September. On 6 September a low-level ash plume rose to 1.5-1.8 km altitude and drifted SSE. Occasional small and diffuse gas-and-steam emissions at the summit were visible in webcam images. Around 1800 on 13 September seismic tremor amplitudes began to increase, and small explosions were detected in seismic and infrasound data. Incandescent lava at the summit was seen in a webcam image taken at 0134 on 14 September during a period of elevated tremor. No ash emissions were reported during the period of elevated seismicity. Lava fountaining began around 0200, based on webcam images. Satellite-based radar observations showed that the lava fountaining activity led to the growth of a cone in the summit crater, which refilled most of the crater. By 0730 seismicity significantly declined and remained at low levels.
Seismic tremor began to increase around 0900 on 15 September and rapidly intensified. An explosive eruption began at around 1710, which prompted AVO to raise the ACC to Red and the VAL to Warning. Within about 30 minutes ash plumes drifted E below a weather cloud at 8.2 km altitude. The National Weather Service estimated that an ash-rich plume rose as high as 12.8 km altitude and produced volcanic lightning. The upper part of the ash plume detached from the vent around 1830 and drifted E, and was observed over the Gulf of Alaska. Around the same time, seismicity dramatically decreased. Trace ashfall was reported in the community of False Pass (38 km ENE) between 1800-2030 and also in King Cove and nearby marine waters. Activity declined at around 1830 although seismicity remained elevated, ash emissions, and ashfall continued until 2100. Lightning was again detected beginning around 1930, which suggested that ash emissions continued. Ongoing explosions were detected in infrasound data, at a lower level than during the most energetic phase of this event. Lightning was last detected at 2048. By 2124 the intensity of the eruption had decreased, and ash emissions were likely rising to less than 6.7 km altitude. Seismicity returned to pre-eruption levels. On 16 September the ACC was lowered to Orange and the VAL to Watch at 1244; the sulfur dioxide plume that was emitted from the previous eruption event was still visible over the northern Pacific Ocean. Elevated surface temperatures, gas-and-steam emissions from the vent, and new, small lahars were reported on the upper flanks based on satellite and webcam images. Minor deposits were reported on the flanks which were likely the result of collapse of previously accumulated lava near the summit crater.
Elevated seismicity with tremor, small earthquakes, and elevated surface temperatures were detected during 17-23 September. Minor gas-and-steam emissions were visible in webcam images. On 20 September small volcanic debris flows were reported on the upper flanks. On 21 September a small ash deposit was observed on the upper flanks extending to the NE based on webcam images. Seismic tremor increased significantly during 22-23 September. Regional infrasound sensors suggested that low-level eruptive activity was occurring within the summit crater by around 1800 on 23 September. Even though seismicity was at high levels, strongly elevated surface temperatures indicating lava at the surface were absent and no ash emissions were detected; weather clouds at 0.6-4.6 km altitude obscured views. At 0025 on 24 September AVO noted that seismicity continued at high levels and nearly continuous small infrasound signals began, likely from low-level eruptive activity. Strongly elevated surface temperatures were identified in satellite images by 0900 and persisted throughout the day; the higher temperatures along with infrasound and seismic data were consistent with lava erupting at the summit. Around 1700 similarly elevated surface temperatures were detected from the summit in satellite data, which suggested that more vigorous lava fountaining had started. Starting around 1800 low-level ash emissions rose to altitudes less than 4.6 km altitude and quickly dissipated.
Beginning at midnight on 25 September, a series of seismic signals consistent with volcanic flows were recorded on the N side of the volcano. A change in seismicity and infrasound signals occurred around 0535 and at 0540 a significant ash cloud formed and quickly reached 14 km altitude and drifted E along the Alaska Peninsula. The cloud generated at least 150 lightning strokes with thunder that could be heard by people in False Pass. Seismicity rapidly declined to near background levels around 0600. AVO increased the ACC to Red and the VAL to Warning at 0602. The ash cloud detached from the volcano at around 0700, rose to 11.6 km altitude, and drifted ESE. Trace to minor amounts of ashfall were reported by the communities of False Pass, King Cove, Cold Bay, and Sand Point around 0700. Ash emissions continued at lower altitudes of 6-7.6 km altitude at 0820. Small explosions at the vent area continued to be detected in infrasound data and likely represented low-level eruptive activity near the vent. Due to the significant decrease in seismicity and ash emissions the ACC was lowered to Orange and the VAL to Watch at 1234. Radar data showed significant collapses of the crater that occurred on 25 September. Satellite data also showed significant hot, degassing pyroclastic and lahar deposits on all flanks, including more extensive flows on the ENE and WSW sections below two new collapse scarps. Following the significant activity during 24-25 September, only low-level activity was observed. Seismicity decreased notably near the end of the strong activity on 25 September and continued to decrease through the end of the month, though tremor and small earthquakes were still reported. No explosive activity was detected in infrasound data through 2 October. Gas-and-steam emissions rose to 3.7 km altitude, as reported by pilots and seen in satellite images. Satellite data from 26 September showed that significant collapses had occurred at the summit crater and hot, steaming deposits from pyroclastic flows and lahars were present on all the flanks, particularly to the ENE and WSW. A small ash cloud was visible in webcam images on 27 September, likely from a collapse at the summit cone. High elevated surface temperatures were observed in satellite imagery during 27-28 September, which were likely the result of hot deposits on the flanks erupted on 25 September. Minor steaming at the summit crater and from an area on the upper flanks was visible in webcam images on 28 September.
During October, explosion events continued between periods of low activity. Seismicity significantly increased starting at around 2100 on 2 October; around the same time satellite images showed an increase in surface temperatures consistent with lava fountaining. Small, hot avalanches of rock and lava descended an unspecified flank. In addition, a distinct increase in infrasound, seismicity, and lightning detections was followed by an ash plume that rose to 12.2 km altitude and drifted S and E at 0520 on 3 October, based on satellite images. Nighttime webcam images showed incandescence due to lava fountaining at the summit and pyroclastic flows descending the NE flank. AVO reported that a notable explosive eruption started at 0547 and lasted until 0900 on 3 October, which prompted a rise in the ACC to Red and the VAL to Warning. Subsequent ash plumes rose to 6-7.6 km altitude by 0931. At 1036 the ACC was lowered back to Orange and the VAL to Watch since both seismic and infrasound data quieted substantially and were slightly above background levels. Gas-and-steam emissions were observed at the summit, based on webcam images. Trace amounts of ashfall were observed in Cold Bay. Resuspended ash was present at several kilometers altitude near the volcano. During the afternoon, low-level ash plumes were visible at the flanks, which appeared to be largely generated by rock avalanches off the summit crater following the explosive activity. These ash plumes rose to 3 km altitude and drifted W. Trace amounts of ashfall were reported by observers in Cold Bay and Unalaska and flights to these communities were disrupted by the ash cloud. Satellite images taken after the eruption showed evidence of pyroclastic flows and lahar deposits in drainages 2 km down the SW flank and about 3.2 km down the NE flank, and continued erosion of the crater rim. Small explosion craters at the end of the pyroclastic flows on the NE flank were noted for the first time, which may have resulted from gas-and-steam explosions when hot deposits interact with underlying ice.
During 4 October seismicity, including frequent small earthquakes, remained elevated, but was gradually declining. Ash plumes were produced for over eight hours until around 1400 that rose to below 3.7 km altitude. These ash plumes were primarily generated off the sides of the volcano where hot rock avalanches from the crater rim had entered drainages to the SW and NE. Two explosion craters were observed at the base of the NE deposits about 3.2 km from the crater rim. Webcam images showed the explosion craters were a source of persistent ash emissions; occasional collapse events also generated ash. Seismicity remained elevated with sulfur dioxide emissions that had a daily average of more than 1,000 tons per day, and frequent small earthquakes through the end of the month. Frequent elevated surface temperatures were identified in satellite images and gas-and-steam plumes were observed in webcam images, although weather conditions occasionally prevented clear views of the summit. Emissions were robust during 14-16 October and were likely generated by the interaction of hot material and snow and ice. During the afternoon of 21 October a strong gas-and-steam plume rose to 3-4.6 km altitude and extended 40 km WSW, based on satellite images and reports from pilots. On 31 October the ACC was lowered to Yellow and the VAL was lowered to Advisory.
Activity in November was characterized by elevated seismicity with ongoing seismic tremor and small, low-frequency earthquakes, elevated surface temperatures, and gas-and-steam emissions. There was an increase in seismic and infrasound tremor amplitudes starting at 1940 on 2 November. As a result, the ACC was again raised to Orange and the VAL was increased to Watch, although ash was not identified in satellite data. An ash cloud rose to 6.1 km altitude and drifted W according to satellite data at 2000. By 0831 on 3 November ash emissions were no longer visible in satellite images. On 6 and 9 November air pressure sensors detected signals consistent with small explosions. Small explosions were detected in infrasound data consistent with weak Strombolian activity on 19 and 21 November. Seismicity started to decrease on 21 November. On 25 November gas-and-steam emissions were emitted from the vent as well as from a scarp on the NE side of the volcano near the summit. A gas-and-steam plume extended about 50 km SSE and was observed in satellite and webcam images on 26 November. On 28 November small explosions were observed in seismic and local infrasound data and gas-and-steam emissions were visible from the summit and from the upper NE collapse scarp based on webcam images. Possible small explosions were observed in infrasound data on 30 November. Weakly elevated surface temperatures and a persistent gas-and-steam plume from the summit and collapse scarps on the upper flanks. A passing aircraft reported the gas-and-steam plume rose to 3-3.4 km altitude on 30 November, but no significant ash emissions were detected.
Satellite data. MODIS thermal anomaly data provided through MIROVA (Middle InfraRed Observation of Volcanic Activity) showed a strong pulse of thermal activity beginning in July 2023 that continued through November 2023 (figure 48). This strong activity was due to Strombolian explosions and lava fountaining events at the summit crater. According to data from MODVOLC thermal alerts, a total of 101 hotspots were detected near the summit crater in July (11-14, 16-19, 23-24 and 26), August (4, 25-26, and 29), September (5, 12, and 17), and October (3, 4, and 8). Infrared satellite data showed large lava flows descending primarily the northern and SE flanks during the reporting period (figure 49). Sulfur dioxide plumes often exceeded two Dobson Units (DUs) and drifted in different directions throughout the reporting period, based on satellite data from the TROPOMI instrument on the Sentinel-5P satellite (figure 50).
Geologic Background. The symmetrical glacier-covered Shishaldin in the Aleutian Islands is the westernmost of three large stratovolcanoes in the eastern half of Unimak Island. The Aleuts named the volcano Sisquk, meaning "mountain which points the way when I am lost." Constructed atop an older glacially dissected edifice, it is largely basaltic in composition. Remnants of an older edifice are exposed on the W and NE sides at 1,500-1,800 m elevation. There are over two dozen pyroclastic cones on its NW flank, which is covered by massive aa lava flows. Frequent explosive activity, primarily consisting of Strombolian ash eruptions from the small summit crater, but sometimes producing lava flows, has been recorded since the 18th century. A steam plume often rises from the summit crater.
Information Contacts: Alaska Volcano Observatory (AVO), a cooperative program of a) U.S. Geological Survey, 4200 University Drive, Anchorage, AK 99508-4667 USA (URL: https://avo.alaska.edu/), b) Geophysical Institute, University of Alaska, PO Box 757320, Fairbanks, AK 99775-7320, USA, and c) Alaska Division of Geological & Geophysical Surveys, 794 University Ave., Suite 200, Fairbanks, AK 99709, USA (URL: http://dggs.alaska.gov/); MIROVA (Middle InfraRed Observation of Volcanic Activity), a collaborative project between the Universities of Turin and Florence (Italy) supported by the Centre for Volcanic Risk of the Italian Civil Protection Department (URL: http://www.mirovaweb.it/); Hawai'i Institute of Geophysics and Planetology (HIGP) - MODVOLC Thermal Alerts System, School of Ocean and Earth Science and Technology (SOEST), Univ. of Hawai'i, 2525 Correa Road, Honolulu, HI 96822, USA (URL: http://modis.higp.hawaii.edu/); NASA Global Sulfur Dioxide Monitoring Page, Atmospheric Chemistry and Dynamics Laboratory, NASA Goddard Space Flight Center (NASA/GSFC), 8800 Greenbelt Road, Goddard, Maryland, USA (URL: https://so2.gsfc.nasa.gov/); Copernicus Browser, Copernicus Data Space Ecosystem, European Space Agency (URL: https://dataspace.copernicus.eu/browser/).
Ioto
Japan
24.751°N, 141.289°E; summit elev. 169 m
All times are local (unless otherwise noted)
New eruption with discolored water, ejecta, and floating pumice during October-December 2023
Ioto (Iwo-jima), located about 1,200 km S of Tokyo, lies within a 9-km-wide submarine caldera along the Izu-Bonin-Mariana volcanic arc. Previous eruptions date back to 1889 and have consisted of dominantly phreatic explosions, pumice deposits during 2001, and discolored water. A submarine eruption during July through December 2022 was characterized by discolored water, pumice deposits, and gas emissions (BGVN 48:01). This report covers a new eruption during October through December 2023, which consisted of explosions, black ejecta, discolored water, and floating pumice, based on information from the Japan Meteorological Association (JMA), the Japan Coast Guard (JCG), and satellite data.
JMA reported that an eruption had been occurring offshore of Okinahama on the SE side of the island since 21 October, which was characterized by volcanic tremor, according to the Japan Maritime Self-Defense Force (JMSDF) Iwo Jima Air Base (figure 22). According to an 18 October satellite image a plume of discolored water at the site of this new eruption extended NE (figure 23). During an overflight conducted on 30 October, a vent was identified about 1 km off the coast of Okinahama. Observers recorded explosions every few minutes that ejected dark material about 20 m above the ocean and as high as 150 m. Ejecta from the vent formed a black-colored island about 100 m in diameter, according to observations conducted from the air by the Earthquake Research Institute of the University of Tokyo in cooperation with the Mainichi newspaper (figure 24). Occasionally, large boulders measuring more than several meters in size were also ejected. Observations from the Advanced Land Observing Satellite Daichi-2 and Sentinel-2 satellite images also confirmed the formation of this island (figure 23). Brown discolored water and floating pumice were present surrounding the island.
The eruption continued during November. During an overflight on 3 November observers photographed the island and noted that material was ejected 169 m high, according to a news source. Explosions gradually became shorter, and, by the 3rd, they occurred every few seconds; dark and incandescent material were ejected about 800 m above the vent. On 4 November eruptions were accompanied by explosive sounds. Floating, brown-colored pumice was present in the water surrounding the island. There was a brief increase in the number of volcanic earthquakes during 8-14 November and 24-25 November. The eruption temporarily paused during 9-11 November and by 12 November eruptions resumed to the W of the island. On 10 November dark brown-to-dark yellow-green discolored water and a small amount of black floating material was observed (figure 25). A small eruption was reported on 18 November off the NE coast of the island, accompanied by white gas-and-steam plumes (figure 23). Another pause was recorded during 17-19 November, which then resumed on 20 November and continued erupting intermittently. According to a field survey conducted by the National Institute for Disaster Prevention Science and Technology on 19 November, a 30-m diameter crater was visible on the NE coast where landslides, hot water, and gray volcanic ash containing clay have occurred and been distributed previously. Erupted blocks about 10 cm in diameter were distributed about 90-120 m from the crater. JCG made observations during an overflight on 23 November and reported a phreatomagmatic eruption. Explosions at the main vent generated dark gas-and-ash plumes that rose to 200 m altitude and ejected large blocks that landed on the island and in the ocean (figure 26). Discolored water also surrounded the island. The size of the new island had grown to 450 m N-S x 200 m E-W by 23 November, according to JCG.
The eruption continued through 11 December, followed by a brief pause in activity, which then resumed on 31 December, according to JMA. Intermittent explosions produced 100-m-high black plumes at intervals of several minutes to 30 minutes during 1-10 December. Overflights were conducted on 4 and 15 December and reported that the water surrounding the new island was discolored to dark brown-to-dark yellow-green (figure 27). No floating material was reported during this time. In comparison to the observations made on 23 November, the new land had extended N and part of it had eroded away. In addition, analysis by the Geospatial Information Authority of Japan using SAR data from Daichi-2 also confirmed that the area of the new island continued to decrease between 4 and 15 December. Ejected material combined with wave erosion transformed the island into a “J” shape, 500-m-long and with the curved part about 200 m offshore of Ioto. The island was covered with brown ash and blocks, and the surrounding water was discolored to greenish-brown and contained an area of floating pumice. JCG reported from an overflight on 4 December that volcanic ash-like material found around the S vent on the NE part of the island was newly deposited since 10 November (figure 28). By 15 December the N part of the “J” shaped island had separated and migrated N, connecting to the Okinahama coast and the curved part of the “J” had eroded into two smaller islands (figure 27).
References. Ukawa, M., Fujita, E., Kobayashi, T., 2002, Recent volcanic activity of Iwo Jima and the 2001 eruption, Monthly Chikyu, Extra No. 39, 157-164.
Geologic Background. Ioto, in the Volcano Islands of Japan, lies within a 9-km-wide submarine caldera. The volcano is also known as Ogasawara-Iojima to distinguish it from several other "Sulfur Island" volcanoes in Japan. The triangular, low-elevation, 8-km-long island narrows toward its SW tip and has produced trachyandesitic and trachytic rocks that are more alkalic than those of other volcanoes in this arc. The island has undergone uplift for at least the past 700 years, accompanying resurgent doming of the caldera; a shoreline landed upon by Captain Cook's surveying crew in 1779 is now 40 m above sea level. The Motoyama plateau on the NE half of the island consists of submarine tuffs overlain by coral deposits and forms the island's high point. Many fumaroles are oriented along a NE-SW zone cutting through Motoyama. Numerous recorded phreatic eruptions, many from vents on the W and NW sides of the island, have accompanied the uplift.
Information Contacts: Japan Meteorological Agency (JMA), 1-3-4 Otemachi, Chiyoda-ku, Tokyo 100-8122, Japan (URL: http://www.jma.go.jp/jma/indexe.html); Japan Coast Guard (JCG) Volcano Database, Hydrographic and Oceanographic Department, 3-1-1, Kasumigaseki, Chiyoda-ku, Tokyo 100-8932, Japan (URL: https://www1.kaiho.mlit.go.jp/GIJUTSUKOKUSAI/kaiikiDB/kaiyo22-2.htm); Copernicus Browser, Copernicus Data Space Ecosystem, European Space Agency (URL: https://dataspace.copernicus.eu/browser/); Asahi, 5-3-2, Tsukiji, Chuo Ward, Tokyo, 104-8011, Japan (URL: https://www.asahi.com/ajw/articles/15048458).
Purace (Colombia) — December 2023 Cite this Report
Purace
Colombia
2.3095°N, 76.3948°W; summit elev. 4650 m
All times are local (unless otherwise noted)
Gas-and-ash emission on 16 November 2023
Puracé, located in Colombia, is a stratovolcano that contains a 500-m-wide summit crater. It is part of the Los Coconucos volcanic chain that is a NW-SE trending group of seven cones and craters. The most recent eruption occurred during March 2022 that was characterized by frequent seismicity and gas-and-steam emissions (BGVN 47:06). This report covers a brief eruption during November 2023 based on monthly reports from the Popayán Observatory, part of the Servicio Geologico Colombiano (SGC).
Activity during November 2022 through November 2023 primarily consisted of seismicity: VT-type events, LP-type events, HB-type events, and TR-type events (table 4). Maximum sulfur dioxide values were measured weekly and ranged from 259-5,854 tons per day (t/d) during November 2022 through April 2023. White gas-and-steam emissions were also occasionally reported.
SGC issued a report on 25 October that noted a significant increase in the number of earthquakes associated with rock fracturing. These earthquakes were located SE of the crater between Puracé and Piocollo at depths of 1-4 km. There were no reported variations in sulfur dioxide values, but SGC noted high carbon dioxide values, compared to those recorded in the first half of 2023.
SGC reported that at 1929 on 16 November the seismic network detected a signal that was possibly associated with a gas-and-ash emission, though it was not confirmed in webcam images due to limited visibility. On 17 November an observer confirmed ash deposits on the N flank. Webcam images showed an increase in degassing both inside the crater and from the NW flank, rising 700 m above the crater.
Table 4. Seismicity at Puracé during November 2022-November 2023. Volcano-tectonic (VT), long-period (LP), hybrid (HB), and tremor (TR) events are reported each month. Courtesy of SGC.
| Month |
Volcano-tectonic |
Long-period |
Hybrid |
Tremor |
| Nov 2022 |
429 |
2,023 |
5 |
831 |
| Dec 2022 |
423 |
1,390 |
9 |
834 |
| Jan 2023 |
719 |
1,622 |
0 |
957 |
| Feb 2023 |
598 |
1,701 |
2 |
1,124 |
| Mar 2023 |
331 |
2,408 |
147 |
607 |
| Apr 2023 |
614 |
4,427 |
33 |
148 |
| May 2023 |
620 |
3,717 |
170 |
109 |
| Jun 2023 |
467 |
3,293 |
86 |
148 |
| Jul 2023 |
1,116 |
5,809 |
183 |
542 |
| Aug 2023 |
692 |
2,927 |
94 |
321 |
| Sep 2023 |
887 |
1,505 |
82 |
848 |
| Oct 2023 |
2,373 |
2,949 |
135 |
692 |
| Nov 2023 |
1,212 |
2,302 |
69 |
293 |
Geologic Background. Puracé is an active andesitic volcano with a 600-m-diameter summit crater at the NW end of the Los Coconucos Volcanic Chain. This volcanic complex includes nine composite and five monogenetic volcanoes, extending from the Puracé crater more than 6 km SE to the summit of Pan de Azúcar stratovolcano. The dacitic massif which the complex is built on extends about 13 km NW-SE and 10 km NE-SW. Frequent small to moderate explosive eruptions reported since 1816 CE have modified the morphology of the summit crater, with the largest eruptions in 1849, 1869, and 1885.
Information Contacts: Servicio Geologico Colombiano (SGC), Diagonal 53 No. 34-53 - Bogotá D.C., Colombia (URL: https://www.sgc.gov.co/volcanes).
Etna
Italy
37.748°N, 14.999°E; summit elev. 3357 m
All times are local (unless otherwise noted)
Strombolian explosions, lava fountains, and lava flows during July-August 2023
Etna, located on the Italian island of Sicily, has had documented eruptions dating back to 1500 BCE. Activity typically originates from multiple cones at the summit, where several craters have formed and evolved. The currently active craters are Northeast Crater (NEC), Voragine (VOR), and Bocca Nuova (BN), and the Southeast Crater (SEC); VOR and BN were previously referred to as the “Central Crater”. The original Southeast crater formed in 1978, and a second eruptive site that opened on its SE flank in 2011 was named the New Southeast Crater (NSEC). Another eruptive site between the SEC and NSEC developed during early 2017 and was referred to as the "cono della sella" (saddle cone). The current eruption period began in November 2022 and has been characterized by intermittent Strombolian activity, lava flows, and ash plumes (BGVN 48:08). This report updates activity during July through October 2023, which includes primarily gas-and-steam emissions; during July and August Strombolian explosions, lava fountains, and lava flows were reported, based on weekly and special reports by the Osservatorio Etneo (OE), part of the Catania Branch of Italy's Istituo Nazionale di Geofisica e Vulcanologica (INGV) and satellite data.
Variable fumarolic degassing was reported at all summit craters (BN, VOR, NEC, and SEC) throughout the entire reporting period (table 15). The MIROVA (Middle InfraRed Observation of Volcanic Activity) volcano hotspot detection system based on the analysis of MODIS data showed frequent low-to-moderate power thermal anomalies during the reporting period (figure 399). During mid-August there was a pulse in activity that showed an increase in the power of the anomalies due to Strombolian activity, lava fountains, and lava flows. Infrared satellite imagery captured strong thermal anomalies at the central and southeast summit crater areas (figure 400). Accompanying thermal activity were occasional sulfur dioxide plumes that exceeded 2 Dobson Units (DUs) recorded by the TROPOMI instrument on the Sentinel-5P satellite (figure 401).
Table 15. Summary of activity at the four primary crater areas at the summit of Etna during July-October 2023. Information is from INGV weekly reports.
| Month |
Bocca Nuova (BN) |
Voragine (VOR) |
Northeast Crater (NEC) |
Southeast Crater (SEC) |
| Jul 2023 |
Continuous degassing. |
No observations. |
Weak gas emissions. |
Continuous degassing. Sporadic and weak-to-moderate ash emissions. Strombolian explosions. |
| Aug 2023 |
Continuous degassing. |
No observations. |
No observations. |
Continuous degassing. Occasional ash emissions. Strombolian activity, lava fountaining, and lava flows. |
| Sep 2023 |
Variable degassing. Crater incandescence. |
Weak fumarolic activity. |
Weak fumarolic activity. |
Variable degassing. |
| Oct 2023 |
Continuous degassing. |
Weak fumarolic activity. |
Weak fumarolic activity. |
Continuous degassing. |
Activity during July and August was relatively low and mainly consisted of degassing at the summit craters, particularly at SEC and BN. Cloudy weather prevented clear views of the summit during early July. During the night of 2 July some crater incandescence was visible at SEC. Explosive activity resumed at SEC during 9-10 July, which was characterized by sporadic and weak ash emissions that rapidly dispersed in the summit area (figure 402). INGV reported moderate Strombolian activity began at 2034 on 14 July and was confined to the inside of the crater and fed by a vent located in the E part of SEC. An ash emission was detected at 2037. A new vent opened on 15 July in the SE part of BN and began to produce continuous gas-and-steam emissions. During an inspection carried out on 28 July pulsating degassing, along with audible booms, were reported at two active vents in BN. Vigorous gas-and-steam emissions intermittently generated rings. On rare occasions, fine, reddish ash was emitted from BN1 and resuspended by the gas-and-steam emissions.
Around 2000 on 13 August INGV reported a sudden increase in volcanic tremor amplitude. Significant infrasonic activity coincided with the tremor increase. Incandescent flashes were visible through the cloud cover in webcam images of SEC (figure 403). Strombolian activity at SEC began to gradually intensify starting at 2040 as seismicity continued to increase. The Aviation Color Code (ACC) was raised to Yellow (the second lowest-level on a four-color scale) at 2126 and then to Orange (the second highest-level on a four-color scale) at 2129 due to above-background activity. The activity rapidly transitioned from Strombolian activity to lava fountains around 2333 that rose 300-400 m above the crater (figure 403). Activity was initially focused on the E vent of the crater, but then the vent located above the S flank of the cone also became active. A lava flow from this vent traveled SW into the drainage created on 10 February 2022, overlapping with previous flows from 10 and 21 February 2022 and 21 May 2023, moving between Monte Barbagallo and Monte Frumento Supino (figure 404). The lava flow was 350 m long, oriented NNE-SSW, and descended to an elevation of 2.8 km. Flows covered an area of 300,000 m2 and had an estimated volume of 900,000 m3. The ACC was raised to Red at 2241 based on strong explosive activity and ashfall in Rifugio Sapienza-Piano Vetore at 1.7 km elevation on the S flank. INGV reported that pyroclastic flows accompanied this activity.
Activity peaked between 0240 and 0330 on 14 August, when roughly 5-6 vents erupted lava fountains from the E to SW flank of SEC. The easternmost vents produced lava fountains that ejected material strongly to the E, which caused heavy fallout of incandescent pyroclastic material on the underlying flank, triggering small pyroclastic flows. This event was also accompanied by lightning both in the ash column and in the ash clouds that were generated by the pyroclastic flows. A fracture characterized by a series of collapse craters (pit craters) opened on the upper SW flank of SEC. An ash cloud rose a few kilometers above the crater and drifted S, causing ash and lapilli falls in Rifugio Sapienza and expanding toward Nicolosi, Mascalucia, Catania, and up to Syracuse. Ashfall resulted in operational problems at the Catania airport (50 km S), which lasted from 0238 until 2000. By 0420 the volcanic tremor amplitude values declined to background levels. After 0500 activity sharply decreased, although the ash cloud remained for several hours and drifted S. By late morning, activity had completely stopped. The ACC was lowered to Orange as volcanic ash was confined to the summit area. Sporadic, minor ash emissions continued throughout the day. At 1415 the ACC was lowered to Yellow and then to Green at 1417.
During the night of 14-15 August only occasional flashes were observed, which were more intense during avalanches of material inside the eruptive vents. Small explosions were detected at SEC at 2346 on 14 August and at 0900 on 26 August that each produced ash clouds which rapidly dispersed into the atmosphere (figure 405). According to a webcam image, an explosive event detected at 2344 at SEC generated a modest ash cloud that was rapidly dispersed by winds. The ACC was raised to Yellow at 2355 on 14 August due to increasing unrest and was lowered to Green at 0954 on 15 August.
Activity during September and October was relatively low and mainly characterized by variable degassing from BN and SEC. Intense, continuous, and pulsating degassing was accompanied by roaring sounds and flashes of incandescence at BN both from BN1 and the new pit crater that formed during late July (figure 406). The degassing from the new pit crater sometimes emitted vapor rings. Cloudy weather during 6-8 September prevented observations of the summit craters .
Geologic Background. Mount Etna, towering above Catania on the island of Sicily, has one of the world's longest documented records of volcanism, dating back to 1500 BCE. Historical lava flows of basaltic composition cover much of the surface of this massive volcano, whose edifice is the highest and most voluminous in Italy. The Mongibello stratovolcano, truncated by several small calderas, was constructed during the late Pleistocene and Holocene over an older shield volcano. The most prominent morphological feature of Etna is the Valle del Bove, a 5 x 10 km caldera open to the east. Two styles of eruptive activity typically occur, sometimes simultaneously. Persistent explosive eruptions, sometimes with minor lava emissions, take place from one or more summit craters. Flank vents, typically with higher effusion rates, are less frequently active and originate from fissures that open progressively downward from near the summit (usually accompanied by Strombolian eruptions at the upper end). Cinder cones are commonly constructed over the vents of lower-flank lava flows. Lava flows extend to the foot of the volcano on all sides and have reached the sea over a broad area on the SE flank.
Information Contacts: Sezione di Catania - Osservatorio Etneo, Istituto Nazionale di Geofisica e Vulcanologia (INGV), Sezione di Catania, Piazza Roma 2, 95123 Catania, Italy (URL: http://www.ct.ingv.it/it/); MIROVA (Middle InfraRed Observation of Volcanic Activity), a collaborative project between the Universities of Turin and Florence (Italy) supported by the Centre for Volcanic Risk of the Italian Civil Protection Department (URL: http://www.mirovaweb.it/); NASA Global Sulfur Dioxide Monitoring Page, Atmospheric Chemistry and Dynamics Laboratory, NASA Goddard Space Flight Center (NASA/GSFC), 8800 Greenbelt Road, Goddard MD 20771, USA (URL: https://so2.gsfc.nasa.gov/); Copernicus Browser, Copernicus Data Space Ecosystem, European Space Agency (URL: https://dataspace.copernicus.eu/browser/).
Suwanosejima (Japan) — December 2023 Cite this Report
Suwanosejima
Japan
29.638°N, 129.714°E; summit elev. 796 m
All times are local (unless otherwise noted)
Eruption plumes, crater incandescence, and occasional explosions during July-October 2023
Suwanosejima is an 8-km-long island that consists of a stratovolcano and two active summit craters, located in the northern Ryukyu Islands, Japan. Volcanism over the past century has been characterized by Strombolian explosions, ash plumes, and ashfall. The current eruption began in October 2004 and has more recently consisted of frequent eruption plumes, explosions, and incandescent ejecta (BGVN 48:07). This report covers similar activity of ash plumes, explosions, and crater incandescence during July through October 2023 using monthly reports from the Japan Meteorological Agency (JMA) and satellite data.
Thermal activity during the reporting period was relatively low; only one low-power thermal anomaly was detected during mid-July and one during early August, based on a MIROVA (Middle InfraRed Observation of Volcanic Activity) Log Radiative Power graph of the MODIS thermal anomaly data. On two clear weather days, a thermal anomaly was visible in infrared satellite images (figure 81).
Low-level activity was reported at the Otake crater during July and no explosions were detected. Eruption plumes rose as high as 1.8 km above the crater. On 13 July an ash plume rose 1.7 km above the crater rim, based on a webcam image. During the night of the 28th crater incandescence was visible in a webcam image. An eruptive event reported on 31 July produced an eruption plume that rose 2.1 km above the crater. Seismicity consisted of 11 volcanic earthquakes on the W flank, the number of which had decreased compared to June (28) and 68 volcanic earthquakes near the Otake crater, which had decreased from 722 in the previous month. According to observations conducted by the University of Tokyo Graduate School of Science, Kyoto University Disaster Prevention Research Institute, Toshima Village, and JMA, the amount of sulfur dioxide emissions released during the month was 400-800 tons per day (t/d).
Eruptive activity in the Otake crater continued during August and no explosions were reported. An eruptive event produced a plume that rose 1 km above the crater at 1447 on 12 August. Subsequent eruptive events were recorded at 0911 on 16 August, at 1303 on 20 August, and at 0317 on 21 August, which produced ash plumes that rose 1-1.1 km above the crater and drifted SE, SW, and W. On 22 August an ash plume was captured in a webcam image rising 1.4 km above the crater (figure 82). Multiple eruptive events were detected on 25 August at 0544, 0742, 0824, 1424, and 1704, which generated ash plumes that rose 1.1-1.2 km above the crater and drifted NE, W, and SW. On 28 August a small amount of ashfall was observed as far as 1.5 km from the crater. There were 17 volcanic earthquakes recorded on the W flank of the volcano and 79 recorded at the Otake crater during the month. The amount of sulfur dioxide emissions released during the month was 400-800 t/d.
Activity continued at the Otake crater during September. Occasionally, nighttime crater incandescence was observed in webcam images and ashfall was reported. An eruptive event at 1949 on 4 September produced an ash plume that rose 1 km above the crater and drifted SW. On 9 September several eruption events were detected at 0221, 0301, and 0333, which produced ash plumes that rose 1.1-1.4 km above the crater rim and drifted W; continuous ash emissions during 0404-0740 rose to a maximum height of 2 km above the crater rim (figure 83). More eruptive events were reported at 1437 on 10 September, at 0319 on 11 September, and at 0511 and 1228 on 15 September, which generated ash plumes that rose 1-1.8 km above the crater. During 25, 27, and 30 September, ash plumes rose as high as 1.3 km above the crater rim. JMA reported that large blocks were ejected as far as 300 m from the center of the crater. There were 18 volcanic earthquakes detected beneath the W flank and 82 volcanic earthquakes detected near the Otake crater. The amount of sulfur dioxide released during the month ranged from 600 to 1,600 t/d.
Activity during early-to-mid-October consisted of occasional explosions, a total number of 13, and ash plumes that rose as high as 1.9 km above the Otake crater rim on 29 October (figure 84). These explosions are the first to have occurred since June 2023. Continuous ash emissions were reported during 0510-0555 on 1 October. Explosions were recorded at 0304, 2141, and 2359 on 2 October, at 0112 on 3 October, and at 1326 on 6 October, which produced ash plumes that rose as high as 1 km above the crater rim and drifted SW and W. An explosion was noted at 0428 on 3 October, but emission details were unknown. A total of eight explosions were recorded by the seismic network at 1522 on 14 October, at 0337, 0433, 0555, 1008, and 1539 on 15 October, and at 0454 and 0517 on 16 October. Ash plumes from these explosions rose as high as 900 m above the crater and drifted SE. Eruptive events during 25-27 and 29-30 October generated plumes that rose as high as 1.9 km above the crater and drifted SE, S, and SW. Ash was deposited in Toshima village (3.5 km SSW). Eruptive activity occasionally ejected large volcanic blocks as far as 600 m from the crater. Nighttime crater incandescence was visible in webcams. Intermittent ashfall was reported as far as 1.5 km from the crater. There were 43 volcanic earthquakes detected on the W flank during the month, and 184 volcanic earthquakes detected near the Otake crater. The amount of sulfur dioxide emitted ranged between 400 and 900 t/d.
Geologic Background. The 8-km-long island of Suwanosejima in the northern Ryukyu Islands consists of an andesitic stratovolcano with two active summit craters. The summit is truncated by a large breached crater extending to the sea on the E flank that was formed by edifice collapse. One of Japan's most frequently active volcanoes, it was in a state of intermittent Strombolian activity from Otake, the NE summit crater, between 1949 and 1996, after which periods of inactivity lengthened. The largest recorded eruption took place in 1813-14, when thick scoria deposits covered residential areas, and the SW crater produced two lava flows that reached the western coast. At the end of the eruption the summit of Otake collapsed, forming a large debris avalanche and creating an open collapse scarp extending to the eastern coast. The island remained uninhabited for about 70 years after the 1813-1814 eruption. Lava flows reached the eastern coast of the island in 1884. Only about 50 people live on the island.
Information Contacts: Japan Meteorological Agency (JMA), 1-3-4 Otemachi, Chiyoda-ku, Tokyo 100-8122, Japan (URL: http://www.jma.go.jp/jma/indexe.html); MIROVA (Middle InfraRed Observation of Volcanic Activity), a collaborative project between the Universities of Turin and Florence (Italy) supported by the Centre for Volcanic Risk of the Italian Civil Protection Department (URL: http://www.mirovaweb.it/); Hawai'i Institute of Geophysics and Planetology (HIGP) - MODVOLC Thermal Alerts System, School of Ocean and Earth Science and Technology (SOEST), Univ. of Hawai'i, 2525 Correa Road, Honolulu, HI 96822, USA (URL: http://modis.higp.hawaii.edu/); Copernicus Browser, Copernicus Data Space Ecosystem, European Space Agency (URL: https://dataspace.copernicus.eu/browser/).
Aira
Japan
31.5772°N, 130.6589°E; summit elev. 1117 m
All times are local (unless otherwise noted)
Explosions, ash plumes, ash fall, and crater incandescence during July-October 2023
Aira caldera, located in the northern half of Kagoshima Bay, Japan, contains the post-caldera Sakurajima volcano. Eruptions typically originate from the Minamidake crater, and since the 8th century, ash deposits have been recorded in the city of Kagoshima (10 km W), one of Kyushu’s largest cities. The Minamidake summit cone and crater has had persistent activity since 1955; the Showa crater on the E flank has also been intermittently active since 2006. The current eruption period began during March 2017 and has recently been characterized by intermittent explosions, eruption plumes, and ashfall (BGVN 48:07). This report updates activity during July through October 2023 and describes explosive events, ash plumes, nighttime crater incandescence, and ashfall, according to monthly activity reports from the Japan Meteorological Agency (JMA) and satellite data.
Thermal activity remained at low levels during this reporting period, according to the MIROVA (Middle InfraRed Observation of Volcanic Activity) system (figure 149). There was a slight increase in the number of anomalies during September through October. Occasional thermal anomalies were visible in infrared satellite images mainly at the Minamidake crater (Vent A is located to the left and Vent B is located to the right) (figure 150).
Table 30. Number of monthly explosive events, days of ashfall, area of ash covered, and sulfur dioxide emissions from Sakurajima’s Minamidake crater at Aira during July-October 2023. Note that smaller ash events are not listed. Ashfall days were measured at Kagoshima Local Meteorological Observatory and ashfall amounts represent material covering all the Kagoshima Prefecture. Data courtesy of JMA monthly reports.
| Month |
Explosive events |
Days of ashfall |
Ashfall amount (g/m2) |
SO2 emissions (tons/day) |
| Jul 2023 |
3 |
0 |
0 |
1,600-3,200 |
| Aug 2023 |
3 |
10 |
7 |
1,800-3,300 |
| Sep 2023 |
3 |
7 |
3 |
1,600-2,300 |
| Oct 2023 |
33 |
8 |
61 |
2,200-4,200 |
JMA reported that during July, there were eight eruptions, three of which were explosion events in the Showa crater. Large blocks were ejected as far as 600 m from the Showa crater. Very small eruptions were occasionally reported at the Minamidake crater. Nighttime incandescence was observed in both the Showa and Minamidake crater. Explosions were reported on 16 July at 2314 and on 17 July at 1224 and at 1232 (figure 151). Resulting eruption plumes rose 700-2,500 m above the crater and drifted N. On 23 July the number of volcanic earthquakes on the SW flank of the volcano increased. A strong Mw 3.1 volcanic earthquake was detected at 1054 on 26 July. The number of earthquakes recorded throughout the month was 545, which markedly increased from 73 in June. No ashfall was observed at the Kagoshima Regional Meteorological Observatory during July. According to a field survey conducted during the month, the daily amount of sulfur dioxide emissions was 1,600-3,200 tons per day (t/d).
There were three eruptions reported at the Minamidake crater during August, each of which were explosive. The explosions occurred on 9 August at 0345, on 13 August at 2205, and on 31 August at 0640, which generated ash plumes that rose 800-2,000 m above the crater and drifted W. There were two eruptions detected at Showa crater; on 4 August at 2150 ejecta traveled 800 m from the Showa crater and associated eruption plumes rose 2.3 km above the crater. The explosion at 2205 on 13 August generated an ash plume that rose 2 km above the crater and was accompanied by large blocks that were ejected 600 m from the Minamidake crater (figure 152). Nighttime crater incandescence was visible in a high-sensitivity surveillance camera at both craters. Seismicity consisted of 163 volcanic earthquakes, 84 of which were detected on the SW flank. According to the Kagoshima Regional Meteorological Observatory there was a total of 7 g/m2 of ashfall over the course of 10 days during the month. According to a field survey, the daily amount of sulfur dioxide emitted was 1,800-3,300 t/d.
During September, four eruptions were reported, three of which were explosion events. These events occurred at 1512 on 9 September, at 0018 on 11 September, and at 2211 on 13 September. Resulting ash plumes generally rose 800-1,100 m above the crater. An explosion produced an ash plume at 2211 on 13 September that rose as high as 1.7 km above the crater. Large volcanic blocks were ejected 600 m from the Minamidake crater. Smaller eruptions were occasionally observed at the Showa crater. Nighttime crater incandescence was visible at the Minamidake crater. Seismicity was characterized by 68 volcanic earthquakes, 28 of which were detected beneath the SW flank. According to the Kagoshima Regional Meteorological Observatory there was a total of 3 g/m2 of ashfall over the course of seven days during the month. A field survey reported that the daily amount of sulfur dioxide emitted was 1,600-2,300 t/d.
Eruptive activity during October consisted of 69 eruptions, 33 of which were described as explosive. These explosions occurred during 4 and 11-21 October and generated ash plumes that rose 500-3,600 m above the crater and drifted S, E, SE, and N. On 19 October at 1648 an explosion generated an ash plume that rose 3.6 km above the crater (figure 153). No eruptions were reported in the Showa crater; white gas-and-steam emissions rose 100 m above the crater from a vent on the N flank. Nighttime incandescence was observed at the Minamidake crater. On 24 October an eruption was reported from 0346 through 0430, which included an ash plume that rose 3.4 km above the crater. Ejected blocks traveled 1.2 km from the Minamidake crater. Following this eruption, small amounts of ashfall were observed from Arimura (4.5 km SE) and a varying amount in Kurokami (4 km E) (figure 154). The number of recorded volcanic earthquakes during the month was 190, of which 14 were located beneath the SW flank. Approximately 61 g/m2 of ashfall was reported over eight days of the month. According to a field survey, the daily amount of sulfur dioxide emitted was 2,200-4,200 t/d.
Geologic Background. The Aira caldera in the northern half of Kagoshima Bay contains the post-caldera Sakurajima volcano, one of Japan's most active. Eruption of the voluminous Ito pyroclastic flow accompanied formation of the 17 x 23 km caldera about 22,000 years ago. The smaller Wakamiko caldera was formed during the early Holocene in the NE corner of the caldera, along with several post-caldera cones. The construction of Sakurajima began about 13,000 years ago on the southern rim and built an island that was joined to the Osumi Peninsula during the major explosive and effusive eruption of 1914. Activity at the Kitadake summit cone ended about 4,850 years ago, after which eruptions took place at Minamidake. Frequent eruptions since the 8th century have deposited ash on the city of Kagoshima, located across Kagoshima Bay only 8 km from the summit. The largest recorded eruption took place during 1471-76.
Information Contacts: Japan Meteorological Agency (JMA), 1-3-4 Otemachi, Chiyoda-ku, Tokyo 100-8122, Japan (URL: http://www.jma.go.jp/jma/indexe.html); MIROVA (Middle InfraRed Observation of Volcanic Activity), a collaborative project between the Universities of Turin and Florence (Italy) supported by the Centre for Volcanic Risk of the Italian Civil Protection Department (URL: http://www.mirovaweb.it/); Copernicus Browser, Copernicus Data Space Ecosystem, European Space Agency (URL: https://dataspace.copernicus.eu/browser/).
Nishinoshima (Japan) — November 2023 Cite this Report
Nishinoshima
Japan
27.247°N, 140.874°E; summit elev. 100 m
All times are local (unless otherwise noted)
Gray emissions during October 2023
Nishinoshima is a small island in the Ogasawara Arc, about 1,000 km S of Tokyo, Japan. It contains prominent submarine peaks to the S, W, and NE. Recorded eruptions date back to 1973, with the current eruption period beginning in October 2022. Eruption plumes and fumarolic activity characterize recent activity (BGVN 48:10). This report covers the end of the eruption for September through October 2023, based on information from monthly reports of the Japan Meteorological Agency (JMA) monthly reports, and satellite data.
No eruptive activity was reported during September 2023, although JMA noted that the surface temperature was slightly elevated compared to the surrounding area since early March 2023. The Japan Coast Guard (JCG) conducted an overflight on 20 September and reported white gas-and-steam plumes rising 3 km above the central crater of the pyroclastic cone, as well as multiple white gas-and-steam emissions emanating from the N, E, and S flanks of the crater to the coastline. In addition, dark reddish brown-to-green discolored water was distributed around almost the entire circumference of the island.
Similar low-level activity was reported during October. Multiple white gas-and-steam emissions rose from the N, E, and S flanks of the central crater of the pyroclastic cone and along the coastline; these emissions were more intense compared to the previous overflight observations. Dark reddish brown-to-green discolored water remained visible around the circumference of the island. On 4 October aerial observations by JCG showed a small eruption consisting of continuous gas-and-steam emissions emanating from the central crater, with gray emissions rising to 1.5 km altitude (figure 129). According to observations from the marine weather observation vessel Keifu Maru on 26 October, white gas-and-steam emissions persisted from the center of the pyroclastic cone, as well as from the NW, SW, and SE coasts of the island for about five minutes. Slightly discolored water was visible up to about 1 km.
Frequent low-to-moderate power thermal anomalies were recorded in the MIROVA graph (Middle InfraRed Observation of Volcanic Activity) during September (figure 130). Occasional anomalies were detected during October, and fewer during November through December. A thermal anomaly was visible in the crater using infrared satellite imagery on 6, 8, 11, 16, 18, 21, and 23 September and 8, 13, 21, 26, and 28 October (figure 131).
Geologic Background. The small island of Nishinoshima was enlarged when several new islands coalesced during an eruption in 1973-74. Multiple eruptions that began in 2013 completely covered the previous exposed surface and continued to enlarge the island. The island is the summit of a massive submarine volcano that has prominent peaks to the S, W, and NE. The summit of the southern cone rises to within 214 m of the ocean surface 9 km SSE.
Information Contacts: Japan Meteorological Agency (JMA), 1-3-4 Otemachi, Chiyoda-ku, Tokyo 100-8122, Japan (URL: http://www.jma.go.jp/jma/indexe.html); MIROVA (Middle InfraRed Observation of Volcanic Activity), a collaborative project between the Universities of Turin and Florence (Italy) supported by the Centre for Volcanic Risk of the Italian Civil Protection Department (URL: http://www.mirovaweb.it/); Copernicus Browser, Copernicus Data Space Ecosystem, European Space Agency (URL: https://dataspace.copernicus.eu/browser/).
Kilauea (United States) — October 2023 Cite this Report
Kilauea
United States
19.421°N, 155.287°W; summit elev. 1222 m
All times are local (unless otherwise noted)
Strong lava fountains, lava flows, and spatter at Halema’uma’u during January-September 2023
Kīlauea is on the island of Hawai’i and overlaps the E flank of the Mauna Loa volcano. Its East Rift Zone (ERZ) has been intermittently active for at least 2,000 years. An extended eruption period began in January 1983 and was characterized by open lava lakes and lava flows from the summit caldera and the East Rift Zone. During May 2018 magma migrated into the Lower East Rift Zone (LERZ) and opened 24 fissures along a 6-km-long NE-trending fracture zone that produced lava flows traveling in multiple directions. As lava emerged from the fissures, the lava lake at Halema'uma'u drained and explosions sent ash plumes to several kilometers altitude (BGVN 43:10).
The current eruption period started during September 2021 and has been characterized by low-level lava effusions in the active Halema’uma’u lava lake (BGVN 48:01). This report covers three notable eruption periods during February, June, and September 2023 consisting of lava fountaining, lava flows, and spatter during January through September 2023 using information from daily reports, volcanic activity notices, and abundant photo, map, and video data from the US Geological Survey's (USGS) Hawaiian Volcano Observatory (HVO).
Activity during January 2023. Small earthquake swarms were recorded on 2 January 2023; increased seismicity and changes in the pattern of deformation were noted on the morning of 5 January. At around 1500 both the rate of deformation and seismicity drastically increased, which suggested magma movement toward the surface. HVO raised the Volcano Alert Level (VAL) to Watch (the second highest level on a four-level scale) and the Aviation Color Code (ACC) to Orange (the second highest color on a four-color scale) at 1520.
Multiple lava fountains and lava effusions from vents in the central eastern portion of the Halema’uma’u crater began on 5 January around 0434; activity was confined to the eastern half of the crater and within the basin of the western half of the crater, which was the focus of the eruption in 2021-2022 (figure 525). Incandescence was visible in webcam images at 1634 on 5 January, prompting HVO to raise the VAL to Warning (the highest level on a four-level scale) and the ACC to Red (the highest color on a four-color scale). Lava fountains initially rose as high as 50 m above the vent at the onset of the eruption (figure 526) but then declined to a more consistent 5-6 m height in the proceeding days. By 1930 that same day, lava had covered most of the crater floor (an area of about 1,200,000 m2) and the lava lake had a depth of 10 m. A higher-elevation island that formed during the initial phase of the December 2020 eruption remained exposed, appearing darker in images, along with a ring of older lava around the lava lake that was active prior to December 2022. Overnight during 5-6 January the lava fountains continued to rise 5 m high, and the lava effusion rate had slowed.
On 6 January at 0815 HVO lowered the VAL to Watch and the ACC to Orange due to the declining effusion rates. Sulfur dioxide emission rates ranged from 3,000-12,500 tonnes per day (t/d), the highest value of which was recorded on 6 January. Lava continued to erupt from the vents during 6-8 January, although the footprint of the active area had shrunk; a similar progression has been commonly observed during the early stages of recent eruptions at Halema’uma’u. On 9 January HVO reported one dominant lava fountain rising 6-7 m high in the E half of the crater. Lava flows built up the margins of the lake, causing the lake to be perched. On 10 January the eastern lava lake had an area of approximately 120,000 m2 that increased to 250,000 m2 by 17 January. During 13-31 January several small overflows occurred along the margins of the E lake. A smaller area of lava was active within the basin in the W half of the crater that had been the focus of activity during 2021-2022. On 19 January just after 0200 a small ooze-out was observed on the crater’s W edge.
Activity during February 2023. Activity continued in the E part of Halema’uma’u crater, as well as in a smaller basin in the W part of the 2021-2022 lava lake (figure 527). The E lava lake contained a single lava fountain and frequent overflows. HVO reported that during the morning of 1 February the large E lava lake began to cool and crust over in the center of the lake; two smaller areas of lava were observed on the N and S sides by the afternoon. The dominant lava fountain located in the S part of the lava lake paused for roughly 45 minutes at 2315 and resumed by midnight, rising 1-2 m. At 0100 on 2 February lava from the S part was effusing across the entire E lava lake area, covering the crusted over portion in the center of the lake and continuing across the majority of the previously measured 250,000 m2 by 0400. A small lava pond near the E lake produced an overflow around 0716 on 2 February. On 3 February some lava crust began to form against the N and E levees, which defined the 250,000 m2 eastern lava lake. The small S lava fountain remained active, rising 1-6 m high during 3-9 February; around 0400 on 5 February occasional bursts doubled the height of the lava fountain.
A large breakout occurred overnight during 2100 on 4 February to 0900 on 5 February on the N part of the crater floor, equal to or slightly larger in size than the E lava lake. A second, smaller lava fountain appeared in the same area of the E lava lake between 0300 and 0700 on 5 February and was temporarily active. This large breakout continued until 7 February. A small, brief breakout was reported in the S of the E lava lake around midnight on 7 February. In the W lake, as well as the smaller lava pond in the central portion of the crater floor, contained several overflows during 7-10 February and intermittent fountaining. Activity at the S small lava pond and the small S lava fountain within the E lake declined during 9-10 February. The lava pond in the central portion of the crater floor had nearly continuous, expansive flows during 10-13 February; channels from the small central lava pond seemed to flow into the larger E lake. During 13-18 February a small lava fountain was observed in the small lava pond in the central portion of the crater floor. Continuous overflows persisted during this time.
Activity in the eastern and central lakes began to decline in the late afternoon of 17 February. By 18 February HVO reported that the lava effusions had significantly declined, and that the eastern and central lakes were no longer erupting. The W lake in the basin remained active but at a greatly reduced level that continued to decline. HVO reported that this decrease in activity is attributed to notable deflationary tilt that began early on the morning of 17 February and lasted until early 19 February. By 19 February the W lake was mostly crusted over although some weak lava flows remained, which continued through 28 February. The sulfur dioxide emission rates ranged 250-2,800 t/d, the highest value of which was recorded on 6 February.
Activity during March 2023. The summit eruption at Halema’uma’u crater continued at greatly reduced levels compared to the previous two months. The E and central vents stopped effusing lava, and the W lava lake remained active with weak lava flows; the lake was mostly crusted over, although slowly circulating lava intermittently overturned the crust. By 6 March the lava lake in the W basin had stopped because the entire surface was crusted over. The only apparent surface eruptive activity during 5-6 March was minor ooze-outs of lava onto the crater floor, which had stopped by 7 March. Several hornitos on the crater floor still glowed through 12 March according to overnight webcam images, but they did not erupt any lava. A small ooze-out of lava was observed just after 1830 in the W lava lake on 8 March, which diminished overnight. The sulfur dioxide emission rate ranged from 155-321 t/d on 21 March. The VAL was lowered to Advisory, and the ACC was lowered to Yellow (the second lowest on a four-color scale) on 23 March due to a pause in the eruption since 7 March.
Activity during April-May 2023. The eruption at Halema’uma’u crater was paused; no lava effusions were visible on the crater floor. Sulfur dioxide emission rates ranged from 75-185 t/d, the highest of which was measured on 22 April. During May and June summit seismicity was elevated compared to seismicity that preceded the activity during January.
Activity during June 2023. Earthquake activity and changes in the patterns of ground deformation beneath the summit began during the evening of 6 June. The data indicated magma movement toward the surface, prompting HVO to raise the VAL to Watch and the ACC to Orange. At about 0444 on 7 June incandescence in Halema’uma’u crater was visible in webcam images, indicating that a new eruption had begun. HVO raised the VAL to Warning and the ACC to Red (the highest color on a four-color scale). Lava flowed from fissures that had opened on the crater floor. Multiple minor lava fountains were active in the central E portion of the Halema’uma’u crater, and one vent opened on the W wall of the caldera (figure 528). The eruptive vent on the SW wall of the crater continued to effuse into the lava lake in the far SW part of the crater (figure 529). The largest lava fountain consistently rose 15 m high; during the early phase of the eruption, fountain bursts rose as high as 60 m. Lava flows inundated much of the crater floor and added about 6 m depth of new lava within a few hours, covering approximately 10,000 m2. By 0800 on 7 June lava filled the crater floor to a depth of about 10 m. During 0800-0900 the sulfur dioxide emission rate was about 65,000 t/d. Residents of Pahala (30 km downwind of the summit) reported minor deposits of fine, gritty ash and Pele’s hair. A small spatter cone had formed at the vent on the SW wall by midday, and lava from the cone was flowing into the active lava lake. Fountain heights had decreased from the onset of the eruption and were 4-9 m high by 1600, with occasional higher bursts. Inflation switched to deflation and summit earthquake activity greatly diminished shortly after the eruption onset.
At 0837 on 8 June HVO lowered the VAL to Watch and the ACC to Orange because the initial high effusion rates had declined, and no infrastructure was threatened. The surface of the lava lake had dropped by about 2 m, likely due to gas loss by the morning of 8 June. The drop left a wall of cooled lava around the margins of the crater floor. Lava fountain heights decreased during 8-9 June but continued to rise to 10 m high. Active lava and vents covered much of the W half of Halema’uma’u crater in a broad, horseshoe-shape around a central, uplifted area (figure 530). The preliminary average effusion rate for the first 24 hours of the eruption was about 150 cubic meters per second, though the estimate did not account for vesiculated lava and variations in crater floor topography. The effusion rate during the very earliest phases of the eruption appeared significantly higher than the previous three summit eruptions based on the rapid coverage of the entire crater floor. An active lava lake, also referred to as the “western lava lake” was centered within the uplifted area and was fed by a vent in the NE corner. Two small active lava lakes were located just SE from the W lava lake and in the E portion of the crater floor.
During 8-9 June the lava in the central lava lake had a thickness of approximately 1.5 m, based on measurements from a laser rangefinder. During 9-12 June the height of the lava fountains decreased to 9 m high. HVO reported that the previously active lava lake in the E part of the crater appeared stagnant during 10-11 June. The surface of the W lake rose approximately 1 m overnight during 11-12 June, likely due to the construction of a levee around it. Only a few small fountains were active during 12-13 June; the extent of the active lava had retreated so that all activity was concentrated in the SW and central parts of Halema’uma’u crater. Intermittent spattering from the vent on the SW wall was visible in overnight webcam images during 13-18 June. On the morning of 14 June a weak lava effusion originated from near the western eruptive vent, but by 15 June there were no signs of continued activity. HVO reported that other eruptive vents in the SW lava lake had stopped during this time, following several days of waning activity; lava filled the lake by about 0.5 m. Lava circulation continued in the central lake and no active lava was reported in the northern or eastern parts of the crater. Around 0800 on 15 June the top of the SW wall spatter cone collapsed, which was followed by renewed and constant spattering from the top vent and a change in activity from the base vent; several new lava flows effused from the top of the cone, as well as from the pre-existing tube-fed flow from its base. Accumulation of lava on the floor resulted in a drop of the central basin relative to the crater floor, allowing several overflows from the SW lava lake to cascade into the basin during the night of 15 June into the morning of 16 June.
Renewed lava fountaining was reported at the eruptive vent on the SW side of the crater during 16-19 June, which effused lava into the far SW part of the crater. This activity was described as vigorous during midday on 16 June; a group of observatory geologists estimated that the lava was consistently ejected at least 10 m high, with some spatter ejected even higher and farther. Deposits from the fountain further heightened and widened the spatter cone built around the original eruptive vent in the lower section of the crater wall. Multiple lava flows from the base of the cone were fed into the SW lava lake and onto the southwestern-most block from the 2018 collapse within Halema’uma’u on 17 June (figure 531); by 18 June they focused into a single flow feeding into the SW lava lake. On the morning of 19 June a second lava flow from the base of the eruptive cone advanced into the SW lava lake.
Around 1600 on 19 June there was a rapid decline in lava fountaining and effusion at the eruptive vent on the SW side of the crater; vent activity had been vigorous up to that point (figure 532). Circulation in the lava lake also slowed, and the lava lake surface dropped by several meters. Overnight webcam images showed some previously eruptive lava still flowing onto the crater floor, which continued until those flows began to cool. By 21 June no lava was erupting in Halema’uma’u crater. Overnight webcam images during 29-30 June showed some incandescence from previously erupted lava flows as they continued to cool. Seismicity in the crater declined to low levels. Sulfur dioxide emission rates ranged 160-21,000 t/d throughout the month, the highest measurement of which was recorded on 8 June. On 30 June the VAL was lowered to Advisory (the second level on a four-level scale) and the ACC was lowered to Yellow. Gradual inflation was detected at summit tiltmeters during 19-30 June.
Activity during July-August 2023. During July, the eruption paused; no lava was erupting in Halema’uma’u crater. Nighttime webcam images showed some incandescence from previously erupted lava as it continued to cool on the crater floor. During the week of 14 August HVO reported that the rate in seismicity increased, with 467 earthquakes of Mw 3.2 and smaller occurring. Sulfur dioxide emission rates remained low, ranging from 75-86 t/d, the highest of which was recorded on 10 and 15 August. On 15 August beginning at 0730 and lasting for several hours, a swarm of approximately 50 earthquakes were detected at a depth of 2-3 km below the surface and about 2 km long directly S of Halema’uma’u crater. HVO reported that this was likely due to magma movement in the S caldera region. During 0130-0500 and 1700-2100 on 21 August two small earthquake swarms of approximately 20 and 25 earthquakes, respectively, occurred at the same location and at similar depths. Another swarm of 50 earthquakes were recorded during 0430-0830 on 23 August. Elevated seismicity continued in the S area through the end of the month.
Activity during September 2023. Elevated seismicity persisted in the S summit with occasional small, brief seismic swarms. Sulfur dioxide measurements were relatively low and were 70 t/d on 8 September. About 150 earthquakes occurred during 9-10 September, and tiltmeter and Global Positioning System (GPS) data showed inflation in the S portion of the crater.
At 0252 on 10 September HVO raised the VAL to Watch and the ACC to Orange due to increased earthquake activity and changes in ground deformation that indicated magma moving toward the surface. At 1515 the summit eruption resumed in the E part of the caldera based on field reports and webcam images. Fissures opened on the crater floor and produced multiple minor lava fountains and flows (figure 533). The VAL and ACC were raised to Warning and Red, respectively. Gas-and-steam plumes rose from the fissures and drifted downwind. A line of eruptive vents stretched approximately 1.4 km from the E part of the crater into the E wall of the down dropped block by 1900. The lava fountains at the onset of the eruption had an estimated 50 m height, which later rose 20-25 m high. Lava erupted from fissures on the down dropped block and expanded W toward Halema’uma’u crater. Data from a laser rangefinder recorded about 2.5 m thick of new lava added to the W part of the crater. Sulfur dioxide emissions were elevated in the eruptive area during 1600-1500 on 10 September, measuring at least 100,000 t/d.
At 0810 on 11 September HVO lowered the VAL and ACC back to Watch and Orange due to the style of eruption and the fissure location had stabilized. The initial extremely high effusion rates had declined (but remained at high levels) and no infrastructure was threatened. An eruption plume, mainly comprised of sulfur dioxide and particulates, rose as high as 3 km altitude. Several lava fountains were active on the W side of the down dropped block during 11-15 September, while the easternmost vents on the down dropped block and the westernmost vents in the crater became inactive on 11 September (figure 534). The remaining vents spanned approximately 750 m and trended roughly E-W. The fed channelized lava effusions flowed N and W into Halema’uma’u. The E rim of the crater was buried by new lava flows; pahoehoe lava flows covered most of the crater floor except areas of higher elevation in the SW part of the crater. The W part of the crater filled about 5 m since the start of the eruption, according to data from a laser rangefinder during 11-12 September. Lava fountaining continued, rising as high as 15 m by the morning of 12 September. During the morning of 13 September active lava flows were moving on the N and E parts of the crater. The area N of the eruptive vents that had active lava on its surface became perched and was about 3 m higher than the surrounding ground surface. By the morning of 14 September active lava was flowing on the W part of the down dropped block and the NE parts of the crater. The distances of the active flows progressively decreased. Spatter had accumulated on the S (downwind) side of the vents, forming ramparts about 20 m high.
Vigorous spattering was restricted to the westernmost large spatter cone with fountains rising 10-15 m high. Minor spattering occurred within the cone to the E of the main cone, but HVO noted that the fountains remained mostly below the rim of the cone. Lava continued to effuse from these cones and likely from several others as well, traveled N and W, confined to the W part of the down-dropped block and the NE parts of Halema’uma’u. Numerous ooze-outs of lava were visible over other parts of the crater floor at night. Laser range-finder measurements taken of the W part of the crater during 14-15 September showed that lava filled the crater by 10 m since the start of the eruption. Sulfur dioxide emissions remained elevated after the onset of the eruption, ranging 20,000-190,000 t/d during the eruption activity, the highest of which occurred on 10 September.
Field crews observed the eruptive activity on 15 September; they reported a notable decrease or stop in activity at several vents. Webcam images showed little to no fountaining since 0700 on 16 September, though intermittent spattering continued from the westernmost large cone throughout the night of 15-16 September. Thermal images showed that lava continued to flow onto the crater floor. On 16 September HVO reported that the eruption stopped around 1200 and that there was no observable activity anywhere overnight or on the morning of 17 September. HVO field crews reported that active lava was no longer flowing onto Halema’uma’u crater floor and was restricted to a ponded area N of the vents on the down dropped block. They reported that spattering stopped around 1115 on 16 September. Nighttime webcam images showed some incandescence on the crater floor as lava continued to cool. Field observations supported by geophysical data showed that eruptive tremor in the summit region decreased over 15-16 September and returned to pre-eruption levels by 1700 on 16 September. Sulfur dioxide emissions were measured at a rate of 800 t/d on 16 September while the eruption was waning, and 200 t/d on 17 September, which were markedly lower compared to measurements taken the previous week of 20,000-190,000 t/d.
Geologic Background. Kilauea overlaps the E flank of the massive Mauna Loa shield volcano in the island of Hawaii. Eruptions are prominent in Polynesian legends; written documentation since 1820 records frequent summit and flank lava flow eruptions interspersed with periods of long-term lava lake activity at Halemaumau crater in the summit caldera until 1924. The 3 x 5 km caldera was formed in several stages about 1,500 years ago and during the 18th century; eruptions have also originated from the lengthy East and Southwest rift zones, which extend to the ocean in both directions. About 90% of the surface of the basaltic shield volcano is formed of lava flows less than about 1,100 years old; 70% of the surface is younger than 600 years. The long-term eruption from the East rift zone between 1983 and 2018 produced lava flows covering more than 100 km2, destroyed hundreds of houses, and added new coastline.
Information Contacts: Hawaiian Volcano Observatory (HVO), U.S. Geological Survey, PO Box 51, Hawai'i National Park, HI 96718, USA (URL: http://hvo.wr.usgs.gov/).
Tinakula (Solomon Islands) — December 2023 Cite this Report
Tinakula
Solomon Islands
10.386°S, 165.804°E; summit elev. 796 m
All times are local (unless otherwise noted)
Continued lava flows and thermal activity during June through November 2023
Tinakula is a remote 3.5 km-wide island in the Solomon Islands, located 640 km ESE of the capital, Honiara. The current eruption period began in December 2018 and has more recently been characterized by intermittent lava flows and thermal activity (BGVN 48:06). This report covers similar activity during June through November 2023 using satellite data.
During clear weather days (20 July, 23 September, 23 October, and 12 November), infrared satellite imagery showed lava flows that mainly affected the W side of the island and were sometimes accompanied by gas-and-steam emissions (figure 54). The flow appeared more intense during July and September compared to October and November. According to the MODVOLC thermal alerts, there were a total of eight anomalies detected on 19 and 21 July, 28 and 30 October, and 16 November. Infrared MODIS satellite data processed by MIROVA (Middle InfraRed Observation of Volcanic Activity) detected a small cluster of thermal activity occurring during late July, followed by two anomalies during August, two during September, five during October, and five during November (figure 55).
Geologic Background. The small 3.5-km-wide island of Tinakula is the exposed summit of a massive stratovolcano at the NW end of the Santa Cruz islands. It has a breached summit crater that extends from the summit to below sea level. Landslides enlarged this scarp in 1965, creating an embayment on the NW coast. The Mendana cone is located on the SE side. The dominantly andesitic volcano has frequently been observed in eruption since the era of Spanish exploration began in 1595. In about 1840, an explosive eruption apparently produced pyroclastic flows that swept all sides of the island, killing its inhabitants. Recorded eruptions have frequently originated from a cone constructed within the large breached crater. These have left the upper flanks and the steep apron of lava flows and volcaniclastic debris within the breach unvegetated.
Information Contacts: MIROVA (Middle InfraRed Observation of Volcanic Activity), a collaborative project between the Universities of Turin and Florence (Italy) supported by the Centre for Volcanic Risk of the Italian Civil Protection Department (URL: http://www.mirovaweb.it/); Hawai'i Institute of Geophysics and Planetology (HIGP) - MODVOLC Thermal Alerts System, School of Ocean and Earth Science and Technology (SOEST), Univ. of Hawai'i, 2525 Correa Road, Honolulu, HI 96822, USA (URL: http://modis.higp.hawaii.edu/); Copernicus Browser, Copernicus Data Space Ecosystem, European Space Agency (URL: https://dataspace.copernicus.eu/browser/).
Search Bulletin Archive by Publication Date
Select a month and year from the drop-downs and click "Show Issue" to have that issue displayed in this tab.
The default month and year is the latest issue available.
Bulletin of the Global Volcanism Network - Volume 42, Number 01 (January 2017)
Chirpoi (Russia)
Chirpoi's Snow cone erupts 11 November 2012; continued activity through October 2016
Kanlaon (Philippines)
Three ash explosions on 18 June 2016; steam plumes through July
Langila (Papua New Guinea)
Weak ash plumes during April-May and November-December 2016
Momotombo (Nicaragua)
Numerous explosions with ash plumes and lava flow, December 2015-April 2016
Nyiragongo (DR Congo)
New vent in the summit crater during February-April 2016; lava lake active throughout 2011-2016
Rinjani (Indonesia)
Ash eruptions on 1 August to 10 km altitude; explosions on 27 September 2016
Sheveluch (Russia)
Ongoing strong explosions and ash plumes during September 2014-February 2015
Stromboli (Italy)
Ongoing explosive activity during 2014, followed by large lava flows into the sea in August
Suwanosejima (Japan)
Occasional ash plumes during January-September 2015
Telica (Nicaragua)
Multiple explosive ash-and-gas episodes; May 2015, and September 2015 through May 2016
Chirpoi
Russia
46.532°N, 150.871°E; summit elev. 742 m
All times are local (unless otherwise noted)
Chirpoi's Snow cone erupts 11 November 2012; continued activity through October 2016
The first recorded eruption in 30 years at Russia's Chirpoi volcano was initially detected on 11 November 2012 by MODIS infrared satellite data and captured by the MODVOLC thermal alert system. The Sakhalin Volcanic Eruption Response Team (SVERT) reported satellite images that detected thermal anomalies over Snow, a volcanic crater on the S end of Chirpoi Island, beginning on 20 November 2012 (BGVN 38:12), which they interpreted as a possible lava flow on the SE flank. Sparse satellite observations by SVERT, MIROVA and MODVOLC thermal anomaly information, a single report from the Tokyo Volcanic Ash Advisory Center (VAAC), and a site visit to this remote location in the Kuril Islands in the western Pacific Ocean together suggest nearly continuous activity at Snow through mid-October 2016.
Activity during November 2012-April 2013. Continuous reports of activity between November 2012 and April 2013 began with strong MODVOLC thermal anomalies from MODIS satellite data first recorded on 11 November local time, followed by a report of thermal anomalies detected from SVERT on 20 November. Strong thermal anomalies were reported by MODVOLC for 12 days during November and nine days during December 2012, after which they did not appear again until July 2013. However, SVERT reported thermal anomalies in satellite data almost weekly through 26 April 2013. They also observed steam-and-gas emissions in satellite data a number of times between 15 December 2012 and 5 March 2013.
Activity during July 2013-June 2014. After about a 10 week break between thermal anomaly observations, the MODVOLC pixels reappeared on 8 July 2013, and SVERT reported a thermal anomaly on 14 July 2013 suggesting a new period of lava effusion. The MODVOLC anomalies were intermittent with only three in July, one each in August and September, and two in October 2013; they then disappeared until March 2014. A single MODVOLC thermal anomaly was recorded on 10 March 2014, one appeared on 2 June and two appeared on 25 June 2014.
SVERT reported anomalies twice in July 2013, three times in August and once on 1 September before picking up again in November. SVERT reported thermal anomalies every week in November 2013, and most weeks through the first week in May 2014. After weak anomalies during 2-4 June 2014, SVERT inferred cooling lava flows and lowered the Alert Level from Yellow to Green.
Steam-and-gas emissions were reported by SVERT only between 23 July and 12 August 2013, and not again until late October. Gas-and-steam emissions were common between 22 October and 25 November 2013 when a plume was observed in satellite imagery drifting 90 km SE, after which plumes were not observed until 15 March 2014. Twice in late March (20 and 27) steam-and-gas plumes were detected drifting SE (150 and 50 km). After 13 April 2014, plumes were not detected again until September.
Activity during August 2014-October 2016. Although SVERT kept the Alert Level at Green until 4 September 2014 when they raised it back to Yellow, MODVOLC thermal alert pixels in late June (two on the 25th) and on 10 August, suggest possible continued activity during the summer. When skies were clear, SVERT again detected thermal anomalies in satellite data beginning on 1 September 2014 and continuing most weeks until 8 June 2015. MODVOLC recorded thermal anomalies on 2 and 22 September, and 22 October 2014, but then was quiet until a strong signal reappeared in April 2015 with six days of multiple anomalies recorded during the month, and five days with anomalies in May. During this interval from September 2014 to June 2015, steam-and-gas plumes were reported twice each in September 2014, February, March, and April 2015, and on 25 May 2015.
While no data is available from SVERT between 9 June and 11 November 2015, the Aviation Color Code remained at Yellow, and single MODVOLC thermal alert pixels were recorded on 28 June, 19 and 30 July, two on 7 September, and one each on 5 October, 3 November, and 19 November 2015, suggesting some type of continued heat source such as a lava flow. In addition, MIROVA records for 2015 provide the strongest evidence for ongoing low-to-moderate volcanic activity throughout 2015 (figure 2).
Visual confirmation of an effusive eruption at Chirpoi was made in October 2015. The website Volcano Discovery reported that "Passengers on board a Russian cruise ship (Ponant) documented the recent … eruption of Snow volcano. When passing the island in October 2015, lava flows were actively reaching the sea, creating spectacular littoral explosions." (figure 3). A video of the event from the cruise ship is also posted on the website.
SVERT reports were available again beginning in November 2015 and they reported that satellite images revealed thermal anomalies almost weekly from 11 November through 10 August 2016. They lowered the Alert Level to Green on 29 August 2016. MODVOLC thermal anomaly data was sparse in 2016 with only three reports of single anomalies on 5 February, 20 May, and 12 June 2016. Reports of steam-and-gas plumes observed in satellite imagery from SVERT were made on 12 and 14 November 2015, 24 March, and 20 and 23 April 2016. A plume that may have contained minor ash was observed by SVERT in satellite data drifting SW on 16 July, and one drifting 90 km N was noted during 22-24 July.
The Tokyo VAAC reported a possible eruption observed on satellite imagery at 1300 UTM on 6 March 2016 with a plume rising to 6.1 km altitude and drifting E. MIROVA data for 2016 again seems to confirm ongoing low to moderate thermally anomalous activity at Chirpoi until the middle of October when Radiative Power levels drop below 0.5 Watts VRP (figure 2).
Geologic Background. Chirpoi, a small island lying between the larger islands of Simushir and Urup, contains a half dozen volcanic edifices constructed within an 8-9 km wide, partially submerged caldera. The southern rim of the caldera is exposed on nearby Brat Chirpoev Island. The symmetrical Cherny volcano, which forms the central cone of the island, erupted twice during the 18th and 19th centuries. The youngest volcano, Snow, originated between 1770 and 1810. It is composed almost entirely of lava flows, many of which have reached the sea on the southern coast. No recorded eruptions are known from Brat Chirpoev, but its youthful morphology suggests recent Strombolian activity.
Information Contacts: Sakhalin Volcanic Eruption Response Team (SVERT), Institute of Marine Geology and Geophysics, Far Eastern Branch, Russian Academy of Science, Nauki st., 1B, Yuzhno-Sakhalinsk, Russia, 693022 (URL: http://www.imgg.ru/en/, http://www.imgg.ru/ru/svert/reports/); Hawai'i Institute of Geophysics and Planetology (HIGP), MODVOLC Thermal Alerts System, School of Ocean and Earth Science and Technology (SOEST), Univ. of Hawai'i, 2525 Correa Road, Honolulu, HI 96822, USA (URL: http://modis.higp.hawaii.edu/, http://modis.higp.hawaii.edu/cgi-bin/modisnew.cgi); MIROVA (Middle InfraRed Observation of Volcanic Activity), a collaborative project between the Universities of Turin and Florence (Italy) supported by the Centre for Volcanic Risk of the Italian Civil Protection Department (URL: http://www.mirovaweb.it/); Volcano Discovery (URL: http://www.volcanodiscovery.com/chirpoi/news/55254/Chirpoi-volcano-Kurile-Islands-Russia-video-of-lava-entering-the-sea.html); Tokyo Volcanic Ash Advisory Center (VAAC), Tokyo, Japan (URL: http://ds.data.jma.go.jp/svd/vaac/data/).
Kanlaon (Philippines) — January 2017 Cite this Report
Kanlaon
Philippines
10.4096°N, 123.13°E; summit elev. 2422 m
All times are local (unless otherwise noted)
Three ash explosions on 18 June 2016; steam plumes through July
An ash explosion from Kanlaon on 24 November 2015 was the start of activity that included intermittent ash emissions through December and during 29-31 March 2016 (BGVN: 4014). That activity was followed by decreasing tremor and steam plumes rising to as high as 800 during the first days of April 2016. A short series of explosions on 18 June 2016 were the last ash emissions through 2016, based on Philippine Institute of Volcanology and Seismology (PHIVOLCS) reports. The Alert Level remained at 1 (on a scale of 0-5) throughout the reporting period, indicating low level of volcanic unrest.
PHIVOLCS reported that ground deformation measurements from continuous GPS data as of 2 June 2016 indicated slight inflation of the edifice since December 2015. Weak to moderate emission of white steam plumes that rose 540 m during 15-17 June and drifted SW and NW.
A series of three eruptive events occurred on 18 June, beginning at 0919 and lasting 27 minutes. These events were recorded by the seismic monitoring network as consecutive explosion-type earthquakes that lasted 30, 42, and 29 seconds, respectively. The first event, a steam-and-gas explosion, generated a light gray-to-white ash plume that initially rose 1.5 km above the crater and then later to 3 km (figure 3). The second event, an ash eruption immediately following the first event, produced a dense black ash plume that rose 500 m. Lastly, a grayish ash plume rose 500 m. Minor ashfall was reported to the W in the barangays of Ara-al, San Miguel, and Yubo in La Carlota City (14 km W), Sag-ang in La Castellana (16 km SW), and Ilijan in Bago City (30 km NW). A diffuse sulfur odor was detected in Ara-al.
PHIVOLCS reported that during 20, 22-23, and 25-26 June white steam plumes rose as high as 800 m and drifted WNW, NW and SW; wispy steam plumes were observed on 27 June. Starting at 1640 on 23 June the seismic network recorded a 4-minute-long, explosion-type signal; weather clouds prevented visual observations of the summit area.
White plumes were again seen during 20-25 July. On 20 July plumes were a dirty-white color; on 21-22 they were of white steam; and on 25 July they rose 200 m and drifted NW and SW. Sulfur dioxide (SO2) emitted at the active vent averaged 234 tonnes/day on 21 July.
Ground deformation data from continuous GPS measurements as of 3 September 2016 indicated no significant change of the edifice since August 2016.
Geologic Background. Kanlaon volcano (also spelled Canlaon) forms the highest point on the Philippine island of Negros. The massive andesitic stratovolcano is covered with fissure-controlled pyroclastic cones and craters, many of which are filled by lakes. The largest debris avalanche known in the Philippines traveled 33 km SW from Kanlaon. The summit contains a 2-km-wide, elongated northern caldera with a crater lake and a smaller but higher active vent, Lugud crater, to the south. Eruptions recorded since 1866 have typically consisted of phreatic explosions of small-to-moderate size that produce minor local ashfall.
Information Contacts: Philippine Institute of Volcanology and Seismology (PHIVOLCS), Department of Science and Technology, PHIVOLCS Building, C.P. Garcia Avenue, Univ. of the Philippines Campus, Diliman, Quezon City, Philippines (URL: http://www.phivolcs.dost.gov.ph/).
Langila (Papua New Guinea) — January 2017 Cite this Report
Langila
Papua New Guinea
5.525°S, 148.42°E; summit elev. 1330 m
All times are local (unless otherwise noted)
Weak ash plumes during April-May and November-December 2016
After two explosions at Langila produced ash plumes that rose to 1.5 and 2.1 km in early December 2012 (BGVN 41.01), no further information about the volcano's activity was available from the Rabaul Volcano Observatory or the Darwin VAAC until April 2016. This report discusses two new eruptions in 2016, one during 2 April-13 May and the other during 3 November-24 December. Observations of ash plumes continued into mid-January 2017.
Thermal anomalies, based on MODIS satellite instruments analyzed using the MODVOLC algorithm, were occasionally detected after 2012. During 2013, seven anomalies were reported during 23 October-1 December (4 pixels on 25 October); during 2014-2015, a possible anomaly was identified on 23 August 2014 NE of the crater and thus probably not associated with volcanic activity.
During 2016, the Darwin VAAC reported the ejection of several ash plumes during 2 April-13 May and 3 November-24 December (table 3). Most plumes rose between 2-3.3 km in altitude. MODVOLC thermal alerts were also seen during those two periods, with six anomalies during April and May, and one reported in November During 20-27 December 2016, five thermal anomalies were reported (most with more than one pixel). Two alert pixels in August were weak and somewhat E of the volcano, and probably not associated with activity.
Table 3. Ash plumes from Langila reported during April-May and November-December 2016. Observations are based on analyses of satellite imagery, ground observations by the Rabaul Volcano Observatory, and wind data; dates are based on local time. Courtesy of the Darwin VAAC.
| Date |
Max. Plume Altitude (km) |
Drift |
| 02-03 Apr 2016 |
2.1 |
35-65 km N, NE, E |
| 06-07 Apr 2016 |
3 |
55 km NE, E |
| 21-22 Apr 2016 |
2.1 |
75-110 km N |
| 09-10 May 2016 |
2.1-3 |
75 km N, NW, W |
| 11-13 May 2016 |
2.1 |
25-85 km NNW, NW, W |
| 03 Nov 2016 |
3.3 |
55 km W |
| 04 Nov 2016 |
3.3 |
NW |
| 13 Nov 2016 |
2.1 |
55 km N |
| 16 Nov 2016 |
4.3 |
30 km SE |
| 01-06 Dec 2016 |
2.1-3 |
NE, NW, W (40 km on 3 Dec) |
| 08-09, 11, 13 Dec 2016 |
1.8-2.4 |
110 km W, WNW, N |
| 21-24 Dec 2016 |
2.4 |
N, NW, S, SE |
The Mirova (Middle InfraRed Observation of Volcanic Activity) volcano hotspot detection system, also based on analysis of MODIS data, also detected occasional hotspots during 2016 (figure 5). Most occurred during April-May and November-December, but a few intermittent anomalies were noted every month during June-October as well. The heat radiated by the volcanic activity (or Volcanic Radiative Power, as measured in watts) was mostly less than 0.5 W.
Geologic Background. Langila, one of the most active volcanoes of New Britain, consists of a group of four small overlapping composite basaltic-andesitic cones on the lower E flank of the extinct Talawe volcano in the Cape Gloucester area of NW New Britain. A rectangular, 2.5-km-long crater is breached widely to the SE; Langila was constructed NE of the breached crater of Talawe. An extensive lava field reaches the coast on the N and NE sides of Langila. Frequent mild-to-moderate explosive eruptions, sometimes accompanied by lava flows, have been recorded since the 19th century from three active craters at the summit. The youngest and smallest crater (no. 3 crater) was formed in 1960 and has a diameter of 150 m.
Information Contacts: Darwin Volcanic Ash Advisory Centre (VAAC), Bureau of Meteorology, Northern Territory Regional Office, PO Box 40050, Casuarina, NT 0811, Australia (URL: http://www.bom.gov.au/info/vaac/); Rabaul Volcano Observatory (RVO), PO Box 386, Rabaul, Papua New Guinea; Hawai'i Institute of Geophysics and Planetology (HIGP), MODVOLC Thermal Alerts System, School of Ocean and Earth Science and Technology (SOEST), Univ. of Hawai'i, 2525 Correa Road, Honolulu, HI 96822, USA (URL: http://modis.higp.hawaii.edu/, http://modis.higp.hawaii.edu/); MIROVA (Middle InfraRed Observation of Volcanic Activity), a collaborative project between the Universities of Turin and Florence (Italy) supported by the Centre for Volcanic Risk of the Italian Civil Protection Department (URL: http://www.mirovaweb.it/).
Momotombo (Nicaragua) — January 2017 Cite this Report
Momotombo
Nicaragua
12.423°N, 86.539°W; summit elev. 1270 m
All times are local (unless otherwise noted)
Numerous explosions with ash plumes and lava flow, December 2015-April 2016
Between 1996 and 2011 there were about 14 seismic swarms at Momotombo, along with fumarolic activity, and an explosion in 2006 (BGVN 37:02). According to the Instituto Nicaragüense de Estudios Territoriales (INETER), explosive activity that generated ash plumes resumed on 1 December 2015 and ended on 8 April 2016. The number of daily explosions increased beginning on 12 February 2016, with very high counts in the first half of March (figure 15).
Activity during December 2015-January 2016. According to the Instituto Nicaragüense de Estudios Territoriales (INETER), an explosion at 0749 on 1 December 2015 generated a gas-and-ash plume that rose 1 km above the crater and drifted SW. Additional explosions at 0817, 0842, and 0855 generated ash plumes that rose 300 m. Gas emissions were visible the rest of the day. The Sistema Nacional para la Prevención, Mitigación y Atención de Desastres (SINAPRED) reported that during 1-2 December, explosions ejected incandescent tephra, and a slow-moving lava flow on the N flank was observed. According to a news report (La Prensa) that interviewed INETER officials, ashfall was reported in nearby communities to the W and SW, including La Concha (40 km SSE), Los Arcos, Flor de la Piedra, La Paz Centro, and Leóin. Some families in La Paz Centro (17 km SW) self-evacuated.
Based on satellite and webcam observations, and seismic data, the Washington Volcanic Ash Advisory Center (VAAC) reported that during 2-3 December 2015, ash plumes rose to an altitude of 2.4 km and drifted 90-225 km NW and WNW.
According to INETER and SINAPRED reports, activity continued through 10 December 2015. Fieldwork revealed a small, incandescent, circular crater halfway up the E flank that was fuming during the morning of 6 December. An explosion on 7 December destroyed part of the crater. On 10 December, SINAPRED reported that material had been accumulating in the crater since the beginning of the eruption on 1 December. Seismicity during 9-14 December was low and stable.
INETER reported that during 29-30 December 2015, no explosions were detected, though Real-time Seismic-Amplitude Measurements (RSAM) continued at moderate-to-high levels.
Three gas-and-ash explosions on 2 January 2016 (at 1333, 1426, and 1434) were noted in INETER and SINAPRED reports which excavated the remaining parts of the lava dome that had been emplaced about a month earlier. An ash plume rose 500 m above the crater, drifted S and SW, and caused ashfall in Puerto Momotombo (9 km WSW). Possible ash plumes from an explosion at 2129 were hidden by darkness. At 0420 on 3 January, an explosion ejected lava bombs 2 km away and caused ashfall in La Paz Centro. Lava flows had advanced as far as 2 km down the NE flank.
INETER reported that at 1209 on 12 January 2016, a large explosion ejected incandescent material onto the flanks and generated an ash plume that rose 4 km above the crater. Tephra was deposited on the E, NE, N, and NW flanks. Ash plumes drifted downwind and caused ashfall in the communities of Flor de Piedra, Amatistán, Guacucal (40 km N), La Palma, Puerto Momotombo (10 km WSW), La Sabaneta, Mira Lago, Asentamiento Miramar, Pancasán, René Linarte, Raúl Cabezas, and Betania. At around 0500 on 15 January, strong volcanic tremor was accompanied by small explosions in the crater; ejected ash and incandescent tephra were deposited on the W flank. Seismicity decreased during 16-17 January.
According to INETER, during 20-21 January both RSAM values and emissions were low. Volcanic tremor increased at 0900 on 22 January, causing RSAM values to rise to high levels. There were no emission changes. INETER recommended that the public stay at least 6 km away from the volcano.
INETER reported that during 26-29 January, RSAM values were at low to moderate levels, and gas emissions were at moderate levels. Crater incandescence from high-temperature gas emissions was observed at night during 26-27 January. A Strombolian explosion at 0344 on 30 January ejected tephra onto the E, NE, N, and NW flanks, and produced gas emissions. At 0529 on 31 January, another explosion also ejected gas, ash, and incandescent material. Ashfall was reported in the nearby communities of Boqueron, Puerto Momotombo, and La Sabaneta. Moderate levels of gas emissions drifted SW towards Puerto Momotombo.
Activity during February-April 2016. During 4-5 and 7-8 February, both RSAM values were low to moderate and emissions were at moderate levels. INETER reported moderate levels of gas emissions on 10 February; volcanic tremor and gas emissions increased to moderate-to-high levels the next day. An explosion on 12 February produced small ash emissions and ejected incandescent material onto the N and SE flanks. An explosion at 1305 on 15 February generated an ash plume that rose 2 km above the crater and ejected incandescent tephra onto the N and NE flanks.
INETER reported that during 16-17 February, two explosions accompanied by tremor produced ash emissions and ejected incandescent material onto the flanks. The first and largest explosion (at 0344) ejected incandescent tephra 800 m above the crater. RSAM values were at low-to-moderate levels. Based on webcam views and satellite images, the Washington VAAC reported that on 19 February, ash emissions rose to an altitude of 3.6 km and drifted SW and WSW. The next day, ash emissions drifted SW. On 21 February ash plumes drifted about 80 km W and 25 km E.
During 19 February-1 March, explosions were detected daily. Explosions produced ash plumes and ejected incandescent material onto the N, NE, E, and SE flanks. Ash plumes rose 1.7-2.3 km above the crater and drifted SW during 21-22 February; gas-and-ash plumes rose 1.8 km on 24 February; an ash plume rose 1 km on 25 February and a small gas-and-ash plume rose 300 m on 26 February. A pyroclastic flow traveled 3.5 km down the N and NW flanks during 23-24 February. Explosions on 27 February ejected tephra 300 m above the crater.
At 0646 on 1 March, explosions ejected gas and incandescent tephra, and an ash plume that rose 1.2 km lasted 16 minutes, causing the plume to widen and darken the sky. According to INETER, 53 small explosions during 2-3 March generated weak gas plumes that rose 300 m above the crater. On 3 March, some explosions produced ash plumes that drifted W and SW. RSAM values were at low to moderate levels. SINAPRED reported that during 5-6 March, there were 78 explosions for a total of 279 explosions detected since 1 December 2015. One of the most significant explosions occurred on 6 March. The next day gas-and-ash plumes rose as high as 1 km above the crater.
On 28 March, SINAPRED reported that 38 explosions, detected over a period of 24 hours, ejected gas-and-ash plumes and incandescent tephra. The strongest event occurred at 1140 on 27 March and generated a plume that rose 1 km.
SINAPRED reported that on 2 April, explosions produced gas-and-ash plumes and ejected incandescent tephra. According to INETER, three explosions during 5-6 April ejected incandescent material onto the flanks and produced gas-and-ash plumes that rose 500 m above the crater. During 6-7 April there were 27 small explosions. The explosions ejected some incandescent material and generated ash plumes that rose 200 m and drifted SW. RSAM values were low during 5-12 April.
Monthly INETER reports did not indicate any explosive activity after 8 April 2016. The August 2016 report indicated that seismicity was low, with only five volcano-tectonic earthquakes. The RSAM in August was a low 30 units.
Thermal anomalies during the 2015-16 eruption. Many thermal anomalies, based on MODIS satellite instruments analyzed using the MODVOLC algorithm, were observed between 2-6 December 2015, primarily on the ENE flank. Subsequently, one anomaly was observed on 1 February, 2 February, and 15 February 2016. A weak possible hotspot on the E flank was also observed on 19 February, but it was slightly S of the previous hotspots.
The Mirova (Middle InfraRed Observation of Volcanic Activity) system, also based on analysis of MODIS data, detected several anomalies within 5 km of the crater during March 2016, but none thereafter through 2016. The heat radiated by the volcanic activity (or Volcanic Radiative Power, as measured in watts) was mostly less than 0.5 watts.
Before this latest activity, a weak hotspot was also detected by MODVOLC on 7 March 2012 near the N rim of the crater, and on 19 June 2014, somewhat further down the E flank than most of the other events; neither event may have been associated with volcanism; no volcanic activity was reported on those days.
Geologic Background. Momotombo is a young stratovolcano that rises prominently above the NW shore of Lake Managua, forming one of Nicaragua's most familiar landmarks. Momotombo began growing about 4500 years ago at the SE end of the Marrabios Range and consists of a somma from an older edifice that is surmounted by a symmetrical younger cone with a 150 x 250 m wide summit crater. Young lava flows extend down the NW flank into the 4-km-wide Monte Galán caldera. The youthful cone of Momotombito forms an island offshore in Lake Managua. Momotombo has a long record of Strombolian eruptions, punctuated by occasional stronger explosive activity. The latest eruption, in 1905, produced a lava flow that traveled from the summit to the lower NE base. A small black plume was seen above the crater after a 10 April 1996 earthquake, but later observations noted no significant changes in the crater. A major geothermal field is located on the south flank.
Information Contacts: Instituto Nicaragüense de Estudios Territoriales (INETER), Apartado Postal 2110, Managua, Nicaragua (URL: http://webserver2.ineter.gob.ni/vol/dep-vol.html); Sistema Nacional para la Prevención, Mitigación y Atención de Desastres (SINAPRED), Edificio SINAPRED, Rotonda Comandante Hugo Chávez 50 metros al Norte, frente a la Avenida Bolívar, Managua, Nicaragua (URL: http://www.sinapred.gob.ni/); Washington Volcanic Ash Advisory Center (VAAC), Satellite Analysis Branch (SAB), NOAA/NESDIS OSPO, NOAA Science Center Room 401, 5200 Auth Rd, Camp Springs, MD 20746, USA (URL: http://www.ospo.noaa.gov/Products/atmosphere/vaac/, archive at: http://www.ssd.noaa.gov/VAAC/archive.html); Hawai'i Institute of Geophysics and Planetology (HIGP), MODVOLC Thermal Alerts System, School of Ocean and Earth Science and Technology (SOEST), Univ. of Hawai'i, 2525 Correa Road, Honolulu, HI 96822, USA (URL: http://modis.higp.hawaii.edu/); MIROVA (Middle InfraRed Observation of Volcanic Activity), a collaborative project between the Universities of Turin and Florence (Italy) supported by the Centre for Volcanic Risk of the Italian Civil Protection Department (URL: http://www.mirovaweb.it/); La Prensa (Nicaragua) (URL: https://www.laprensani.com/).
Nyiragongo (DR Congo) — January 2017 Cite this Report
Nyiragongo
DR Congo
1.52°S, 29.25°E; summit elev. 3470 m
All times are local (unless otherwise noted)
New vent in the summit crater during February-April 2016; lava lake active throughout 2011-2016
Nyiragongo holds one of the world's largest lava lakes, having been observed since at least 1971 (CSLP 21-71). Lava flows in 1977 and 2002 had deadly consequences for the city of Goma, which lies about 15 km S of the summit. The last Bulletin (BGVN 39:04) summarized observations made by a team of scientists that visited the volcano during 30 May-9 June 2011, and Toulouse Volcanic Ash Advisory Center (VAAC) notices posted in July 2012. This report covers activity from November 2011 through December 2016. Ground reports of activity are infrequent, though there are intermittent tourist expeditions, and a visit by scientists in March 2016 provided visual observations detailing changes in the crater and vent morphology.
Excellent pictures of the lava lake within the crater were taken in June 2010 by photographer Olivier Grunewald, while on an expedition to the volcano with observatory scientists doing fieldwork. These images, 28 total, were provided by Nelson (2011) for a news article; three are shown below (figures 54-56).
Emissions and thermal anomalies. A nearly daily record of thermal alerts identified from the MODIS Agua and Terra satellite sensors has been generated by MODVOLC since 2002; the MODVOLC and MIROVA systems recorded nearly daily thermal anomalies during 2015 and at least through December 2016.
According to NASA's Earth Observatory, a satellite image acquired on 15 November 2011 showed heat coming from the active lava lake. The Toulouse VAAC reported that, according to a Volcano Observatory Notices for Aviation (VONA) issued by OVG (Observatoire Volcanologique de Goma), a gas plume composed mostly of sulfur dioxide rose from the crater on 1 November 2012. Another satellite image, acquired on 29 July 2013 and analyzed by NASA's Earth Observatory, again showed incandescence coming from the active lava lake in the summit crater; a diffuse blue plume drifted N.
A satellite image from 29 January 2014 showed a gas-and-steam plume rising from Nyiragongo. On 9 February 2015, clear skies permitted a view from space of plumes venting from Nyamuragira (figure 57, top) and Nyiragongo (figure 57, bottom) volcanoes.
New vent in crater, February 2016. Activity intensified on 28 February 2016, prompting OVG to dispatch a team of scientists to the crater. Starting at 0400 on 29 February, local residents began to hear frequent rumblings coming from the volcano almost every minute. These were likely caused by the opening of a new vent (observed the next day) and associated rockfalls inside the crater. During a 1-2 March field expedition, the scientists observed the new eruptive vent (figure 58), located at the NE end of the lowest crater terrace, outside the active lava lake (which had been in place since 2002) and just at the base of the near-vertical crater walls. The vent sits on the E-trending fracture zone that connects the summit vent with the prominent flank cone Baruta to the NE of the main edifice, near the village of Kibumba. Photos in the report suggest that the new vent sits atop a small spatter cone. Fresh lava flows had pooled onto the crater floor around the cone.
Observers during a 10-11 March field expedition noted that activity in the new vent consisted in pulsating lava fountains and Strombolian bursts which ejected material of a few tens of meters high. Lava flows from the new vent extended around the central pit on 11 March (figure 59). Activity in the lava lake was intense; lava fountains were active in the N and E parts of the lake. Both the lava lake and crater vent were producing gas emissions (figure 60).
On 26 March and 8 April 2016, the mainly effusive activity from the new vent continued with little change. Lava flows had surrounded the central pit (containing the main lava lake), covered most of the third terrace, and cascaded into the central vent at multiple locations.
A report from OVG on 12 April 2016 noted that activity had declined since 6 April 2016, and that the level of the lava lake had dropped. A report dated 17 April stated that some volcanic earthquakes had been located within 5 km E and 10-15 km N of the crater; continuous volcanic tremor was recorded during 0200-0400 on 17 April. In a photo dated 19 April the incandescent vent atop a spatter cone was visible. According to Volcano Discovery, local mountain guides reported that as of 30 May, no more lava flows were being produced from the vent, although bubbling lava was visible.
Ongoing activity through December 2016. Social media accounts and photos from a few tourist expeditions showed that the lava lake within the summit crater remained active during August-November 2016. Infrared data from MODIS instruments confirmed this persistent activity, with almost daily anomalies, through the end of December 2016.
Information from a weekly bulletin produced by the Goma Volcano Observatory, not available online, was reported by Radio Kivu. That report, for 27 December-2 January 2017, noted there was incandescence visible during 30-31 December, and that lava flows had overflowed the lake into the rest of the crater, accompanied by explosions and fountaining. A persistent gas plume can be seen during the day, which typically blows to the west.
Research on January 2002 eruption. In a recent article by Wauthier and others (2012), and summarized by Morton (2016), researchers reported finding evidence for linkage between the deadly January 2002 eruption (BGVN 26:12 and later) and a magnitude-6.2 earthquake eight months afterwards, centered 20 km S in the Lake Kivu region, partially destroying the town of Kalehe. Using satellite radar data (InSAR – Interferometric Synthetic Aperature Radar) to analyze ground deformation between the volcano and the lake before and after both the eruption and the earthquake, they inferred the formation of 20-km-long dike intrusion (figure 61, along the pink line between Nyiragongo and Lake Kivu).
References: Morton, M. C., 2016 (May/June), Double trouble: Volcanic eruption leads to strong earthquake eight months later, Earth, American Geosciences Institute, v.61, no. 5&6, p. 33 (www.earthmagazine.org).
Nelson, P., 2011 (28 February), Nyiragongo Crater: Journey to the Center of the World, boston.Com (URL: http://archive.boston.com/bigpicture/2011/02/nyiragongo_crater_journey_to_t.html). Photos by Olivier Grunewald.
Wauthier, C., Cayol, V., Kervyn, F., and d'Oreye, N., 2012 (May), Magma sources involved in the 2002 Nyiragongo eruption, as inferred from an InSAR analysis, Journal of Geophysical Research, Solid Earth, Geodesy and Gravity/Tectonophysics, v. 117, issue B5, 36 p.
Geologic Background. The Nyiragongo stratovolcano contained a lava lake in its deep summit crater that was active for half a century before draining catastrophically through its outer flanks in 1977. The steep slopes contrast to the low profile of its neighboring shield volcano, Nyamuragira. Benches in the steep-walled, 1.2-km-wide summit crater mark levels of former lava lakes, which have been observed since the late-19th century. Two older stratovolcanoes, Baruta and Shaheru, are partially overlapped by Nyiragongo on the north and south. About 100 cones are located primarily along radial fissures south of Shaheru, east of the summit, and along a NE-SW zone extending as far as Lake Kivu. Many cones are buried by voluminous lava flows that extend long distances down the flanks, which is characterized by the eruption of foiditic rocks. The extremely fluid 1977 lava flows caused many fatalities, as did lava flows that inundated portions of the major city of Goma in January 2002.
Information Contacts: Observatoire Volcanologique de Goma (Goma Volcano Observatory), Goma, North Kivu, DR Congo; Hawai'i Institute of Geophysics and Planetology (HIGP), MODVOLC Thermal Alerts System, School of Ocean and Earth Science and Technology (SOEST), Univ. of Hawai'i, 2525 Correa Road, Honolulu, HI 96822, USA (URL: http://modis.higp.hawaii.edu/); MIROVA - Middle InfraRed Observation of Volcanic Activity, A near real time volcanic hot-spot detection system based on the analysis of MODIS ( Moderate Resolution Imaging Spectroradiometer) data, a collaborative project between the Universities of Turin and Florence (Italy) (URL: http://www.mirovaweb.it/); Tom Pfeiffer, Volcano Discovery (URL: https://www.volcanodiscovery.com/nyiragongo/news); NASA Earth Observatory, EOS Project Science Office, NASA Goddard Space Flight Center, Goddard, Maryland, USA (URL: http://earthobservatory.nasa.gov/); Radio Kivu, Goma, North Kivu, DR Congo (URL: http://www.radiokivu1.org/page/article.php?action=articleread&tokena=1432).
Rinjani (Indonesia) — January 2017 Cite this Report
Rinjani
Indonesia
8.42°S, 116.47°E; summit elev. 3726 m
All times are local (unless otherwise noted)
Ash eruptions on 1 August to 10 km altitude; explosions on 27 September 2016
An eruption at Rinjani that lasted two months, between 25 October and 24 December 2015 (BVGN 41:08) included ash plumes rising to 6 km altitude and lava flows from the Barujari cone that reached the Segara Anak lake within the caldera. A new eruption that began on 1 August 2016 generated ash plumes to about 10 km altitude. After another period of quiet, small-scale explosive activity on 27 September stranded a number of trekkers on the slopes and caused the Alert level to be raised to 2. No further activity was reported in 2016.
Based on satellite and pilot observations, the Darwin VAAC reported that an eruption on 1 August 2016 generated an ash plume that rose to an altitude of 9.8 km altitude and drifted S. The ash plumes were first visible in satellite images at 1150, and according to the Pusat Vulkanologi dan Mitigasi Bencana Geologi (PVMBG, also known as the Centre for Volcanology and Geological Hazard Mitigation), passengers aboard a passing aircraft saw ash plumes rising 2 km above the crater (figure 27). The National Agency for Disaster Management (BNPB) noted that the Lombok International Airport closed at 1655 and was scheduled to reopen at 1000 the next day. Later on 1 August ash plumes rose to altitudes of 4.3-6.1 km altitude and drifted S, SW, and W. No plumes were visible at 1730; conditions had returned to normal levels, although BNPB warned that the public should stay at least 1.5 km away from the volcano.
PVMBG reported that at 1445 on 27 September a small explosive eruption at Barujari Crater produced an ash plume rose that rose 2 km above the crater and drifted WSW. The eruption was preceded by an increase in seismicity, but the number and amplitude of the events were insignificant. The Alert Level was raised to 2, and the public was warned not to approach the crater within a 3-km radius.
Based on data from the Mount Rinjani National Park, BNPB reported that as many as 1,023 tourists were on Rinjani when it erupted on 27 September; officially only 464 people were registered to make the 3-day trek to the volcano and back. Officials began the evacuation of tourists that day.
The Jakarta Post reported on 1 October that the West Nusa Tenggara Disaster Mitigation Agency (BPBD NTB) had called on representatives of foreign countries to file a report if they had citizens still missing in the climbing area. The agency made the request following reports that 44 tourists had not yet returned from climbing the mountain. BPBD NTB head Muhammad Rum said it was possible that the climbers had returned, but had not yet been recorded, or had not passed through either of the two official entrances. The Jakarta Post reported on 5 December 2016 that hiking routes were once again open.
Geologic Background. Rinjani volcano on the island of Lombok rises to 3726 m, second in height among Indonesian volcanoes only to Sumatra's Kerinci volcano. Rinjani has a steep-sided conical profile when viewed from the east, but the west side of the compound volcano is truncated by the 6 x 8.5 km, oval-shaped Segara Anak (Samalas) caldera. The caldera formed during one of the largest Holocene eruptions globally in 1257 CE, which truncated Samalas stratovolcano. The western half of the caldera contains a 230-m-deep lake whose crescentic form results from growth of the post-caldera cone Barujari at the east end of the caldera. Historical eruptions dating back to 1847 have been restricted to Barujari cone and consist of moderate explosive activity and occasional lava flows that have entered Segara Anak lake.
Information Contacts: Pusat Vulkanologi dan Mitigasi Bencana Geologi (PVMBG, also known as Indonesian Centre for Volcanology and Geological Hazard Mitigation, CVGHM), Jalan Diponegoro 57, Bandung 40122, Indonesia (URL: http://www.vsi.esdm.go.id/); Darwin Volcanic Ash Advisory Centre (VAAC), Bureau of Meteorology, Northern Territory Regional Office, PO Box 40050, Casuarina, NT 0811, Australia (URL: http://www.bom.gov.au/info/vaac/); Badan Nasional Penanggulangan Bencana (BNPB), National Disaster Management Agency, Graha BNPB - Jl. Scout Kav.38, East Jakarta 13120, Indonesia (URL: http://www.bnpb.go.id/); Jakarta Post (URL: http://www.thejakartapost.com/).
Sheveluch (Russia) — January 2017 Cite this Report
Sheveluch
Russia
56.653°N, 161.36°E; summit elev. 3283 m
All times are local (unless otherwise noted)
Ongoing strong explosions and ash plumes during September 2014-February 2015
An eruption at Sheveluch has been ongoing since 1999, and the activity there was previously described through August 2014 (BGVN 39:08). During 1 September 2014-28 February 2015 the same type of activity prevailed, with periods of strong explosions producing ash plumes as high as 11 km altitude. Most of the following data comes from Kamchatka Volcanic Eruption Response Team (KVERT) reports. Views of the volcano are often obscured by clouds.
KVERT reported that the explosive and effusive eruption continued into September 2014 through at least the end of February 2015. Activity was dominated by lava dome growth on the SE flank (N flank after mid-September), moderate ash explosions, fumarolic activity, and hot avalanches. According to KVERT, satellite data showed a thermal anomaly over the dome most days, when weather permitted observation. However, few MODVOLC alerts about MODIS thermal anomalies were recorded during the reporting period: two in September 2014, one in November, one in December, three in January 2015, and two in February.
Occasional strong explosions were reported by KVERT that produced ash plumes that rose as high as 11.5 km and drifted mostly in a northerly and easterly direction (NW to E). Strong explosions were recorded 2-3 times per month during September-November 2014, and about seven times per month during December 2014-February 2015. The Alert Level remained Orange (second highest) throughout the reporting period, except on 24 September, when it was briefly raised to Red due to strong explosions at 1238 that generated a large ash plume (207 x 250 km) that rose 11-11.5 km (figure 38); the Alert Level was lowered back to Orange that same day as the explosive activity subsided.
In addition to the above activity, KVERT recorded a small pyroclastic flow on 7 January 2015 that descended the SE flank of the dome. Ashfall was reported in Klyuchi Village (50 km SW) on 12 January and in in Ust-Kamchatsk (85 km SE) on 4 March.
According to a news article (CNN), strong explosions on 28 February 2015 blew ash plumes across the Bering Sea into western Alaska and caused Alaska Airlines to cancel several flights. The article also indicated that an airlines spokesman mentioned that a similar cancellation had occurred in January.
Geologic Background. The high, isolated massif of Sheveluch volcano (also spelled Shiveluch) rises above the lowlands NNE of the Kliuchevskaya volcano group. The 1,300 km3 andesitic volcano is one of Kamchatka's largest and most active volcanic structures, with at least 60 large eruptions during the Holocene. The summit of roughly 65,000-year-old Stary Shiveluch is truncated by a broad 9-km-wide late-Pleistocene caldera breached to the south. Many lava domes occur on its outer flanks. The Molodoy Shiveluch lava dome complex was constructed during the Holocene within the large open caldera; Holocene lava dome extrusion also took place on the flanks of Stary Shiveluch. Widespread tephra layers from these eruptions have provided valuable time markers for dating volcanic events in Kamchatka. Frequent collapses of dome complexes, most recently in 1964, have produced debris avalanches whose deposits cover much of the floor of the breached caldera.
Information Contacts: Kamchatka Volcanic Eruptions Response Team (KVERT), Far East Division, Russian Academy of Sciences, 9 Piip Blvd., Petropavlovsk-Kamchatsky, 683006, Russia (URL: http://www.kscnet.ru/ivs/kvert/); Institute of Volcanology and Seismology, Far Eastern Branch, Russian Academy of Sciences, (IVS FEB RAS), 9 Piip Blvd., Petropavlovsk-Kamchatsky 683006, Russia (URL: http://www.kscnet.ru/ivs/eng/); Hawai'i Institute of Geophysics and Planetology (HIGP), MODVOLC Thermal Alerts System, School of Ocean and Earth Science and Technology (SOEST), Univ. of Hawai'i, 2525 Correa Road, Honolulu, HI 96822, USA (URL: http://modis.higp.hawaii.edu/); Cable News Network (CNN), Turner Broadcasting System, Inc. (URL: http://www.cnn.com/).
Stromboli (Italy) — January 2017 Cite this Report
Stromboli
Italy
38.789°N, 15.213°E; summit elev. 924 m
All times are local (unless otherwise noted)
Ongoing explosive activity during 2014, followed by large lava flows into the sea in August
Italy's Stromboli volcano, best known for lava fountain eruptions, has been essentially continuously active for at least the last 400 years. Confirmed historical observations of its eruptions go back 2,000 years. Frequent, mild explosive activity in 2013 was accompanied by lava flows and ash plumes (BGVN 40:11). Activity increased significantly during 2014 as reported by the Instituto Nazionale de Geofisica e Vulcanologia (INGV), Sezione de Catania, who monitors the gas geochemistry, deformation, and seismology, as well as the surficial activity. The Toulouse Volcanic Ash Advisory Center (VAAC) reports on ash plumes potentially affecting air travel. The activity at the summit consistently occurs from vents within two well defined north and south crater areas (figure 88) at the head of the Sciara del Fuoco, a large scarp that runs from the summit down the NW side of the island (see BGVN 36:09 for geologic map).
A gradual increase of Strombolian activity from January through May 2014 was followed by small lava flows in June onto the Sciara del Fuoco. Several more lava flows in early July contributed to landslides that sent debris down the scarp into the ocean. In mid-July, four additional flows emerged and traveled down the scarp, with the flow on 19 July reaching the coastline. A strong surge in explosion frequency and intensity in early August caused 300-m-high fountains, followed by lava flows into the ocean for several days between 6 and 13 August. Minor ash emissions in early October sent plumes as high as 3 km altitude. Lava flows continued intermittently into October, but they no longer made it to the coast. Activity diminished significantly at the end of October 2014.
Activity during January-March 2014. After an explosive sequence on 25 December 2013 sent lapilli, bombs, and an ash plume above the summit craters, activity was quieter for several months. INGV reported that a medium-intensity explosive sequence of four events occurred from the S crater area on 4 January 2014. Lava fountaining with lapilli and bombs landing on the S part of the crater terrace and the S and E edges of the Sciara del Fuoco were reported, along with a minor landslide along the scarp. For the remainder of January, fountain explosion heights ranged from low (less than 80 m) to medium (less than 120 m) from the North (N) Area vents. Explosions of lapilli and bombs mixed with ash averaged 2-3 per hour. The South (S) Area vents sometimes exhibited medium-high-intensity (over 150 m) activity with discontinuous spattering, averaging 3-7 explosions per hour.
Only vent N1 in the North Area was active in February 2014. It was characterized by low- to medium-intensity explosive activity, emitting lapilli and bombs mixed with ash at a rate of 2-3 explosions per hour. In the South Area, vents S1, S3, and S4 were active at weak levels with emissions of fine ash mixed with some coarse material, at a rate averaging less than 6 explosions per hour.
Typical Strombolian activity during March included low- to medium-intensity explosive activity from both vent areas. A sequence of three explosions on 7 March from the South Vents led to the fallout of bombs on the upper side of the Sciara del Fuoco. At vent S1 vigorous activity on 14 March produced the rapid accumulation of lava fragments around the vent that flowed downward inside the terrace crater before subsiding. On 17 March small explosions at vent S3 briefly formed a new nearby vent with a persistent thermal anomaly. An increase in SO2 flux was observed in mid-March by INGV. The average frequency of explosions increased in the last week of March to 10-13 per hour, and the seismic amplitudes were also slightly higher in the second half of the month.
Activity during April-June 2014. Lapilli and bombs mixed with fine ash were typical from all vents during April 2014. The South Area had greater activity, with 3 or 4 vents active during the month, although the activity level was generally low- to medium-intensity in both areas. Frequency of events was generally average, ranging from 9 to 15 per hour. Activity in May 2014 was much the same as April in the N Area until the very end of the month when vent N2 began low-intensity explosive activity. All four vents in the S Area were active throughout May. Two intervals of high intensity spattering were reported on 13 and 19 May from the S Area vents. Explosion rates increased slightly during the month to averages of 11 to 18 per hour.
Activity continued to increase in both vent areas during June 2014. Explosions increased to a rate of more than 20 per hour several times during the month, accompanied by longer periods of spattering. Seismic tremor amplitudes also increased beginning at the end of May. Two periods of vigorous spattering led to lava flows. On 17 June, 70 minutes of vigorous spattering from vent S1 fed a lava overflow within the crater that flowed NE for a few tens of meters before cooling. On the morning of 22 June, vent N2 showed a marked increase in both frequency and intensity of activity. It was characterized by vigorous spattering and discrete bursts of high-intensity (over 200 m high) lava jets. The lava flowed from a crack at the edge of the vent and spread to the upper part of the Sciara del Fuoco. It flowed down the scarp for a few hundred meters before stopping early on 23 June. The South Area vents also had explosions over 200 m high beginning on 23 June. A lava flow emerged from vent S1 on 27 June; on 29 June, vent N2 produced two lava flows, the first remained within the crater, and the second, starting in the afternoon, continued flowing into 30 June, reaching the upper Sciara del Fuoco before stopping.
The first anomalies from the MODVOLC thermal alert system using MODIS satellite thermal data in 2014 appeared in early June and increased during the lava flow emissions that occurred at the end of the month.
Activity during July-October 2014. Three lava flows emerged from Vent N2 on 1, 4, and 7 July 2014. The first flowed E for two hours over the 29 June flow within the crater, and was followed later in the day by a second flow that moved towards the Sciara del Fuoco as did the flows on 4 and 7 July. Modest slumping of material around the western portion of the small pyroclastic cone that formed around Vent N2 led to a collapse and landslide that spread rapidly down the Sciara del Fuoco on 7 July. This led to a lava overflow on the upper part of the scarp for several hours during 7 July. Additional lava flows from Vent N2 occurred on 9 and 10 July as large blocks rolling down the scarp coalesced into a lava flow that continued until the evening of 10 July. Small landslides were triggered on the steep flanks of the scarp, and fine debris was carried downslope, almost to the coastline (figure 89).
Four lava flows emerged from vent N2 on 15, 16, 17, and 19 July, while activity at vent N1 continued as low- to high-intensity (up to 200 m high) explosions with lapilli and bomb ejections. The new flows were emplaced just north of the earlier flows. The flow on 19 July made it to the shoreline. Meanwhile, constant spattering and low-intensity explosions continued in the South area at all four vents. The locus of activity shifted during 21 and 22 July from the North Area to the South Area.
During 3 and 4 August, there was a strong surge in explosion frequency to averages of over 30 per hour with peaks of around 100 per hour. This resulted in high-intensity explosions (to over 300 m in height above the vents) from both the North and South Areas. A new lava overflow from the crater terrace began in the early afternoon of 6 August, following the same path down the center of the Sciara del Fuoco as other recent flows. Landslides of hot material quickly reached the coastline, raising large plumes of steam. Pulsating flows of lava later reached the coast and continued flowing into the early hours of 7 August. A new lava overflow from the N Area vents in the early morning of 7 August quickly formed a broad lava field at 600 m elevation and flowed onto the Sciara del Fuoco. Several arms of the lava flowed toward the coast and entered the sea (figure 90).
Lava emissions continued from the N Area vents, reaching the coastline intermittently for several days, fanning out and covering large areas of the scarp, and generating steam jets and explosions with blocks of lava sent tens of meters high as the lava entered the ocean (figure 91). During this time, explosive activity decreased noticeably at the vents, while strong degassing continued. The lava continued to flow along the eastern edge of the Sciara del Fuoco with new flows covering earlier cooling flows as they traveled down the scarp to the coastline until 13 August. Lava effusion continued until mid-October but flows gradually retreated up the scarp, no longer reaching the sea.
Sporadic ash emissions in early October 2014 led to several reports from the Toulouse VAAC. Ash was reported in the vicinity of Stromboli at a low levels on 30 September, but it was not identifiable on satellite data. It was reported below 1.8 km altitude on 8 October, below 2.4 km on 9 October and below 3 km on 11 October.
A few intermittent MODVOLC thermal anomalies were recorded in July and then substantial anomalies appeared in August, with multiple-per-day continuously during 7-29 August. Almost daily multi-pixel anomalies continued in September and October, but ended abruptly on 28 October. Only one more anomaly was recorded on 8 November 2014. No additional reports on Stromboli were issued by INGV after the 16 October 2014 update.
Geologic Background. Spectacular incandescent nighttime explosions at Stromboli have long attracted visitors to the "Lighthouse of the Mediterranean" in the NE Aeolian Islands. This volcano has lent its name to the frequent mild explosive activity that has characterized its eruptions throughout much of historical time. The small island is the emergent summit of a volcano that grew in two main eruptive cycles, the last of which formed the western portion of the island. The Neostromboli eruptive period took place between about 13,000 and 5,000 years ago. The active summit vents are located at the head of the Sciara del Fuoco, a prominent scarp that formed about 5,000 years ago due to a series of slope failures which extends to below sea level. The modern volcano has been constructed within this scarp, which funnels pyroclastic ejecta and lava flows to the NW. Essentially continuous mild Strombolian explosions, sometimes accompanied by lava flows, have been recorded for more than a millennium.
Information Contacts: Istituto Nazionale di Geofisica e Vulcanologia (INGV), Sezione di Catania, Piazza Roma 2, 95123 Catania, Italy (URL: http://www.ct.ingv.it/en/); Toulouse Volcanic Ash Advisory Center (VAAC), Météo-France, 42 Avenue Gaspard Coriolis, F-31057 Toulouse cedex, France (URL: http://www.meteo.fr/vaac/); Hawai'i Institute of Geophysics and Planetology (HIGP), MODVOLC Thermal Alerts System, School of Ocean and Earth Science and Technology (SOEST), Univ. of Hawai'i, 2525 Correa Road, Honolulu, HI 96822, USA (URL: http://modis.higp.hawaii.edu/).
Suwanosejima (Japan) — January 2017 Cite this Report
Suwanosejima
Japan
29.638°N, 129.714°E; summit elev. 796 m
All times are local (unless otherwise noted)
Occasional ash plumes during January-September 2015
Continuous tremor, intervals with several explosions per day, and plumes rising to 5.5 km altitude were observed at Suwanosejima between 1 April 2013 and 14 December 2014 (BGVN 39:11). The data for this report, covering 5 January-11 September 2015, was gathered primarily from two key sources: the Tokyo Volcanic Ash Advisory Center (VAAC) and the Japan Meteorological Agency (JMA). Throughout the entire reporting period, no MODVOLC thermal anomalies were recorded, although the hazard status remained at Alert Level 2 (Do not approach the crater), on an increasing scale of 1-5. The Otake (also O-take) crater (figure 1) was the site of much of the activity during 2015.
In its Monthly Volcanic Activity Report for January 2015, JMA noted four explosive eruptions at the Otake crater, in addition to other occasional non-explosive eruptions. Grayish plumes accompanying the eruption rose as high as 1 km above the crater rim. On 25 January a field survey revealed a pit in the southeastern portion of the Otake crater which had formed since the previous survey on 8 November 2012.
Plumes in 2015 were reported by the VAAC in the months of January, February, April, July, August, and September. JMA served as the primary source for all of these VAAC notices; any additional sources are noted. The Tokyo VAAC reported that on 5 January ash plumes rose to altitudes of 1.5-1.8 km and drifted NE and SE, and were also observed by pilots. The VAAC also reported an explosion on 25 January, the same day as the field survey.
The Tokyo VAAC reported that during 11-12 and 14-15 February ash plumes rose to altitudes of 1.8-2.1 km and drifted E. JMA's monthly report for February 2015 indicated that twelve explosions occurred at Otake crater, in addition to occasional, non-explosive events. Grayish plumes accompanying the explosions rose as high as 1,500 m above the crater rim. According to the Suwanosejima branch of the Toshima Village administration, ash fall was observed at Kiriishi port (located ~3.5 km S. of Otake) on 26 February.
A very small eruption at the Otake crater on 5 March 2015 was noted by JMA. An event on 13 April reported by the Tokyo VAAC generated a plume that rose to an altitude of 2.1 km and drifted N. Explosions during 24-25 April generated plumes that rose to altitudes of 1.8-2.1 km and drifted N and SE.
JMA reported a continued high activity level at the Otake crater with very small eruptions recorded on 5 and 17 May 2015. No explosions were observed at the Otake crater in June. The Tokyo VAAC reported that ash plumes from small eruptions at Otake on 30-31 July rose to altitudes of 2.1-3 km and drifted E, SW, and W, as reported by pilots and seen in satellite data. Grayish plumes accompanying the eruption rose as high as 1,300 m above the crater rim. According to the Suwanosejima branch of the Toshima Village administration, ashfall was observed in a village ~4 km SSW of Otake on 31 July.
JMA's August 2015 report described small, occasional, non-explosive events at the Otake crater, with accompanying grayish plumes rising as high as 1.2 km above the crater rim. Volcanic "glow" was observed at the Otake crater occasionally at night with a high-sensitivity camera. According to the Toshima Village administration, ashfall 4 km SSW of Otake was again present on 1, 2, and 9 August. The Tokyo VAAC reported that ash plumes identified in satellite images rose to an altitude of 4 km on 2 August, and to 1.8 km on 21 August that drifted SE.
In the September 2015 report, JMA noted that volcanic activity had remained at high levels, with 89 explosions recorded at the Otake crater; 69 of those were on 24 September, the first time more than 50 explosions a day had been observed since 30 December 2013. Plumes accompanying the events rose as high as 1,500 m above the crater rim. Crater incandescence was observed at night with a thermal camera. According to the Toshima Village administration, ashfall was once again observed in a village 4 km SSW on 7 September. The Tokyo VAAC reported that on 13 September ash plumes rose to an altitude of 1.8 km and drifted SE. JMA noted that parts of local structures shook in association with explosions that occurred on 24 September. Explosions and rumbling were heard on the island.
Geologic Background. The 8-km-long island of Suwanosejima in the northern Ryukyu Islands consists of an andesitic stratovolcano with two active summit craters. The summit is truncated by a large breached crater extending to the sea on the E flank that was formed by edifice collapse. One of Japan's most frequently active volcanoes, it was in a state of intermittent Strombolian activity from Otake, the NE summit crater, between 1949 and 1996, after which periods of inactivity lengthened. The largest recorded eruption took place in 1813-14, when thick scoria deposits covered residential areas, and the SW crater produced two lava flows that reached the western coast. At the end of the eruption the summit of Otake collapsed, forming a large debris avalanche and creating an open collapse scarp extending to the eastern coast. The island remained uninhabited for about 70 years after the 1813-1814 eruption. Lava flows reached the eastern coast of the island in 1884. Only about 50 people live on the island.
Information Contacts: Japan Meteorological Agency (JMA), Otemachi, 1-3-4, Chiyoda-ku Tokyo 100-8122, Japan (URL: http://www.jma.go.jp/); Tokyo Volcanic Ash Advisory Center (VAAC), Tokyo, Japan (URL: http://ds.data.jma.go.jp/svd/vaac/data/).
Telica (Nicaragua) — January 2017 Cite this Report
Telica
Nicaragua
12.606°N, 86.84°W; summit elev. 1036 m
All times are local (unless otherwise noted)
Multiple explosive ash-and-gas episodes; May 2015, and September 2015 through May 2016
Small explosions have been recorded at Nicaragua's Telica volcano regularly since early in the 20th century. The last major eruptive episode began with a series of small explosions in March 2011 and culminated in greatly increased seismicity and several larger explosions during May that deposited ashfall in communities within 8 km of the volcano, and caused a small number of evacuations. Ash-bearing explosive activity died down by mid-June 2011, although steady degassing with gas-and-steam plumes continued. A small ash-and-gas explosion was reported on 25 September 2013.
On 7 May 2015 a new series of larger ash-and-gas explosions began. Nicaragua's Instituto Nicaragüense de Estudios Territoriales (INETER) provides monthly reports on seismic activity and monitoring of thermal and geochemical data as well as daily informational bulletins of volcanic activity; aviation advisories are also provided by the Washington Volcanic Ash Advisory Center (VAAC). Activity from June 2014 through August of 2016 is covered in this report.
A decrease in seismicity and increase in temperature within the summit crater at Telica in April 2015 preceded an ash-and-gas explosion on 7 May 2015 after several years of relative quiet. This was followed by a series of over 100 ash-bearing explosions in the following three weeks, the last on 28 May. Degassing from fumaroles continued without ash during June and the crater had cooled significantly by August. A new series of ash-and-gas explosion between 23 and 26 September 2015 sent ashfall to nearby communities and a few large volcanic bombs several hundred meters from the crater. The next series of explosions between 22 and 29 November sent ashfall to over 70 communities within 20 km of Telica. Incandescence was observed in a crack in the floor of the summit crater in December, but lava wasn't observed in the vent until 25 February 2016 after a sequence of gas explosions that lasted until 1 March. The lava and incandescence were observed until early May when explosions on 7-8 May 2016 were observed from a new vent in the N part of the crater. No further ash emissions were observed, and seismicity dropped significantly and remained quiet through August 2016.
Activity between June 2014 and May 2015. Remote temperature measurements of the summit crater floor at Telica showed a steady decline between May and July 2014 from an average of 417°C to 350°C, continuing a decline from values measured in 2013 that had been as much as 100°C hotter. During this time, few noises were heard and little incandescence from the crater was observed. There were no further reports until February 2015 when fresh landslides along the SE inner wall were observed blocking the vent; on a 25 February summit crater visit there was no noise, and few emissions from fumaroles were observed. Temperatures at the fumaroles on the SE, S and SW walls of the crater were around 150°C, and the floor of the crater was measured at 123°C with the Testo IR 820 thermometer. Gas emissions were more variable in March 2015, but again there was no noise or incandescence observed. The numbers of daily seismic events in March 2015, 3982, were generally within normal levels, ranging from a few to a few hundred per day, depending on type of seismicity.
The temperature at the floor of the crater in April 2015 had risen significantly to 412°C. The seismicity was also changed, with fewer total events (1,973). There was a noticeable drop in the number of events in the second half of April. As reported by INETER seismologist Virginia Tenorio, this decrease in number of events, accompanied by a narrowing of the frequency range to between 3 and 11 Hz, from a normally larger range of 3 to 30 Hz, also occurred prior to the last significant eruption in 2011.
Activity during May-August 2015. On 7 May 2015 at 1609 and 1615, INETER reported that Telica broke its "relative calm" since 26 September 2013 with two gas and ash explosions which rose about 200 m above the rim of the crater. This was the beginning of an eruptive period that included 902 seismically-detected explosions between 7 and 28 May, of which 104 were accompanied by volcanic ash (figure 35). Some also involved ejection of large incandescent lava blocks. Towns within 40 km in a generally W direction were affected by ashfall from these explosions.
An explosion on 12 May ejected rocks 400 m high to the W. Minor ashfall was reported during May in El Realejo (35 km WSW), Corinto (40 km WSW), Posoltega (16 km SW), Guanacastal (20 km WSW), Quezalguaque (12 km SW), Chinandega (30 km W), El Viejo (35 km WNW), and Chichigalpa (20 km WSW). On 20 and 21 May, a series of explosions ejected one-m-diameter blocks up to 500 m from the crater. Many ash plumes were photographed by the INETER web camera located at the TELN seismic station on the E flank; others by INETER scientists at the volcano (figures 36-40).
On only two dates during May did these explosions initiate reports from the Washington VAAC; they reported ash emissions on 11 May rising to 1.8 km and drifting W, and twice on 26 May. The first plume on 26 May extended 75 km W below 3 km altitude, and a second drifted 117 km WNW of the summit at 4.3 km before dissipating.
Visits to the crater on 8 and 14 May revealed a new vent at the base of the S wall of the crater that formed during the 7 May explosion (figure 41). There was a substantial increase in temperature inside the crater from 150°C to 377°C between these dates. The first explosion with incandescent material was observed on 10 May. SO2 measurements of 1,000-1,500 tons per day (t/d) were taken during an explosion on 26 May (figure 42), and values were significantly higher than previous levels of around 300 t/d.
Seismicity in May was high, with 18,858 recorded events. The high number of volcano-tectonic events (VT) during the month (605) was associated with the ruptures that triggered explosions; they have a characteristic frequency of 4.5 to 10.0 Hz. Most of the VT events were located between 6 and 10 km below the surface. The majority of the total seismic events in May were related to degassing and gas explosions (18,087). Screw-type "tornillo" earthquakes are usually rare at Telica, but about 46 of them were observed in May.
The volcano remained relatively calm during June, with the number of daily seismic events typically at 10 or lower, far fewer than May. Even fewer seismic events (71) were recorded in July along with gas emissions that were variable but generally light. The most degassing came from fumaroles located on the inner walls of the crater where the temperature was measured at 298°C. On a 25 August visit to the crater, INETER technicians noted that the points where incandescence had been observed prior to May had disappeared, and temperatures at the fumaroles on the SW and NE walls ranged from 50°C to 160°C.
Activity during September 2015-August 2016. A new gas-and-ash explosion at 0800 on 23 September 2015 sent ash to the NW, W, and SW. The plume rose to 400 m above the crater. Other smaller explosions with small quantities of ash continued that day and the next. Ashfall was reported in the community of Guanacastal (20 km WSW). Additional medium-intensity explosions on 26 September ejected gas, ash, and rock fragments up to 500 m from the crater. Ash plumes reached 1,000 m above the crater and drifted W and NW. The Washington VAAC reported these emissions at 4.3 km altitude, drifting N and W about 45 km (figure 43). This second series of explosions opened a new vent on the N side of the crater floor, and gas emissions continued from both vents. Seismic events in September numbered 775.
During October, no ash explosions were recorded, although 2,921 total seismic events were reported. On 22 November 2015 a new series of explosions began, lasting for eight days. That day, the Washington VAAC reported an ash plume to 2.4 km that drifted about 185 km W. According to a news article published by el19, two explosions, at 0847 and 0848, generated ash plumes that rose 2 km and ejected tephra at least 900 m away (figure 44). Residents in Agua Fría (900 m away) noted it was the first time lapilli and blocks had reached their community. La Prensa reported that ash fell in at least 70 communities in the municipalities of Quezalguaque (13 km SW), Posoltega (16 km WSW), Chichigalpa (20 km WSW), and Chinandega (30 km W).
INETER reported that during 25-27 November numerous small explosions were recorded, most of which generated volcanic ash, with the highest plume reaching 800 m above the crater. Satellite imagery reported from the Washington VAAC showed a faint plume extending about 16 km WSW at 1.2 km altitude on 26 November. Occasional emissions continued until 29 November with several VAAC reports indicating plumes at 1.5 km altitude visible in satellite imagery drifting up to 45 km W and SW.
While no explosions were reported during December 2015, the INETER volcano observer (René Dávila) noted that incandescence was observed in a N-S trending fracture on the crater floor during a visit to the summit. Seismicity was low in December, with a total of 1,342 events recorded, although there was an increase in micro-seismicity during the second half of the month. Even fewer seismic events were reported in January 2016 (171 events), along with few gas emissions that seldom rose above the crater rim.
On 13 February 2016 emissions were observed in visible satellite imagery by the Washington VAAC moving WSW from the summit that likely contained ash. This was preceded by a burst of seismic activity reported by INETER. They noted intermittent high micro-seismicity between 16 February and 1 March. Incandescence from the vent on the crater floor increased during February; lava on the crater floor was first observed by INETER on 25 February. Small gas explosions were observed inside the crater during 24- 26 February followed by five gas-and-ash explosions recorded during 29 February-1 March which generated plumes that rose 300 m above the crater and drifted W and SW. Gas-and-ash emissions lasted for 14 minutes during the strongest of these events.
A visit to the crater on 15 March 2016 by INETER scientists provided additional evidence of incandescence within the crater and a temperature reading of 485° C (figure 45).
From late March through early May, INETER reported incandescence and lava inside a vent on the crater floor, and micro-seismicity remained high even though gas emissions and RSAM values were low. The last report of incandescence from the vent on the crater floor was during the second week of May. RSAM values had dropped to 80 units by 14 May.
Based on information from INETER, SINAPRED reported that 30 explosions occurred during 7-8 May 2016, producing gas-and-ash plumes that rose 600 m and drifted S and SW. The explosions originated from a new vent in the N part of the crater. Seismic RSAM amplitudes spiked to several hundred units between 8 and 12 June, but there were no reports of ash emissions after 8 May from either the Washington VAAC or INETER.
In late July 2016 scientists visited the Las Quemadas, Aguas Frías, (Hot Spring) located 1.7 km north-east of Telica to study temperature and chemistry of the geothermal waters. Seismicity and RSAM values remained low through August 2016 with no further reports of ash emissions or lava in the crater.
Geologic Background. Telica, one of Nicaragua's most active volcanoes, has erupted frequently since the beginning of the Spanish era. This volcano group consists of several interlocking cones and vents with a general NW alignment. Sixteenth-century eruptions were reported at symmetrical Santa Clara volcano at the SW end of the group. However, its eroded and breached crater has been covered by forests throughout historical time, and these eruptions may have originated from Telica, whose upper slopes in contrast are unvegetated. The steep-sided cone of Telica is truncated by a 700-m-wide double crater; the southern crater, the source of recent eruptions, is 120 m deep. El Liston, immediately E, has several nested craters. The fumaroles and boiling mudpots of Hervideros de San Jacinto, SE of Telica, form a prominent geothermal area frequented by tourists, and geothermal exploration has occurred nearby.
Information Contacts: Instituto Nicaragüense de Estudios Territoriales (INETER), Apartado Postal 2110, Managua, Nicaragua (URL: http://webserver2.ineter.gob.ni/vol/dep-vol.html); Washington Volcanic Ash Advisory Center (VAAC), Satellite Analysis Branch (SAB), NOAA/NESDIS OSPO, NOAA Science Center Room 401, 5200 Auth Rd, Camp Springs, MD 20746, USA (URL: http://www.ospo.noaa.gov/Products/atmosphere/vaac/ , archive at: http://www.ssd.noaa.gov/VAAC/archive.html); Sistema Nacional para la Prevencion, Mitigacion y Atencion de Desastres, (SINAPRED), Edificio SINAPRED, Rotonda Comandante Hugo Chávez 50 metros al Norte, frente a la Avenida Bolívar, Managua, Nicaragua (URL: http://www.sinapred.gob.ni/); El19digital, https://www.el19digital.com/articulos/ver/titulo:35988-volcan-telica-registra-fuerte-explosion; La Prensa, http://www.laprensa.com.ni/2015/11/22/departamentales/1940877-volcan-telica-lanza-piedras-cenizas-dos-mil-metros-altura .