Recently Published Bulletin Reports
Ambrym (Vanuatu) New effusive eruption during January 2024
Popocatepetl (Mexico) Daily gas-and-ash emissions, ashfall, and occasional explosions during August-November 2023
Reventador (Ecuador) Daily explosions, gas-and-ash emissions, and incandescent avalanches during August-November 2023
Erta Ale (Ethiopia) Strong lava lake activity and lava overflows during June-November 2023
Ubinas (Peru) New eruption with explosions and ash plumes during June-December 2023
Kanaga (United States) Small explosion on 18 December 2023
Klyuchevskoy (Russia) New eruption consisting of Strombolian activity, lava flows and fountains, and ash plumes during June-December 2023
Agung (Indonesia) Three eruptive events reported in April, May, and December 2022
Saunders (United Kingdom) Persistent thermal anomalies from the summit crater lava lake during February 2023-January 2024
Tengger Caldera (Indonesia) Minor ash emission in December 2023; persistent weak thermal anomaly in the Bromo crater
Shishaldin (United States) New eruption with significant Strombolian explosions, ash plumes, and ashfall
Ioto (Japan) New eruption with discolored water, ejecta, and floating pumice during October-December 2023
Ambrym (Vanuatu) — February 2024  Cite this Report
Ambrym
Vanuatu
16.25°S, 168.12°E; summit elev. 1334 m
All times are local (unless otherwise noted)
New effusive eruption during January 2024
Ambrym contains a 12-km-wide caldera and is part of the New Hebrides Arc, located in the Vanuatu archipelago. The two currently active craters within the caldera are Benbow and Marum, both of which have produced lava lakes, explosions, lava flows, and gas-and-ash emissions. The previous eruption occurred during late January 2022 and was characterized by ash plumes, sulfur dioxide plumes, and crater incandescence (BGVN 47:05). This report covers a new, short eruption during January 2024, which consisted of a lava effusion and an explosion. Information comes from the Vanuatu Meteorology and Geohazards Department (VMGD) and satellite data.
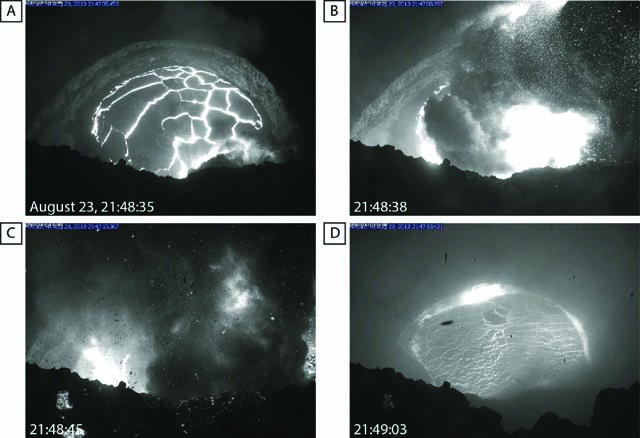
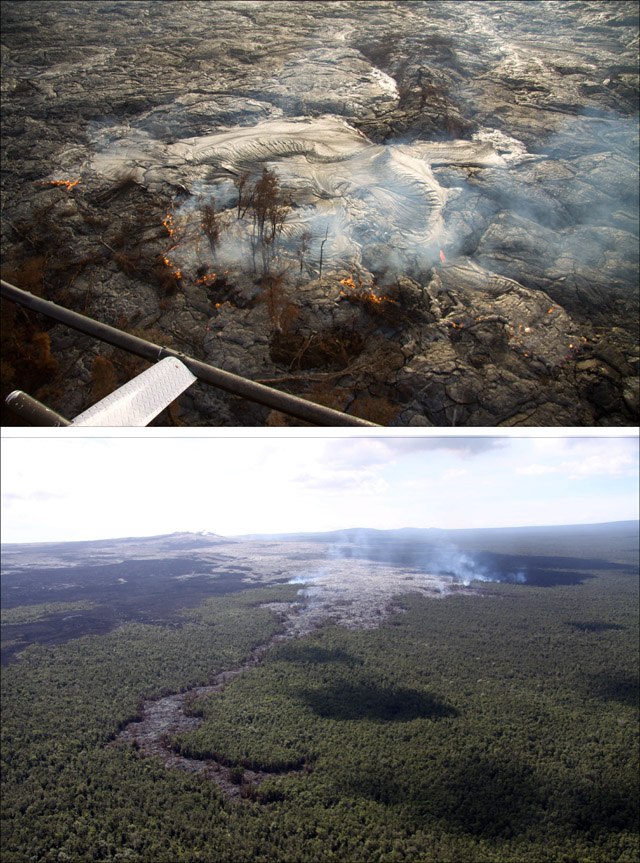
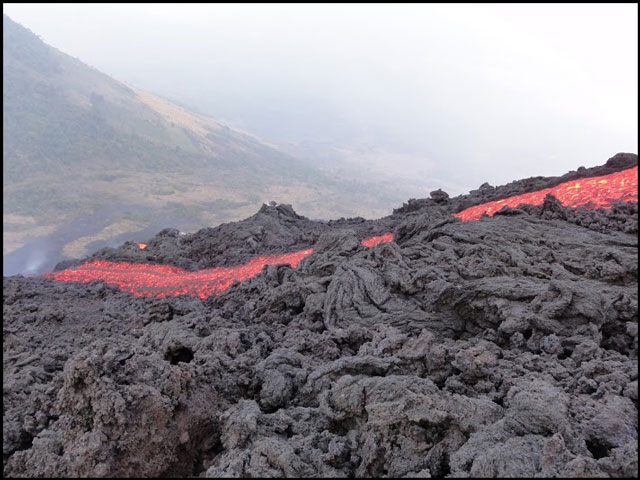
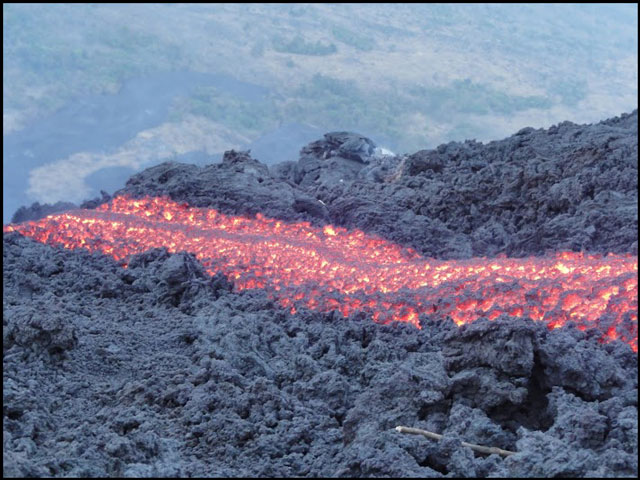
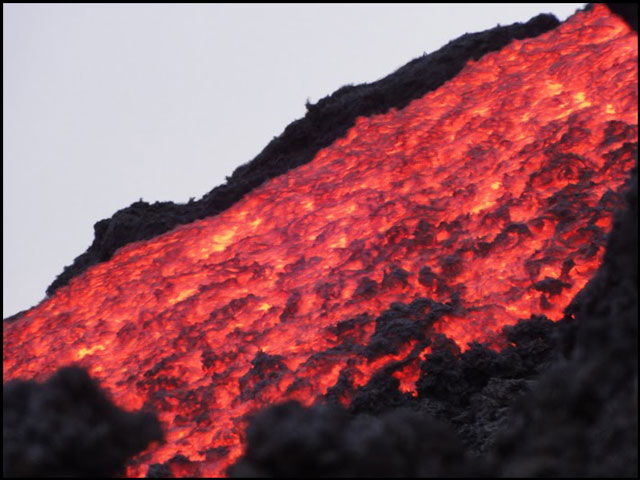
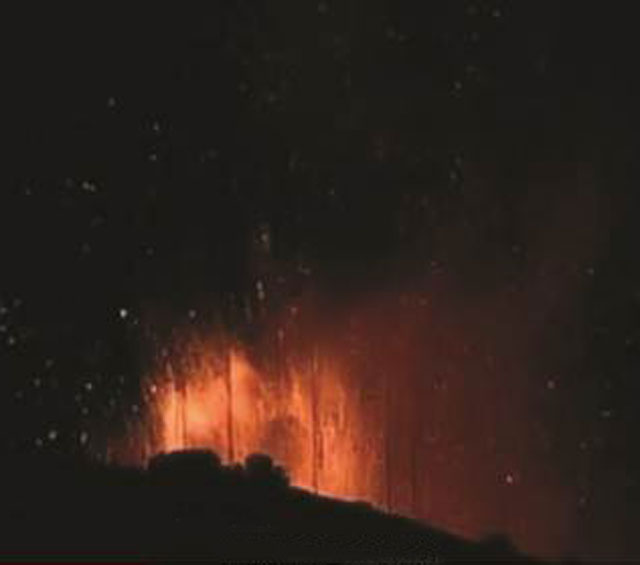
VMGD reported that at 2217 on 13 January an eruption began at Benbow Crater, based on webcam and seismic data. The eruption was characterized by a loud explosion, intense crater incandescence (figure 55), and gas-and-steam emissions. As a result, the Volcano Alert Level (VAL) was raised from 1 to 3 (on a scale of 0-5). A lava flow was reported in Benbow Crater, which lasted for four days. Satellite data showed that 1,116 tons of sulfur dioxide per day (t/d) were emitted on 14 January (figure 56). During the morning of 15 January, ground reports noted loud explosions and minor earthquakes. The sulfur dioxide flux on 15 January was 764 t/d. During 15-17 January activity decreased according to webcam images, seismic data, and field observations. No sulfur dioxide emissions were reported after 15 January. Gas-and-ash emissions also decreased, although they continued to be observed through 31 January, and crater incandescence was less intense (figure 57). The VAL was lowered to 2 on 17 January.
Geologic Background. Ambrym is a large basaltic volcano with a 12-km-wide caldera formed during a major Plinian eruption with dacitic pyroclastic flows about 1,900 years ago. A thick, almost exclusively pyroclastic sequence, initially dacitic then basaltic, overlies lava flows of a pre-caldera shield volcano. Post-caldera eruptions, primarily from Marum and Benbow cones, have partially filled the caldera floor and produced lava flows that ponded on the floor or overflowed through gaps in the caldera rim. Post-caldera eruptions have also formed a series of scoria cones and maars along a fissure system oriented ENE-WSW. Eruptions have been frequently reported since 1774, though mostly limited to extra-caldera eruptions that would have affected local populations. Since 1950 observations of eruptive activity from cones within the caldera or from flank vents have occurred almost yearly.
Information Contacts: Geo-Hazards Division, Vanuatu Meteorology and Geo-Hazards Department (VMGD), Ministry of Climate Change Adaptation, Meteorology, Geo-Hazards, Energy, Environment and Disaster Management, Private Mail Bag 9054, Lini Highway, Port Vila, Vanuatu (URL: http://www.vmgd.gov.vu/, https://www.facebook.com/VanuatuGeohazardsObservatory/); Copernicus Browser, Copernicus Data Space Ecosystem, European Space Agency (URL: https://dataspace.copernicus.eu/browser/).
Popocatepetl (Mexico) — January 2024 Cite this Report
Popocatepetl
Mexico
19.023°N, 98.622°W; summit elev. 5393 m
All times are local (unless otherwise noted)
Daily gas-and-ash emissions, ashfall, and occasional explosions during August-November 2023
Popocatépetl, located 70 km SE of Mexica City, Mexico, contains a 400 x 600 m-wide summit crater. Records of activity date back to the 14th century; three Plinian eruptions, the most recent of which took place about 800 CE, have occurred since the mid-Holocene, accompanied by pyroclastic flows and voluminous lahars that swept basins below the volcano. The current eruption period began in January 2005, characterized by numerous episodes of lava dome growth and destruction within the summit crater. Recent activity has been characterized by daily gas-and-ash emissions, ashfall, and explosions (BGVN 48:09). This report covers similar activity during August through November 2023, according to daily reports from Mexico's Centro Nacional de Prevención de Desastres (CENAPRED) and various satellite data.
Daily gas-and-steam emissions, containing some amount of ash, continued during August through November 2023. CENAPRED reported the number of low-intensity gas-and-ash emissions or “exhalations” and the minutes of tremor, which sometimes included harmonic tremor in their daily reports (figure 220). A total of 21 volcano-tectonic (VT) tremors were detected throughout the reporting period. The average number of exhalations was 117 per day, with a maximum number of 640 on 25 September. Frequent sulfur dioxide plumes that exceeded two Dobson Units (DU) and drifted in multiple directions were visible in satellite data from the TROPOMI instrument on the Sentinel-5P satellite (figure 221).
Activity during August was relatively low and mainly consisted of occasional explosions, ash emissions, and light ashfall. There were 30 explosions (25 minor explosions and four moderate explosions), and nine VT-type events detected. An average number of 60 exhalations occurred each day, which mostly consisted of water vapor, volcanic gases, and a small amount of ash. On 2 August the National Center for Communications and Civil Protection Operations (CENACOM) reported light ashfall in Ocuituco (22 km SW), Yecapixtla (31 km SW), Cuautla (43 km SW), and Villa de Ayala (47 km SW). On 7 August light ashfall was observed in Atlautla (16 km W). A minor explosion at 0305 on 11 August was accompanied by crater incandescence. Explosions at 0618 on 13 August produced a gas-and-ash plume that rose above the summit, and at 0736 another explosion produced a puff of gas-and-ash (figure 222). Two minor explosions were detected at 0223 and 0230 on 16 August that generated eruptive columns with low ash content rising 800 m and 700 m above the crater, respectively. On 24 August an eruptive event lasted 185 minutes and consisted of light ash emissions that did not exceed 300 m above the crater. According to the Washington VAAC, ash plumes identified in daily satellite images rose to 4.6-7.6 km altitude and drifted in multiple directions, the highest of which occurred on 29 August.
There was an average of 156 exhalations each day during September, a monthly total of seven VT-type events, and 29 explosions, 14 of which were minor and nine of which were moderate. A gas-and-ash plume rose to 2 km above the summit and drifted WSW at 1216 on 1 September. CENACOM reported at 1510 observations of ashfall in Ozumba (18 km W), Atlautla, Tepetlixpa (20 km W), and Ecatzingo (15 km SW), as well as in Morelos in Cuernavaca (65 km WSW), Temixco (67 km WSW), Huitzilac (67 km W), Tepoztlán (49 km W), and Jiutepec (59 km SW). The next day, gas-and-ash plumes rose to 2 km above the summit (figure 223). At 1100 ashfall was reported in Amecameca (15 km NW), Ayapango (24 km WNW), Ozumba, Juchitepec, Tenango del Aire (29 km WNW), Atlautla, and Tlalmanalco (27 km NW). A gas-and-ash plume rose to 1 km above the summit and drifted WNW at 1810. During 5-6, 8-9, 12, 14, 19, and 24-25 September ashfall was reported in Amecameca, Atlautla, Ozumba, Tenango del Aire, Tepetlixpa, Juchitepec, Cuernavaca, Ayala, Valle de Chalco (44 km NW), Ixtapaluca (42 km NW), La Paz (50 km NW), Chimalhuacán, Ecatepec, Nezahualcóyotl (60 km NW), Xochimilco (53 km SE), Huayapan, Tetela del Volcano (20 km SW), Yautepec (50 km WSW), Cuautla (43 km SW), Yecapixtla (30 km SW) and possibly Tlaltizapán (65 km SW), Tlaquiltenango, and Tepalcingo. According to the Washington VAAC, ash plumes identified in daily satellite images rose to 5.8-9.1 km altitude and drifted in multiple directions, the highest of which was identified during 1-2 August.
Activity during October and November was relatively low. An average of 179 exhalations consisting of gas-and-steam and ash emissions were reported during October and 73 during November. Only one VT-type event and two explosions were detected during October and four VT-type events and one explosion during November. A satellite image from 0101 on 14 October showed ash fanning out to the NW at 6.7 km altitude and an image from 0717 showed a continuously emitted ash plume drifting WNW and NW at the same altitude. Ash emissions at 1831 on 14 October were ongoing and visible in webcam images slowly drifting W at an altitude of 6.4 km altitude (figure 224). On 24 October a tremor sequence began at 0310 that generated a gas-and-ash plume that rose 800 m above the summit and drifted W. Another tremor sequence occurred during 1305-1900 on 25 October that consisted of continuous ash emissions. Ash plumes identified in daily satellite images rose to 5.5-8.5 km altitude and drifted in different directions during October, according to the Washington VAAC. The highest ash plume was detected on 23 October. During 10-13 November ash plumes rose to 6.7 km altitude and drifted N, NNW, NE, and NW. On 13 November a M 1.5 VT-type event was detected at 0339 and light ashfall was reported in Amecameca, Cocotitlán (34 km NW), and Tenango del Aire, and Ocuituco. On 14 November ash plumes rose to 6 km altitude and drifted N, NE, and SE and light ashfall was reported in Cuernavaca (64 km W). The Washington VAAC reported frequent ash plumes that rose to 5.8-7.9 km altitude and drifted in several directions; the highest ash plume was recorded on 28 November.
Satellite data. MODIS thermal anomaly data provided through MIROVA (Middle InfraRed Observation of Volcanic Activity) showed frequent low-to-moderate thermal anomalies during the reporting period (figure 225). The intensity of the anomalies was lower compared to previous months. According to data from MODVOLC thermal alerts, a total of ten hotspots were detected at the summit crater on 2 August and 2, 4, 9, 19, and 26 September. Thermal activity in the summit crater was visible in infrared satellite data and was sometimes accompanied by ash plumes, as shown on 17 November (figure 226).
Geologic Background. Volcán Popocatépetl, whose name is the Aztec word for smoking mountain, rises 70 km SE of Mexico City to form North America's 2nd-highest volcano. The glacier-clad stratovolcano contains a steep-walled, 400 x 600 m wide crater. The generally symmetrical volcano is modified by the sharp-peaked Ventorrillo on the NW, a remnant of an earlier volcano. At least three previous major cones were destroyed by gravitational failure during the Pleistocene, producing massive debris-avalanche deposits covering broad areas to the south. The modern volcano was constructed south of the late-Pleistocene to Holocene El Fraile cone. Three major Plinian eruptions, the most recent of which took place about 800 CE, have occurred since the mid-Holocene, accompanied by pyroclastic flows and voluminous lahars that swept basins below the volcano. Frequent historical eruptions, first recorded in Aztec codices, have occurred since Pre-Columbian time.
Information Contacts: Centro Nacional de Prevención de Desastres (CENAPRED), Av. Delfín Madrigal No.665. Coyoacan, México D.F. 04360, México (URL: http://www.cenapred.unam.mx/, Daily Report Archive https://www.gob.mx/cenapred/archivo/articulos); Washington Volcanic Ash Advisory Center (VAAC), Satellite Analysis Branch (SAB), NOAA/NESDIS OSPO, NOAA Science Center Room 401, 5200 Auth Rd, Camp Springs, MD 20746, USA (URL: www.ospo.noaa.gov/Products/atmosphere/vaac, archive at: http://www.ssd.noaa.gov/VAAC/archive.html); MIROVA (Middle InfraRed Observation of Volcanic Activity), a collaborative project between the Universities of Turin and Florence (Italy) supported by the Centre for Volcanic Risk of the Italian Civil Protection Department (URL: http://www.mirovaweb.it/); Hawai'i Institute of Geophysics and Planetology (HIGP) - MODVOLC Thermal Alerts System, School of Ocean and Earth Science and Technology (SOEST), Univ. of Hawai'i, 2525 Correa Road, Honolulu, HI 96822, USA (URL: http://modis.higp.hawaii.edu/); NASA Global Sulfur Dioxide Monitoring Page, Atmospheric Chemistry and Dynamics Laboratory, NASA Goddard Space Flight Center (NASA/GSFC), 8800 Greenbelt Road, Goddard, Maryland, USA (URL: https://so2.gsfc.nasa.gov/); Copernicus Browser, Copernicus Data Space Ecosystem, European Space Agency (URL: https://dataspace.copernicus.eu/browser/).
Reventador (Ecuador) — January 2024 Cite this Report
Reventador
Ecuador
0.077°S, 77.656°W; summit elev. 3562 m
All times are local (unless otherwise noted)
Daily explosions, gas-and-ash emissions, and incandescent avalanches during August-November 2023
Volcán El Reventador, located in Ecuador, is a stratovolcano with a 4-km-wide avalanche scarp open to the E that was formed by edifice collapse. The largest recorded eruption took place in 2002 producing a 17-km-high eruption column, pyroclastic flows that traveled as far as 8 km, and lava flows from summit and flank vents. Recorded eruptions date back to the 16th century and have been characterized by explosive events, lava flows, ash plumes, and lahars. Frequent lahars have built deposits on the scarp slope. The current eruption period began in July 2008 and has recently been characterized daily explosions, gas-and-ash emissions, and block avalanches (BGVN 48:08). This report covers similar activity during August through November 2023 using daily reports from Ecuador's Instituto Geofisico (IG-EPN) and satellite data.
During August through November 2023, IG-EPN reported daily explosions, gas-and-ash plumes that rose as high as 1.3 km above the crater, and frequent crater incandescence, often accompanied by incandescent block avalanches that affected one or multiple flanks. More daily explosions were detected during November, with an average total of 46 per day.
Table 19. Monthly summary of explosions and plume heights recorded at Reventador from August through November 2023. Data could not be collected for 29-30 September 2023 and 6-23 October 2023. Data courtesy of IG-EPN (August-November 2023 daily reports).
| Month |
Average number of explosions per day |
Max plume height above the crater rim (km) |
| Aug 2023 |
32 |
1.3 |
| Sep 2023 |
30 |
1 |
| Oct 2023 |
31 |
1.3 |
| Nov 2023 |
46 |
1.2 |
Activity during August consisted of 6-75 daily explosions, nighttime crater incandescence, and incandescent avalanches of material. Frequent seismicity was mainly characterized by long-period (LP) events, harmonic tremor (TRARM), tremor-type (TRE), and volcano tectonic (VT)-type events. Daily gas-and-ash emissions rose 200-1,300 m above the summit and drifted W, SW, NW, NE, N, and E, based on webcam and satellite images. The Washington VAAC also reported occasional ash plumes that rose 400-1,600 m above the crater and drifted NW. Avalanches of incandescent material were reported during 1-2, 6-7, 9-14, 16-17, 18-21, and 26-29 August, which traveled 500-900 m below the crater and affected multiple flanks (figure 180). During 24-25 August incandescent material was ejected 300 m above the crater.
Gas-and-ash emissions and seismicity characterized by LP, VT, TRARM, and TRE-type events continued during September; data were not available for 29-30 September. Daily gas-and-ash emissions rose 200-1,000 m above the crater and generally drifted W, NW, and SW (figure 181). Near-daily explosions ranged from 16-53 per day, often accompanied by incandescent avalanches, which affected one or multiple flanks and traveled 100-800 m below the crater. During 2-3 September incandescent material was ejected 200 m above the crater and was accompanied by blocks rolling down the flanks. During 16-17 September incandescent material was ejected 100-200 m above the crater and avalanches descended 600 m below the crater. During 21-22 and 24-26 September incandescent material was ejected 100-300 m above the crater. According to the Washington VAAC, ash plumes rose 700 m above the crater and drifted SW, W, and NW on 3, 16, and 20 September, respectfully.
During October, daily explosions, gas-and-ash plumes, and crater incandescence continued, with 16-40 explosions recorded each day (figure 182); data was not available for 6-23 October. Seismicity consisted of LP, TRE, and TRARM-type events. Gas-and-ash emissions rose 200-1,000 m above the crater and drifted W, SW, NW, SSW, NNW, and NE. The Washington VAAC reported that ash plumes rose 1-1.3 km above the crater and drifted W, SW, and NW during 1-5 October. During 30 September-1 October incandescent avalanches descended 700 m below the crater. Ejected material rose 200 m above the crater during 2-5 October and was accompanied by avalanches of material that traveled 250-600 m below the crater rim; incandescent avalanches were also reported during 23-29 October.
Daily explosions, LP, TRARM, VT, and TRE-type events, crater incandescence, and avalanches of material continued during November. There were 26-62 daily explosions detected throughout the month. Gas-and-ash emissions rose 300-1,200 m above the crater and drifted in different directions (figure 183). The Washington VAAC reported that ash plumes rose 700-1,620 m above the crater and drifted NW, W, WNW, SW, E, SE, and ESE. Frequent incandescent avalanches descended 500-1,000 m below the crater. Explosions ejected material 100-300 m above the crater during 4-7, 11-12, and 19-23 November.
Satellite data. MIROVA (Middle InfraRed Observation of Volcanic Activity) analysis of MODIS satellite data showed intermittent thermal anomalies of low-to-moderate power (figure 184). Thermal activity mainly consisted of incandescent avalanches descending the flanks due to the frequently detected explosions. The MODVOLC hotspot system identified a total of ten hotspots on 3 August, 7, 18, 12, 22, and 28 September, and 7, 9, and 19 November.
Geologic Background. Volcán El Reventador is the most frequently active of a chain of Ecuadorian volcanoes in the Cordillera Real, well east of the principal volcanic axis. The forested, dominantly andesitic stratovolcano has 4-km-wide avalanche scarp open to the E formed by edifice collapse. A young, unvegetated, cone rises from the amphitheater floor to a height comparable to the rim. It has been the source of numerous lava flows as well as explosive eruptions visible from Quito, about 90 km ESE. Frequent lahars in this region of heavy rainfall have left extensive deposits on the scarp slope. The largest recorded eruption took place in 2002, producing a 17-km-high eruption column, pyroclastic flows that traveled up to 8 km, and lava flows from summit and flank vents.
Information Contacts: Instituto Geofísico, Escuela Politécnica Nacional (IG-EPN), Casilla 17-01-2759, Quito, Ecuador (URL: http://www.igepn.edu.ec/); MIROVA (Middle InfraRed Observation of Volcanic Activity), a collaborative project between the Universities of Turin and Florence (Italy) supported by the Centre for Volcanic Risk of the Italian Civil Protection Department (URL: http://www.mirovaweb.it/); Hawai'i Institute of Geophysics and Planetology (HIGP) - MODVOLC Thermal Alerts System, School of Ocean and Earth Science and Technology (SOEST), Univ. of Hawai'i, 2525 Correa Road, Honolulu, HI 96822, USA (URL: http://modis.higp.hawaii.edu/).
Erta Ale (Ethiopia) — January 2024 Cite this Report
Erta Ale
Ethiopia
13.601°N, 40.666°E; summit elev. 585 m
All times are local (unless otherwise noted)
Strong lava lake activity and lava overflows during June-November 2023
Erta Ale in Ethiopia has a 50-km-wide edifice that rises more than 600 m from below sea level in the Danakil depression. The summit caldera is 0.7 x 1.6 km and contains at least two pit craters (North and South). Another larger 1.8 x 3.1-km-wide depression is located SE of the summit and is bounded by curvilinear fault scarps on the SE side. Lava flows from fissures have traveled into the caldera and locally overflowed the crater rim. The current eruption has been ongoing since 1967, with at least one long-term active lava lake present in the summit caldera. Recent fissure eruptions from 2017 have occurred on the SE flank (BGVN 42:07). Recent activity has been characterized by minor thermal activity at the S crater and an active lava lake at the N crater (BGVN 48:06). This report covers strong lava lake activity primarily at the N pit crater during June through November 2023 using information from satellite infrared data.
Infrared satellite images generally showed an active lava lake as the N pit crater and variable thermal activity at the S pit crater during the reporting period. On 7 June two strong thermal anomalies were detected at the S pit crater and two weaker anomalies were visible at the N pit crater. Those anomalies persisted throughout the month, although the intensity at each declined. On 2 July a possible lava lake was identified at the S pit crater, filling much of the crater. On 7 July both pit craters contained active lava lakes (figure 120). By 12 July the thermal activity decreased; two smaller anomalies were visible through the rest of the month at the S pit crater while the N pit crater showed evidence of cooling.
Renewed lava lake activity was identified at the N pit crater, based on a satellite image from 11 August, with two smaller anomalies visible at the S pit crater. By 16 August the lava lake in the N pit had begun to cool and only a small thermal anomaly was identified. Activity restarted on 21 August, filling much of the E and SE part of the N pit crater. The thermal activity at the N pit crater intensified on 31 August, particularly in the NW part of the crater. On 5 September lava filled much of the N pit crater, overflowing to the W and SW. During at least 10-20 September thermal activity at both craters were relatively low.
According to a satellite image on 25 September, strong thermal activity resumed when lava overflowed the N pit crater to the S, SW, and NE (figure 120). A satellite image taken on 5 October showed lava flows from the N had spilled into the S and begun to cool, accompanied by two weak thermal anomalies at the S pit crater. On 15 October lava flows again traveled SE and appeared to originate from the S pit crater (figure 120). Following these events, smaller thermal anomalies were visible on the SE rim of the N pit crater and within the S pit crater.
Lava was visible in the NW part of the N pit crater according to a satellite image taken on 4 November. By 9 November the intensity had decreased, and the lava appeared to cool through the rest of the month; young lava flows were visible along the W side of the S pit crater on 24 and 29 November. Lava flows occurred at the N pit crater trending NE-SW and along the E side on 29 November (figure 120).
During the reporting period, the MIROVA (Middle InfraRed Observation of Volcanic Activity) thermal detection system recorded consistent activity during the first half of 2023 (figure 121). Beginning in June 2023, thermal activity increased and remained variable in intensity through the end of the year indicating the presence of an active lava lake and lava flows. The MODVOLC thermal detection system registered a total of 63 anomalies during 7, 8, and 23 July, 10 and 18 August, 3, 5, 16, 23, 24, and 25 September, 15 and 20 October, and 21, 24, 26, 28, and 30 November. Some of these stronger thermal anomalies were also detected in Sentinel-2 infrared satellite images that showed an active lava lake at the N pit crater and subsequent lava overflows from both pit craters (figure 120).
Geologic Background. The Erta Ale basaltic shield volcano in Ethiopia has a 50-km-wide edifice that rises more than 600 m from below sea level in the Danakil depression. The volcano includes a 0.7 x 1.6 km summit crater hosting steep-sided pit craters. Another larger 1.8 x 3.1 km wide depression elongated parallel to the trend of the Erta Ale range is located SE of the summit and is bounded by curvilinear fault scarps on the SE side. Basaltic lava flows from these fissures have poured into the caldera and locally overflowed its rim. The summit caldera usually also holds at least one long-term lava lake that has been active since at least 1967, and possibly since 1906. Recent fissure eruptions have occurred on the N flank.
Information Contacts: MIROVA (Middle InfraRed Observation of Volcanic Activity), a collaborative project between the Universities of Turin and Florence (Italy) supported by the Centre for Volcanic Risk of the Italian Civil Protection Department (URL: http://www.mirovaweb.it/); Hawai'i Institute of Geophysics and Planetology (HIGP) - MODVOLC Thermal Alerts System, School of Ocean and Earth Science and Technology (SOEST), Univ. of Hawai'i, 2525 Correa Road, Honolulu, HI 96822, USA (URL: http://modis.higp.hawaii.edu/); Copernicus Browser, Copernicus Data Space Ecosystem, European Space Agency (URL: https://dataspace.copernicus.eu/browser/).
Ubinas
Peru
16.345°S, 70.8972°W; summit elev. 5608 m
All times are local (unless otherwise noted)
New eruption with explosions and ash plumes during June-December 2023
Ubinas, located in Peru, has had 24 eruptions since 1550, which more recently have been characterized by explosions, ash plumes, and lahars (BGVN 45:03). This report covers a new eruption during June through December 2023 based on reports from Instituto Geofisico del Peru (IGP), Instituto Geológico Minero y Metalúrgico (INGEMMET), and satellite data.
IGP reported that seismic unrest began on 17 May, followed by an increase in seismicity during the second half of the month. There were 168 volcano-tectonic (VT) earthquakes detected, which are associated with rock fracturing processes, and 171 long-period (LP) earthquakes recorded during 16-24 May, which are associated with the movement of volcanic fluid.
Seismicity and fumarolic activity at the crater level continued to increase during June. During 1-18 June there was an average of 631 VT-type earthquakes and 829 LP earthquakes recorded. Webcams showed gas-and-steam emissions rising 500 m above the summit and drifting SE. In addition, the maximum value of emitted sulfur dioxide during this period was 337 tons/day. During 19-22 June an average of 315 VT-type events and 281 LP-type events and tremor were reported. On 20 June the Gobierno Regional de Moquegua raised the Volcano Alert Level (VAL) to Yellow (the second level on a four-color scale), based on recommendations from IGP. Webcam images showed ash emissions rising 1 km above the summit and drifting E at 0011 on 22 June, which IGP reported marked the start of a new eruption. Sporadic and diffuse gas-and-ash emissions continued to rise 800-1,500 m above the summit through the rest of the month and drifted mainly E, N, NW, W, SW, and NE. During 23-25 June there was an average of 402 VT-type earthquakes and 865 LP-type events detected. During 26-28 June the earthquakes associated with ash emissions, which have been observed since 22 June, decreased, indicating the end of the phreatic phase of the eruption, according to IGP. A thermal anomaly was detected in the crater for the first time on 26 June and was periodically visible through 4 July (figure 61). During 29-30 June there was an average of 173 VT-type earthquakes and 351 LP-type events recorded, and sulfur dioxide values ranged between 600 t/d and 1,150 t/d. During this same time, seismicity significantly increased, with 173 VT-type earthquakes, 351 LP-type events, and harmonic tremor which signified rising magma. The Gobierno Regional de Moquegua raised the Alert Level to Orange (the third level on a four-color scale) on 30 June based on the recommendation from IGP and INGEMMET.
Activity during July consisted of continued seismicity and gas-and-ash emissions. Gas-and-ash emissions rose as high as 5 km above the summit and drifted as far as 40 km in different directions during 1, 4-6, 16, 20-23, 26, and 29 July, based on webcam and satellite images. During 1-2 July an average of 72 VT-type earthquakes and 114 LP-type events were detected. In addition, during that time, ashfall was reported in Ubinas (6.5 km SSE) and Querapi (4.5 km SE). During 2-3 July INGEMMET reported gas-and-ash plumes rose 400 m above the summit and drifted SW, causing ashfall in downwind areas as far as 5 km. During 3-4 July there was an average of 69 VT-type earthquakes and 96 LP-type events reported. On 4 July starting around 0316 there were 16 seismic signals associated with explosive activity and ash emissions detected (figure 62). According to INGEMMET an explosion ejected ballistics and generated a gas-and-ash plume that rose 5.5 km above the summit and drifted SW and S. Ashfall was recorded in Querapi, Ubinas, Sacohaya (7 km SSE), Anascapa (11 km SE), San Miguel (10 km SE), Tonohaya (7 km SSE), Huatahua, Huarina, Escacha (9 km SE), and Matalaque (17 km SSE), and was most significant within 5 km of the volcano. IGP noted that ash fell within a radius of 20 km and deposits were 1 mm thick in towns in the district of Ubinas.
During 5-9 July an average of 67 VT-type events and 47 LP-type events were reported. A period of continuous gas-and-ash emissions occurred on 5 July, with plumes drifting more than 10 km SE and E. A total of 11 seismic signals associated with explosions also detected on 6, 16, 17, and 22 July. On 6 July explosions recorded at 0747 and 2330 produced gas-and-ash plumes that rose as high as 3.5 km above the summit and drifted as far as 30 km NW, NE, SE, and S. According to the Washington VAAC the explosion at 0747 produced a gas-and-ash plume that rose to 9.1 km altitude and drifted SW, which gradually dissipated, while a lower-altitude plume rose to 7.6 km altitude and drifted NE. Gobierno Regional de Moquegua declared a state of emergency for districts in the Moquegua region, along with Coalaque Chojata, Icuña, Lloque, Matalaque, Ubinas, and Yunga of the General Sánchez Cerro province, to be in effect for 60 days. On 7 July an ash plume rose to 7.3 km altitude and drifted E at 0320. At 0900 and 1520 gas-and-steam plumes with diffuse ash rose to 6.7 km altitude and drifted SE. Small ash emissions were visible in satellite and webcam images at 0920 and 1520 on 8 July and rose as high as 6.4 km altitude and drifted SE. During 10-16 July there was an average of 80 VT-type earthquakes and 93 LP-type events reported. INGEMMET reported that during 9-11 July sulfur dioxide emissions were low and remained around 300 t/d.
During 17-23 July an average of 46 VT-type events and 122 LP-type events were detected. On 20 July at 0530 an explosion generated an ash plume that rose 3-4.5 km above the crater and drifted 65 km toward Arequipa. An explosion on 21 July at 0922 produced a gas-and-ash plume that rose 5 km above the summit (figure 63). Ashfall was reported in Querapi, Ubinas, Tonohaya, Anascapa, Sacohaya, San Miguel, Escacha, Huatagua (14 km SE), Huarina, Escacha (9 km SE), Matalaque, Logén, Santa Lucía de Salinas, and Salinas de Moche. An explosion on 22 July at 1323 generated an ash plume that rose 5.5 km above the summit and drifted NE, E, and SE. During 24-30 July there were five volcanic explosions detected and an average of 60 VT-type events and 117 LP-type events. An explosion on 29 July at 0957 produced an ash plume that rose 2.5 km above the summit and drifted as far as 40 km NE, E, and SE. As a result, significant ashfall was reported in Ubinas and Matalaque.
During August, explosions, gas-and-ash emissions, and seismic earthquakes persisted. During 31 July to 6 August there was an average of 115 VT-type events and 124 LP-type events reported. Gas-and-ash emissions were observed during 1, 6, 10, 13-14, 17-18, 21, and 23 August and they drifted as far as 20 km in different directions; on 14 and 18 August continuous ash emissions extended as far as 40 km S, SE, and NE. An explosion was detected at 2110 on 1 August, which generated a gas-and-ash plume that rose 5.4 km above the summit and drifted SE and E. The explosion ejected blocks and incandescent material as far as 3 km from the crater onto the SW, S, and SE flanks. Ashfall was reported in Ubinas and Chojata (19 km ESE). Gas-and-ash emissions rose as high as 2 km above the summit and drifted in different directions through 5 August, sometimes causing ashfall within a 15-km-radius. An explosion at 0009 on 6 August ejected blocks and produced a gas-and-ash plume that rose 1.4 km above the summit and drifted SE and E, which caused ashfall in Ubinas and Chojata and other areas within a 30-km radius. During 7-13 August there was an average of 102 VT-type events and 60 LP-type events detected. INGEMMET reported that sulfur dioxide emissions were low on 7 August and averaged 400 t/d.
One volcanic explosion that was recorded on 10 August, producing gas-and-ash emissions that rose 2.4 km above the summit and drifted as far as 25 km SE and E. Ashfall was observed in Ubinas, Matalaque, and Chojata. During 10-11 and 13-14 August sulfur dioxide values increased slightly to moderate levels of 2,400-3,700 t/d. The average number of VT-type events was 104 and the number of LP-type events was 71 during 14-21 August. Two explosions were detected at 0141 and 0918 on 21 August, which produced gas-and-ash emissions that rose 3.5 km above the summit and drifted 50 km N, NE, W, and NW (figure 64). The explosion at 0918 generated an ash plume that caused ashfall in different areas of San Juan de Tarucani. During 22-27 August the average number of VT-type events was 229 and the average number of LP-type events was 54. An explosion was reported at 1757 on 25 August, which generated a gas-and-ash plume that rose 4.2 km above the summit and drifted in multiple directions as far as 25 km. During 28 August through 3 September gas-and-ash emissions rose 600 m above the summit and drifted as far as 5 km E and SE. During this time, there was an average of 78 VT-type events and 42 LP-type events.
Gas-and-steam emissions rose 600-2,600 m above the summit and drifted as far as 15 km in multiple directions during September. During 4-10 and 11-17 September there was an average of 183 VT-type events and 27 LP-type events, and 114 VT-type events and 86 LP-type events occurred, respectively. On 14 September an explosion at 1049 generated a gas-and-ash plume that rose 2.6 km above the summit and drifted as far as 15 km E, NE, SE, and S (figure 65). During 14-16 September an average of three hours of seismic tremor related to ash emissions was recorded each day. During 18-24 September the average number of VT-type events was 187 and the average number of LP-type events was 45. During 25 September and 1 October, there was an average number of 129 VT-type events and 52 LP-type events detected.
Relatively low activity was reported during October; during 2-9 October there was an average number of 155 VT-type events and 27 LP-type events recorded. On 1 October at 1656 seismic signals associated with ash emissions were recorded for an hour and thirty minutes; the ash plumes rose as high as 1 km above the summit and drifted more than 10 km E, S, and SW. On 4 October IGP reported that an ash plume drifted more than 15 km SW and S. Sulfur dioxide emissions were 1,250 t/d on that day. On 7 October a gas-and-ash plume rose 1.9 km above the summit and drifted NE, E, and SE. On 4 October the amount of sulfur dioxide emissions was 1,250 t/d. During 10-15 October there was an average number of 225 VT-type events and 34 LP-type events recorded. On 11 October at 1555 a single seismic signal associated with an ash pulse was recorded; the gas-and-ash emissions rose 700 m above the summit and drifted SW and W. There was an average of 204 VT-type events and 25 LP-type events detected during 16-22 October and 175 VT-type events and 17 LP-type events during 23-29 October. On 27 October at 0043 a gas-and-ash emission rose 500 m above the summit and drifted SE and E. A minor thermal anomaly was visible on the crater floor. During 30 October to 5 November there was an average of 95 VT-type events and 24 LP-type events detected.
Activity remained relatively low during November and December and consisted mainly of gas-and-steam emissions and seismicity. Gas-and-steam emissions rose 900-1,100 m above the summit and drifted mainly E, SE, N, and NE. IGP detected an average of 166 VT-type events and 38 LP-type events during 6-15 November, 151 VT-type events and 17 LP-type events during 16-30 November, 143 VT-type events and 23 LP-type events during 1-15 December, and 129 VT-type events and 21 LP-type events during 16-31 December. No explosions or ash emissions were recorded during November. The VAL was lowered to Yellow (the second level on a four-color scale) during the first week of November. According to the Washington VAAC an ash emission was identified in a satellite image at 0040 on 11 December that rose to 5.5 km altitude and drifted NW. Webcam images at 0620 and 1220 showed continuous gas-and-steam emissions possibly containing some ash rising as high as 7 km altitude. Webcam images during 10-31 December showed continuous gas-and-ash emissions that rose as high as 2.5 km above the summit and drifted up to 5 km NW, W, and SW. On 12 December continuous ash emissions drifted more than 10 km N and NW.
Geologic Background. The truncated appearance of Ubinas, Perú's most active volcano, is a result of a 1.4-km-wide crater at the summit. It is the northernmost of three young volcanoes located along a regional structural lineament about 50 km behind the main volcanic front. The growth and destruction of Ubinas I was followed by construction of Ubinas II beginning in the mid-Pleistocene. The upper slopes of the andesitic-to-rhyolitic Ubinas II stratovolcano are composed primarily of andesitic and trachyandesitic lava flows and steepen to nearly 45°. The steep-walled, 150-m-deep summit crater contains an ash cone with a 500-m-wide funnel-shaped vent that is 200 m deep. Debris-avalanche deposits from the collapse of the SE flank about 3,700 years ago extend 10 km from the volcano. Widespread Plinian pumice-fall deposits include one from about 1,000 years ago. Holocene lava flows are visible on the flanks, but activity documented since the 16th century has consisted of intermittent minor-to-moderate explosive eruptions.
Information Contacts: Instituto Geofisico del Peru (IGP), Calle Badajoz N° 169 Urb. Mayorazgo IV Etapa, Ate, Lima 15012, Perú (URL: https://www.gob.pe/igp); Observatorio Volcanologico del INGEMMET (Instituto Geológical Minero y Metalúrgico), Barrio Magisterial Nro. 2 B-16 Umacollo - Yanahuara Arequipa, Peru (URL: http://ovi.ingemmet.gob.pe); Gobierno Regional Moquegua, Sede Principal De Moquegua, R377+5RR, Los Chirimoyos, Moquegua 18001, Peru (URL: https://www.gob.pe/regionmoquegua); Washington Volcanic Ash Advisory Center (VAAC), Satellite Analysis Branch (SAB), NOAA/NESDIS OSPO, NOAA Science Center Room 401, 5200 Auth Rd, Camp Springs, MD 20746, USA (URL: www.ospo.noaa.gov/Products/atmosphere/vaac, archive at: http://www.ssd.noaa.gov/VAAC/archive.html); MIROVA (Middle InfraRed Observation of Volcanic Activity), a collaborative project between the Universities of Turin and Florence (Italy) supported by the Centre for Volcanic Risk of the Italian Civil Protection Department (URL: http://www.mirovaweb.it/); Copernicus Browser, Copernicus Data Space Ecosystem, European Space Agency (URL: https://dataspace.copernicus.eu/browser/).
Kanaga (United States) — January 2024 Cite this Report
Kanaga
United States
51.923°N, 177.168°W; summit elev. 1307 m
All times are local (unless otherwise noted)
Small explosion on 18 December 2023
Kanaga lies within the Kanaton caldera at the northern tip of Kanaga Island. The caldera rim forms a 760-m-high arcuate ridge south and east of Kanaga; a lake occupies part of the SE caldera floor. Most of its previous recorded eruptions are poorly documented, although they date back to 1763. Fumarolic activity at Kanaga occurs in a circular, 200-m-wide, 60-m-deep summit crater and produces vapor plumes sometimes seen on clear days from Adak, 50 km to the east. Its most recent eruption occurred in February 2012, which consisted of numerous small earthquakes, a possible weak ash cloud, and gas-and-steam emissions (BGVN 38:03). This report covers a new eruption during December 2023, based on information from the Alaska Volcano Observatory (AVO).
A small explosion was detected in local infrasound and seismic data at 2231 on 18 December, followed by elevated seismicity. No ash emissions were visible in partly cloudy satellite images. On 19 December the Volcano Alert Level (VAL) was raised to Advisory (the second level on a four-level scale) and the Aviation Color Code (ACC) was raised to Yellow (the second color on a four-color scale). The rate of seismicity significantly declined after the 18th, although it remained elevated through 30 December. Small, daily earthquakes occurred during 19-28 December. Satellite observations following the event showed a debris flow extending 1.5 km down the NW flank. Possible minor gas-and-steam emissions were visible in a webcam image on 20 December. Weakly elevated surface temperatures were identified in satellite data during 23-26 December. A series of cracks extending from the inner crater to the upper SE flank and debris deposits on the upper flanks were observed in satellite images on 27 December. AVO reported that these were likely formed during the 18 December event. Local webcam and seismic data were temporarily offline due to a power failure during 4-28 January.
On 28 January connection to the seismic stations and webcams was restored and webcam images showed gas-and-steam emissions at the summit. Occasional earthquakes were also detected each day. A period of weak seismic tremor was observed on 31 January. During February, the number of earthquakes declined. On 27 February AVO lowered the VAL to Normal (the lowest level on a four-level scale) and the ACC to Green (the lowest color on a four-color scale) due to decreased levels of seismicity and no new surface changes or elevated temperatures based on satellite and webcam data.
Geologic Background. Symmetrical Kanaga stratovolcano is situated within the Kanaton caldera at the northern tip of Kanaga Island. The caldera rim forms a 760-m-high arcuate ridge south and east of Kanaga; a lake occupies part of the SE caldera floor. The volume of subaerial dacitic tuff is smaller than would typically be associated with caldera collapse, and deposits of a massive submarine debris avalanche associated with edifice collapse extend nearly 30 km to the NNW. Several fresh lava flows from historical or late prehistorical time descend the flanks of Kanaga, in some cases to the sea. Historical eruptions, most of which are poorly documented, have been recorded since 1763. Kanaga is also noted petrologically for ultramafic inclusions within an outcrop of alkaline basalt SW of the volcano. Fumarolic activity occurs in a circular, 200-m-wide, 60-m-deep summit crater and produces vapor plumes sometimes seen on clear days from Adak, 50 km to the east.
Information Contacts: Alaska Volcano Observatory (AVO), a cooperative program of a) U.S. Geological Survey, 4200 University Drive, Anchorage, AK 99508-4667 USA (URL: https://avo.alaska.edu/), b) Geophysical Institute, University of Alaska, PO Box 757320, Fairbanks, AK 99775-7320, USA, and c) Alaska Division of Geological & Geophysical Surveys, 794 University Ave., Suite 200, Fairbanks, AK 99709, USA (URL: http://dggs.alaska.gov/).
Klyuchevskoy (Russia) — January 2024 Cite this Report
Klyuchevskoy
Russia
56.056°N, 160.642°E; summit elev. 4754 m
All times are local (unless otherwise noted)
New eruption consisting of Strombolian activity, lava flows and fountains, and ash plumes during June-December 2023
Klyuchevskoy, located on the Kamchatka Peninsula, has produced frequent moderate-volume explosive and effusive eruptions and more than 100 flank eruptions have occurred during the past 3,000 years. Eruptions recorded since the late 17th century have resulted in frequent changes to the morphology of the 700-m-wide summit crater. Eruptions over the past 400 years have primarily originated from the summit crater, although numerous major explosive and effusive eruptions have also occurred from flank craters. The previous eruption ended in November 2022 and consisted of Strombolian activity (BGVN 47:12). This report covers a new eruption during June through December 2023, characterized by Strombolian explosions, lava flows, and ash plumes. Information primarily comes from weekly and daily reports from the Kamchatkan Volcanic Eruption Response Team (KVERT) and various satellite data.
KVERT reported that a Strombolian eruption began at 2323 on 22 June. A thermal anomaly was visible in satellite data starting on 22 June (figure 75). As a result, the Aviation Color Code (ACC) was raised to Yellow (the second lowest level on a four-color scale). During 4-6 and 13 July small ash clouds were occasionally observed over the crater. On 19 July a new lava flow began to effuse along the Apakhonchich drainage on the SE flank, which continued through 19 August. Lava fountaining was reported on 21 July in addition to the active lava flow, which continued through 23 August and during 27-30 August. During 22-23 and 27-30 August the lava flow was active along the Apakhonchich drainage on the SE flank.
Similar activity was observed during September. Lava fountaining resumed on 2 September and continued through 31 October. In addition, on 2 September a lava flow began to effuse along the Kozyrevsky drainage on the SW flank. During 3-5 September resuspended ash plumes rose to 3-3.5 km altitude and extended as far as 170 km E by 1940 on 4 September. The ACC was raised to Orange (the third level on a four-color scale) at 1240 on 4 September. The ACC was briefly lowered back to Yellow at 1954 that same day before returning to Orange during 1532-1808 on 5 September due to resuspended ash plumes that rose to 3 km altitude and drifted 120 km E at 1500. KVERT reported that Strombolian activity continued, feeding the lava flows advancing down the Apakhonchichsky and Kozyrevsky drainages through most of the month. During 25 September through 16 October the lava flow was only active in the Apakhonchichisky drainage (figure 76). During 9-12 September resuspended ash plumes rose to 1.5-4 km altitude and extended 550 km E and SE. On 22 September resuspended ash plumes rose to 2-2.5 km altitude and drifted 50-90 km E, which prompted KVERT to raise the ACC to Orange; the ACC was lowered back to Yellow on 24 September. On 29 September phreatic explosions generated ash plumes that rose to 5.2-5.3 km altitude.
Activity during October continued with lava fountains, lava flows, and ash plumes. Strombolian activity with lava fountains continued at the crater and active lava flows alternately descended the Apakhonchichisky and Kozyrevsky drainages on the SE and S flanks (figure 77). During 11-12 October gas-and-steam plumes containing some ash rose to 5.5-6 km altitude and extended as far as 65 km NE and SE. The ACC was raised to Orange on 11 October. According to observers at the Kamchatka Volcanological Station, lava effusion was almost continuous, and incandescent material was ejected as high as 300 m above the crater rim. On 13 October at 1420 an ash plume rose to 5-5.5 km altitude and drifted 90-100 km SE. During 14-16 October gas-and-steam plumes containing some ash rose to 4-6 km altitude and drifted 40-145 km ESE and E. On 16 October lava on the SE flank melted the snow and ice, causing phreatic explosions and large collapses of material from the margins of the flow. At 1500 an ash plume rose to 6.5-7 km altitude and drifted 70 km ENE. On 17 October an ash plume was reported extending 360 km NE. Gray-red ashfall was observed in Klyuchi at 0700; this ash was resuspended from older material.
During 22-31 October phreatic explosions generated ash plumes mainly containing ash from collapses of previously deposited pyroclastic material that rose to 7 km altitude and extended as far as 280 km NE, E, SW, and S on 23 and 29 October the ash plumes rose to 8 km altitude. Ash plumes during 27-29 October rose to 8 km altitude and drifted as far as 300 km SE, ESE, and E. Lava fountains rose up to 500 m above the crater during 27-31 October. Scientists from the Kamchatka Volcanological Station visited the volcano on 28 October and reported that the cinder cone at the summit had grown. They also observed advancing lava on the E flank that extended about 2 km from the summit to 2,700 m elevation, incandescent ejecta 500 m above the crater, and avalanches in the Apakhonchichsky drainage. On 31 October activity intensified, and lava flows were reported moving in the Kretovsky, Kozyrevsky, and Apakhonchichisky drainages on the NW, SW, and SE flanks. At 0930 an ash plume rose to 7 km altitude and at first drifted 169 km SW and then 646 km SE. KVERT reported ash plumes rose to 14 km altitude and extended as far as 1,500 km SSE. The ACC was raised to Red (the highest level on a four-color scale). During 31 October to 1 November ash plumes rose as high as 14 km altitude and drifted as far as 2,255 km ESE.
Activity on 1 November intensified. The lava fountains rose as high as 1 km above the summit (figure 78) and fed the lava flows that were active on the Kretovsky, Kozyrevsky, and Apakhonchichsky drainages on the NW, SW, and SE flanks. Ash plumes rose to 10-14 km altitude and drifted as far as 1,500 km SSE (figure 79). According to the Kamchatka Volcanological Station, observers reported pyroclastic flows descending the flanks. Lahars descended the Studenoy River, blocking the Kozyrevsky-Petropavlovsk federal highway and descended the Krutenkaya River, blocking the road E of Klyuchi. According to news articles the ash plumes caused some flight cancellations and disruptions in the Aleutians, British Columbia (Canada), and along flight paths connecting the Unites States to Japan and South Korea. Ash plumes containing old ash from collapses in the Apakhonchichsky drainage due to phreatic explosions rose to 9.5-9.8 km altitude and drifted 192 km SW at 1400 and to 8.7 km altitude and drifted 192 km SW at 1710 on 1 November.
On 2 November ash plumes rose to 6-14 km altitude; the ash plume that rose to 14 km altitude decreased to 6.5 km altitude and drifted NNE by 2000 and continued to drift more than 3,000 km ESE and E. The ACC was lowered to Orange. On 3 November ash plumes rose to 5-8.2 km altitude and drifted 72-538 km ENE, NNE, and ESE; at 0850 an ash plume rose to 6-6.5 km altitude and drifted more than 3,000 km ESE throughout the day. During 4-6 and 8-10 November resuspended ash plumes associated with collapses of old pyroclastic material from the sides of the Apakhonchichsky drainage due to phreatic explosions rose to 4.5-5.5 km altitude and extended 114-258 km NE, ENE, and E. KVERT reported that the eruption stopped on 5 November and the lava flows had begun to cool. Resuspended ash plumes rose to 5-6 km altitude and drifted 60 km E at 0820 on 13 November and to 5 km and 4.5 km altitude at 1110 and 1430 and drifted 140 km E and 150 km ESE, respectively. On 15 November the ACC was lowered to Green.
Activity was relatively low during most of December. On 27 December Strombolian activity resumed based on a thermal anomaly visible in satellite data. On 30 December an ash plume rose to 6 km altitude and extended 195 km NW. The ACC was raised to Orange. On 31 December video and satellite data showed explosions that generated ash plumes that rose to 5-6.5 km altitude and drifted 50-230 km WNW and NW. Though a thermal anomaly persisted through 1 January 2024, no explosions were detected, so the ACC was lowered to Yellow.
Satellite data. Thermal activity was strong throughout the reporting period due to frequent lava fountaining and lava flows. MODIS thermal anomaly data provided through MIROVA (Middle InfraRed Observation of Volcanic Activity) showed strong activity during the entire reporting period, resulting from lava fountaining and lava flows (figure 80). According to data from MODVOLC thermal alerts, a total of 336 hotspots were detected in June (3), July (30), August (11), September (52), October (217), and November (23). Thermal activity was also visible in infrared satellite images, often showing a strong thermal anomaly at the summit crater and a lava flow affecting primarily the SE and SW flanks (figure 81).
Geologic Background. Klyuchevskoy is the highest and most active volcano on the Kamchatka Peninsula. Since its origin about 6,000 years ago, this symmetrical, basaltic stratovolcano has produced frequent moderate-volume explosive and effusive eruptions without major periods of inactivity. It rises above a saddle NE of Kamen volcano and lies SE of the broad Ushkovsky massif. More than 100 flank eruptions have occurred during approximately the past 3,000 years, with most lateral craters and cones occurring along radial fissures between the unconfined NE-to-SE flanks of the conical volcano between 500 and 3,600 m elevation. Eruptions recorded since the late 17th century have resulted in frequent changes to the morphology of the 700-m-wide summit crater. These eruptions over the past 400 years have originated primarily from the summit crater, but have also included numerous major explosive and effusive eruptions from flank craters.
Information Contacts: Kamchatka Volcanic Eruptions Response Team (KVERT), Far Eastern Branch, Russian Academy of Sciences, 9 Piip Blvd., Petropavlovsk-Kamchatsky, 683006, Russia (URL: http://www.kscnet.ru/ivs/kvert/); Kamchatka Volcanological Station, Kamchatka Branch of Geophysical Survey, (KB GS RAS), Klyuchi, Kamchatka Krai, Russia (URL: http://volkstat.ru/); MIROVA (Middle InfraRed Observation of Volcanic Activity), a collaborative project between the Universities of Turin and Florence (Italy) supported by the Centre for Volcanic Risk of the Italian Civil Protection Department (URL: http://www.mirovaweb.it/); Hawai'i Institute of Geophysics and Planetology (HIGP) - MODVOLC Thermal Alerts System, School of Ocean and Earth Science and Technology (SOEST), Univ. of Hawai'i, 2525 Correa Road, Honolulu, HI 96822, USA (URL: http://modis.higp.hawaii.edu/); Copernicus Browser, Copernicus Data Space Ecosystem, European Space Agency (URL: https://dataspace.copernicus.eu/browser/).
Agung (Indonesia) — January 2024 Cite this Report
Agung
Indonesia
8.343°S, 115.508°E; summit elev. 2997 m
All times are local (unless otherwise noted)
Three eruptive events reported in April, May, and December 2022
Mount Agung, located on the E end of the island of Bali, Indonesia, rises above the SE rim of the Batur caldera. The summit area extends 1.5 km E-W, with the highest point on the W and a steep-walled 800-m-wide crater on the E. Recorded eruptions date back to the early 19th century. A large and deadly explosive and effusive eruption occurred during 1963-64, which was characterized by voluminous ashfall, pyroclastic flows, and lahars that caused extensive damage and many fatalities. More recent activity was documented during November 2017-June 2019 that consisted of multiple explosions, significant ash plumes, lava flows at the summit crater, and incandescent ejecta. This report covers activity reported during April-May 2022 and December 2022 based on data from the Darwin Volcanic Ash Advisory Center (VAAC).
Activity during 2022 was relatively low and mainly consisted of a few ash plumes during April-May and December. An ash plume on 3 April rising to 3.7 km altitude (700 m above the summit) and drifting N was reported in a Darwin VAAC notice based on a ground report, with ash seen in HIMAWARI-8 visible imagery. Another ash plume was reported at 1120 on 27 May that rose to 5.5 km altitude (2.5 m above the summit); the plume was not visible in satellite or webcam images due to weather clouds. An eruption was reported based on seismic data at 0840 on 13 December, with an estimated plume altitude of 3.7 km; however, no ash was seen using satellite imagery in clear conditions before weather clouds obscured the summit.
Geologic Background. Symmetrical Agung stratovolcano, Bali's highest and most sacred mountain, towers over the eastern end of the island. The volcano, whose name means "Paramount," rises above the SE rim of the Batur caldera, and the northern and southern flanks extend to the coast. The summit area extends 1.5 km E-W, with the high point on the W and a steep-walled 800-m-wide crater on the E. The Pawon cone is located low on the SE flank. Only a few eruptions dating back to the early 19th century have been recorded in historical time. The 1963-64 eruption, one of the largest in the 20th century, produced voluminous ashfall along with devastating pyroclastic flows and lahars that caused extensive damage and many fatalities.
Information Contacts: Darwin Volcanic Ash Advisory Centre (VAAC), Bureau of Meteorology, Northern Territory Regional Office, PO Box 40050, Casuarina, NT 0811, Australia (URL: http://www.bom.gov.au/info/vaac/).
Saunders (United Kingdom) — February 2024 Cite this Report
Saunders
United Kingdom
57.8°S, 26.483°W; summit elev. 843 m
All times are local (unless otherwise noted)
Persistent thermal anomalies from the summit crater lava lake during February 2023-January 2024
Saunders is one of eleven islands that comprise the South Sandwich Islands in the South Atlantic. The active Mount Michael volcano has been in almost continuous eruption since November 2014 (BGVN 48:02). Recent activity has resulted in intermittent thermal anomalies and gas-and-steam emissions (BGVN 47:03, 48:02). Visits are infrequent due to its remote location, and cloud cover often prevents satellite observations. Satellite thermal imagery and visual observation of incandescence during a research expedition in 2019 (BGVN 28:02 and 44:08) and a finding confirmed by a National Geographic Society research team that summited Michael in November 2022 reported the presence of a lava lake.
Although nearly constant cloud cover during February 2023 through January 2024 greatly limited satellite observations, thermal anomalies from the lava lake in the summit crater were detected on clear days, especially around 20-23 August 2023. Anomalies similar to previous years (eg. BGVN 48:02) were seen in both MIROVA (Middle InfraRed Observation of Volcanic Activity) data from MODIS instruments and in Sentinel 2 infrared imagery. The only notable sulfur dioxide plume detected near Saunders was on 25 September 2023, with the TROPOMI instrument aboard the Sentinel-5P satellite.
Geologic Background. Saunders Island consists of a large central volcanic edifice intersected by two seamount chains, as shown by bathymetric mapping (Leat et al., 2013). The young Mount Michael stratovolcano dominates the glacier-covered island, while two submarine plateaus, Harpers Bank and Saunders Bank, extend north. The symmetrical Michael has a 500-m-wide summit crater and a remnant of a somma rim to the SE. Tephra layers visible in ice cliffs surrounding the island are evidence of recent eruptions. Ash clouds were reported from the summit crater in 1819, and an effusive eruption was inferred to have occurred from a N-flank fissure around the end of the 19th century and beginning of the 20th century. A low ice-free lava platform, Blackstone Plain, is located on the north coast, surrounding a group of former sea stacks. A cluster of cones on the SE flank, the Ashen Hills, appear to have been modified since 1820 (LeMasurier and Thomson, 1990). Analysis of satellite imagery available since 1989 (Gray et al., 2019; MODVOLC) suggests frequent eruptive activity (when weather conditions allow), volcanic clouds, steam plumes, and thermal anomalies indicative of a persistent, or at least frequently active, lava lake in the summit crater. Due to this observational bias, there has been a presumption when defining eruptive periods that activity has been ongoing unless there is no evidence for at least 10 months.
Information Contacts: MIROVA (Middle InfraRed Observation of Volcanic Activity), a collaborative project between the Universities of Turin and Florence (Italy) supported by the Centre for Volcanic Risk of the Italian Civil Protection Department (URL: http://www.mirovaweb.it/); NASA Global Sulfur Dioxide Monitoring Page, Atmospheric Chemistry and Dynamics Laboratory, NASA Goddard Space Flight Center (NASA/GSFC), 8800 Greenbelt Road, Goddard MD 20771, USA (URL: https://so2.gsfc.nasa.gov/); Copernicus Browser (URL: https://dataspace.copernicus.eu/browser).
Tengger Caldera (Indonesia) — February 2024 Cite this Report
Tengger Caldera
Indonesia
7.942°S, 112.95°E; summit elev. 2329 m
All times are local (unless otherwise noted)
Minor ash emission in December 2023; persistent weak thermal anomaly in the Bromo crater
Tengger Caldera, located at the N end of a volcanic massif in Indonesia’s East Java, consists of five overlapping stratovolcanoes. The youngest and only active cone in the 16-km-wide caldera is Bromo, which typically produces gas-and-steam plumes, occasional ash plumes and explosions, and weak thermal signals (BGVN 44:05, 47:01). This report covers activity during January 2022-December 2023, consisting of mostly white gas-and-steam emissions and persistent weak thermal anomalies. Information was provided by the Pusat Vulkanologi dan Mitigasi Bencana Geologi (PVMBG, also known as Indonesian Center for Volcanology and Geological Hazard Mitigation, CVGHM) and satellite imagery. The Alert Level remained at 2 (on a scale of 1-4), and visitors were warned to stay at least 1 km from the crater.
Activity was generally low during the reporting period, similar to that in 2021. According to almost daily images from MAGMA Indonesia (a platform developed by PVMBG), white emissions and plumes rose from 50 to 900 m above the main crater during this period (figure 24). During several days in March and June 2022, white plumes reached heights of 1-1.2 km above the crater.
After an increase in activity at 2114 on 3 February 2023, a PVMBG team that was sent to observe white emissions rising as high as 300 m during 9-12 February and heard rumbling noises. A sulfur dioxide odor was also strong near the crater and measurements indicated that levels were above the healthy (non-hazardous) threshold of 5 parts per million; differential optical absorption spectroscopy (DOAS) measurements indicated an average flux of 190 metric tons per day on 11 February. Incandescence originating from a large fumarole in the NNW part of the crater was visible at night. The team observed that vegetation on the E caldera wall was yellow and withered. The seismic network recorded continuous tremor and deep and shallow volcanic earthquakes.
According to a PVMBG press release, activity increased on 13 December 2023 with white, gray, and brown emissions rising as high as 900 m above Bromo’s crater rim and drifting in multiple directions (figure 25). The report noted that tremor was continuous and was accompanied in December by three volcanic earthquakes. Deformation data indicated inflation in December. There was no observable difference in the persistent thermal anomaly in the crater between 11 and 16 December 2023.
All clear views of the Bromo crater throughout this time, using Sentinel-2 infrared satellite images, showed a weak persistent thermal anomaly; none of the anomalies were strong enough to cause MODVOLC Thermal Alerts. A fire in the SE part of the caldera in early September 2023 resulted in a brief period of strong thermal anomalies.
Geologic Background. The 16-km-wide Tengger caldera is located at the northern end of a volcanic massif extending from Semeru volcano. The massive volcanic complex dates back to about 820,000 years ago and consists of five overlapping stratovolcanoes, each truncated by a caldera. Lava domes, pyroclastic cones, and a maar occupy the flanks of the massif. The Ngadisari caldera at the NE end of the complex formed about 150,000 years ago and is now drained through the Sapikerep valley. The most recent of the calderas is the 9 x 10 km wide Sandsea caldera at the SW end of the complex, which formed incrementally during the late Pleistocene and early Holocene. An overlapping cluster of post-caldera cones was constructed on the floor of the Sandsea caldera within the past several thousand years. The youngest of these is Bromo, one of Java's most active and most frequently visited volcanoes.
Information Contacts: Pusat Vulkanologi dan Mitigasi Bencana Geologi (PVMBG, also known as Indonesian Center for Volcanology and Geological Hazard Mitigation, CVGHM), Jalan Diponegoro 57, Bandung 40122, Indonesia (URL: http://www.vsi.esdm.go.id/); MAGMA Indonesia, Kementerian Energi dan Sumber Daya Mineral (URL: https://magma.esdm.go.id/v1); Copernicus Browser, Copernicus Data Space Ecosystem, European Space Agency (URL: https://dataspace.copernicus.eu/browser/); Hawai'i Institute of Geophysics and Planetology (HIGP) - MODVOLC Thermal Alerts System, School of Ocean and Earth Science and Technology (SOEST), Univ. of Hawai'i, 2525 Correa Road, Honolulu, HI 96822, USA (URL: http://modis.higp.hawaii.edu/).
Shishaldin (United States) — December 2023 Cite this Report
Shishaldin
United States
54.756°N, 163.97°W; summit elev. 2857 m
All times are local (unless otherwise noted)
New eruption with significant Strombolian explosions, ash plumes, and ashfall
Shishaldin is located on the eastern half of Unimak Island, one of the Aleutian Islands. Frequent explosive activity, primarily consisting of Strombolian ash eruptions from the small summit crater, but sometimes producing lava flows, has been recorded since the 18th century. The previous eruption ended in May 2020 and was characterized by intermittent thermal activity, increased seismicity and surface temperatures, ash plumes, and ash deposits (BGVN 45:06). This report covers a new eruption during July through November 2023, which consisted of significant explosions, ash plumes, ashfall, and lava fountaining. Information comes from daily, weekly, and special reports from the Alaska Volcano Observatory (AVO) and various satellite data. AVO monitors the volcano using local seismic and infrasound sensors, satellite data, web cameras, and remote infrasound and lightning networks.
AVO reported that intermittent tremor and low-frequency earthquakes had gradually become more regular and consistent during 10-13 July. Strongly elevated surface temperatures at the summit were identified in satellite images during 10-13 July. On 11 July AVO raised the Aviation Color Code (ACC) to Yellow (the second color on a four-color scale) and Volcano Alert Level (VAL) to Advisory (the second level on a four-level scale) at 1439. Later in the day on 11 July summit crater incandescence was observed in webcam images. Observations of the summit suggested that lava was likely present at the crater, which prompted AVO to raise the ACC to Orange (the second highest color on a four-color scale) and the VAL to Watch (the second highest level on a four-level scale). The US Coast Guard conducted an overflight on 12 July and confirmed that lava was erupting from the summit. That same day, sulfur dioxide emissions were detected in satellite images.
A significant explosion began at 0109 on 14 July that produced an ash plume that rose to 9-12 km altitude and drifted S over the Pacific Ocean (figure 43). Webcam images and photos taken around 0700 from a ship SW off Unimak Island showed small lahar deposits, which were the result of the interaction of hot pyroclastic material and snow and ice on the flanks. There was also ashfall on the SW and N flanks. A smaller explosion at 0710 generated an ash plume that rose to 4.5 km altitude. Webcam images and pilot reports showed continued low-level ash emissions during the morning, rising to less than 4.6 km altitude; those emissions included a small ash plume near the summit around 1030 resulting from a small explosion.
Seismic tremor amplitude began increasing at around 1700 on 15 July; strongly elevated surface temperatures were also reported. An ash plume rose to 4.6 km altitude and drifted SSE at 2100, based on a satellite image. A continuous ash plume during 2150 through 2330 rose to 5 km altitude and extended 125 km S. At 2357 AVO raised the ACC to Red (the highest color on a four-color scale) and the VAL to Warning (the highest level on a four-level scale), noting that seismicity remained elevated for more than six hours and explosion signals were frequently detected by regional infrasound (pressure sensor) networks. Explosions generated an ash plume that rose to 4.9 km altitude and drifted as far as 500 km SE. Activity throughout the night declined and by 0735 the ACC was lowered to Orange and the VAL to Watch. High-resolution satellite images taken on 16 July showed pyroclastic deposits extending as far as 3 km from the vent; these deposits generated lahars that extended further down the drainages on the flanks. Ash deposits were mainly observed on the SSE flank and extended to the shore of Unimak Island. During 16-17 July lava continued to erupt at the summit, which caused strongly elevated surface temperatures that were visible in satellite imagery.
Lava effusion increased at 0100 on 18 July, as noted in elevated surface temperatures identified in satellite data, increasing seismic tremor, and activity detected on regional infrasound arrays. A significant ash plume at 0700 rose to 7 km altitude and continued until 0830, eventually reaching 9.1 km altitude and drifting SSE (figure 44). As a result, the ACC was raised to Red and the VAL to Warning. By 0930 the main plume detached, but residual low-level ash emissions continued for several hours, remaining below 3 km altitude and drifting S. The eruption gradually declined and by 1208 the ACC was lowered to Orange and the VAL was lowered to Watch. High-resolution satellite images showed ash deposits on the SW flank and pyroclastic deposits on the N, E, and S flanks, extending as far as 3 km from the vent; lahars triggered by the eruption extended farther down the flanks (figure 45). Lava continued to erupt from the summit crater on 19 July.
Elevated surface temperatures were detected in satellite images during 19-25 July, despite occasional weather cloud cover, which was consistent with increased lava effusion. During 22-23 July satellite observations acquired after the eruption from 18 July showed pyroclastic flow and lahar deposits extending as far as 3 km down the N, NW, and NE flanks and as far as 1.5 km down the S and SE flanks. Ash deposits covered the SW and NE flanks. No lava flows were observed outside the crater. On 22 July a sulfur dioxide plume was detected in satellite data midday that had an estimated mass of 10 kt. In a special notice issued at 1653 on 22 July AVO noted that eruptive activity had intensified over the previous six hours, which was characterized by an hours-long steady increase in seismic tremor, intermittent infrasound signals consistent with small explosions, and an increase in surface temperatures that were visible in satellite data. Pilots first reported low-level ash plumes at around 1900. At 2320 an ash plume had risen to 9 km altitude based on additional pilot reports and satellite images. The ACC was increased to Red and the VAL to Warning at 2343. Satellite images indicated growth of a significantly higher ash plume that rose to 11 km altitude continued until 0030 and drifted NE. During the early morning hours of 23 July ash plumes had declined to 4.6 k altitude. Seismic tremor peaked at 0030 on 23 July and began to rapidly decline at 0109; active ash emissions were no longer visible in satellite data by 0130. The ACC was lowered to Orange and the VAL to Watch at 0418; bursts of increased seismicity were recorded throughout the morning, but seismicity generally remained at low levels. Elevated surface temperatures were visible in satellite data until about 0600. On 24 July pilots reported seeing vigorous gas-and-steam plumes rising to about 3 km altitude; the plumes may have contained minor amounts of ash.
During 24-25 July low level seismicity and volcanic tremor were detected at low levels following the previous explosion on 23 July. Strongly elevated surface temperatures were observed at the summit crater in satellite data. Around 2200 on 25 July seismicity began to increase, followed by infrasound signals of explosions after 0200 on 26 July. An ash plume rose to 3 km altitude at 0500 and drifted ENE, along with an associated sulfur dioxide plume that drifted NE and had an estimated mass of 22 kt. Diffuse ash emissions were visible in satellite data and rose to 6.1-7.6 km altitude and extended 125 km from the volcano starting around 1130. These ash events were preceded by about seven hours of seismic tremor, infrasound detections of explosions, and five hours of increased surface temperatures visible in satellite data. Activity began to decline around 1327, which included low-frequency earthquakes and decreased volcanic tremor, and infrasound data no longer detected significant explosions. Surface temperatures remained elevated through the end of the month.
Seismicity, volcanic tremor, and ash emissions remained at low levels during early August. Satellite images on 1 August showed that some slumping had occurred on the E crater wall due to the recent explosive activity. Elevated surface temperatures continued, which was consistent with cooling lava. On 2 August small explosive events were detected, consistent with low-level Strombolian activity. Some episodes of volcanic tremor were reported, which reflected low-level ash emissions. Those ash emissions rose to less than 3 km altitude and drifted as far as 92.6 km N. Pilots that were located N of the volcano observed an ash plume that rose to 2.7 km altitude. Seismicity began to increase in intensity around 0900 on 3 August. Seismicity continued to increase throughout the day and through the night with strongly elevated surface temperatures, which suggested that lava was active at the surface.
An ash cloud that rose to 7.6-7.9 km altitude and drifted 60-75 km NE was visible in a satellite image at 0520 on 4 August. Pilots saw and reported the plume at 0836 (figure 46). By 0900 the plume had risen to 9.1 km altitude and extended over 100 km NE. AVO raised the ACC to Red and the VAL to Warning as a result. Seismic tremor levels peaked at 1400 and then sharply declined at 1500 to slightly elevated levels; the plume was sustained during the period of high tremor and drifted N and NE. The ACC was lowered to Orange and the VAL to Watch at 2055. During 5-14 August seismicity remained low and surface temperatures were elevated based on satellite data due to cooling lava. On 9 August a small lava flow was observed that extended from the crater rim to the upper NE flank. It had advanced to 55 m in length and appeared in satellite imagery on 11 August. Occasional gas-and-steam plumes were noted in webcam images. At 1827 AVO noted that seismic tremor had steadily increased during the afternoon and erupting lava was visible at the summit in satellite images.
Strong explosion signals were detected at 0200 on 15 August. An ash cloud that was visible in satellite data extended 100 km NE and may have risen as high as 11 km altitude around 0240. By 0335 satellite images showed the ash cloud rising to 7.6 km altitude and drifting NE. Significant seismicity and explosions were detected by the local AVO seismic and infrasound networks, and volcanic lightning was detected by the World Wide Lightning Location Network (WWLLN). A sulfur dioxide plume associated with the eruption drifted over the S Bering Sea and parts of Alaska and western Canada. Seismicity was significantly elevated during the eruption but had declined by 1322. A pilot reported that ash emissions continued, rising as high as 4.9 km altitude. Elevated surface temperatures detected in satellite data were caused by hot, eruptive material (pyroclastic debris and lava) that accumulated around the summit. Eruptive activity declined by 16 August and the associated sulfur dioxide plume had mostly dissipated; remnants continued to be identified in satellite images at least through 18 August. Surface temperatures remained elevated based on satellite images, indicating hot material on the upper parts of the volcano. Small explosions were detected in infrasound data on the morning of 19 August and were consistent with pilot reports of small, short-lived ash plumes that rose to about 4.3 km altitude. Low-level explosive activity was reported during 20-24 August, according to seismic and infrasound data, and weather clouds sometimes prevented views. Elevated surface temperatures were observed in satellite images, which indicated continued hot material on the upper parts of the volcano.
Seismic tremor began to increase at around 0300 on 25 August and was followed by elevated surface temperatures identified in satellite images, consistent with erupting lava. Small explosions were recorded in infrasound data. The ACC was raised to Red and the VAL to Warning at 1204 after a pilot reported an ash plume that rose to 9.1 km altitude. Seismicity peaked at 1630 and began to rapidly decline at around 1730. Ash plumes rose as high as 10 km altitude and drifted as far as 400 km NE. By 2020 the ash plumes had declined to 6.4 km altitude and continued to drift NE. Ash emissions were visible in satellite data until 0000 on 26 August and seismicity was at low levels. AVO lowered the ACC to Orange and the VAL to Watch at 0030. Minor explosive activity within the summit crater was detected during 26-28 August and strongly elevated surface temperatures were still visible in satellite imagery through the rest of the month. An AVO field crew working on Unimak Island observed a mass flow that descended the upper flanks beginning around 1720 on 27 August. The flow produced a short-lived ash cloud that rose to 4.5 km altitude and rapidly dissipated. The mass flow was likely caused by the collapse of spatter that accumulated on the summit crater rim.
Similar variable explosive activity was reported in September, although weather observations sometimes prevented observations. A moderate resolution satellite image from the afternoon of 1 September showed gas-and-steam emissions filling the summit crater and obscuring views of the vent. In addition, hot deposits from the previous 25-26 August explosive event were visible on the NE flank near the summit, based on a 1 September satellite image. On 2 and 4 September seismic and infrasound data showed signals of small, repetitive explosions. Variable gas-and-steam emissions from the summit were visible but there was no evidence of ash. Possible summit crater incandescence was visible in nighttime webcam images during 3-4 September.
Seismicity began to gradually increase at around 0300 on 5 September and activity escalated at around 0830. A pilot reported an ash plume that rose to 7.6 km altitude at 0842 and continued to rise as high as possibly 9.7 km altitude and drifted SSE based on satellite images (figure 47). The ACC was raised to Red and the VAL to Warning at 0900. In addition to strong tremor and sustained explosions, the eruption produced volcanic lightning that was detected by the WWLLN. Around 1100 seismicity decreased and satellite data confirmed that the altitude of the ash emissions had declined to 7.6 km altitude. By 1200 the lower-altitude portion of the ash plume had drifted 125 km E. Significant ash emissions ended by 1330 based on webcam images. The ACC was lowered to Orange and the VAL to Watch at 1440. Satellite images showed extensive pyroclastic debris flows on most of the flanks that extended 1.2-3.3 km from the crater rim.
During 6-13 September elevated surface temperatures continued to be observed in satellite data, seismicity remained elevated with weak but steady tremor, and small, low-frequency earthquakes and small explosions were reported, except on 12 September. On 6 September a low-level ash plume rose to 1.5-1.8 km altitude and drifted SSE. Occasional small and diffuse gas-and-steam emissions at the summit were visible in webcam images. Around 1800 on 13 September seismic tremor amplitudes began to increase, and small explosions were detected in seismic and infrasound data. Incandescent lava at the summit was seen in a webcam image taken at 0134 on 14 September during a period of elevated tremor. No ash emissions were reported during the period of elevated seismicity. Lava fountaining began around 0200, based on webcam images. Satellite-based radar observations showed that the lava fountaining activity led to the growth of a cone in the summit crater, which refilled most of the crater. By 0730 seismicity significantly declined and remained at low levels.
Seismic tremor began to increase around 0900 on 15 September and rapidly intensified. An explosive eruption began at around 1710, which prompted AVO to raise the ACC to Red and the VAL to Warning. Within about 30 minutes ash plumes drifted E below a weather cloud at 8.2 km altitude. The National Weather Service estimated that an ash-rich plume rose as high as 12.8 km altitude and produced volcanic lightning. The upper part of the ash plume detached from the vent around 1830 and drifted E, and was observed over the Gulf of Alaska. Around the same time, seismicity dramatically decreased. Trace ashfall was reported in the community of False Pass (38 km ENE) between 1800-2030 and also in King Cove and nearby marine waters. Activity declined at around 1830 although seismicity remained elevated, ash emissions, and ashfall continued until 2100. Lightning was again detected beginning around 1930, which suggested that ash emissions continued. Ongoing explosions were detected in infrasound data, at a lower level than during the most energetic phase of this event. Lightning was last detected at 2048. By 2124 the intensity of the eruption had decreased, and ash emissions were likely rising to less than 6.7 km altitude. Seismicity returned to pre-eruption levels. On 16 September the ACC was lowered to Orange and the VAL to Watch at 1244; the sulfur dioxide plume that was emitted from the previous eruption event was still visible over the northern Pacific Ocean. Elevated surface temperatures, gas-and-steam emissions from the vent, and new, small lahars were reported on the upper flanks based on satellite and webcam images. Minor deposits were reported on the flanks which were likely the result of collapse of previously accumulated lava near the summit crater.
Elevated seismicity with tremor, small earthquakes, and elevated surface temperatures were detected during 17-23 September. Minor gas-and-steam emissions were visible in webcam images. On 20 September small volcanic debris flows were reported on the upper flanks. On 21 September a small ash deposit was observed on the upper flanks extending to the NE based on webcam images. Seismic tremor increased significantly during 22-23 September. Regional infrasound sensors suggested that low-level eruptive activity was occurring within the summit crater by around 1800 on 23 September. Even though seismicity was at high levels, strongly elevated surface temperatures indicating lava at the surface were absent and no ash emissions were detected; weather clouds at 0.6-4.6 km altitude obscured views. At 0025 on 24 September AVO noted that seismicity continued at high levels and nearly continuous small infrasound signals began, likely from low-level eruptive activity. Strongly elevated surface temperatures were identified in satellite images by 0900 and persisted throughout the day; the higher temperatures along with infrasound and seismic data were consistent with lava erupting at the summit. Around 1700 similarly elevated surface temperatures were detected from the summit in satellite data, which suggested that more vigorous lava fountaining had started. Starting around 1800 low-level ash emissions rose to altitudes less than 4.6 km altitude and quickly dissipated.
Beginning at midnight on 25 September, a series of seismic signals consistent with volcanic flows were recorded on the N side of the volcano. A change in seismicity and infrasound signals occurred around 0535 and at 0540 a significant ash cloud formed and quickly reached 14 km altitude and drifted E along the Alaska Peninsula. The cloud generated at least 150 lightning strokes with thunder that could be heard by people in False Pass. Seismicity rapidly declined to near background levels around 0600. AVO increased the ACC to Red and the VAL to Warning at 0602. The ash cloud detached from the volcano at around 0700, rose to 11.6 km altitude, and drifted ESE. Trace to minor amounts of ashfall were reported by the communities of False Pass, King Cove, Cold Bay, and Sand Point around 0700. Ash emissions continued at lower altitudes of 6-7.6 km altitude at 0820. Small explosions at the vent area continued to be detected in infrasound data and likely represented low-level eruptive activity near the vent. Due to the significant decrease in seismicity and ash emissions the ACC was lowered to Orange and the VAL to Watch at 1234. Radar data showed significant collapses of the crater that occurred on 25 September. Satellite data also showed significant hot, degassing pyroclastic and lahar deposits on all flanks, including more extensive flows on the ENE and WSW sections below two new collapse scarps. Following the significant activity during 24-25 September, only low-level activity was observed. Seismicity decreased notably near the end of the strong activity on 25 September and continued to decrease through the end of the month, though tremor and small earthquakes were still reported. No explosive activity was detected in infrasound data through 2 October. Gas-and-steam emissions rose to 3.7 km altitude, as reported by pilots and seen in satellite images. Satellite data from 26 September showed that significant collapses had occurred at the summit crater and hot, steaming deposits from pyroclastic flows and lahars were present on all the flanks, particularly to the ENE and WSW. A small ash cloud was visible in webcam images on 27 September, likely from a collapse at the summit cone. High elevated surface temperatures were observed in satellite imagery during 27-28 September, which were likely the result of hot deposits on the flanks erupted on 25 September. Minor steaming at the summit crater and from an area on the upper flanks was visible in webcam images on 28 September.
During October, explosion events continued between periods of low activity. Seismicity significantly increased starting at around 2100 on 2 October; around the same time satellite images showed an increase in surface temperatures consistent with lava fountaining. Small, hot avalanches of rock and lava descended an unspecified flank. In addition, a distinct increase in infrasound, seismicity, and lightning detections was followed by an ash plume that rose to 12.2 km altitude and drifted S and E at 0520 on 3 October, based on satellite images. Nighttime webcam images showed incandescence due to lava fountaining at the summit and pyroclastic flows descending the NE flank. AVO reported that a notable explosive eruption started at 0547 and lasted until 0900 on 3 October, which prompted a rise in the ACC to Red and the VAL to Warning. Subsequent ash plumes rose to 6-7.6 km altitude by 0931. At 1036 the ACC was lowered back to Orange and the VAL to Watch since both seismic and infrasound data quieted substantially and were slightly above background levels. Gas-and-steam emissions were observed at the summit, based on webcam images. Trace amounts of ashfall were observed in Cold Bay. Resuspended ash was present at several kilometers altitude near the volcano. During the afternoon, low-level ash plumes were visible at the flanks, which appeared to be largely generated by rock avalanches off the summit crater following the explosive activity. These ash plumes rose to 3 km altitude and drifted W. Trace amounts of ashfall were reported by observers in Cold Bay and Unalaska and flights to these communities were disrupted by the ash cloud. Satellite images taken after the eruption showed evidence of pyroclastic flows and lahar deposits in drainages 2 km down the SW flank and about 3.2 km down the NE flank, and continued erosion of the crater rim. Small explosion craters at the end of the pyroclastic flows on the NE flank were noted for the first time, which may have resulted from gas-and-steam explosions when hot deposits interact with underlying ice.
During 4 October seismicity, including frequent small earthquakes, remained elevated, but was gradually declining. Ash plumes were produced for over eight hours until around 1400 that rose to below 3.7 km altitude. These ash plumes were primarily generated off the sides of the volcano where hot rock avalanches from the crater rim had entered drainages to the SW and NE. Two explosion craters were observed at the base of the NE deposits about 3.2 km from the crater rim. Webcam images showed the explosion craters were a source of persistent ash emissions; occasional collapse events also generated ash. Seismicity remained elevated with sulfur dioxide emissions that had a daily average of more than 1,000 tons per day, and frequent small earthquakes through the end of the month. Frequent elevated surface temperatures were identified in satellite images and gas-and-steam plumes were observed in webcam images, although weather conditions occasionally prevented clear views of the summit. Emissions were robust during 14-16 October and were likely generated by the interaction of hot material and snow and ice. During the afternoon of 21 October a strong gas-and-steam plume rose to 3-4.6 km altitude and extended 40 km WSW, based on satellite images and reports from pilots. On 31 October the ACC was lowered to Yellow and the VAL was lowered to Advisory.
Activity in November was characterized by elevated seismicity with ongoing seismic tremor and small, low-frequency earthquakes, elevated surface temperatures, and gas-and-steam emissions. There was an increase in seismic and infrasound tremor amplitudes starting at 1940 on 2 November. As a result, the ACC was again raised to Orange and the VAL was increased to Watch, although ash was not identified in satellite data. An ash cloud rose to 6.1 km altitude and drifted W according to satellite data at 2000. By 0831 on 3 November ash emissions were no longer visible in satellite images. On 6 and 9 November air pressure sensors detected signals consistent with small explosions. Small explosions were detected in infrasound data consistent with weak Strombolian activity on 19 and 21 November. Seismicity started to decrease on 21 November. On 25 November gas-and-steam emissions were emitted from the vent as well as from a scarp on the NE side of the volcano near the summit. A gas-and-steam plume extended about 50 km SSE and was observed in satellite and webcam images on 26 November. On 28 November small explosions were observed in seismic and local infrasound data and gas-and-steam emissions were visible from the summit and from the upper NE collapse scarp based on webcam images. Possible small explosions were observed in infrasound data on 30 November. Weakly elevated surface temperatures and a persistent gas-and-steam plume from the summit and collapse scarps on the upper flanks. A passing aircraft reported the gas-and-steam plume rose to 3-3.4 km altitude on 30 November, but no significant ash emissions were detected.
Satellite data. MODIS thermal anomaly data provided through MIROVA (Middle InfraRed Observation of Volcanic Activity) showed a strong pulse of thermal activity beginning in July 2023 that continued through November 2023 (figure 48). This strong activity was due to Strombolian explosions and lava fountaining events at the summit crater. According to data from MODVOLC thermal alerts, a total of 101 hotspots were detected near the summit crater in July (11-14, 16-19, 23-24 and 26), August (4, 25-26, and 29), September (5, 12, and 17), and October (3, 4, and 8). Infrared satellite data showed large lava flows descending primarily the northern and SE flanks during the reporting period (figure 49). Sulfur dioxide plumes often exceeded two Dobson Units (DUs) and drifted in different directions throughout the reporting period, based on satellite data from the TROPOMI instrument on the Sentinel-5P satellite (figure 50).
Geologic Background. The symmetrical glacier-covered Shishaldin in the Aleutian Islands is the westernmost of three large stratovolcanoes in the eastern half of Unimak Island. The Aleuts named the volcano Sisquk, meaning "mountain which points the way when I am lost." Constructed atop an older glacially dissected edifice, it is largely basaltic in composition. Remnants of an older edifice are exposed on the W and NE sides at 1,500-1,800 m elevation. There are over two dozen pyroclastic cones on its NW flank, which is covered by massive aa lava flows. Frequent explosive activity, primarily consisting of Strombolian ash eruptions from the small summit crater, but sometimes producing lava flows, has been recorded since the 18th century. A steam plume often rises from the summit crater.
Information Contacts: Alaska Volcano Observatory (AVO), a cooperative program of a) U.S. Geological Survey, 4200 University Drive, Anchorage, AK 99508-4667 USA (URL: https://avo.alaska.edu/), b) Geophysical Institute, University of Alaska, PO Box 757320, Fairbanks, AK 99775-7320, USA, and c) Alaska Division of Geological & Geophysical Surveys, 794 University Ave., Suite 200, Fairbanks, AK 99709, USA (URL: http://dggs.alaska.gov/); MIROVA (Middle InfraRed Observation of Volcanic Activity), a collaborative project between the Universities of Turin and Florence (Italy) supported by the Centre for Volcanic Risk of the Italian Civil Protection Department (URL: http://www.mirovaweb.it/); Hawai'i Institute of Geophysics and Planetology (HIGP) - MODVOLC Thermal Alerts System, School of Ocean and Earth Science and Technology (SOEST), Univ. of Hawai'i, 2525 Correa Road, Honolulu, HI 96822, USA (URL: http://modis.higp.hawaii.edu/); NASA Global Sulfur Dioxide Monitoring Page, Atmospheric Chemistry and Dynamics Laboratory, NASA Goddard Space Flight Center (NASA/GSFC), 8800 Greenbelt Road, Goddard, Maryland, USA (URL: https://so2.gsfc.nasa.gov/); Copernicus Browser, Copernicus Data Space Ecosystem, European Space Agency (URL: https://dataspace.copernicus.eu/browser/).
Ioto
Japan
24.751°N, 141.289°E; summit elev. 169 m
All times are local (unless otherwise noted)
New eruption with discolored water, ejecta, and floating pumice during October-December 2023
Ioto (Iwo-jima), located about 1,200 km S of Tokyo, lies within a 9-km-wide submarine caldera along the Izu-Bonin-Mariana volcanic arc. Previous eruptions date back to 1889 and have consisted of dominantly phreatic explosions, pumice deposits during 2001, and discolored water. A submarine eruption during July through December 2022 was characterized by discolored water, pumice deposits, and gas emissions (BGVN 48:01). This report covers a new eruption during October through December 2023, which consisted of explosions, black ejecta, discolored water, and floating pumice, based on information from the Japan Meteorological Association (JMA), the Japan Coast Guard (JCG), and satellite data.
JMA reported that an eruption had been occurring offshore of Okinahama on the SE side of the island since 21 October, which was characterized by volcanic tremor, according to the Japan Maritime Self-Defense Force (JMSDF) Iwo Jima Air Base (figure 22). According to an 18 October satellite image a plume of discolored water at the site of this new eruption extended NE (figure 23). During an overflight conducted on 30 October, a vent was identified about 1 km off the coast of Okinahama. Observers recorded explosions every few minutes that ejected dark material about 20 m above the ocean and as high as 150 m. Ejecta from the vent formed a black-colored island about 100 m in diameter, according to observations conducted from the air by the Earthquake Research Institute of the University of Tokyo in cooperation with the Mainichi newspaper (figure 24). Occasionally, large boulders measuring more than several meters in size were also ejected. Observations from the Advanced Land Observing Satellite Daichi-2 and Sentinel-2 satellite images also confirmed the formation of this island (figure 23). Brown discolored water and floating pumice were present surrounding the island.
The eruption continued during November. During an overflight on 3 November observers photographed the island and noted that material was ejected 169 m high, according to a news source. Explosions gradually became shorter, and, by the 3rd, they occurred every few seconds; dark and incandescent material were ejected about 800 m above the vent. On 4 November eruptions were accompanied by explosive sounds. Floating, brown-colored pumice was present in the water surrounding the island. There was a brief increase in the number of volcanic earthquakes during 8-14 November and 24-25 November. The eruption temporarily paused during 9-11 November and by 12 November eruptions resumed to the W of the island. On 10 November dark brown-to-dark yellow-green discolored water and a small amount of black floating material was observed (figure 25). A small eruption was reported on 18 November off the NE coast of the island, accompanied by white gas-and-steam plumes (figure 23). Another pause was recorded during 17-19 November, which then resumed on 20 November and continued erupting intermittently. According to a field survey conducted by the National Institute for Disaster Prevention Science and Technology on 19 November, a 30-m diameter crater was visible on the NE coast where landslides, hot water, and gray volcanic ash containing clay have occurred and been distributed previously. Erupted blocks about 10 cm in diameter were distributed about 90-120 m from the crater. JCG made observations during an overflight on 23 November and reported a phreatomagmatic eruption. Explosions at the main vent generated dark gas-and-ash plumes that rose to 200 m altitude and ejected large blocks that landed on the island and in the ocean (figure 26). Discolored water also surrounded the island. The size of the new island had grown to 450 m N-S x 200 m E-W by 23 November, according to JCG.
The eruption continued through 11 December, followed by a brief pause in activity, which then resumed on 31 December, according to JMA. Intermittent explosions produced 100-m-high black plumes at intervals of several minutes to 30 minutes during 1-10 December. Overflights were conducted on 4 and 15 December and reported that the water surrounding the new island was discolored to dark brown-to-dark yellow-green (figure 27). No floating material was reported during this time. In comparison to the observations made on 23 November, the new land had extended N and part of it had eroded away. In addition, analysis by the Geospatial Information Authority of Japan using SAR data from Daichi-2 also confirmed that the area of the new island continued to decrease between 4 and 15 December. Ejected material combined with wave erosion transformed the island into a “J” shape, 500-m-long and with the curved part about 200 m offshore of Ioto. The island was covered with brown ash and blocks, and the surrounding water was discolored to greenish-brown and contained an area of floating pumice. JCG reported from an overflight on 4 December that volcanic ash-like material found around the S vent on the NE part of the island was newly deposited since 10 November (figure 28). By 15 December the N part of the “J” shaped island had separated and migrated N, connecting to the Okinahama coast and the curved part of the “J” had eroded into two smaller islands (figure 27).
References. Ukawa, M., Fujita, E., Kobayashi, T., 2002, Recent volcanic activity of Iwo Jima and the 2001 eruption, Monthly Chikyu, Extra No. 39, 157-164.
Geologic Background. Ioto, in the Volcano Islands of Japan, lies within a 9-km-wide submarine caldera. The volcano is also known as Ogasawara-Iojima to distinguish it from several other "Sulfur Island" volcanoes in Japan. The triangular, low-elevation, 8-km-long island narrows toward its SW tip and has produced trachyandesitic and trachytic rocks that are more alkalic than those of other volcanoes in this arc. The island has undergone uplift for at least the past 700 years, accompanying resurgent doming of the caldera; a shoreline landed upon by Captain Cook's surveying crew in 1779 is now 40 m above sea level. The Motoyama plateau on the NE half of the island consists of submarine tuffs overlain by coral deposits and forms the island's high point. Many fumaroles are oriented along a NE-SW zone cutting through Motoyama. Numerous recorded phreatic eruptions, many from vents on the W and NW sides of the island, have accompanied the uplift.
Information Contacts: Japan Meteorological Agency (JMA), 1-3-4 Otemachi, Chiyoda-ku, Tokyo 100-8122, Japan (URL: http://www.jma.go.jp/jma/indexe.html); Japan Coast Guard (JCG) Volcano Database, Hydrographic and Oceanographic Department, 3-1-1, Kasumigaseki, Chiyoda-ku, Tokyo 100-8932, Japan (URL: https://www1.kaiho.mlit.go.jp/GIJUTSUKOKUSAI/kaiikiDB/kaiyo22-2.htm); Copernicus Browser, Copernicus Data Space Ecosystem, European Space Agency (URL: https://dataspace.copernicus.eu/browser/); Asahi, 5-3-2, Tsukiji, Chuo Ward, Tokyo, 104-8011, Japan (URL: https://www.asahi.com/ajw/articles/15048458).
Search Bulletin Archive by Publication Date
Select a month and year from the drop-downs and click "Show Issue" to have that issue displayed in this tab.
The default month and year is the latest issue available.
Bulletin of the Global Volcanism Network - Volume 39, Number 05 (May 2014)
Kilauea (United States)
During 2013, a summit lava lake and lava flows on slopes and into ocean
Nabro (Eritrea)
Thermal alerts ended mid-2012; revised 2011 plume heights; uplift mechanisms debated
Pacaya (Guatemala)
Sudden, bomb-laden explosions of 27-28 May 2010; extra-crater lava flows
Kilauea (United States) — May 2014 Cite this Report
Kilauea
United States
19.421°N, 155.287°W; summit elev. 1222 m
All times are local (unless otherwise noted)
During 2013, a summit lava lake and lava flows on slopes and into ocean
This report summarizes observations and monitoring data from Kīlauea during January-December 2013; activity during 2010-12 was covered in BGVN 38:05. The primary reporting source was the U.S. Geological Survey-Hawaiian Volcano Observatory (HVO) which provided monitoring and communication resources for the Hawaiian volcanoes, namely Kīlauea, Mauna Loa, Mauna Kea, Hualalai, and Lo`ihi.
2013 Overview. During 2013, Kīlauea's summit lava lake persisted , and lava flows erupted from Pu'u 'O'o. Two minor ocean entries were visible during the year until mid-July; both were branches of the Peace Day flow while, later in the year, two lava flows (Kahauale'a 1 and Kahauale'a 2) extended N-NE from Pu'u 'O'o. Both lava flows crossed into the nearby forest, causing fires and significant smoke along their margins. Petrology of the summit tephra and East Rift Zone (ERZ) did not show significant changes during the year. SO2 emissions from both, the summit and the active ERZ were closely monitored by HVO and those observations led to new innovations in quantifying the flux. HVO reported that SO2 and also CO2 fluxes were relatively low but still above safe levels as established by the Centers for Disease Control and Prevention. Flank deformation and seismic monitoring determined that, although variable conditions were detected, very little accumulated change had occurred at Kīlauea.
Due to the Federal shutdown during 1-16 October 2013, HVO focused on only the most critical operations. Activities that were not directly related to critical operations were postponed, including research and outreach.
One such outreach opportunity that became curtailed was the first Great ShakeOut for Hawai`i which took place on 17 October 2013 and included almost 16,000 participants across all of the islands. This was a large-scale earthquake drill that followed in the tradition of The Great Southern California ShakeOut, which took place in 2008. HVO partnered with the State and County Civil Defense, Center for the Study of Active Volcanoes (CSAV), National Oceanic and Atmospheric Administration (NOAA), University of Hawai`i (UH-Hilo), American Red Cross, and FEMA. HVO staff generated a significant amount of information for the media including several press releases and web content; they also attended preparedness fairs and gave public talks.
Persistent thermal anomalies during 2013. More than 200 alerts per month were released by the MODVOLC program during 2013 for the Big Island of Hawai`i (figure 211). These alerts came from sites around the island that exhibited elevated radiance and were dominated by Pu'u 'O'o and the Kīlauea summit. One exceptional thermal anomaly was a site along the Mamalahoa Highway (Highway 190) in the NW sector of the island. News sources reported that, during 25-26 November 2013, a significant brushfire burned 300 acres in South Kohala. The burn site was near the highway mile marker 14 and caused segments of the highway to close while emergency crews contained the fire.
Summit lava lake activity. "Now in its sixth year, the current summit eruption harks back to the persistent lava lake in Halema`uma`u during the 1800s and early 1900s, suggesting that it has the potential to last for many years" (Patrick and others, 2013). Based on Hawai`i's written record, one earlier summit lava lake occupied Halema`uma`u during 1823-1924.
During 2013, the summit lava lake within the Overlook crater, a nested crater within Halema`uma`u, fluctuated in height, by tens of meters, resulting in perched lava deposits (bathtub rings) and collapse of the crater walls. The crater englarged slightly as a result.
Also, observers frequently noted nighttime incandescence (figure 212). Local webcameras (infrared and visible-light) captured images of the lava lake from the Halema`uma`u Overlook site as well as from the highest point of the HVO facility.
The HT infrared camera occasionally documented crater rim collapse events in 2013. These events were relatively small-sized and tended to occur more frequently when the lava lake level was relatively deep within the Overlook crater (for example, a small collapse occurred when the lava lake was at a depth of ~75 m during 25-26 July 2013). When the lava lake was high, however, the interior walls were subjected to heating and cracking and HVO scientists concluded that collapse events could be triggered during these conditions as well. One collapse event, on 15 November 2013, was likely triggered by slumping due to heavy rain; several Park Rangers observed the event and the collapse was heard by an HVO scientist standing at the Jaggar Overlook (the same location shared with HVO on the crater rim).
A crust of lava had formed an inner rim within the Overlook crater and, on 25 July at 2033, a portion of that rim collapsed into the lava lake (figure 213). The main event was followed by smaller collapses of the deep inner ledge during the following day. Based on webcamera images, explosive events were not triggered by the collapse. HVO reported that, since the formation of the lava lake (March 2008), the largest gas-and-ash emissions from the summit were triggered by gravitational collapses along the crater rim; when rockfalls hit the convecting lava's surface, violent gas release could occur.
According to HVO, the lava lake level within the Overlook crater generally fluctuated 30-60 m below the rim during 2013. A laser rangefinder was used to obtain regular measurements during the year. Lava was closest to the rim and flooded part of the inner ledge of the crater in January 2013 (an event that also occurred in October 2012). Lava at the flooded lake's margin chilled and reinforced the bathtub-like ring that persisted above the active lava surface (note the "inner rim" in figure 213). In daily online reports, HVO noted: "The lake level responds to summit tilt changes with the lake generally receding during deflation and rising during inflation."
Starting in 2009, HVO scientists noted rise/fall events and determined that the pattern began with decreasing tremor from the summit at a time when lava rose within the lake, spattering would decrease or completely stop, and summit tilt would also decrease. "After a period of minutes to hours, the lava will abruptly drain back to its previous level amidst resumed vigorous spattering, seismic tremor amplitude will increase for a short time (a seismic tremor burst) before resuming background levels, and summit tilt will return to its previous level. Gas emissions decrease significantly during the high lava stand (the plume gets wispy), and resume during its draining phase. Taken together, the geophysical characteristics suggest that, during the high lava stand, lava is puffed up with gas trapped under the lava lake crust."
During 2013, explosive events at the summit rarely occurred; intermittent spattering and degassing dominated summit activity. The plume from the vent continued to deposit variable amounts of ash, spatter, and Pele's hair onto nearby areas, particularly downwind of the crater (figure 214). The Overlook crater diameter was 35 m in March 2008 and, by the end of 2013, the dimensions had increased to 160 x 215 m. The size increase followed minor explosions and rockfalls from the interior crater walls.
Kīlauea's Overlook crater lava lake produced a small explosion during 2148-2149 on 23 August 2013 (figure 215). A portion of the overhanging SE crater rim collapsed and struck the surface of the lava lake. The debris had fallen into an area where nearly persistent spattering had previously been observed. The ensuing explosion generated a plume containing ash, lapilli, bombs (up to 34 cm in diameter), and lithics (ash, lapilli, and blocks up to 10 cm in diameter). The plume deposited material across the Overlook area. The level of the lava lake had been measured as ~38 m below the rim of Halema`uma`u crater earlier that day. Normal conditions prevailed after visibility returned within the camera's field of view at ~2149.
Pu'u 'O'o and East Rift Zone lava flows. The Pu'u 'O'o eruption consisted of three lava flows during 2013: the Peace Day, Kahauale'a, and Kahauale'a 2 flows (figure 216). The Kahauale'a flows were unique in that they traveled N of the rift zone, unlike the numerous other lava flows that have spread generally toward the ocean (including the Peace Day flow) (figure 217). This activity was considered the continuation of Episode 61, which began on 20 August 2011 and continued through the end of this reporting period (December 2013).
The morphology of Pu'u 'O'o crater was relatively stable through 2013. The crater remained very shallow and at or near the level of the original E spillway rim (figure 216). There were four spatter cones, all consistently active and often exhibiting incandescent openings at their tops (figure 218). These cones also emitted gas-jetting sounds and occasional, effusive spattering. The main center of activity through the year was the NE spatter cone. This cone often hosted a small lava pond and served as the vent for the Kahauale'a and Kahauale'a 2 flows.
In late 2012, Pu'u 'O'o crater was slowly infilling, and by the beginning of 2013, lava from the NE spatter cone reached the E spillway rim. A dramatic inflation event in mid-January triggered numerous overflows from the NE spatter cone, and the SE cone spread more lava across the crater floor but also sent flows over the E spillway. On 19 January, an overflow from the NE spatter cone sent lava down the E spillway in what would become the Kahauale'a flow. Over the next month, overflows from the cone covered much of the E spillway. Inflation in late April correlated with abundant venting and more overflows from four cones on the crater floor, with some spilling out toward the E, adding to the recent flows mantling the upper E flank of Pu'u 'O'o (figure 219). After the Kahauale'a flow eventually stalled in April, overflows in early May from the NE spatter cone fed a new flow, following the same course; this became the Kahauale'a 2 flow. Small overflows occurred sporadically from the cones through the remainder of the year, with larger events in mid-August and mid-November.
Coastal plain lava flows and ocean entries. The Peace Day flow (episode 61b) began on 21 September 2011, and it was active for much of 2013 before ceasing in November 2013. This lava flow reached the sea and generated scattered, branching flows (breakouts) on the coastal plain, as well as several isolated breakouts above the pali (fault scarp).
The ocean entry consisted of two main entry points during 2013, with an E entry at Kupapa`u (just E of the Park boundary) and a smaller, weaker entry immediately to its W (within the Park). These entry points were not vigorous; there were little-to-no-observed littoral explosions; a delta formed that extended several meters out from the sea cliff (figure 220 A).The view from the E margin of the Peace Day flow field on the sea cliff was relatively good, and the ocean entry provided a destination for guide services (not all sanctioned) operating out of Kalapana (numerous, possibly over 100 tourists made the hour-long walk out to the site each evening). As activity on the coastal plain declined in the summer, the W entry shut down in mid-July; the E entry ceased on 21 August.
Most of the Peace Day flow activity during 2013 was constrained to the coastal plain. From January through August, the coastal plain featured episodic of breakouts near the base of the pali in Royal Gardens. Those branches from the main flow slowly migrated toward the ocean before halting on the coastal plain (figure 220 B). Eventually, another breakout occurred at the base of the pali and sent out another flow that presumably drained supply from the previous flow. The new flow reached the location of the stagnating previous flow, and the flows became an indistinguishable mix of small, scattered breakouts in the middle of the coastal plain (figure 221). Minor, scattered breakouts were common on the coastal plain during January-August. Activity levels declined by August, the ocean entry diminished, and the last coastal plain flows ended around 8 September. With no ocean entry or surface flows, the coastal plain (and Kalapana-based lava tourism) became quiet again.
Lava flow activity above the pali. From mid-January to the end of May 2013, a large amount of lava escaped the Peace Day tube to create a divergent flow above Royal Gardens. It did not advance very far until April, when it crept slowly downslope into the upper reaches of Royal Gardens. This breakout flow ceased on 30 May. As the coastal plain breakouts progressively decreased during September, two small flows appeared above the pali, presumably resulting from the abandonment of the lower Peace Day lava tube. The smaller of the two breakouts was at the top of Royal Gardens, about 6 km from Pu'u 'O'o, and appeared to start between 7 and 14 September but was inactive by mid-October (timing was determined in large part by satellite images as opposed to direct observation). This small breakout flow was visible from the Kalapana lava-viewing area.
The larger of the two breakouts began around 5 September and was about 3 km SE of Pu'u 'O'o, advancing a little over a kilometer before stalling. This breakout was active until 7 November, when it and the rest of the Peace Day flow stalled. This wasn't the end, however, and the Peace Day flow gasped a final breath when a very small, brief breakout occurred on the upper Peace Day lava tube, near Pu'u Halulu, on 15 November. It was probably active for only minutes or hours and marked the end of the Peace Day flow.
The Kahauale'a flow (episode 61c) began as an overflow from the NE spatter cone on 19 January 2013, occurring simultaneously as Kīlauea inflated. It advanced down the NE flank of Pu'u 'O'o, N of the Peace Day tube, until it hit flat topography N of the cone where it developed a lava tube and covered early Pu'u 'O'o 'a'a flows. The flow consisted of scattered pahoehoe lobes, and these migrated slowly (~50 m/day) E toward Kahauale'a cone, reaching it in mid-February (figure 222). From there, it followed the N margin of an earlier flow emplaced during the episode 58 flow. The path of this new flow abutted the steep northern slope of the 2007-2008 perched lava channel. This confinement led to a narrowing of the advancing flow front, resulting in increased advance rates (>100 m/day) in early March. As the front passed the perched channel, it became less confined, and advance rates dropped to under 50 m/day. By the first week of April, the flow had reached 4.9 km from the vent on Pu'u 'O'o but ceased on 17 April during a deflation-inflation (DI) event (see figure 199 in Bulletin 38:02 where DI events are illustrated). Due to infrequent overflights by HVO scientists during 2013 (resulting from budget cuts), staff relied heavily on satellite images--particularly EO-1 Advanced Land Imager images--to track the advance of the flow.
HVO noted that the Kahauale'a flow was unusual in that the most recent flows from Pu'u 'O'o traveled S toward the ocean, providing minimal threat to residential areas. The Kahauale'a flow, however, was directed N of the rift zone, along a NE trend. This put the flow on a downslope trajectory that could have threatened residential areas of including Ainaloa and Paradise Park. HVO and Hawai'i County Civil Defense increased their communications through that time period but just a few weeks later, in mid-April, an abrupt change in magma supply occurred at Pu'u 'O'o and the flow ceased.
Inflation at Pu'u 'O'o produced another overflow from the NE spatter cone, which started on 6 May. This became the Kahauale'a 2 flow (episode 61d) and was directed slightly more to the N by the original Kahauale'a flow, reaching the forest boundary ~2 km NW of Pu'u 'O'o in early June. These flows invaded the forest a short distance and created steady forest fires. During July, the flow front took a more northeasterly course, following the N margin of the original Kahauale'a flow (figure 223). Its advance slowed during late July to mid-August, but during September the advance increased when the flow entered the previously mentioned narrow channel along the episode 58 perched lava channel.
By mid-October, Kahauale'a 2's narrow flow front had reached the distant forest boundary and surpassed the length of the original Kahauale'a flow. A narrow finger of lava forming the flow front advanced into the forest in mid-November, reaching just over 7 km distance from Pu'u 'O'o, before stalling soon after 20 November. Behind the flow front, branching flows began to migrate along a more northerly direction into the forest, triggering more fires. This area of breakouts soon turned NE, paralleling the narrow finger that had stalled in late November. By 26 December, the active flow front was 6.3 km NE of the vent and persisted into the New Year.
Petrology of the summit (Halema`uma`u) and rift (Pu`u `O`o) lavas. From 2013 to 2014, the juvenile component of Kīlauea's summit tephra remained essentially as it had during 2008-2013. The overall temporal variation of summit lava mimicked the MgO systematics of ERZ lava for the 2008-2014 interval, with summit glass compositions overlapping those of contemporaneous bulk ERZ lava but erupting 20° to 25°C hotter than at Pu'u 'O'o. There were no changes in trace-element signatures, which matched those of the East Rift Zone (ERZ) lava. Halema'uma'u vent tephra remained sparsely olivine and spinel phyric with ~2 volume percent of 100-300 μm, subhedral to euhedral olivine phenocrysts (typically with melt inclusions). Olivine in summit glasses was consistently complemented by >0.05 volume percent of chromian-spinel microphenocrysts.
2013 Pu'u 'O'o lava also did not show any significant petrologic changes. It contained a five-phase assemblage: olivine(-spinel)-augite-plagioclase-liquid. The assemblage was interpreted as the result of simultaneous growth and dissolution of phenocrysts, reflecting the modeled values for cooling, fractionation, and mixing in the shallow edifice prior to eruption. This multi-phyric condition (see figure 224 for photomicrograph examples from previous years), which had persisted in the steady-state ERZ lava for most of the last ~15 years, attested to a stable shallow magmatic condition perpetuated by near-continuous recharge and eruption.
SO2 emission rates. During 2013, HVO reported notable advances in measuring the dense, opaque summit SO2 plume. It was significant to note that the summit SO2 emission rates measured since 2008 represented a minimum constraint on emissions, whereas by the end of 2013 it was possible to determine a more accurate estimate of the amount of gas emitted from the Overlook crater. Because traditional gas measuring techniques are subject to multiple scattering effects from incoming radiation that can contribute to significant errors in the calculated SO2 emission rates, HVO scientists were pursued various approaches to achieve a more accurate emission rate.
HVO scientists addressed the issue of underestimation due to scattered light in two ways: (1) minimize and/or model the effects of scattering on the retrieved results and (2) measure farther away from the emission source where the plume is more dispersed and not as optically thick.
Using HVO's old metric for evaluating SO2 summit emissions, the total SO2 released in 2013 was first calculated as 266,000 metric tons. They had long recognized these value as among those that had persistently understated the true mass of SO2. To account for the summit emission rate underestimation, they used an initial preliminary correction. It was based on early Simulated Radiative Transfer- Differential Optical Absorption Spectroscopy (SRT-DOAS) values. This refinement increased the summit's traditional estimate 3-fold, yielding a summit total SO2 amount of ~800,000 metric tons for the year 2013.
HVO further reported a preliminary calculation of Kīlauea's 2013 summit emissions using their available Flyspec array data yielded ~1.0 x 10⁶ metric tons for 2013. This was judged more accurate value for the total summit SO2 release.
East rift zone (ERZ) emissions for 2013 continued at the low level recorded since mid-2012. Early in the year, SO2 emissions increased coincident with the occurrence of the Kahauale'a lava flow, but emissions stabilized several months later and continued at a low level for the balance of the year. Rift emissions were consistently less than those at the summit for 2013 totaled ~113,000 metric tons (using the refined methods mentioned above). This was ~20% less than reported in 2012, and the lowest amount recorded since the ERZ eruption began in 1983. The low SO2 emissions from the ERZ were at least partially due to degassing at the summit.
Summit CO2 emission rates. During 2013, CO2 emission rates remained at the relatively low level measured since approximately 2009 (figure 225). The continued absence of a strong CO2 signature in 2013 confirmed that the current summit activity reflects shallow reservoir processes rather than deeper ones. All CO2 measurements in 2013 were made with the Licor LI-6252 gas analyzer.
Quantifying summit and rift plume characteristics. In addition to emission-rate studies, HVO continued to monitor the summit and rift plumes using a variety of techniques, including multi-species sensor-based time-series measurements and open-path FTIR. In 2013, FTIR measurements of the summit plume reconfirmed the shallow nature of the degassing source, with plume chemistry characterized by low CO2, high SO2, high H2O, and significant HCl and HF (table 10). Measurements of the summit and rift plumes yielded similar chemistry, suggesting a common source for these gases. Also reconfirmed in 2013 were the previously observed short-term changes in gas chemistry correlating with behavior in Overlook crater.
Table 10. The composition of Kīlauea's summit plume for 2013 reported in moles and mole%. Courtesy of HVO.
| Gas species |
moles |
mole% |
| H2O |
1,117.98 |
88.23 |
| SO2 |
81.46 |
6.43 |
| CO2 |
64.69 |
5.11 |
| HCl |
1 |
0.08 |
| HF |
1.17 |
0.09 |
| CO |
0.84 |
0.07 |
| total moles |
1,267.14 |
100 |
Gas hazards. In 2013, the maximum ambient concentration of SO2 measured near the summit along Crater Rim Drive during traverses made with a car was 150 ppm, a value well above the IDLH (Immediately Dangerous to Life and Health) threshold. Concentrations measured inside the vehicle reached a maximum of 12 ppm. The inside-car levels were measured with all air-handling turned off, the operating conditions that minimize SO2 penetration into the vehicle. Fumarole sampling at the two locations on the rim of Halema'uma'u were subsequently paused during 2013 while shifting to alternative, less-hazardous measurement techniques.
HVO continued to operate the low-resolution SO2 sensor and rain collector network on Kapapala Ranch in 2013 (within 23 km SW of the summit). In general, maximum SO2 concentrations on the Ranch in 2013 were lower than in 2012. During the early years of the activity at the Overlook vent, the Ranch's livestock exhibited runny eyes, respiratory issues, weight loss, and tooth mottling and degradation (possibly indicating fluorosis). Additionally, fences and other metal infrastructure on the ranch had been deteriorating more rapidly than before the summit eruption began. New data showed SO2 one-minute values for 2013 (a single, one-second measurement per minute) up to 4 ppm. Hazard monitoring and communication with the ranch operators, veterinarians, and public health officials remained ongoing.
Ambient SO2 concentrations measured downwind of Halema'uma'u continued to reach very high levels (~150 ppm) along Crater Rim Drive near the Halema'uma'u parking lot, warranting continued caution along Crater Rim Drive in 2013. HVO scientists maintained communications with community groups and county, state, and federal agencies in order to relay the changing gas-hazard conditions associated with Kīlauea's ongoing eruptions.
In 2013, the National Park Service's (NPS) ambient air quality stations located at HVO and behind the Kīlauea Visitor Center continued to record periods of hazardous air quality resulting from the ongoing eruptions. The National Park continued to close the highly impacted areas of the park during poor air-quality episodes. Closing of park locations, including Kīlauea Visitor Center and Jaggar Museum, were based on the following criteria: a Visitor Center is closed when SO2 concentrations exceed 1 ppm for 6 consecutive 15-minute periods (1.5 hrs), 3 ppm for 3 consecutive 15-minute averages (45 minutes), or 5 ppm for one 15-minute average. NPS high-resolution SO2 analyzers located at the visitor centers operated in the extended 0-10 ppm range.
Flank deformation. The variable-rate inflation of Kīlauea that has been ongoing since 2010 continued through 2013. There were periods of slight deflation in March-May, late May, July-August, and September and November. The saw-tooth pattern created by the alternating inflation and deflation is most obvious in the distance change across the Halema'uma'u crater, but can also be seen in the tilt record at summit tiltmeters, such as at station UWE and subtly in the vertical changes at summit GPS sites (figure 226).
During 2013, there was a total of almost 10 cm of extension on the approximately 3.5-km baseline between UWEV and CRIM (figure 226 B) and about 10 microradians of inflationary tilt at UWE (figure 226 A). There was very little accumulated vertical change at the summit GPS sites over the year, however. This was also reflected in the lack of appreciable line-of-sight displacement in the interferograms from INSAR spanning 2013. There were 65 deflation-inflation (DI) events in 2013, similar to the rate of occurrence observed since the opening of the summit vent in 2008. Most of these were only weakly detected by the POC tiltmeter at Pu'u 'O'o.
At Pu'u 'O'o, the GPS site on the N rim (PUOC), recorded a fairly steady, slow rate of N-NW motion in 2013, with a slight acceleration in late April-early May. The direction of motion is usually indicative of inflation, but there was no appreciable uplift at the site. There was a net tilt of about 20 microradians to the NW at POC on the N flank, also usually indicative of inflation.
The pattern and velocity of GPS sites on the S flank of Kīlauea in 2013 were similar to the patterns and rates that have been observed in the recent past during times free of slow-slip events and ERZ intrusions.
Deformation monitoring equipment. Two continuous GPS sites (LEIA and SPIL) were lost to lava flows from Pu'u 'O'o in early 2013. After a data outage at the Malama Ki (MKI) tilt site on the lower ERZ in April, HVO discovered that thieves had dismantled the gate to the security enclosure and stolen everything except the actual tiltmeter. This had been part of a string of thefts at this site, forcing HVO to eventually abandon it. This was an unfortunate loss to the monitoring network, especially because the only other tiltmeter station on the lower ERZ, near Heiheiahulu (HEI) had also been stolen late during the previous year. In July, HVO installed a new tiltmeter in a less accessible location a few kilometers NW of Heiheiahulu.
Seismicity. In 2013, HVO's seismic network consisted of 57 real-time continuous stations (25 broadband, 21 strong-motion, 7 three-component short-period, and 25 vertical-component short-period instruments) (figure 227). The network coverage was most dense on and around Kīlauea. In 2013, HVO upgraded of the seismic network which involved installing the digital stations NAHU (to replace the analog station ESR) and TOUO (to replace analog station KII). They also established three arrays of infrasound sensors in order to better track acoustical waves in the air (infrasound) associated with volcanic processes.
Seismic activity at Kīlauea was generally low in 2013 compared to that of other time periods since the 2008 start of the summit eruption (figure 228). Tremor was a ubiquitous feature of the seismicity near the summit, with discrete very-long-period (VLP) and long-period (LP) events occurring sporadically. Tremor amplitudes appeared to modulate in conjunction with the presence or absence of spattering in the lava lake within Halema'uma'u. In general, increased seismicity in the S caldera and upper ERZ were coincident with rapid increased lava lake level and tilt. None of these swarms were remarkable in number or size compared to previous swarms, especially those in 2011 and 2012.
New interactive earthquake webpage launched. In October 2013, HVO launched a new interactive earthquake webpage, informally called Volcweb (USGS, 2013b). The new website used several new technologies that provided a better user-experience and a better compatibility with mobile devices. In addition to providing earthquake location information, the site also creates cross-sections, time-depth plots, cumulative number of earthquake plots, and cumulative magnitude plots for data up to a year old. Webicorders for all stations were available (updated every 10 minutes). The rollout of this website allowed HVO to retire the old "Recent Earthquakes" page.
References. Patrick, M., Orr, T., Sutton, A.J., Elias, T., and Swanson, D., 2013, The first five years of Kīlauea's summit eruption in Halema'uma'u crater, 2008-2013. Hawai`i National Park, HI: U.S. Geological Survey, Hawaiian Volcano Observatory, Fact Sheet 2013-3116.
Patrick, M.R., Orr, T., Antolik, L., Lee, L., and Kamibayashi, K., 2014, Continuous monitoring of Hawaiian volcanoes with thermal cameras, Journal of Applied Volcanology, 3:1.
Roeder, P.L., Thornber, C., Poustovetov, A., and Grant, A., 2003, Morphology and composition of spinel in Pu'u 'O'o lava (1996-1998), Kīlauea volcano, Hawaii. Journal of Volcanology and Geothermal Research, 123, 245-265.
USGS, 2013a (January). Earthquake Hazards Program, Netquakes: Map of Instruments. Retrieved from http://earthquake.usgs.gov/monitoring/netquakes/map/.
USGS, 2013b (December). Hawaiian Volcano Observatory, Recent Earthquakes in Hawaii. Retrieved from http://hvo.wr.usgs.gov/earthquakes/new.
Geologic Background. Kilauea overlaps the E flank of the massive Mauna Loa shield volcano in the island of Hawaii. Eruptions are prominent in Polynesian legends; written documentation since 1820 records frequent summit and flank lava flow eruptions interspersed with periods of long-term lava lake activity at Halemaumau crater in the summit caldera until 1924. The 3 x 5 km caldera was formed in several stages about 1,500 years ago and during the 18th century; eruptions have also originated from the lengthy East and Southwest rift zones, which extend to the ocean in both directions. About 90% of the surface of the basaltic shield volcano is formed of lava flows less than about 1,100 years old; 70% of the surface is younger than 600 years. The long-term eruption from the East rift zone between 1983 and 2018 produced lava flows covering more than 100 km2, destroyed hundreds of houses, and added new coastline.
Information Contacts: Hawaiian Volcano Observatory (HVO), U.S. Geological Survey, PO Box 51, Hawai`i National Park, HI 96718, USA (URL: https://volcanoes.usgs.gov/observatories/hvo/); Hawai`i Institute of Geophysics and Planetology (HIGP) Thermal Alerts System, School of Ocean and Earth Science and Technology (SOEST), Univ. of Hawai`i, 2525 Correa Road, Honolulu, HI 96822, USA (URL: http://modis.higp.hawaii.edu/); Hawaii 24/7 (URL: http://www.hawaii247.com); Great ShakeOut (URL: http://shakeout.org/hawaii/); and West Hawaii Today (URL: http://www.westhawaiitoday.com/).
Nabro
Eritrea
13.37°N, 41.7°E; summit elev. 2218 m
All times are local (unless otherwise noted)
Thermal alerts ended mid-2012; revised 2011 plume heights; uplift mechanisms debated
This report shows satellite thermal alerts from the MODVOLC system showing that they continued for 7 months after the end of coverage in our one report on Nabro's June 2011 eruption (BGVN 36:09), with the last alert occurring on 3 June 2012.
What has emerged regarding the 2011 Nabro eruption since our one previous report is a much more detailed eruptive timeline and some substantially taller plume-height estimates. These new and more carefully assessed details came out in at least eight papers and three technical comments (see References below).
The initial Toulouse Volcanic Ash Advisory Center estimates cited in BGVN 36:09 were made in the time-limited operational setting that identifies volcanic ash for aviation safety. Those altitude estimates, which included maximum plume heights on 13 June 2011 in the range of 9.1-13.7 km altitude, have since been reassessed using an array of satellite and ground-based instruments and processing strategies. The revised heights in the subsequent papers often determined plume altitudes above the 16-18 km tropopause and into the stratosphere. Absent in our earlier report but well documented in the papers was evidence of a 16 June 2011 eruptive pulse.
Overall, Nabro erupted a total SO2 mass of at ~1.5 Tg (Clarisse and others, 2012), making the eruption the largest SO2 emitter of the 2002-2012 interval (Bourassa and others, 2013). The various papers and the technical comments have also framed debate on how and when Nabro's plume entered stratosphere.
Thermal alerts. This report does not contain any new in situ observations at Nabro. Table 1 shows MODVOLC thermal alerts during November 2011 and into 2012 on the basis of the number of days with alerts in these months. Those alerts stem from observations made with the MODIS instrument that flies on the Terra and Aqua satellites. Our previous report discussed alerts as late as 5 November 2011, but additional alerts were issued later in the month. For this table, January 2012 was the month with the largest number of days with alerts, 15 days. As of late 2014, the last posted alert was issued on 3 June 2012.
Table 1. MODVOLC thermal alerts recorded for Nabro from November 2012 through September 2014. Courtesy of MODVOLC.
| Month |
Number of days with alerts |
| November 2011 |
11 |
| December 2011 |
08 |
| January 2012 |
15 |
| February 2012 |
12 |
| March 2012 |
07 |
| April 2012 |
11 |
| May 2012 |
11 |
| June 2012 |
01 |
Although the earlier alerts may signify ongoing eruption, some of the later alerts could stem from ongoing post-eruptive thermal radiance from potentially thick lava flows. Absence of alerts could be the result of clouds masking the volcano, although that is unlikely significant in the terminal alert registered in June 2012. It also bears noting that the alerts are at a fairly high threshold.
References. Bourassa, AE, Robock, A, Randel, WJ, Deshler, T, Rieger, LA, Lloyd, ND, Llewellyn, EJ, and Degenstein, DA, 2012, Large Volcanic Aerosol Load in the Stratosphere Linked to Asian Monsoon Transport. Science 337 (6090):78-81. DOI: 10.1126/science.1219371.
Bourassa, AE, Robock, A, Randel, WJ, Deshler, T, Rieger, LA, Lloyd, ND, Llewellyn, EJ, and Degenstein, DA, 2013, Response to Comments on "Large volcanic aerosol load in the stratosphere linked to Asian Monsoon transport. Science, 339 (6120), 647, DOI: 10.1126/science.1227961.
Clarisse, L., P.-F. Coheur, N. Theys, D. Hurtmans, and C. Clerbaux, 2014, The 2011 Nabro eruption, a SO2 plume height analysis using IASI measurements, Atmos. Chem. Phys., 14, 3095-3111,DOI:10.5194/acp-14-3095-2014.
Clarisse, L., Hurtmans, D., Clerbaux, C., Hadji-Lazaro, J., Ngadi, Y., & Coheur, P. F., 2012, Retrieval of sulphur dioxide from the infrared atmospheric sounding interferometer (IASI). Atmospheric Measurement Techniques Discussions, 4, 7241-7275 [13 March 2012; revised from 2011 version] www.atmos-meas-tech.net/5/581/2012/; DOI:10.5194/amt-5-581-2012.
Fairlie, T. D., Vernier, J.-P., Natarajan, M., and Bedka, K. M., 2014, Dispersion of the Nabro volcanic plume and its relation to the Asian summer monsoon, Atmos. Chem. Phys., 14, 7045-7057, DOI:10.5194/acp-14-7045-2014, 2014.
Fromm, M, Nedoluha, G, and Charvat, Z, 2013, Comment on "Large Volcanic Aerosol Load in the Stratosphere Linked to Asian Monsoon Transport." Science 339 (6120). DOI: 10.1126/science.1228605.
Fromm, M, Kablick, G (III), Nedoluha1, G., Carboni, E., Grainger, R., Campbell, J, and Lewis, J., 2014, Correcting the record of volcanic stratospheric aerosol impact: Nabro and Sarychev Peak, Journal of Geophysical Research. Atmospheres. [Early, online version, accessed August 2014] DOI: 10.1002/2014JD021507
Pan, LL, and Munchak, LA, 2011, Relationship of cloud top to the tropopause and jet structure from CALIPSO data. Journal of Geophysical Research: Atmospheres (1984-2012) 116.D12 (2011).
Penning de Vries, M. J. M., Dörner, S., Pukite, J., Hörmann, C., Fromm, M. D., & Wagner, T. (2014). Characterisation of a stratospheric sulfate plume from the Nabro volcano using a combination of passive satellite measurements in nadir and limb geometry. Atmospheric Chemistry and Physics, 14(15), 8149-8163.
Theys, N., Campion, R., Clarisse, L., Brenot, H., van Gent, J., Dils, B., Corradini, S., Merucci, L., Coheur, P.-F., Van Roozendael, M., Hurtmans, D., Clerbaux, C., Tait, S., and Ferrucci, F.: Volcanic SO2 fluxes derived from satellite data: a survey using OMI, GOME-2, IASI and MODIS, Atmos. Chem. Phys., 13, 5945-5968, doi:10.5194/acp-13-5945-2013, 2013.
Vernier, JP, Thomason, LW, Fairlie, TD, Minnis, P., Palikonda, R, and Bedka, K M, 2013. Comment on "Large Volcanic Aerosol Load in the Stratosphere Linked to Asian Monsoon Transport." Science 339 (6120). DOI: 10.1126/science.1227817.
Geologic Background. The Nabro stratovolcano is the highest volcano in the Danakil depression of northern Ethiopia and Eritrea, at the SE end of the Danakil Alps. Nabro, along with Mallahle, Asavyo, and Sork Ale volcanoes, collectively comprise the Bidu volcanic complex SW of Dubbi volcano. This complex stratovolcano constructed primarily of trachytic lava flows and pyroclastics, is truncated by nested calderas 8 and 5 km in diameter. The larger caldera is widely breached to the SW. Rhyolitic obsidian domes and basaltic lava flows were erupted inside the caldera and on its flanks. Some very recent lava flows were erupted from NNW-trending fissures transverse to the trend of the volcanic range.
Information Contacts: Hawai'i Institute of Geophysics and Planetology (HIGP) MODVOLC Thermal Alerts System, School of Ocean and Earth Science and Technology (SOEST), Univ. of Hawai'i, 2525 Correa Road, Honolulu, HI (URL: http://modis.higp.hawaii.edu/); and Toulouse Volcanic Ash Advisory Centre (VAAC) (URL: http://www.meteo.fr/vaac/).
Pacaya
Guatemala
14.382°N, 90.601°W; summit elev. 2569 m
All times are local (unless otherwise noted)
Sudden, bomb-laden explosions of 27-28 May 2010; extra-crater lava flows
Pacaya, which in recent years has consistently erupted olivine-bearing high alumina basaltic lavas, erupted with remarkable violence on both 27 and 28 May 2010 with an explosion on the 27th lasting ~45 minutes. This was followed by a smaller explosion the next day that generated a plume assessed from satellite and meteorological data as reaching 13 km altitude. In this report we describe those events as explosions in order to distinguish them from the ongoing, decades-long, and often effusive eruption generally seen at Pacaya. The terms 'explosion' and 'explosive' appear warranted given such factors as the suddenness of escalation, the ~13 km plume altitude (~10 km over the summit when measured during the weaker explosion on the 28th, the density of projectiles, and the scale of the tephra fall. The term explosion seems consistent with common practice (Sparks, 1986; Fiske and others, 2009).
The following report emphasizes Pacaya's behavior in 2010, including the 27 and 28 May explosions and impacts continuing into early June 2010. Our last report (BGVN 34:12) discussed behavior into mid-January 2010. Some of the reporting came from reports of Guatemalan agencies (eg. INSIVUMEH and CONRED, acronyms spelled out in the Information contacts section at bottom), newspapers (eg. Prense Libra, 2010a, b), videos and photos, and cited manuscripts and papers. It especially benefited from a draft manuscript prepared by Rüdiger Escobar Wolf (REW, 2014) and graciously provided to Bulletin editors. REW also provided reviews, insights, and numerous tailored graphics but bears no responsibility for possible errors induced by Bulletin editors.
The explosions were preceded months to weeks earlier by extra-crater venting of lava flows on the E and SE flanks. The lava flows covered substantial areas after emerging effusively at two widely spaced vents in atypical extra-crater or crater-margin locations.
Subsections address the following topics: (1) the Guatemalan hazard agency CONRED's reports, (2) a sample of available video and photo documentation of Pacaya's behavior, (3) events prior to the 27 May explosion, (4) the explosions and some of the impacts, (5) the seismic record showing the pattern of escalation around the time of the explosions, (6) a brief summary of the critical initial aviation reports, and (7) a geotechnical slope stability study that suggests gravitational instability at Pacaya, particularly owing to the cone's magma pressure and seismic loading.
Pacaya , which has a record of eruptions dating back over 1,600 years, has been erupting the majority of the time since 1961, often emitting rough-surfaced lavas but also occasionally discharging explosions. The centerpiece of the National Park of the same name, it is the most often climbed volcano in Guatemala. There have been 69 prior Smithsonian-published reports describing behavior from 1969 to early January 2010 (CSLP 03-70 to BGVN 34:12). REW (2013) ranked the 27 May explosions as sub-plinean and the associated lava emissions as the largest since similar events in 1961.
Figure 42 shows two simplified regional maps of Guatemala and neighboring countries including Mexico, Belize, Honduras, and El Salvador.
The larger tephra blanket spread N, covering an area of more than 1,000 km2 including the bulk of the Guatemala City metropolitan area, the largest city in Central America, population ~3.5 million. The City's center lies ~25 km NNE of Pacaya's summit but a 5-km-wide strip of urban and suburban development now stretches from its older core (red square, figure 42)to ~9 km N of the summit. The tephra shut down La Aurora, the county's primary international airport and among the region's busiest, for 5 consecutive days.
The 27 May 2010 explosion destroyed or damaged nearly 800 houses in nearby communities, forcing ~2,000 residents to evacuate and injuring 59 people. A high density of ballistics fell on nearby hamlets and villages, particularly those 2.5-3.5 km N of the MacKenny cone (El Cedro, San Francisco de Sales, and Calderas). The ballistics had sufficient mass and velocity to puncture roofs with a density on the order of one puncture per square meter in some places. Many more smaller ballistics bent but did not penetrate the corrugated sheet metal roofs common in many of the region's dwellings. Some of the ballistics were sufficiently hot to start fires.
Ash caused widespread damage locally, and up to ~8 cm of ash fell on parts of metropolitan Guatemala City, the nation's capital, centered ~35 km NNW of Pacaya. Up to 20 cm of tephra accumulated at and near Pacaya. According to available census data, the population within 10 km of Pacaya was 57,000 (John Ewert, USGS-CVO, personal communication).
Accounts from Guatemalan meteorological stations reported that detectable ash from the 2010 explosions fell as far away as the Caribbean coast. Brianna Hetland was both a graduate student in volcanology and a US Peace Corps Volunteer in Guatemala during 2010-2012. Hetland noted in a message that she had spoken with another Volunteer who said ash had blanketed his neighborhood near Coban (in Samac, Alta Verapaz) ~180 m N of Pacaya (figure 42, bottom). Hetland documented post-eruptive conditions at Pacaya, composed a blog on the impact and clean up, and gave a talk on those aspects as well as multifaceted monitoring conducted by fellow students and faculty at Michigan Technological University (Hetland, 2012a, b; Walikainen, 2010).
Some of the impacts of the freshly fallen ash were amplified and other impacts were diminished by heavy rains and flooding due to Tropical Storm Agatha that struck the region 2 days later, with some areas receiving 0.9 m of rain. The floodwater run carried ash that dislodged debris, clogged drainage systems, left thick deposits on valley floors, and damaged many bridges. The scale of the combined disasters led to more analysis of hardships, mitigation, and economic impact than usual at many eruptions, as exemplified by the detailed assessments by Wardman and others (2012). Those authors visited in the aftermath from New Zealand in order to study impacts that might be analogous to hazards elsewhere. They found that one moderating impact of the rain was to cee crops, which were washed clean of ash and residual acids. The authors also found that that a prompt and efficient cleanup was initiated by the Capital municipality to remove tephra from the 2,100 km of roads in the Capital. An estimated 11,350,000 m3 of tephra was removed from the city's roads and rooftops.
Diminishing strombolian activity and lava flows in the crater area continued into at least late June 2010. By this time the emissions had become more like the generally effusive decades-long eruption, which was still ongoing when this was written in late 2014. In addition to the information here, Pacaya's discharge rates have been summarized for the years 2004-2010 on the basis of infrared satellite images (Morgan and others, 2013). As would be expected, a strong peak in radiance developed in late May 2010.
REW (2013) noted one death attributed to the explosion and tephra fall and 179 deaths attributed to the Tropical Storm. Two people died at Pacaya days prior to the explosion of 27 May 2010. Wardman and others (2013) mentioned two further deaths due to people cleaning tephra from roofs.
Geochemical analysis of material erupted on 27 and 28 May is not yet reported. As background, Matías and others (2012) describe Pacaya's recent lavas as all high-alumina basalts with SiO2 contents of 50-52.5 weight percent and MgO contents of 3-5 weight percent. Common phynocrysts (visible minerals) included plagioclase, olivine, and opaque minerals (Conway, 1995). There is a slight variation of CaO in this group of lavas, which suggests a phenocryst enrichment or depletion. The lava compositions have remained broadly similar since 1961, and for many previous lavas as well, although some more felsic compositions are represented at older flank eruptions (Eggers, 1971).
CONRED reports. Perspective on the disaster can be gained from the chronology and content of announcements issued by CONRED (the Guatemalan agency for disaster reduction; Coordinadora Nacional para la Reducción de Desastres, table 4). These will be referred to in text by "CONRED" followed by their bulletin number.
Table 4. A summary of key CONRED information bulletins issued relevant to Pacaya's May 2010 eruption (http://conred.gob.gt/). After Escobar Wolf (2012) in addition to a similar table by Wardman and others (2012). Not all bulletins are included in this table.
| Date |
CONRED Bulletin |
Summary |
| 10 Feb 2010 |
564 |
Called attention to lavas emitted on the E to S flanks. |
| 17 May 2010 |
708 |
Recommended the National Park restrict access to the lava flows. |
| 26 May 2010 |
726 |
Eruptive activity increased during the day, generating plumes of 1 km above the vent that dispersed fine tephra onto neighboring villages. Recommended closing access to Park. Warned air traffic authorities about risks to aviation. |
| 27 May 2010 |
729 |
Began to mobilize staff to villages near volcano around 1500 on the 27th, to discuss and implement pre-emptive evacuation. Seven shelters were prepared in San Vicente Pacaya to accommodate refugees. When the paroxysmal phase of eruption started (after 1900), evacuation of villages to the W (El Rodeo and El Patrocinio) was already underway, however, tephra and ballistics were dispersed primarily to the N and the villages of El Cedro, San Francisco de Sales and Calderas were the most severely affected. |
| 28 May 2010 |
731 |
Declared Red Alert. As of 1239 on the 28th over 1600 people had been evacuated from the villages of San Francisco de Sales, El Rodeo, El Patrocinio, El Cedro, Calderas, and Caracolito. They moved to San Vicente Pacaya.
Civil Aviation authorities closed La Aurora International Airport due to tephra fall. The Ministry of Education closed schools in Escuintla, Sacatepequez and Guatemala departments. Access to the National Park remained restricted.
The municipality-level response agency (with a similar name, COMRED, not CONRED) was activated in Villa Canales. It set up shelters in the municipal auditorium, a church, and the municipal hall.
Advised citizens on managing the tephra fall. |
| 28 May 2010 |
734 |
Thus far the eruption had injured 59 people, killed 1, and prompted the evacuation of nearly 2000. |
| 08 May 2010 |
735 |
In the afternoon at 1424 on the 28th, high eruptive vigor resumed and tephra again fell on Guatemala City, but in much smaller quantities than during the previous day. |
| 29 May 2010 |
748 |
By this time, a total of 2635 people were in shelters due to the eruption; ~400 houses had been slightly damaged and 375, severely damaged. |
| 27 May 2011 |
1673 |
One year later; a retrospective summary of civil defense responses to the eruption and the larger engulfing disaster, tropical storm Agatha. |
Events prior to the energetic 27 May explosion. Figure 43 highlights Pacaya's vent locations (1961 to 2009 vents as green dots), including the two new E and SE flank vents that emitted lava flows (red areas). Changes in eruption behavior preceded the 27-28 May explosions by several months.
From 2004 to around the end of 2009, Pacaya's eruptive intensity was often low. A clear sign of changes took place in February 2010 when lava flows emerged at vents on the S and SE flanks (table 4). These vents sit well outboard of the usual points of lava emission, which have in recent decades been limited to spots within the central crater, an area bounded by a large engulfing collapse scarp (a Somma rim; Eggers, 1969; figure 43). The two previously mentioned deaths occurred on 18 April when, according to the news, they were hit by a rock avalanched caused by an explosion. By 17 May, SE flank lava flows had reached 1.5 km long and the Park began restricting access (table 1). The scene on the SE flank appears in figure 44.
Earlier on the 27th (prior to the explosion), INSIVUMEH volcanologist Gustavo Chigna looked out over the crater area and counted at least 16 distinct vents emitting lava. Chigna was surprised, and his comment was something like 'It looked like water gushing out of a sieve.' That scale of new extrusive sites helped alert authorities that the volcano's behavior had escalated well beyond the norm and led to restricting public access to Pacaya.
During the 5 years prior to the 27 May 2010 explosion, sporadic vent openings limited to the MacKenney cone and adjacent areas (particularly the N crater) extruded lava flows (green dots, figure 43). Many of the resulting lava flows were each only active for periods of days to months. INSIVUMEH sometimes reported multiple simultaneous lava flows from distinct vents on the cone, which occurred, for example, during April 2009. Most of the lava was confined to the main crater or portions downslope and W of the E-bounding collapse scarp. The case in 2005 illustrated that the topographic boundary associated with the NE segment of the collapse scarp had diminished in places to the point where lava flows could cross the scarp (BGVN 33:08).
Around January 2010, Gustavo Chigna (INSIVUMEH) indicted the end of mainly lower effusive activity ongoing since 2004. The new upsurge fed several lava flows from vents on Pacaya's main cone. In harmony with this comment, the video by Crossman (2009) indicates that on 24 December 2009 the volcano emitted considerable lava. Venting was effusive and at both the MacKenney cone's summit and base. Visible plumes were nearly absent.
Table 5 lists a small sample of available videos taken at Pacaya that aid in documenting its behavior. The table includes videos taken before, during, or shortly after the 27 May explosion, with the two pre-explosion videos capturing behavior relevant to this subsection. The videos from other parts of the table are discussed in appropriate sections below.
Table 5. Some photos and videos that advance understanding of Pacaya behavior during December 2009 to about 2 June 2010 (a week after the explosion). The cases presented are a sample, not an exhaustive list. Compiled by Bulletin editors.
| Video (V) or Photo (P) and source |
Date acquired / Date posted if clearly stated) |
Title; Content; URL
How cited in text of this report |
| V; Patrick R. Crossman |
24 Dec 2009 / 24 Dec 2011 |
Title: 'Hiking the Pacaya volcano in Guatemala'
This video chronicles a group visiting Pacaya amid ongoing effusive volcanism in comparatively calm conditions and with people in many scenes. Some parts of the video depict a narrow (1- to 2-m wide), channelized, slowly moving lava flow. That flow appears to vent near the base of the MacKenney cone, devoid of visible plume, and traverses a region of low incline. The path of the molten flow is sinuous rather than linear. The visitors roast marshmallows in radiant heat from the flows. The video also cuts to scenes at the MacKenney cone's summit, where a larger flow several meters wide vents in a stable, effusive manner, also devoid of an associated plume.
http://www.youtube.com/watch?v=Y62ZbfRBDmM
Cited in text as Crossman, 2011 |
| V & P; H. Paul Moon (Zen Violence Films, LLC) |
01 April 2010 / 24 April. [Date confirmed with Moon and by comparison to his dated still photos] |
Title: 'Pacaya Volcano, Guatemala [1080p HD]'
Close up views showing copious lava flowing down the E flank from the new vent there. Accompanies GPS record of hiking track and still photos. Music accompanies the video. Dovetails with a Landsat image from about a week earlier, which also documents the E flank lavas. See text for more discussion.
http://www.youtube.com/watch?v=Hr7VAVUBOhk
http://vimeo.com/hpmoon/pacaya
Associated link shows GPS path on a satellite image.
Cited in text as Moon, 2010 |
| V; RT news channel (original authorship not provided) |
-- / 28 May 2010 |
Title: 'Video of Guatemala Pacaya volcano eruption'
Compact, powerful strombolian explosions throwing molten ejecta vertically from multiple vents, or an elongate vent such as a fissure in Pacaya's crater (see photo below in figure 52).
http://www.youtube.com/watch?v=fFoF57KX2yU
Cited in text as RT News, 2010a |
| V; RT news channel (original authorship not provided) |
--/ 30 May 2010 |
Title: 'Raw video of damage caused by volcano eruptions in Guatemala and Ecuador'
The video shows, for Pacaya, images of advancing lava flows and some distant views of the volcano in daylight with a moderate plume above it. There are many scenes of damage, evacuation, and human impact, including ash-loaded corrugated metal roofs that buckled; ash on airliners; brigades of people sweeping and carting off ash from city streets and an airport runway; and children sheltering in a relief center.
http://www.youtube.com/watch?v=gmrVLHSS4mc
http://www.youtube.com/watch?feature=player_detailpage&v=gmrVLHSS4mc
Cited in text as RT News, 2010b |
| P; Boston.com |
27-31 May / 2 June 2010 |
Title: 'A Rough Week for Guatemala' (in The Big Picture—News Stories in Photographs)
"In just the past seven days, residents of Guatemala and parts of neighboring Honduras and El Salvador have had to cope with a volcanic eruption and ash fall, a powerful tropical storm, the resulting floods and landslides, and a frightening sinkhole in Guatemala City that swallowed up a small building and an intersection. Pacaya volcano started erupting lava and rocks on May 27th, blanketing Guatemala City with ash, closing the airport, and killing one television reporter who was near the eruption. Two days later, as Guatemalans worked to clear the ash, Tropical Storm Agatha made landfall bringing heavy rains that washed away bridges, filled some villages with mud, and somehow triggered the giant sinkhole--the exact cause is still being studied. (34 photos total)."
(URL: http://www.boston.com/bigpicture/2010/06/a_rough_week_for_guatemala.html)
Cited in text as Boston.com, 2010 |
| V; Tropical-rambler (clear authorship not provided) |
31 May 2010 / 31 May 2010 |
Title: 'Erupción Volcán de Pacaya - Pacaya volcano Eruption'
Helicopter views of flight generally towards, and then at, Pacaya, which was still in eruption, with initial views showing Agua volcano and parts of Lake Amatitlán. Low weather clouds covered extensive areas. This video captured a decidedly non-vertical, denser black plume from Pacaya feeding a lighter, tan colored more massive plume that appears to drop ash as it is carried to tens of kilometers downwind (directed E-SE-S). Shots include those of Cerro Chino and antenna towers there, and widespread steaming on the MacKenney cone that coalesced into large steam clouds low over much of the central crater area.
http://www.youtube.com/watch?feature=player_detailpage&v=JIqlMy8Q-aQ
Cited in text as Author unknown, 2010 |
| V; PrensaLibre.com |
About 2-3 June 2010/ 10 June 2010 |
Title: 'Espectacular erupción en el Pacaya'
(Narration by news reporter referring to explosion as 1 week ago, thus the 'About 2-3 June' date in the previous column.) According to REW, this video shows lavas emitted at the new SE flank vent. Remarkable images, some seemingly shot from helicopter and others from the ground, showing copious channelized lava flows moving rapidly downslope to the SE. At the vent area there are three small vents discharging spatter from coalescing cones with very steep sides. Their glowing summit craters gave off occasional eruptions as well as occasional puffs of gases, glowing spatter, and possibly flames. Some shots show incandescent lava flows several kilometers long. Rising plumes sometimes display toroidal motion, rotational behavior reminiscent of dust devils.
http://www.youtube.com/watch?v=CFpPB5TIRbk
Cited in text as Prensa Libre, 2010 |
Figure 45 shows one of several Landsat views of the E flank in an infrared image acquired on 23 March 2010. It showed high thermal radiance in a narrow linear thermal anomaly headed E outboard of the usual eruptions confined to the crater. The E-flank area is devoid of vegetation, which rules out a local fire there, meaning that the anomaly was due to a lava flow. The number of clear (cloud-free) views of Pacaya available during March through June was limited. REW plotted this anomaly in a KMZ file format (red line, figure 46).
The new E flank (extra-crater) lava flow documented by Landsat on 23 March was the subject of a video by Moon (2010) taken on 1 April (table 4; see their excursion route on figure 46). The footage was shot during daylight hours at high resolution [1080p HD] and later processed to obtain vibrant red, orange, and yellow colors. The discharges were effusive and few visible emission clouds accompanied the lava flows seen in the video. A dark plume remained above the MacKenney cone's summit.
As seen in figures 47-50, the lava documented by Moon (2010) in photo and video was several meters wide and passing over irregular terrain. As seen from a distance (e.g. figure 47), some sectors of the flows channel stood well above the surrounding landscape. In the area visited, the lava remained confined behind jumbled but effective levees as it passed through and over the a'a' (rough textured) flow field.
Figure 51 maps the inferred E flank lava flow axis and SE flank fissures on an oblique Google Earth view.
On 18 April 2010, according to a news report in the newspaper Prensa Libre, a Venezuelan tourist and her Guatemalan guide died on Pacaya. The news report stated the deceased were in the area of high risk when struck by material released from an explosion. Some of the other 14 people on the scene sustained injuries.
On 17 May 2010, observers saw abundant lava escaping from a new SE-flank vent (CONRED 708). A mound had formed at the vent area. The lava from this vent had by 17 May extended as far as 1.5 km. As seen on figure 43, the SE flank lava flows and their fissures ultimately fed lava flows trending roughly S for ~2.5 km then turning sharply (~90 degrees) to the W and extending in that direction another ~2.5 km.
CONRED 708 made a recommendation to the Pacaya National Park authority to restrict visitor access to the lava flows. The 17 May report noted that Pacaya's activity was considered to be relatively high, but it left out language suggesting a crisis at this point. According to the press, access to the volcano was restricted following the recommendation.
On 17 May, the newspaper Prensa Libre featured an undated night photo of the MacKenney cone taken from the N, presumably of this stage of Pacaya's eruption. It showed a dense spray of glowing material thrown from the MacKenney cone's summit and rising hundreds of meters. The cone's N rim contained a recently formed V-shaped notch (or trough). Out of that notch poured a broad lava flow. Several hundred meters down the MacKenney cone's N face, the broad flow split into two flows descending the cone's steep face on diverging paths. The notch in the cone stands out as a clear morphologic change associated with this time interval (~10 days prior to the 27 May explosion), and as will be seen below, it served as a conspicuous vent site for the fissure emissions documented during the explosions.
The day before the explosion, on 26 May, eruptive and seismic intensity both increased markedly. An eruptive plume reached 1 km above the vent and fine tephra fell on villages around the volcano (CONRED 726 on 26 May, table 4). CONRED recommended fully closing Pacaya National Park, and they warned aviation authorities of airborne ash near Pacaya. No call was yet made to evacuate residents living adjacent Pacaya.
Vigorous explosions starting 27 May 2010. Pacaya's eruptive vigor increased to the point of strong strombolian eruption, with the initial increase noted on the 27th in a morning report in Prensa Libre. More intense explosions occurred at around 1500 when observers noted explosions discharging about once per second and saw glowing material thrown ~1.5 km above the crater, and taller rising dark clouds carrying finer tephra that dispersed over nearby villages.
The exact start time of the intense 27 May explosion is variously reported, but available visual observations suggested to REW (2014) that it was during the interval 1800-1900. CONRED 729 indicated the climax (the explosion)began at 1900. Seismic data, discussed in a subsection below underwent the highest (RSAM) amplitudes during 1730-1830 local time on the 27th. Aviation reporting of satellite data on eruptive plumes, discussed in a subsection below, was initially ineffectual for the 27th owing to above-lying weather clouds.
What is clear is that the explosion late in the day on the 27th drove forth intense fire fountaining and vigorous ejection of tephra and ballistics.
Figure 52 shows a broad fire fountain frame taken from a Youtube video posted on 28 May—but it lacked an acquisition date (RT news channel, 2010a). REW interprets this video as taken during the major climax (explosion) during the night on the 27th. The eruption was clearly of fissure style at this point but the upper extent of the glowing material was possibly masked by ash clouds. Some of the textures within the glowing region are explained in the f caption and in the text below.
REW described the video source for figure 52 as taken looking at Cerro Chino (indicated on figure 43) from at or near the town of El Cedro, ~3 km to the NNW of the vent. The diffuse zones of near darkness in the midst of the fountains are rising ash clouds locally diminishing the glow. Thus it is clear from the dynamics seen on the video, that the glow of higher reaching clasts in the upper portions of this image could possibly be masked by dense ash plumes.
On the video, the orange streaks from glowing airborne pyroclasts track to points below that suggest emission from multiple vents or an elongate vent with continuous extent, rather than a single point source, a topic returned to below in the context of an elongate trough developed on the MacKenney cone. That said, REW points out that it is hard to get a good idea of the scale from this video and that videos taken from other locations seem to show a wider, and at times two different fountain jets. Available video and photographic data has thus far prohibited estimating the width of the fountain at this stage of the eruption. REW (2013) citing Hetland (personal communication) and CONRED 856 noted that associated with these emissions the major tephra fall began, and it soon spread tens of kilometers to the N.
Early in the explosion on the 27th (exact timing unknown), a news team from a national television station (Notisiete) endured a shower of ballistics. REW (2013) noted that they were in the vicinity of Cerro Chino at probably less than 1 km from the vent, the zone with critical infrastructure most impacted (figure 53). Although most of the news team survived, reporter Anibal Archila's death was apparently the result of direct impact from a large ballistic. His was the only icially confirmed death caused by the strong explosive phase. During a subsequent eruptive lull, a rescue team spent several dangerous hours in very close proximity to the vent, finding and rescuing missing people, and carrying out Archila's body.
Ballistics in excess of 0.5 m on their long axis fell at Cerro Chino and elsewhere within ~1 km of the vent area (figure 54). Some bombs on the ground reached sizes of 80 x 50 cm (Hetland personal communication) but part of that extent may have been due to splattering on impact. Farther away, the sizes of ballistics generally diminished with distance from the source. At Cerro Chino ballistic impacts broke concrete roofs, started fires in the radio shacks, and toppled antenna towers (REW, 2014; Wardman and others, 2010).
When the intense phase started on the 27th, the evacuation of villages to the W (El Rodeo and El Patrocinio) was already underway. During the hours after the explosion's onset on the 27th, more than 2,100 people were evacuated from the proximal villages to the town of San Vicente Pacaya (5 km NNW)(see related scenes in RT news, 2010 (b), table 4).
The settlements El Cedro, San Francisco de Sales, and Calderas, towns 2.5-3.5 km to the N, endured both ash as well as a dense barrage of hot ballistic bombs (figure 55). Many of the bombs were below 20 cm in diameter. Some of the ballistics pierced the corrugated (sheet metal or fiber cement) roofing common in Latin America. In some cases the ballistics also ignited fires that consumed most of the combustible contents of the buildings. Some roofs collapsed or buckled due to the load of deposited tephra.
The ballistics examined were of low density owing to vesicles larger than 1 mm in diameter. They contained sparse phenocrysts (often larger than 1 mm), most likely plagioclase (Hetland personal communication to REW and Hetland (2010).
REW (2013) noted that, from the observed damage to roofs in these villages, the density per unit area of impacts that pierced through the corrugated roofs averaged as high as on the order of 1 per square meter. Portions of the roofs in near-vent settlements also sustained many dents from bombs that delivered impacts with lower force. Although some communities were partially evacuated when many of the ballistics arrived, REW (2013) concluded that some residents remained within the communities and regions mostly affected.
Reports in Prensa Libre give insights into the scene of the evacuation and the barrage. Many of the residents evacuated on foot following narrow paths across the rugged rural terrain. Other residents remained behind in order to protect their belongings from theft. When the barrage came, those too close used whatever hard and resistant objects they could find to protect themselves, including hiding under furniture and using pots and pans to protect their heads. Some corroded metal roofs were weak prior to the eruption. Some people found refuge in buildings with heavier, concrete-slab roofs, which generally fared better.
Figure 56 shows an individual who clearly received medical attention, stitches, for a laceration on his forehead. According to REW (2013), Pacaya's 2010 ballistic barrage caused more injuries than any recent eruptions. That said, data remain scanty on injuries rates and kinds, resultant disabilities, accident location, etc., although Wardman and others (2012) compiled some statistics.
The AmatitlÁn geothermal plant, located ~3 km N of the MacKenney cone to the N of San Francisco de Sales received ~20 cm of mostly lapilli-sized tephra. As Wardman and others (2012) noted, "Ballistic bombs and blocks also bombarded the plant, causing extensive damage to the plant's roof and condenser fans. Fan blades were dented, bent and also suffered damage from abrasion. Minor denting of the intake and outlet pipe cladding was also reported however these impacts were superficial and did not require repair." A photo showed cladding bearing multiple closely spaced dents on the side of a large pipe; the largest dent, 20 cm across, had ruptured through the sheet metal.
Post-explosion assessment of the MacKenney cone shed new light on the form and significance of the previously mentioned notch across it (a linear NW-trending trough passing through the summit, figure 57).
The notch formed a prominent depression aligned both with the new SE-flank fissures and Cerro Chino cone on the outer NW crater rim. Portions of the RT video footage taken during vigorous stages of explosion suggests that at a paroxysmal stage of the explosion the trough served as an eruptive fissure emitting a vertically directed fountain as a curtain (table 5). REW (2013) also suggested that the eruptive fissure along the trough may have served as the vent for the ballistics that fell in previously mentioned settlements to the N.
The explosions broadest areal impact came from tephra fall. Figure 58 shows a close up of ash from a sample collected 22 km from the vent. Overall, the grain sizes ranged from sub-millimeter to centimeter size. An abundance of fine suspended particles in the air were not reported during or following the tephra fall.
As noted in table 4, in the afternoon on the 28th, high eruptive vigor resumed and tephra again fell on Guatemala City (CONRED 735). The ash fall on this day was lighter than on the 27th. Here aviation data (discussed below) did record the plume via satellite. The Washington Volcanic Ash Advisory Center (VAAC) noted (in their 6th advisory) an eruption in the afternoon on the 28th reaching (based on comparison of plume movement to modeling of winds aloft) ~13 km altitude.
During 29 May and onwards the intensity of volcanic activity decreased, with only relatively small eruptive plumes that occasionally produced minor tephra fall in the communities surrounding the volcano (CONRED 742). CONRED 748 noted that by the 29th, a total of 2,635 people were in shelters due to the eruption, with close to 800 home either damaged or destroyed. In the following days the attention of the emergency managers shifted from the eruption to the Tropical Storm Agatha, which had much broader extent and impact.
In the Pacaya and Guatamala City region, and along drainages carrying ash-charged run, both disasters combined. Lake AmatitlÁn rose, inundating low lying parts of the town with a water-and-ash mix (see photo documentation of impacts at Boston.com). Figure 59 is a photo taken ~12 km downstream of the Lake's outlet.
Seismic record. INSIVUMEH and REW (2013) suggested a climax on the 27th starting shortly before 1800 local time and lasting ~40 minutes.
The seismic signal (figure 60, upper panel) contained a few scattered high amplitude events during the morning of 27 May 2010. Seismicity rose significantly about 1200 on the 27th, about doubling the RSAM values recorded during the previous 13 hours.
The first of about 10 strong peaks (seen on both the upper and lower panels of figure 60) took place around 1230 on the 27th. Those peaks represented a large escalation in seismicity an approximate doubling of the RSAM values. The highest peak on the record took place during 1730 to 1830 on the 27th, a ~6-fold increase in RSAM over the background values acquired earlier on the 27th. During the middle part of the 1800-1900 interval there was a peculiar several-minute-long period with low seismicity conspicuous on the seismic record (upper panel). After that, a series of closely spaced peaks of generally decreasing amplitude followed and then seismicity decreased substantially, particularly around 2300-2400 on the 27th. A second escalation of broadly similar size to the earlier one came on the 28th peaking at 1100 and then dropping.
In a later analysis of seismicity, Mercado and others (2012 correlated waveforms for 5 months before and 9 months after the May 2010 eruption. They noted that "No correlation was found between the events of each day during the five-month period before the eruption, thus, establishing no relationship with the periods of correlation found after the eruption. The post-eruptive sources of seismicity discovered were not active before the eruptive event of May 27, 2010, and therefore these sources must be strictly post-eruptive in nature."
Aviation. Although there were 48 reports (Volcanic Ash Advisories, VAA's or simply 'advisories') issued by the Washington Volcanic Ash Advisory Center (VAAC) on Pacaya behavior during the interval 27 May to 26 June 2010, weather clouds frequently masked the plume from the key satellite observation platform, the GOES-13 satellite. Where satellite observations of the plume were scarce or lacking, most of the VAA's conveyed ground-based observations including media reports.
By the 3rd advisory, which was issued on the 28th, considerable ash had fallen at the International airport Aurora. There is some confusion as to the quantity of ash at the airport and over the region in general, but a photo on the 28th shows ash at the airport. Judging from ash load on the aircraft, the f walking just to the right of the aircraft, and adjacent tire tracks, the ash was on the order of ~1-cm thick (figure 61). This is in accord with INSIVUMEH's summary report that said 5-7 mm of ash had fallen during the entire explosive 27-28 May eruption at the airport. This is also in accord with REW (2014), which discusses the complexities of assessing tephra thicknesses in more detail, and presents a preliminary isopach map that shows the S fringes of the Guatemala City urban area with 10 cm of ash and many parts of the urban area farther N, including the airport, with on the order of 1 cm of ash.
What follows is a summary of the advisories issued during 27 through 28 May (UTC).
The VAA's frequently refer to the NAM (North American Mesoscale Model), a numerical model for short-term weather forecasting and in this case wind-velocity estimation. The model is run 4 times a day with 12 km horizontal resolution and with 1 hour temporal resolution, providing finer detail than other operational forecast models. An example of a model with less detail is the model called GFS (Global Forecast System), which predicts weather for many regions of the world, and was sometimes also used by the VAAC analysts.
The VAAC issued their 1st VAA for Pacaya during 2010 on May 27 at 1140 UTC, citing as key information sources GFS winds and INSIVUMEH. Eruption details noted small brief ash emissions near the summit at 1115 UTC. The ash cloud was not identifiable from the GOES-13 satellite owing to rain. The ash cloud was inferred to have remained low and near the volcano. GFS wind data suggested that for such a low ash cloud at that time, wind-directed transport would carry a plume S-SW and would only be significant for ~20 km. The analyst noted that eruption as then dominantly lava emission.
The 2nd advisory came out 7 hours later at 1845 UTC on the 27th indicating volcanic ash and gases to ~3.5 km altitude (noting ICAO as an information source). Ash was again not identifiable from the GOES-13 satellite owing to clouds.
The 3rd advisory, noting 'ongoing emission of volcanic ash and gases,' came out at 1257 UTC on the 28th, again lacking clear satellite identification of ash owing to clouds, in this case citing a thick tropical depression. This advisory relied on both a wind model (NAM winds) and an aviation meteorological report (a METAR). The advisory further noted media reports of ash on runways as discussed in the context of figure 61.
The 4th advisory was issued at 1554 UTC on the 28th, noting "increasing emissions" at 1515 UTC with INSIVUMEH reporting ash rising to 3.7 km altitude (FL 120) and spreading up to 27 km NW. Again, owing to extensive weather clouds, ash was again not visible from GOES-13 satellite.
The 5th advisory was issued at 1710 UTC on the 28th, noting "ongoing emissions" recorded at 1645 UTC. Plume has now become visible in [GOES-13] imagery and extends about 15 NMI [Nautical miles, 27 km] to the NNE of the summit. Plume top was at 3.7 km altitude (FL 120).
The 6th advisory was issued at 1915 UTC on the 28th, noting a large eruption recorded at 1815 UTC: "Large eruption seen to FL420 [42,000 feet, ~13 km altitude] based on NAM sounding for the area. Forecast winds remain mostly westerly to northwesterly. Winds at the time of observation blew the plume E at ~18 km/hr.
The 7th advisory was issued at 1930 UTC on the 28th (the last one that day); it repeated information about the eruption seen in imagery around 1815. In this advisory the wind was moving NW at 27 km/hr.
Slope stability study. Schaefer and others (2013) evaluated slope stability at Pacaya and commented on the possible implications of the trough across the MacKenney cone (figure 57). They consider the trough noted above as an example of a recent, smaller-volume collapse.
Specifically, they studied the SW flank of the edifice and developed a geomechanical model based upon field observations and laboratory tests of intact rocks from Pacaya. Their study included analysis of slope stability using numerical techniques and consideration of forces from gravity, magmatic pressure, and seismic loading as triggering mechanisms for slope failure.
Given the cone's structural and seismo-tectonic setting, the likely magma pressures, and the history of past behavior, they suggested Pacaya lacked substantial gravitational stability.
References. Bonis, S., 1993, Mapa Geologico de Guatemala Escala 1:250,000. Hoja ND 15 - 8 - G, "Guatemala". First edition (map). IGN, Guatemala.
Conway, M., 1995, Construction patterns and timing of volcanism at the Cerro Quemado, Santa María, and Pacaya volcanoes, Guatemala. Ph. D. Dissertation. Michigan Technological University, Houghton, Michigan. 152 pp.
Escobar Wolf, R, 2013 (Report in preparation, July 2013), The eruption of VolcÁn de Pacaya on May -June, 2010, Michigan Technological University, 31 pp.
Escobar-Wolf, R., & Tubman, S., in preparation, Compilation of historical and recent accounts of eruptions from volcan de Pacaya (XVI-IXX centuries).
Eggers, A., 1972, The geology and petrology of the AmatitlÁn quadrangle, Guatemala. Ph. D. Dissertation. Dartmouth College, Hanover, New Hampshire. 221 pp.
Eggers, A., 1969, Mapa Geologico de Guatemala Escala 1:50,000. Hoja 2059 II G, " AmatitlÁn ". First edition (map). IGN, Guatemala.
Fiske, R. S., Rose, T. R., Swanson, D. A., Champion, D. E., & McGeehin, J. P., 2009, Kulanaokuaiki Tephra (ca. AD 400-1000): Newly recognized evidence for highly explosive eruptions at Kīlauea Volcano, Hawai'i. Geological Society of America Bulletin, vol. 121, no. 5-6), pp. 712-728
Hetland, B., 2010a, Volcano Pacaya, Cleaning up the eruption of Pacaya, One roof at a time…; Online manuscript by Brianna "Adriana" Hetland, US Peace Corps Volunteer 2010-2012, (URL: http://www.geo.mtu.edu/~raman/Pacaya.Bri.pdf )
Hetland, B., 2010b, Erupción del VolcÁn de Pacaya 27 Mayo 2010; X Congreso Geológico de América Central, Antigua, Guatemala, November 10, 2010. [Power Point from talk at Geologic Conference; in Spanish] (URL: http://www.geo.mtu.edu/rs4hazards/conferencepresentations_files/conferenceshz.htm )
Kitamura S., and Matías O., 1995. Tephra stratigraphic approach to the eruptive history of Pacaya volcano, Guatemala. Science Reports-Tohoku University, Seventh Series: Geography. 45 (1): 1-41.
Matías Gómez, RO, Rose, WI, Palma, JL, Escobar-Wolf, R, 2012, Notes on a map of the 1961-2010 eruptions of VolcÁn de Pacaya, Guatemala. Geol Soc Am Digital Map Chart Series 10: 10 pp.
Matías , O., 2010, Volcanological map of the 1961 - 2009 eruption of Volcan de Pacaya, Guatemala. MS. Thesis. Michigan Technological University, Houghton, Michigan. 57 pp.
Mercado, D, Waite, G, and Rodriguez, L, 2012, Analysis of seismic patterns before and after the May 27, 2010 eruption of Pacaya volcano, Guatemala, Cities on Volcanoes 7 (COV7), Abstract volume, IAVCEI meeting (19-23 November 2012, Colima, Mexico) (URL: http://www.citiesonvolcanoes7.com/vistaprevia2.php?idab=510)
Morgan, HA, Harris, AJL, and L. Gurioli, 2013, Lava discharge rate estimates from thermal infrared satellite data for Pacaya Volcano during 2004-2010, Jour.of Volcanology and Geoth. Res., Vol. 264, pp. 1-11, ISSN 0377-0273, http://dx.doi.org/10.1016/j.jvolgeores.2013.07.008.
Prensa Libre, 2010 [19 April at 01:17 Nacionales]; Mueren tras explosion (URL: http://www.prensalibre.com/noticias/Mueren-explosion_0_246575377.html; http://tinyurl.com/2vvaj4j ) [in Spanish]
Prense Libre, 17 May 2010 [21:38 Nacionales], Restringen acceso al volcÁn de Pacaya (URL: http://www.prensalibre.com/noticias/Restringen-acceso-volcan-Pacaya_0_263373950.html; http://tinyurl.com/2wb8p9t) [in Spanish]
Prensa Libre, 27 May 2010 Aumenta actividad volcÁnica en el Pacaya (URL: http://www.prensalibre.com/noticias/volcan-pacaya-actividad-erupcion_0_269373197.html; http://tinyurl.com/246hohe)
Rose, W. I., Palma, J. L., Wolf, R. E., & Gomez, R. O. M., 2013, A 50 yr eruption of a basaltic composite cone: Pacaya, Guatemala. Geological Society of America Special Papers, 498, 1-21.
Schaefer, L. N., Oommen, T., Corazzato, C., Tibaldi, A., Escobar-Wolf, R., & Rose, W. I., 2013, An integrated field-numerical approach to assess slope stability hazards at volcanoes: the example of Pacaya, Guatemala. Bull Volcanol, 75, 720.
Sparks, R. S. J., 1986, The dimensions and dynamics of volcanic eruption columns. Bulletin of Volcanology, vol. 48, no. 1, pp. 3-15.
Wardman, J., Sword-Daniels, V., Stewart, C., & Wilson, T. M., 2012, Impact assessment of the May 2010 eruption of Pacaya volcano, Guatemala (No. 2012/09). GNS Science (New Zealand)
Walikainen, Dennis, 2010 [June 4], Eyewitness to Disasters: Graduate Student Reports from Guatemala (URL: http://www.mtu.edu/news/stories/2010/june/eyewitness-disasters-graduate-student-reports-guatemala.html)
Geologic Background. Eruptions from Pacaya are frequently visible from Guatemala City, the nation's capital. This complex basaltic volcano was constructed just outside the southern topographic rim of the 14 x 16 km Pleistocene Amatitlán caldera. A cluster of dacitic lava domes occupies the southern caldera floor. The post-caldera Pacaya massif includes the older Pacaya Viejo and Cerro Grande stratovolcanoes and the currently active Mackenney stratovolcano. Collapse of Pacaya Viejo between 600 and 1,500 years ago produced a debris-avalanche deposit that extends 25 km onto the Pacific coastal plain and left an arcuate scarp inside which the modern Pacaya volcano (Mackenney cone) grew. The NW-flank Cerro Chino crater was last active in the 19th century. During the past several decades, activity has consisted of frequent Strombolian eruptions with intermittent lava flow extrusion that has partially filled in the caldera moat and covered the flanks of Mackenney cone, punctuated by occasional larger explosive eruptions that partially destroy the summit.
Information Contacts: Rüdiger Escobar Wolf, Department of Geological Engineering and Sciences, Michigan Tech University, Houghton, MI 49931; INSIVUMEH Seccion Vulcanologia (Institute National de Sismologia, Vulcanologia, Meteorolgia, e Hidrologia) 7a Avenida, Zona 13, Guatemala City, Guatemala; Gustavo Chigna,.INSIVUMEH; CONRED (Coordinadora Nacional para la Reducción de Desastres) Avenida Hincapié 21-72, Zona 13 Guatemala, Ciudad de Guatemala; and Washington Volcanic Ash Advisory Center (VAAC), NOAA Satellite Analysis Branch, NOAA NESDIS OSPO, E/SP, NCWCP, 5830 University Research Court, College Park, MD 20740 (URL: http://www.ospo.noaa.gov/Products/atmosphere/vaac/).