Recently Published Bulletin Reports
Agung (Indonesia) Three eruptive events reported in April, May, and December 2022
Tengger Caldera (Indonesia) Minor ash emission in December 2023; persistent weak thermal anomaly in the Bromo crater
Saunders (United Kingdom) Persistent thermal anomalies from the summit crater lava lake during February 2023-January 2024
Shishaldin (United States) New eruption with significant Strombolian explosions, ash plumes, and ashfall
Ioto (Japan) New eruption with discolored water, ejecta, and floating pumice during October-December 2023
Purace (Colombia) Gas-and-ash emission on 16 November 2023
Suwanosejima (Japan) Eruption plumes, crater incandescence, and occasional explosions during July-October 2023
Etna (Italy) Strombolian explosions, lava fountains, and lava flows during July-August 2023
Aira (Japan) Explosions, ash plumes, ash fall, and crater incandescence during July-October 2023
Nishinoshima (Japan) Gray emissions during October 2023
Kilauea (United States) Strong lava fountains, lava flows, and spatter at Halema’uma’u during January-September 2023
Tinakula (Solomon Islands) Continued lava flows and thermal activity during June through November 2023
Agung (Indonesia) — January 2024  Cite this Report
Agung
Indonesia
8.343°S, 115.508°E; summit elev. 2997 m
All times are local (unless otherwise noted)
Three eruptive events reported in April, May, and December 2022
Mount Agung, located on the E end of the island of Bali, Indonesia, rises above the SE rim of the Batur caldera. The summit area extends 1.5 km E-W, with the highest point on the W and a steep-walled 800-m-wide crater on the E. Recorded eruptions date back to the early 19th century. A large and deadly explosive and effusive eruption occurred during 1963-64, which was characterized by voluminous ashfall, pyroclastic flows, and lahars that caused extensive damage and many fatalities. More recent activity was documented during November 2017-June 2019 that consisted of multiple explosions, significant ash plumes, lava flows at the summit crater, and incandescent ejecta. This report covers activity reported during April-May 2022 and December 2022 based on data from the Darwin Volcanic Ash Advisory Center (VAAC).
Activity during 2022 was relatively low and mainly consisted of a few ash plumes during April-May and December. An ash plume on 3 April rising to 3.7 km altitude (700 m above the summit) and drifting N was reported in a Darwin VAAC notice based on a ground report, with ash seen in HIMAWARI-8 visible imagery. Another ash plume was reported at 1120 on 27 May that rose to 5.5 km altitude (2.5 m above the summit); the plume was not visible in satellite or webcam images due to weather clouds. An eruption was reported based on seismic data at 0840 on 13 December, with an estimated plume altitude of 3.7 km; however, no ash was seen using satellite imagery in clear conditions before weather clouds obscured the summit.
Geologic Background. Symmetrical Agung stratovolcano, Bali's highest and most sacred mountain, towers over the eastern end of the island. The volcano, whose name means "Paramount," rises above the SE rim of the Batur caldera, and the northern and southern flanks extend to the coast. The summit area extends 1.5 km E-W, with the high point on the W and a steep-walled 800-m-wide crater on the E. The Pawon cone is located low on the SE flank. Only a few eruptions dating back to the early 19th century have been recorded in historical time. The 1963-64 eruption, one of the largest in the 20th century, produced voluminous ashfall along with devastating pyroclastic flows and lahars that caused extensive damage and many fatalities.
Information Contacts: Darwin Volcanic Ash Advisory Centre (VAAC), Bureau of Meteorology, Northern Territory Regional Office, PO Box 40050, Casuarina, NT 0811, Australia (URL: http://www.bom.gov.au/info/vaac/).
Tengger Caldera (Indonesia) — February 2024 Cite this Report
Tengger Caldera
Indonesia
7.942°S, 112.95°E; summit elev. 2329 m
All times are local (unless otherwise noted)
Minor ash emission in December 2023; persistent weak thermal anomaly in the Bromo crater
Tengger Caldera, located at the N end of a volcanic massif in Indonesia’s East Java, consists of five overlapping stratovolcanoes. The youngest and only active cone in the 16-km-wide caldera is Bromo, which typically produces gas-and-steam plumes, occasional ash plumes and explosions, and weak thermal signals (BGVN 44:05, 47:01). This report covers activity during January 2022-December 2023, consisting of mostly white gas-and-steam emissions and persistent weak thermal anomalies. Information was provided by the Pusat Vulkanologi dan Mitigasi Bencana Geologi (PVMBG, also known as Indonesian Center for Volcanology and Geological Hazard Mitigation, CVGHM) and satellite imagery. The Alert Level remained at 2 (on a scale of 1-4), and visitors were warned to stay at least 1 km from the crater.
Activity was generally low during the reporting period, similar to that in 2021. According to almost daily images from MAGMA Indonesia (a platform developed by PVMBG), white emissions and plumes rose from 50 to 900 m above the main crater during this period (figure 24). During several days in March and June 2022, white plumes reached heights of 1-1.2 km above the crater.
After an increase in activity at 2114 on 3 February 2023, a PVMBG team that was sent to observe white emissions rising as high as 300 m during 9-12 February and heard rumbling noises. A sulfur dioxide odor was also strong near the crater and measurements indicated that levels were above the healthy (non-hazardous) threshold of 5 parts per million; differential optical absorption spectroscopy (DOAS) measurements indicated an average flux of 190 metric tons per day on 11 February. Incandescence originating from a large fumarole in the NNW part of the crater was visible at night. The team observed that vegetation on the E caldera wall was yellow and withered. The seismic network recorded continuous tremor and deep and shallow volcanic earthquakes.
According to a PVMBG press release, activity increased on 13 December 2023 with white, gray, and brown emissions rising as high as 900 m above Bromo’s crater rim and drifting in multiple directions (figure 25). The report noted that tremor was continuous and was accompanied in December by three volcanic earthquakes. Deformation data indicated inflation in December. There was no observable difference in the persistent thermal anomaly in the crater between 11 and 16 December 2023.
All clear views of the Bromo crater throughout this time, using Sentinel-2 infrared satellite images, showed a weak persistent thermal anomaly; none of the anomalies were strong enough to cause MODVOLC Thermal Alerts. A fire in the SE part of the caldera in early September 2023 resulted in a brief period of strong thermal anomalies.
Geologic Background. The 16-km-wide Tengger caldera is located at the northern end of a volcanic massif extending from Semeru volcano. The massive volcanic complex dates back to about 820,000 years ago and consists of five overlapping stratovolcanoes, each truncated by a caldera. Lava domes, pyroclastic cones, and a maar occupy the flanks of the massif. The Ngadisari caldera at the NE end of the complex formed about 150,000 years ago and is now drained through the Sapikerep valley. The most recent of the calderas is the 9 x 10 km wide Sandsea caldera at the SW end of the complex, which formed incrementally during the late Pleistocene and early Holocene. An overlapping cluster of post-caldera cones was constructed on the floor of the Sandsea caldera within the past several thousand years. The youngest of these is Bromo, one of Java's most active and most frequently visited volcanoes.
Information Contacts: Pusat Vulkanologi dan Mitigasi Bencana Geologi (PVMBG, also known as Indonesian Center for Volcanology and Geological Hazard Mitigation, CVGHM), Jalan Diponegoro 57, Bandung 40122, Indonesia (URL: http://www.vsi.esdm.go.id/); MAGMA Indonesia, Kementerian Energi dan Sumber Daya Mineral (URL: https://magma.esdm.go.id/v1); Copernicus Browser, Copernicus Data Space Ecosystem, European Space Agency (URL: https://dataspace.copernicus.eu/browser/); Hawai'i Institute of Geophysics and Planetology (HIGP) - MODVOLC Thermal Alerts System, School of Ocean and Earth Science and Technology (SOEST), Univ. of Hawai'i, 2525 Correa Road, Honolulu, HI 96822, USA (URL: http://modis.higp.hawaii.edu/).
Saunders (United Kingdom) — February 2024 Cite this Report
Saunders
United Kingdom
57.8°S, 26.483°W; summit elev. 843 m
All times are local (unless otherwise noted)
Persistent thermal anomalies from the summit crater lava lake during February 2023-January 2024
Saunders is one of eleven islands that comprise the South Sandwich Islands in the South Atlantic. The active Mount Michael volcano has been in almost continuous eruption since November 2014 (BGVN 48:02). Recent activity has resulted in intermittent thermal anomalies and gas-and-steam emissions (BGVN 47:03, 48:02). Visits are infrequent due to its remote location, and cloud cover often prevents satellite observations. Satellite thermal imagery and visual observation of incandescence during a research expedition in 2019 (BGVN 28:02 and 44:08) and a finding confirmed by a National Geographic Society research team that summited Michael in November 2022 reported the presence of a lava lake.
Although nearly constant cloud cover during February 2023 through January 2024 greatly limited satellite observations, thermal anomalies from the lava lake in the summit crater were detected on clear days, especially around 20-23 August 2023. Anomalies similar to previous years (eg. BGVN 48:02) were seen in both MIROVA (Middle InfraRed Observation of Volcanic Activity) data from MODIS instruments and in Sentinel 2 infrared imagery. The only notable sulfur dioxide plume detected near Saunders was on 25 September 2023, with the TROPOMI instrument aboard the Sentinel-5P satellite.
Geologic Background. Saunders Island consists of a large central volcanic edifice intersected by two seamount chains, as shown by bathymetric mapping (Leat et al., 2013). The young Mount Michael stratovolcano dominates the glacier-covered island, while two submarine plateaus, Harpers Bank and Saunders Bank, extend north. The symmetrical Michael has a 500-m-wide summit crater and a remnant of a somma rim to the SE. Tephra layers visible in ice cliffs surrounding the island are evidence of recent eruptions. Ash clouds were reported from the summit crater in 1819, and an effusive eruption was inferred to have occurred from a N-flank fissure around the end of the 19th century and beginning of the 20th century. A low ice-free lava platform, Blackstone Plain, is located on the north coast, surrounding a group of former sea stacks. A cluster of cones on the SE flank, the Ashen Hills, appear to have been modified since 1820 (LeMasurier and Thomson, 1990). Analysis of satellite imagery available since 1989 (Gray et al., 2019; MODVOLC) suggests frequent eruptive activity (when weather conditions allow), volcanic clouds, steam plumes, and thermal anomalies indicative of a persistent, or at least frequently active, lava lake in the summit crater. Due to this observational bias, there has been a presumption when defining eruptive periods that activity has been ongoing unless there is no evidence for at least 10 months.
Information Contacts: MIROVA (Middle InfraRed Observation of Volcanic Activity), a collaborative project between the Universities of Turin and Florence (Italy) supported by the Centre for Volcanic Risk of the Italian Civil Protection Department (URL: http://www.mirovaweb.it/); NASA Global Sulfur Dioxide Monitoring Page, Atmospheric Chemistry and Dynamics Laboratory, NASA Goddard Space Flight Center (NASA/GSFC), 8800 Greenbelt Road, Goddard MD 20771, USA (URL: https://so2.gsfc.nasa.gov/); Copernicus Browser (URL: https://dataspace.copernicus.eu/browser).
Shishaldin (United States) — December 2023 Cite this Report
Shishaldin
United States
54.756°N, 163.97°W; summit elev. 2857 m
All times are local (unless otherwise noted)
New eruption with significant Strombolian explosions, ash plumes, and ashfall
Shishaldin is located on the eastern half of Unimak Island, one of the Aleutian Islands. Frequent explosive activity, primarily consisting of Strombolian ash eruptions from the small summit crater, but sometimes producing lava flows, has been recorded since the 18th century. The previous eruption ended in May 2020 and was characterized by intermittent thermal activity, increased seismicity and surface temperatures, ash plumes, and ash deposits (BGVN 45:06). This report covers a new eruption during July through November 2023, which consisted of significant explosions, ash plumes, ashfall, and lava fountaining. Information comes from daily, weekly, and special reports from the Alaska Volcano Observatory (AVO) and various satellite data. AVO monitors the volcano using local seismic and infrasound sensors, satellite data, web cameras, and remote infrasound and lightning networks.
AVO reported that intermittent tremor and low-frequency earthquakes had gradually become more regular and consistent during 10-13 July. Strongly elevated surface temperatures at the summit were identified in satellite images during 10-13 July. On 11 July AVO raised the Aviation Color Code (ACC) to Yellow (the second color on a four-color scale) and Volcano Alert Level (VAL) to Advisory (the second level on a four-level scale) at 1439. Later in the day on 11 July summit crater incandescence was observed in webcam images. Observations of the summit suggested that lava was likely present at the crater, which prompted AVO to raise the ACC to Orange (the second highest color on a four-color scale) and the VAL to Watch (the second highest level on a four-level scale). The US Coast Guard conducted an overflight on 12 July and confirmed that lava was erupting from the summit. That same day, sulfur dioxide emissions were detected in satellite images.
A significant explosion began at 0109 on 14 July that produced an ash plume that rose to 9-12 km altitude and drifted S over the Pacific Ocean (figure 43). Webcam images and photos taken around 0700 from a ship SW off Unimak Island showed small lahar deposits, which were the result of the interaction of hot pyroclastic material and snow and ice on the flanks. There was also ashfall on the SW and N flanks. A smaller explosion at 0710 generated an ash plume that rose to 4.5 km altitude. Webcam images and pilot reports showed continued low-level ash emissions during the morning, rising to less than 4.6 km altitude; those emissions included a small ash plume near the summit around 1030 resulting from a small explosion.
Seismic tremor amplitude began increasing at around 1700 on 15 July; strongly elevated surface temperatures were also reported. An ash plume rose to 4.6 km altitude and drifted SSE at 2100, based on a satellite image. A continuous ash plume during 2150 through 2330 rose to 5 km altitude and extended 125 km S. At 2357 AVO raised the ACC to Red (the highest color on a four-color scale) and the VAL to Warning (the highest level on a four-level scale), noting that seismicity remained elevated for more than six hours and explosion signals were frequently detected by regional infrasound (pressure sensor) networks. Explosions generated an ash plume that rose to 4.9 km altitude and drifted as far as 500 km SE. Activity throughout the night declined and by 0735 the ACC was lowered to Orange and the VAL to Watch. High-resolution satellite images taken on 16 July showed pyroclastic deposits extending as far as 3 km from the vent; these deposits generated lahars that extended further down the drainages on the flanks. Ash deposits were mainly observed on the SSE flank and extended to the shore of Unimak Island. During 16-17 July lava continued to erupt at the summit, which caused strongly elevated surface temperatures that were visible in satellite imagery.
Lava effusion increased at 0100 on 18 July, as noted in elevated surface temperatures identified in satellite data, increasing seismic tremor, and activity detected on regional infrasound arrays. A significant ash plume at 0700 rose to 7 km altitude and continued until 0830, eventually reaching 9.1 km altitude and drifting SSE (figure 44). As a result, the ACC was raised to Red and the VAL to Warning. By 0930 the main plume detached, but residual low-level ash emissions continued for several hours, remaining below 3 km altitude and drifting S. The eruption gradually declined and by 1208 the ACC was lowered to Orange and the VAL was lowered to Watch. High-resolution satellite images showed ash deposits on the SW flank and pyroclastic deposits on the N, E, and S flanks, extending as far as 3 km from the vent; lahars triggered by the eruption extended farther down the flanks (figure 45). Lava continued to erupt from the summit crater on 19 July.
Elevated surface temperatures were detected in satellite images during 19-25 July, despite occasional weather cloud cover, which was consistent with increased lava effusion. During 22-23 July satellite observations acquired after the eruption from 18 July showed pyroclastic flow and lahar deposits extending as far as 3 km down the N, NW, and NE flanks and as far as 1.5 km down the S and SE flanks. Ash deposits covered the SW and NE flanks. No lava flows were observed outside the crater. On 22 July a sulfur dioxide plume was detected in satellite data midday that had an estimated mass of 10 kt. In a special notice issued at 1653 on 22 July AVO noted that eruptive activity had intensified over the previous six hours, which was characterized by an hours-long steady increase in seismic tremor, intermittent infrasound signals consistent with small explosions, and an increase in surface temperatures that were visible in satellite data. Pilots first reported low-level ash plumes at around 1900. At 2320 an ash plume had risen to 9 km altitude based on additional pilot reports and satellite images. The ACC was increased to Red and the VAL to Warning at 2343. Satellite images indicated growth of a significantly higher ash plume that rose to 11 km altitude continued until 0030 and drifted NE. During the early morning hours of 23 July ash plumes had declined to 4.6 k altitude. Seismic tremor peaked at 0030 on 23 July and began to rapidly decline at 0109; active ash emissions were no longer visible in satellite data by 0130. The ACC was lowered to Orange and the VAL to Watch at 0418; bursts of increased seismicity were recorded throughout the morning, but seismicity generally remained at low levels. Elevated surface temperatures were visible in satellite data until about 0600. On 24 July pilots reported seeing vigorous gas-and-steam plumes rising to about 3 km altitude; the plumes may have contained minor amounts of ash.
During 24-25 July low level seismicity and volcanic tremor were detected at low levels following the previous explosion on 23 July. Strongly elevated surface temperatures were observed at the summit crater in satellite data. Around 2200 on 25 July seismicity began to increase, followed by infrasound signals of explosions after 0200 on 26 July. An ash plume rose to 3 km altitude at 0500 and drifted ENE, along with an associated sulfur dioxide plume that drifted NE and had an estimated mass of 22 kt. Diffuse ash emissions were visible in satellite data and rose to 6.1-7.6 km altitude and extended 125 km from the volcano starting around 1130. These ash events were preceded by about seven hours of seismic tremor, infrasound detections of explosions, and five hours of increased surface temperatures visible in satellite data. Activity began to decline around 1327, which included low-frequency earthquakes and decreased volcanic tremor, and infrasound data no longer detected significant explosions. Surface temperatures remained elevated through the end of the month.
Seismicity, volcanic tremor, and ash emissions remained at low levels during early August. Satellite images on 1 August showed that some slumping had occurred on the E crater wall due to the recent explosive activity. Elevated surface temperatures continued, which was consistent with cooling lava. On 2 August small explosive events were detected, consistent with low-level Strombolian activity. Some episodes of volcanic tremor were reported, which reflected low-level ash emissions. Those ash emissions rose to less than 3 km altitude and drifted as far as 92.6 km N. Pilots that were located N of the volcano observed an ash plume that rose to 2.7 km altitude. Seismicity began to increase in intensity around 0900 on 3 August. Seismicity continued to increase throughout the day and through the night with strongly elevated surface temperatures, which suggested that lava was active at the surface.
An ash cloud that rose to 7.6-7.9 km altitude and drifted 60-75 km NE was visible in a satellite image at 0520 on 4 August. Pilots saw and reported the plume at 0836 (figure 46). By 0900 the plume had risen to 9.1 km altitude and extended over 100 km NE. AVO raised the ACC to Red and the VAL to Warning as a result. Seismic tremor levels peaked at 1400 and then sharply declined at 1500 to slightly elevated levels; the plume was sustained during the period of high tremor and drifted N and NE. The ACC was lowered to Orange and the VAL to Watch at 2055. During 5-14 August seismicity remained low and surface temperatures were elevated based on satellite data due to cooling lava. On 9 August a small lava flow was observed that extended from the crater rim to the upper NE flank. It had advanced to 55 m in length and appeared in satellite imagery on 11 August. Occasional gas-and-steam plumes were noted in webcam images. At 1827 AVO noted that seismic tremor had steadily increased during the afternoon and erupting lava was visible at the summit in satellite images.
Strong explosion signals were detected at 0200 on 15 August. An ash cloud that was visible in satellite data extended 100 km NE and may have risen as high as 11 km altitude around 0240. By 0335 satellite images showed the ash cloud rising to 7.6 km altitude and drifting NE. Significant seismicity and explosions were detected by the local AVO seismic and infrasound networks, and volcanic lightning was detected by the World Wide Lightning Location Network (WWLLN). A sulfur dioxide plume associated with the eruption drifted over the S Bering Sea and parts of Alaska and western Canada. Seismicity was significantly elevated during the eruption but had declined by 1322. A pilot reported that ash emissions continued, rising as high as 4.9 km altitude. Elevated surface temperatures detected in satellite data were caused by hot, eruptive material (pyroclastic debris and lava) that accumulated around the summit. Eruptive activity declined by 16 August and the associated sulfur dioxide plume had mostly dissipated; remnants continued to be identified in satellite images at least through 18 August. Surface temperatures remained elevated based on satellite images, indicating hot material on the upper parts of the volcano. Small explosions were detected in infrasound data on the morning of 19 August and were consistent with pilot reports of small, short-lived ash plumes that rose to about 4.3 km altitude. Low-level explosive activity was reported during 20-24 August, according to seismic and infrasound data, and weather clouds sometimes prevented views. Elevated surface temperatures were observed in satellite images, which indicated continued hot material on the upper parts of the volcano.
Seismic tremor began to increase at around 0300 on 25 August and was followed by elevated surface temperatures identified in satellite images, consistent with erupting lava. Small explosions were recorded in infrasound data. The ACC was raised to Red and the VAL to Warning at 1204 after a pilot reported an ash plume that rose to 9.1 km altitude. Seismicity peaked at 1630 and began to rapidly decline at around 1730. Ash plumes rose as high as 10 km altitude and drifted as far as 400 km NE. By 2020 the ash plumes had declined to 6.4 km altitude and continued to drift NE. Ash emissions were visible in satellite data until 0000 on 26 August and seismicity was at low levels. AVO lowered the ACC to Orange and the VAL to Watch at 0030. Minor explosive activity within the summit crater was detected during 26-28 August and strongly elevated surface temperatures were still visible in satellite imagery through the rest of the month. An AVO field crew working on Unimak Island observed a mass flow that descended the upper flanks beginning around 1720 on 27 August. The flow produced a short-lived ash cloud that rose to 4.5 km altitude and rapidly dissipated. The mass flow was likely caused by the collapse of spatter that accumulated on the summit crater rim.
Similar variable explosive activity was reported in September, although weather observations sometimes prevented observations. A moderate resolution satellite image from the afternoon of 1 September showed gas-and-steam emissions filling the summit crater and obscuring views of the vent. In addition, hot deposits from the previous 25-26 August explosive event were visible on the NE flank near the summit, based on a 1 September satellite image. On 2 and 4 September seismic and infrasound data showed signals of small, repetitive explosions. Variable gas-and-steam emissions from the summit were visible but there was no evidence of ash. Possible summit crater incandescence was visible in nighttime webcam images during 3-4 September.
Seismicity began to gradually increase at around 0300 on 5 September and activity escalated at around 0830. A pilot reported an ash plume that rose to 7.6 km altitude at 0842 and continued to rise as high as possibly 9.7 km altitude and drifted SSE based on satellite images (figure 47). The ACC was raised to Red and the VAL to Warning at 0900. In addition to strong tremor and sustained explosions, the eruption produced volcanic lightning that was detected by the WWLLN. Around 1100 seismicity decreased and satellite data confirmed that the altitude of the ash emissions had declined to 7.6 km altitude. By 1200 the lower-altitude portion of the ash plume had drifted 125 km E. Significant ash emissions ended by 1330 based on webcam images. The ACC was lowered to Orange and the VAL to Watch at 1440. Satellite images showed extensive pyroclastic debris flows on most of the flanks that extended 1.2-3.3 km from the crater rim.
During 6-13 September elevated surface temperatures continued to be observed in satellite data, seismicity remained elevated with weak but steady tremor, and small, low-frequency earthquakes and small explosions were reported, except on 12 September. On 6 September a low-level ash plume rose to 1.5-1.8 km altitude and drifted SSE. Occasional small and diffuse gas-and-steam emissions at the summit were visible in webcam images. Around 1800 on 13 September seismic tremor amplitudes began to increase, and small explosions were detected in seismic and infrasound data. Incandescent lava at the summit was seen in a webcam image taken at 0134 on 14 September during a period of elevated tremor. No ash emissions were reported during the period of elevated seismicity. Lava fountaining began around 0200, based on webcam images. Satellite-based radar observations showed that the lava fountaining activity led to the growth of a cone in the summit crater, which refilled most of the crater. By 0730 seismicity significantly declined and remained at low levels.
Seismic tremor began to increase around 0900 on 15 September and rapidly intensified. An explosive eruption began at around 1710, which prompted AVO to raise the ACC to Red and the VAL to Warning. Within about 30 minutes ash plumes drifted E below a weather cloud at 8.2 km altitude. The National Weather Service estimated that an ash-rich plume rose as high as 12.8 km altitude and produced volcanic lightning. The upper part of the ash plume detached from the vent around 1830 and drifted E, and was observed over the Gulf of Alaska. Around the same time, seismicity dramatically decreased. Trace ashfall was reported in the community of False Pass (38 km ENE) between 1800-2030 and also in King Cove and nearby marine waters. Activity declined at around 1830 although seismicity remained elevated, ash emissions, and ashfall continued until 2100. Lightning was again detected beginning around 1930, which suggested that ash emissions continued. Ongoing explosions were detected in infrasound data, at a lower level than during the most energetic phase of this event. Lightning was last detected at 2048. By 2124 the intensity of the eruption had decreased, and ash emissions were likely rising to less than 6.7 km altitude. Seismicity returned to pre-eruption levels. On 16 September the ACC was lowered to Orange and the VAL to Watch at 1244; the sulfur dioxide plume that was emitted from the previous eruption event was still visible over the northern Pacific Ocean. Elevated surface temperatures, gas-and-steam emissions from the vent, and new, small lahars were reported on the upper flanks based on satellite and webcam images. Minor deposits were reported on the flanks which were likely the result of collapse of previously accumulated lava near the summit crater.
Elevated seismicity with tremor, small earthquakes, and elevated surface temperatures were detected during 17-23 September. Minor gas-and-steam emissions were visible in webcam images. On 20 September small volcanic debris flows were reported on the upper flanks. On 21 September a small ash deposit was observed on the upper flanks extending to the NE based on webcam images. Seismic tremor increased significantly during 22-23 September. Regional infrasound sensors suggested that low-level eruptive activity was occurring within the summit crater by around 1800 on 23 September. Even though seismicity was at high levels, strongly elevated surface temperatures indicating lava at the surface were absent and no ash emissions were detected; weather clouds at 0.6-4.6 km altitude obscured views. At 0025 on 24 September AVO noted that seismicity continued at high levels and nearly continuous small infrasound signals began, likely from low-level eruptive activity. Strongly elevated surface temperatures were identified in satellite images by 0900 and persisted throughout the day; the higher temperatures along with infrasound and seismic data were consistent with lava erupting at the summit. Around 1700 similarly elevated surface temperatures were detected from the summit in satellite data, which suggested that more vigorous lava fountaining had started. Starting around 1800 low-level ash emissions rose to altitudes less than 4.6 km altitude and quickly dissipated.
Beginning at midnight on 25 September, a series of seismic signals consistent with volcanic flows were recorded on the N side of the volcano. A change in seismicity and infrasound signals occurred around 0535 and at 0540 a significant ash cloud formed and quickly reached 14 km altitude and drifted E along the Alaska Peninsula. The cloud generated at least 150 lightning strokes with thunder that could be heard by people in False Pass. Seismicity rapidly declined to near background levels around 0600. AVO increased the ACC to Red and the VAL to Warning at 0602. The ash cloud detached from the volcano at around 0700, rose to 11.6 km altitude, and drifted ESE. Trace to minor amounts of ashfall were reported by the communities of False Pass, King Cove, Cold Bay, and Sand Point around 0700. Ash emissions continued at lower altitudes of 6-7.6 km altitude at 0820. Small explosions at the vent area continued to be detected in infrasound data and likely represented low-level eruptive activity near the vent. Due to the significant decrease in seismicity and ash emissions the ACC was lowered to Orange and the VAL to Watch at 1234. Radar data showed significant collapses of the crater that occurred on 25 September. Satellite data also showed significant hot, degassing pyroclastic and lahar deposits on all flanks, including more extensive flows on the ENE and WSW sections below two new collapse scarps. Following the significant activity during 24-25 September, only low-level activity was observed. Seismicity decreased notably near the end of the strong activity on 25 September and continued to decrease through the end of the month, though tremor and small earthquakes were still reported. No explosive activity was detected in infrasound data through 2 October. Gas-and-steam emissions rose to 3.7 km altitude, as reported by pilots and seen in satellite images. Satellite data from 26 September showed that significant collapses had occurred at the summit crater and hot, steaming deposits from pyroclastic flows and lahars were present on all the flanks, particularly to the ENE and WSW. A small ash cloud was visible in webcam images on 27 September, likely from a collapse at the summit cone. High elevated surface temperatures were observed in satellite imagery during 27-28 September, which were likely the result of hot deposits on the flanks erupted on 25 September. Minor steaming at the summit crater and from an area on the upper flanks was visible in webcam images on 28 September.
During October, explosion events continued between periods of low activity. Seismicity significantly increased starting at around 2100 on 2 October; around the same time satellite images showed an increase in surface temperatures consistent with lava fountaining. Small, hot avalanches of rock and lava descended an unspecified flank. In addition, a distinct increase in infrasound, seismicity, and lightning detections was followed by an ash plume that rose to 12.2 km altitude and drifted S and E at 0520 on 3 October, based on satellite images. Nighttime webcam images showed incandescence due to lava fountaining at the summit and pyroclastic flows descending the NE flank. AVO reported that a notable explosive eruption started at 0547 and lasted until 0900 on 3 October, which prompted a rise in the ACC to Red and the VAL to Warning. Subsequent ash plumes rose to 6-7.6 km altitude by 0931. At 1036 the ACC was lowered back to Orange and the VAL to Watch since both seismic and infrasound data quieted substantially and were slightly above background levels. Gas-and-steam emissions were observed at the summit, based on webcam images. Trace amounts of ashfall were observed in Cold Bay. Resuspended ash was present at several kilometers altitude near the volcano. During the afternoon, low-level ash plumes were visible at the flanks, which appeared to be largely generated by rock avalanches off the summit crater following the explosive activity. These ash plumes rose to 3 km altitude and drifted W. Trace amounts of ashfall were reported by observers in Cold Bay and Unalaska and flights to these communities were disrupted by the ash cloud. Satellite images taken after the eruption showed evidence of pyroclastic flows and lahar deposits in drainages 2 km down the SW flank and about 3.2 km down the NE flank, and continued erosion of the crater rim. Small explosion craters at the end of the pyroclastic flows on the NE flank were noted for the first time, which may have resulted from gas-and-steam explosions when hot deposits interact with underlying ice.
During 4 October seismicity, including frequent small earthquakes, remained elevated, but was gradually declining. Ash plumes were produced for over eight hours until around 1400 that rose to below 3.7 km altitude. These ash plumes were primarily generated off the sides of the volcano where hot rock avalanches from the crater rim had entered drainages to the SW and NE. Two explosion craters were observed at the base of the NE deposits about 3.2 km from the crater rim. Webcam images showed the explosion craters were a source of persistent ash emissions; occasional collapse events also generated ash. Seismicity remained elevated with sulfur dioxide emissions that had a daily average of more than 1,000 tons per day, and frequent small earthquakes through the end of the month. Frequent elevated surface temperatures were identified in satellite images and gas-and-steam plumes were observed in webcam images, although weather conditions occasionally prevented clear views of the summit. Emissions were robust during 14-16 October and were likely generated by the interaction of hot material and snow and ice. During the afternoon of 21 October a strong gas-and-steam plume rose to 3-4.6 km altitude and extended 40 km WSW, based on satellite images and reports from pilots. On 31 October the ACC was lowered to Yellow and the VAL was lowered to Advisory.
Activity in November was characterized by elevated seismicity with ongoing seismic tremor and small, low-frequency earthquakes, elevated surface temperatures, and gas-and-steam emissions. There was an increase in seismic and infrasound tremor amplitudes starting at 1940 on 2 November. As a result, the ACC was again raised to Orange and the VAL was increased to Watch, although ash was not identified in satellite data. An ash cloud rose to 6.1 km altitude and drifted W according to satellite data at 2000. By 0831 on 3 November ash emissions were no longer visible in satellite images. On 6 and 9 November air pressure sensors detected signals consistent with small explosions. Small explosions were detected in infrasound data consistent with weak Strombolian activity on 19 and 21 November. Seismicity started to decrease on 21 November. On 25 November gas-and-steam emissions were emitted from the vent as well as from a scarp on the NE side of the volcano near the summit. A gas-and-steam plume extended about 50 km SSE and was observed in satellite and webcam images on 26 November. On 28 November small explosions were observed in seismic and local infrasound data and gas-and-steam emissions were visible from the summit and from the upper NE collapse scarp based on webcam images. Possible small explosions were observed in infrasound data on 30 November. Weakly elevated surface temperatures and a persistent gas-and-steam plume from the summit and collapse scarps on the upper flanks. A passing aircraft reported the gas-and-steam plume rose to 3-3.4 km altitude on 30 November, but no significant ash emissions were detected.
Satellite data. MODIS thermal anomaly data provided through MIROVA (Middle InfraRed Observation of Volcanic Activity) showed a strong pulse of thermal activity beginning in July 2023 that continued through November 2023 (figure 48). This strong activity was due to Strombolian explosions and lava fountaining events at the summit crater. According to data from MODVOLC thermal alerts, a total of 101 hotspots were detected near the summit crater in July (11-14, 16-19, 23-24 and 26), August (4, 25-26, and 29), September (5, 12, and 17), and October (3, 4, and 8). Infrared satellite data showed large lava flows descending primarily the northern and SE flanks during the reporting period (figure 49). Sulfur dioxide plumes often exceeded two Dobson Units (DUs) and drifted in different directions throughout the reporting period, based on satellite data from the TROPOMI instrument on the Sentinel-5P satellite (figure 50).
Geologic Background. The symmetrical glacier-covered Shishaldin in the Aleutian Islands is the westernmost of three large stratovolcanoes in the eastern half of Unimak Island. The Aleuts named the volcano Sisquk, meaning "mountain which points the way when I am lost." Constructed atop an older glacially dissected edifice, it is largely basaltic in composition. Remnants of an older edifice are exposed on the W and NE sides at 1,500-1,800 m elevation. There are over two dozen pyroclastic cones on its NW flank, which is covered by massive aa lava flows. Frequent explosive activity, primarily consisting of Strombolian ash eruptions from the small summit crater, but sometimes producing lava flows, has been recorded since the 18th century. A steam plume often rises from the summit crater.
Information Contacts: Alaska Volcano Observatory (AVO), a cooperative program of a) U.S. Geological Survey, 4200 University Drive, Anchorage, AK 99508-4667 USA (URL: https://avo.alaska.edu/), b) Geophysical Institute, University of Alaska, PO Box 757320, Fairbanks, AK 99775-7320, USA, and c) Alaska Division of Geological & Geophysical Surveys, 794 University Ave., Suite 200, Fairbanks, AK 99709, USA (URL: http://dggs.alaska.gov/); MIROVA (Middle InfraRed Observation of Volcanic Activity), a collaborative project between the Universities of Turin and Florence (Italy) supported by the Centre for Volcanic Risk of the Italian Civil Protection Department (URL: http://www.mirovaweb.it/); Hawai'i Institute of Geophysics and Planetology (HIGP) - MODVOLC Thermal Alerts System, School of Ocean and Earth Science and Technology (SOEST), Univ. of Hawai'i, 2525 Correa Road, Honolulu, HI 96822, USA (URL: http://modis.higp.hawaii.edu/); NASA Global Sulfur Dioxide Monitoring Page, Atmospheric Chemistry and Dynamics Laboratory, NASA Goddard Space Flight Center (NASA/GSFC), 8800 Greenbelt Road, Goddard, Maryland, USA (URL: https://so2.gsfc.nasa.gov/); Copernicus Browser, Copernicus Data Space Ecosystem, European Space Agency (URL: https://dataspace.copernicus.eu/browser/).
Ioto
Japan
24.751°N, 141.289°E; summit elev. 169 m
All times are local (unless otherwise noted)
New eruption with discolored water, ejecta, and floating pumice during October-December 2023
Ioto (Iwo-jima), located about 1,200 km S of Tokyo, lies within a 9-km-wide submarine caldera along the Izu-Bonin-Mariana volcanic arc. Previous eruptions date back to 1889 and have consisted of dominantly phreatic explosions, pumice deposits during 2001, and discolored water. A submarine eruption during July through December 2022 was characterized by discolored water, pumice deposits, and gas emissions (BGVN 48:01). This report covers a new eruption during October through December 2023, which consisted of explosions, black ejecta, discolored water, and floating pumice, based on information from the Japan Meteorological Association (JMA), the Japan Coast Guard (JCG), and satellite data.
JMA reported that an eruption had been occurring offshore of Okinahama on the SE side of the island since 21 October, which was characterized by volcanic tremor, according to the Japan Maritime Self-Defense Force (JMSDF) Iwo Jima Air Base (figure 22). According to an 18 October satellite image a plume of discolored water at the site of this new eruption extended NE (figure 23). During an overflight conducted on 30 October, a vent was identified about 1 km off the coast of Okinahama. Observers recorded explosions every few minutes that ejected dark material about 20 m above the ocean and as high as 150 m. Ejecta from the vent formed a black-colored island about 100 m in diameter, according to observations conducted from the air by the Earthquake Research Institute of the University of Tokyo in cooperation with the Mainichi newspaper (figure 24). Occasionally, large boulders measuring more than several meters in size were also ejected. Observations from the Advanced Land Observing Satellite Daichi-2 and Sentinel-2 satellite images also confirmed the formation of this island (figure 23). Brown discolored water and floating pumice were present surrounding the island.
The eruption continued during November. During an overflight on 3 November observers photographed the island and noted that material was ejected 169 m high, according to a news source. Explosions gradually became shorter, and, by the 3rd, they occurred every few seconds; dark and incandescent material were ejected about 800 m above the vent. On 4 November eruptions were accompanied by explosive sounds. Floating, brown-colored pumice was present in the water surrounding the island. There was a brief increase in the number of volcanic earthquakes during 8-14 November and 24-25 November. The eruption temporarily paused during 9-11 November and by 12 November eruptions resumed to the W of the island. On 10 November dark brown-to-dark yellow-green discolored water and a small amount of black floating material was observed (figure 25). A small eruption was reported on 18 November off the NE coast of the island, accompanied by white gas-and-steam plumes (figure 23). Another pause was recorded during 17-19 November, which then resumed on 20 November and continued erupting intermittently. According to a field survey conducted by the National Institute for Disaster Prevention Science and Technology on 19 November, a 30-m diameter crater was visible on the NE coast where landslides, hot water, and gray volcanic ash containing clay have occurred and been distributed previously. Erupted blocks about 10 cm in diameter were distributed about 90-120 m from the crater. JCG made observations during an overflight on 23 November and reported a phreatomagmatic eruption. Explosions at the main vent generated dark gas-and-ash plumes that rose to 200 m altitude and ejected large blocks that landed on the island and in the ocean (figure 26). Discolored water also surrounded the island. The size of the new island had grown to 450 m N-S x 200 m E-W by 23 November, according to JCG.
The eruption continued through 11 December, followed by a brief pause in activity, which then resumed on 31 December, according to JMA. Intermittent explosions produced 100-m-high black plumes at intervals of several minutes to 30 minutes during 1-10 December. Overflights were conducted on 4 and 15 December and reported that the water surrounding the new island was discolored to dark brown-to-dark yellow-green (figure 27). No floating material was reported during this time. In comparison to the observations made on 23 November, the new land had extended N and part of it had eroded away. In addition, analysis by the Geospatial Information Authority of Japan using SAR data from Daichi-2 also confirmed that the area of the new island continued to decrease between 4 and 15 December. Ejected material combined with wave erosion transformed the island into a “J” shape, 500-m-long and with the curved part about 200 m offshore of Ioto. The island was covered with brown ash and blocks, and the surrounding water was discolored to greenish-brown and contained an area of floating pumice. JCG reported from an overflight on 4 December that volcanic ash-like material found around the S vent on the NE part of the island was newly deposited since 10 November (figure 28). By 15 December the N part of the “J” shaped island had separated and migrated N, connecting to the Okinahama coast and the curved part of the “J” had eroded into two smaller islands (figure 27).
References. Ukawa, M., Fujita, E., Kobayashi, T., 2002, Recent volcanic activity of Iwo Jima and the 2001 eruption, Monthly Chikyu, Extra No. 39, 157-164.
Geologic Background. Ioto, in the Volcano Islands of Japan, lies within a 9-km-wide submarine caldera. The volcano is also known as Ogasawara-Iojima to distinguish it from several other "Sulfur Island" volcanoes in Japan. The triangular, low-elevation, 8-km-long island narrows toward its SW tip and has produced trachyandesitic and trachytic rocks that are more alkalic than those of other volcanoes in this arc. The island has undergone uplift for at least the past 700 years, accompanying resurgent doming of the caldera; a shoreline landed upon by Captain Cook's surveying crew in 1779 is now 40 m above sea level. The Motoyama plateau on the NE half of the island consists of submarine tuffs overlain by coral deposits and forms the island's high point. Many fumaroles are oriented along a NE-SW zone cutting through Motoyama. Numerous recorded phreatic eruptions, many from vents on the W and NW sides of the island, have accompanied the uplift.
Information Contacts: Japan Meteorological Agency (JMA), 1-3-4 Otemachi, Chiyoda-ku, Tokyo 100-8122, Japan (URL: http://www.jma.go.jp/jma/indexe.html); Japan Coast Guard (JCG) Volcano Database, Hydrographic and Oceanographic Department, 3-1-1, Kasumigaseki, Chiyoda-ku, Tokyo 100-8932, Japan (URL: https://www1.kaiho.mlit.go.jp/GIJUTSUKOKUSAI/kaiikiDB/kaiyo22-2.htm); Copernicus Browser, Copernicus Data Space Ecosystem, European Space Agency (URL: https://dataspace.copernicus.eu/browser/); Asahi, 5-3-2, Tsukiji, Chuo Ward, Tokyo, 104-8011, Japan (URL: https://www.asahi.com/ajw/articles/15048458).
Purace (Colombia) — December 2023 Cite this Report
Purace
Colombia
2.3095°N, 76.3948°W; summit elev. 4650 m
All times are local (unless otherwise noted)
Gas-and-ash emission on 16 November 2023
Puracé, located in Colombia, is a stratovolcano that contains a 500-m-wide summit crater. It is part of the Los Coconucos volcanic chain that is a NW-SE trending group of seven cones and craters. The most recent eruption occurred during March 2022 that was characterized by frequent seismicity and gas-and-steam emissions (BGVN 47:06). This report covers a brief eruption during November 2023 based on monthly reports from the Popayán Observatory, part of the Servicio Geologico Colombiano (SGC).
Activity during November 2022 through November 2023 primarily consisted of seismicity: VT-type events, LP-type events, HB-type events, and TR-type events (table 4). Maximum sulfur dioxide values were measured weekly and ranged from 259-5,854 tons per day (t/d) during November 2022 through April 2023. White gas-and-steam emissions were also occasionally reported.
SGC issued a report on 25 October that noted a significant increase in the number of earthquakes associated with rock fracturing. These earthquakes were located SE of the crater between Puracé and Piocollo at depths of 1-4 km. There were no reported variations in sulfur dioxide values, but SGC noted high carbon dioxide values, compared to those recorded in the first half of 2023.
SGC reported that at 1929 on 16 November the seismic network detected a signal that was possibly associated with a gas-and-ash emission, though it was not confirmed in webcam images due to limited visibility. On 17 November an observer confirmed ash deposits on the N flank. Webcam images showed an increase in degassing both inside the crater and from the NW flank, rising 700 m above the crater.
Table 4. Seismicity at Puracé during November 2022-November 2023. Volcano-tectonic (VT), long-period (LP), hybrid (HB), and tremor (TR) events are reported each month. Courtesy of SGC.
| Month |
Volcano-tectonic |
Long-period |
Hybrid |
Tremor |
| Nov 2022 |
429 |
2,023 |
5 |
831 |
| Dec 2022 |
423 |
1,390 |
9 |
834 |
| Jan 2023 |
719 |
1,622 |
0 |
957 |
| Feb 2023 |
598 |
1,701 |
2 |
1,124 |
| Mar 2023 |
331 |
2,408 |
147 |
607 |
| Apr 2023 |
614 |
4,427 |
33 |
148 |
| May 2023 |
620 |
3,717 |
170 |
109 |
| Jun 2023 |
467 |
3,293 |
86 |
148 |
| Jul 2023 |
1,116 |
5,809 |
183 |
542 |
| Aug 2023 |
692 |
2,927 |
94 |
321 |
| Sep 2023 |
887 |
1,505 |
82 |
848 |
| Oct 2023 |
2,373 |
2,949 |
135 |
692 |
| Nov 2023 |
1,212 |
2,302 |
69 |
293 |
Geologic Background. Puracé is an active andesitic volcano with a 600-m-diameter summit crater at the NW end of the Los Coconucos Volcanic Chain. This volcanic complex includes nine composite and five monogenetic volcanoes, extending from the Puracé crater more than 6 km SE to the summit of Pan de Azúcar stratovolcano. The dacitic massif which the complex is built on extends about 13 km NW-SE and 10 km NE-SW. Frequent small to moderate explosive eruptions reported since 1816 CE have modified the morphology of the summit crater, with the largest eruptions in 1849, 1869, and 1885.
Information Contacts: Servicio Geologico Colombiano (SGC), Diagonal 53 No. 34-53 - Bogotá D.C., Colombia (URL: https://www.sgc.gov.co/volcanes).
Suwanosejima (Japan) — December 2023 Cite this Report
Suwanosejima
Japan
29.638°N, 129.714°E; summit elev. 796 m
All times are local (unless otherwise noted)
Eruption plumes, crater incandescence, and occasional explosions during July-October 2023
Suwanosejima is an 8-km-long island that consists of a stratovolcano and two active summit craters, located in the northern Ryukyu Islands, Japan. Volcanism over the past century has been characterized by Strombolian explosions, ash plumes, and ashfall. The current eruption began in October 2004 and has more recently consisted of frequent eruption plumes, explosions, and incandescent ejecta (BGVN 48:07). This report covers similar activity of ash plumes, explosions, and crater incandescence during July through October 2023 using monthly reports from the Japan Meteorological Agency (JMA) and satellite data.
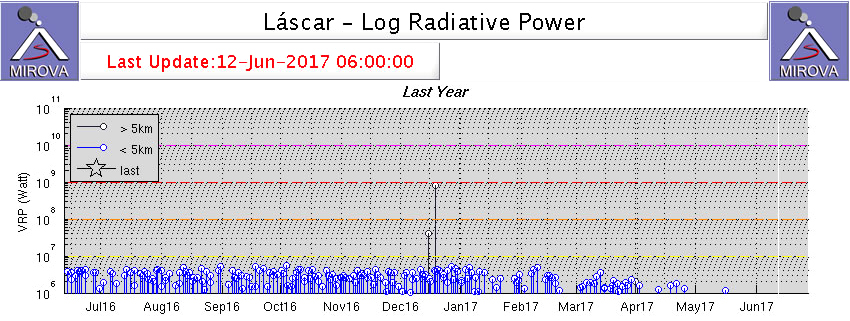
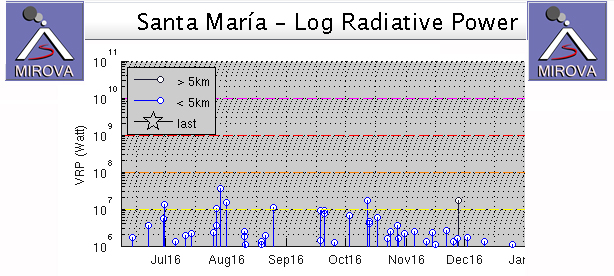
Thermal activity during the reporting period was relatively low; only one low-power thermal anomaly was detected during mid-July and one during early August, based on a MIROVA (Middle InfraRed Observation of Volcanic Activity) Log Radiative Power graph of the MODIS thermal anomaly data. On two clear weather days, a thermal anomaly was visible in infrared satellite images (figure 81).
Low-level activity was reported at the Otake crater during July and no explosions were detected. Eruption plumes rose as high as 1.8 km above the crater. On 13 July an ash plume rose 1.7 km above the crater rim, based on a webcam image. During the night of the 28th crater incandescence was visible in a webcam image. An eruptive event reported on 31 July produced an eruption plume that rose 2.1 km above the crater. Seismicity consisted of 11 volcanic earthquakes on the W flank, the number of which had decreased compared to June (28) and 68 volcanic earthquakes near the Otake crater, which had decreased from 722 in the previous month. According to observations conducted by the University of Tokyo Graduate School of Science, Kyoto University Disaster Prevention Research Institute, Toshima Village, and JMA, the amount of sulfur dioxide emissions released during the month was 400-800 tons per day (t/d).
Eruptive activity in the Otake crater continued during August and no explosions were reported. An eruptive event produced a plume that rose 1 km above the crater at 1447 on 12 August. Subsequent eruptive events were recorded at 0911 on 16 August, at 1303 on 20 August, and at 0317 on 21 August, which produced ash plumes that rose 1-1.1 km above the crater and drifted SE, SW, and W. On 22 August an ash plume was captured in a webcam image rising 1.4 km above the crater (figure 82). Multiple eruptive events were detected on 25 August at 0544, 0742, 0824, 1424, and 1704, which generated ash plumes that rose 1.1-1.2 km above the crater and drifted NE, W, and SW. On 28 August a small amount of ashfall was observed as far as 1.5 km from the crater. There were 17 volcanic earthquakes recorded on the W flank of the volcano and 79 recorded at the Otake crater during the month. The amount of sulfur dioxide emissions released during the month was 400-800 t/d.
Activity continued at the Otake crater during September. Occasionally, nighttime crater incandescence was observed in webcam images and ashfall was reported. An eruptive event at 1949 on 4 September produced an ash plume that rose 1 km above the crater and drifted SW. On 9 September several eruption events were detected at 0221, 0301, and 0333, which produced ash plumes that rose 1.1-1.4 km above the crater rim and drifted W; continuous ash emissions during 0404-0740 rose to a maximum height of 2 km above the crater rim (figure 83). More eruptive events were reported at 1437 on 10 September, at 0319 on 11 September, and at 0511 and 1228 on 15 September, which generated ash plumes that rose 1-1.8 km above the crater. During 25, 27, and 30 September, ash plumes rose as high as 1.3 km above the crater rim. JMA reported that large blocks were ejected as far as 300 m from the center of the crater. There were 18 volcanic earthquakes detected beneath the W flank and 82 volcanic earthquakes detected near the Otake crater. The amount of sulfur dioxide released during the month ranged from 600 to 1,600 t/d.
Activity during early-to-mid-October consisted of occasional explosions, a total number of 13, and ash plumes that rose as high as 1.9 km above the Otake crater rim on 29 October (figure 84). These explosions are the first to have occurred since June 2023. Continuous ash emissions were reported during 0510-0555 on 1 October. Explosions were recorded at 0304, 2141, and 2359 on 2 October, at 0112 on 3 October, and at 1326 on 6 October, which produced ash plumes that rose as high as 1 km above the crater rim and drifted SW and W. An explosion was noted at 0428 on 3 October, but emission details were unknown. A total of eight explosions were recorded by the seismic network at 1522 on 14 October, at 0337, 0433, 0555, 1008, and 1539 on 15 October, and at 0454 and 0517 on 16 October. Ash plumes from these explosions rose as high as 900 m above the crater and drifted SE. Eruptive events during 25-27 and 29-30 October generated plumes that rose as high as 1.9 km above the crater and drifted SE, S, and SW. Ash was deposited in Toshima village (3.5 km SSW). Eruptive activity occasionally ejected large volcanic blocks as far as 600 m from the crater. Nighttime crater incandescence was visible in webcams. Intermittent ashfall was reported as far as 1.5 km from the crater. There were 43 volcanic earthquakes detected on the W flank during the month, and 184 volcanic earthquakes detected near the Otake crater. The amount of sulfur dioxide emitted ranged between 400 and 900 t/d.
Geologic Background. The 8-km-long island of Suwanosejima in the northern Ryukyu Islands consists of an andesitic stratovolcano with two active summit craters. The summit is truncated by a large breached crater extending to the sea on the E flank that was formed by edifice collapse. One of Japan's most frequently active volcanoes, it was in a state of intermittent Strombolian activity from Otake, the NE summit crater, between 1949 and 1996, after which periods of inactivity lengthened. The largest recorded eruption took place in 1813-14, when thick scoria deposits covered residential areas, and the SW crater produced two lava flows that reached the western coast. At the end of the eruption the summit of Otake collapsed, forming a large debris avalanche and creating an open collapse scarp extending to the eastern coast. The island remained uninhabited for about 70 years after the 1813-1814 eruption. Lava flows reached the eastern coast of the island in 1884. Only about 50 people live on the island.
Information Contacts: Japan Meteorological Agency (JMA), 1-3-4 Otemachi, Chiyoda-ku, Tokyo 100-8122, Japan (URL: http://www.jma.go.jp/jma/indexe.html); MIROVA (Middle InfraRed Observation of Volcanic Activity), a collaborative project between the Universities of Turin and Florence (Italy) supported by the Centre for Volcanic Risk of the Italian Civil Protection Department (URL: http://www.mirovaweb.it/); Hawai'i Institute of Geophysics and Planetology (HIGP) - MODVOLC Thermal Alerts System, School of Ocean and Earth Science and Technology (SOEST), Univ. of Hawai'i, 2525 Correa Road, Honolulu, HI 96822, USA (URL: http://modis.higp.hawaii.edu/); Copernicus Browser, Copernicus Data Space Ecosystem, European Space Agency (URL: https://dataspace.copernicus.eu/browser/).
Etna
Italy
37.748°N, 14.999°E; summit elev. 3357 m
All times are local (unless otherwise noted)
Strombolian explosions, lava fountains, and lava flows during July-August 2023
Etna, located on the Italian island of Sicily, has had documented eruptions dating back to 1500 BCE. Activity typically originates from multiple cones at the summit, where several craters have formed and evolved. The currently active craters are Northeast Crater (NEC), Voragine (VOR), and Bocca Nuova (BN), and the Southeast Crater (SEC); VOR and BN were previously referred to as the “Central Crater”. The original Southeast crater formed in 1978, and a second eruptive site that opened on its SE flank in 2011 was named the New Southeast Crater (NSEC). Another eruptive site between the SEC and NSEC developed during early 2017 and was referred to as the "cono della sella" (saddle cone). The current eruption period began in November 2022 and has been characterized by intermittent Strombolian activity, lava flows, and ash plumes (BGVN 48:08). This report updates activity during July through October 2023, which includes primarily gas-and-steam emissions; during July and August Strombolian explosions, lava fountains, and lava flows were reported, based on weekly and special reports by the Osservatorio Etneo (OE), part of the Catania Branch of Italy's Istituo Nazionale di Geofisica e Vulcanologica (INGV) and satellite data.
Variable fumarolic degassing was reported at all summit craters (BN, VOR, NEC, and SEC) throughout the entire reporting period (table 15). The MIROVA (Middle InfraRed Observation of Volcanic Activity) volcano hotspot detection system based on the analysis of MODIS data showed frequent low-to-moderate power thermal anomalies during the reporting period (figure 399). During mid-August there was a pulse in activity that showed an increase in the power of the anomalies due to Strombolian activity, lava fountains, and lava flows. Infrared satellite imagery captured strong thermal anomalies at the central and southeast summit crater areas (figure 400). Accompanying thermal activity were occasional sulfur dioxide plumes that exceeded 2 Dobson Units (DUs) recorded by the TROPOMI instrument on the Sentinel-5P satellite (figure 401).
Table 15. Summary of activity at the four primary crater areas at the summit of Etna during July-October 2023. Information is from INGV weekly reports.
| Month |
Bocca Nuova (BN) |
Voragine (VOR) |
Northeast Crater (NEC) |
Southeast Crater (SEC) |
| Jul 2023 |
Continuous degassing. |
No observations. |
Weak gas emissions. |
Continuous degassing. Sporadic and weak-to-moderate ash emissions. Strombolian explosions. |
| Aug 2023 |
Continuous degassing. |
No observations. |
No observations. |
Continuous degassing. Occasional ash emissions. Strombolian activity, lava fountaining, and lava flows. |
| Sep 2023 |
Variable degassing. Crater incandescence. |
Weak fumarolic activity. |
Weak fumarolic activity. |
Variable degassing. |
| Oct 2023 |
Continuous degassing. |
Weak fumarolic activity. |
Weak fumarolic activity. |
Continuous degassing. |
Activity during July and August was relatively low and mainly consisted of degassing at the summit craters, particularly at SEC and BN. Cloudy weather prevented clear views of the summit during early July. During the night of 2 July some crater incandescence was visible at SEC. Explosive activity resumed at SEC during 9-10 July, which was characterized by sporadic and weak ash emissions that rapidly dispersed in the summit area (figure 402). INGV reported moderate Strombolian activity began at 2034 on 14 July and was confined to the inside of the crater and fed by a vent located in the E part of SEC. An ash emission was detected at 2037. A new vent opened on 15 July in the SE part of BN and began to produce continuous gas-and-steam emissions. During an inspection carried out on 28 July pulsating degassing, along with audible booms, were reported at two active vents in BN. Vigorous gas-and-steam emissions intermittently generated rings. On rare occasions, fine, reddish ash was emitted from BN1 and resuspended by the gas-and-steam emissions.
Around 2000 on 13 August INGV reported a sudden increase in volcanic tremor amplitude. Significant infrasonic activity coincided with the tremor increase. Incandescent flashes were visible through the cloud cover in webcam images of SEC (figure 403). Strombolian activity at SEC began to gradually intensify starting at 2040 as seismicity continued to increase. The Aviation Color Code (ACC) was raised to Yellow (the second lowest-level on a four-color scale) at 2126 and then to Orange (the second highest-level on a four-color scale) at 2129 due to above-background activity. The activity rapidly transitioned from Strombolian activity to lava fountains around 2333 that rose 300-400 m above the crater (figure 403). Activity was initially focused on the E vent of the crater, but then the vent located above the S flank of the cone also became active. A lava flow from this vent traveled SW into the drainage created on 10 February 2022, overlapping with previous flows from 10 and 21 February 2022 and 21 May 2023, moving between Monte Barbagallo and Monte Frumento Supino (figure 404). The lava flow was 350 m long, oriented NNE-SSW, and descended to an elevation of 2.8 km. Flows covered an area of 300,000 m2 and had an estimated volume of 900,000 m3. The ACC was raised to Red at 2241 based on strong explosive activity and ashfall in Rifugio Sapienza-Piano Vetore at 1.7 km elevation on the S flank. INGV reported that pyroclastic flows accompanied this activity.
Activity peaked between 0240 and 0330 on 14 August, when roughly 5-6 vents erupted lava fountains from the E to SW flank of SEC. The easternmost vents produced lava fountains that ejected material strongly to the E, which caused heavy fallout of incandescent pyroclastic material on the underlying flank, triggering small pyroclastic flows. This event was also accompanied by lightning both in the ash column and in the ash clouds that were generated by the pyroclastic flows. A fracture characterized by a series of collapse craters (pit craters) opened on the upper SW flank of SEC. An ash cloud rose a few kilometers above the crater and drifted S, causing ash and lapilli falls in Rifugio Sapienza and expanding toward Nicolosi, Mascalucia, Catania, and up to Syracuse. Ashfall resulted in operational problems at the Catania airport (50 km S), which lasted from 0238 until 2000. By 0420 the volcanic tremor amplitude values declined to background levels. After 0500 activity sharply decreased, although the ash cloud remained for several hours and drifted S. By late morning, activity had completely stopped. The ACC was lowered to Orange as volcanic ash was confined to the summit area. Sporadic, minor ash emissions continued throughout the day. At 1415 the ACC was lowered to Yellow and then to Green at 1417.
During the night of 14-15 August only occasional flashes were observed, which were more intense during avalanches of material inside the eruptive vents. Small explosions were detected at SEC at 2346 on 14 August and at 0900 on 26 August that each produced ash clouds which rapidly dispersed into the atmosphere (figure 405). According to a webcam image, an explosive event detected at 2344 at SEC generated a modest ash cloud that was rapidly dispersed by winds. The ACC was raised to Yellow at 2355 on 14 August due to increasing unrest and was lowered to Green at 0954 on 15 August.
Activity during September and October was relatively low and mainly characterized by variable degassing from BN and SEC. Intense, continuous, and pulsating degassing was accompanied by roaring sounds and flashes of incandescence at BN both from BN1 and the new pit crater that formed during late July (figure 406). The degassing from the new pit crater sometimes emitted vapor rings. Cloudy weather during 6-8 September prevented observations of the summit craters .
Geologic Background. Mount Etna, towering above Catania on the island of Sicily, has one of the world's longest documented records of volcanism, dating back to 1500 BCE. Historical lava flows of basaltic composition cover much of the surface of this massive volcano, whose edifice is the highest and most voluminous in Italy. The Mongibello stratovolcano, truncated by several small calderas, was constructed during the late Pleistocene and Holocene over an older shield volcano. The most prominent morphological feature of Etna is the Valle del Bove, a 5 x 10 km caldera open to the east. Two styles of eruptive activity typically occur, sometimes simultaneously. Persistent explosive eruptions, sometimes with minor lava emissions, take place from one or more summit craters. Flank vents, typically with higher effusion rates, are less frequently active and originate from fissures that open progressively downward from near the summit (usually accompanied by Strombolian eruptions at the upper end). Cinder cones are commonly constructed over the vents of lower-flank lava flows. Lava flows extend to the foot of the volcano on all sides and have reached the sea over a broad area on the SE flank.
Information Contacts: Sezione di Catania - Osservatorio Etneo, Istituto Nazionale di Geofisica e Vulcanologia (INGV), Sezione di Catania, Piazza Roma 2, 95123 Catania, Italy (URL: http://www.ct.ingv.it/it/); MIROVA (Middle InfraRed Observation of Volcanic Activity), a collaborative project between the Universities of Turin and Florence (Italy) supported by the Centre for Volcanic Risk of the Italian Civil Protection Department (URL: http://www.mirovaweb.it/); NASA Global Sulfur Dioxide Monitoring Page, Atmospheric Chemistry and Dynamics Laboratory, NASA Goddard Space Flight Center (NASA/GSFC), 8800 Greenbelt Road, Goddard MD 20771, USA (URL: https://so2.gsfc.nasa.gov/); Copernicus Browser, Copernicus Data Space Ecosystem, European Space Agency (URL: https://dataspace.copernicus.eu/browser/).
Aira
Japan
31.5772°N, 130.6589°E; summit elev. 1117 m
All times are local (unless otherwise noted)
Explosions, ash plumes, ash fall, and crater incandescence during July-October 2023
Aira caldera, located in the northern half of Kagoshima Bay, Japan, contains the post-caldera Sakurajima volcano. Eruptions typically originate from the Minamidake crater, and since the 8th century, ash deposits have been recorded in the city of Kagoshima (10 km W), one of Kyushu’s largest cities. The Minamidake summit cone and crater has had persistent activity since 1955; the Showa crater on the E flank has also been intermittently active since 2006. The current eruption period began during March 2017 and has recently been characterized by intermittent explosions, eruption plumes, and ashfall (BGVN 48:07). This report updates activity during July through October 2023 and describes explosive events, ash plumes, nighttime crater incandescence, and ashfall, according to monthly activity reports from the Japan Meteorological Agency (JMA) and satellite data.
Thermal activity remained at low levels during this reporting period, according to the MIROVA (Middle InfraRed Observation of Volcanic Activity) system (figure 149). There was a slight increase in the number of anomalies during September through October. Occasional thermal anomalies were visible in infrared satellite images mainly at the Minamidake crater (Vent A is located to the left and Vent B is located to the right) (figure 150).
Table 30. Number of monthly explosive events, days of ashfall, area of ash covered, and sulfur dioxide emissions from Sakurajima’s Minamidake crater at Aira during July-October 2023. Note that smaller ash events are not listed. Ashfall days were measured at Kagoshima Local Meteorological Observatory and ashfall amounts represent material covering all the Kagoshima Prefecture. Data courtesy of JMA monthly reports.
| Month |
Explosive events |
Days of ashfall |
Ashfall amount (g/m2) |
SO2 emissions (tons/day) |
| Jul 2023 |
3 |
0 |
0 |
1,600-3,200 |
| Aug 2023 |
3 |
10 |
7 |
1,800-3,300 |
| Sep 2023 |
3 |
7 |
3 |
1,600-2,300 |
| Oct 2023 |
33 |
8 |
61 |
2,200-4,200 |
JMA reported that during July, there were eight eruptions, three of which were explosion events in the Showa crater. Large blocks were ejected as far as 600 m from the Showa crater. Very small eruptions were occasionally reported at the Minamidake crater. Nighttime incandescence was observed in both the Showa and Minamidake crater. Explosions were reported on 16 July at 2314 and on 17 July at 1224 and at 1232 (figure 151). Resulting eruption plumes rose 700-2,500 m above the crater and drifted N. On 23 July the number of volcanic earthquakes on the SW flank of the volcano increased. A strong Mw 3.1 volcanic earthquake was detected at 1054 on 26 July. The number of earthquakes recorded throughout the month was 545, which markedly increased from 73 in June. No ashfall was observed at the Kagoshima Regional Meteorological Observatory during July. According to a field survey conducted during the month, the daily amount of sulfur dioxide emissions was 1,600-3,200 tons per day (t/d).
There were three eruptions reported at the Minamidake crater during August, each of which were explosive. The explosions occurred on 9 August at 0345, on 13 August at 2205, and on 31 August at 0640, which generated ash plumes that rose 800-2,000 m above the crater and drifted W. There were two eruptions detected at Showa crater; on 4 August at 2150 ejecta traveled 800 m from the Showa crater and associated eruption plumes rose 2.3 km above the crater. The explosion at 2205 on 13 August generated an ash plume that rose 2 km above the crater and was accompanied by large blocks that were ejected 600 m from the Minamidake crater (figure 152). Nighttime crater incandescence was visible in a high-sensitivity surveillance camera at both craters. Seismicity consisted of 163 volcanic earthquakes, 84 of which were detected on the SW flank. According to the Kagoshima Regional Meteorological Observatory there was a total of 7 g/m2 of ashfall over the course of 10 days during the month. According to a field survey, the daily amount of sulfur dioxide emitted was 1,800-3,300 t/d.
During September, four eruptions were reported, three of which were explosion events. These events occurred at 1512 on 9 September, at 0018 on 11 September, and at 2211 on 13 September. Resulting ash plumes generally rose 800-1,100 m above the crater. An explosion produced an ash plume at 2211 on 13 September that rose as high as 1.7 km above the crater. Large volcanic blocks were ejected 600 m from the Minamidake crater. Smaller eruptions were occasionally observed at the Showa crater. Nighttime crater incandescence was visible at the Minamidake crater. Seismicity was characterized by 68 volcanic earthquakes, 28 of which were detected beneath the SW flank. According to the Kagoshima Regional Meteorological Observatory there was a total of 3 g/m2 of ashfall over the course of seven days during the month. A field survey reported that the daily amount of sulfur dioxide emitted was 1,600-2,300 t/d.
Eruptive activity during October consisted of 69 eruptions, 33 of which were described as explosive. These explosions occurred during 4 and 11-21 October and generated ash plumes that rose 500-3,600 m above the crater and drifted S, E, SE, and N. On 19 October at 1648 an explosion generated an ash plume that rose 3.6 km above the crater (figure 153). No eruptions were reported in the Showa crater; white gas-and-steam emissions rose 100 m above the crater from a vent on the N flank. Nighttime incandescence was observed at the Minamidake crater. On 24 October an eruption was reported from 0346 through 0430, which included an ash plume that rose 3.4 km above the crater. Ejected blocks traveled 1.2 km from the Minamidake crater. Following this eruption, small amounts of ashfall were observed from Arimura (4.5 km SE) and a varying amount in Kurokami (4 km E) (figure 154). The number of recorded volcanic earthquakes during the month was 190, of which 14 were located beneath the SW flank. Approximately 61 g/m2 of ashfall was reported over eight days of the month. According to a field survey, the daily amount of sulfur dioxide emitted was 2,200-4,200 t/d.
Geologic Background. The Aira caldera in the northern half of Kagoshima Bay contains the post-caldera Sakurajima volcano, one of Japan's most active. Eruption of the voluminous Ito pyroclastic flow accompanied formation of the 17 x 23 km caldera about 22,000 years ago. The smaller Wakamiko caldera was formed during the early Holocene in the NE corner of the caldera, along with several post-caldera cones. The construction of Sakurajima began about 13,000 years ago on the southern rim and built an island that was joined to the Osumi Peninsula during the major explosive and effusive eruption of 1914. Activity at the Kitadake summit cone ended about 4,850 years ago, after which eruptions took place at Minamidake. Frequent eruptions since the 8th century have deposited ash on the city of Kagoshima, located across Kagoshima Bay only 8 km from the summit. The largest recorded eruption took place during 1471-76.
Information Contacts: Japan Meteorological Agency (JMA), 1-3-4 Otemachi, Chiyoda-ku, Tokyo 100-8122, Japan (URL: http://www.jma.go.jp/jma/indexe.html); MIROVA (Middle InfraRed Observation of Volcanic Activity), a collaborative project between the Universities of Turin and Florence (Italy) supported by the Centre for Volcanic Risk of the Italian Civil Protection Department (URL: http://www.mirovaweb.it/); Copernicus Browser, Copernicus Data Space Ecosystem, European Space Agency (URL: https://dataspace.copernicus.eu/browser/).
Nishinoshima (Japan) — November 2023 Cite this Report
Nishinoshima
Japan
27.247°N, 140.874°E; summit elev. 100 m
All times are local (unless otherwise noted)
Gray emissions during October 2023
Nishinoshima is a small island in the Ogasawara Arc, about 1,000 km S of Tokyo, Japan. It contains prominent submarine peaks to the S, W, and NE. Recorded eruptions date back to 1973, with the current eruption period beginning in October 2022. Eruption plumes and fumarolic activity characterize recent activity (BGVN 48:10). This report covers the end of the eruption for September through October 2023, based on information from monthly reports of the Japan Meteorological Agency (JMA) monthly reports, and satellite data.
No eruptive activity was reported during September 2023, although JMA noted that the surface temperature was slightly elevated compared to the surrounding area since early March 2023. The Japan Coast Guard (JCG) conducted an overflight on 20 September and reported white gas-and-steam plumes rising 3 km above the central crater of the pyroclastic cone, as well as multiple white gas-and-steam emissions emanating from the N, E, and S flanks of the crater to the coastline. In addition, dark reddish brown-to-green discolored water was distributed around almost the entire circumference of the island.
Similar low-level activity was reported during October. Multiple white gas-and-steam emissions rose from the N, E, and S flanks of the central crater of the pyroclastic cone and along the coastline; these emissions were more intense compared to the previous overflight observations. Dark reddish brown-to-green discolored water remained visible around the circumference of the island. On 4 October aerial observations by JCG showed a small eruption consisting of continuous gas-and-steam emissions emanating from the central crater, with gray emissions rising to 1.5 km altitude (figure 129). According to observations from the marine weather observation vessel Keifu Maru on 26 October, white gas-and-steam emissions persisted from the center of the pyroclastic cone, as well as from the NW, SW, and SE coasts of the island for about five minutes. Slightly discolored water was visible up to about 1 km.
Frequent low-to-moderate power thermal anomalies were recorded in the MIROVA graph (Middle InfraRed Observation of Volcanic Activity) during September (figure 130). Occasional anomalies were detected during October, and fewer during November through December. A thermal anomaly was visible in the crater using infrared satellite imagery on 6, 8, 11, 16, 18, 21, and 23 September and 8, 13, 21, 26, and 28 October (figure 131).
Geologic Background. The small island of Nishinoshima was enlarged when several new islands coalesced during an eruption in 1973-74. Multiple eruptions that began in 2013 completely covered the previous exposed surface and continued to enlarge the island. The island is the summit of a massive submarine volcano that has prominent peaks to the S, W, and NE. The summit of the southern cone rises to within 214 m of the ocean surface 9 km SSE.
Information Contacts: Japan Meteorological Agency (JMA), 1-3-4 Otemachi, Chiyoda-ku, Tokyo 100-8122, Japan (URL: http://www.jma.go.jp/jma/indexe.html); MIROVA (Middle InfraRed Observation of Volcanic Activity), a collaborative project between the Universities of Turin and Florence (Italy) supported by the Centre for Volcanic Risk of the Italian Civil Protection Department (URL: http://www.mirovaweb.it/); Copernicus Browser, Copernicus Data Space Ecosystem, European Space Agency (URL: https://dataspace.copernicus.eu/browser/).
Kilauea (United States) — October 2023 Cite this Report
Kilauea
United States
19.421°N, 155.287°W; summit elev. 1222 m
All times are local (unless otherwise noted)
Strong lava fountains, lava flows, and spatter at Halema’uma’u during January-September 2023
Kīlauea is on the island of Hawai’i and overlaps the E flank of the Mauna Loa volcano. Its East Rift Zone (ERZ) has been intermittently active for at least 2,000 years. An extended eruption period began in January 1983 and was characterized by open lava lakes and lava flows from the summit caldera and the East Rift Zone. During May 2018 magma migrated into the Lower East Rift Zone (LERZ) and opened 24 fissures along a 6-km-long NE-trending fracture zone that produced lava flows traveling in multiple directions. As lava emerged from the fissures, the lava lake at Halema'uma'u drained and explosions sent ash plumes to several kilometers altitude (BGVN 43:10).
The current eruption period started during September 2021 and has been characterized by low-level lava effusions in the active Halema’uma’u lava lake (BGVN 48:01). This report covers three notable eruption periods during February, June, and September 2023 consisting of lava fountaining, lava flows, and spatter during January through September 2023 using information from daily reports, volcanic activity notices, and abundant photo, map, and video data from the US Geological Survey's (USGS) Hawaiian Volcano Observatory (HVO).
Activity during January 2023. Small earthquake swarms were recorded on 2 January 2023; increased seismicity and changes in the pattern of deformation were noted on the morning of 5 January. At around 1500 both the rate of deformation and seismicity drastically increased, which suggested magma movement toward the surface. HVO raised the Volcano Alert Level (VAL) to Watch (the second highest level on a four-level scale) and the Aviation Color Code (ACC) to Orange (the second highest color on a four-color scale) at 1520.
Multiple lava fountains and lava effusions from vents in the central eastern portion of the Halema’uma’u crater began on 5 January around 0434; activity was confined to the eastern half of the crater and within the basin of the western half of the crater, which was the focus of the eruption in 2021-2022 (figure 525). Incandescence was visible in webcam images at 1634 on 5 January, prompting HVO to raise the VAL to Warning (the highest level on a four-level scale) and the ACC to Red (the highest color on a four-color scale). Lava fountains initially rose as high as 50 m above the vent at the onset of the eruption (figure 526) but then declined to a more consistent 5-6 m height in the proceeding days. By 1930 that same day, lava had covered most of the crater floor (an area of about 1,200,000 m2) and the lava lake had a depth of 10 m. A higher-elevation island that formed during the initial phase of the December 2020 eruption remained exposed, appearing darker in images, along with a ring of older lava around the lava lake that was active prior to December 2022. Overnight during 5-6 January the lava fountains continued to rise 5 m high, and the lava effusion rate had slowed.
On 6 January at 0815 HVO lowered the VAL to Watch and the ACC to Orange due to the declining effusion rates. Sulfur dioxide emission rates ranged from 3,000-12,500 tonnes per day (t/d), the highest value of which was recorded on 6 January. Lava continued to erupt from the vents during 6-8 January, although the footprint of the active area had shrunk; a similar progression has been commonly observed during the early stages of recent eruptions at Halema’uma’u. On 9 January HVO reported one dominant lava fountain rising 6-7 m high in the E half of the crater. Lava flows built up the margins of the lake, causing the lake to be perched. On 10 January the eastern lava lake had an area of approximately 120,000 m2 that increased to 250,000 m2 by 17 January. During 13-31 January several small overflows occurred along the margins of the E lake. A smaller area of lava was active within the basin in the W half of the crater that had been the focus of activity during 2021-2022. On 19 January just after 0200 a small ooze-out was observed on the crater’s W edge.
Activity during February 2023. Activity continued in the E part of Halema’uma’u crater, as well as in a smaller basin in the W part of the 2021-2022 lava lake (figure 527). The E lava lake contained a single lava fountain and frequent overflows. HVO reported that during the morning of 1 February the large E lava lake began to cool and crust over in the center of the lake; two smaller areas of lava were observed on the N and S sides by the afternoon. The dominant lava fountain located in the S part of the lava lake paused for roughly 45 minutes at 2315 and resumed by midnight, rising 1-2 m. At 0100 on 2 February lava from the S part was effusing across the entire E lava lake area, covering the crusted over portion in the center of the lake and continuing across the majority of the previously measured 250,000 m2 by 0400. A small lava pond near the E lake produced an overflow around 0716 on 2 February. On 3 February some lava crust began to form against the N and E levees, which defined the 250,000 m2 eastern lava lake. The small S lava fountain remained active, rising 1-6 m high during 3-9 February; around 0400 on 5 February occasional bursts doubled the height of the lava fountain.
A large breakout occurred overnight during 2100 on 4 February to 0900 on 5 February on the N part of the crater floor, equal to or slightly larger in size than the E lava lake. A second, smaller lava fountain appeared in the same area of the E lava lake between 0300 and 0700 on 5 February and was temporarily active. This large breakout continued until 7 February. A small, brief breakout was reported in the S of the E lava lake around midnight on 7 February. In the W lake, as well as the smaller lava pond in the central portion of the crater floor, contained several overflows during 7-10 February and intermittent fountaining. Activity at the S small lava pond and the small S lava fountain within the E lake declined during 9-10 February. The lava pond in the central portion of the crater floor had nearly continuous, expansive flows during 10-13 February; channels from the small central lava pond seemed to flow into the larger E lake. During 13-18 February a small lava fountain was observed in the small lava pond in the central portion of the crater floor. Continuous overflows persisted during this time.
Activity in the eastern and central lakes began to decline in the late afternoon of 17 February. By 18 February HVO reported that the lava effusions had significantly declined, and that the eastern and central lakes were no longer erupting. The W lake in the basin remained active but at a greatly reduced level that continued to decline. HVO reported that this decrease in activity is attributed to notable deflationary tilt that began early on the morning of 17 February and lasted until early 19 February. By 19 February the W lake was mostly crusted over although some weak lava flows remained, which continued through 28 February. The sulfur dioxide emission rates ranged 250-2,800 t/d, the highest value of which was recorded on 6 February.
Activity during March 2023. The summit eruption at Halema’uma’u crater continued at greatly reduced levels compared to the previous two months. The E and central vents stopped effusing lava, and the W lava lake remained active with weak lava flows; the lake was mostly crusted over, although slowly circulating lava intermittently overturned the crust. By 6 March the lava lake in the W basin had stopped because the entire surface was crusted over. The only apparent surface eruptive activity during 5-6 March was minor ooze-outs of lava onto the crater floor, which had stopped by 7 March. Several hornitos on the crater floor still glowed through 12 March according to overnight webcam images, but they did not erupt any lava. A small ooze-out of lava was observed just after 1830 in the W lava lake on 8 March, which diminished overnight. The sulfur dioxide emission rate ranged from 155-321 t/d on 21 March. The VAL was lowered to Advisory, and the ACC was lowered to Yellow (the second lowest on a four-color scale) on 23 March due to a pause in the eruption since 7 March.
Activity during April-May 2023. The eruption at Halema’uma’u crater was paused; no lava effusions were visible on the crater floor. Sulfur dioxide emission rates ranged from 75-185 t/d, the highest of which was measured on 22 April. During May and June summit seismicity was elevated compared to seismicity that preceded the activity during January.
Activity during June 2023. Earthquake activity and changes in the patterns of ground deformation beneath the summit began during the evening of 6 June. The data indicated magma movement toward the surface, prompting HVO to raise the VAL to Watch and the ACC to Orange. At about 0444 on 7 June incandescence in Halema’uma’u crater was visible in webcam images, indicating that a new eruption had begun. HVO raised the VAL to Warning and the ACC to Red (the highest color on a four-color scale). Lava flowed from fissures that had opened on the crater floor. Multiple minor lava fountains were active in the central E portion of the Halema’uma’u crater, and one vent opened on the W wall of the caldera (figure 528). The eruptive vent on the SW wall of the crater continued to effuse into the lava lake in the far SW part of the crater (figure 529). The largest lava fountain consistently rose 15 m high; during the early phase of the eruption, fountain bursts rose as high as 60 m. Lava flows inundated much of the crater floor and added about 6 m depth of new lava within a few hours, covering approximately 10,000 m2. By 0800 on 7 June lava filled the crater floor to a depth of about 10 m. During 0800-0900 the sulfur dioxide emission rate was about 65,000 t/d. Residents of Pahala (30 km downwind of the summit) reported minor deposits of fine, gritty ash and Pele’s hair. A small spatter cone had formed at the vent on the SW wall by midday, and lava from the cone was flowing into the active lava lake. Fountain heights had decreased from the onset of the eruption and were 4-9 m high by 1600, with occasional higher bursts. Inflation switched to deflation and summit earthquake activity greatly diminished shortly after the eruption onset.
At 0837 on 8 June HVO lowered the VAL to Watch and the ACC to Orange because the initial high effusion rates had declined, and no infrastructure was threatened. The surface of the lava lake had dropped by about 2 m, likely due to gas loss by the morning of 8 June. The drop left a wall of cooled lava around the margins of the crater floor. Lava fountain heights decreased during 8-9 June but continued to rise to 10 m high. Active lava and vents covered much of the W half of Halema’uma’u crater in a broad, horseshoe-shape around a central, uplifted area (figure 530). The preliminary average effusion rate for the first 24 hours of the eruption was about 150 cubic meters per second, though the estimate did not account for vesiculated lava and variations in crater floor topography. The effusion rate during the very earliest phases of the eruption appeared significantly higher than the previous three summit eruptions based on the rapid coverage of the entire crater floor. An active lava lake, also referred to as the “western lava lake” was centered within the uplifted area and was fed by a vent in the NE corner. Two small active lava lakes were located just SE from the W lava lake and in the E portion of the crater floor.
During 8-9 June the lava in the central lava lake had a thickness of approximately 1.5 m, based on measurements from a laser rangefinder. During 9-12 June the height of the lava fountains decreased to 9 m high. HVO reported that the previously active lava lake in the E part of the crater appeared stagnant during 10-11 June. The surface of the W lake rose approximately 1 m overnight during 11-12 June, likely due to the construction of a levee around it. Only a few small fountains were active during 12-13 June; the extent of the active lava had retreated so that all activity was concentrated in the SW and central parts of Halema’uma’u crater. Intermittent spattering from the vent on the SW wall was visible in overnight webcam images during 13-18 June. On the morning of 14 June a weak lava effusion originated from near the western eruptive vent, but by 15 June there were no signs of continued activity. HVO reported that other eruptive vents in the SW lava lake had stopped during this time, following several days of waning activity; lava filled the lake by about 0.5 m. Lava circulation continued in the central lake and no active lava was reported in the northern or eastern parts of the crater. Around 0800 on 15 June the top of the SW wall spatter cone collapsed, which was followed by renewed and constant spattering from the top vent and a change in activity from the base vent; several new lava flows effused from the top of the cone, as well as from the pre-existing tube-fed flow from its base. Accumulation of lava on the floor resulted in a drop of the central basin relative to the crater floor, allowing several overflows from the SW lava lake to cascade into the basin during the night of 15 June into the morning of 16 June.
Renewed lava fountaining was reported at the eruptive vent on the SW side of the crater during 16-19 June, which effused lava into the far SW part of the crater. This activity was described as vigorous during midday on 16 June; a group of observatory geologists estimated that the lava was consistently ejected at least 10 m high, with some spatter ejected even higher and farther. Deposits from the fountain further heightened and widened the spatter cone built around the original eruptive vent in the lower section of the crater wall. Multiple lava flows from the base of the cone were fed into the SW lava lake and onto the southwestern-most block from the 2018 collapse within Halema’uma’u on 17 June (figure 531); by 18 June they focused into a single flow feeding into the SW lava lake. On the morning of 19 June a second lava flow from the base of the eruptive cone advanced into the SW lava lake.
Around 1600 on 19 June there was a rapid decline in lava fountaining and effusion at the eruptive vent on the SW side of the crater; vent activity had been vigorous up to that point (figure 532). Circulation in the lava lake also slowed, and the lava lake surface dropped by several meters. Overnight webcam images showed some previously eruptive lava still flowing onto the crater floor, which continued until those flows began to cool. By 21 June no lava was erupting in Halema’uma’u crater. Overnight webcam images during 29-30 June showed some incandescence from previously erupted lava flows as they continued to cool. Seismicity in the crater declined to low levels. Sulfur dioxide emission rates ranged 160-21,000 t/d throughout the month, the highest measurement of which was recorded on 8 June. On 30 June the VAL was lowered to Advisory (the second level on a four-level scale) and the ACC was lowered to Yellow. Gradual inflation was detected at summit tiltmeters during 19-30 June.
Activity during July-August 2023. During July, the eruption paused; no lava was erupting in Halema’uma’u crater. Nighttime webcam images showed some incandescence from previously erupted lava as it continued to cool on the crater floor. During the week of 14 August HVO reported that the rate in seismicity increased, with 467 earthquakes of Mw 3.2 and smaller occurring. Sulfur dioxide emission rates remained low, ranging from 75-86 t/d, the highest of which was recorded on 10 and 15 August. On 15 August beginning at 0730 and lasting for several hours, a swarm of approximately 50 earthquakes were detected at a depth of 2-3 km below the surface and about 2 km long directly S of Halema’uma’u crater. HVO reported that this was likely due to magma movement in the S caldera region. During 0130-0500 and 1700-2100 on 21 August two small earthquake swarms of approximately 20 and 25 earthquakes, respectively, occurred at the same location and at similar depths. Another swarm of 50 earthquakes were recorded during 0430-0830 on 23 August. Elevated seismicity continued in the S area through the end of the month.
Activity during September 2023. Elevated seismicity persisted in the S summit with occasional small, brief seismic swarms. Sulfur dioxide measurements were relatively low and were 70 t/d on 8 September. About 150 earthquakes occurred during 9-10 September, and tiltmeter and Global Positioning System (GPS) data showed inflation in the S portion of the crater.
At 0252 on 10 September HVO raised the VAL to Watch and the ACC to Orange due to increased earthquake activity and changes in ground deformation that indicated magma moving toward the surface. At 1515 the summit eruption resumed in the E part of the caldera based on field reports and webcam images. Fissures opened on the crater floor and produced multiple minor lava fountains and flows (figure 533). The VAL and ACC were raised to Warning and Red, respectively. Gas-and-steam plumes rose from the fissures and drifted downwind. A line of eruptive vents stretched approximately 1.4 km from the E part of the crater into the E wall of the down dropped block by 1900. The lava fountains at the onset of the eruption had an estimated 50 m height, which later rose 20-25 m high. Lava erupted from fissures on the down dropped block and expanded W toward Halema’uma’u crater. Data from a laser rangefinder recorded about 2.5 m thick of new lava added to the W part of the crater. Sulfur dioxide emissions were elevated in the eruptive area during 1600-1500 on 10 September, measuring at least 100,000 t/d.
At 0810 on 11 September HVO lowered the VAL and ACC back to Watch and Orange due to the style of eruption and the fissure location had stabilized. The initial extremely high effusion rates had declined (but remained at high levels) and no infrastructure was threatened. An eruption plume, mainly comprised of sulfur dioxide and particulates, rose as high as 3 km altitude. Several lava fountains were active on the W side of the down dropped block during 11-15 September, while the easternmost vents on the down dropped block and the westernmost vents in the crater became inactive on 11 September (figure 534). The remaining vents spanned approximately 750 m and trended roughly E-W. The fed channelized lava effusions flowed N and W into Halema’uma’u. The E rim of the crater was buried by new lava flows; pahoehoe lava flows covered most of the crater floor except areas of higher elevation in the SW part of the crater. The W part of the crater filled about 5 m since the start of the eruption, according to data from a laser rangefinder during 11-12 September. Lava fountaining continued, rising as high as 15 m by the morning of 12 September. During the morning of 13 September active lava flows were moving on the N and E parts of the crater. The area N of the eruptive vents that had active lava on its surface became perched and was about 3 m higher than the surrounding ground surface. By the morning of 14 September active lava was flowing on the W part of the down dropped block and the NE parts of the crater. The distances of the active flows progressively decreased. Spatter had accumulated on the S (downwind) side of the vents, forming ramparts about 20 m high.
Vigorous spattering was restricted to the westernmost large spatter cone with fountains rising 10-15 m high. Minor spattering occurred within the cone to the E of the main cone, but HVO noted that the fountains remained mostly below the rim of the cone. Lava continued to effuse from these cones and likely from several others as well, traveled N and W, confined to the W part of the down-dropped block and the NE parts of Halema’uma’u. Numerous ooze-outs of lava were visible over other parts of the crater floor at night. Laser range-finder measurements taken of the W part of the crater during 14-15 September showed that lava filled the crater by 10 m since the start of the eruption. Sulfur dioxide emissions remained elevated after the onset of the eruption, ranging 20,000-190,000 t/d during the eruption activity, the highest of which occurred on 10 September.
Field crews observed the eruptive activity on 15 September; they reported a notable decrease or stop in activity at several vents. Webcam images showed little to no fountaining since 0700 on 16 September, though intermittent spattering continued from the westernmost large cone throughout the night of 15-16 September. Thermal images showed that lava continued to flow onto the crater floor. On 16 September HVO reported that the eruption stopped around 1200 and that there was no observable activity anywhere overnight or on the morning of 17 September. HVO field crews reported that active lava was no longer flowing onto Halema’uma’u crater floor and was restricted to a ponded area N of the vents on the down dropped block. They reported that spattering stopped around 1115 on 16 September. Nighttime webcam images showed some incandescence on the crater floor as lava continued to cool. Field observations supported by geophysical data showed that eruptive tremor in the summit region decreased over 15-16 September and returned to pre-eruption levels by 1700 on 16 September. Sulfur dioxide emissions were measured at a rate of 800 t/d on 16 September while the eruption was waning, and 200 t/d on 17 September, which were markedly lower compared to measurements taken the previous week of 20,000-190,000 t/d.
Geologic Background. Kilauea overlaps the E flank of the massive Mauna Loa shield volcano in the island of Hawaii. Eruptions are prominent in Polynesian legends; written documentation since 1820 records frequent summit and flank lava flow eruptions interspersed with periods of long-term lava lake activity at Halemaumau crater in the summit caldera until 1924. The 3 x 5 km caldera was formed in several stages about 1,500 years ago and during the 18th century; eruptions have also originated from the lengthy East and Southwest rift zones, which extend to the ocean in both directions. About 90% of the surface of the basaltic shield volcano is formed of lava flows less than about 1,100 years old; 70% of the surface is younger than 600 years. The long-term eruption from the East rift zone between 1983 and 2018 produced lava flows covering more than 100 km2, destroyed hundreds of houses, and added new coastline.
Information Contacts: Hawaiian Volcano Observatory (HVO), U.S. Geological Survey, PO Box 51, Hawai'i National Park, HI 96718, USA (URL: http://hvo.wr.usgs.gov/).
Tinakula (Solomon Islands) — December 2023 Cite this Report
Tinakula
Solomon Islands
10.386°S, 165.804°E; summit elev. 796 m
All times are local (unless otherwise noted)
Continued lava flows and thermal activity during June through November 2023
Tinakula is a remote 3.5 km-wide island in the Solomon Islands, located 640 km ESE of the capital, Honiara. The current eruption period began in December 2018 and has more recently been characterized by intermittent lava flows and thermal activity (BGVN 48:06). This report covers similar activity during June through November 2023 using satellite data.
During clear weather days (20 July, 23 September, 23 October, and 12 November), infrared satellite imagery showed lava flows that mainly affected the W side of the island and were sometimes accompanied by gas-and-steam emissions (figure 54). The flow appeared more intense during July and September compared to October and November. According to the MODVOLC thermal alerts, there were a total of eight anomalies detected on 19 and 21 July, 28 and 30 October, and 16 November. Infrared MODIS satellite data processed by MIROVA (Middle InfraRed Observation of Volcanic Activity) detected a small cluster of thermal activity occurring during late July, followed by two anomalies during August, two during September, five during October, and five during November (figure 55).
Geologic Background. The small 3.5-km-wide island of Tinakula is the exposed summit of a massive stratovolcano at the NW end of the Santa Cruz islands. It has a breached summit crater that extends from the summit to below sea level. Landslides enlarged this scarp in 1965, creating an embayment on the NW coast. The Mendana cone is located on the SE side. The dominantly andesitic volcano has frequently been observed in eruption since the era of Spanish exploration began in 1595. In about 1840, an explosive eruption apparently produced pyroclastic flows that swept all sides of the island, killing its inhabitants. Recorded eruptions have frequently originated from a cone constructed within the large breached crater. These have left the upper flanks and the steep apron of lava flows and volcaniclastic debris within the breach unvegetated.
Information Contacts: MIROVA (Middle InfraRed Observation of Volcanic Activity), a collaborative project between the Universities of Turin and Florence (Italy) supported by the Centre for Volcanic Risk of the Italian Civil Protection Department (URL: http://www.mirovaweb.it/); Hawai'i Institute of Geophysics and Planetology (HIGP) - MODVOLC Thermal Alerts System, School of Ocean and Earth Science and Technology (SOEST), Univ. of Hawai'i, 2525 Correa Road, Honolulu, HI 96822, USA (URL: http://modis.higp.hawaii.edu/); Copernicus Browser, Copernicus Data Space Ecosystem, European Space Agency (URL: https://dataspace.copernicus.eu/browser/).
Search Bulletin Archive by Publication Date
Select a month and year from the drop-downs and click "Show Issue" to have that issue displayed in this tab.
The default month and year is the latest issue available.
Bulletin of the Global Volcanism Network - Volume 42, Number 07 (July 2017)
Erta Ale (Ethiopia)
Persistent lava lake; crater rim overflows; new fissure eruption begins in January 2017
Fournaise, Piton de la (France)
Intermittent effusive episodes during February-October 2015; May and September 2016; and February 2017
Kambalny (Russia)
First major eruption in over 600 years consists of large ash explosions during March-April 2017
Lascar (Chile)
Thermal anomaly persists until April 2017
Popocatepetl (Mexico)
Ash plumes several times weekly, multiple episodes of dome growth and destruction, and high SO2 flux during January 2015-June 2016.
Reventador (Ecuador)
Lava flow emerges from summit cone, January 2016; continued explosions, pyroclastic flows, and ash emissions
San Miguel (El Salvador)
Six small ash emission events during January 2015-June 2017
Santa Maria (Guatemala)
Continuous ash emissions, pyroclastic flows and lahars; new lava dome visible at Caliente dome, October 2016
Stromboli (Italy)
Persistent low- and moderate-level explosive activity during 2015 and 2016
Yasur (Vanuatu)
Strong explosions reported through mid-June 2017, with ongoing thermal anomalies
Erta Ale
Ethiopia
13.601°N, 40.666°E; summit elev. 585 m
All times are local (unless otherwise noted)
Persistent lava lake; crater rim overflows; new fissure eruption begins in January 2017
Ethiopia's Erta Ale basaltic shield volcano has had an active lava lake since the mid 1960s, and possibly much earlier. The first confirmed historical observations were in 1906. Two active craters (Northern and Southern) within a larger oval-shaped caldera exhibit periodic fountaining of lava causing lava lake overflows; this creates spectacular incandescence as the pahoehoe lava flows into the larger caldera around the craters and occasionally beyond. Lava flows in the South Pit crater overflowed its rim in November 2010 (BGVN 36:06). This report discusses activity from 2011 through June 2017, including the South Pit crater overflows in January and November 2016, and a new fissure eruption on the SE flank that began in January 2017 and was continuing in June 2017. Information comes from satellite thermal and visual data (NASA Earth Observatory, MODIS), and photographs from expeditions (primarily from Volcano Discovery) that regularly visit this remote site.
The lava lake at the South Pit crater in the summit caldera remained active, with the lake level falling and rising to within a few meters of the rim, during 2011-2015. Intermittent lava flows were reported from the North Pit Crater as well during this time. Activity increased late in 2015, and the first overflows of the South Pit crater rim since late 2010 occurred in mid-January 2016. It overflowed again in November 2016, and covered a significant area of the surrounding caldera floor with pahoehoe. By late December, effusive activity was reported from both craters. Flow intensity and volume increased dramatically for several days beginning on 17 January 2017, followed by ash emissions and crater collapses on 20-21 January. A new fissure eruption on the SE flank about 4 km from the caldera appeared on 21 January 2017, and sent lava flows several kilometers to the NE and the SW. Activity at the fissure vent increased during subsequent months, and by June 2017 a substantial new lava field that contained at least one new lava lake and flows more than 1,500 m long covered the area. Effusive activity had also resumed at both craters in the summit caldera.
Activity during November 2011-December 2016. Visitors in November 2011 confirmed the continued presence of the lava lake (figure 32) at the South Pit crater in the summit caldera. On 16 January 2012, an attack by Eritrean rebels on tourists camping at the S crater rim left at least five European tourists dead and seven others wounded; four Europeans and their Ethiopian guides were also abducted, according to Volcano Discovery reports. News reported through Volcano Discovery suggested that the abducted tourists were released in March 2012.
Visitors in January 2013 reported that the lava lake in the North Pit crater was active and about 10 m below the rim. Intermittent lava flows were observed from a hornito in the South Pit crater and were continuing to fill the crater floor. Members of an expedition in December 2013 observed that the active lava lake at the South Pit crater had risen considerably during previous months (figure 33). An expedition in February 2015 also documented continued lava fountaining (figure 34) at the South Pit crater.
During 19-21 November 2015, visitors on an expedition to Erta Ale observed significant changes in the lava lake level at the South Pit crater. On the morning of 19 November (figure 35) the lake surface was 2-3 m below the rim. A local guide reported that the lake had been very active during the previous weeks, rising to levels near overflowing similar to the event in late 2010. A second terrace of freshly cooled pahoehoe was visible less than 1 m below the rim, indicating the most recent maximum height of the lake. On 19 November, the lake rose to within 30 cm of the terrace rim, with occasional lava fountains splashing onto the terrace (figure 36), and Pele's hair forming continuously. The level had dropped several meters by the next morning. During 20 and 21 November, the activity was characterized by large, periodic "exploding bubbles" from the center of the lake creating waves across the surface; minor Strombolian activity and fountaining occurred around the edges. The lake level generally fluctuated between 0.5 and 1 m below the second terrace. On the evening of 21 November, the level rose rapidly from five to three meters below the second terrace; lava rapidly seeped out of the cracks in the cooling surface, overflowing onto the thin crust.
Volcano Discovery reported that the lava overflowed the rim of the South Pit crater during the night of 15-16 January 2016, and covered the rim with a fresh crust of pahoehoe. An expedition leader reported that during 12-15 February 2016, the lake level had dropped 5-7 m. A visitor to the crater in April 2016 photographed the lake level several meters below the rim with active fountaining lava (figure 37).
The southern pit crater began overflowing again at the beginning of November 2016, and covered significant parts of the surrounding caldera floor (figures 38 and 39). The overflow was observed at mid-day on 14 November by visitors from the Societe de Volcanologie Geneve (SVG).
By late December 2016, effusive activity was reported from both the North and South Pit craters, including activity at the South Pit crater overflowing beyond the surrounding summit caldera. An expedition during 29 December 2016-1 January 2017 observed changing activity from both craters inside the summit caldera (figure 40). During 29-31 December, the lake level at the South Pit crater fluctuated between 0.5 and 1 m below the rim. During this time lava fountains 2-3 m high were frequent along the South Pit crater rim, but it did not overflow. The caldera floor around the crater was covered with 2-3 m of fresh pahoehoe, over an area about 150 m in diameter. Activity at the North Pit crater had formed three hornitos, one of which was emitting lava.
Activity during January-June 2017. Observations on 16 January 2017 at the North Pit crater showed remnants of two large hornitos surrounded by fresh lava flows (figure 41). During 16-20 January 2017, the lava lake at the South Pit crater underwent rapid and large variations, producing massive overflows and intense spattering. During the morning of 16 January the lake overflowed the W rim of the crater (figure 42); in the afternoon two lava rivers, reaching 500 m in length, appeared on the SW flank.
On 17 January around 1300, two overflows began on the South Pit crater rim. Two hours later, overflows appeared on the NE and N flank; lava was flowing over about 70% of the rim according to visitors (figure 43). They reported the speed of the lava flowing on the flank at 50-70 km per hour, covering about 1 km2 within the larger caldera. In the morning of 18 January, fresh, glowing lava covered the area around the South Pit crater 500-700 m in all directions (figure 44). Sporadic overflows occurred with lake levels fluctuating by 10-15 m for several days. During lower levels, Strombolian fountains reached 50-60 m above the lake.
On the evening of 20 January, explosions of very large gas bubbles were observed by Oliver Grunewald and reported by Culture Volcan, causing lava to spatter up to 30 m high. Parts of both of the craters in the Summit caldera began to collapse. At the North Pit crater, a new 20 m deep oval-shaped pit crater 150 x 30 m formed during the next 24 hours. A collapse at the South Pit crater doubled its size. This activity was accompanied by ash emissions that reached 700-800 m above the crater.
Volcano Discovery reported news from eyewitness reports of a fissure eruption beginning on 21 January 2017. Two fissure eruptions were visible on the SE flank, 3 and 4 km SE of the South Pit crater lava lake, in satellite imagery taken on 26 January 2017 (figure 45). The higher vent was located at about 650 m elevation, and the lower one around 400 m. The fissures created three distinct lava fields, one to the NE reaching about 3 km length, a smaller one to the W (about 1 km), and one to the SSE about 2 km long. The surface area covered by the first two (on either side on the northernmost fissures) was estimated to be about 1.5 km² (1,500,000 m²), while the southern flow covered about 0.35 km² (350,000 m²). As a result of the sudden draining of the magma into the new fissure zone, the lava lake in the South Pit crater was reported to have dropped by 80-100 m. Additional satellite imagery taken before and after the fissure eruptions began reveal the locations of the new flows on 23 and 27 January 2017 (figure 46).
After dropping about 100 m after the flank eruption began, the South Pit crater lake level rose again by mid-February to 40-50 m below its rim. By April 2017, activity still remained high; a new lava lake about 80 x 175 m in size had formed at the flank eruption site, and a growing lava field, about 1,500 m wide had reached 3.5 km NE of the original site. Geologists from Addis Abeba University who visited the site during 11-15 April 2017 noted two coalesced hornitos in the NE part of the South Pit crater, estimated to be 7 m high. The old lava lake was covered with cooled lava in a 200-m-diameter near-circular shape. Frequent surface collapse and lake-level changes occurred every 30 minutes, and lava fountains rose 25 m above the surface. The fresh lava surface around the crater rim had cooled enough to walk on it. The North Pit crater was still degassing, with several small hornitos growing in the center. The lake level at the new fissure (the SE Rift Zone) had dropped by about 10 m.
By early May 2017, the first lava lake at the SE Rift Zone had crusted over and a new lake was forming about 350 m E. A new breakout also started in early May, and was feeding a new flow field overlapping the previous one to the NE, more than 1,500 m long and over 500 m wide.
Satellite data. In addition to field observations of Erta Ale, valuable information is available from continuous satellite data. Thermal data from MODIS is processed by both the MIROVA and MODVOLC systems. The MIROVA thermal anomaly system recorded the high levels of heat flow and changes in location of the heat flow sources from late September 2015 through June 2017 (figure 47). The change in location and intensity of the heat flow in late January 2017 corresponds with the opening of the SE-flank fissure.
The MODVOLC thermal alert system managed by the University of Hawaii has captured persistent thermal alerts from Erta Ale for at least 10 years. When activity is moderate to high at the lava lakes in the pit craters, the signal is concentrated in those areas (figure 48). The reports of lava overflowing the south crater rim in January 2016 correspond to increased heat flow visible in the MODVOLC data. The dramatic changes in heat flow with the new fissure flows from the SE rift zone and subsequent new lava lake formation are apparent in MODVOLC images from January-May 2017 (figure 49).
Geologic Background. The Erta Ale basaltic shield volcano in Ethiopia has a 50-km-wide edifice that rises more than 600 m from below sea level in the Danakil depression. The volcano includes a 0.7 x 1.6 km summit crater hosting steep-sided pit craters. Another larger 1.8 x 3.1 km wide depression elongated parallel to the trend of the Erta Ale range is located SE of the summit and is bounded by curvilinear fault scarps on the SE side. Basaltic lava flows from these fissures have poured into the caldera and locally overflowed its rim. The summit caldera usually also holds at least one long-term lava lake that has been active since at least 1967, and possibly since 1906. Recent fissure eruptions have occurred on the N flank.
Information Contacts: NASA Earth Observatory, EOS Project Science Office, NASA Goddard Space Flight Center, Goddard, Maryland, USA (URL: http://earthobservatory.nasa.gov/); Tom Pfeiffer, Volcano Discovery (URL: http://www.volcanodiscovery.com/); Robert Simon, Sr. Data Visualization Engineer, Planet Labs Inc. (URL: http://www.planet.com/); MIROVA (Middle InfraRed Observation of Volcanic Activity), a collaborative project between the Universities of Turin and Florence (Italy) supported by the Centre for Volcanic Risk of the Italian Civil Protection Department (URL: http://www.mirovaweb.it/); Hawai'i Institute of Geophysics and Planetology (HIGP), MODVOLC Thermal Alerts System, School of Ocean and Earth Science and Technology (SOEST), Univ. of Hawai'i, 2525 Correa Road, Honolulu, HI 96822, USA (URL: http://modis.higp.hawaii.edu/); Societe de Volcanologie Geneve (SVG), Bulletin 161, January 2017.
Piton de la Fournaise (France) — July 2017 Cite this Report
Piton de la Fournaise
France
21.244°S, 55.708°E; summit elev. 2632 m
All times are local (unless otherwise noted)
Intermittent effusive episodes during February-October 2015; May and September 2016; and February 2017
Short pulses of intermittent eruptive activity have characterized Piton de la Fournaise, the large basaltic shield volcano on Reunion Island in the western Indian Ocean, for several thousand years. Recent eruptive episodes on 21 June 2014 and activity that started on 4 February 2015 have already been reported (BGVN 40:02). This report covers the remainder of the 2015 eruptive episode, and additional activity through May 2017. Information about Piton de la Fournaise is provided by the Observatoire Volcanologique du Piton de la Fournaise (OVPF) and satellite instruments.
A one-day fissure eruption on the ESE side of the central cone of the summit caldera on 21 June 2014 created a 1.5-km-long flow. This was followed by seven months of quiet. There were four effusive eruption events during 2015. The 4-15 February event occurred on the W side of the Dolomieu summit cone and the lava flow traveled about 2.5 km S. Effusion during 17-30 May started outside and SE of the Dolomieu Crater and traveled 4 km before it ceased. The brief 30 July-2 August event erupted from a 1-km-long fissure in the NE part of the l'Enclos Fouqué caldera and produced dozens of lava fountains. During 24 August-31 October a more sustained eruption from a fissure on the S flank of Dolomieu Crater sent lava flows at least 3.5 km down the flank to the S. Piton de la Fournaise experienced two effusive episodes in 2016. The 26-27 May event caused lava fountains on the SE flank of Dolomieu Crater. During 11-18 September, several fissures opened in the N part of the l'Enclos Fouqué caldera and produced numerous lava fountains and a lava flow. An effusive event on the SE flank of the summit crater during 31 January-27 February 2017 sent lava through tubes and flowed several kilometers to the SE before subsiding.
Activity during June 2014 and February 2015. The one-day eruption on 21 June 2014 consisted of a fissure eruption that was entirely contained within the Enclos Fouqué (the summit caldera) on the ESE side of the central (Dolomieu) cone. A lava fountain at the fissure created a spatter rampart and two lava flows that traveled about 1.5 km to the SE (BGVN 40:02).
The next eruption began abruptly on 4 February 2015 at a fissure on the W side of the summit cone adjacent to Bory crater (see figure 87), and lava flowed generally S, reaching about 2.5 km in length by 8 February (figure 88). The MODVOLC thermal alert signal for this event was detected over 4-14 February, and indications of continuing activity ceased by 15 February. OVPF partially reopened access to the volcano on 21 February.
Activity during May 2015. A brief increase in seismic activity, continued deformation, and increased magmatic gas emissions occurred on 29 April, but no effusive activity took place. A 90-minute seismic swarm of 200 volcano-tectonic (VT) events followed by significant deformation at the summit crater preceded a new effusive eruption at 1345 on 17 May. The eruption started outside and SE of Dolomieu crater in the Castle crater area. Volcanologists noted lava fountains from three fissures, and two lava flows. A very large gas plume emitted during the first few hours of the eruption rose 3.6-4 km above the summit and drifted NW. The fissure furthest W stopped issuing lava fountains before midnight.
On 18 May only one fissure was active and the SSW-drifting gas plume was much smaller. Hydrogen sulfide emissions continued to be high, and carbon dioxide emissions increased. Lava fountains from a single vent along the second fissure, further E, rose 40-50 m. The lava flow had traveled 4 km, reaching an elevation of 1.1 km. On 19 May, scientists observed lava fountains 20-30 m high, and noted the lava flow which had traveled 750 m in the previous day, reaching 1 km elevation. Lava-flow rates estimated by satellite data fluctuated but showed an overall decrease from 24.2 m2/s on 17 May to 2.5 m2/s on 21 May. During 21-22 May observers reported large variations in activity, including increasing heights of the lava fountain (over 50 m high), collapsing parts of the newly formed cinder cone, and a new very fluid lava flow adjacent to the main flow.
During an overflight on 23 May scientists observed a large blue sulfur dioxide plume above the vent, lower lava fountains, a smaller vent in the cone, and the presence of a lava tube about 200 m downstream of the vent. During 24-25 May activity remained unchanged; low lava fountains and low-level lava flows persisted (figure 89). OVPF reported that the eruption continued through 30 May 2015 after which tremor was no longer detected. The MODVOLC thermal alerts for this event agreed well with the observations of the volcanologists. Strong multi-pixel alerts were issued daily from 17-30 May.
Activity during 30 July-2 August 2015. A brief spike in seismicity on 6 July was the only notable activity after 30 May prior to a new eruptive episode that began on 30 July with a sharp increase in seismicity, increased gas emissions, and deformation near the summit. A fissure eruption began the next day at 0920, preceded by 90 minutes of high seismicity and 80 minutes of major deformation; it was confirmed by a hiker and then by observation of a gas plume. The 1-km-long fissure opened in the NE part of the l'Enclos Fouqué caldera and produced dozens of lava fountains (figure 90). Based on satellite images and gas data, the flow rate was estimated to be 28 m2/s initially and then 11 m2/s later that day. A gas plume rose to altitudes of 3.2-3.5 km. By the evening there were only five fountains, and a lava flow had traveled as far E as Plaine des Osmondes (NE part of the caldera). According to an AP news article, lava fountains were 40 m high, forming 20-m-high cones on 31 July. At 1115 on 2 August tremor stopped after several hours of fluctuating intensity, indicating the end of effusive activity.
Activity during 24 August-November 2015. The government reopened access to the caldera on 20 August; this was very short-lived, however, as a new eruption began on 24 August that continued through November 2015. Sulfur dioxide gas emissions increased at 1600, and the seismic and deformation network indicated a magmatic intrusion beginning at 1711 (figure 91). Lava fountains were visible at 1850 from a fissure on the S flank of Dolomieu Crater, at about 2,000 m elevation, near Rivals Crater. The fissure propagated towards the top of Rivals, and at around 2115 a fissure opened to the NW, below Bory Crater. The lava-flow rate was 30-60 m2/s . By the next morning fountains at higher elevations ceased, and were only active from a 100-m-long section near Rivals crater. The lava flow rate had significantly decreased to 10 m2/s . Near the top of the active fissure, a small cone had formed 140 m E of the sign to Rivals crater.
OVPF reported that the eruption fluctuated during the rest of August, causing variations in the height of the lava fountains and emissions. One vent remained active, and lava flows from it traveled at least as far as 3.5 km during 27-28 August. During an overflight the next day, scientists observed two growing cinder cones with lava lakes and lava fountains. An 'a'a lava flow was active, and a large gas plume rose 3 km.
Scientists conducting fieldwork during 31 August-1 September observed an active cone (20 m high) filled with a lava lake. Fluctuating lava fountains rose 15-20 m above the surface and gas bubbles exploded. Lava traveled through a 50-m-long lava tube and extended a distance of 1 km. During 1-2 September, seismicity increased and the lava flow grew to 2 km long (figure 92). Lava was observed in two separate side-by-side vents on 4 September (figure 93), and lava fountains were lower compared to recent days. Five small lava flows were visible near the foot of the cone; four were 30 m long and the fifth was 1 km long.
The side-by-side vents remained active through 17 September, after which only one was active. Lava flows emerged from and were active beyond a 50-100 m lava tube; the largest lava flows were up to 1.5 km in length. During 22-23 September a new lava tube formed to the W of the lava field. By 24 September the active cone was 30 m high; lava fountains were lower and less frequently observed but lava flows continued to be active, traveling as far as 3 km S and E (figure 94). OVPF reported that seismicity at Piton de la Fournaise slowly increased during the last week of September, and deformation data showed a trend of deflation during the last few days of the month. During fieldwork on 27 September volcanologists noted continuous lava fountains. Small lava flows were active, though the fronts of the two larger ones were no longer advancing.
During the first two weeks of October, the lava lake remained active; bursting gas bubbles ejected lava onto the edges of the 30-35-m-high cone. Pahoehoe lava flows issued from ephemeral vents on lava tubes, and in many instances hornitos were built at these vents. Lava was active as far as 2.5 km from the base of the cone and burned vegetation near the base of Piton de Bert. The lava-flow rate peaked at 11 m2/s during 1-4 October then returned to the previous rate of 5-10 m2/s. On 7 October lava flowed out of a breach in the cone. The evolution of the morphology of the eruptive vent changed from a fissure to a single cone between late August and early October (figure 95).
On 12 October there was a strong increase in tremor intensity, with values reaching or exceeding those detected during the first few hours of the eruption (24 August). Strain measurements showed continued deflation. A hornito SW of the cone ejected spatter during 13-14 October. Activity continued to increase on 16 and 17 October (figure 96). The cone continued to grow; the base was 100 m in diameter and it was about 40 m high. Parts of the cone rim continued to collapse, and a notch in the rim allowed for periodic lava-lake overflows. Increased SO2 flux created bubbles in the lava that caused ejection and spattering of large amounts of lava around the vent rim.
Tremor ceased abruptly on 19 October. Observers reported that a small explosion in the vent ejected spatter on 22 October, but lava flows were not observed. Lava fountains were visible from the main 24 August vent on 30 October for the last time (figure 97).
OVPF reported that based on the change in seismic and lava flow activity, the effusive phase of the eruption beginning on 24 August had ended by 31 October 2015. They noted that during a few days before 11 November, the networks had recorded geophysical and geochemical signs of pressurization within the volcano. They also observed during aerial reconnaissance on 11 November persistent white fumarolic activity reflecting the high temperature of the lava field. Indications of inflation ceased at the end of November. MODVOLC thermal alerts became sporadic during November and ceased altogether on 2 December 2015 for more than five months.
MODVOLC thermal alerts for 2015. The MODVOLC thermal alerts captured for Piton de la Fournaise during 2015 show the differing locations of the four effusive eruptions (figure 98). The 4-14 February episode was located on the W side of the summit cone adjacent to Bory crater, in the W side of the Enclos Fouqué summit caldera. The 17-30 May episode extended farther E than that of the February event. A 1-km-long fissure opened in the NE part of the l'Enclos Fouqué caldera for the brief 31 July-1 August episode. Activity was concentrated on the S flank of the Dolomieu Crater during the lengthier 24 August-31 October effusive episode.
Sulfur Dioxide flux during 2015. Images captured by the OMI (Ozone Monitoring Instrument) on the Aura satellite showed significant SO2 plumes during three of the 2015 eruptive episodes, especially at the onset of the activity (figure 99). Dobson Unit (DU) values greater than 2 are shown as red pixels in the images. The largest plumes of SO2 captured during 2015 were after the effusive episodes had ended on 24 and 31 October 2015 (figure 100).
Activity during 2016. Piton de la Fournaise experienced two effusive episodes in 2016, one occurred during 26-27 May, and the other during 11-18 September. The GPS networks detected evidence of inflation on 24 January 2016. This lasted until the second week of February when weak deflation was recorded. OVPF reported that CO2 gas emission, deformation, and seismicity began to slowly increase on 16 May, and then seismicity significantly increased at 1140 on 25 May. Tremor began at 0805 on 26 May, characteristic of an ongoing eruption, likely from a new fissure near Château Fort crater. Bad weather prevented visual observations of the area at first, though at 0900 ground observers confirmed a new eruption. Later that day scientists and reporters saw about six lava fountains (some were 40-50 m high) during brief aerial surveys and a cinder cone being built on a flat area at 1850 m elevation about 1-1.5 km SE of Castle Crater. On 27 May, tremor levels significantly dropped at 0845 and then ceased at 1100. Signals indicative of degassing continued. The lava fountains on 26 May were located on the SE flank of the main Dolomieu Crater south of the locations of both the May and August 2015 episodes (figure 101).
Significant inflation continued after the 26-27 May eruption until mid-June (more than two centimeters between 27 May and 8 June) when it levelled off, and then began again in mid-July along with increased seismicity beginning on 13 July that lasted through the remainder of the month. OVPF reported that seismicity remained low during August. Gas emissions were also low and dominated by water vapor; CO2 emissions had been elevated during 21-27 July. Inflation had stopped in early August and slight deflation was detected through 2 September.
Seismicity increased on 10 September, and elevated levels of SO2 were detected at fumaroles. A seismic swarm occurred at 0735 on 11 September, characterized by several earthquakes per minute. Deformation suggested magma migrating to the surface. Volcanic tremor began at 0841, indicating the beginning of the eruption. Several fissures opened in the N part of the l'Enclos Fouqué caldera, between Puy Mi-côte and the July 2015 eruption site, and produced a dozen 15-30-m-high lava fountains distributed over several hundred meters. The eruption continued on the next day.
OVPF reported that volcanic tremor stabilized during 14-17 September. Field observations on 15 September revealed that the two volcanic cones that had formed on the lower part of the fissures had begun to coalesce (figure 102). Lava from the northernmost cone flowed N and NE, and by 0900 was active midway between Piton Partage and Nez Coupé de Sainte Rose. The height of the lava fountains grew in the afternoon, rising as high as 60 m, likely from activity ceasing at the southernmost cone and focusing at one main cone. On 16 September the main cone continued to build around a 50-m-high lava fountain; lava flows from this vent traveled NE. Tremor rose during the night on 17 September, and then fell sharply at 0418 on 18 September, indicating the end of surface activity. During 11-18 September, the erupted volume was an estimated 7 million cubic meters. By 26 September, earthquake frequency had decreased to less than five per day.
Following the slight deflation observed during the eruption (11-18 September), inflation began again on 18 September, slowed significantly by 1 October and ceased by 6 October. Inflation resumed at the summit on 12 December, and increased summit seismicity was reported by OVPF on 22 December 2016.
Activity during January-May 2017. A return to background levels of seismicity (0-1 events per day) and a slowdown in inflation were reported on 9 January 2017. Inflation resumed on 22 January. This was interpreted by OVPF to represent the deep-seated magma supplies beginning to feed the surface reservoir about 1.5-2 km under the summit craters once again. Following a seismic swarm beginning at 1522 on 31 January, seismic tremor indicated that a new effusive eruption began at 1940 on 31 January.
Visual observations on 1 February confirmed that the active vent was located about 1 km SE of Château Fort and about 2.5 km ENE of Piton de Bert (figure 103). Lava fountains rose 20-50 m above the 10-m-high vent, and 'a'a lava flows branched and traveled 750 m (figure 104). Two other cracks had opened at the beginning of the eruption, but were no longer active. Tremor levels decreased in the early hours of the eruption; lava-fountain heights were variable (between 20-50 m).
On 2 February, two lava fountains at the vent were visible, and lava flows had traveled an additional 500 m E (figure 105). The vent was 128 m long and about 35 m high at the highest part. On 4 February OVPF noted that significant fluctuations of volcanic tremor were detected for more than 24 hours, with intensity levels reaching those observed at the onset of the eruption. Higher levels of seismicity continued through 7 February.
OVPF reported that during 8-14 February volcanic tremor was high, with levels reaching those observed at the onset of the eruption on 31 January. The eruptive vent was perched on top of a cone that was 30-35 m high and 190 m wide at the base (figure 106). The lava level inside of the cone was low, or about half of cone's height, and incandescent material was ejected from the vent. Inflation stopped on 11 February. The lava flow reached its farthest extent on 10 February, almost 3 km SE of the vent (figures 107 and 108).
Volcanic tremor fluctuated during 14-21 February. Observations made on the ground on 16 February by the observatory teams indicated that activity continued mainly in lava tubes. Only a few flows were visible a hundred meters downstream of the eruptive cone. A resumption of inflation was confirmed on 20 February.
During 25-26 February OVPF observers noted ejections of material from the active vent. A few skylights in the lava tubes were spotted. Late at night on 26 February tremor began to decline, and ceased at 1010 the next morning. Mid-day on 27 February observers confirmed that no material was being ejected from the vent, and that only white plumes were rising; gas emissions ceased at 1930. OVPF reported that the 28-day eruption at Piton de la Fournaise, beginning on 31 January and ending on 27 February, was estimated to have produced between 8 and 10 million cubic meters of lava. Although the eruption had ended on 27 February, inflation at the summit continued until about 7 March. It resumed at a low rate in mid-April, along with minor seismicity.
A new seismic swarm began at 1340 on 17 May and was accompanied by rapid deformation that suggested rising magma; volcanic tremor was recorded at 2010. The seismic and deformation activity was located in the NE part of l'Enclos Fouqué caldera. During an overflight at 1100 on 18 May scientists observed no surface activity at the base of the Nez Coupé de Sainte Rose rampart (on the N side of the volcano) nor outside of l'Enclos Fouqué caldera, and suggested that fractures opened but did not emit lava.
Seismicity increased again at 0400 on 18 May. The number of shallow (2 km depth) volcano-tectonic earthquakes progressively decreased over the next three days. During a field visit on 22 May scientists mapped the deformation associated with the 17 May event and measured displacements which did not exceed 35 cm. The 17-18 May activity resulted in two new zones of fumaroles that followed the trends seen in seismic and deformation data. Inflation stopped around mid-June, and seismicity was minimal for the remainder of the month.
MIROVA thermal data for 2016 and January-May 2017. Plots of thermal anomaly data by the MIROVA system correlated with the eruptive activity of 26-27 May 2016, 11-18 September 2016, and 31 January-27 February 2017 (figure 109). The thermal signatures of the September 2016 and February 2017 episodes show continued cooling of the new lava flows for several weeks after the effusive activity ceased.
Geologic Background. Piton de la Fournaise is a massive basaltic shield volcano on the French island of Réunion in the western Indian Ocean. Much of its more than 530,000-year history overlapped with eruptions of the deeply dissected Piton des Neiges shield volcano to the NW. Three scarps formed at about 250,000, 65,000, and less than 5,000 years ago by progressive eastward slumping, leaving caldera-sized embayments open to the E and SE. Numerous pyroclastic cones are present on the floor of the scarps and their outer flanks. Most recorded eruptions have originated from the summit and flanks of Dolomieu, a 400-m-high lava shield that has grown within the youngest scarp, which is about 9 km wide and about 13 km from the western wall to the ocean on the E side. More than 150 eruptions, most of which have produced fluid basaltic lava flows, have occurred since the 17th century. Only six eruptions, in 1708, 1774, 1776, 1800, 1977, and 1986, have originated from fissures outside the scarps.
Information Contacts: Observatoire Volcanologique du Piton de la Fournaise, Institut de Physique du Globe de Paris, 14 route nationale 3, 27 ème km, 97418 La Plaine des Cafres, La Réunion, France (URL: http://www.ipgp.fr/); Hawai'i Institute of Geophysics and Planetology (HIGP), MODVOLC Thermal Alerts System, School of Ocean and Earth Science and Technology (SOEST), Univ. of Hawai'i, 2525 Correa Road, Honolulu, HI 96822, USA (URL: http://modis.higp.hawaii.edu/); MIROVA (Middle InfraRed Observation of Volcanic Activity), a collaborative project between the Universities of Turin and Florence (Italy) supported by the Centre for Volcanic Risk of the Italian Civil Protection Department (URL: http://www.mirovaweb.it/); NASA Goddard Space Flight Center (NASA/GSFC), Global Sulfur Dioxide Monitoring Page, Atmospheric Chemistry and Dynamics Laboratory, 8800 Greenbelt Road, Goddard, Maryland, USA (URL: https://so2.gsfc.nasa.gov/); Associated Press (URL: http://www.ap.org/); U.S. News (URL: https://www.usnews.com/news/world/articles/2015/08/01/highly-active-volcano-erupts-on-reunion-amid-media-frenzy).
Kambalny
Russia
51.306°N, 156.875°E; summit elev. 2116 m
All times are local (unless otherwise noted)
First major eruption in over 600 years consists of large ash explosions during March-April 2017
The last major eruption at Kambalny volcano was around 1350, although younger undated tephra layers have been found; there are also five Holocene cinder cones on the W and SE flanks. According to the Kamchatkan Volcanic Eruption Response Team (KVERT), a new eruption began began at about 2120 UTC on 24 March 2017. Satellite data showed an initial ash plume at about 5-6 km altitude drifting about 35 km SW from the volcano.
Explosive activity was strong during 24-27 March, generating ash plumes up to 7 km high that drifted downwind as far as 2,000 km (table 1). Activity then decreased, with only minor ash emissions through 6 April, followed by ash plumes that drifted 50 and 170 km on 9 and 10 April, respectively. Only gas-and-steam plumes were reported after that time.
Table 1. Chronological details of the March-April 2017 eruption of Kambalny. Data from KVERT reports.
| Date |
Time (UTC) |
Plume height (km) |
Drift (km) |
Other observations |
| 24 Mar 2017 |
2250 |
5-6 |
35 SW |
Aviation Color Code Orange |
| 25 Mar 2017 |
0053 |
5-6 |
100 SSW |
-- |
| 25 Mar 2017 |
0240 |
5-6 |
163 SSW |
-- |
| 25 Mar 2017 |
0409 |
5-7 |
255 SW |
-- |
| 25 Mar 2017 |
1250 |
5 |
550 SSW |
-- |
| 25 Mar 2017 |
1807 |
6 |
870 SSW |
-- |
| 25 Mar 2017 |
2250 |
5.5 |
930 S |
-- |
| 26 Mar 2017 |
0530 |
5 |
1,350 SSE |
-- |
| 26 Mar 2017 |
2131 |
3.5-4 |
670 SE |
-- |
| 27 Mar 2017 |
0041 |
5 |
830 SE |
-- |
| 27 Mar 2017 |
0347 |
4-4.5 |
425 SE |
-- |
| 27 Mar 2017 |
2119 |
4-5 |
51 W |
-- |
| 27-31 Mar 2017 |
-- |
5-6 |
2,000 W to SE |
-- |
| 01 Apr 2017 |
-- |
-- |
200 E, SE |
Quiet. |
| 02-04 Apr 2017 |
-- |
7 |
-- |
Minor ash emissions thru 6 Apr; satellite thermal anomaly 3-4 Apr. |
| 09 Apr 2017 |
-- |
7 |
50 NE |
-- |
| 10 Apr 2017 |
-- |
-- |
170 SE |
-- |
| 12 Apr 2017 |
-- |
-- |
-- |
Gas-and-steam activity. |
| 21-28 Apr 2017 |
-- |
-- |
-- |
Moderate activity. |
| 05 May 2017 |
-- |
-- |
-- |
Aviation Color Code Yellow. Moderate gas-steam activity. |
| 19 May 2017 |
-- |
-- |
-- |
Aviation Color Code Yellow Green. Only gas-steam activity during last month; explosive phase began 24 Mar, ended 10 Apr 2017. |
On 25 March satellite imagery showed an ash plume stretching about 100 km SW of the Kamchatka Peninsula (figure 1). A dark stain is visible to the W of the plume, where ash has covered the snow. By 26 March ashfall had covered the ground on both sides of the volcano. The eruption was also observed on the ground by staff at the South Kamchatka Federal Wildlife Sanctuary (figure 2). The Ozone Monitoring Instrument on the Aura satellite observed an airborne plume of sulfur dioxide (SO2) trailing S of Kamchatka on 26 March 2017 (figure 3).
On 28 March 2017, the Operational Land Imager (OLI) on the Landsat 8 satellite acquired a natural-color image of an ash plume from Kambalny (figure 4), including a large area of ash-covered snow. When photographed by scientists on 12 April (figure 5), the entire edifice was covered by ash and there was a gas-and-steam plume rising from a crater fumarole.
Geologic Background. The southernmost major stratovolcano on the Kamchatka peninsula, Kambalny has a summit crater that is breached to the SE. Five Holocene cinder cones on the W and SE flanks have produced fresh-looking lava flows. Beginning about 6,300 radiocarbon years ago, a series of major collapses of the edifice produced at least three debris-avalanche deposits. The last major eruption took place about 600 years ago, although younger tephra layers have been found, and an eruption was reported in 1767. Active fumarolic areas are found on the flanks of the volcano, which is located south of the massive Pauzhetka volcano-tectonic depression.
Information Contacts: Kamchatka Volcanic Eruptions Response Team (KVERT), Far Eastern Branch, Russian Academy of Sciences, 9 Piip Blvd., Petropavlovsk-Kamchatsky, 683006, Russia (URL: http://www.kscnet.ru/ivs/kvert/); Institute of Volcanology and Seismology, Far Eastern Branch, Russian Academy of Sciences, (IVS FEB RAS), 9 Piip Blvd., Petropavlovsk-Kamchatsky 683006, Russia (URL: http://www.kscnet.ru/ivs/eng/); South Kamchatka Federal Wildlife Sanctuary, Ministry of Natural Resources and Ecology of the Russian Federation, Kamchatka Territory 684000, Russia (URL: http://www.kronoki.ru/); NASA Earth Observatory, EOS Project Science Office, NASA Goddard Space Flight Center, Goddard, Maryland, USA (URL: http://earthobservatory.nasa.gov/); NASA Goddard Space Flight Center (NASA/GSFC), Global Sulfur Dioxide Monitoring Page, Atmospheric Chemistry and Dynamics Laboratory, 8800 Greenbelt Road, Goddard, Maryland, USA (URL: https://so2.gsfc.nasa.gov/).
Lascar
Chile
23.37°S, 67.73°W; summit elev. 5592 m
All times are local (unless otherwise noted)
Thermal anomaly persists until April 2017
The six overlapping summit craters of northern Chile's Lascar volcano have produced numerous lava flows down the NW flanks. Frequent small-to-moderate explosive eruptions since the mid-19th century, and infrequent larger eruptions, have produced ashfall hundreds of kilometers away. The largest historical eruption took place in 1993, producing pyroclastic flows to 8.5 km NW of the summit and ashfall in Buenos Aires. An explosion on 30 October 2015 produced an ash plume that rose 2.5 km above the 5.6 km high summit and drifted NE; this event also initiated a distinct thermal anomaly signal recorded by MIROVA that continued through June 2016 (BGVN 41:07). Continuous incandescence from the crater was seen for the next two months. The thermal anomaly did not begin to diminish until February 2017; details of activity through June 2017 are reported here with information primarily from Chile's Servicio Nacional de Geología y Minería, (SERNAGEOMIN), and the Italian MIROVA project.
After the 30 October 2015 explosion, a persistent thermal anomaly appeared in the MIROVA data that maintained a near-constant level of activity through June 2016 (figure 49, BGVN 41:07). The MIROVA VRP (Volcanic Radiative Power) values remained steady with multiple weekly anomalies through January 2017 when they began to taper off in both frequency and intensity (figure 46). They were intermittent during February, persistent but at a lower level during March and into the first few days of April. A few anomalies appeared later in April, and one during mid-May 2017; there is no evidence to determine exactly when eruptive activity ended or the cause of the anomalies.
Throughout July 2016-June 2017, the local webcam showed persistent degassing of mostly steam plumes from the main crater, with plume heights ranging from 500-1,500 m above the summit (table 6). Although there were three pilot reports of ash emissions from Lascar on 22 and 25 September and 29 December 2016, in each case the Buenos Aires VAAC noted that there was no indication of volcanic ash in satellite images under clear skies; the webcam did show continuous emissions of steam and gas dissipating rapidly near the summit. Seismicity during this period varied from a low of three events during October 2016 to a high of 122 events during June 2017. Although there was an increase in the number of seismic events during April 2017, the total energy released remained low. Continuous incandescence at the crater was observed during October-December 2016.
Table 6. Seismic events, degassing information, and incandescence observed at Lascar from July 2016-June 2017. Information provided by SERNAGEOMIN monthly reports. Maximum height is meters above the 5,592 m elevation summit.
| Month |
No of Seismic Events |
Degassing |
Maximum Height (m) |
Date of Maximum Height |
Incandescence Observed |
| Jul 2016 |
11 |
Steam |
700 |
4 Jul |
-- |
| Aug 2016 |
12 |
Steam |
850 |
25 Aug |
-- |
| Sep 2016 |
24 |
Steam |
1,100 |
21 Sep |
-- |
| Oct 2016 |
3 |
Steam |
1,000 |
28 Oct |
Continuous |
| Nov 2016 |
7 |
Steam |
1,500 |
4 Nov |
Continuous |
| Dec 2016 |
6 |
Steam |
1,400 |
20 Dec |
Continuous |
| Jan 2017 |
13 |
Constant |
800 |
6 Jan |
-- |
| Feb 2017 |
36 |
Constant |
650 |
19 Feb |
-- |
| Mar 2017 |
19 |
Constant |
600 |
5 Mar |
-- |
| Apr 2017 |
112 |
Constant |
600 |
29 Apr |
-- |
| May 2017 |
97 |
Constant |
560 |
8 May |
-- |
| Jun 2017 |
122 |
Constant |
500 |
1 Jun |
-- |
Geologic Background. Láscar is the most active volcano of the northern Chilean Andes. The andesitic-to-dacitic stratovolcano contains six overlapping summit craters. Prominent lava flows descend its NW flanks. An older, higher stratovolcano 5 km E, Volcán Aguas Calientes, displays a well-developed summit crater and a probable Holocene lava flow near its summit (de Silva and Francis, 1991). Láscar consists of two major edifices; activity began at the eastern volcano and then shifted to the western cone. The largest eruption took place about 26,500 years ago, and following the eruption of the Tumbres scoria flow about 9000 years ago, activity shifted back to the eastern edifice, where three overlapping craters were formed. Frequent small-to-moderate explosive eruptions have been recorded since the mid-19th century, along with periodic larger eruptions that produced ashfall hundreds of kilometers away. The largest historical eruption took place in 1993, producing pyroclastic flows to 8.5 km NW of the summit and ashfall in Buenos Aires.
Information Contacts: Servicio Nacional de Geología y Minería, (SERNAGEOMIN), Observatorio Volcanológico de Los Andes del Sur (OVDAS), Avda Sta María No. 0104, Santiago, Chile ( URL: http://www.sernageomin.cl/); MIROVA (Middle InfraRed Observation of Volcanic Activity), a collaborative project between the Universities of Turin and Florence (Italy) supported by the Centre for Volcanic Risk of the Italian Civil Protection Department (URL: http://www.mirovaweb.it/); Buenos Aires Volcanic Ash Advisory Center (VAAC), Servicio Meteorológico Nacional-Fuerza Aérea Argentina, 25 de mayo 658, Buenos Aires, Argentina (URL: http://www.smn.gov.ar/vaac/buenosaires/inicio.php?lang=es).
Popocatepetl (Mexico) — July 2017 Cite this Report
Popocatepetl
Mexico
19.023°N, 98.622°W; summit elev. 5393 m
All times are local (unless otherwise noted)
Ash plumes several times weekly, multiple episodes of dome growth and destruction, and high SO2 flux during January 2015-June 2016.
Frequent historical eruptions, first recorded in Aztec codices, have occurred since pre-Columbian time at México's Popocatépetl, the second highest volcano in North America. More recently, activity picked up in the mid-1990s after about 50 years of quiescence. The current eruption, which has been ongoing since January 2005, has included frequent ash plumes rising generally 1-4 km above the 5.4-km-elevation summit, and numerous episodes of lava-dome growth and destruction within the 500-m-wide summit caldera. Multiple ash emissions generally occur daily, with larger, more explosive events that generate ashfall in neighboring communities occurring several times each month. Information about Popocatépetl comes primarily from daily reports provided by México's Centro Nacional de Prevención de Desastres (CENAPRED). Many ash emissions are also reported by the Washington Volcanic Ash Advisory Center (VAAC). Satellite visible and thermal imagery and SO2 data also provide important information about the character of the eruptive activity. Our last report covered activity through December 2014 (BGVN 40:02); this report covers 2015 and the first six months of 2016.
CENAPRED reported near-constant emissions of water vapor, gas, and minor ash during 2015 and January-June 2016. Ash plumes from larger explosions regularly occurred several times per day during the more active months, and a few times a week during the quieter months. Ashfall is sometimes reported within 40 km of the summit. The plumes generally rose to altitudes of 6.1-7.9 km, and occasionally higher. The prevailing winds most often sent the ash NE or E, but multi-direction plumes at different altitudes were also common. Incandescent tephra was ejected onto the flank within 1 km of the summit every month, and was reported 3.5 km from the summit after stronger activity on 3 April 2016. Sulfur dioxide emissions are persistent, with plumes drifting a hundred or more kilometers from the volcano observed regularly in satellite data. Two episodes of dome growth were reported in February and April 2015, and dome destruction was inferred during January 2016.
Activity during January-June 2015. During January 2015 CENAPRED reported at least 13 explosions with ash-bearing plumes, as well as near-constant emissions of water vapor and gas that sometimes contained ash. The ash plumes generally rose to 600-1,500 m above the summit crater (up to 6.9 km altitude) and drifted either E or NE. Incandescence from the crater was visible on most clear nights. The Washington VAAC issued two series of reports; ash emissions on 4 January were not observed in satellite imagery due to weather clouds, but the 17 January emission was observed via webcam and satellite images at 5.8 km altitude drifting E. There were 58 MODVOLC thermal alerts issued in January, all from the immediate vicinity of the summit crater; most days had multiple-pixel alerts. NASA's Global Sulfur Dioxide monitoring system captured nine days of SO2 emissions with values greater than two Dobson Units (DU), a measure of the molecular density of SO2 in the atmosphere. Values greater than 2 show as red pixels on the imagery created from the OMI on the Aura satellite (figure 69).
The volcano was very active during February 2015. CENAPRED reported that their seismic network recorded several hundred low-intensity events that were accompanied by steam-and-gas-emissions and usually contained ash. Numerous explosions were attributed to lava-dome growth. Ash plumes rose 1-2 km above the crater, generally drifting NE. Ashfall was reported a number of times in communities up to 50 km away, and incandescence at the summit was observed on many nights.
On 11 February, ashfall was reported in the city of Puebla (~50 km to the E) and in the municipalities of Juan C. Bonilla (30 km ENE), Domingo Arenas (22 km NE), Huejotzingo (27 km NE), and at the airport to the E. On 15 February, explosions generated ashfall in Huejotzingo, Domingo Arenas, Salvador el Verde (30 km NNE), San Felipe Teotlalcingo (26 km NNE), and Puebla. Five explosions generated ash plumes on 18 February (figure 70). On 21 February, there were 22 small explosions, some of which ejected tephra 200 m onto the NE flank. A series of explosions on 24 February ejected incandescent material as far as 700 m onto the NE and SE flanks.
Additional explosions (19) detected on 25 February resulted in ashfall 20-37 km to the NE in San Martín Texmelucan (35 km NE), San Matías Tlalancaleca (35 km NE), San Salvador el Verde (29 km NE), Santa Rita Tlahuapan (34 km NNE), Tlaltenango, Huejotzingo, San Miguel Xoxtla (37 km NE), Domingo Arenas, Santa María Atexcac (20 km NE), and the Puebla airport (30 km NE). Explosions on 26 February ejected incandescent tephra 700 m onto the N and NE flanks; ashfall was again noted in Domingo Arenas, San Martín Texmelucan, and Huejotzingo in the state of Puebla. The international airport in Huejotzingo suspended operations to clean up the ash. On 27 February explosions generated ash emissions and again ejected incandescent tephra 300 m onto the flanks. Ashfall was reported in Huejotzingo, Domingo Arenas, Tlaltenango, San Andrés Cholula (33 km E), and Puebla. Two separate series of explosions were detected on 28 February, and more incandescent tephra was ejected 300 m onto the flanks.
During an overflight on 17 February, volcanologists observed a dome at the bottom of the inner crater, which formed in July 2013 and extends 100 m below the floor of the main crater. They identified this as dome number 55; it was 150 in diameter. On a second overflight on 27 February, volcanologists observed that the dome had grown and was filling the bottom of the inner crater (figure 71). The dome was 250 m in diameter and at least 40 m high, putting the top about 60 m above the bottom of the main crater floor. The volume was an estimated 1.96 million cubic meters. They also witnessed a small ash explosion from the inner crater (figure 71).
The Washington VAAC issued reports of ash emissions on 3 February, and during 11-16 and 24-28 February. Ash plumes identified in satellite imagery rose to altitudes of 6.1-6.7 km during 11-13 February and drifted as far as 5 km NE. On 24 February, a plume was seen extending about 15 km ENE from the summit at 6.7 km altitude. The next day an ash plume was observed in satellite imagery at 9.1 km altitude extending NE about 12 km from the summit. Later that day (25 February) it extended 300 km NE at 6.7 km altitude, out over the Gulf of México, before it dissipated. Additional emissions on 25 February occurred about every 60-90 minutes and drifted 130 km ENE at 8.2 km altitude. These bursts of ash continued moving ENE and finally dissipated about 170 km from the volcano. Plumes observed on 27 and 28 February in multispectral satellite images rose to 7-7.9 km altitude. A small area of faint ash from the 27 February emission was visible in images in the Gulf of México about 390 ENE of the summit late on 28 February, while a new emission was visible extending NE about 25 km. Twenty-five MODVOLC thermal alerts were issued most days during February (except 12-17). The OMI instrument on the AURA satellite captured 14 days of SO2 emissions with DU>2.
Activity continued at a high rate during March 2015, again with hundreds of emission events with gas, steam, and small quantities of ash (figure 72). Larger quantities of ash from multiple-per-week explosions rose 1-3 km above the summit and drifted N or NE. Incandescent tephra was ejected 100-800 m onto the N, NE, and SE flanks at least four times. A series of explosions on 7 March led to ashfall reported in Ecatzingo (15 km SW). On 9 March ashfall was reported in Amecameca (20 km NW), Ecatzingo (15 km SW), and Tepextlipa from explosions the previous day. A four-hour series of explosions on 24 March produced steam, gas, and ash emissions that rose 3 km.
The Washington VAAC reported ash emissions every day during 1-5, 7-10, 19-21, and 24-26 March. During the first week, the plumes rose 6.1-7.6 km altitude, drifted NE, N, and NW, and were usually visible for about 100 km from the summit before dissipating. On 8 March, two plumes drifted in opposite directions: one went 15 km ENE at 7 km altitude and one drifted 45 km W at 5.6 km altitude. During the second half of March, the plumes drifted generally NE, at altitudes of 6.1-7.3 km, tens of kilometers before dissipating. Only 11 MODVOLC thermal alerts were issued in March; SO2 data showed four days with DU>2, although SO2 plumes were visible in satellite data almost every day.
Hundreds of daily ash emissions were noted by CENAPRED during April 2015. Ash plumes generally drifted N or NE at 1-3 km above the summit crater, but occasionally they drifted W or SW. Incandescence was often noted at night. Incandescent tephra was ejected several hundred meters onto the flanks during 4-6 April, and again on 18 and 20 April. The only ashfall reported during the month was in Tetela and Ocuituco (both about 22 km SW) after ash-bearing explosions during 3-4 April.
During an overflight on 10 April (figure 73), scientists confirmed that a lava dome had been emplaced in the bottom of the crater between 24 March and 4 April. The lava dome was at least 250 m in diameter and 30 m high. The surface of the dome had concentric fractures and the central part was collapsed from deflation.
The Washington VAAC issued aviation alerts during 1, 3-8, 13, and 18-21 April. On 3 April volcanic ash was observed moving SE from the summit at 8.2 km altitude. The plume extended over 150 km before dissipating later in the day. Another plume the same day rose to 9.1 km altitude and drifted 55 km NE. During 4 and 5 April, ongoing emissions at various altitudes from 6.1 to 9.1 km drifted in multiple directions for tens of kilometers before dissipating. Most of the alerts were for brief, intermittent emissions that dissipated within 20 km of the summit after a few hours. On 7 April one ash cloud drifted 45 km SSE and another drifted 100 km SE, both at 7.6 km altitude. An ash emission on 13 April traveled around 260 km E at 7.3 km altitude before dissipating. The plumes observed during 18-21 April ranged from 6.7 to 9.7 km in altitude, and mostly drifted NE or E. There were 20 MODVOLC thermal alerts issued during April, scattered throughout the month. Most days during April had SO2 plumes with values >2 DU in the satellite data.
Ashfall was reported in San Pedro Benito Juárez (10-12 km SE), in the municipality of Atlixco Puebla on 2 May 2015, and in Ocuituco (24 km SW) on 22 May. On 26 May ashfall was reported in Tetela del Volcán (20 km SW) and slight ashfall was recorded in Amozoc, Puebla (60 km E) on 31 May. The ongoing explosions generated ash emissions that generally rose 0.5-2.5 km above the crater rim and sent plumes to the SW, SE, and E (figure 74). Nighttime crater incandescence was observed on most clear nights.
Although aviation alerts from the Washington VAAC were issued during 9 days of May (2, 10, 20-21, 25-26, 28, and 30-31), plumes were only visible in satellite images a few times. The highest plume was on 20 May, at 8.2 km altitude drifting SSW. The plume on 26 May was observed drifting NW at 6.1 km, extending 150 km from the summit. Only four MODVOLC thermal alerts were issued during 10, 19, 21 and 30 May, but strong SO2 plumes (>2 DU values) were recorded 12 times, with just as many days showing smaller-magnitude plumes.
Activity was much quieter at Popocatépetl during June 2015. Only six VAAC reports were issued (during 7-8, 12, and 21-22), and only two were identified in satellite images. The plume on 7 June rose to 8.2 km altitude and drifted SW. The larger plume on 12 June came from multiple small emissions; it rose to 6.1 km altitude and was last seen at 55 km SW of the summit before dissipating. There were seven MODVOLC thermal alerts on seven different days during June, and 17 different days with SO2 plumes with recorded values >2 Dobson Units.
Activity during July-December 2015. Multiple daily emissions, nighttime incandescence, and intermittent explosions continued during July 2015 (figure 75). Nine MODVOLC thermal alerts were issued, but they were concentrated during 6-8 and 26-31 July. The Washington VAAC issued alerts on 8, 10, and 11 July, and then during a second period from 24 to 28 July. The report on 8 July noted an ash emission at 7.6 km altitude extending 15 km SW from the summit. The report on 10 July noted that ashfall had been reported about 10 km NW of the summit, but cloudy skies prevented satellite observations. Reports issued during 24-28 July included satellite observations of emissions at 6.1 to 7.6 km altitude extending 25-45 km NE or W from the summit before dissipating. The SO2 emissions during July were visible nearly every day in the satellite data, with 16 days having values >2 DU.
Sulfur dioxide emissions during August 2015 were also visible in satellite imagery nearly every day. Six days had values >2 DU. There were no Washington VAAC reports during August, but there were ten MODVOLC thermal alerts issued throughout the month.
The number of daily emissions during September 2015 were far fewer than during January-July 2015, although crater incandescence was still observed. The Washington VAAC only issued three reports, all during 19-20 September. They observed an ash emission on 19 September at 6.7 km altitude that extended 45 km WNW from the summit for a few hours before dissipating (figure 76). Ten MODVOLC thermal alerts were issued in September, and SO2 plumes were visible daily with values >2 DU on half the days of the month.
Ash emissions increased again during October 2015. Ash-bearing plumes rose as high as 2 km above the crater. The Washington VAAC issued reports of ash plumes on 12 different days. An ash plume observed on 2 October at 7.6 km altitude extended 185 km SW before dissipating; another plume on 20 October was identified in satellite images at 8.5 km altitude drifting NW, and was visible from México City. Eighteen MODVOLC thermal alerts were issued throughout the month, and strong SO2 plumes were detected nearly every day in OMI satellite data.
Activity during November 2015 was similar to that during October. CENAPRED recorded tens of daily emissions of water vapor, gas, and minor amounts of ash. Explosions at regular intervals sent ash plumes 1-3 km above the summit, and incandescent material was deposited on the flanks within 1 km of the crater a number of times (figure 77). The Washington VAAC issued aviation alerts almost daily during 1-17 November, but none after that for the rest of the year. Most of the ash plumes reached 6.1-7.3 km altitude and drifted N, NE, SW, W, and S for a few tens of kilometers before dissipating. The plume on 7 November rose to 9.1 km and was visible as a dark feature above the weather clouds before it dissipated.
While ash plume observations decreased during the second half of November and during December, MODVOLC thermal alerts increased in number. Thirty-three appeared during November, and 35 during December. Plumes of SO2 were persistently visible in Aura/OMI satellite data both months.
Activity during January-June 2016. A series of explosive events during 2-8 January 2016 resulted in 13 aviation alerts from the Washington VAAC. An ash plume first reported in satellite data early on 6 January was drifting E at 6.4 km altitude. By late the next day, VAAC reports indicated that the plume was still visible over 1,000 km E before it finally dissipated. A new series of explosive events began on 20 January (figure 78) and lasted through 26 January.
CENAPRED reported that on 23 January 2016 an increase in activity was characterized by continuous gas-and-ash emissions, likely related to the destruction of a recently-formed lava dome. Later that night cameras recorded incandescent fragments ejected during periods of emissions. The constant steam-and-ash emissions drifted E and ENE for more than 48 hours at altitudes from 6.1 to 8.2 km. By 25 January, an ash plume was still visible over 900 km E. NASA Earth Observatory posted a satellite image of the plume around 1930 UTC (1330 local time) (figure 79). NASA's Goddard Space Flight Center also captured an image of a strong SO2 plume drifting NE from Popocatépetl at the same time (figure 80). Twenty-six MODVOLC thermal alerts were issued on 15 days of January. Especially strong SO2 plumes were visible on 6, 7, 23, and 25 January.
Tens of daily emissions of water vapor, gas, and ash were reported during February 2016, along with multiple daily explosions generating ash plumes and occasionally sending tephra onto the flank. The Washington VAAC issued aviation alerts on twelve days during the month. They were discrete events that sent ash plumes generally E or SE at altitudes between 6 and 7 km, and generally dissipated within 6 hours, tens of kilometers from the summit. An ash plume reported on 15 February was still visible 500 km E of the summit before it dissipated. MODVOLC thermal alerts were reported on 10 days during the month, SO2 plumes were more intermittent and only exceeded 2 DU on four days.
The largest ash explosion events during March 2016 took place at the end of the month. On 27 March, an ash plume was spotted by the Washington VAAC extending about 100 km NE at 6.4 km altitude. Explosions on 29 March created an ash plume at 9.1 km altitude moving rapidly ESE (figure 81). Ashfall from the plume caused Puebla's airport to close from 2000 on 29 March to 0600 on 30 March. The plume fanned out and extended tens of kilometers to both the S and SE before dissipating. On 31 March an explosion produced an ash plume that rose 1.8 km and drifted ENE; incandescent fragments fell 1 km away on the ESE flank. Thermal alerts were issued by MODVOLC on 13 days of March, and SO2 plumes were visible about the same number of days, but values did not exceed 2 DU.
On 2 April 2016 CENAPRED scientists conducted an overflight of the crater and observed the inner crater which was 325 m in diameter and 50 m deep (figure 82). The crater had previously been filled with a lava dome, destroyed in January, which had grown to an estimated volume of 2,000,000 cubic meters. Small landslides had occurred on the E wall of the inner crater. During 3 April, incandescent fragments were ejected as far as 3.5 km onto the E and SE flanks, generating fires in that part of the forest; authorities noted that the event was the largest explosion in three years. Ash fell in the towns of Juan C. Bonilla (32 km ENE) and Coronango (35 km ENE), both in the state of Puebla. The Washington VAAC reported numerous ash plumes during 1-9 April. The highest, on 1 April, was observed in satellite data at 9.7 km altitude, extending over 300 km NE over the Gulf of México. The other plumes were mostly observed between 6.4 and 8.5 km altitude, drifting E or NE.
Strombolian activity on 18 April ejected incandescent fragments 1.6 km onto the NE flank, and ash plumes rose 3 km above the crater and drifted ENE. Ashfall was reported in San Pedro Benito Juárez (12 km SE), San Nicolás de los Ranchos (15 km ENE), Tianguismanalco (17 km E), San Martín Texmelucan (35 km NNE), and Huejotzingo (27 km NE). According to a news article, the airport in Puebla closed again due to the ash plumes. Thermal alerts from MODVOLC were recorded on 13 days during the month, and SO2 plumes were visible in the Aura/OMI data almost every day.
Activity continued at slightly lower levels during May 2016 with VAAC reports issued on nine days. The ash plumes reported all dissipated quickly within a few tens of kilometers of the summit after drifting E at altitudes generally around 6.4 to 6.7 km. Single MODVOLC alerts were reported on only six days during the month, and except for a large SO2 plume on 3 May, small plumes were visible about 8 days of the month.
An increase in the number of daily explosions with ash emissions was reported by CENAPRED during June 2016. As many as six a day were reported during the second week of the month. An explosion on 12 June produced an ash plume that rose 2.5 km and drifted W (figure 83). Minor amounts of ash fell in Ozumba (18 km W). Aviation alerts were issued by the Washington VAAC on 13 days. Most of the ash plumes dissipated within six hours a few tens of kilometers from the summit due to high winds. The plumes rose to altitudes between 6.1 and 7.9 km, and drifted NE, W and SW. The ash plume reported on 23 June extended NE 16 km at 7.3 km altitude, and 26 km SW at 5.8 km altitude simultaneously. Thermal alerts from the MODVOLC system were reported on 1, 8, and 25 June. SO2 satellite data was only available for the second half of the month, and showed two days with significant SO2 plumes.
Geologic Background. Volcán Popocatépetl, whose name is the Aztec word for smoking mountain, rises 70 km SE of Mexico City to form North America's 2nd-highest volcano. The glacier-clad stratovolcano contains a steep-walled, 400 x 600 m wide crater. The generally symmetrical volcano is modified by the sharp-peaked Ventorrillo on the NW, a remnant of an earlier volcano. At least three previous major cones were destroyed by gravitational failure during the Pleistocene, producing massive debris-avalanche deposits covering broad areas to the south. The modern volcano was constructed south of the late-Pleistocene to Holocene El Fraile cone. Three major Plinian eruptions, the most recent of which took place about 800 CE, have occurred since the mid-Holocene, accompanied by pyroclastic flows and voluminous lahars that swept basins below the volcano. Frequent historical eruptions, first recorded in Aztec codices, have occurred since Pre-Columbian time.
Information Contacts: Centro Nacional de Prevención de Desastres (CENAPRED), Av. Delfín Madrigal No.665. Coyoacan, México D.F. 04360, México (URL: https://www.gob.mx/cenapred/); Washington Volcanic Ash Advisory Center (VAAC), Satellite Analysis Branch (SAB), NOAA/NESDIS OSPO, NOAA Science Center Room 401, 5200 Auth Rd, Camp Springs, MD 20746, USA (URL: http://www.ospo.noaa.gov/Products/atmosphere/vaac/, archive at: http://www.ssd.noaa.gov/VAAC/archive.html); Hawai'i Institute of Geophysics and Planetology (HIGP), MODVOLC Thermal Alerts System, School of Ocean and Earth Science and Technology (SOEST), Univ. of Hawai'i, 2525 Correa Road, Honolulu, HI 96822, USA (URL: http://modis.higp.hawaii.edu/); NASA Earth Observatory, EOS Project Science Office, NASA Goddard Space Flight Center, Goddard, Maryland, USA (URL: http://earthobservatory.nasa.gov/); NASA Goddard Space Flight Center (NASA/GSFC), Global Sulfur Dioxide Monitoring Page, Atmospheric Chemistry and Dynamics Laboratory, 8800 Greenbelt Road, Goddard, Maryland, USA (URL: https://so2.gsfc.nasa.gov/).
Reventador (Ecuador) — July 2017 Cite this Report
Reventador
Ecuador
0.077°S, 77.656°W; summit elev. 3562 m
All times are local (unless otherwise noted)
Lava flow emerges from summit cone, January 2016; continued explosions, pyroclastic flows, and ash emissions
The andesitic Volcán El Reventador lies well east of the main volcanic axis of the Cordillera Real in Ecuador and has historical observations of eruptions with numerous lava flows and explosive events going back to the 16th century. The largest historical eruption took place in November 2002 and generated a 17-km-high eruption cloud, pyroclastic flows that traveled 8 km, and several lava flows. From June 2014-December 2015, monthly eruptive activity included ash plumes, lava flows, pyroclastic flows, and ejected incandescent blocks (BGVN 42:06). Similar activity during January-April 2016 is described below with information provided by the Instituto Geofisico-Escuela Politecnicia Nacional (IG) of Ecuador, and the Washington Volcanic Ash Advisory Center (VAAC).
Almost daily eruptive activity continued during January-April 2016. Steam and gas emissions, usually containing minor amounts of ash, were visible at the summit crater on most clear days rising 500-1,000 m above the 3.6-km-high summit. Explosions sent incandescent blocks 500-1,500 m down all flanks several times each month. Pyroclastic flows also traveled similar distances down the flanks a few times each month. A lava flow was observed descending the N flank of the summit cone on 28 January 2016.
Steam and gas emissions, usually with minor amounts of ash, rose daily from the summit crater during January 2016. Plumes generally rose 500-1,000 m and drifted NW or W. A pyroclastic flow descended 1,000 m down the NE flank on 5 January. Loud explosions were heard in the community of El Reventador (15 km E) on 6 and 7 January, and plumes were observed 1.5 km above the crater. The Washington VAAC reported an ash emission moving SW on 9 January at 4.6 km altitude; it extended 65 km SW before dissipating. The Guayaquil Meteorological Weather Office (MWO) reported an ash emission on 12 January at 6.7 km altitude, but extensive cloud cover prevented satellite observation.
The Washington VAAC observed emissions in satellite imagery moving 25 km NW on 15 and 16 January at about 4.9 km altitude. Technical crews performing maintenance on 15 January observed and documented several explosions with ash plumes that reached 2 km above the summit (about 5.5 km altitude) and observed a pyroclastic flow that moved 500 m down the N flank (figure 53). They also noted pyroclastic deposits that had been emplaced during recent weeks along the N flank. Small pyroclastic flows during the night of 18 January descended the flanks of the cone for 1,000 m. Additional explosions the next day sent blocks down the SW flank. On 21 January, incandescent blocks traveled 1,200 m down the W flank; on 27 January, they were observed 500 m below the summit crater. The Washington VAAC observed a hotpot in infrared imagery on 24 January.
On 28 January 2016, IG conducted an overflight and observed pulsing fumarolic activity producing plumes with low to moderate ash emissions drifting W. They noted pyroclastic flow deposits on all the flanks that did not go beyond the foot of the active cone. They also witnessed an active lava flow descending the N flank, emerging from a vent on the N side of the summit of the cone (figure 54). Thermal measurements were taken at the N vent (501°C ), the central vent (372.8°C), and the base of the flow (324.6°C) (figure 55). MODVOLC thermal alerts were reported on eight days during January (6, 9 (4), 14, 16 (3), 18 (3), 25 (2), 27 (3), 29, 31).
Reventador was quieter during February 2016 than in January. Steam and gas emissions with minor ash were observed often, with emissions generally below 500 m above the crater. Incandescent blocks observed on 4 February were 1,000 m below the summit crater. The Washington VAAC reported ash emissions visible in satellite imagery on 5 February moving SSW, extending about 25 km at 4.3 km altitude (about 700 m above the summit crater); they also observed incandescence at the crater. Incandescence was again observed on 6 and 7 February; blocks traveled 700 m down the SW flank on 13 February. A diffuse, narrow plume of ash was drifting NW from the summit on 14 February at 4.6 km altitude. The Guayaquil MWO reported an ash plume at 6.1 km altitude moving W on 23 February, but weather clouds obscured views in satellite imagery. Although it was cloudy on 27 February, loud explosions were heard during the night. MODVOLC thermal alerts were reported on seven days of the month; 1 (3), 3 (5), 5 (4), 6, 14 (3), 19, and 26 (3).
Tourists visiting the Hostería el Reventador observed steam, gas, and ash emissions on 2 March 2016. On many clear days during March, emissions of steam with minor ash were observed rising 1 km above the summit crater, drifting NW, W or SW. Incandescence and pyroclastic flows were seen much more frequently than during February. A pyroclastic flow traveled down the SE flank on 5 March. Explosions that afternoon sent incandescent blocks 1,200 m down the E and SE flanks. This activity continued through 9 March with blocks traveling daily 500-1,000 m down the flanks. On 9 March, ash emissions rose to 1 km above the crater and drifted NW; morning explosions sent blocks 1,200 m down the flanks and a small pyroclastic flow was observed that night. Explosions with steam and ash rising 1 km above the summit were observed on 10 March. Incandescence at the summit, and blocks rolling up to 1,500 m down the flanks were observed on most clear nights during the second half of March. A pyroclastic flow on 20 March descended 2 km down the SW flank. Steam and ash were reported drifting W 1 km above the crater on 21 March.
The Guayaquil MWO reported ash emissions on 7 March to 4.9 km, but weather clouds prevented observations by the Washington VAAC. On 10 March, ash emissions were confirmed in satellite imagery at 6.1 km altitude drifting W. The MWO reported ash emissions at 6.4 km altitude on 15 March, but weather clouds again prevented satellite observation. Webcam images showed ash emissions on 18 March at 4.3 km altitude drifting NW. The next day, the Washington VAAC was able to observe emissions in both satellite imagery and the webcam drifting W at 5.5 km altitude. Possible emissions on 31 March were also obscured by weather clouds. MODVOLC thermal alerts were reported on 7 days during March; 6, 15 (2), 16 (2), 22 (4), 26 (4), 29, 31.
Explosions that sent incandescent blocks down the flanks were observed nine times during April 2016, on days 3, 4, 7, 9, 12, 19, 23, 25, and 26. They generally travelled 1,000 m or more down various flanks. They were observed 2,000 m down the SW flank after a large explosion on 23 April. Pyroclastic flows were observed three times. On 6 April they traveled 1,500 m down the NW flank; on 13 and 21 April they traveled 1,000 m down the E flank. Steam and gas emissions were observed on most clear days, and generally contained minor amounts of ash. The plumes usually rose 300 to 800 m above the summit and drifted W, but on 13 and 18 April they rose 2 km above the summit, according to INSIVUMEH.
The Washington VAAC reported a possible ash emission on 4 April drifting NW at 4.3 km altitude based on a brief emission witnessed from the webcam. Weather clouds prevented satellite imagery views. There were also reports of volcanic ash at 6.7 km altitude drifting SE on 12 April, but both the webcam and satellite imagery were obscured by clouds. Observers reported an ash plume moving NE at 5.5 km altitude the next day. Ash emissions were reported moving NW at 5.8 km altitude on 29 April, but weather clouds again obscured satellite imagery. MODVOLC thermal alerts were reported on 8 days of April: 3, 11 (2), 14 (2), 19 (2), 20, 25 (4), 26 (3), 30.
Geologic Background. Volcán El Reventador is the most frequently active of a chain of Ecuadorian volcanoes in the Cordillera Real, well east of the principal volcanic axis. The forested, dominantly andesitic stratovolcano has 4-km-wide avalanche scarp open to the E formed by edifice collapse. A young, unvegetated, cone rises from the amphitheater floor to a height comparable to the rim. It has been the source of numerous lava flows as well as explosive eruptions visible from Quito, about 90 km ESE. Frequent lahars in this region of heavy rainfall have left extensive deposits on the scarp slope. The largest recorded eruption took place in 2002, producing a 17-km-high eruption column, pyroclastic flows that traveled up to 8 km, and lava flows from summit and flank vents.
Information Contacts: Instituto Geofísico (IG), Escuela Politécnica Nacional, Casilla 17-01-2759, Quito, Ecuador (URL: http://www.igepn.edu.ec/); Washington Volcanic Ash Advisory Center (VAAC), Satellite Analysis Branch (SAB), NOAA/NESDIS OSPO, NOAA Science Center Room 401, 5200 Auth Rd, Camp Springs, MD 20746, USA (URL: http://www.ospo.noaa.gov/Products/atmosphere/vaac/, archive at: http://www.ssd.noaa.gov/VAAC/archive.html); Hawai'i Institute of Geophysics and Planetology (HIGP) - MODVOLC Thermal Alerts System, School of Ocean and Earth Science and Technology (SOEST), Univ. of Hawai'i, 2525 Correa Road, Honolulu, HI 96822, USA (URL: http://modis.higp.hawaii.edu/).
San Miguel (El Salvador) — July 2017 Cite this Report
San Miguel
El Salvador
13.434°N, 88.269°W; summit elev. 2130 m
All times are local (unless otherwise noted)
Six small ash emission events during January 2015-June 2017
Volcán de San Miguel (Chaparrastique), in southern El Salvador, was active with several flank lava flows during the 17th-19th centuries, but recent activity has consisted of occasional ash eruptions from the summit crater. The beginning of the most recent eruption on 29 December 2013 resulted in a large ash plume that rose to 9.7 km altitude, and dispersed ash to many communities within 30 km of the volcano (BGVN 40:08). Intermittent ash plumes lasted through 28 July 2014. This report covers activity from January 2015 through June 2017, and describes six small ash emission events during this time. Information about San Miguel comes from the the Ministero de Medio Ambiente y Recursos Naturales (MARN) of El Salvador, and the Washington Volcanic Ash Advisory Center (VAAC).
Six ash-bearing explosions occurred at San Miguel between January 2015 and June 2017. Otherwise, minor seismicity and pulses of gas-and-steam emissions were the primary type of activity. The explosion on 26 January 2015 sent a plume 300 m above the crater, drifting SW. An explosion on 11 April 2015 resulted in an ash plume rising about 800 m above the crater that also drifted SW. Trace amounts of ash were emitted on 13 August 2015. The largest explosion of the period took place on 12 January 2016, when an ash plume drifting W caused ashfall as far as 25 km away, and the plume was ultimately visible as far as 300 km from the volcano. Incandescence was observed at the base of the 900-m-high eruptive column that appeared on 18 June 2016. Minor ash emissions were reported on 7 January 2017 drifting 130 km SW from San Miguel. Minor seismic swarms and steam-and-gas plumes were reported during February-June 2017.
Activity during 2015. After very little activity other than slightly elevated RSAM values since July 2014, a small ash-bearing explosion occurred on 26 January 2015 (figure 18). The ash plume rose about 300 m above the crater and drifted SW, dissipating quickly. Trace amounts of ash fell in the Piedra Azul area about 6 km SW of the crater.
Another emission lasting for 20 minutes on 22 February 2015 sent a column of gas 300 m above the crater that dispersed to the SSW; no ash was observed. Occasional pulses of gas were reported during March rising 200 m above the summit crater. An explosion on 11 April 2015 resulted in an ash plume rising about 800 m above the crater and drifting SW. Local observers reported a millimeter of ashfall in the areas of La Piedra, Morita, and San Jorge, less than 10 km to the SW.
Occasional small pulses of gas that rose to about 200 m above the crater were typical behavior during May-July (figure 19). On 13 August 2015, the webcam captured a gas plume emission that contained minor amounts of ash and rose 200-300 m above the crater. A millimeter of ashfall was reported in San Jorge, and near the communities of Moritas and Piedrita to the SW. No emissions were reported during September, and the small pulses of gas observed during October did not exceed 200 m above the summit crater. No anomalous activity was reported during November, and small discrete pulses of gas were the only activity reported for December 2015.
Activity during 2016. San Miguel began the year with what MARN described as a VEI 1 eruption of ash and gas on 12 January 2016 (figure 20). Periodic pulses of ash and gas lasting 3-5 minutes rose to less than 1,000 m above the crater and drifted WSW. Ashfall was reported from La Piedra, Moritas, La Placita, San Jorge, (all less than 10 km SW), San Rafael Oriente (10 km SW), Alegría (25 km NW) and Berlin in Usulután (21 km SW).
NASA Earth Observatory captured images of two pulses of ash from the 12 January eruption that show the changing direction of the plume (figure 21). The first image, taken at 1635 (UTC) shows the ash plume headed directly W. The second image, taken three hours later at 1935 shows the active plume drifting SW, with the earlier plume segment farther to the W over the Pacific Ocean. The Washington VAAC reported the ash emission at 2.4 km altitude (300 m above the summit crater) drifting WSW at 1745 (UTC). At that time, the denser part of the plume extended 45 km from the volcano and the diffuse, wispy plume extended 130 km WSW. By midday on 13 January, the Washington VAAC reported ongoing emissions and that the plume extended 300 km SW. The plume was no longer visible in satellite images by the end of the day.
Seismicity declined during 12-14 January 2016. On 15 January, local observers reported a millimeter of ash deposited in Las Cruces on the N flank. Gas emissions during 17-18 January were weak, only rising 150 m. At 0900 on 18 January, the emission plume became dark and drifted SW. By the next crater inspection on 19 February, MARN scientists noted only minor degassing from the summit crater.
Although a period of volcanic tremor occurred on 8 March 2016, only short pulses of gas were observed that did not rise more than 150 m above the crater. Another spike in seismicity occurred on 3 April, but no gas or ash emissions were observed. Otherwise, only minor pulses of gas issued from the crater during February through May. A seismic swarm indicating rock fracturing at depth on 31 May could have resulted in trace amounts of ash deposited within the crater, but cloudy weather prevented observations. A few pulses of gas were observed from the webcam other times during May.
Seismic activity increased significantly during the second week in June. An explosion in the early morning of 18 June 2016 lasted about 60 seconds, and sent an ash emission to about 900 m above the crater (figure 22). Incandescence was observed within the eruptive column, and the debris fell about 100 m down the N flank. Ashfall of less than half a millimeter was reported in the El Volcan area about 7 km NE of the crater. The volcanologist who examined the ash determined that it was juvenile material from a magmatic explosion. A continuous column of steam-and-gas issued from the crater until 29 June (figure 23). During this time, local observers and officials from the Civil Protection of San Jorge reported sulfur odors and slight acid rain damage to the vegetation in the La Morita, La Piedrita, La Ceiba, and LACAYO farms, located about 4 km W of the crater.
Seismic activity was slightly elevated during the first half of July 2016, but otherwise only small pulses of gas were observed from the crater. Low-level activity continued from the summit crater during August. On 29 August, however, a seismic signal indicative of a lahar was noted near the VSM (Santa Isabel) seismic station, but no damage was reported. Periodic pulses of gases were noted during September 2016. A 20-minute-long seismic signal on 5 September indicated another lahar passing near seismic station VSM, but no damage was reported. GPS measurements during September indicated deformation of a few millimeters on the N flank. No explosions were reported during October-December 2016, only small plumes of steam and gas were observed (figure 24).
Activity during January-June 2017. On 7 January 2017, the Washington VAAC reported minor volcanic ash emissions from San Miguel at 2.6 km altitude extending SW about 130 km from the summit. Mild degassing continued during February and March. A brief seismic swarm occurred on 17 April 2017, but no explosions of gas or ash were observed in the webcam. A strong gas plume rose 1.2 km above the crater rim on 27 April. Seismicity decreased during May. Other than small gas plumes, the only activity reported during June 2017 was a slight increase in seismicity beginning on 12 June and lasting to the end of the month.
Geologic Background. The symmetrical cone of San Miguel, one of the most active volcanoes in El Salvador, rises from near sea level to form one of the country's most prominent landmarks. A broad, deep, crater complex that has been frequently modified by eruptions recorded since the early 16th century caps the truncated unvegetated summit, also known locally as Chaparrastique. Flanks eruptions of the basaltic-andesitic volcano have produced many lava flows, including several during the 17th-19th centuries that extended to the N, NE, and SE. The SE-flank flows are the largest and form broad, sparsely vegetated lava fields crossed by highways and a railroad skirting the base of the volcano. Flank vent locations have migrated higher on the edifice during historical time, and the most recent activity has consisted of minor ash eruptions from the summit crater.
Information Contacts: Ministero de Medio Ambiente y Recursos Naturales (MARN), Km. 5½ Carretera a Nueva San Salvador, Avenida las Mercedes, San Salvador, El Salvador (URL: http://www.snet.gob.sv/ver/vulcanologia); Washington Volcanic Ash Advisory Center (VAAC), Satellite Analysis Branch (SAB), NOAA/NESDIS OSPO, NOAA Science Center Room 401, 5200 Auth Rd, Camp Springs, MD 20746, USA (URL: http://www.ospo.noaa.gov/Products/atmosphere/vaac/, archive at: http://www.ssd.noaa.gov/VAAC/archive.html).
Santa Maria (Guatemala) — July 2017 Cite this Report
Santa Maria
Guatemala
14.757°N, 91.552°W; summit elev. 3745 m
All times are local (unless otherwise noted)
Continuous ash emissions, pyroclastic flows and lahars; new lava dome visible at Caliente dome, October 2016
The dacitic Santiaguito lava-dome complex on the W flank of Guatemala's Santa María volcano has been growing since 1922. The youngest of the four vents in the complex, Caliente, has been actively erupting with ash explosions, pyroclastic flows, and lava flows for more than 40 years. Constant steam and magmatic gases during January-June 2016 were accompanied by some of the largest explosive events of the last few years in April and May. Ash plumes rose to over 5 km altitude and spread ash regularly over communities within 30 km (BGVN 41:09). Guatemala's INSIVUMEH (Instituto Nacional de Sismologia, Vulcanologia, Meterologia e Hidrologia) and the Washington VAAC (Volcanic Ash Advisory Center) provided regular updates on the continuing activity during the second half of 2016, and are the primary sources of information for this report.
Constant emission of both steam and magmatic gas were observed from the summit of Caliente dome throughout July-December 2016. Overall, eruptive activity decreased during this period compared with the previous six months. During July-September, INSIVUMEH reported 3-5 daily weak or moderate explosions with ash plumes that rose to 3.3-3.5 km altitude and dispersed ash over communities generally to the SW within 30 km. Stronger explosions took place 5-10 times each month from July-September. The ash plumes from these larger explosions usually rose to 5-5.5 km altitude. The highest plume was reported by the Washington VAAC at 6.1 km altitude during August. Ash plumes drifted more than 100 km from the volcano on several occasions, and ashfall was reported more than 50 km away more than once. These larger explosions also produced numerous pyroclastic flows that descended into the drainages on the SE, S, and SW flanks of Caliente dome. Heavy rains resulted in substantial lahars generated from the ash and debris several times each month.
INSIVUMEH observed the growth of a new lava dome inside the summit crater of Caliente beginning in October. By the end of the year, it had filled more than half of the summit crater with new material. During October, November, and the first part of December, the number of smaller explosions to around 3.5 km altitude increased to 25-35 daily events.
Activity during July-August 2016. Eruptive activity at the Santiaguito dome complex decreased from previous months during July 2016. Constant degassing from the Caliente dome, weak and moderate daily explosions, and ashfall in nearby (5-20 km) communities to the W and SW were typical. Steam and magmatic gases generally rose 300-400 m above the summit crater. Three or four weak to moderate explosions per day generally created diffuse ash plumes that rose to altitudes of 3.3-3.5 km. Ashfall from the smaller explosions generally affected the villages of San Marcos Palajunoj, Loma Linda, Monte Bello, and a few others located 10-20 km SW. Four stronger explosions on 1 (2), 3, and 10 July sent ash plumes to altitudes of 5-5.5 km (figure 48) and generated pyroclastic flows that descended the SW, S, and SE flanks (figure 49).
Ash from the larger explosions was reported at least once in Columba, about 20 km SW (figure 50), Malacatán (about 55 km NW), and also from the Chiapas regions of Mexico, 70 km W. The Washington VAAC reported a plume on 1 July at 5.2 km altitude with ash extending about 35 km WNW. On 10 July, they observed an ash plume in multispectral imagery moving NW about 45 km from the summit. They also observed a bright hotspot at the summit. On 11 July, they reported an ash plume at 6.4 km altitude extending over 80 km NW. Dissipating ash was visible in imagery about 275 km NW later in the day.
A lahar descended the Cabello de Ángel river drainage on 3 July 2016 after a large explosion (figure 51). It was up to 30 m wide in places, and 1.5 m deep with blocks up to 1.5 m in diameter. The Cabello de Ángel flows into the Nimá I and Samala River drainages.
Constant degassing of steam and bluish magmatic gases continued during August 2016, rising 100-400 m above the summit of Caliente dome. Three to five weak or moderate explosions occurred daily, sending ash plumes to altitudes of 3.3-3.5 km (800-1,000 m above the dome). The STG3 seismic station recorded nine larger explosions in August (4, 14, 16, 18, 20, 21, 23, 28) that sent ash emissions to 4-5.5 km altitude, and generated pyroclastic flows that descended up to 2.5 km down the flanks (figure 52). The incandescent rock and ash descended the Nimá I, Nimá II, and San Isidro drainages on the SW, S, and SE flanks.
Communities and fincas (farms) affected by ashfall from these explosions included San Marcos Palajunoj, Loma Linda, Monte Bello, San Felipe (15 km SSW), Mazatenango (25 km SSE), Retalhuleu (27 km SW), El Faro, La Florida (5 km S), Patzulin (SW flank), and El Patrocinio. Tephra particles as large as 8 mm were collected in Loma Linda (figure 53). A few of the explosions resulted in ashfall more than 50 km from the volcano, including into Mexico. The Washington VAAC reported ash plumes rising to 5.8 km on 1 August; they were later visible 175 km W of the Mexico coast, W of Tapachula, Mexico. Two emissions on 12 August were seen at 5.2 km altitude drifting W. Ongoing emissions were reported at 6.1 km altitude on 16 August moving WNW and extending about 80 km. The plume observed on 19 August was 65 km NW at 5.5 km altitude. A plume observed in multispectral imagery on 25 August was moving NW at 6.1 km altitude over 185 km from the summit.
Increased precipitation during August 2016 led to lahars on 8, 13, and 29 August 2016 that descended the Cabello de Ángel , Nimá I, and Samalá drainages. They ranged from 18 to 25 m wide and were 1.5 m deep containing blocks up to 1.5 m in diameter. Flooding was reported downstream near the Castillo Armas bridge on the Samalá River.
Activity during September 2016. Most of the steam and magmatic gases emitting daily from Caliente during September 2016 rose 100-400 m above the dome and generally drifted SW or W (figure 54). Small to moderate ash-bearing explosions occurred 3-5 times daily; ash plumes generally rose to 3.3-3.5 km altitude during these events. Several stronger explosions during September (1, 4, 11, 17, 19, 24, 25, 30) generated ash plumes that rose to 4.5 or 5 km altitude and drifted W, SW, S, SE and E. The Washington VAAC also reported an ash plume observed in multispectral imagery on 20 September at 5.2 km altitude drifting 45 km W. A few hours later, they reported two plumes, one at 4.6 km drifting 75 mi W, and a second at 5.2 km altitude moving WSW over 80 km from the summit.
Near-daily ashfall was reported from many of the communities 10-20 km SW including San Marcos Palajunoj, Loma Linda, Monte Bello, Santa María de Jesús, El Nuevo Palmar, and Las Marías (figure 55) during September 2016. Lapilli as large as 15 mm diameter was collected in the neighborhoods of San Marcos Palajunoj (figure 56).
The larger explosions also resulted in pyroclastic flows that travelled 2.0-2.5 km down the SW, S, and SE flanks in the Nimá I, Nimá II, and San Isidro drainages. Areas of vegetation burned from the heat of the pyroclastic flows (figure 57).
Lahars or heavy mudflows were recorded on ten days during September, primarily in the Cabello de Ángel and Nimá I drainages (figure 58). Channels of debris worked their way over the 2015 lava flows in the Nimá I drainage and continued downstream. The lahars were 13-20 m wide and 1.5 m high and carried clay, volcanic ash, and blocks up to 1.5 m in diameter.
The constant explosive activity at Caliente dome during 2016 enlarged the summit crater significantly between January and the end of September 2016. In January 2016, it was about 260 m wide and 20 m deep; by 21 September, it was 340 m wide and 175 m deep according to INSIVUMEH (figure 59).
Activity during October-December 2016. INSIVUMEH reported that a new lava dome began growing inside the summit crater of Caliente on 1 October 2016. The number of weak to moderate ash-bearing explosions increased during October, but the overall amount of energy from the explosions decreased. The STG3 seismic station recorded 25-35 weak to moderate explosions per day and the ash plumes they created generally rose to 3.3-3.5 km altitude (figure 60). There were no strong explosions reported by INSIVUMEH. The Washington VAAC reported larger ash plumes at 5.5 km altitude on 3 and 4 October that drifted a few tens of kilometers SSW from the summit before dissipating. Ashfall from these plumes was reported in the villages of San Marcos Palajunoj, Loma Linda, Monte Bello, El Faro, Patzulin and others to the S and SW. Lahars up to 20 m wide descended the Cabello de Ángel drainage on 4, 27, and 28 October.
The same eruptive pattern as October continued during November 2016 with 25-35 daily weak to moderate explosions that were responsible for ashfall in the villages to the SW, including Monte Claro, San José, and La Quinta and others. Steam and magmatic gasses continued to rise 100-500 m above the Caliente dome. A 15-m-wide lahar descended the Cabello de Ángel drainage on 9 November that was one meter deep, and carried material several kilometers down the Nimá and Samala drainages. The Washington VAAC reported some of the ash plumes visible up to 50 km from the dome. On 14 November, they noted two ash emissions at 4.6 km altitude. One was dissipating about 40 km SW while the second was within 15 km headed in the same direction. They also noted a small ash emission at 4.6 km altitude on 25 November drifting 20 km W.
Eruptive activity continued at a similar level during the first half of December 2016 with many weak and a few moderate explosions. During the second half of the month, the number of moderate explosions increased, but the overall number of explosions decreased. Twenty-five to thirty weak to moderate explosions per day were responsible for ash plumes rising to 3.0-3.5 km altitude. The Washington VAAC reported plumes on 24 and 30 December visible in satellite imagery at 4.6 km altitude drifting W. INSIVUMEH reported that the explosion on 30 December generated a pyroclastic flow that traveled for 2 km.
The growth of the new lava dome within the summit crater of Caliente first observed in October continued during November and December. By 18 December 2016 the new, growing dome had filled about two-thirds of the summit crater (figure 61). Heat flow at Caliente steadily declined during the second half of 2016, especially as compared with values during the first half of the year (see figure 47, BGVN (41:09). Only two MODVOLC thermal alerts were recorded after June 2016, on 29 July and 1 August. The MIROVA signal also showed a steady decrease in heat flow during this period (figure 62).
Geologic Background. Symmetrical, forest-covered Santa María volcano is part of a chain of large stratovolcanoes that rise above the Pacific coastal plain of Guatemala. The sharp-topped, conical profile is cut on the SW flank by a 1.5-km-wide crater. The oval-shaped crater extends from just below the summit to the lower flank, and was formed during a catastrophic eruption in 1902. The renowned Plinian eruption of 1902 that devastated much of SW Guatemala followed a long repose period after construction of the large basaltic andesite stratovolcano. The massive dacitic Santiaguito lava-dome complex has been growing at the base of the 1902 crater since 1922. Compound dome growth at Santiaguito has occurred episodically from four vents, with activity progressing E towards the most recent, Caliente. Dome growth has been accompanied by almost continuous minor explosions, with periodic lava extrusion, larger explosions, pyroclastic flows, and lahars.
Information Contacts: Instituto Nacional de Sismologia, Vulcanologia, Meteorologia e Hydrologia (INSIVUMEH), Unit of Volcanology, Geologic Department of Investigation and Services, 7a Av. 14-57, Zona 13, Guatemala City, Guatemala (URL: http://www.insivumeh.gob.gt/); Washington Volcanic Ash Advisory Center (VAAC), Satellite Analysis Branch (SAB), NOAA/NESDIS OSPO, NOAA Science Center Room 401, 5200 Auth Rd, Camp Springs, MD 20746, USA (URL: http://www.ospo.noaa.gov/Products/atmosphere/vaac/, archive at: http://www.ssd.noaa.gov/VAAC/archive.html); Hawai'i Institute of Geophysics and Planetology (HIGP) - MODVOLC Thermal Alerts System, School of Ocean and Earth Science and Technology (SOEST), Univ. of Hawai'i, 2525 Correa Road, Honolulu, HI 96822, USA (URL: http://modis.higp.hawaii.edu/); MIROVA (Middle InfraRed Observation of Volcanic Activity), a collaborative project between the Universities of Turin and Florence (Italy) supported by the Centre for Volcanic Risk of the Italian Civil Protection Department (URL: http://www.mirovaweb.it/).
Stromboli
Italy
38.789°N, 15.213°E; summit elev. 924 m
All times are local (unless otherwise noted)
Persistent low- and moderate-level explosive activity during 2015 and 2016
Confirmed historical eruptions at Italy's Stromboli volcano go back 2,000 years as this island volcano in the Tyrrhenian Sea has been a natural beacon for eons with its near-constant fountains of lava. Explosive activity during 2014 generated numerous lava flows that traveled down the flanks, including several that reached the ocean during August (BGVN 42:01). The volcano was quieter during 2015 and 2016 as reported by the Instituto Nazionale de Geofisica e Vulcanologia (INGV), Sezione de Catania, who monitors the gas geochemistry, deformation, and seismology, as well as the surficial activity at Stromboli. Their weekly reports are summarized briefly below. Eruptive activity at the summit consistently occurs from multiple vents at both a north crater area (N Area) and a southern crater group (S Area) on the Terrazza Craterica at the head of the Sciara del Fuoco, a large scarp that runs from the summit down the NW side of the island. Thermal and visual cameras placed on the nearby Pizzo Sopra La Fossa monitor activity at the Terrazza Craterica.
No reports were issued by INGV after a report of 16 October 2014. The last activity at Stromboli in 2014 captured remotely was a MODVOLC thermal alert on 8 November 2014. Low- to medium-intensity explosions from the active vent areas at the summit characterized activity throughout 2015 and 2016. Occasional bursts of higher-intensity activity sent ash, lapilli, and bombs across the Terrazza Craterica and onto the head of the Sciara del Fuoco.
Activity during 2015. While no thermal anomalies were identified in MODIS data during 2015 or 2016, the eruptive activity continued at low-to-moderate levels. Strombolian explosions were frequent from both crater areas during January 2015. Six explosions accompanied by abundant ash emissions erupted from the N Area on 12 and 13 January. In the S Area, vents also produced tephra containing lapilli and small bombs. A high-intensity burst from the S Area on 23 January contained ash and a few lapilli and bombs.
Intermittent explosive activity continued at both crater areas during February 2015. Medium-to-low intensity explosive activity during the first week characterized the N Area, with the ejection of bombs mixed with ash. Strombolian activity increased on 7 February. In the S Area, explosions were characterized by the ejection of fine ash with lesser coarse material (lapilli and bombs). An energetic explosive event took place at the S Area on 15 February (figure 92). It was the strongest event since the activity of August 2014, and was followed by several explosions over the following 12 hours that contained abundant tephra.
Low-intensity explosions characterized both the N and S Areas during March and early April 2015. Beginning on the afternoon of 15 April, the intensity and number of explosions increased significantly in the N Area for about 48 hours. Low- to medium-intensity explosions continued at both crater areas during May. On the evening of 11 May, and again during 13-15 May, a continuous glow was observed from the S Area caused by significant spattering activity. Strombolian activity was also noted from both crater areas on 20 and 21 May, and was more frequently observed during June 2015 (figure 93).
Members of an expedition to the summit on 1 July 2015 observed explosive activity from the S Area vents (figure 94). Activity continued at low-to-moderate levels during July. On 16 July, a strongly intense explosive sequence occurred at both crater areas (figure 95). The first explosion occurred in the S Area at 0103. A larger explosion a few seconds later produced a jet of bombs and lapilli that lasted for about 15 seconds and rose about 300 m into the air, depositing material across the Terrazza Craterica area and the upper part of the Sciara del Fuoco. A third explosion, this time from the N Area, occurred about one minute later, ejecting bombs and lapilli 200 m into the air. Intense spattering continued from both crater areas for the next hour, after which activity resumed at lower levels.
Low-intensity explosions accompanied by weak and discontinuous spattering with ash, lapilli, and bombs characterized activity from both areas for most of August except for a short-lived (2-hour) vigorous explosive event at the S Area beginning around 2300 on 8 August 2015. Activity was more vigorous at the N Area from 23 August through the end of the month. Low- and medium-low intensity explosions were typical during September with only a few days of medium- to medium-high intensity explosive events. Activity during October was difficult for INGV to monitor due to difficulty with their equipment, but it appeared to continue at low-to-moderate levels.
A series of medium- and medium-high intensity events occurred during 7-9 November 2015 from the N Area and were captured by the thermal camera on the Pizzo Sopra La Fossa (figure 96). Two vents in the N Area produced strong explosions at the same time generating plumes with fine ash and lapilli that likely reached over 200 m above the Terrazza Craterica. Another strong explosion from the N Area occurred on 19 November, sending coarse ejecta onto the top of the Sciara del Fuoco.
Explosions during 12 and 14 December ejected bombs and lapilli onto the Sciara del Fuoco. During an overflight on 16 December thermal imagery showed hot explosive material from the N Area deposited on the Sciara del Fuoco, and freshly erupted material surrounding the S Area as well.
Activity during 2016. During January 2016 windy and cloudy weather conditions and technical equipment problems made observations difficult for INGV, but activity was generally low to moderate at both crater areas. A strong Strombolian explosion from the N Area on 14 January was one of the larger events of the month, sending lapilli and bombs to the top of the Sciara del Fuoco. Numerous explosions from the N Area of medium-to-medium-high intensity were typical during February. Explosions at the S Area were generally low intensity. Clear weather on 15 February provided an excellent view of the two crater areas on the Terrazza Craterica (figure 97). A brief event on 21 February at the S Area caused weak spattering around the vent.
During March 2016, two vents were active in the S Area, and one in the N Area until 16 March, when a second vent began activity (figure 98). The typical frequency of events during low-level activity is 0-1 explosions per hour. Rarely, higher energy events will deposit material on the Sciara del Fuoco. After a month of low-intensity activity at both crater areas, there was a rapid intensification of explosive activity at the S Area at around 2130 on 28 April, which continued through 1 May (figure 99).
Generally low-level activity during most of May was interrupted during 6-11 May with persistent incandescence and pulsating spattering at the S Area vents. Occasional medium-to-high-intensity explosions from the S Area produced significant ash emissions during the second half of May, and often sent lapilli and bombs on to the Terrazza Craterica, and occasionally onto the Sciara del Fuoco.
Events with medium-to-high intensity levels continued at the S Area during June 2016, which resulted in ash emissions covering much of the Terrazza Craterica. Intensity increased in the N area by the third week of June. Two site inspections on 6 and 7 July by INGV provided details of the ongoing changes in morphology at the Terrazza Craterica (figure 100). At the N Area, they noted two distinct vents, while in the S area they observed a large crater depression with subvertical walls that had many deep vents on the S side. Episodic explosive activity from the N Area was accompanied by small ash plumes. In the S Area, landslides occurred along the southernmost wall, lasting for tens of seconds and producing small ash clouds.
During late July, persistent incandescence was visible at night from the Pizzo Sopra La Fossa coming from the northernmost vent of the S Area, which continued until 19 August. Activity diminished from this vent and appeared at the southernmost vent of the S Area on 20 August. Explosions of incandescent lava were observed about ten meters above the crater rim. Occasional high-intensity explosions from the N Area resulted in coarse ash emissions during August, especially during 27 and 28 August when two vents were active at the N area, sending bombs, lapilli, and ash onto the Sciara del Fuoco.
By the end of August activity was concentrated mostly in the N Area where two active vents ejected lapilli, bombs, and abundant ash in explosions that occurred at a rate of 2-3 per hour. On 29 September, a nighttime pulsating glow was observed from the Pizzo Sopra La Fossa visible camera emanating from the southernmost vent of the S area. Observations of the glow persisted until 6 October. INVG inferred the glow was related to deep explosive activity. Typical low-to-moderate activity during October included Strombolian activity several tens of meters above the crater rim and frequent ash emissions, primarily from the S Area.
During November and December 2016, low- and moderate-level activity continued, with persistent incandescence observed at northern vent of the S Area for most of December, and rare low-and-medium-intensity explosions observed at the N Area (figure 101).
Geologic Background. Spectacular incandescent nighttime explosions at Stromboli have long attracted visitors to the "Lighthouse of the Mediterranean" in the NE Aeolian Islands. This volcano has lent its name to the frequent mild explosive activity that has characterized its eruptions throughout much of historical time. The small island is the emergent summit of a volcano that grew in two main eruptive cycles, the last of which formed the western portion of the island. The Neostromboli eruptive period took place between about 13,000 and 5,000 years ago. The active summit vents are located at the head of the Sciara del Fuoco, a prominent scarp that formed about 5,000 years ago due to a series of slope failures which extends to below sea level. The modern volcano has been constructed within this scarp, which funnels pyroclastic ejecta and lava flows to the NW. Essentially continuous mild Strombolian explosions, sometimes accompanied by lava flows, have been recorded for more than a millennium.
Information Contacts: Istituto Nazionale di Geofisica e Vulcanologia (INGV), Sezione di Catania, Piazza Roma 2, 95123 Catania, Italy (URL: http://www.ct.ingv.it/en/).
Yasur
Vanuatu
19.532°S, 169.447°E; summit elev. 361 m
All times are local (unless otherwise noted)
Strong explosions reported through mid-June 2017, with ongoing thermal anomalies
The almost continuous eruption at Yasur, possibly over the previous 800 years, remained active through October 2016 (BGVN 41:12). The Vanuatu Geohazards Observatory (VGO) has maintained the hazards status at Volcano Alert Level 2 (major unrest - danger around the crater rim and specific area, notable/large unrest, considerable possibility of eruption and also chance of flank eruption) through mid-June 2017.
Volcano Alert Bulletins posted by the VGO on 19 April, 22 May, and 22 June 2017 indicated ongoing strong explosive activity. Satellite-detected MODIS thermal anomalies identified by MODVOLC were numerous during the reporting period, with at least one every month except during November 2016. The MIROVA system also detected nearly continuous thermal anomalies during the year ending on 12 June 2017 (figure 46), though activity decreased in the last few months of 2016 and was somewhat more intermittent in the first half of 2017 compared to July-September 2016.
Geologic Background. Yasur has exhibited essentially continuous Strombolian and Vulcanian activity at least since Captain Cook observed ash eruptions in 1774. This style of activity may have continued for the past 800 years. Located at the SE tip of Tanna Island in Vanuatu, this pyroclastic cone has a nearly circular, 400-m-wide summit crater. The active cone is largely contained within the small Yenkahe caldera, and is the youngest of a group of Holocene volcanic centers constructed over the down-dropped NE flank of the Pleistocene Tukosmeru volcano. The Yenkahe horst is located within the Siwi ring fracture, a 4-km-wide open feature associated with eruption of the andesitic Siwi pyroclastic sequence. Active tectonism along the Yenkahe horst accompanying eruptions has raised Port Resolution harbor more than 20 m during the past century.
Information Contacts: Vanuatu Geohazards Observatory, Department of Geology, Mines and Water Resources of Vanuatu (URL: http://www.vmgd.gov.vu/vmgd/, http://www.vmgd.gov.vu/vmgd/index.php/geohazards/volcano); Hawai'i Institute of Geophysics and Planetology (HIGP) - MODVOLC Thermal Alerts System, School of Ocean and Earth Science and Technology (SOEST), Univ. of Hawai'i, 2525 Correa Road, Honolulu, HI 96822, USA (URL: http://modis.higp.hawaii.edu/); MIROVA (Middle InfraRed Observation of Volcanic Activity), a collaborative project between the Universities of Turin and Florence (Italy) supported by the Centre for Volcanic Risk of the Italian Civil Protection Department (URL: http://www.mirovaweb.it/).