Recently Published Bulletin Reports
Agung (Indonesia) Three eruptive events reported in April, May, and December 2022
Tengger Caldera (Indonesia) Minor ash emission in December 2023; persistent weak thermal anomaly in the Bromo crater
Saunders (United Kingdom) Persistent thermal anomalies from the summit crater lava lake during February 2023-January 2024
Shishaldin (United States) New eruption with significant Strombolian explosions, ash plumes, and ashfall
Ioto (Japan) New eruption with discolored water, ejecta, and floating pumice during October-December 2023
Purace (Colombia) Gas-and-ash emission on 16 November 2023
Suwanosejima (Japan) Eruption plumes, crater incandescence, and occasional explosions during July-October 2023
Etna (Italy) Strombolian explosions, lava fountains, and lava flows during July-August 2023
Aira (Japan) Explosions, ash plumes, ash fall, and crater incandescence during July-October 2023
Nishinoshima (Japan) Gray emissions during October 2023
Kilauea (United States) Strong lava fountains, lava flows, and spatter at Halema’uma’u during January-September 2023
Tinakula (Solomon Islands) Continued lava flows and thermal activity during June through November 2023
Agung (Indonesia) — January 2024  Cite this Report
Agung
Indonesia
8.343°S, 115.508°E; summit elev. 2997 m
All times are local (unless otherwise noted)
Three eruptive events reported in April, May, and December 2022
Mount Agung, located on the E end of the island of Bali, Indonesia, rises above the SE rim of the Batur caldera. The summit area extends 1.5 km E-W, with the highest point on the W and a steep-walled 800-m-wide crater on the E. Recorded eruptions date back to the early 19th century. A large and deadly explosive and effusive eruption occurred during 1963-64, which was characterized by voluminous ashfall, pyroclastic flows, and lahars that caused extensive damage and many fatalities. More recent activity was documented during November 2017-June 2019 that consisted of multiple explosions, significant ash plumes, lava flows at the summit crater, and incandescent ejecta. This report covers activity reported during April-May 2022 and December 2022 based on data from the Darwin Volcanic Ash Advisory Center (VAAC).
Activity during 2022 was relatively low and mainly consisted of a few ash plumes during April-May and December. An ash plume on 3 April rising to 3.7 km altitude (700 m above the summit) and drifting N was reported in a Darwin VAAC notice based on a ground report, with ash seen in HIMAWARI-8 visible imagery. Another ash plume was reported at 1120 on 27 May that rose to 5.5 km altitude (2.5 m above the summit); the plume was not visible in satellite or webcam images due to weather clouds. An eruption was reported based on seismic data at 0840 on 13 December, with an estimated plume altitude of 3.7 km; however, no ash was seen using satellite imagery in clear conditions before weather clouds obscured the summit.
Geologic Background. Symmetrical Agung stratovolcano, Bali's highest and most sacred mountain, towers over the eastern end of the island. The volcano, whose name means "Paramount," rises above the SE rim of the Batur caldera, and the northern and southern flanks extend to the coast. The summit area extends 1.5 km E-W, with the high point on the W and a steep-walled 800-m-wide crater on the E. The Pawon cone is located low on the SE flank. Only a few eruptions dating back to the early 19th century have been recorded in historical time. The 1963-64 eruption, one of the largest in the 20th century, produced voluminous ashfall along with devastating pyroclastic flows and lahars that caused extensive damage and many fatalities.
Information Contacts: Darwin Volcanic Ash Advisory Centre (VAAC), Bureau of Meteorology, Northern Territory Regional Office, PO Box 40050, Casuarina, NT 0811, Australia (URL: http://www.bom.gov.au/info/vaac/).
Tengger Caldera (Indonesia) — February 2024 Cite this Report
Tengger Caldera
Indonesia
7.942°S, 112.95°E; summit elev. 2329 m
All times are local (unless otherwise noted)
Minor ash emission in December 2023; persistent weak thermal anomaly in the Bromo crater
Tengger Caldera, located at the N end of a volcanic massif in Indonesia’s East Java, consists of five overlapping stratovolcanoes. The youngest and only active cone in the 16-km-wide caldera is Bromo, which typically produces gas-and-steam plumes, occasional ash plumes and explosions, and weak thermal signals (BGVN 44:05, 47:01). This report covers activity during January 2022-December 2023, consisting of mostly white gas-and-steam emissions and persistent weak thermal anomalies. Information was provided by the Pusat Vulkanologi dan Mitigasi Bencana Geologi (PVMBG, also known as Indonesian Center for Volcanology and Geological Hazard Mitigation, CVGHM) and satellite imagery. The Alert Level remained at 2 (on a scale of 1-4), and visitors were warned to stay at least 1 km from the crater.
Activity was generally low during the reporting period, similar to that in 2021. According to almost daily images from MAGMA Indonesia (a platform developed by PVMBG), white emissions and plumes rose from 50 to 900 m above the main crater during this period (figure 24). During several days in March and June 2022, white plumes reached heights of 1-1.2 km above the crater.
After an increase in activity at 2114 on 3 February 2023, a PVMBG team that was sent to observe white emissions rising as high as 300 m during 9-12 February and heard rumbling noises. A sulfur dioxide odor was also strong near the crater and measurements indicated that levels were above the healthy (non-hazardous) threshold of 5 parts per million; differential optical absorption spectroscopy (DOAS) measurements indicated an average flux of 190 metric tons per day on 11 February. Incandescence originating from a large fumarole in the NNW part of the crater was visible at night. The team observed that vegetation on the E caldera wall was yellow and withered. The seismic network recorded continuous tremor and deep and shallow volcanic earthquakes.
According to a PVMBG press release, activity increased on 13 December 2023 with white, gray, and brown emissions rising as high as 900 m above Bromo’s crater rim and drifting in multiple directions (figure 25). The report noted that tremor was continuous and was accompanied in December by three volcanic earthquakes. Deformation data indicated inflation in December. There was no observable difference in the persistent thermal anomaly in the crater between 11 and 16 December 2023.
All clear views of the Bromo crater throughout this time, using Sentinel-2 infrared satellite images, showed a weak persistent thermal anomaly; none of the anomalies were strong enough to cause MODVOLC Thermal Alerts. A fire in the SE part of the caldera in early September 2023 resulted in a brief period of strong thermal anomalies.
Geologic Background. The 16-km-wide Tengger caldera is located at the northern end of a volcanic massif extending from Semeru volcano. The massive volcanic complex dates back to about 820,000 years ago and consists of five overlapping stratovolcanoes, each truncated by a caldera. Lava domes, pyroclastic cones, and a maar occupy the flanks of the massif. The Ngadisari caldera at the NE end of the complex formed about 150,000 years ago and is now drained through the Sapikerep valley. The most recent of the calderas is the 9 x 10 km wide Sandsea caldera at the SW end of the complex, which formed incrementally during the late Pleistocene and early Holocene. An overlapping cluster of post-caldera cones was constructed on the floor of the Sandsea caldera within the past several thousand years. The youngest of these is Bromo, one of Java's most active and most frequently visited volcanoes.
Information Contacts: Pusat Vulkanologi dan Mitigasi Bencana Geologi (PVMBG, also known as Indonesian Center for Volcanology and Geological Hazard Mitigation, CVGHM), Jalan Diponegoro 57, Bandung 40122, Indonesia (URL: http://www.vsi.esdm.go.id/); MAGMA Indonesia, Kementerian Energi dan Sumber Daya Mineral (URL: https://magma.esdm.go.id/v1); Copernicus Browser, Copernicus Data Space Ecosystem, European Space Agency (URL: https://dataspace.copernicus.eu/browser/); Hawai'i Institute of Geophysics and Planetology (HIGP) - MODVOLC Thermal Alerts System, School of Ocean and Earth Science and Technology (SOEST), Univ. of Hawai'i, 2525 Correa Road, Honolulu, HI 96822, USA (URL: http://modis.higp.hawaii.edu/).
Saunders (United Kingdom) — February 2024 Cite this Report
Saunders
United Kingdom
57.8°S, 26.483°W; summit elev. 843 m
All times are local (unless otherwise noted)
Persistent thermal anomalies from the summit crater lava lake during February 2023-January 2024
Saunders is one of eleven islands that comprise the South Sandwich Islands in the South Atlantic. The active Mount Michael volcano has been in almost continuous eruption since November 2014 (BGVN 48:02). Recent activity has resulted in intermittent thermal anomalies and gas-and-steam emissions (BGVN 47:03, 48:02). Visits are infrequent due to its remote location, and cloud cover often prevents satellite observations. Satellite thermal imagery and visual observation of incandescence during a research expedition in 2019 (BGVN 28:02 and 44:08) and a finding confirmed by a National Geographic Society research team that summited Michael in November 2022 reported the presence of a lava lake.
Although nearly constant cloud cover during February 2023 through January 2024 greatly limited satellite observations, thermal anomalies from the lava lake in the summit crater were detected on clear days, especially around 20-23 August 2023. Anomalies similar to previous years (eg. BGVN 48:02) were seen in both MIROVA (Middle InfraRed Observation of Volcanic Activity) data from MODIS instruments and in Sentinel 2 infrared imagery. The only notable sulfur dioxide plume detected near Saunders was on 25 September 2023, with the TROPOMI instrument aboard the Sentinel-5P satellite.
Geologic Background. Saunders Island consists of a large central volcanic edifice intersected by two seamount chains, as shown by bathymetric mapping (Leat et al., 2013). The young Mount Michael stratovolcano dominates the glacier-covered island, while two submarine plateaus, Harpers Bank and Saunders Bank, extend north. The symmetrical Michael has a 500-m-wide summit crater and a remnant of a somma rim to the SE. Tephra layers visible in ice cliffs surrounding the island are evidence of recent eruptions. Ash clouds were reported from the summit crater in 1819, and an effusive eruption was inferred to have occurred from a N-flank fissure around the end of the 19th century and beginning of the 20th century. A low ice-free lava platform, Blackstone Plain, is located on the north coast, surrounding a group of former sea stacks. A cluster of cones on the SE flank, the Ashen Hills, appear to have been modified since 1820 (LeMasurier and Thomson, 1990). Analysis of satellite imagery available since 1989 (Gray et al., 2019; MODVOLC) suggests frequent eruptive activity (when weather conditions allow), volcanic clouds, steam plumes, and thermal anomalies indicative of a persistent, or at least frequently active, lava lake in the summit crater. Due to this observational bias, there has been a presumption when defining eruptive periods that activity has been ongoing unless there is no evidence for at least 10 months.
Information Contacts: MIROVA (Middle InfraRed Observation of Volcanic Activity), a collaborative project between the Universities of Turin and Florence (Italy) supported by the Centre for Volcanic Risk of the Italian Civil Protection Department (URL: http://www.mirovaweb.it/); NASA Global Sulfur Dioxide Monitoring Page, Atmospheric Chemistry and Dynamics Laboratory, NASA Goddard Space Flight Center (NASA/GSFC), 8800 Greenbelt Road, Goddard MD 20771, USA (URL: https://so2.gsfc.nasa.gov/); Copernicus Browser (URL: https://dataspace.copernicus.eu/browser).
Shishaldin (United States) — December 2023 Cite this Report
Shishaldin
United States
54.756°N, 163.97°W; summit elev. 2857 m
All times are local (unless otherwise noted)
New eruption with significant Strombolian explosions, ash plumes, and ashfall
Shishaldin is located on the eastern half of Unimak Island, one of the Aleutian Islands. Frequent explosive activity, primarily consisting of Strombolian ash eruptions from the small summit crater, but sometimes producing lava flows, has been recorded since the 18th century. The previous eruption ended in May 2020 and was characterized by intermittent thermal activity, increased seismicity and surface temperatures, ash plumes, and ash deposits (BGVN 45:06). This report covers a new eruption during July through November 2023, which consisted of significant explosions, ash plumes, ashfall, and lava fountaining. Information comes from daily, weekly, and special reports from the Alaska Volcano Observatory (AVO) and various satellite data. AVO monitors the volcano using local seismic and infrasound sensors, satellite data, web cameras, and remote infrasound and lightning networks.
AVO reported that intermittent tremor and low-frequency earthquakes had gradually become more regular and consistent during 10-13 July. Strongly elevated surface temperatures at the summit were identified in satellite images during 10-13 July. On 11 July AVO raised the Aviation Color Code (ACC) to Yellow (the second color on a four-color scale) and Volcano Alert Level (VAL) to Advisory (the second level on a four-level scale) at 1439. Later in the day on 11 July summit crater incandescence was observed in webcam images. Observations of the summit suggested that lava was likely present at the crater, which prompted AVO to raise the ACC to Orange (the second highest color on a four-color scale) and the VAL to Watch (the second highest level on a four-level scale). The US Coast Guard conducted an overflight on 12 July and confirmed that lava was erupting from the summit. That same day, sulfur dioxide emissions were detected in satellite images.
A significant explosion began at 0109 on 14 July that produced an ash plume that rose to 9-12 km altitude and drifted S over the Pacific Ocean (figure 43). Webcam images and photos taken around 0700 from a ship SW off Unimak Island showed small lahar deposits, which were the result of the interaction of hot pyroclastic material and snow and ice on the flanks. There was also ashfall on the SW and N flanks. A smaller explosion at 0710 generated an ash plume that rose to 4.5 km altitude. Webcam images and pilot reports showed continued low-level ash emissions during the morning, rising to less than 4.6 km altitude; those emissions included a small ash plume near the summit around 1030 resulting from a small explosion.
Seismic tremor amplitude began increasing at around 1700 on 15 July; strongly elevated surface temperatures were also reported. An ash plume rose to 4.6 km altitude and drifted SSE at 2100, based on a satellite image. A continuous ash plume during 2150 through 2330 rose to 5 km altitude and extended 125 km S. At 2357 AVO raised the ACC to Red (the highest color on a four-color scale) and the VAL to Warning (the highest level on a four-level scale), noting that seismicity remained elevated for more than six hours and explosion signals were frequently detected by regional infrasound (pressure sensor) networks. Explosions generated an ash plume that rose to 4.9 km altitude and drifted as far as 500 km SE. Activity throughout the night declined and by 0735 the ACC was lowered to Orange and the VAL to Watch. High-resolution satellite images taken on 16 July showed pyroclastic deposits extending as far as 3 km from the vent; these deposits generated lahars that extended further down the drainages on the flanks. Ash deposits were mainly observed on the SSE flank and extended to the shore of Unimak Island. During 16-17 July lava continued to erupt at the summit, which caused strongly elevated surface temperatures that were visible in satellite imagery.
Lava effusion increased at 0100 on 18 July, as noted in elevated surface temperatures identified in satellite data, increasing seismic tremor, and activity detected on regional infrasound arrays. A significant ash plume at 0700 rose to 7 km altitude and continued until 0830, eventually reaching 9.1 km altitude and drifting SSE (figure 44). As a result, the ACC was raised to Red and the VAL to Warning. By 0930 the main plume detached, but residual low-level ash emissions continued for several hours, remaining below 3 km altitude and drifting S. The eruption gradually declined and by 1208 the ACC was lowered to Orange and the VAL was lowered to Watch. High-resolution satellite images showed ash deposits on the SW flank and pyroclastic deposits on the N, E, and S flanks, extending as far as 3 km from the vent; lahars triggered by the eruption extended farther down the flanks (figure 45). Lava continued to erupt from the summit crater on 19 July.
Elevated surface temperatures were detected in satellite images during 19-25 July, despite occasional weather cloud cover, which was consistent with increased lava effusion. During 22-23 July satellite observations acquired after the eruption from 18 July showed pyroclastic flow and lahar deposits extending as far as 3 km down the N, NW, and NE flanks and as far as 1.5 km down the S and SE flanks. Ash deposits covered the SW and NE flanks. No lava flows were observed outside the crater. On 22 July a sulfur dioxide plume was detected in satellite data midday that had an estimated mass of 10 kt. In a special notice issued at 1653 on 22 July AVO noted that eruptive activity had intensified over the previous six hours, which was characterized by an hours-long steady increase in seismic tremor, intermittent infrasound signals consistent with small explosions, and an increase in surface temperatures that were visible in satellite data. Pilots first reported low-level ash plumes at around 1900. At 2320 an ash plume had risen to 9 km altitude based on additional pilot reports and satellite images. The ACC was increased to Red and the VAL to Warning at 2343. Satellite images indicated growth of a significantly higher ash plume that rose to 11 km altitude continued until 0030 and drifted NE. During the early morning hours of 23 July ash plumes had declined to 4.6 k altitude. Seismic tremor peaked at 0030 on 23 July and began to rapidly decline at 0109; active ash emissions were no longer visible in satellite data by 0130. The ACC was lowered to Orange and the VAL to Watch at 0418; bursts of increased seismicity were recorded throughout the morning, but seismicity generally remained at low levels. Elevated surface temperatures were visible in satellite data until about 0600. On 24 July pilots reported seeing vigorous gas-and-steam plumes rising to about 3 km altitude; the plumes may have contained minor amounts of ash.
During 24-25 July low level seismicity and volcanic tremor were detected at low levels following the previous explosion on 23 July. Strongly elevated surface temperatures were observed at the summit crater in satellite data. Around 2200 on 25 July seismicity began to increase, followed by infrasound signals of explosions after 0200 on 26 July. An ash plume rose to 3 km altitude at 0500 and drifted ENE, along with an associated sulfur dioxide plume that drifted NE and had an estimated mass of 22 kt. Diffuse ash emissions were visible in satellite data and rose to 6.1-7.6 km altitude and extended 125 km from the volcano starting around 1130. These ash events were preceded by about seven hours of seismic tremor, infrasound detections of explosions, and five hours of increased surface temperatures visible in satellite data. Activity began to decline around 1327, which included low-frequency earthquakes and decreased volcanic tremor, and infrasound data no longer detected significant explosions. Surface temperatures remained elevated through the end of the month.
Seismicity, volcanic tremor, and ash emissions remained at low levels during early August. Satellite images on 1 August showed that some slumping had occurred on the E crater wall due to the recent explosive activity. Elevated surface temperatures continued, which was consistent with cooling lava. On 2 August small explosive events were detected, consistent with low-level Strombolian activity. Some episodes of volcanic tremor were reported, which reflected low-level ash emissions. Those ash emissions rose to less than 3 km altitude and drifted as far as 92.6 km N. Pilots that were located N of the volcano observed an ash plume that rose to 2.7 km altitude. Seismicity began to increase in intensity around 0900 on 3 August. Seismicity continued to increase throughout the day and through the night with strongly elevated surface temperatures, which suggested that lava was active at the surface.
An ash cloud that rose to 7.6-7.9 km altitude and drifted 60-75 km NE was visible in a satellite image at 0520 on 4 August. Pilots saw and reported the plume at 0836 (figure 46). By 0900 the plume had risen to 9.1 km altitude and extended over 100 km NE. AVO raised the ACC to Red and the VAL to Warning as a result. Seismic tremor levels peaked at 1400 and then sharply declined at 1500 to slightly elevated levels; the plume was sustained during the period of high tremor and drifted N and NE. The ACC was lowered to Orange and the VAL to Watch at 2055. During 5-14 August seismicity remained low and surface temperatures were elevated based on satellite data due to cooling lava. On 9 August a small lava flow was observed that extended from the crater rim to the upper NE flank. It had advanced to 55 m in length and appeared in satellite imagery on 11 August. Occasional gas-and-steam plumes were noted in webcam images. At 1827 AVO noted that seismic tremor had steadily increased during the afternoon and erupting lava was visible at the summit in satellite images.
Strong explosion signals were detected at 0200 on 15 August. An ash cloud that was visible in satellite data extended 100 km NE and may have risen as high as 11 km altitude around 0240. By 0335 satellite images showed the ash cloud rising to 7.6 km altitude and drifting NE. Significant seismicity and explosions were detected by the local AVO seismic and infrasound networks, and volcanic lightning was detected by the World Wide Lightning Location Network (WWLLN). A sulfur dioxide plume associated with the eruption drifted over the S Bering Sea and parts of Alaska and western Canada. Seismicity was significantly elevated during the eruption but had declined by 1322. A pilot reported that ash emissions continued, rising as high as 4.9 km altitude. Elevated surface temperatures detected in satellite data were caused by hot, eruptive material (pyroclastic debris and lava) that accumulated around the summit. Eruptive activity declined by 16 August and the associated sulfur dioxide plume had mostly dissipated; remnants continued to be identified in satellite images at least through 18 August. Surface temperatures remained elevated based on satellite images, indicating hot material on the upper parts of the volcano. Small explosions were detected in infrasound data on the morning of 19 August and were consistent with pilot reports of small, short-lived ash plumes that rose to about 4.3 km altitude. Low-level explosive activity was reported during 20-24 August, according to seismic and infrasound data, and weather clouds sometimes prevented views. Elevated surface temperatures were observed in satellite images, which indicated continued hot material on the upper parts of the volcano.
Seismic tremor began to increase at around 0300 on 25 August and was followed by elevated surface temperatures identified in satellite images, consistent with erupting lava. Small explosions were recorded in infrasound data. The ACC was raised to Red and the VAL to Warning at 1204 after a pilot reported an ash plume that rose to 9.1 km altitude. Seismicity peaked at 1630 and began to rapidly decline at around 1730. Ash plumes rose as high as 10 km altitude and drifted as far as 400 km NE. By 2020 the ash plumes had declined to 6.4 km altitude and continued to drift NE. Ash emissions were visible in satellite data until 0000 on 26 August and seismicity was at low levels. AVO lowered the ACC to Orange and the VAL to Watch at 0030. Minor explosive activity within the summit crater was detected during 26-28 August and strongly elevated surface temperatures were still visible in satellite imagery through the rest of the month. An AVO field crew working on Unimak Island observed a mass flow that descended the upper flanks beginning around 1720 on 27 August. The flow produced a short-lived ash cloud that rose to 4.5 km altitude and rapidly dissipated. The mass flow was likely caused by the collapse of spatter that accumulated on the summit crater rim.
Similar variable explosive activity was reported in September, although weather observations sometimes prevented observations. A moderate resolution satellite image from the afternoon of 1 September showed gas-and-steam emissions filling the summit crater and obscuring views of the vent. In addition, hot deposits from the previous 25-26 August explosive event were visible on the NE flank near the summit, based on a 1 September satellite image. On 2 and 4 September seismic and infrasound data showed signals of small, repetitive explosions. Variable gas-and-steam emissions from the summit were visible but there was no evidence of ash. Possible summit crater incandescence was visible in nighttime webcam images during 3-4 September.
Seismicity began to gradually increase at around 0300 on 5 September and activity escalated at around 0830. A pilot reported an ash plume that rose to 7.6 km altitude at 0842 and continued to rise as high as possibly 9.7 km altitude and drifted SSE based on satellite images (figure 47). The ACC was raised to Red and the VAL to Warning at 0900. In addition to strong tremor and sustained explosions, the eruption produced volcanic lightning that was detected by the WWLLN. Around 1100 seismicity decreased and satellite data confirmed that the altitude of the ash emissions had declined to 7.6 km altitude. By 1200 the lower-altitude portion of the ash plume had drifted 125 km E. Significant ash emissions ended by 1330 based on webcam images. The ACC was lowered to Orange and the VAL to Watch at 1440. Satellite images showed extensive pyroclastic debris flows on most of the flanks that extended 1.2-3.3 km from the crater rim.
During 6-13 September elevated surface temperatures continued to be observed in satellite data, seismicity remained elevated with weak but steady tremor, and small, low-frequency earthquakes and small explosions were reported, except on 12 September. On 6 September a low-level ash plume rose to 1.5-1.8 km altitude and drifted SSE. Occasional small and diffuse gas-and-steam emissions at the summit were visible in webcam images. Around 1800 on 13 September seismic tremor amplitudes began to increase, and small explosions were detected in seismic and infrasound data. Incandescent lava at the summit was seen in a webcam image taken at 0134 on 14 September during a period of elevated tremor. No ash emissions were reported during the period of elevated seismicity. Lava fountaining began around 0200, based on webcam images. Satellite-based radar observations showed that the lava fountaining activity led to the growth of a cone in the summit crater, which refilled most of the crater. By 0730 seismicity significantly declined and remained at low levels.
Seismic tremor began to increase around 0900 on 15 September and rapidly intensified. An explosive eruption began at around 1710, which prompted AVO to raise the ACC to Red and the VAL to Warning. Within about 30 minutes ash plumes drifted E below a weather cloud at 8.2 km altitude. The National Weather Service estimated that an ash-rich plume rose as high as 12.8 km altitude and produced volcanic lightning. The upper part of the ash plume detached from the vent around 1830 and drifted E, and was observed over the Gulf of Alaska. Around the same time, seismicity dramatically decreased. Trace ashfall was reported in the community of False Pass (38 km ENE) between 1800-2030 and also in King Cove and nearby marine waters. Activity declined at around 1830 although seismicity remained elevated, ash emissions, and ashfall continued until 2100. Lightning was again detected beginning around 1930, which suggested that ash emissions continued. Ongoing explosions were detected in infrasound data, at a lower level than during the most energetic phase of this event. Lightning was last detected at 2048. By 2124 the intensity of the eruption had decreased, and ash emissions were likely rising to less than 6.7 km altitude. Seismicity returned to pre-eruption levels. On 16 September the ACC was lowered to Orange and the VAL to Watch at 1244; the sulfur dioxide plume that was emitted from the previous eruption event was still visible over the northern Pacific Ocean. Elevated surface temperatures, gas-and-steam emissions from the vent, and new, small lahars were reported on the upper flanks based on satellite and webcam images. Minor deposits were reported on the flanks which were likely the result of collapse of previously accumulated lava near the summit crater.
Elevated seismicity with tremor, small earthquakes, and elevated surface temperatures were detected during 17-23 September. Minor gas-and-steam emissions were visible in webcam images. On 20 September small volcanic debris flows were reported on the upper flanks. On 21 September a small ash deposit was observed on the upper flanks extending to the NE based on webcam images. Seismic tremor increased significantly during 22-23 September. Regional infrasound sensors suggested that low-level eruptive activity was occurring within the summit crater by around 1800 on 23 September. Even though seismicity was at high levels, strongly elevated surface temperatures indicating lava at the surface were absent and no ash emissions were detected; weather clouds at 0.6-4.6 km altitude obscured views. At 0025 on 24 September AVO noted that seismicity continued at high levels and nearly continuous small infrasound signals began, likely from low-level eruptive activity. Strongly elevated surface temperatures were identified in satellite images by 0900 and persisted throughout the day; the higher temperatures along with infrasound and seismic data were consistent with lava erupting at the summit. Around 1700 similarly elevated surface temperatures were detected from the summit in satellite data, which suggested that more vigorous lava fountaining had started. Starting around 1800 low-level ash emissions rose to altitudes less than 4.6 km altitude and quickly dissipated.
Beginning at midnight on 25 September, a series of seismic signals consistent with volcanic flows were recorded on the N side of the volcano. A change in seismicity and infrasound signals occurred around 0535 and at 0540 a significant ash cloud formed and quickly reached 14 km altitude and drifted E along the Alaska Peninsula. The cloud generated at least 150 lightning strokes with thunder that could be heard by people in False Pass. Seismicity rapidly declined to near background levels around 0600. AVO increased the ACC to Red and the VAL to Warning at 0602. The ash cloud detached from the volcano at around 0700, rose to 11.6 km altitude, and drifted ESE. Trace to minor amounts of ashfall were reported by the communities of False Pass, King Cove, Cold Bay, and Sand Point around 0700. Ash emissions continued at lower altitudes of 6-7.6 km altitude at 0820. Small explosions at the vent area continued to be detected in infrasound data and likely represented low-level eruptive activity near the vent. Due to the significant decrease in seismicity and ash emissions the ACC was lowered to Orange and the VAL to Watch at 1234. Radar data showed significant collapses of the crater that occurred on 25 September. Satellite data also showed significant hot, degassing pyroclastic and lahar deposits on all flanks, including more extensive flows on the ENE and WSW sections below two new collapse scarps. Following the significant activity during 24-25 September, only low-level activity was observed. Seismicity decreased notably near the end of the strong activity on 25 September and continued to decrease through the end of the month, though tremor and small earthquakes were still reported. No explosive activity was detected in infrasound data through 2 October. Gas-and-steam emissions rose to 3.7 km altitude, as reported by pilots and seen in satellite images. Satellite data from 26 September showed that significant collapses had occurred at the summit crater and hot, steaming deposits from pyroclastic flows and lahars were present on all the flanks, particularly to the ENE and WSW. A small ash cloud was visible in webcam images on 27 September, likely from a collapse at the summit cone. High elevated surface temperatures were observed in satellite imagery during 27-28 September, which were likely the result of hot deposits on the flanks erupted on 25 September. Minor steaming at the summit crater and from an area on the upper flanks was visible in webcam images on 28 September.
During October, explosion events continued between periods of low activity. Seismicity significantly increased starting at around 2100 on 2 October; around the same time satellite images showed an increase in surface temperatures consistent with lava fountaining. Small, hot avalanches of rock and lava descended an unspecified flank. In addition, a distinct increase in infrasound, seismicity, and lightning detections was followed by an ash plume that rose to 12.2 km altitude and drifted S and E at 0520 on 3 October, based on satellite images. Nighttime webcam images showed incandescence due to lava fountaining at the summit and pyroclastic flows descending the NE flank. AVO reported that a notable explosive eruption started at 0547 and lasted until 0900 on 3 October, which prompted a rise in the ACC to Red and the VAL to Warning. Subsequent ash plumes rose to 6-7.6 km altitude by 0931. At 1036 the ACC was lowered back to Orange and the VAL to Watch since both seismic and infrasound data quieted substantially and were slightly above background levels. Gas-and-steam emissions were observed at the summit, based on webcam images. Trace amounts of ashfall were observed in Cold Bay. Resuspended ash was present at several kilometers altitude near the volcano. During the afternoon, low-level ash plumes were visible at the flanks, which appeared to be largely generated by rock avalanches off the summit crater following the explosive activity. These ash plumes rose to 3 km altitude and drifted W. Trace amounts of ashfall were reported by observers in Cold Bay and Unalaska and flights to these communities were disrupted by the ash cloud. Satellite images taken after the eruption showed evidence of pyroclastic flows and lahar deposits in drainages 2 km down the SW flank and about 3.2 km down the NE flank, and continued erosion of the crater rim. Small explosion craters at the end of the pyroclastic flows on the NE flank were noted for the first time, which may have resulted from gas-and-steam explosions when hot deposits interact with underlying ice.
During 4 October seismicity, including frequent small earthquakes, remained elevated, but was gradually declining. Ash plumes were produced for over eight hours until around 1400 that rose to below 3.7 km altitude. These ash plumes were primarily generated off the sides of the volcano where hot rock avalanches from the crater rim had entered drainages to the SW and NE. Two explosion craters were observed at the base of the NE deposits about 3.2 km from the crater rim. Webcam images showed the explosion craters were a source of persistent ash emissions; occasional collapse events also generated ash. Seismicity remained elevated with sulfur dioxide emissions that had a daily average of more than 1,000 tons per day, and frequent small earthquakes through the end of the month. Frequent elevated surface temperatures were identified in satellite images and gas-and-steam plumes were observed in webcam images, although weather conditions occasionally prevented clear views of the summit. Emissions were robust during 14-16 October and were likely generated by the interaction of hot material and snow and ice. During the afternoon of 21 October a strong gas-and-steam plume rose to 3-4.6 km altitude and extended 40 km WSW, based on satellite images and reports from pilots. On 31 October the ACC was lowered to Yellow and the VAL was lowered to Advisory.
Activity in November was characterized by elevated seismicity with ongoing seismic tremor and small, low-frequency earthquakes, elevated surface temperatures, and gas-and-steam emissions. There was an increase in seismic and infrasound tremor amplitudes starting at 1940 on 2 November. As a result, the ACC was again raised to Orange and the VAL was increased to Watch, although ash was not identified in satellite data. An ash cloud rose to 6.1 km altitude and drifted W according to satellite data at 2000. By 0831 on 3 November ash emissions were no longer visible in satellite images. On 6 and 9 November air pressure sensors detected signals consistent with small explosions. Small explosions were detected in infrasound data consistent with weak Strombolian activity on 19 and 21 November. Seismicity started to decrease on 21 November. On 25 November gas-and-steam emissions were emitted from the vent as well as from a scarp on the NE side of the volcano near the summit. A gas-and-steam plume extended about 50 km SSE and was observed in satellite and webcam images on 26 November. On 28 November small explosions were observed in seismic and local infrasound data and gas-and-steam emissions were visible from the summit and from the upper NE collapse scarp based on webcam images. Possible small explosions were observed in infrasound data on 30 November. Weakly elevated surface temperatures and a persistent gas-and-steam plume from the summit and collapse scarps on the upper flanks. A passing aircraft reported the gas-and-steam plume rose to 3-3.4 km altitude on 30 November, but no significant ash emissions were detected.
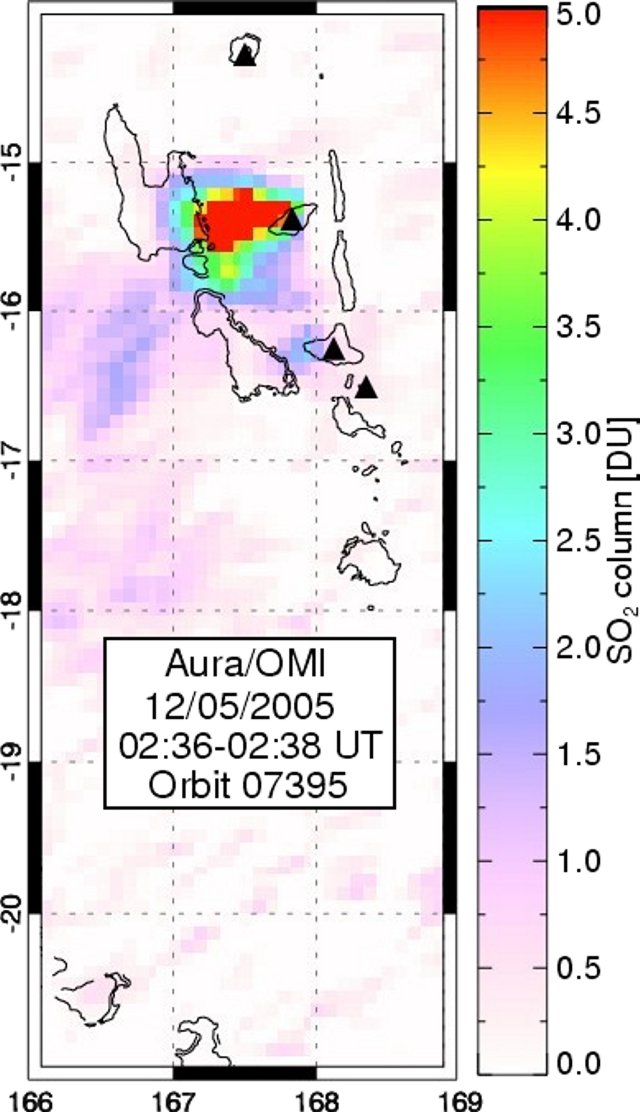
Satellite data. MODIS thermal anomaly data provided through MIROVA (Middle InfraRed Observation of Volcanic Activity) showed a strong pulse of thermal activity beginning in July 2023 that continued through November 2023 (figure 48). This strong activity was due to Strombolian explosions and lava fountaining events at the summit crater. According to data from MODVOLC thermal alerts, a total of 101 hotspots were detected near the summit crater in July (11-14, 16-19, 23-24 and 26), August (4, 25-26, and 29), September (5, 12, and 17), and October (3, 4, and 8). Infrared satellite data showed large lava flows descending primarily the northern and SE flanks during the reporting period (figure 49). Sulfur dioxide plumes often exceeded two Dobson Units (DUs) and drifted in different directions throughout the reporting period, based on satellite data from the TROPOMI instrument on the Sentinel-5P satellite (figure 50).
Geologic Background. The symmetrical glacier-covered Shishaldin in the Aleutian Islands is the westernmost of three large stratovolcanoes in the eastern half of Unimak Island. The Aleuts named the volcano Sisquk, meaning "mountain which points the way when I am lost." Constructed atop an older glacially dissected edifice, it is largely basaltic in composition. Remnants of an older edifice are exposed on the W and NE sides at 1,500-1,800 m elevation. There are over two dozen pyroclastic cones on its NW flank, which is covered by massive aa lava flows. Frequent explosive activity, primarily consisting of Strombolian ash eruptions from the small summit crater, but sometimes producing lava flows, has been recorded since the 18th century. A steam plume often rises from the summit crater.
Information Contacts: Alaska Volcano Observatory (AVO), a cooperative program of a) U.S. Geological Survey, 4200 University Drive, Anchorage, AK 99508-4667 USA (URL: https://avo.alaska.edu/), b) Geophysical Institute, University of Alaska, PO Box 757320, Fairbanks, AK 99775-7320, USA, and c) Alaska Division of Geological & Geophysical Surveys, 794 University Ave., Suite 200, Fairbanks, AK 99709, USA (URL: http://dggs.alaska.gov/); MIROVA (Middle InfraRed Observation of Volcanic Activity), a collaborative project between the Universities of Turin and Florence (Italy) supported by the Centre for Volcanic Risk of the Italian Civil Protection Department (URL: http://www.mirovaweb.it/); Hawai'i Institute of Geophysics and Planetology (HIGP) - MODVOLC Thermal Alerts System, School of Ocean and Earth Science and Technology (SOEST), Univ. of Hawai'i, 2525 Correa Road, Honolulu, HI 96822, USA (URL: http://modis.higp.hawaii.edu/); NASA Global Sulfur Dioxide Monitoring Page, Atmospheric Chemistry and Dynamics Laboratory, NASA Goddard Space Flight Center (NASA/GSFC), 8800 Greenbelt Road, Goddard, Maryland, USA (URL: https://so2.gsfc.nasa.gov/); Copernicus Browser, Copernicus Data Space Ecosystem, European Space Agency (URL: https://dataspace.copernicus.eu/browser/).
Ioto
Japan
24.751°N, 141.289°E; summit elev. 169 m
All times are local (unless otherwise noted)
New eruption with discolored water, ejecta, and floating pumice during October-December 2023
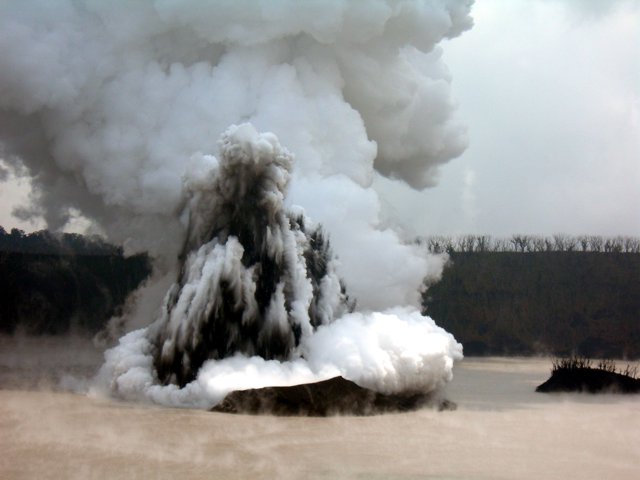
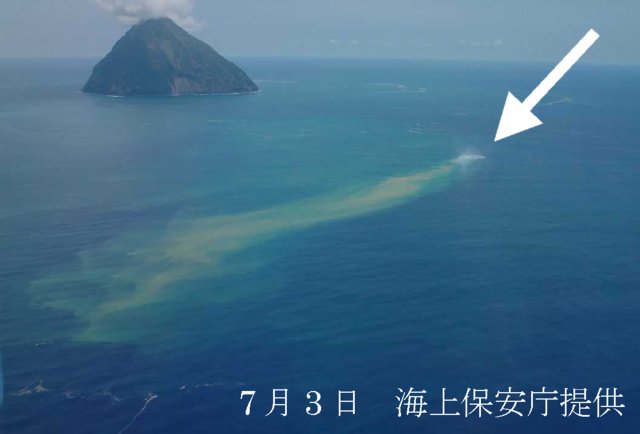
Ioto (Iwo-jima), located about 1,200 km S of Tokyo, lies within a 9-km-wide submarine caldera along the Izu-Bonin-Mariana volcanic arc. Previous eruptions date back to 1889 and have consisted of dominantly phreatic explosions, pumice deposits during 2001, and discolored water. A submarine eruption during July through December 2022 was characterized by discolored water, pumice deposits, and gas emissions (BGVN 48:01). This report covers a new eruption during October through December 2023, which consisted of explosions, black ejecta, discolored water, and floating pumice, based on information from the Japan Meteorological Association (JMA), the Japan Coast Guard (JCG), and satellite data.
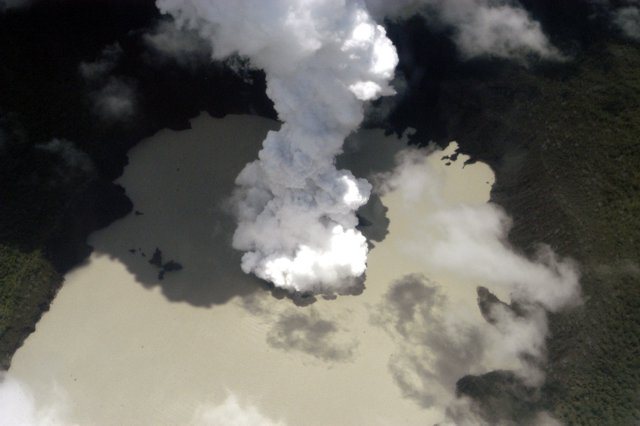
JMA reported that an eruption had been occurring offshore of Okinahama on the SE side of the island since 21 October, which was characterized by volcanic tremor, according to the Japan Maritime Self-Defense Force (JMSDF) Iwo Jima Air Base (figure 22). According to an 18 October satellite image a plume of discolored water at the site of this new eruption extended NE (figure 23). During an overflight conducted on 30 October, a vent was identified about 1 km off the coast of Okinahama. Observers recorded explosions every few minutes that ejected dark material about 20 m above the ocean and as high as 150 m. Ejecta from the vent formed a black-colored island about 100 m in diameter, according to observations conducted from the air by the Earthquake Research Institute of the University of Tokyo in cooperation with the Mainichi newspaper (figure 24). Occasionally, large boulders measuring more than several meters in size were also ejected. Observations from the Advanced Land Observing Satellite Daichi-2 and Sentinel-2 satellite images also confirmed the formation of this island (figure 23). Brown discolored water and floating pumice were present surrounding the island.
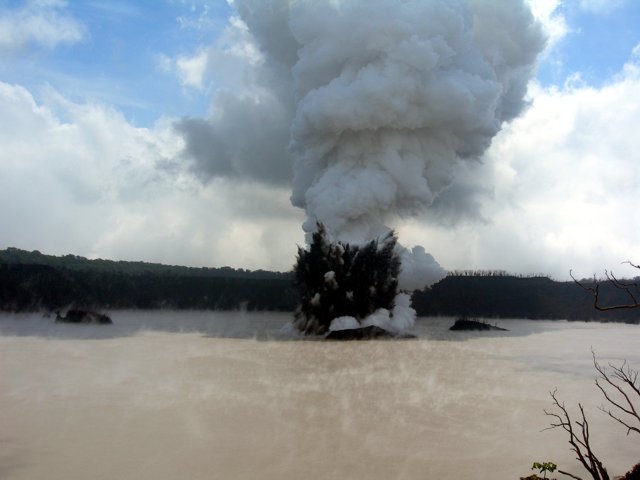
The eruption continued during November. During an overflight on 3 November observers photographed the island and noted that material was ejected 169 m high, according to a news source. Explosions gradually became shorter, and, by the 3rd, they occurred every few seconds; dark and incandescent material were ejected about 800 m above the vent. On 4 November eruptions were accompanied by explosive sounds. Floating, brown-colored pumice was present in the water surrounding the island. There was a brief increase in the number of volcanic earthquakes during 8-14 November and 24-25 November. The eruption temporarily paused during 9-11 November and by 12 November eruptions resumed to the W of the island. On 10 November dark brown-to-dark yellow-green discolored water and a small amount of black floating material was observed (figure 25). A small eruption was reported on 18 November off the NE coast of the island, accompanied by white gas-and-steam plumes (figure 23). Another pause was recorded during 17-19 November, which then resumed on 20 November and continued erupting intermittently. According to a field survey conducted by the National Institute for Disaster Prevention Science and Technology on 19 November, a 30-m diameter crater was visible on the NE coast where landslides, hot water, and gray volcanic ash containing clay have occurred and been distributed previously. Erupted blocks about 10 cm in diameter were distributed about 90-120 m from the crater. JCG made observations during an overflight on 23 November and reported a phreatomagmatic eruption. Explosions at the main vent generated dark gas-and-ash plumes that rose to 200 m altitude and ejected large blocks that landed on the island and in the ocean (figure 26). Discolored water also surrounded the island. The size of the new island had grown to 450 m N-S x 200 m E-W by 23 November, according to JCG.
The eruption continued through 11 December, followed by a brief pause in activity, which then resumed on 31 December, according to JMA. Intermittent explosions produced 100-m-high black plumes at intervals of several minutes to 30 minutes during 1-10 December. Overflights were conducted on 4 and 15 December and reported that the water surrounding the new island was discolored to dark brown-to-dark yellow-green (figure 27). No floating material was reported during this time. In comparison to the observations made on 23 November, the new land had extended N and part of it had eroded away. In addition, analysis by the Geospatial Information Authority of Japan using SAR data from Daichi-2 also confirmed that the area of the new island continued to decrease between 4 and 15 December. Ejected material combined with wave erosion transformed the island into a “J” shape, 500-m-long and with the curved part about 200 m offshore of Ioto. The island was covered with brown ash and blocks, and the surrounding water was discolored to greenish-brown and contained an area of floating pumice. JCG reported from an overflight on 4 December that volcanic ash-like material found around the S vent on the NE part of the island was newly deposited since 10 November (figure 28). By 15 December the N part of the “J” shaped island had separated and migrated N, connecting to the Okinahama coast and the curved part of the “J” had eroded into two smaller islands (figure 27).
References. Ukawa, M., Fujita, E., Kobayashi, T., 2002, Recent volcanic activity of Iwo Jima and the 2001 eruption, Monthly Chikyu, Extra No. 39, 157-164.
Geologic Background. Ioto, in the Volcano Islands of Japan, lies within a 9-km-wide submarine caldera. The volcano is also known as Ogasawara-Iojima to distinguish it from several other "Sulfur Island" volcanoes in Japan. The triangular, low-elevation, 8-km-long island narrows toward its SW tip and has produced trachyandesitic and trachytic rocks that are more alkalic than those of other volcanoes in this arc. The island has undergone uplift for at least the past 700 years, accompanying resurgent doming of the caldera; a shoreline landed upon by Captain Cook's surveying crew in 1779 is now 40 m above sea level. The Motoyama plateau on the NE half of the island consists of submarine tuffs overlain by coral deposits and forms the island's high point. Many fumaroles are oriented along a NE-SW zone cutting through Motoyama. Numerous recorded phreatic eruptions, many from vents on the W and NW sides of the island, have accompanied the uplift.
Information Contacts: Japan Meteorological Agency (JMA), 1-3-4 Otemachi, Chiyoda-ku, Tokyo 100-8122, Japan (URL: http://www.jma.go.jp/jma/indexe.html); Japan Coast Guard (JCG) Volcano Database, Hydrographic and Oceanographic Department, 3-1-1, Kasumigaseki, Chiyoda-ku, Tokyo 100-8932, Japan (URL: https://www1.kaiho.mlit.go.jp/GIJUTSUKOKUSAI/kaiikiDB/kaiyo22-2.htm); Copernicus Browser, Copernicus Data Space Ecosystem, European Space Agency (URL: https://dataspace.copernicus.eu/browser/); Asahi, 5-3-2, Tsukiji, Chuo Ward, Tokyo, 104-8011, Japan (URL: https://www.asahi.com/ajw/articles/15048458).
Purace (Colombia) — December 2023 Cite this Report
Purace
Colombia
2.3095°N, 76.3948°W; summit elev. 4650 m
All times are local (unless otherwise noted)
Gas-and-ash emission on 16 November 2023
Puracé, located in Colombia, is a stratovolcano that contains a 500-m-wide summit crater. It is part of the Los Coconucos volcanic chain that is a NW-SE trending group of seven cones and craters. The most recent eruption occurred during March 2022 that was characterized by frequent seismicity and gas-and-steam emissions (BGVN 47:06). This report covers a brief eruption during November 2023 based on monthly reports from the Popayán Observatory, part of the Servicio Geologico Colombiano (SGC).
Activity during November 2022 through November 2023 primarily consisted of seismicity: VT-type events, LP-type events, HB-type events, and TR-type events (table 4). Maximum sulfur dioxide values were measured weekly and ranged from 259-5,854 tons per day (t/d) during November 2022 through April 2023. White gas-and-steam emissions were also occasionally reported.
SGC issued a report on 25 October that noted a significant increase in the number of earthquakes associated with rock fracturing. These earthquakes were located SE of the crater between Puracé and Piocollo at depths of 1-4 km. There were no reported variations in sulfur dioxide values, but SGC noted high carbon dioxide values, compared to those recorded in the first half of 2023.
SGC reported that at 1929 on 16 November the seismic network detected a signal that was possibly associated with a gas-and-ash emission, though it was not confirmed in webcam images due to limited visibility. On 17 November an observer confirmed ash deposits on the N flank. Webcam images showed an increase in degassing both inside the crater and from the NW flank, rising 700 m above the crater.
Table 4. Seismicity at Puracé during November 2022-November 2023. Volcano-tectonic (VT), long-period (LP), hybrid (HB), and tremor (TR) events are reported each month. Courtesy of SGC.
| Month |
Volcano-tectonic |
Long-period |
Hybrid |
Tremor |
| Nov 2022 |
429 |
2,023 |
5 |
831 |
| Dec 2022 |
423 |
1,390 |
9 |
834 |
| Jan 2023 |
719 |
1,622 |
0 |
957 |
| Feb 2023 |
598 |
1,701 |
2 |
1,124 |
| Mar 2023 |
331 |
2,408 |
147 |
607 |
| Apr 2023 |
614 |
4,427 |
33 |
148 |
| May 2023 |
620 |
3,717 |
170 |
109 |
| Jun 2023 |
467 |
3,293 |
86 |
148 |
| Jul 2023 |
1,116 |
5,809 |
183 |
542 |
| Aug 2023 |
692 |
2,927 |
94 |
321 |
| Sep 2023 |
887 |
1,505 |
82 |
848 |
| Oct 2023 |
2,373 |
2,949 |
135 |
692 |
| Nov 2023 |
1,212 |
2,302 |
69 |
293 |
Geologic Background. Puracé is an active andesitic volcano with a 600-m-diameter summit crater at the NW end of the Los Coconucos Volcanic Chain. This volcanic complex includes nine composite and five monogenetic volcanoes, extending from the Puracé crater more than 6 km SE to the summit of Pan de Azúcar stratovolcano. The dacitic massif which the complex is built on extends about 13 km NW-SE and 10 km NE-SW. Frequent small to moderate explosive eruptions reported since 1816 CE have modified the morphology of the summit crater, with the largest eruptions in 1849, 1869, and 1885.
Information Contacts: Servicio Geologico Colombiano (SGC), Diagonal 53 No. 34-53 - Bogotá D.C., Colombia (URL: https://www.sgc.gov.co/volcanes).
Suwanosejima (Japan) — December 2023 Cite this Report
Suwanosejima
Japan
29.638°N, 129.714°E; summit elev. 796 m
All times are local (unless otherwise noted)
Eruption plumes, crater incandescence, and occasional explosions during July-October 2023
Suwanosejima is an 8-km-long island that consists of a stratovolcano and two active summit craters, located in the northern Ryukyu Islands, Japan. Volcanism over the past century has been characterized by Strombolian explosions, ash plumes, and ashfall. The current eruption began in October 2004 and has more recently consisted of frequent eruption plumes, explosions, and incandescent ejecta (BGVN 48:07). This report covers similar activity of ash plumes, explosions, and crater incandescence during July through October 2023 using monthly reports from the Japan Meteorological Agency (JMA) and satellite data.
Thermal activity during the reporting period was relatively low; only one low-power thermal anomaly was detected during mid-July and one during early August, based on a MIROVA (Middle InfraRed Observation of Volcanic Activity) Log Radiative Power graph of the MODIS thermal anomaly data. On two clear weather days, a thermal anomaly was visible in infrared satellite images (figure 81).
Low-level activity was reported at the Otake crater during July and no explosions were detected. Eruption plumes rose as high as 1.8 km above the crater. On 13 July an ash plume rose 1.7 km above the crater rim, based on a webcam image. During the night of the 28th crater incandescence was visible in a webcam image. An eruptive event reported on 31 July produced an eruption plume that rose 2.1 km above the crater. Seismicity consisted of 11 volcanic earthquakes on the W flank, the number of which had decreased compared to June (28) and 68 volcanic earthquakes near the Otake crater, which had decreased from 722 in the previous month. According to observations conducted by the University of Tokyo Graduate School of Science, Kyoto University Disaster Prevention Research Institute, Toshima Village, and JMA, the amount of sulfur dioxide emissions released during the month was 400-800 tons per day (t/d).
Eruptive activity in the Otake crater continued during August and no explosions were reported. An eruptive event produced a plume that rose 1 km above the crater at 1447 on 12 August. Subsequent eruptive events were recorded at 0911 on 16 August, at 1303 on 20 August, and at 0317 on 21 August, which produced ash plumes that rose 1-1.1 km above the crater and drifted SE, SW, and W. On 22 August an ash plume was captured in a webcam image rising 1.4 km above the crater (figure 82). Multiple eruptive events were detected on 25 August at 0544, 0742, 0824, 1424, and 1704, which generated ash plumes that rose 1.1-1.2 km above the crater and drifted NE, W, and SW. On 28 August a small amount of ashfall was observed as far as 1.5 km from the crater. There were 17 volcanic earthquakes recorded on the W flank of the volcano and 79 recorded at the Otake crater during the month. The amount of sulfur dioxide emissions released during the month was 400-800 t/d.
Activity continued at the Otake crater during September. Occasionally, nighttime crater incandescence was observed in webcam images and ashfall was reported. An eruptive event at 1949 on 4 September produced an ash plume that rose 1 km above the crater and drifted SW. On 9 September several eruption events were detected at 0221, 0301, and 0333, which produced ash plumes that rose 1.1-1.4 km above the crater rim and drifted W; continuous ash emissions during 0404-0740 rose to a maximum height of 2 km above the crater rim (figure 83). More eruptive events were reported at 1437 on 10 September, at 0319 on 11 September, and at 0511 and 1228 on 15 September, which generated ash plumes that rose 1-1.8 km above the crater. During 25, 27, and 30 September, ash plumes rose as high as 1.3 km above the crater rim. JMA reported that large blocks were ejected as far as 300 m from the center of the crater. There were 18 volcanic earthquakes detected beneath the W flank and 82 volcanic earthquakes detected near the Otake crater. The amount of sulfur dioxide released during the month ranged from 600 to 1,600 t/d.
Activity during early-to-mid-October consisted of occasional explosions, a total number of 13, and ash plumes that rose as high as 1.9 km above the Otake crater rim on 29 October (figure 84). These explosions are the first to have occurred since June 2023. Continuous ash emissions were reported during 0510-0555 on 1 October. Explosions were recorded at 0304, 2141, and 2359 on 2 October, at 0112 on 3 October, and at 1326 on 6 October, which produced ash plumes that rose as high as 1 km above the crater rim and drifted SW and W. An explosion was noted at 0428 on 3 October, but emission details were unknown. A total of eight explosions were recorded by the seismic network at 1522 on 14 October, at 0337, 0433, 0555, 1008, and 1539 on 15 October, and at 0454 and 0517 on 16 October. Ash plumes from these explosions rose as high as 900 m above the crater and drifted SE. Eruptive events during 25-27 and 29-30 October generated plumes that rose as high as 1.9 km above the crater and drifted SE, S, and SW. Ash was deposited in Toshima village (3.5 km SSW). Eruptive activity occasionally ejected large volcanic blocks as far as 600 m from the crater. Nighttime crater incandescence was visible in webcams. Intermittent ashfall was reported as far as 1.5 km from the crater. There were 43 volcanic earthquakes detected on the W flank during the month, and 184 volcanic earthquakes detected near the Otake crater. The amount of sulfur dioxide emitted ranged between 400 and 900 t/d.
Geologic Background. The 8-km-long island of Suwanosejima in the northern Ryukyu Islands consists of an andesitic stratovolcano with two active summit craters. The summit is truncated by a large breached crater extending to the sea on the E flank that was formed by edifice collapse. One of Japan's most frequently active volcanoes, it was in a state of intermittent Strombolian activity from Otake, the NE summit crater, between 1949 and 1996, after which periods of inactivity lengthened. The largest recorded eruption took place in 1813-14, when thick scoria deposits covered residential areas, and the SW crater produced two lava flows that reached the western coast. At the end of the eruption the summit of Otake collapsed, forming a large debris avalanche and creating an open collapse scarp extending to the eastern coast. The island remained uninhabited for about 70 years after the 1813-1814 eruption. Lava flows reached the eastern coast of the island in 1884. Only about 50 people live on the island.
Information Contacts: Japan Meteorological Agency (JMA), 1-3-4 Otemachi, Chiyoda-ku, Tokyo 100-8122, Japan (URL: http://www.jma.go.jp/jma/indexe.html); MIROVA (Middle InfraRed Observation of Volcanic Activity), a collaborative project between the Universities of Turin and Florence (Italy) supported by the Centre for Volcanic Risk of the Italian Civil Protection Department (URL: http://www.mirovaweb.it/); Hawai'i Institute of Geophysics and Planetology (HIGP) - MODVOLC Thermal Alerts System, School of Ocean and Earth Science and Technology (SOEST), Univ. of Hawai'i, 2525 Correa Road, Honolulu, HI 96822, USA (URL: http://modis.higp.hawaii.edu/); Copernicus Browser, Copernicus Data Space Ecosystem, European Space Agency (URL: https://dataspace.copernicus.eu/browser/).
Etna
Italy
37.748°N, 14.999°E; summit elev. 3357 m
All times are local (unless otherwise noted)
Strombolian explosions, lava fountains, and lava flows during July-August 2023
Etna, located on the Italian island of Sicily, has had documented eruptions dating back to 1500 BCE. Activity typically originates from multiple cones at the summit, where several craters have formed and evolved. The currently active craters are Northeast Crater (NEC), Voragine (VOR), and Bocca Nuova (BN), and the Southeast Crater (SEC); VOR and BN were previously referred to as the “Central Crater”. The original Southeast crater formed in 1978, and a second eruptive site that opened on its SE flank in 2011 was named the New Southeast Crater (NSEC). Another eruptive site between the SEC and NSEC developed during early 2017 and was referred to as the "cono della sella" (saddle cone). The current eruption period began in November 2022 and has been characterized by intermittent Strombolian activity, lava flows, and ash plumes (BGVN 48:08). This report updates activity during July through October 2023, which includes primarily gas-and-steam emissions; during July and August Strombolian explosions, lava fountains, and lava flows were reported, based on weekly and special reports by the Osservatorio Etneo (OE), part of the Catania Branch of Italy's Istituo Nazionale di Geofisica e Vulcanologica (INGV) and satellite data.
Variable fumarolic degassing was reported at all summit craters (BN, VOR, NEC, and SEC) throughout the entire reporting period (table 15). The MIROVA (Middle InfraRed Observation of Volcanic Activity) volcano hotspot detection system based on the analysis of MODIS data showed frequent low-to-moderate power thermal anomalies during the reporting period (figure 399). During mid-August there was a pulse in activity that showed an increase in the power of the anomalies due to Strombolian activity, lava fountains, and lava flows. Infrared satellite imagery captured strong thermal anomalies at the central and southeast summit crater areas (figure 400). Accompanying thermal activity were occasional sulfur dioxide plumes that exceeded 2 Dobson Units (DUs) recorded by the TROPOMI instrument on the Sentinel-5P satellite (figure 401).
Table 15. Summary of activity at the four primary crater areas at the summit of Etna during July-October 2023. Information is from INGV weekly reports.
| Month |
Bocca Nuova (BN) |
Voragine (VOR) |
Northeast Crater (NEC) |
Southeast Crater (SEC) |
| Jul 2023 |
Continuous degassing. |
No observations. |
Weak gas emissions. |
Continuous degassing. Sporadic and weak-to-moderate ash emissions. Strombolian explosions. |
| Aug 2023 |
Continuous degassing. |
No observations. |
No observations. |
Continuous degassing. Occasional ash emissions. Strombolian activity, lava fountaining, and lava flows. |
| Sep 2023 |
Variable degassing. Crater incandescence. |
Weak fumarolic activity. |
Weak fumarolic activity. |
Variable degassing. |
| Oct 2023 |
Continuous degassing. |
Weak fumarolic activity. |
Weak fumarolic activity. |
Continuous degassing. |
Activity during July and August was relatively low and mainly consisted of degassing at the summit craters, particularly at SEC and BN. Cloudy weather prevented clear views of the summit during early July. During the night of 2 July some crater incandescence was visible at SEC. Explosive activity resumed at SEC during 9-10 July, which was characterized by sporadic and weak ash emissions that rapidly dispersed in the summit area (figure 402). INGV reported moderate Strombolian activity began at 2034 on 14 July and was confined to the inside of the crater and fed by a vent located in the E part of SEC. An ash emission was detected at 2037. A new vent opened on 15 July in the SE part of BN and began to produce continuous gas-and-steam emissions. During an inspection carried out on 28 July pulsating degassing, along with audible booms, were reported at two active vents in BN. Vigorous gas-and-steam emissions intermittently generated rings. On rare occasions, fine, reddish ash was emitted from BN1 and resuspended by the gas-and-steam emissions.
Around 2000 on 13 August INGV reported a sudden increase in volcanic tremor amplitude. Significant infrasonic activity coincided with the tremor increase. Incandescent flashes were visible through the cloud cover in webcam images of SEC (figure 403). Strombolian activity at SEC began to gradually intensify starting at 2040 as seismicity continued to increase. The Aviation Color Code (ACC) was raised to Yellow (the second lowest-level on a four-color scale) at 2126 and then to Orange (the second highest-level on a four-color scale) at 2129 due to above-background activity. The activity rapidly transitioned from Strombolian activity to lava fountains around 2333 that rose 300-400 m above the crater (figure 403). Activity was initially focused on the E vent of the crater, but then the vent located above the S flank of the cone also became active. A lava flow from this vent traveled SW into the drainage created on 10 February 2022, overlapping with previous flows from 10 and 21 February 2022 and 21 May 2023, moving between Monte Barbagallo and Monte Frumento Supino (figure 404). The lava flow was 350 m long, oriented NNE-SSW, and descended to an elevation of 2.8 km. Flows covered an area of 300,000 m2 and had an estimated volume of 900,000 m3. The ACC was raised to Red at 2241 based on strong explosive activity and ashfall in Rifugio Sapienza-Piano Vetore at 1.7 km elevation on the S flank. INGV reported that pyroclastic flows accompanied this activity.
Activity peaked between 0240 and 0330 on 14 August, when roughly 5-6 vents erupted lava fountains from the E to SW flank of SEC. The easternmost vents produced lava fountains that ejected material strongly to the E, which caused heavy fallout of incandescent pyroclastic material on the underlying flank, triggering small pyroclastic flows. This event was also accompanied by lightning both in the ash column and in the ash clouds that were generated by the pyroclastic flows. A fracture characterized by a series of collapse craters (pit craters) opened on the upper SW flank of SEC. An ash cloud rose a few kilometers above the crater and drifted S, causing ash and lapilli falls in Rifugio Sapienza and expanding toward Nicolosi, Mascalucia, Catania, and up to Syracuse. Ashfall resulted in operational problems at the Catania airport (50 km S), which lasted from 0238 until 2000. By 0420 the volcanic tremor amplitude values declined to background levels. After 0500 activity sharply decreased, although the ash cloud remained for several hours and drifted S. By late morning, activity had completely stopped. The ACC was lowered to Orange as volcanic ash was confined to the summit area. Sporadic, minor ash emissions continued throughout the day. At 1415 the ACC was lowered to Yellow and then to Green at 1417.
During the night of 14-15 August only occasional flashes were observed, which were more intense during avalanches of material inside the eruptive vents. Small explosions were detected at SEC at 2346 on 14 August and at 0900 on 26 August that each produced ash clouds which rapidly dispersed into the atmosphere (figure 405). According to a webcam image, an explosive event detected at 2344 at SEC generated a modest ash cloud that was rapidly dispersed by winds. The ACC was raised to Yellow at 2355 on 14 August due to increasing unrest and was lowered to Green at 0954 on 15 August.
Activity during September and October was relatively low and mainly characterized by variable degassing from BN and SEC. Intense, continuous, and pulsating degassing was accompanied by roaring sounds and flashes of incandescence at BN both from BN1 and the new pit crater that formed during late July (figure 406). The degassing from the new pit crater sometimes emitted vapor rings. Cloudy weather during 6-8 September prevented observations of the summit craters .
Geologic Background. Mount Etna, towering above Catania on the island of Sicily, has one of the world's longest documented records of volcanism, dating back to 1500 BCE. Historical lava flows of basaltic composition cover much of the surface of this massive volcano, whose edifice is the highest and most voluminous in Italy. The Mongibello stratovolcano, truncated by several small calderas, was constructed during the late Pleistocene and Holocene over an older shield volcano. The most prominent morphological feature of Etna is the Valle del Bove, a 5 x 10 km caldera open to the east. Two styles of eruptive activity typically occur, sometimes simultaneously. Persistent explosive eruptions, sometimes with minor lava emissions, take place from one or more summit craters. Flank vents, typically with higher effusion rates, are less frequently active and originate from fissures that open progressively downward from near the summit (usually accompanied by Strombolian eruptions at the upper end). Cinder cones are commonly constructed over the vents of lower-flank lava flows. Lava flows extend to the foot of the volcano on all sides and have reached the sea over a broad area on the SE flank.
Information Contacts: Sezione di Catania - Osservatorio Etneo, Istituto Nazionale di Geofisica e Vulcanologia (INGV), Sezione di Catania, Piazza Roma 2, 95123 Catania, Italy (URL: http://www.ct.ingv.it/it/); MIROVA (Middle InfraRed Observation of Volcanic Activity), a collaborative project between the Universities of Turin and Florence (Italy) supported by the Centre for Volcanic Risk of the Italian Civil Protection Department (URL: http://www.mirovaweb.it/); NASA Global Sulfur Dioxide Monitoring Page, Atmospheric Chemistry and Dynamics Laboratory, NASA Goddard Space Flight Center (NASA/GSFC), 8800 Greenbelt Road, Goddard MD 20771, USA (URL: https://so2.gsfc.nasa.gov/); Copernicus Browser, Copernicus Data Space Ecosystem, European Space Agency (URL: https://dataspace.copernicus.eu/browser/).
Aira
Japan
31.5772°N, 130.6589°E; summit elev. 1117 m
All times are local (unless otherwise noted)
Explosions, ash plumes, ash fall, and crater incandescence during July-October 2023
Aira caldera, located in the northern half of Kagoshima Bay, Japan, contains the post-caldera Sakurajima volcano. Eruptions typically originate from the Minamidake crater, and since the 8th century, ash deposits have been recorded in the city of Kagoshima (10 km W), one of Kyushu’s largest cities. The Minamidake summit cone and crater has had persistent activity since 1955; the Showa crater on the E flank has also been intermittently active since 2006. The current eruption period began during March 2017 and has recently been characterized by intermittent explosions, eruption plumes, and ashfall (BGVN 48:07). This report updates activity during July through October 2023 and describes explosive events, ash plumes, nighttime crater incandescence, and ashfall, according to monthly activity reports from the Japan Meteorological Agency (JMA) and satellite data.
Thermal activity remained at low levels during this reporting period, according to the MIROVA (Middle InfraRed Observation of Volcanic Activity) system (figure 149). There was a slight increase in the number of anomalies during September through October. Occasional thermal anomalies were visible in infrared satellite images mainly at the Minamidake crater (Vent A is located to the left and Vent B is located to the right) (figure 150).
Table 30. Number of monthly explosive events, days of ashfall, area of ash covered, and sulfur dioxide emissions from Sakurajima’s Minamidake crater at Aira during July-October 2023. Note that smaller ash events are not listed. Ashfall days were measured at Kagoshima Local Meteorological Observatory and ashfall amounts represent material covering all the Kagoshima Prefecture. Data courtesy of JMA monthly reports.
| Month |
Explosive events |
Days of ashfall |
Ashfall amount (g/m2) |
SO2 emissions (tons/day) |
| Jul 2023 |
3 |
0 |
0 |
1,600-3,200 |
| Aug 2023 |
3 |
10 |
7 |
1,800-3,300 |
| Sep 2023 |
3 |
7 |
3 |
1,600-2,300 |
| Oct 2023 |
33 |
8 |
61 |
2,200-4,200 |
JMA reported that during July, there were eight eruptions, three of which were explosion events in the Showa crater. Large blocks were ejected as far as 600 m from the Showa crater. Very small eruptions were occasionally reported at the Minamidake crater. Nighttime incandescence was observed in both the Showa and Minamidake crater. Explosions were reported on 16 July at 2314 and on 17 July at 1224 and at 1232 (figure 151). Resulting eruption plumes rose 700-2,500 m above the crater and drifted N. On 23 July the number of volcanic earthquakes on the SW flank of the volcano increased. A strong Mw 3.1 volcanic earthquake was detected at 1054 on 26 July. The number of earthquakes recorded throughout the month was 545, which markedly increased from 73 in June. No ashfall was observed at the Kagoshima Regional Meteorological Observatory during July. According to a field survey conducted during the month, the daily amount of sulfur dioxide emissions was 1,600-3,200 tons per day (t/d).
There were three eruptions reported at the Minamidake crater during August, each of which were explosive. The explosions occurred on 9 August at 0345, on 13 August at 2205, and on 31 August at 0640, which generated ash plumes that rose 800-2,000 m above the crater and drifted W. There were two eruptions detected at Showa crater; on 4 August at 2150 ejecta traveled 800 m from the Showa crater and associated eruption plumes rose 2.3 km above the crater. The explosion at 2205 on 13 August generated an ash plume that rose 2 km above the crater and was accompanied by large blocks that were ejected 600 m from the Minamidake crater (figure 152). Nighttime crater incandescence was visible in a high-sensitivity surveillance camera at both craters. Seismicity consisted of 163 volcanic earthquakes, 84 of which were detected on the SW flank. According to the Kagoshima Regional Meteorological Observatory there was a total of 7 g/m2 of ashfall over the course of 10 days during the month. According to a field survey, the daily amount of sulfur dioxide emitted was 1,800-3,300 t/d.
During September, four eruptions were reported, three of which were explosion events. These events occurred at 1512 on 9 September, at 0018 on 11 September, and at 2211 on 13 September. Resulting ash plumes generally rose 800-1,100 m above the crater. An explosion produced an ash plume at 2211 on 13 September that rose as high as 1.7 km above the crater. Large volcanic blocks were ejected 600 m from the Minamidake crater. Smaller eruptions were occasionally observed at the Showa crater. Nighttime crater incandescence was visible at the Minamidake crater. Seismicity was characterized by 68 volcanic earthquakes, 28 of which were detected beneath the SW flank. According to the Kagoshima Regional Meteorological Observatory there was a total of 3 g/m2 of ashfall over the course of seven days during the month. A field survey reported that the daily amount of sulfur dioxide emitted was 1,600-2,300 t/d.
Eruptive activity during October consisted of 69 eruptions, 33 of which were described as explosive. These explosions occurred during 4 and 11-21 October and generated ash plumes that rose 500-3,600 m above the crater and drifted S, E, SE, and N. On 19 October at 1648 an explosion generated an ash plume that rose 3.6 km above the crater (figure 153). No eruptions were reported in the Showa crater; white gas-and-steam emissions rose 100 m above the crater from a vent on the N flank. Nighttime incandescence was observed at the Minamidake crater. On 24 October an eruption was reported from 0346 through 0430, which included an ash plume that rose 3.4 km above the crater. Ejected blocks traveled 1.2 km from the Minamidake crater. Following this eruption, small amounts of ashfall were observed from Arimura (4.5 km SE) and a varying amount in Kurokami (4 km E) (figure 154). The number of recorded volcanic earthquakes during the month was 190, of which 14 were located beneath the SW flank. Approximately 61 g/m2 of ashfall was reported over eight days of the month. According to a field survey, the daily amount of sulfur dioxide emitted was 2,200-4,200 t/d.
Geologic Background. The Aira caldera in the northern half of Kagoshima Bay contains the post-caldera Sakurajima volcano, one of Japan's most active. Eruption of the voluminous Ito pyroclastic flow accompanied formation of the 17 x 23 km caldera about 22,000 years ago. The smaller Wakamiko caldera was formed during the early Holocene in the NE corner of the caldera, along with several post-caldera cones. The construction of Sakurajima began about 13,000 years ago on the southern rim and built an island that was joined to the Osumi Peninsula during the major explosive and effusive eruption of 1914. Activity at the Kitadake summit cone ended about 4,850 years ago, after which eruptions took place at Minamidake. Frequent eruptions since the 8th century have deposited ash on the city of Kagoshima, located across Kagoshima Bay only 8 km from the summit. The largest recorded eruption took place during 1471-76.
Information Contacts: Japan Meteorological Agency (JMA), 1-3-4 Otemachi, Chiyoda-ku, Tokyo 100-8122, Japan (URL: http://www.jma.go.jp/jma/indexe.html); MIROVA (Middle InfraRed Observation of Volcanic Activity), a collaborative project between the Universities of Turin and Florence (Italy) supported by the Centre for Volcanic Risk of the Italian Civil Protection Department (URL: http://www.mirovaweb.it/); Copernicus Browser, Copernicus Data Space Ecosystem, European Space Agency (URL: https://dataspace.copernicus.eu/browser/).
Nishinoshima (Japan) — November 2023 Cite this Report
Nishinoshima
Japan
27.247°N, 140.874°E; summit elev. 100 m
All times are local (unless otherwise noted)
Gray emissions during October 2023
Nishinoshima is a small island in the Ogasawara Arc, about 1,000 km S of Tokyo, Japan. It contains prominent submarine peaks to the S, W, and NE. Recorded eruptions date back to 1973, with the current eruption period beginning in October 2022. Eruption plumes and fumarolic activity characterize recent activity (BGVN 48:10). This report covers the end of the eruption for September through October 2023, based on information from monthly reports of the Japan Meteorological Agency (JMA) monthly reports, and satellite data.
No eruptive activity was reported during September 2023, although JMA noted that the surface temperature was slightly elevated compared to the surrounding area since early March 2023. The Japan Coast Guard (JCG) conducted an overflight on 20 September and reported white gas-and-steam plumes rising 3 km above the central crater of the pyroclastic cone, as well as multiple white gas-and-steam emissions emanating from the N, E, and S flanks of the crater to the coastline. In addition, dark reddish brown-to-green discolored water was distributed around almost the entire circumference of the island.
Similar low-level activity was reported during October. Multiple white gas-and-steam emissions rose from the N, E, and S flanks of the central crater of the pyroclastic cone and along the coastline; these emissions were more intense compared to the previous overflight observations. Dark reddish brown-to-green discolored water remained visible around the circumference of the island. On 4 October aerial observations by JCG showed a small eruption consisting of continuous gas-and-steam emissions emanating from the central crater, with gray emissions rising to 1.5 km altitude (figure 129). According to observations from the marine weather observation vessel Keifu Maru on 26 October, white gas-and-steam emissions persisted from the center of the pyroclastic cone, as well as from the NW, SW, and SE coasts of the island for about five minutes. Slightly discolored water was visible up to about 1 km.
Frequent low-to-moderate power thermal anomalies were recorded in the MIROVA graph (Middle InfraRed Observation of Volcanic Activity) during September (figure 130). Occasional anomalies were detected during October, and fewer during November through December. A thermal anomaly was visible in the crater using infrared satellite imagery on 6, 8, 11, 16, 18, 21, and 23 September and 8, 13, 21, 26, and 28 October (figure 131).
Geologic Background. The small island of Nishinoshima was enlarged when several new islands coalesced during an eruption in 1973-74. Multiple eruptions that began in 2013 completely covered the previous exposed surface and continued to enlarge the island. The island is the summit of a massive submarine volcano that has prominent peaks to the S, W, and NE. The summit of the southern cone rises to within 214 m of the ocean surface 9 km SSE.
Information Contacts: Japan Meteorological Agency (JMA), 1-3-4 Otemachi, Chiyoda-ku, Tokyo 100-8122, Japan (URL: http://www.jma.go.jp/jma/indexe.html); MIROVA (Middle InfraRed Observation of Volcanic Activity), a collaborative project between the Universities of Turin and Florence (Italy) supported by the Centre for Volcanic Risk of the Italian Civil Protection Department (URL: http://www.mirovaweb.it/); Copernicus Browser, Copernicus Data Space Ecosystem, European Space Agency (URL: https://dataspace.copernicus.eu/browser/).
Kilauea (United States) — October 2023 Cite this Report
Kilauea
United States
19.421°N, 155.287°W; summit elev. 1222 m
All times are local (unless otherwise noted)
Strong lava fountains, lava flows, and spatter at Halema’uma’u during January-September 2023
Kīlauea is on the island of Hawai’i and overlaps the E flank of the Mauna Loa volcano. Its East Rift Zone (ERZ) has been intermittently active for at least 2,000 years. An extended eruption period began in January 1983 and was characterized by open lava lakes and lava flows from the summit caldera and the East Rift Zone. During May 2018 magma migrated into the Lower East Rift Zone (LERZ) and opened 24 fissures along a 6-km-long NE-trending fracture zone that produced lava flows traveling in multiple directions. As lava emerged from the fissures, the lava lake at Halema'uma'u drained and explosions sent ash plumes to several kilometers altitude (BGVN 43:10).
The current eruption period started during September 2021 and has been characterized by low-level lava effusions in the active Halema’uma’u lava lake (BGVN 48:01). This report covers three notable eruption periods during February, June, and September 2023 consisting of lava fountaining, lava flows, and spatter during January through September 2023 using information from daily reports, volcanic activity notices, and abundant photo, map, and video data from the US Geological Survey's (USGS) Hawaiian Volcano Observatory (HVO).
Activity during January 2023. Small earthquake swarms were recorded on 2 January 2023; increased seismicity and changes in the pattern of deformation were noted on the morning of 5 January. At around 1500 both the rate of deformation and seismicity drastically increased, which suggested magma movement toward the surface. HVO raised the Volcano Alert Level (VAL) to Watch (the second highest level on a four-level scale) and the Aviation Color Code (ACC) to Orange (the second highest color on a four-color scale) at 1520.
Multiple lava fountains and lava effusions from vents in the central eastern portion of the Halema’uma’u crater began on 5 January around 0434; activity was confined to the eastern half of the crater and within the basin of the western half of the crater, which was the focus of the eruption in 2021-2022 (figure 525). Incandescence was visible in webcam images at 1634 on 5 January, prompting HVO to raise the VAL to Warning (the highest level on a four-level scale) and the ACC to Red (the highest color on a four-color scale). Lava fountains initially rose as high as 50 m above the vent at the onset of the eruption (figure 526) but then declined to a more consistent 5-6 m height in the proceeding days. By 1930 that same day, lava had covered most of the crater floor (an area of about 1,200,000 m2) and the lava lake had a depth of 10 m. A higher-elevation island that formed during the initial phase of the December 2020 eruption remained exposed, appearing darker in images, along with a ring of older lava around the lava lake that was active prior to December 2022. Overnight during 5-6 January the lava fountains continued to rise 5 m high, and the lava effusion rate had slowed.
On 6 January at 0815 HVO lowered the VAL to Watch and the ACC to Orange due to the declining effusion rates. Sulfur dioxide emission rates ranged from 3,000-12,500 tonnes per day (t/d), the highest value of which was recorded on 6 January. Lava continued to erupt from the vents during 6-8 January, although the footprint of the active area had shrunk; a similar progression has been commonly observed during the early stages of recent eruptions at Halema’uma’u. On 9 January HVO reported one dominant lava fountain rising 6-7 m high in the E half of the crater. Lava flows built up the margins of the lake, causing the lake to be perched. On 10 January the eastern lava lake had an area of approximately 120,000 m2 that increased to 250,000 m2 by 17 January. During 13-31 January several small overflows occurred along the margins of the E lake. A smaller area of lava was active within the basin in the W half of the crater that had been the focus of activity during 2021-2022. On 19 January just after 0200 a small ooze-out was observed on the crater’s W edge.
Activity during February 2023. Activity continued in the E part of Halema’uma’u crater, as well as in a smaller basin in the W part of the 2021-2022 lava lake (figure 527). The E lava lake contained a single lava fountain and frequent overflows. HVO reported that during the morning of 1 February the large E lava lake began to cool and crust over in the center of the lake; two smaller areas of lava were observed on the N and S sides by the afternoon. The dominant lava fountain located in the S part of the lava lake paused for roughly 45 minutes at 2315 and resumed by midnight, rising 1-2 m. At 0100 on 2 February lava from the S part was effusing across the entire E lava lake area, covering the crusted over portion in the center of the lake and continuing across the majority of the previously measured 250,000 m2 by 0400. A small lava pond near the E lake produced an overflow around 0716 on 2 February. On 3 February some lava crust began to form against the N and E levees, which defined the 250,000 m2 eastern lava lake. The small S lava fountain remained active, rising 1-6 m high during 3-9 February; around 0400 on 5 February occasional bursts doubled the height of the lava fountain.
A large breakout occurred overnight during 2100 on 4 February to 0900 on 5 February on the N part of the crater floor, equal to or slightly larger in size than the E lava lake. A second, smaller lava fountain appeared in the same area of the E lava lake between 0300 and 0700 on 5 February and was temporarily active. This large breakout continued until 7 February. A small, brief breakout was reported in the S of the E lava lake around midnight on 7 February. In the W lake, as well as the smaller lava pond in the central portion of the crater floor, contained several overflows during 7-10 February and intermittent fountaining. Activity at the S small lava pond and the small S lava fountain within the E lake declined during 9-10 February. The lava pond in the central portion of the crater floor had nearly continuous, expansive flows during 10-13 February; channels from the small central lava pond seemed to flow into the larger E lake. During 13-18 February a small lava fountain was observed in the small lava pond in the central portion of the crater floor. Continuous overflows persisted during this time.
Activity in the eastern and central lakes began to decline in the late afternoon of 17 February. By 18 February HVO reported that the lava effusions had significantly declined, and that the eastern and central lakes were no longer erupting. The W lake in the basin remained active but at a greatly reduced level that continued to decline. HVO reported that this decrease in activity is attributed to notable deflationary tilt that began early on the morning of 17 February and lasted until early 19 February. By 19 February the W lake was mostly crusted over although some weak lava flows remained, which continued through 28 February. The sulfur dioxide emission rates ranged 250-2,800 t/d, the highest value of which was recorded on 6 February.
Activity during March 2023. The summit eruption at Halema’uma’u crater continued at greatly reduced levels compared to the previous two months. The E and central vents stopped effusing lava, and the W lava lake remained active with weak lava flows; the lake was mostly crusted over, although slowly circulating lava intermittently overturned the crust. By 6 March the lava lake in the W basin had stopped because the entire surface was crusted over. The only apparent surface eruptive activity during 5-6 March was minor ooze-outs of lava onto the crater floor, which had stopped by 7 March. Several hornitos on the crater floor still glowed through 12 March according to overnight webcam images, but they did not erupt any lava. A small ooze-out of lava was observed just after 1830 in the W lava lake on 8 March, which diminished overnight. The sulfur dioxide emission rate ranged from 155-321 t/d on 21 March. The VAL was lowered to Advisory, and the ACC was lowered to Yellow (the second lowest on a four-color scale) on 23 March due to a pause in the eruption since 7 March.
Activity during April-May 2023. The eruption at Halema’uma’u crater was paused; no lava effusions were visible on the crater floor. Sulfur dioxide emission rates ranged from 75-185 t/d, the highest of which was measured on 22 April. During May and June summit seismicity was elevated compared to seismicity that preceded the activity during January.
Activity during June 2023. Earthquake activity and changes in the patterns of ground deformation beneath the summit began during the evening of 6 June. The data indicated magma movement toward the surface, prompting HVO to raise the VAL to Watch and the ACC to Orange. At about 0444 on 7 June incandescence in Halema’uma’u crater was visible in webcam images, indicating that a new eruption had begun. HVO raised the VAL to Warning and the ACC to Red (the highest color on a four-color scale). Lava flowed from fissures that had opened on the crater floor. Multiple minor lava fountains were active in the central E portion of the Halema’uma’u crater, and one vent opened on the W wall of the caldera (figure 528). The eruptive vent on the SW wall of the crater continued to effuse into the lava lake in the far SW part of the crater (figure 529). The largest lava fountain consistently rose 15 m high; during the early phase of the eruption, fountain bursts rose as high as 60 m. Lava flows inundated much of the crater floor and added about 6 m depth of new lava within a few hours, covering approximately 10,000 m2. By 0800 on 7 June lava filled the crater floor to a depth of about 10 m. During 0800-0900 the sulfur dioxide emission rate was about 65,000 t/d. Residents of Pahala (30 km downwind of the summit) reported minor deposits of fine, gritty ash and Pele’s hair. A small spatter cone had formed at the vent on the SW wall by midday, and lava from the cone was flowing into the active lava lake. Fountain heights had decreased from the onset of the eruption and were 4-9 m high by 1600, with occasional higher bursts. Inflation switched to deflation and summit earthquake activity greatly diminished shortly after the eruption onset.
At 0837 on 8 June HVO lowered the VAL to Watch and the ACC to Orange because the initial high effusion rates had declined, and no infrastructure was threatened. The surface of the lava lake had dropped by about 2 m, likely due to gas loss by the morning of 8 June. The drop left a wall of cooled lava around the margins of the crater floor. Lava fountain heights decreased during 8-9 June but continued to rise to 10 m high. Active lava and vents covered much of the W half of Halema’uma’u crater in a broad, horseshoe-shape around a central, uplifted area (figure 530). The preliminary average effusion rate for the first 24 hours of the eruption was about 150 cubic meters per second, though the estimate did not account for vesiculated lava and variations in crater floor topography. The effusion rate during the very earliest phases of the eruption appeared significantly higher than the previous three summit eruptions based on the rapid coverage of the entire crater floor. An active lava lake, also referred to as the “western lava lake” was centered within the uplifted area and was fed by a vent in the NE corner. Two small active lava lakes were located just SE from the W lava lake and in the E portion of the crater floor.
During 8-9 June the lava in the central lava lake had a thickness of approximately 1.5 m, based on measurements from a laser rangefinder. During 9-12 June the height of the lava fountains decreased to 9 m high. HVO reported that the previously active lava lake in the E part of the crater appeared stagnant during 10-11 June. The surface of the W lake rose approximately 1 m overnight during 11-12 June, likely due to the construction of a levee around it. Only a few small fountains were active during 12-13 June; the extent of the active lava had retreated so that all activity was concentrated in the SW and central parts of Halema’uma’u crater. Intermittent spattering from the vent on the SW wall was visible in overnight webcam images during 13-18 June. On the morning of 14 June a weak lava effusion originated from near the western eruptive vent, but by 15 June there were no signs of continued activity. HVO reported that other eruptive vents in the SW lava lake had stopped during this time, following several days of waning activity; lava filled the lake by about 0.5 m. Lava circulation continued in the central lake and no active lava was reported in the northern or eastern parts of the crater. Around 0800 on 15 June the top of the SW wall spatter cone collapsed, which was followed by renewed and constant spattering from the top vent and a change in activity from the base vent; several new lava flows effused from the top of the cone, as well as from the pre-existing tube-fed flow from its base. Accumulation of lava on the floor resulted in a drop of the central basin relative to the crater floor, allowing several overflows from the SW lava lake to cascade into the basin during the night of 15 June into the morning of 16 June.
Renewed lava fountaining was reported at the eruptive vent on the SW side of the crater during 16-19 June, which effused lava into the far SW part of the crater. This activity was described as vigorous during midday on 16 June; a group of observatory geologists estimated that the lava was consistently ejected at least 10 m high, with some spatter ejected even higher and farther. Deposits from the fountain further heightened and widened the spatter cone built around the original eruptive vent in the lower section of the crater wall. Multiple lava flows from the base of the cone were fed into the SW lava lake and onto the southwestern-most block from the 2018 collapse within Halema’uma’u on 17 June (figure 531); by 18 June they focused into a single flow feeding into the SW lava lake. On the morning of 19 June a second lava flow from the base of the eruptive cone advanced into the SW lava lake.
Around 1600 on 19 June there was a rapid decline in lava fountaining and effusion at the eruptive vent on the SW side of the crater; vent activity had been vigorous up to that point (figure 532). Circulation in the lava lake also slowed, and the lava lake surface dropped by several meters. Overnight webcam images showed some previously eruptive lava still flowing onto the crater floor, which continued until those flows began to cool. By 21 June no lava was erupting in Halema’uma’u crater. Overnight webcam images during 29-30 June showed some incandescence from previously erupted lava flows as they continued to cool. Seismicity in the crater declined to low levels. Sulfur dioxide emission rates ranged 160-21,000 t/d throughout the month, the highest measurement of which was recorded on 8 June. On 30 June the VAL was lowered to Advisory (the second level on a four-level scale) and the ACC was lowered to Yellow. Gradual inflation was detected at summit tiltmeters during 19-30 June.
Activity during July-August 2023. During July, the eruption paused; no lava was erupting in Halema’uma’u crater. Nighttime webcam images showed some incandescence from previously erupted lava as it continued to cool on the crater floor. During the week of 14 August HVO reported that the rate in seismicity increased, with 467 earthquakes of Mw 3.2 and smaller occurring. Sulfur dioxide emission rates remained low, ranging from 75-86 t/d, the highest of which was recorded on 10 and 15 August. On 15 August beginning at 0730 and lasting for several hours, a swarm of approximately 50 earthquakes were detected at a depth of 2-3 km below the surface and about 2 km long directly S of Halema’uma’u crater. HVO reported that this was likely due to magma movement in the S caldera region. During 0130-0500 and 1700-2100 on 21 August two small earthquake swarms of approximately 20 and 25 earthquakes, respectively, occurred at the same location and at similar depths. Another swarm of 50 earthquakes were recorded during 0430-0830 on 23 August. Elevated seismicity continued in the S area through the end of the month.
Activity during September 2023. Elevated seismicity persisted in the S summit with occasional small, brief seismic swarms. Sulfur dioxide measurements were relatively low and were 70 t/d on 8 September. About 150 earthquakes occurred during 9-10 September, and tiltmeter and Global Positioning System (GPS) data showed inflation in the S portion of the crater.
At 0252 on 10 September HVO raised the VAL to Watch and the ACC to Orange due to increased earthquake activity and changes in ground deformation that indicated magma moving toward the surface. At 1515 the summit eruption resumed in the E part of the caldera based on field reports and webcam images. Fissures opened on the crater floor and produced multiple minor lava fountains and flows (figure 533). The VAL and ACC were raised to Warning and Red, respectively. Gas-and-steam plumes rose from the fissures and drifted downwind. A line of eruptive vents stretched approximately 1.4 km from the E part of the crater into the E wall of the down dropped block by 1900. The lava fountains at the onset of the eruption had an estimated 50 m height, which later rose 20-25 m high. Lava erupted from fissures on the down dropped block and expanded W toward Halema’uma’u crater. Data from a laser rangefinder recorded about 2.5 m thick of new lava added to the W part of the crater. Sulfur dioxide emissions were elevated in the eruptive area during 1600-1500 on 10 September, measuring at least 100,000 t/d.
At 0810 on 11 September HVO lowered the VAL and ACC back to Watch and Orange due to the style of eruption and the fissure location had stabilized. The initial extremely high effusion rates had declined (but remained at high levels) and no infrastructure was threatened. An eruption plume, mainly comprised of sulfur dioxide and particulates, rose as high as 3 km altitude. Several lava fountains were active on the W side of the down dropped block during 11-15 September, while the easternmost vents on the down dropped block and the westernmost vents in the crater became inactive on 11 September (figure 534). The remaining vents spanned approximately 750 m and trended roughly E-W. The fed channelized lava effusions flowed N and W into Halema’uma’u. The E rim of the crater was buried by new lava flows; pahoehoe lava flows covered most of the crater floor except areas of higher elevation in the SW part of the crater. The W part of the crater filled about 5 m since the start of the eruption, according to data from a laser rangefinder during 11-12 September. Lava fountaining continued, rising as high as 15 m by the morning of 12 September. During the morning of 13 September active lava flows were moving on the N and E parts of the crater. The area N of the eruptive vents that had active lava on its surface became perched and was about 3 m higher than the surrounding ground surface. By the morning of 14 September active lava was flowing on the W part of the down dropped block and the NE parts of the crater. The distances of the active flows progressively decreased. Spatter had accumulated on the S (downwind) side of the vents, forming ramparts about 20 m high.
Vigorous spattering was restricted to the westernmost large spatter cone with fountains rising 10-15 m high. Minor spattering occurred within the cone to the E of the main cone, but HVO noted that the fountains remained mostly below the rim of the cone. Lava continued to effuse from these cones and likely from several others as well, traveled N and W, confined to the W part of the down-dropped block and the NE parts of Halema’uma’u. Numerous ooze-outs of lava were visible over other parts of the crater floor at night. Laser range-finder measurements taken of the W part of the crater during 14-15 September showed that lava filled the crater by 10 m since the start of the eruption. Sulfur dioxide emissions remained elevated after the onset of the eruption, ranging 20,000-190,000 t/d during the eruption activity, the highest of which occurred on 10 September.
Field crews observed the eruptive activity on 15 September; they reported a notable decrease or stop in activity at several vents. Webcam images showed little to no fountaining since 0700 on 16 September, though intermittent spattering continued from the westernmost large cone throughout the night of 15-16 September. Thermal images showed that lava continued to flow onto the crater floor. On 16 September HVO reported that the eruption stopped around 1200 and that there was no observable activity anywhere overnight or on the morning of 17 September. HVO field crews reported that active lava was no longer flowing onto Halema’uma’u crater floor and was restricted to a ponded area N of the vents on the down dropped block. They reported that spattering stopped around 1115 on 16 September. Nighttime webcam images showed some incandescence on the crater floor as lava continued to cool. Field observations supported by geophysical data showed that eruptive tremor in the summit region decreased over 15-16 September and returned to pre-eruption levels by 1700 on 16 September. Sulfur dioxide emissions were measured at a rate of 800 t/d on 16 September while the eruption was waning, and 200 t/d on 17 September, which were markedly lower compared to measurements taken the previous week of 20,000-190,000 t/d.
Geologic Background. Kilauea overlaps the E flank of the massive Mauna Loa shield volcano in the island of Hawaii. Eruptions are prominent in Polynesian legends; written documentation since 1820 records frequent summit and flank lava flow eruptions interspersed with periods of long-term lava lake activity at Halemaumau crater in the summit caldera until 1924. The 3 x 5 km caldera was formed in several stages about 1,500 years ago and during the 18th century; eruptions have also originated from the lengthy East and Southwest rift zones, which extend to the ocean in both directions. About 90% of the surface of the basaltic shield volcano is formed of lava flows less than about 1,100 years old; 70% of the surface is younger than 600 years. The long-term eruption from the East rift zone between 1983 and 2018 produced lava flows covering more than 100 km2, destroyed hundreds of houses, and added new coastline.
Information Contacts: Hawaiian Volcano Observatory (HVO), U.S. Geological Survey, PO Box 51, Hawai'i National Park, HI 96718, USA (URL: http://hvo.wr.usgs.gov/).
Tinakula (Solomon Islands) — December 2023 Cite this Report
Tinakula
Solomon Islands
10.386°S, 165.804°E; summit elev. 796 m
All times are local (unless otherwise noted)
Continued lava flows and thermal activity during June through November 2023
Tinakula is a remote 3.5 km-wide island in the Solomon Islands, located 640 km ESE of the capital, Honiara. The current eruption period began in December 2018 and has more recently been characterized by intermittent lava flows and thermal activity (BGVN 48:06). This report covers similar activity during June through November 2023 using satellite data.
During clear weather days (20 July, 23 September, 23 October, and 12 November), infrared satellite imagery showed lava flows that mainly affected the W side of the island and were sometimes accompanied by gas-and-steam emissions (figure 54). The flow appeared more intense during July and September compared to October and November. According to the MODVOLC thermal alerts, there were a total of eight anomalies detected on 19 and 21 July, 28 and 30 October, and 16 November. Infrared MODIS satellite data processed by MIROVA (Middle InfraRed Observation of Volcanic Activity) detected a small cluster of thermal activity occurring during late July, followed by two anomalies during August, two during September, five during October, and five during November (figure 55).
Geologic Background. The small 3.5-km-wide island of Tinakula is the exposed summit of a massive stratovolcano at the NW end of the Santa Cruz islands. It has a breached summit crater that extends from the summit to below sea level. Landslides enlarged this scarp in 1965, creating an embayment on the NW coast. The Mendana cone is located on the SE side. The dominantly andesitic volcano has frequently been observed in eruption since the era of Spanish exploration began in 1595. In about 1840, an explosive eruption apparently produced pyroclastic flows that swept all sides of the island, killing its inhabitants. Recorded eruptions have frequently originated from a cone constructed within the large breached crater. These have left the upper flanks and the steep apron of lava flows and volcaniclastic debris within the breach unvegetated.
Information Contacts: MIROVA (Middle InfraRed Observation of Volcanic Activity), a collaborative project between the Universities of Turin and Florence (Italy) supported by the Centre for Volcanic Risk of the Italian Civil Protection Department (URL: http://www.mirovaweb.it/); Hawai'i Institute of Geophysics and Planetology (HIGP) - MODVOLC Thermal Alerts System, School of Ocean and Earth Science and Technology (SOEST), Univ. of Hawai'i, 2525 Correa Road, Honolulu, HI 96822, USA (URL: http://modis.higp.hawaii.edu/); Copernicus Browser, Copernicus Data Space Ecosystem, European Space Agency (URL: https://dataspace.copernicus.eu/browser/).
Search Bulletin Archive by Publication Date
Select a month and year from the drop-downs and click "Show Issue" to have that issue displayed in this tab.
The default month and year is the latest issue available.
Bulletin of the Global Volcanism Network - Volume 30, Number 11 (November 2005)
Ambae (Vanuatu)
New eruption begins on 27 November 2005 and builds cone in crater lake
Bezymianny (Russia)
Ash plumes to 10 km altitude in 2005, hot avalanches from the dome
Fournaise, Piton de la (France)
Eruption on 5 October follows four months of heightened activity
Fukutoku-Oka-no-Ba (Japan)
July 2005 submarine eruption; discolored water and debris
Karthala (Union of the Comoros)
Eruption on 24 November 2005; big evacuation and one fatality
Karymsky (Russia)
Explosions continued during December 2004-June 2005
Krummel-Garbuna-Welcker (Papua New Guinea)
First historically witnessed eruption in October 2005
Langila (Papua New Guinea)
Active during August-September, decreasing during October-November
Montagu Island (United Kingdom)
N-coast delta grew during 14 September-4 October 2005
Ambae
Vanuatu
15.389°S, 167.835°E; summit elev. 1496 m
All times are local (unless otherwise noted)
New eruption begins on 27 November 2005 and builds cone in crater lake
A new eruption began on 27 November 2005 when vapor plumes and ash columns were observed originating from Lake Voui, a crater lake at the summit of Aoba (figure 13). The volcano is also referred to locally as Manaro or Lombenben. Prior to this activity, the most recent reported volcanism consisted of phreatic explosions from the lake during March 1995 (BGVN 20:01, 20:02, and 20:08). Bathymetry conducted by ORSTOM in 1996 showed that the vent feeding gases and magma into Lake Voui had a depth of about 150 m and a diameter of about 50 m. The volume of water in the lake (1 x 2 km) totals some 40 million cubic meters, with a mean pH of 1.8. Lake Voui and the Manaro Ngoro summit explosion craters and cones formed ~ 420 years ago (figure 14). Lake Manaro was formed by the accumulation of water in a low-lying area of the Manaro summit caldera.
Starting on 3 December a team of volcanologists from the Vanuatu Department of Geology, Mines, and Water Resources (DGMWR), the French Institut de recherche pour le développement (IRD), the New Zealand Institute of Geological & Nuclear Sciences (GNS), and New Zealand's Massey University began collaborating on observations and monitoring. The amplitude of tremor recorded by DGMWR instruments from 30 November to 3 December was lower than during the March 1995 activity.
Scientists who visited the lake on 4 and 5 December (figures 15 and 16) observed a similar style of eruptive activity on both days, but some individual explosions appeared larger on the 5th. It was not possible to reach the lake to collect a water sample. There appeared to be two active vents, side by side, in the lake. One was producing eruptions of mud, rocks, and water, and the other appeared to be the source of the large continuous steam plume rising above the crater; the plume did not contain ash. There were no reports of ash falling on the island since the start of the eruptions the previous week. The team estimated that the cone being built in the lake, at an estimated height of more than 20 m on the 4th, was about 70% complete around the active vents, and grew 5-10% higher between 4 and 5 December. Continuous tremor was recorded during this time, and the level of eruptive and seismic activity seemed to be fairly stable.
Cloud cover and rain prevented a visit to the lake on 6 and 7 December. Earthquake recorders from the GNS were installed at the Provincial Centre at Saratamata, the Longana Peoples Centre (Lovonda village), and at Tahamamavi ("place of warm sea") (figure 17). On 7 December, a final recorder from the IRD was installed near Nduidui on the SW side of the island. Over 6-7 December continuous moderate-level volcanic tremor was recorded, with no significant change in its level; there was no other significant seismic activity.
On 8 December, the group noted that small-scale eruptions continued in Lake Voui, building a volcanic cone in the lake and producing a tall (2.4-3.0 km) steam-and-gas plume. Afternoon observations showed the cone growing taller and surrounding three sides of the active vents. However, the cone was not complete on its E side, allowing lake water to react with the rising magma. Though the resulting explosions became further apart and slightly larger, the total energy involved appeared similar to 4-5 December. There continued to be two active vents, one producing the small explosions, and the second the steam and gas emissions. Seismic recorders continued to record volcanic tremor, but very few local earthquakes. No volcanic ash was present in the plume. The eruption had no immediate effect beyond Lake Voui. The Volcanic Alert Level remained at Level 2. The level of seismic activity seemed to be stable. No other significant seismic activity was recorded.
While departing by air on the evening of 8 December, the group clearly saw the active vents (figure 18). The cone had grown to the W, joining and partly burying one of the old islands. All eruptions occurred from inside the cone. The largest individual eruptions threw material 150-200 m above the lake. There was also a gas-and-steam vent present within the cone, W of the other vent. The level of the lake appeared unchanged.
On 10 December, the small-scale volcanic eruption continued from active vents within the summit crater lake (Lake Voui). Molten material entered the crater lake and reacted with the water to produce small explosive eruptions and a plume of steam and gas. The eruption built a cone around the active vents, enclosing them on three sides, forming an island about 200 m across and 50-60 m high. There were two vents, one erupting water, rocks and mud, and the other producing a tall column of steam and gas. The eruption had little effect outside the crater lake (minor ashfall occurred only in the first three days of the eruption). Five days of seismic recordings show a moderate level of seismic activity (mostly volcanic tremor).No change was noted in the level of Lake Voui, and there was also no evidence of ground uplift or fractures near the lake.
Sulfur dioxide measurements. SO2 data collected using a DOAS spectrometer on the Islander planes of Unity Air Lines (3 December) and Air Vanuatu (5 December). On 3 December the flux was 32.6-33.6 kg/s (~ 2,900 metric tons/day). By 5 December the flux had decreased about 25%, to 24.7-26.4 kg/s (~ 2,300 metric tons/day). SO2 was clearly detected by the OMI (ozone monitoring instrument) sensor on the NASA Aura satellite (figure 19). One measurement of the volcanic gas output on 10 December showed a moderate level of sulfur dioxide (SO2) gas (about 2,000 t/d) from the active vents.
Lake temperatures. A monitoring station for continuous measurements of water temperature at Lake Voui was installed in October 1998. The station used a satellite ARGOS transmission system and recorded the last heating episode of 2001 (figure 20), but failed after three years due to the harsh acid environment. ASTER thermal infrared images can also be used for monitoring lake surface temperatures, and Aoba has a freshwater lake (Manaro Lakua) which can be used to remove the seasonal/diurnal variations in atmospheric temperatures. Unfortunately, the top of the volcano is frequently covered by clouds and few ASTER images are exploitable. The most recent ASTER image clearly showing both lakes was collected on 9 July 2005. Difference in temperatures between lake Voui and Lakua was 4.0°C, slightly above background values during 2002-2003. Maximum background temperatures measured with ASTER during the September 2002-October 2005 were at 26.3°C. The last ASTER images before the eruption, on 5 October 2005, showed no unusual temperatures at Lake Voui.
MODIS satellites have a more frequent coverage than ASTER but their spatial resolution is only 1 km. The surface area of Lake Voui (2.1 km2) is too small for an accurate measurement of lake temperature, but MODIS can detect rough temperature changes or an increased thermal anomaly. The MODIS pixel footprint is about 1 km along track and 2 km across track, so the measured temperatures are a mixed signal corresponding to the lake and some signal from the adjacent tropical forest (much colder than the lake at night at this elevation). MODIS SST imagery showed a strong thermal anomaly on 21 November 2005 (figure 20). Approximate lake temperatures, likely a minimum, were 30.4°C on 20 November and 29.5°C (Terra)/ 31.4°C (Aqua) on 21 November. On 25 November the temperature jumped to about 42°C.
Reference. Cronin, S.J., Gaylord, D.R., Charley, D., Alloway, B.V., Wallez, S., and Esau, J.W., 2004, Participatory methods of incorporating scientific with traditional knowledge for volcanic hazard management on Ambae Island, Vanuatu: Bulletin of Volcanology, v. 66, p. 652-668. (URL: http://www.proventionconsortium.org/files/tools_CRA/CS/Vanuatu.pdf)
Geologic Background. The island of Ambae, also known as Aoba, is a massive 2,500 km3 basaltic shield that is the most voluminous volcano of the New Hebrides archipelago. A pronounced NE-SW-trending rift zone with numerous scoria cones gives the 16 x 38 km island an elongated form. A broad pyroclastic cone containing three crater lakes (Manaro Ngoru, Voui, and Manaro Lakua) is located at the summit within the youngest of at least two nested calderas, the largest of which is 6 km in diameter. That large central edifice is also called Manaro Voui or Lombenben volcano. Post-caldera explosive eruptions formed the summit craters about 360 years ago. A tuff cone was constructed within Lake Voui (or Vui) about 60 years later. The latest known flank eruption, about 300 years ago, destroyed the population of the Nduindui area near the western coast.
Information Contacts: Esline Garaebiti, Douglas Charley, Morris Harrison, and Sandrine Wallez, Department of Geology, Mines, and Water Resources (DGMWR), Port-Vila, Vanuatu; Michel Lardy, Philipson Bani, Jean-Lambert Join, and Claude Robin, Institut de recherche pour le développement (IRD), BP A5, 98 848 Nouméa CEDEX, New Caledonia (URL: http://www.suds-en-ligne.ird.fr/fr/volcan/vanu_eng/aoba1.htm); Brad Scott and Steve Sherburn, Institute of Geological & Nuclear Sciences (GNS), Wairakei Research Center, Taupo, New Zealand; Shane Cronin, Institute of Natural Resources, Massey University, Palmerston, New Zealand; Alain Bernard, IAVCEI Commission on Volcanic Lakes, Université Libre de Bruxelles, Brussels, Belgium (URL: http://www.ulb.ac.be/sciences/cvl/aoba/Ambae1.html); NASA Earth Observatory (URL: http://earthobservatory.nasa.gov/); United Nations, Office for the Coordination of Humanitarian Affairs (OCHA), Regional Office for Asia and the Pacific.
Bezymianny (Russia) — November 2005 Cite this Report
Bezymianny
Russia
55.972°N, 160.595°E; summit elev. 2882 m
All times are local (unless otherwise noted)
Ash plumes to 10 km altitude in 2005, hot avalanches from the dome
This report mentions a series of noteworthy events during mid-January through late December 2005. On 11 January 2005 an explosive eruption was inferred from seismic data; it was thought to have produced an ash column to 8-10 km altitude (BGVN 30:03). Seismic activity returned to background levels following this eruption and the Concern Color Code was lowered from Orange to Yellow on 14 January and remained at Yellow until the end of November 2005.
On 6-7 May 2005, weak gas-and-steam plumes were observed, but clouds frequently obscured the volcano. Thermal anomalies at the dome were detected in satellite imagery on 6-8, 10, and 12 May.
On 30 November, KVERT reported that seismicity at Bezymianny had increased during the previous two weeks. Seismic signals indicated that hot avalanches from the lava dome had begun on 29 November and the intensity of the thermal anomaly at the dome had increased. Strong fumarolic activity was captured on video of 29 November.
An explosive eruption began on 30 November at 2400 according to seismic data. Ash plumes were subsequently seen in satellite imagery extending SW at an altitude of about 6 km. The Concern Color Code was raised to Orange.
After the eruption on 30 November, seismic activity at the volcano decreased to background levels. On 2 December the Concern Color Code was reduced from Orange to Yellow. On 9 December, KVERT reported that based on past experience with Bezymianny, a viscous lava flow was probably active at the summit lava dome and there were no indications that an explosive eruption was imminent.
A gas-steam plume was visible on 9-11 December and fumarolic activity at the lava dome continued through December. Thermal anomalies were registered at the dome on 9, 17, 21, 24-25, and 27-29 December.
Geologic Background. The modern Bezymianny, much smaller than its massive neighbors Kamen and Kliuchevskoi on the Kamchatka Peninsula, was formed about 4,700 years ago over a late-Pleistocene lava-dome complex and an edifice built about 11,000-7,000 years ago. Three periods of intensified activity have occurred during the past 3,000 years. The latest period, which was preceded by a 1,000-year quiescence, began with the dramatic 1955-56 eruption. This eruption, similar to that of St. Helens in 1980, produced a large open crater that was formed by collapse of the summit and an associated lateral blast. Subsequent episodic but ongoing lava-dome growth, accompanied by intermittent explosive activity and pyroclastic flows, has largely filled the 1956 crater.
Information Contacts: Olga Girina, Kamchatka Volcanic Eruptions Response Team (KVERT), a cooperative program of the Institute of Volcanic Geology and Geochemistry, Far East Division, Russian Academy of Sciences, Piip Ave. 9, Petropavlovsk-Kamchatsky, 683006, Russia, the Kamchatka Experimental and Methodical Seismological Department (KEMSD), GS RAS (Russia), and the Alaska Volcano Observatory (USA); Alaska Volcano Observatory (AVO), a cooperative program of the U.S. Geological Survey, 4200 University Drive, Anchorage, AK 99508-4667, USA (URL: http://www.avo.alaska.edu/), the Geophysical Institute, University of Alaska, PO Box 757320, Fairbanks, AK 99775-7320, USA, and the Alaska Division of Geological and Geophysical Surveys, 794 University Ave., Suite 200, Fairbanks, AK 99709, USA.
Piton de la Fournaise (France) — November 2005 Cite this Report
Piton de la Fournaise
France
21.244°S, 55.708°E; summit elev. 2632 m
All times are local (unless otherwise noted)
Eruption on 5 October follows four months of heightened activity
Increased seismicity and ground deformation from late June 2004 through 9 August preceded the third eruption of 2004, which started on 13 August (BGVN 29:12). During that eruption ~ 750 m of National Road 2 was overrun by lava. Eruptive activity ceased on the morning of 7 September 2004 (BGVN 29:12). Eruptions occurred again during February and October-December 2005.
Eruption during February 2005. A new period of heightened seismicity began on 17 February 2005 around 1300, consisting of about 100 seismic events within 90 minutes. After that, the number of events decreased, but recommenced at 1638 with several hundred events. Strong deformation was recorded at the same time by tiltmeters and the extensometer network. Eruption tremor began around 2035, becoming strong at 2050. The eruption site seemed to be situated close to Nez Coupé de Sainte Rose (on the N side of the volcano), and lava flows were observed in the Grand Brûlé area.
After a period of relative quiet on 19 February, eruption tremor increased to high levels again on 21 February. Two eruption sites were active: the principal vent at 1,600-m elevation above the Plaine des Osmondes, and a vent at about 1,200-m elevation in the Plaine des Osmondes. The principal vent released a volcanic plume and several pahoehoe lava flows, but no lava fountains were visible. The second vent also released a very fluid pahoehoe lava flow. The flows covered a large area within the Plaine des Osmondes, and smaller lava flows traveled to about 600-m elevation in the Grand Brûlé.
On 24 February, shallow seismicity began beneath Dolomieu crater. It increased over time and by 26 February, several hundreds of seismic events up to M 3 occurred. According to the Observatoire Volcanologique du Piton de la Fournaise (OVPDLF), these events may have indicated formation of a new pit crater within Dolomieu crater. On 24 February, visible signs of activity stopped within the Plaine des Osmondes, while eruption tremor slowly increased.
On the evening of 25 February, a lava flow from Plaine des Osmondes traveled down the Grandes Pentes, cutting the National Road on its way to the sea. The lava flow covered a distance of ~ 5 km in about 2 hours. At the same time, seismicity increased on the NE rift zone above Bois Blanc, and a new vent opened within the Trou de Sable on the N border of the caldera at 450-m elevation. This vents lava flow stopped about 100 m from the National Road.
Eruptions during October-December 2005. Another eruption started on 4 October 2005 at 1426 after 4 months of almost continuous inflation and increased seismicity. The eruption was immediately preceded by a 56-minute-long sequence of seismicity and strong summit inflation. A low-intensity eruption at Dolomieu crater produced pahoehoe lava flows that covered a small area of the western part of the crater.
Immediately after the end of the 4 October eruption at Dolomieu crater, the permanent GPS network and extensometer network continued to show strong surface deformation, which was a precursor for a new eruptive event. On 29 November 2005 at 0559 a seismic crisis began, and at 0625 tremor indicated the beginning of an eruption. A vent opened in the western part of Dolomieu crater and another vent opened on the N flank. Very little projected volcanic material was visible. A large, fast-moving lava flow traveled down the N flank in the direction of Piton Kapor. Inclement weather prohibited further observations. The Toulouse VAAC reported that ash from the eruption was not visible on satellite imagery.
Following the 29 November eruption, further summit inflation was recorded by the permanent GPS network. On 26 December at 1444 a seismic crisis started beneath Dolomieu crater. Within the next 2 hours seismic activity shifted to the NE, towards Nez Coupé de Sainte Rose. A first fissure opened at 1715 at the NE base of Piton de la Fournaise; at 2200 eruptive fissures opened in the caldera wall about 500 m E of Nez Coupé de Sainte Rose and lava flowed into the Plaine des Osmondes. By 28 December, eruptive activity was almost constant. An aa-type lava flow crossed the Grandes Brûlé and reached a point 3 km upslope from the national road.
Geologic Background. Piton de la Fournaise is a massive basaltic shield volcano on the French island of Réunion in the western Indian Ocean. Much of its more than 530,000-year history overlapped with eruptions of the deeply dissected Piton des Neiges shield volcano to the NW. Three scarps formed at about 250,000, 65,000, and less than 5,000 years ago by progressive eastward slumping, leaving caldera-sized embayments open to the E and SE. Numerous pyroclastic cones are present on the floor of the scarps and their outer flanks. Most recorded eruptions have originated from the summit and flanks of Dolomieu, a 400-m-high lava shield that has grown within the youngest scarp, which is about 9 km wide and about 13 km from the western wall to the ocean on the E side. More than 150 eruptions, most of which have produced fluid basaltic lava flows, have occurred since the 17th century. Only six eruptions, in 1708, 1774, 1776, 1800, 1977, and 1986, have originated from fissures outside the scarps.
Information Contacts: Thomas Staudacher, Observatoire Volcanologique du Piton de la Fournaise, Institut de Physique du Globe de Paris, 14 RN3 le 27 ème km, F-97418 La Plaine des Cafres, La Réunion, France (URL: http://www.ipgp.fr/fr/ovpf/observatoire-volcanologique-piton-de-fournaise); Toulouse Volcanic Ash Advisory Center (VAAC), Météo-France, 42 Avenue G. Coriolis, 31057 Toulouse Cedex, France (URL: http://www.meteo.fr/vaac/).
Fukutoku-Oka-no-Ba (Japan) — November 2005 Cite this Report
Fukutoku-Oka-no-Ba
Japan
24.285°N, 141.481°E; summit elev. -29 m
All times are local (unless otherwise noted)
July 2005 submarine eruption; discolored water and debris
Notice of Fukutoku-Okanoba unrest in 2005 first came to Bulletin editors from Olivier Hyvernaud, information that was amplified by the Japanese Meteorological Agency (JMA) Volcanic Activity Reports of July and October 2005. The JMA reports contain information from the Japanese Marine Defense Forces as well as the Marine Security and Safety Agency and the Tokyo Institute of Technology. In addition, a Japan Coast Guard website (see URL below) contains a more extensive (and yet untranslated) table on recent events at Fukutoku-Okanoba, which includes photos and videos of the July eruption. That table clearly illustrates activity both earlier and later than the 2-3 July eruption, and several other details not discussed here, including the observation of numerous large and steaming blocks floating on the ocean surface at mid-day on 3 July. Bulletin editors hope to decipher this table and include more details in a later report.
The last five Bulletin reports discussing or mentioning Fukutoku-Okanoba appeared in BGVN 22:01, 24:11, 24:12, 25:05, and 28:06 (1997-2003). Note that the last four cases were considered ambiguous and grouped along with reports under the heading "Acoustic signals in 1999-2000 from unknown source, Volcano Islands, Japan" and only the first case was listed under the volcano name). A 3-d view of the volcano and its setting appears as figure 5.
JMA reported that at about 1745 on 2 July 2005, a white plume was witnessed at Fukutoku-Okanoba. During an investigation at 1900 that same day, a white plume reached ~ 1 km above the sea surface. A photo taken from considerable distance was included in the JMA report, showing the plume, but the image's limited contrast has led to its exclusion here. In addition to the plume, other evidence for an eruption included debris on the sea surface. When seen on 2 July, the debris covered an area approximately 100 m wide and 300 m long.
JMA noted that 3 July aerial observations suggested that compared to the previous day, eruptive vigor and the height of the white plume had decreased. The key observation then was a zone of discolored seawater (figure 6).
JMA's report of 4 and 5 July aerial investigations noted the lack of a white vapor plume over the sea. In other words, the 2-3 July eruption had calmed, but fresh debris and seawater discoloration were still present. After that, aerial investigations on 15, 17, 20, and 21 July, again disclosed seawater discoloration, but not the presence of floating debris.
The Maritime Security and Safety Agency conducted an underwater topographical survey on 20-22 July 2005, the result of which was the discovery of two craters caused by the recent eruption. The results suggested that the topography just S of those craters was newly raised.
According to a 3 October aerial observer, the ocean surface near Fukutoku-Okanoba, then displayed a pale, blue-white discoloration, interpreted as indicative of volcanism. The area of discoloration extended ~ 300 m in length to the E and was ~ 50 m wide (N-S) at its widest point. However, in the surrounding area they saw no floating debris or plumes containing ash or steam. On 27 October, an aerial observation could not confirm the seawater discoloration.
Satellite data. M. Urai (2005) reported that three days after the 2 July 2005 eruption of Fukutoku-Okanoba, satellite remote sensing using ASTER (Advanced Spaceborne Thermal Emission and Reflection Radiometer) observed the discolored seawater and floating materials within 40 km of the submarine volcano. Some of this abstract follows.
"At the most dense discolored seawater area, reflectance of ASTER band 1 is 3% higher [than] the surrounding seawater. The floating materials are similar in ASTER VNIR [Very Near-Infrared Radiometer] reflectance spectra to clouds, however, the floating materials can be separated from clouds using their shape and stereo image features. The extensions of discolored seawater area and floating material detected by ASTER were 6.34 km2 and 1.14 km2, respectively. It is possible to estimate the scale of [a] submarine eruption using the quantitative data derived from satellite remote sensing."
Distant hydrophones. Robert Dziak and Haru Matsumoto monitor N Pacific volcano seismicity with the National Oceanic and Atmospheric Agency/Pacific Marine Environmental Laboratory (NOAA/PMEL). They initially learned of the eruption via the internet. Regarding the 2 July eruption, Dziak wrote to the Bulletin staff on 22 November 2005. Some of his messages follow.
". . . the [N] Pacific hydrophone array we use recorded seismicity during the Fukutoku-Okanoba eruption near Iwo Jima. I was aware of the eruption at the time [mid 2005] thanks to Haru [Matsumoto; he designed and built the instruments used there to record the T-wave events] forwarding a news image of the discolored water. Despite being only able to roughly locate the seismicity since it is way west of our array, I am pretty sure Fukutoku-Okanoba was the source because the arrival azimuths and timing of the signals were a match. The last earthquake activity we recorded from this area occurred on 25 September [2005] . . .. A few years ago I was contacting you [Smithsonian Institution] about our recording of harmonic tremor from a source in the Volcano Islands. The conclusion I published in JGR [Dziak and Fox, 2002] was that either Fukutoku-Okanoba or Funka-asane ([N] of Iwo Jima) was the probable source because of a history of submarine volcanic activity at both volcanoes. We have still been recording this tremor intermittently over the last few years and another pulse of it occurred during the Fukutoku-Okanoba eruption on July 2, 2005. The last occurrence was on August 22.
According to an Email from Dziak on 23 November 2005, "...I think the tremor is coming from [Fukutoku-Okanoba or Funka-asane]. I was only able to get synchronous data from the French Polynesian seismic net (Hyvernaud). They confirmed the signals but it did not help much with location because they were so far away. My thought is the source of earthquakes and tremor from these submarine volcanoes is at an ocean depth within the sound channel. This allows for very efficient seismic-acoustic coupling and acoustic propagation throughout the Pacific ocean basin."
References. Dziak, R.P., and Fox, C.G., 2002, Evidence of harmonic tremor from a submarine volcano detected across the Pacific Ocean basin: Journal of Geophysical Research, v. 107(B5), p. 2085; doi 10.1029/2001JB0001772085.
Kato, Y., 1988, Gray pumices drifted from Fukutoku-oka-no-ba to the Ryukyu Islands: Bulletin of the Volcanological Society of Japan, Second Series, v. 33, p. 21-30.
Ossaka, J., Mitsuno, C., Shibata, T., Matsuda, T., Hirabayashi, J., Tsuchide, M., Sakurai, M., and Sato, H., 1986, The 1986 submarine eruption of Fukutoku-okanoba, Part 2. Volcanic ejectas: Bull. Vol. Soc. Japan, v. 31, p. 134-135.
Urai, M., 2005, Monitoring submarine volcano with satellite remote sensing: Eos Trans, AGU, v. 86(52), Fall Meet. Suppl., Abstract 611A-1176.
Geologic Background. Fukutoku-Oka-no-ba is a submarine volcano located 5 km NE of the island of Minami-Ioto. Water discoloration is frequently observed, and several ephemeral islands have formed in the 20th century. The first of these formed Shin-Ioto ("New Sulfur Island") in 1904, and the most recent island was formed in 1986. The volcano is part of an elongated edifice with two major topographic highs trending NNW-SSE, and is a trachyandesitic volcano geochemically similar to Ioto.
Information Contacts: Olivier Hyvernaud, Laboratoire de Géophysique, BP 640 Pamatai, Tahiti, French Polynesia; Japanese Meteorological Agency (URL: http://www.jma.go.jp/JMA_HP/jma/indexe.html); Robert Dziak and Haru Matsumoto, NOAA PMEL, Hatfield Marine Science Center, 2115 SE Oregon State University Drive, Newport, OR 97365, USA; Yukio Hayakawa (URL: http://www.hayakawayukio.jp/English.html/); Daily Yomiuri News (URL: http://www.yomiuri.co.jp/); Reuters; Associated Press; Tokyo Institute of Technology, 2-12-1 O-Okayama, Meguro-ku, Tokyo 152-8551, Japan; Japan Coast Guard, Hydrographic and Oceanographic Department (URL: http://www1.kaiho.mlit.go.jp/GIJUTSUKOKUSAI/kaiikiDB/kaiyo24-2.htm); Japan Maritime Security and Safety Agency, Oceanic Information Section (URL: http://www1.kaiho.mlit.go.jp/).
Karthala (Union of the Comoros) — November 2005 Cite this Report
Karthala
Union of the Comoros
11.7658°S, 43.3639°E; summit elev. 2350 m
All times are local (unless otherwise noted)
Eruption on 24 November 2005; big evacuation and one fatality
The last eruption at Karthala occurred in April 2005 (BGVN 30:04); this report discusses the second large eruption of the year, on 24-25 November 2005. Karthala is a volcano with a lava lake and well-known for episodic outbursts. This report begins with imagery and maps, discusses satellite images of the 24-25 November ash plume, and then summarizes press and United Nations reports.
Satellite imagery. Elements of Karthala geography appear in figure 11. This and many other figures were produced by a United Nations consortium of public and private organizations, UNOSAT, which provides satellite imagery and geographic information to the humanitarian community. The islands capital, Moroni, lies on the coast directly W of the summit complex.
Perspective on the eruption's impact can be seen on figure 12, containing images from both pre- and post-eruption time frames (13 July 2004 and 5 December 2005). Conspicuous new deposits at distance from the summit area were imaged on 5 December. Some new deposits resided in what appear as channels to the N of the craters, suggesting that freshly deposited tephra may have entered and followed the drainage systems: see channels on figure 12, heading NE. These tentative inferences by Bulletin editors were not discussed in available ground-based reports, so confirmation is lacking. No reports were yet available discussing the morphology or potential hazards of these new deposits.
Ash clouds. Charles Holliday (US Air Force Weather Agency, AFWA) assessed the 25 November 2005 Karthala eruption plume using a NASA Terra MODIS image at 1010 local time (0710 UTC; figure 13). He measured the overall E-W extent of eruptive clouds as ~ 150 nautical miles (~ 280 km). The W margin of the brown clouds lie up to 30-50 km W and NW of the volcano. The light-colored clouds were blown SE, and they became far less optically dense towards the E where they extended over the vicinity of reef-fringed Mayotte Island. The image shows light-colored (nearly white) clouds above and centered SE of the visible brown clouds. Holliday interpreted this to represent a brown zone composed of dominantly ash with a higher lighter-colored zone of ash and ice particles. The tallest clouds reached FL 380 ('Flight Level 380,' a height of 38,000 feet or ~ 11.6 km altitude).
Fred Prata (CSIRO) processed both MODIS and AIRS images for the 25 November eruption (figures 14 and 15). Both instruments are part of NASA's Earth Observing System: MODIS stands for Moderate Resolution Imaging Spectro-Radiometer (flying onboard the Terra (EOS AM-1) satellite); AIRS stands for Atmospheric Infrared Sounder (which uses a grating spectrometer on the Aqua satellite).
Prata used the MODIS image to estimate the 25 November eruption's mass loading. This resulted in an estimate of fine ash amounting to 83 kilotons (kt) in the grain-size ranges indicated. Analysis of SO2 from the MODIS data for 0710 on the 25th yielded 2.85 kt.
Prata also downloaded and processed the AIRS data available from 25 November but found only one good image (figure 12). Prata commented that the reason for the shortage of AIRS data stems from a compromise in instrument design, whereby when acquiring images at low latitudes, polar-orbiting satellites frequently lack sufficient overlap in their scanners to obtain full coverage. The one available satisfactory AIRS image, ~ 13 hours later than the MODIS image, showed a different plume configuration that included two separate zones of SO2 concentration rather than one. The mass of the SO2 measured by the AIRS instrument for the 25th was 2.0 kilotons. This value about the same as Prata obtained in a MODIS retrieval for the same 25 November eruption. In addition, the zones of elevated concentrations on both images stood in roughly the same place—except for the blob near 11°S detected by AIRS and not by MODIS.
Regarding his analysis of the 25 November Karthala eruption, Prata goes on to say that "assuming my fine ash loading of 83 kt is right and (big assumption now) this represents ~ 1% of the total erupted mass, then the volume of erupted ash would be ~ 0.006 km3. This suggests a VEI ~ 2. If the 1% estimate is robust (I've seen this quoted in Bill Rose's work) then the fine ash estimates from remote sensing may be quite helpful [in] assessing the 'size' of an eruption. Coupled with cloud-height estimates we may be moving towards some nice tools for volcanologists."
Prata further commented that he had hoped to image an algal bloom in the ocean where the Karthala ash had fallen. Recent work on ocean chemistry and biology (Boyd and others, 2000) point to iron enrichment as a means of ocean fertilization. As briefly discussed on the NASA Earth Observatory website, Anatahan plumes had recently been suggested to have triggered such blooms; however, with available remote-sensing data Prata was unable to confirm that the Karthala eruption triggered such a plume.
UN and related reports. The following appeared in a 28 November 2005 report of the United Nations Office for the Coordination of Humanitarian Affairs.
"The Karthala Volcano forms most of the landmass of Grande Comore (also called Ngazidja), the main island of the Union of the Comoros. The volcano is one of the largest volcanoes in activity in the world. Over the last two hundred years, it has erupted every eleven years on average. In April 2005, a volcanic eruption projected ashes and volcanic debris on the eastern part of the island, affecting as many as 40,000 people.
"[Karthala] had an eruption for the second time this year in the night of . . . 24 November, spilling ashes and smoke over the southeastern and southwestern parts of Grande Comore Island, and the Comoros capital, Moroni.
"During Friday 25, the projections of ashes and smoke receded. However, seismographic data collected by the Karthala Volcano Observatory has shown that the seismic activity is continuing. According to the observatory, a lava lake is in formation in the crater, as of yet confined within the crater. According to the local authorities, approximately 2,000 people fled from their villages in the region of Bambao in the central part of the island, and sought refuge in less exposed areas, such as Mitsamiouli, Mboudé, and Oichili."
"Concerns exist regarding the availability of potable water in the areas exposed to smoke and ashes. Preliminary results from the assessment indicate that as many as 118,000 persons living in 75 villages may be affected by the contamination of water tanks. A further assessment of the water tanks is underway to ascertain the exact scope of the needs. Concerns also exist regarding the impact of the pollution by volcanic debris on agriculture and livestock."
A 28 November news report by Agence France-Presse (AFP) also noted some of the above details, but added some new points. They said that the eruption had the effect of " . . .killing at least one infant, infiltrating homes, shops and offices and contaminating water in cisterns during the height of the dry season. 'We have two problems with water: one, we are in the dry season and two, the reserves in many private cisterns are now polluted,' minister of state for defense Abdu Madi Mari told AFP."
"He said cistern water supplies for about 120,000 residents mainly from rural villages near the volcano had been contaminated by the ash, which has also raised fears of respiratory ailments."
"Authorities on Grand Comore, the largest of the three semi-autonomous islands in the Comoros, had appealed for international assistance to help in distributing potable water to those in need, Mari said."
The AFP news report stated the eruption sent only "about 500 villagers fleeing from their homes in the shadow of the mountain." and said that despite continued tremor reported by the observatory, "almost all have now returned."
In a 9 December report the World Food Program estimated that the 24 November Karthala eruption affected 245,000 people. They briefly mentioned the issue of potentially contaminated drinking water but noted that, although minor eruptions continued, abundant rain in the weeks that followed helped reduce the potential water and air contamination problems. As noted above, no reports were found discussing problems from ash-choked drainages (lahars).
Geologic Background. The southernmost and largest of the two shield volcanoes forming Grand Comore Island (also known as Ngazidja Island), Karthala has two overlapping 3-4 km summit calderas generated by repeated collapse. Elongated rift zones extend NNW and SE from the summit of the basaltic shield, which has an asymmetrical profile that is steeper to the S. The lower SE rift zone forms the Massif du Badjini, a peninsula at the SE tip of the island. More than twenty eruptions have been recorded since the 19th century from the summit caldera and vents on the N and S flanks, producing many lava flows that reached the sea on both sides of the island. An 1860 CE lava flow from the summit caldera traveled ~13 km to the NW, reaching the W coast to the N of the capital city of Moroni.
Information Contacts: UNOSAT, United Nations Institute for Training and Research (UNITAR), Palais des Nations, CH - 1211 Geneva 10, Switzerland (URL: https://unitar.org/unosat/); Charles Holliday, U.S. Air Force Weather Agency (AFWA)/XOGM, Offutt Air Force Base, NE 68113, USA; Fred Prata, CSIRO Marine and Atmospheric Research, 107-121 Station Street, PMB 1, Aspendale, Victoria 3195, Australia; NASA Earth Observatory, NASA Goddard Space Flight Center, Code 900, Greenbelt, MD 20771, USA (URL: http://earthobservatory.nasa.gov/); MODIS Rapid Response Team, Goddard Space Flight Center, Code 923, Greenbelt, MD 20771, USA; Agence France-Presse (AFP); United Nations, Office for the Coordination of Humanitarian Affairs (OCHA) and the World Food Program (WFP) (URL: https://reliefweb.int/, http://www.wfp.org/).
Karymsky (Russia) — November 2005 Cite this Report
Karymsky
Russia
54.049°N, 159.443°E; summit elev. 1513 m
All times are local (unless otherwise noted)
Explosions continued during December 2004-June 2005
From December 2004 to June 2005 frequent explosions and plumes were detected at Karymsky (BGVN 30:06). In June 2005, the alert level was briefly lowered from Orange to Yellow because of a decrease in seismic and volcanic activity, but it was raised to Orange again on 23 June because of ash and gas plumes which rose to 3 km above the crater.
Karymsky remained at Concern Color Code Orange and seismicity remained above background levels throughout August-December 2005.
Throughout July 2005 ash-and-gas plumes frequently may have risen to 1-3 km above the crater. During 8-15 July, 450-600 shallow earthquakes occurred daily. On 11 July, an ash-and-gas plume extended about 11 km SE. During 15-22 July, 350-700 shallow earthquakes occurred daily. On 22 July, a weak thermal anomaly and a short E-drifting ash-and-gas plume were visible on satellite imagery.
Seismic activity during August indicated frequent possible ash-and-gas plumes up to 4 km altitude. A MODIS satellite thermal anomaly was registered on 2 August. On 22 August, three ash plumes reached heights around 3-4 km altitude and extended ~ 130 km E. An ash plume was visible at an altitude of ~ 5.8 km on 27 August.
Small ash and gas plumes continued to be emitted in September. A thermal anomaly was visible at the volcano on satellite imagery on 15 September.
Visual observations on 17 October revealed that the lava dome in the volcano's crater had been partially destroyed. Based on seismic data, three ash-and-gas plumes may have risen to 2.5-4 km altitude during 14-16 October. Five ash-and-gas plumes may have reached heights of 2.5-3.5 km altitude on several days during the last week of October 2005. A thermal anomaly at the volcano was visible on satellite imagery.
The lava dome inside the volcano's crater continued to grow during November 2005. Based on seismic data, three gas plumes containing some ash possibly rose 3-3.8 km altitude during 29-31 October and 1 November. Ash plumes were visible on satellite imagery extending NE on 31 October and 2 November. During 4-11 November five gas-and-steam plumes with some ash may have reached heights of 3-3.5 km altitude.
No seismic data were available after 10 November. A thermal anomaly was visible at the volcano on 15 and 17 November. According to seismic data, many weak shallow earthquakes and possible gas-steam plumes with some amount of ash up to 2.5 km altitude were registered on 20-23 November. A thermal anomaly was noted over the volcano during the last week of November and the first week of December. According to satellite data from Russia and USA, ash clouds moving to the SE from the volcano were noted on 6-7 December.
After 3 December the availability of seismic data became very erratic. A thermal anomaly was registered on 9-11 December and 14-15 December. According to satellite data, ash plumes and clouds were noted on 9 and on 10 December, moving SW and SE, and SE and E, respectively.
During the third week of December, many weak shallow earthquakes and possibly ten ash plumes up to 3.6 km altitude were registered. According to Kamchatka Volcanic Eruptions Response Team (KVERT) volcanologists who work near Karymsky, ash explosions rose up to 2.5-3 km altitude on 17-21 December 2005, and extended WSW and ENE. A thermal anomaly was registered over the volcano on 15-21 December. Seismicity indicated that ash explosions from the summit crater continued.
Many weak shallow earthquakes were registered during the last week of December. Ash plumes rose up to 2.5-4 km altitude on 24 December and 26-27 December and extended mainly E and SE from the volcano, and occasionally SW. According to KVERT volcanologists, a new cone approximately 60-80 m in diameter was formed at the summit of Karymsky volcano. A small lava dome 20-30 m in diameter was seen in the cone's crater. According to satellite data from the USA and Russia, a thermal anomaly was registered over the volcano all week.
Geologic Background. Karymsky, the most active volcano of Kamchatka's eastern volcanic zone, is a symmetrical stratovolcano constructed within a 5-km-wide caldera that formed during the early Holocene. The caldera cuts the south side of the Pleistocene Dvor volcano and is located outside the north margin of the large mid-Pleistocene Polovinka caldera, which contains the smaller Akademia Nauk and Odnoboky calderas. Most seismicity preceding Karymsky eruptions originated beneath Akademia Nauk caldera, located immediately south. The caldera enclosing Karymsky formed about 7600-7700 radiocarbon years ago; construction of the stratovolcano began about 2000 years later. The latest eruptive period began about 500 years ago, following a 2300-year quiescence. Much of the cone is mantled by lava flows less than 200 years old. Historical eruptions have been vulcanian or vulcanian-strombolian with moderate explosive activity and occasional lava flows from the summit crater.
Information Contacts: Olga Girina, Kamchatka Volcanic Eruptions Response Team (KVERT), a cooperative program of the Institute of Volcanic Geology and Geochemistry, Far East Division, Russian Academy of Sciences, Piip Ave. 9, Petropavlovsk-Kamchatsky, 683006, Russia, the Kamchatka Experimental and Methodical Seismological Department (KEMSD), GS RAS (Russia), and the Alaska Volcano Observatory (USA); Alaska Volcano Observatory (AVO), a cooperative program of the U.S. Geological Survey, 4200 University Drive, Anchorage, AK 99508-4667, USA (URL: http://www.avo.alaska.edu/), the Geophysical Institute, University of Alaska, PO Box 757320, Fairbanks, AK 99775-7320, USA, and the Alaska Division of Geological and Geophysical Surveys, 794 University Ave., Suite 200, Fairbanks, AK 99709, USA; Tokyo Volcanic Ash Advisory Center (VAAC) (URL: https://ds.data.jma.go.jp/svd/vaac/data/).
Krummel-Garbuna-Welcker (Papua New Guinea) — November 2005 Cite this Report
Krummel-Garbuna-Welcker
Papua New Guinea
5.416°S, 150.027°E; summit elev. 564 m
All times are local (unless otherwise noted)
First historically witnessed eruption in October 2005
This report concerns Garbuna volcano's first historically witnessed eruption. That occurred in mid-October 2005 after a felt earthquake. This report contains a section by members of the Rabaul Volcano Observatory (RVO) and another by Rodger Wilson, a NOAA meteorologist , who made an unofficial visit in November.
Setting. Garbuna is part of the 23 x 15 km Krummel-Garbuna-Welcker complex (a volcanic field with these major topographic highs located in S-to-N progression; figure 1). The field resides at the S end of New Britain island's Willaumez (Talasea) peninsula, a narrow projection jutting well N from the island's W-central region. The peninsula and some local reefs and islands are known for volcanoes and hydrothermal features (including, from N to S, Dakataua caldera and its large lake, Bola stratovolcano, Garua Harbour volcanic field, and the Garbuna complex). In addition to young volcanics found at the complex's three summit (ridge) centers and their associated domes and craters, there have been prior flank and eccentric eruptions, most notably Numundo Maar. The complex's products are mostly high-SiO2 andesites to high-SiO2 dacites with more mafic eruptives from Krummel and Numundo Maar. (McKee and others, 2005). Only 5-6 km to the E and W of the volcanic field are some inhabited and intensively cultivated strips along the coast.
Garbuna and Welcker volcanoes were thought to have had a latest significant/datable eruption at ~ 1,800 BP. Garbuna in particular was very geothermally active, with the central area containing 4 km2 of fumaroles, solfataras, hot and bubbling mud and water springs, and patches of hot ground. Conspicuous from the barren, sulfurous and geothermally altered, clay-rich areas was a timber-covered but undated lava dome (or alternately, a short, thick lava flow to the S, a feature sometimes described as a coulée). This dome shows little geothermal alteration, appears very youthful, and is not obviously mantled by the regional tephras from Witori or Dakataua, all features suggesting a comparatively young age. The low cone hosting the dome stands ~ 500-600 m in diameter.
Events surrounding the eruption. The RVO team reported this section and noted that the complex was not instrumentally monitored. A single, locally felt earthquake occurred around midday on 16 October 2005. Jet-like noises were noticed about 2342 that night, rumbling noises started soon after, and at about midnight ash emissions began. The eruption continued and by morning pale to dark gray ash clouds were being driven forcefully into the sky. By 1000 a 3-4-km-high eruption column was visible; the main plume drifted NW with a thin veil of falling material below it. The eruption began to wane between midnight and the morning of 18 October, reducing to slow pale-gray emissions, with only white vapor by the end of the day. A second vent opened quietly during the night of the 18-19 October, with two white vapor plumes visible at dawn on the 19th.
Aerial inspections on 19, 20, and 26 October showed the two vents situated in the central low area of Garbuna, historically an area of high geothermal activity. Both vents are located on or close to the edge of the youthful lava dome mentioned above. The center of the dome is at 05° 26' 48" S, 150° 01' 36" E, with the active vents aligned SW-NE at across a NW sector of the old cone. Both active vents are 60-75 m in diameter and emitted low to moderate amounts of white fume, the southerly plume being more voluminous. On the first two visits fume billowed out gently.
The SW vent seems to have been the source of the initial October emissions. Before the 19th a small incomplete cone had formed around it. Within a kilometer of this vent several ten's of centimeters of ash/mud had been deposited, which thinned very rapidly away from the vent. Old records did not indicate the existence of the SW vent or other conspicuous feature prior to the onset of this eruption.
The second, or NE, vent became active on the night of 18-19 October. Photographs from 1996 showed that prior to the eruption this vent was a small, wooded, funnel-shaped pit, with some evidence of instability on its western side and visible un-vegetated scars.
Although ashfall was reported to the NW, images of the eruption at first light on the 17th showed the fallout to resemble rain rather than dry ash. Vegetation damaged by the fallout had brown blotches rather than uniform discoloration, leading to the conclusion that the initial column was made up primarily of acidic water and mud.
It appears that the NE vent is predominantly a collapse feature, surrounded by a small apron of brownish-gray mud, with a jagged edge and bright red/yellow walls. Following a locally felt earthquake, summit observations on the 20th showed that the NE vent had increased ~ 10-20 m by concentric collapse since the previous day and was 50-60 m deeper. At this time it contained a boiling mud lake ~ 60-70 m below the rim.
Observations on the 26th showed the ash cone around the SW vent had all but disappeared as it had increased in size by collapse. The resulting pit was irregular in shape. Quite vigorous steam emissions occurred and some ash was visibly mixed with the fume and dropping out as fine droplets of dilute mud. Impact craters from projectiles were evident around the vent, especially to the SW. Near the vent these small projectiles were visible and block-like. Up to 500-600 m to the SW small impact craters could still be seen but the projectiles themselves were not apparent.
Close study of the old dome, on whose periphery the vents have opened, suggests that it has undergone little or no movement during the onset of this eruption. Foliage-stripped trees are mainly up-right, and no fresh cracks or heaved boulders are evident. Thermal imagery also showed no hot cracks in the dome, suggesting that the eruption was not preceded by intense surface deformation, and that the vents are now enlarging by concentric collapse.
A large area of grass N of the vents gave the impression of having been flattened in a uniform direction. Trees and shrubs, although stripped of leaves, did not show this flattening. This may suggest that floods of water were responsible for the flattened grass, rather than blast effects. To the S, flooding is also suggested by the apparently recent incising of the valley floor (headwaters of the Garu-Haella sulfur stream). The edge of the jungle also shows undercutting with trees having fallen toward the vents.
Since the start of the eruption changes in the amount of discharge, along with unusual discoloration and dying fish were seen in the streams draining from Garbuna. On 26 October, aerial observers followed one of the Garu thermal streams from the Plantation-Garu village road on its ascent to the summit. At higher elevations the stream's water level dropped markedly, until within a few kilometers of the summit, it dried out completely. The stream was not blocked or dammed, and the falling levels of streams and drying of springs appeared to be related to the drying of the summit, or fracturing, allowing water to percolate into the mountain rather than flow off the geothermally produced clay-rich area. At first light on the morning of 29 October, the watercourse commonly known as the Walindi river was milky white with a blue tinge. It was odorless, of normal temperature, and tasted simply of clayey water with no bitterness. This is the first recorded case of one of the eastern drainage systems exhibiting this behavior, although it is common in the W and SW regions.
A few locally felt earthquakes and sulfur odors were reported from areas not traditionally affected by the complex's sulfatara emissions. On several occasions explosions or booming noises from the Garbuna area were heard at Garu Plantation.
Two seismic stations were installed on 18 October. A 3-component digital recorder was located at Garu Plantation ~ 5.5 km SW of the active vents. An analog recorder was installed at Sisi near Walindi, ~ 5.6 km E of the vents. Notable seismicity was recorded on 20, 21, and 22 October. On the 20th a ML ~ 2.5 local volcano-tectonic earthquake was felt, which was followed by a dozen smaller VT earthquakes between 1300 and 1500. Starting about 0500 on 21 October many very small (ML < 0.5) VT earthquakes began to occur. These events continued throughout 21 October and ceased about 1600 on 22 October. Random VT earthquakes numbering 1-4 per day were recorded on 23, 25, and 28 October. Other volcano-related earthquakes recorded included some small low-frequency earthquakes on 22 October by the Sisi station. Continuous tremor was recorded immediately when a new telemetered seismometer was installed about 0.9 km NE of the active vents. At the end of the month the tremors were continuing.
The West New Britain Provincial Disaster Committee has ensured a smooth civic response to this unforeseen event with public education and preparations for a possible evacuation being well advanced.
Observations during mid-November 2005. Rodger Wilson submitted the following report of his visit to Garbuna with John Seach.
"We climbed Garbuna the first time on 14 November. We smelled H2S(?) from at least three locations at lower elevations along the trek. Wind at the time was to the NE, so I don't believe we were sensing the summit gas plume. Also, there was an area that I jokingly referred to as, 'The Valley of Death,' where we all (four) felt nauseated (on both climbs at the same location, both coming and going), but did not detect any odor of gas. On the second climb, we found an immature parrot on the ground at the (SE?) edge of this area (we removed him from that area, and he seemed fine afterward). Again, we were unable to get a GPS fix there, but it occurs along a (NW to SE-running?) depression just prior to a steeper climb to the summit.
"Just before reaching the clearing at the summit, along a more N-S-running depression, we encountered an area where the trees appeared to have been 'sprayed' horizontally as evidenced by ash being 'plastered' to their N (crater) sides. Bark on many of the larger trees appeared to be at least lightly abraded, but not removed. Numerous smaller trees of approximately 6 cm or less in diameter had been neatly 'clipped' or sharply bent over at just less than 2 m height. There was no evidence of high temperature in connection with the physical damage. Our visit was restricted to along the S edge of the summit, bounded by the hydrothermal area on the W and the two old phreatic craters to the E. This area of damaged trees was, as far as we could see, the only significant damage to the surrounding forest (by a base surge or a cold density current?) in contrast to the more complete devastation suffered by the fewer trees and lower vegetation at the summit. Interestingly, the trees still standing at the summit, appeared to be stripped solely by vertically falling, not horizontally moving, debris.
"We exited the forest at the summit at about 1100, along a N-S bare ridge (old crater rim?), that is clearly visible in aerial photos of the area. Copious fume emanated soundlessly from the two new craters. White fume exited the western crater, with yellow-tinged fume rising from the eastern one. There was a fairly strong smell of H2S, but not the eye-stinging or choking sensation I've felt with SO2 at Etna and Stromboli. As we rested there, we noted the water in our bottles was in constant motion and once we made our way to the thermal area, we clearly felt frequent (several per minute) small shocks while we took temperatures at several spots there. The highest temperatures were all at 100°C. During the first couple of hours at the summit, we had two brief bands of rain showers pass overhead, but by about 1330 the rain became sustained and heavy. Run-off in most of the surrounding gullies had increased to several inches deep. We . . . were picking our way back toward the forest when, just as we left the southern edge of the thermal area, we heard a loud roar and witnessed a lahar issue from the gully draining the crater . . ..
"Changes we noted during the second visit 3 days later were [as follows]: a low rumble or rushing noise associated with the summit vents which was heard through most of the journey to the summit, although [they observed] a complete lack of detectable seismicity while at the summit. The interval between "huffs" of fume was shorter, on the order of maybe 4-5 minutes rather than the 8-10 minutes observed during the first visit. Fume leaving the western vent remained white, while ash was clearly visible as it fell over the E flank of the volcano from the eastern plume. That plume also had a more yellow cast as it issued from its source, compared with a few days before.
"We heard low booming rumbles from near Walindi at around 0530 on 17 November and loud roaring the next morning at about 0700 from the same location. The latter was preceded (by as much as 10 minutes) by dogs at our location being agitated and barking, simultaneously with others in the distance.
Reference. McKee, C.O., Patia, H., Kuduon, J., and Torrence, R., 2005, Volcanic Hazard Assessment of the Krummel-Garbuna-Welcker Volcanic Complex, Southern Willaumez Peninsula, WNB, Papua New Guinea: Geological Survey of Papua New Guinea—Report 2005/4.
Geologic Background. The basaltic-to-dacitic Krummel-Garbuna-Welcker Volcanic Complex consists of three volcanic peaks located along a 7-km N-S line above a shield-like foundation at the southern end of the Willaumez Peninsula. The central and lower peaks of the centrally located Garbuna contain a large vegetation-free area that is probably the most extensive thermal field in Papua New Guinea. A prominent lava dome and blocky lava flow in the center of thermal area have resisted destruction by thermal activity, and may be of Holocene age. Krummel volcano at the south end of the group contains a summit crater, breached to the NW. The highest peak of the group is Welcker volcano, which has fed blocky lava flows that extend to the eastern coast of the peninsula. The last major eruption from both it and Garbuna volcanoes took place about 1800 years ago. The first historical eruption took place at Garbuna in October 2005.
Information Contacts: Steve Saunders, Ima Itikarai, and Herman Patia, Rabaul Volcano Observatory (RVO), P.O. Box 386, Rabaul, Papua New Guinea; Rodger Wilson, Meteorological Technician, US National Oceanic and Atmospheric Administration (NOAA) and National Weather Service (NWS), WSO, P.O. Box 1685, Valdez, AK 99686, USA.
Langila (Papua New Guinea) — November 2005 Cite this Report
Langila
Papua New Guinea
5.525°S, 148.42°E; summit elev. 1330 m
All times are local (unless otherwise noted)
Active during August-September, decreasing during October-November
Rabaul Volcano Observatory (RVO) reported that during 22-28 August 2005, modest eruptive activity was observed at Langila's Crater 2. Occasional forceful emissions of ash produced plumes that rose ~ 1 km above the crater on 22 and 25 August, but reached only several hundred meters after that. The ash plumes drifted N and NW, resulting in fine ashfall in downwind areas, including the town of Kilenge. Seismicity was at low levels, consisting mainly of low-frequency earthquakes. The Darwin Volcanic Ash Advisory Centre (VAAC) reported that a plume was visible on satellite imagery on 30 August extending NNW.
During 12-18 September, Crater 2 continued to forcefully erupt ash at irregular intervals. The resultant ash plumes drifted NW and W. Incandescence and weak projections of volcanic material were visible on the evening of 13 September. There was no activity at Crater 3. Seismicity was at low levels at the volcano, consisting mainly of low-frequency earthquakes.
During 20-23 October, low-level plumes from Langila were occasionally visible on satellite imagery. On 29 October, a plume from Langila was visible on satellite imagery at an altitude of ~ 2.7 km.
During 11-12 November, low-level ash plumes emitted from Langila were visible. The heights of the plumes were not reported.
Geologic Background. Langila, one of the most active volcanoes of New Britain, consists of a group of four small overlapping composite basaltic-andesitic cones on the lower E flank of the extinct Talawe volcano in the Cape Gloucester area of NW New Britain. A rectangular, 2.5-km-long crater is breached widely to the SE; Langila was constructed NE of the breached crater of Talawe. An extensive lava field reaches the coast on the N and NE sides of Langila. Frequent mild-to-moderate explosive eruptions, sometimes accompanied by lava flows, have been recorded since the 19th century from three active craters at the summit. The youngest and smallest crater (no. 3 crater) was formed in 1960 and has a diameter of 150 m.
Information Contacts: Darwin Volcanic Ash Advisory Centre (VAAC), Bureau of Meteorology, Northern Territory Regional Office, PO Box 40050, Casuarina, NT 0811, Australia (URL: http://www.bom.gov.au/info/vaac); Rabaul Volcano Observatory (RVO), P.O. Box 386, Rabaul, Papua New Guinea; International Federation of Red Cross And Red Crescent Societies (IFRC) (URL: https://reliefweb.int/).
Montagu Island (United Kingdom) — November 2005 Cite this Report
Montagu Island
United Kingdom
58.445°S, 26.374°W; summit elev. 1370 m
All times are local (unless otherwise noted)
N-coast delta grew during 14 September-4 October 2005
MODVOLC radiant heat-flux data and ASTER high-resolution satellite imagery revealed discharging lava flows that traveled N to the sea where they constructed a lava delta. The large effusive episode described in BGVN 30:09 had ceased, followed by a smaller episode in November. MODVOLC responses were most intense during 14 September to 4 October 2005. Figure 11a shows the radiant heat flux for the volcano since the start of the eruption in October 2001, providing rough idea eruptive intensity. Figure 11b indicates the distance of each alert pixel from the vent, giving insights into the timing of significant effusive episodes.
As figure 12b suggests, the September-October 2005 episode was likely the largest effusive episode of the eruption in that it involved the only sustained occurrence of alert pixels (i.e. active lava) more than 2 km from the vent. Following 4 October 2005, a single alert pixel appeared more than 3 km from the vent on 17 November 2005, but subsequent alert pixels were all near-vent. It is not yet clear if this 17 November anomaly represents the start of a substantial additional episode of lava effusion.
An ASTER image collected on 3 November 2005, shows the result from the September-October 2005 effusive episode (visible wavelength image shown in figure 12a). The shortwave infrared anomaly in this image (not shown) is minor compared to the 23 September 2005 image (BGVN 30:09), suggesting that any effusion had dropped to low levels by early November. The 3 November image indicates that a significant lava delta had formed on the N shore of the island during the September-October effusive phase (see arrow in figure 12a). The delta comprises two major lobes, and is approximately 400-500 m in width and length, equating to approximately 0.2 km2. An enlarged view of the visible image is provided in figure 12b, where the approximate path of the September-October 2005 lava flow is shown by the dotted arrow. The current coastline is shown by the dotted line, with the lava delta (denoted by solid arrow) clearly jutting out. Note the faint steam wisps extending E from delta's eastern margin. The thermal infrared image (band 14, at 11-micron wavelength) of the island is shown in figure 12c, and clearly indicates the anomalously warm delta.
A Royal Air Force overflight on 11 October 2005, captured an oblique photograph of the delta (not shown). The lava flow appears to have steeply cut through thick ice approaching the shore, producing a broad and relatively flat delta that is vigorously steaming from the delta margins in the photograph.
Geologic Background. The largest of the South Sandwich Islands, Montagu consists of a massive shield volcano cut by a 6-km-wide ice-filled summit caldera. The summit of the 11 x 15 km island rises about 3,000 m from the sea floor between Bristol and Saunders Islands. Around 90% of the island is ice-covered; glaciers extending to the sea typically form vertical ice cliffs. The name Mount Belinda has been applied both to the high point at the southern end of the summit caldera and to the young central cone. Mount Oceanite, an isolated peak at the SE tip of the island, was the source of lava flows exposed at Mathias Point and Allen Point. There was no record of Holocene activity until MODIS satellite data, beginning in late 2001, revealed thermal anomalies consistent with lava lake activity. Apparent plumes and single anomalous pixels were observed intermittently on AVHRR images from March 1995 to February 1998, possibly indicating earlier volcanic activity.
Information Contacts: Matt Patrick, University of Hawaii, Hawaii Institute of Geophysics and Planetology (HIGP) Thermal Alerts Team, 2525 Correa Road, Honolulu, HI 96822 (URL: http://modis.higp.hawaii.edu/); John Smelie, British Antarctic Survey, Natural Environment Research Council, High Cross, Madingly Road, Cambridge CB3 0ET, United Kingdom (URL: https://www.bas.ac.uk/); NASA Earth Observatory (URL: http://earthobservatory.nasa.gov/).