The Alert Level at Raoul Island was lowered to 0 (on a scale of 0-5) on 18 September due to a general decline in activity. Since April 2006, no significant earthquake activity had occurred within ~30 km of the island, the water in Green Lake dropped to the pre-eruption level, and on-going hydrothermal activity returned to normal.
Source: GeoNet
Update on March 2006 eruption; new submarine volcanoes discovered
This report discusses evidence for the end of the March 2006 eruption, and press releases announcing newly acquired multibeam bathymetry that disclosed submarine calderas on the flanks of Raoul Island and some adjacent volcanoes.
End of the March 2006 eruption. After the 17 March 2006 eruption (BGVN 31:03), volcanic activity decreased significantly. On 18 September 2006 the Alert Level was lowered to 0.
GeoNet Science (GNS) summarized the decreased activity in their Volcano Alert Bulletin of 18 September 2006. The report noted an absence of significant earthquakes within ~ 30 km of Raoul Island. The water level in Green Lake had continued to drop and was close to the pre-eruption level by 18 September. On 27 August the lake temperature was 20.3°C, well within the seasonal range. The level of ongoing hydrothermal activity (upwelling in Green Lake, nearby hot pools, and steaming ground) was commensurate with that expected six months after an eruption like that seen in March. Chemical analyses of samples recently collected from some of the thermal features were typical of volcano-hydrothermal features in this environment.
GNS reported that the water level in Green Lake, which had risen significantly during the week after the March 2006 eruption and had drowned several new steam vents, still remained above pre-eruption levels as of July 2006, but thereafter dropped slowly. Upwelling and bubbling of springs indicated the volcanic-hydrothermal system was still weakly active 3 months after the eruption. The water temperature, obtained from a thermal infrared satellite image taken on 11 April 2006, was 39.2°C, was 7°C above the average water temperature in April, but had returned to seasonal temperatures by August 2006.
Only 1 to 5 earthquakes were recorded per day in the months following the eruption. The number of earthquakes 30-40 km offshore was slightly higher than normal.
New submarine volcanoes discovered. Marine geologists who had investigated two volcanoes in the Kermadec Arc during May 2007, discovered two new submarine volcanoes near Raoul Island. The geologists were on a scientific expedition mounted by New Zealand's National Institute of Water & Atmospheric Research (NIWA) and the University of Auckland aboard NIWA's deepwater research vessel Tangaroa. They investigated volcanoes on the two largest Kermadec Islands (Raoul and Macauley) and their submerged flanks.
A 22 May 2007 press release by NIWA reported that new seafloor observations revealed for the first time the presence of two submerged calderas. Both calderas were relatively small, ~ 4 km in diameter. One caldera was very deep, measuring ~ 1 km from the rim to the crater floor. Both volcanoes appeared geologically young, on the order of thousands of years old, but laboratory analysis of sediments will be needed to better quantify their age.
The expedition took sediment samples and mapped the contours of the volcanoes both above and below sea level (the latter using multibeam sonar). A series of sediment cores taken from E and W of both islands revealed at least six eruptions from the two islands, recorded as centimeter-thick layers up to 100 km from the islands.
Information Contacts: Steve Sherburn, GeoNet Science (GNS), Wairakei Research Centre, Private Bag 2000, Taupo, New Zealand; Ian Wright, Ocean Geology group, National Institute of Water & Atmospheric Research (NIWA), PO Box 14901, Wellington, New Zealand (URL: http://www.niwascience.co.nz); Roger Matthews, North Shore City Council, 1 The Strand, Takapuna Private Bag 93500, Takapuna, North Shore City, New Zealand (URL: http://www.northshorecity.govt.nz/).
2006: March
| April
| September
The Alert Level at Raoul Island was lowered to 0 (on a scale of 0-5) on 18 September due to a general decline in activity. Since April 2006, no significant earthquake activity had occurred within ~30 km of the island, the water in Green Lake dropped to the pre-eruption level, and on-going hydrothermal activity returned to normal.
Source: GeoNet
Hydrothermal activity at Raoul Island's Green Lake crater had declined significantly as of 28 April and the lake water level continued to fall. The Alert Level at Raoul Island was reduced from 2 to 1 (some signs of volcano unrest), on a scale of 0-5.
Source: GeoNet
As of 21 April, hydrothermal activity at Raoul Island's Green Lake crater declined significantly and the lake level continued to fall. Recent earthquakes at or near the island were smaller and occurred less often than during the previous 3 weeks. Raoul Island remained at Alert Level 2 (minor eruptive activity).
Source: GeoNet
As of 13 April, seismicity at Raoul Island had returned to normal and Green Lake's water level was dropping. Raoul Island remained at Alert Level 2 (minor eruptive activity).
Source: GeoNet
Seismicity continued to decline at Raoul Island through 7 April. In addition, Green Lake's water level began to recede, ending the water-level increase that had occurred in response to the 17 March eruption. Raoul Island remained at Alert Level 2 (minor eruptive activity).
Source: GeoNet
As of 31 March, no new eruptive activity had occurred at Raoul Island after the 17 March eruption. Seismicity continued to decline and Green Lake's water level continued to rise in response to the eruption. Raoul Island remained at Alert Level 2 (minor eruptive activity).
Source: GeoNet
After a 17 March eruption at Green Lake on Raoul Island, no new eruptions occurred and seismicity declined through 24 March. GNS observed the volcano via photographs and video on the afternoon of the 17th, and noted that many new craters had formed in and around Green Lake and that pre-existing 1964 craters had reactivated. The main steam columns were derived from Crater I, Marker Bay, and Crater XI. The eruption blew over mature trees as far as 200 m from the eruption site and deposited dark gray hydrothermal mud and ballistic blocks.
An aerial inspection on 21 March revealed that steam discharge from vents had declined significantly owing to a dramatic (6-8 m) rise in Green Lake's water level, and consequent drowning of most of the active vents. There was no evidence of further eruptions after 17 March. There was also no evidence that any activity occurred at the 1964 craters NW of crater gully, but many new craters had formed at the mouth of the gully where hot, bare ground was present. GNS reported that as the hydrothermal system adjusts to the increased fluid pressure, further eruptions remain possible. They recommended that access to the active crater area should be restricted to the margins of the areas affected to date and the Green Lake area should not be entered. According to news reports, the search for a missing person on the island ceased around 22 March. Raoul Island remained at Alert Level 2 (minor eruptive activity).
Sources: GeoNet; Associated Press
An eruption began in the Green Lake area of Raoul Island volcano on 17 March around 0821. Based on interpretations of seismic data, the eruption appeared to have lasted for 30 minutes, with the most intense activity lasting 5-10 minutes. The eruption consisted of the ejection of mud and rocks, and a steam plume. A strong sequence of earthquakes began during the evening of the 12th that declined in number and size a few days before the 17th. According to GNS, the eruption appeared to have occurred with no immediate warning. New Zealand Department of Conservation officials evacuated a dozen staff on the island. News articles reported that one person remained missing on the island as of 22 March. The last eruption from the Green Lake area occurred during November 1964-April 1965.
Sources: GeoNet; Wellington Volcanic Ash Advisory Center (VAAC); Associated Press
Reports are organized chronologically and indexed below by Month/Year (Publication Volume:Number), and include a one-line summary. Click on the index link or scroll down to read the reports.
Possible steam emission
A possible minor eruption occurred at about 1000 on 25 March, when apparent steam emission, resembling whales spouting, was reported. A similar event occurred in approximately the same location some months previously but was not reported because activity was attributed to whales. An observer on Raoul Island, Peter Fisher, noted a possible thickening of the seismogram trace and remarked that whales are not normally found in area waters at this time of year.
The eruptive activity was an estimated 7 km NNE (10-20° E of N) of the meteorological station on the central N coast of Raoul Island. The activity was very close to a seamount (figure 1) and the site of floating pumice and upwelling reported in 1886, 8 km NNE of Raoul (Lloyd and Nathan, 1981, p. 62-63).
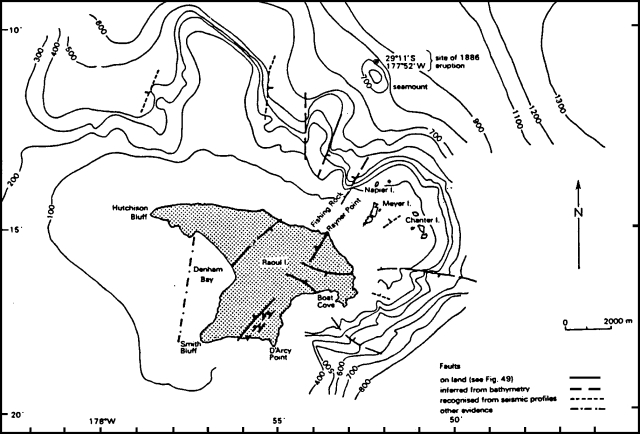 |
Figure 1. Bathymetric map and structure of Raoul Island, compiled from surveys of HMNZS Lachlan and RV Vulkanolog (Lloyd and Nathan, 1981). Isobaths are in meters. |
Reference. Lloyd, E.F. and Nathan, S., 1981, Geology and tephrochronology of Raoul Island, Kermadec Group, New Zealand: New Zealand Geological Survey Bulletin, no. 95, 105 p.
Information Contacts: J. Latter, DSIR Geophysics, Wellington.
Increased microseismicity but no changes in thermal activity
The following observations, made by scientists from the USSR and New Zealand during a cruise of the RV Vulkanolog, were reported by W.F. Giggenbach and I. Menyailov. The island was visited on 30 January 1990.
"A considerable increase in microseismic activity to ~180 events/day, starting at the beginning of January 1990, was recorded by the Raoul Island seismic station. A similar swarm of minor shocks (Adams and Dibble, 1967) and an increase in hydrothermal activity (Healy et al., 1965) preceded the 1964 eruption. There were, however, no significant changes in the appearance and emission rate of thermal fluids from the main area of geothermal discharge along the W shore of Green Lake since the last visit of RV Vulkanolog in March 1988. Water and steam samples were collected in 1988 and 1990. The compositions of the 1988 samples are compared in table 1 with those reported by Weissberg and Sarbutt (1966) for samples collected shortly after the 1964 eruption. Gas compositions point to an essentially hydrothermal origin with insignificant contributions from high-temperature magmatic gases. Heavy seas prevented landing on Curtis Island, the other island in the Kermadecs showing thermal activity."
Table 1. Chemical composition (in mmol/mol of dry gas) of steam samples collected from the main fumarolic vents on Raoul Island in December 1964 (shortly after the 1964 eruption; Weissberg and Sarbutt, 1966) and during the March 1988 cruise of the RV Vulkanolog.
| Dry Gas (mmol/mol) | 08 Dec 1964 | 10 Mar 1988 | ||
| Sample 1 | Sample 2 | Sample 1 | Sample 2 | |
| C | 100 | 83 | 96 | 96 |
| CO2 | 855 | 912 | 984 | 969 |
| H2S | 12.2 | -- | 0.9 | 0.9 |
| He | -- | -- | 0.005 | -- |
| Ne | -- | -- | 0.00008 | -- |
| Ar | -- | -- | 0.07 | 0.28 |
| H2 | -- | 0.7 | 0.3 | 0.2 |
| O2 | 19.2 | 7.3 | <0.1 | 5.0 |
| N2 | 113 | 78 | 14 | 25 |
| CH4 | 0.50 | 1.70 | 0.11 | 0.07 |
References. Adams, R.D., and Dibble, R.R., 1967, Seismological studies of the Raoul Island eruption, 1964: New Zealand Journal of Geology and Geophysics, v. 10, p. 1,348-1,361.
Weissberg, B.G., and Sarbutt, J., 1966, Chemistry of the hydrothermal waters of the volcanic eruption on Raoul Island, November 1964: New Zealand Journal of Science; v. 9, p. 426-432.
Information Contacts: I. Nairn, P. Otway, B. Scott, and C. Wood, NZGS Rotorua; W. Giggenbach, DSIR Chemistry, Petone.
Tectonic earthquake swarm; strongest swarm since 1964
The strongest earthquake swarm since the 1964 eruption began at 0150 on 9 March. About 1 earthquake/minute was felt at the island's meteorological station, ~2 km N of Raoul Caldera and 3 km NW of Denham Bay. The larger events shook trees and caused small rockfalls. There were no apparent changes to the lakes in the caldera or to Denham Bay. On the afternoon of 9 March an overflight revealed no indications of volcanic activity. Though mechanical problems prevented the island's one seismograph from recording any earthquakes until that evening, seven earthquakes were detected in Wellington, ~1,600 km S. The strongest, M 4.3, occurred at 0734. Because the swarm may have been precursory to an eruption, the meteorological station staff of 4 men and 1 dog was evacuated by ship to a location 10 km from the island. They returned the following day and saw that the number of earthquakes had diminished considerably. Earthquakes continued to decline in number and intensity, and on 13 March, the ship departed the island, leaving the staff behind. Analysis of the seismicity indicated the swarm was of tectonic rather than volcanic origin.
No volcanic earthquakes or tremor, such as recorded in the 11 days prior to the 1964 eruption, were detected in this swarm, and the recent earthquakes were fewer and smaller than in 1964. There was no evidence of the increased heat flow to the surface that preceded the 1964 eruption. Though the level of one of the caldera lakes rose 38 cm on 12-25 March, this was minor compared to the rise of 600 cm in 11 days prior to the 1964 eruption.
Information Contacts: I. Nairn and B. Scott, IGNS Wairakei; J. Latter, IGNS Wellington.
Eruption on 17 March 2006 preceded by 5 days of earthquakes; 1 fatality
An eruption took place on 17 March 2006 at Raoul Island, killing one person. Brad Scott, New Zealand Institute of Geological and Nuclear Sciences (GNS), reported that on the evening of 12 March 2006 earthquakes began near Raoul Island. More than 200 earthquakes were recorded in the first 24 hours, with many of the larger events felt on the island. Earthquakes continued throughout the week, but the numbers gradually decreased.
An eruption from the Green Lake crater, within the Raoul caldera (figure 2), began at 0821 on 17 March. Other than the precursory seismicity, no water-level or temperature changes were observed, even only 24 hours before the eruption. Based on data from the seismograph on the island, the eruption appears to have continued for up to 30 minutes, although the most intense part of the eruption lasted for only 5 to 10 minutes. Following the eruption, the rate of earthquake activity doubled, but by 23 March the number of earthquakes was reduced to 10-20 per day. No thermal anomalies were detected by the MODIS satellite system during March 2006.
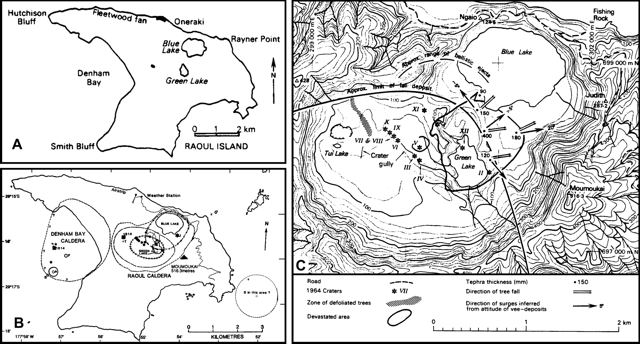 |
Figure 2. Maps of Raoul Island taken from New Zealand governmental publications issued considerably prior to the 2006 eruption. A) Sketch map of the entire island (from Lloyd and Nathan, 1981). B) A second sketch map showing key areas of volcanism during the past 4,000 years (from Latter and others, 1992). C) A more detailed view of Raoul caldera and the cratered interior of the island, with contour lines at 20 m intervals (from Lloyd and Nathan, 1981). The northern caldera contains three small lakes: Blue Lake (1.17 km2, about 40% overgrown), Green Lake (160,000 m2), and Tui Lake (5,000 m2, drinking water quality). The island's high point is Moumoukai (516 m). Unfortunately, the current report mentions a few other features undisclosed on these maps. Courtesy of GNS. |
The 2006 eruption blew over mature trees out to ~ 200 m and deposited dark gray mud and large ballistic blocks. Many of the steep crater margins had post-eruption collapses marked by fresh landslides.
The New Zealand Department of Conservation evacuated five staff members from the island, but one worker, taking water-temperature measurements at Green Lake at the time of the eruption, was killed. Devastation left by the eruption thwarted efforts to find the missing worker (figure 3). A news story reported that the missing man left around 0730 on 17 March to walk to Green Lake. An hour later the volcano erupted.
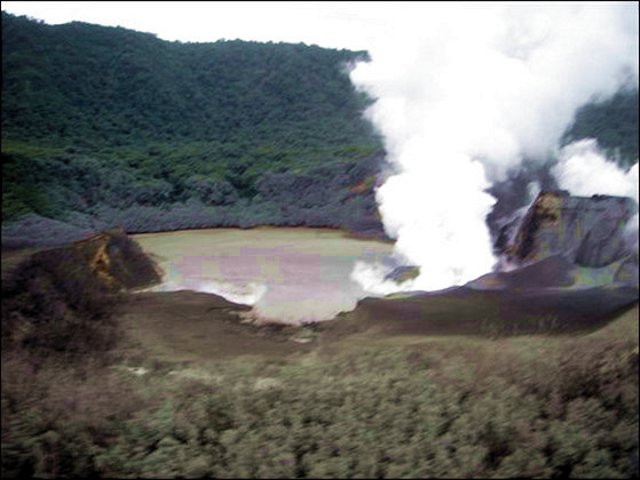 |
Figure 3. Photo reportedly taken by the rescue helicopter pilot John Funnell of the area affected by the volcanic eruption on Raoul Island, 17 March 2006. AP Photo; photo credit to John Funnell. |
Volcano monitoring of the Raoul crater lakes started after the 1964 eruption, as these lakes responded measurably before that event, consistent with a long-lived hydrothermal system. There are low-temperature (boiling-point) fumaroles in the vicinity of Green Lake and minor seepages of hydrothermal brine from the system (boiling hot springs) along Oneraki Beach, outside of the caldera. The gases have strong hydrothermal signatures (as opposed to proximal magmatic). As such, they do not suggest single-phase vapor transport directly from a magmatic source to the surface, but rather are indicative of the presence of boiling hydrothermal brine at depth. GNS has no quantitative data from Denham Bay (offshore to the W of the island, but scientists from the organization found boiling-point (100° C) steaming ground on the steep crater walls, and gas and water seeps in the sea. Historical observations of volcanic eruptions from this caldera (and Raoul caldera) point to the likely existence of a sizable active system residing there.
Still and video footage taken of the post-eruptive scene on 17 March 2006 showed many new craters and reactivation of 1964 craters. The main steam columns were derived from Crater I, Marker Bay, and Crater XI. Fumarolic activity appeared near the mouth of Crater Gully and the stream that drains from Crater V. The area NW of Bubbling Bay, where there had been a fumarole, contained a crater about 20-30 m across.
In the main body of Green Lake there were two areas of strong upwelling. One occurred near the end of the peninsula S of Crater XII (a promontory that had been explosively removed). Jagged rocks were visible in the lake where it had been 2-4 m deep. There was also a new feature about 200-300 m N of Green Lake's Crater XII (figure 2B); the new feature included a moat near the edge of the crater floor, which contained a vigorously active vent. Green Lake's surface did not appear elevated at the time of the post-eruption 17 March observations.
Sulfur dioxide (SO2) was detected by satellite about 5 hours after the 17 March eruption (figure 4). SO2 data was collected by the Aura Ozone Monitoring Instrument (OMI), which is affiliated with the University of Maryland, the US National Aeronautics and Space Administration (NASA), the Royal Netherlands Meteorological Institute (KNMI), and the Finnish Meteorological Institute (FMI). The highest SO2 values stood over and adjacent to the island and reached as high as two Dobson Units (DU, figure 4). Simon Carn noted that the total mass of SO2 in figure 4 was ~ 200 tons. Subsequent observations did not detect further SO2 discharge.
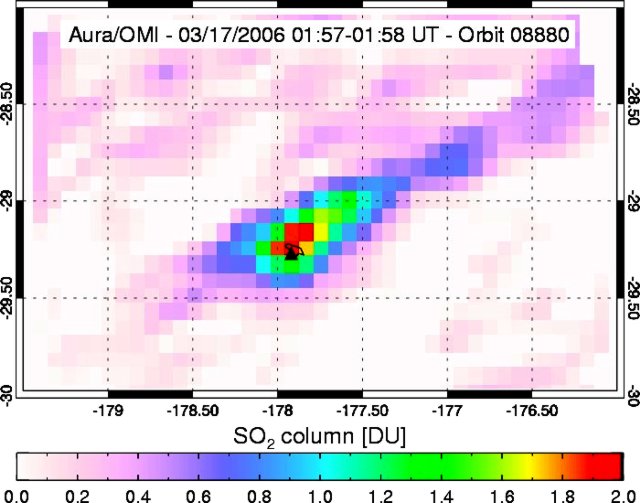 |
Figure 4. Atmospheric sulfur dioxide (SO2) detected by the Aura/OMI satellite about 5.65 hours after the Raoul Island eruption's onset on 17 March 2006. (The eruption onset was at about 0821 local time and this SO2 observation was at about 1358 local time (0158 UTC).) Image courtesy of Simon Carn, the OMI SO2 group at the University of Maryland, and NASA/KNMI/FMI. |
An aerial inspection on 21 March made from a Royal New Zealand Air Force Orion aircraft allowed excellent views of both the Raoul and Denham Bay calderas. Visible steam discharge from the vents had declined significantly owing to a 6-8 m rise in Green Lake's water level and the consequent drowning of most of the active vents. The lake level did not appear to have reached overflow level. Landsliding and collapse also blocked Crater I. Vigorous upwelling and gas discharge was still obvious through Green Lake, which appeared very warm.
There was no evidence of further eruptions since 17 March, nor was there any evidence that activity had occurred from the 1964 craters adjacent to Crater Gully (i.e. craters III, IV, and VI-X). However, many new craters formed at the mouth of Crater Gully where hot bare ground had been present. There was a possible NE-trend through the vents from Crater Gully to NE of Crater XII. In 1964 the craters aligned along three parallel fractures that tended NW. Heightened activity was not confined to the lake.
In Denham Bay GNS scientists observed a weak plume of discolored water approximately coincident with the vent area. There was evidence of hydrothermal seepage along most of the beach (milky discoloration indicating mixing of hydrothermal brine and seawater). There were also discharges in the rocky bay halfway between Hutchison Bluff and the NW end of Denham beach (figure 2A). If these are confirmed as hydrothermal seepages, they represent a significant rise in the surface of the hydrothermal fluids in the system, consistent with that observed in the caldera.
On 23 March 2006, the GNS reported that scientists who flew over noted that the hydrothermal system under the island showed signs of over-pressuring. GNS volcanologist Bruce Christenson stated, "From our aerial observations, it is clear that the heat, gas, and water that are discharging into Green Lake are making this part of the volcano's hydrothermal system unstable." Several new steam vents opened in and around Green Lake during the eruption and some old ones had reactivated. Many of these were drowned as a result of lake-level rise. According to Christenson, "one explanation for the increased hydrothermal activity is that it is being driven by the intrusion of magma at depth."
Steve Sherburn of GNS reported on 24 March on the GeoNet website (the New Zealand GeoNet Project provides real-time monitoring and data collection for rapid response and research into earthquake, volcano, landslide, and tsunami hazards) that over the last few days the level of earthquake activity at or close to Raoul Island had continued to decline to a current level of only 5-10 earthquakes per day, most of which were probably too small to be felt on the island. There is no unequivocal seismic evidence for magma movement (such as the strong volcanic tremor observed before the 1964 eruption). Careful seismic monitoring of Raoul Island will continue.
Brad Scott reported on 3 April 2006 that activity continued to decline in the Green Lake crater area. The most recently available photographs showed the water level continuing to rise slowly in Green Lake, but it had not reached overflow level. Over the last few days the level of earthquake activity at or close to Raoul Island continued to decline and in early April there were only 2-5 earthquakes per day being recorded.
References. Latter, J.H.; Lloyd, E.F.; Smith, I.E.M.; and Nathan, S., 1992, Volcanic hazards in the Kermadec Islands, and at submarine volcanoes between Southern Tonga and New Zealand: Volcanic Hazards Information Series, no. 4 (CD 303), New Zealand Ministry of Civil Defence, 45 p. (Booklet) ISBN 0-477-07472-3Lloyd, E.F., and Nathan, S., 1981, Geology and tephrochronology of Raoul Island, Kermadec Group, New Zealand: New Zealand Geological Survey Bulletin, no. 95, 105 p. (includes map in back pocket).
Information Contacts: Brad Scott, Institute of Geological and Nuclear Sciences (GNS), Wairakei Research Centre, 114 Karetoto Road, Taupo, New Zealand (URL: http://www.geonet.org.nz/, http://www.gns.cri.nz/).
Update on March 2006 eruption; new submarine volcanoes discovered
This report discusses evidence for the end of the March 2006 eruption, and press releases announcing newly acquired multibeam bathymetry that disclosed submarine calderas on the flanks of Raoul Island and some adjacent volcanoes.
End of the March 2006 eruption. After the 17 March 2006 eruption (BGVN 31:03), volcanic activity decreased significantly. On 18 September 2006 the Alert Level was lowered to 0.
GeoNet Science (GNS) summarized the decreased activity in their Volcano Alert Bulletin of 18 September 2006. The report noted an absence of significant earthquakes within ~ 30 km of Raoul Island. The water level in Green Lake had continued to drop and was close to the pre-eruption level by 18 September. On 27 August the lake temperature was 20.3°C, well within the seasonal range. The level of ongoing hydrothermal activity (upwelling in Green Lake, nearby hot pools, and steaming ground) was commensurate with that expected six months after an eruption like that seen in March. Chemical analyses of samples recently collected from some of the thermal features were typical of volcano-hydrothermal features in this environment.
GNS reported that the water level in Green Lake, which had risen significantly during the week after the March 2006 eruption and had drowned several new steam vents, still remained above pre-eruption levels as of July 2006, but thereafter dropped slowly. Upwelling and bubbling of springs indicated the volcanic-hydrothermal system was still weakly active 3 months after the eruption. The water temperature, obtained from a thermal infrared satellite image taken on 11 April 2006, was 39.2°C, was 7°C above the average water temperature in April, but had returned to seasonal temperatures by August 2006.
Only 1 to 5 earthquakes were recorded per day in the months following the eruption. The number of earthquakes 30-40 km offshore was slightly higher than normal.
New submarine volcanoes discovered. Marine geologists who had investigated two volcanoes in the Kermadec Arc during May 2007, discovered two new submarine volcanoes near Raoul Island. The geologists were on a scientific expedition mounted by New Zealand's National Institute of Water & Atmospheric Research (NIWA) and the University of Auckland aboard NIWA's deepwater research vessel Tangaroa. They investigated volcanoes on the two largest Kermadec Islands (Raoul and Macauley) and their submerged flanks.
A 22 May 2007 press release by NIWA reported that new seafloor observations revealed for the first time the presence of two submerged calderas. Both calderas were relatively small, ~ 4 km in diameter. One caldera was very deep, measuring ~ 1 km from the rim to the crater floor. Both volcanoes appeared geologically young, on the order of thousands of years old, but laboratory analysis of sediments will be needed to better quantify their age.
The expedition took sediment samples and mapped the contours of the volcanoes both above and below sea level (the latter using multibeam sonar). A series of sediment cores taken from E and W of both islands revealed at least six eruptions from the two islands, recorded as centimeter-thick layers up to 100 km from the islands.
Information Contacts: Steve Sherburn, GeoNet Science (GNS), Wairakei Research Centre, Private Bag 2000, Taupo, New Zealand; Ian Wright, Ocean Geology group, National Institute of Water & Atmospheric Research (NIWA), PO Box 14901, Wellington, New Zealand (URL: http://www.niwascience.co.nz); Roger Matthews, North Shore City Council, 1 The Strand, Takapuna Private Bag 93500, Takapuna, North Shore City, New Zealand (URL: http://www.northshorecity.govt.nz/).
|
|
||||||||||||||||||||||||||
There is data available for 17 confirmed eruptive periods.
2006 Mar 17 - 2006 Mar 17 Confirmed Eruption (Explosive / Effusive) VEI: 1 (?)
| Episode 1 | Eruption (Explosive / Effusive) | Green Lake crater | ||||||||||||||||||||||||||||||||||||||||||||||||
|---|---|---|---|---|---|---|---|---|---|---|---|---|---|---|---|---|---|---|---|---|---|---|---|---|---|---|---|---|---|---|---|---|---|---|---|---|---|---|---|---|---|---|---|---|---|---|---|---|---|
| 2006 Mar 17 - 2006 Mar 17 | Evidence from Observations: Reported | ||||||||||||||||||||||||||||||||||||||||||||||||
|
List of 8 Events for Episode 1 at Green Lake crater
|
|||||||||||||||||||||||||||||||||||||||||||||||||
[ 1987 Mar 25 - 1987 Mar 25 ] Uncertain Eruption
| Episode 1 | Uncertain | NNE flank (7 km from Raoul Island) | |||||||||||||
|---|---|---|---|---|---|---|---|---|---|---|---|---|---|---|
| 1987 Mar 25 - 1987 Mar 25 | Evidence from Unknown | |||||||||||||
| A possible minor eruption was observed 7 km NE of Raoul Island near the site of the 1886 submarine eruption. Activity consisted of apparent steam emission resembling whales spouting. A similar event several months earlier had been attributed to whales, but a possible thickening of the seismogram trace was noted in March, and it was remarked that whales were not normally found in area waters at this time of year (SEAN 12:03). | ||||||||||||||
|
List of 1 Events for Episode 1 at NNE flank (7 km from Raoul Island)
|
||||||||||||||
1964 Nov 19 - 1965 Apr 25 (?) Confirmed Eruption (Explosive / Effusive) VEI: 2
| Episode 1 | Eruption (Explosive / Effusive) | West side of Green Lake, Denham caldera | ||||||||||||||||||||||||||||||||||||||||||||||||||||||||||||||||||||
|---|---|---|---|---|---|---|---|---|---|---|---|---|---|---|---|---|---|---|---|---|---|---|---|---|---|---|---|---|---|---|---|---|---|---|---|---|---|---|---|---|---|---|---|---|---|---|---|---|---|---|---|---|---|---|---|---|---|---|---|---|---|---|---|---|---|---|---|---|---|
| 1964 Nov 19 - 1965 Apr 25 (?) | Evidence from Observations: Reported | ||||||||||||||||||||||||||||||||||||||||||||||||||||||||||||||||||||
|
List of 12 Events for Episode 1 at West side of Green Lake, Denham caldera
|
|||||||||||||||||||||||||||||||||||||||||||||||||||||||||||||||||||||
1886 Mar Confirmed Eruption (Explosive / Effusive) VEI: 0
| Episode 1 | Eruption (Explosive / Effusive) | NNE flank (7.5 km from Raoul Island) | ||||||||||||||||||
|---|---|---|---|---|---|---|---|---|---|---|---|---|---|---|---|---|---|---|---|
| 1886 Mar - Unknown | Evidence from Observations: Reported | ||||||||||||||||||
|
List of 2 Events for Episode 1 at NNE flank (7.5 km from Raoul Island)
|
|||||||||||||||||||
[ 1872 Feb 1 ± 60 days ] Discredited Eruption
Widely repeated reports of eruptions prior to or after the 1870 eruption are based on secondary reports and cannot be substantiated (Lloyd and Nathan, 1981). New 1870 islands had disappeared by September 1872.
1870 Jun 20 ± 4 days - 1870 Oct 3 Confirmed Eruption (Explosive / Effusive) VEI: 3
| Episode 1 | Eruption (Explosive / Effusive) | Denham caldera, Green Lake | ||||||||||||||||||||||||||||||||||||||||||||||||
|---|---|---|---|---|---|---|---|---|---|---|---|---|---|---|---|---|---|---|---|---|---|---|---|---|---|---|---|---|---|---|---|---|---|---|---|---|---|---|---|---|---|---|---|---|---|---|---|---|---|
| 1870 Jun 20 ± 4 days - 1870 Oct 3 | Evidence from Observations: Reported | ||||||||||||||||||||||||||||||||||||||||||||||||
|
List of 8 Events for Episode 1 at Denham caldera, Green Lake
|
|||||||||||||||||||||||||||||||||||||||||||||||||
1814 Mar 9 Confirmed Eruption (Explosive / Effusive) VEI: 3
| Episode 1 | Eruption (Explosive / Effusive) | Denham caldera and Smith Crater | ||||||||||||||||||||||||||||||||||||||
|---|---|---|---|---|---|---|---|---|---|---|---|---|---|---|---|---|---|---|---|---|---|---|---|---|---|---|---|---|---|---|---|---|---|---|---|---|---|---|---|
| 1814 Mar 9 - Unknown | Evidence from Observations: Reported | ||||||||||||||||||||||||||||||||||||||
|
List of 6 Events for Episode 1 at Denham caldera and Smith Crater
|
|||||||||||||||||||||||||||||||||||||||
1720 ± 50 years Confirmed Eruption (Explosive / Effusive) VEI: 4
| Episode 1 | Eruption (Explosive / Effusive) | Denham Bay?, Tui Lake Crater | ||||||||||||||||||||||||||||||||||||||
|---|---|---|---|---|---|---|---|---|---|---|---|---|---|---|---|---|---|---|---|---|---|---|---|---|---|---|---|---|---|---|---|---|---|---|---|---|---|---|---|
| 1720 ± 50 years - Unknown | Evidence from Isotopic: 14C (uncalibrated) | ||||||||||||||||||||||||||||||||||||||
|
List of 6 Events for Episode 1 at Denham Bay?, Tui Lake Crater
|
|||||||||||||||||||||||||||||||||||||||
1630 ± 50 years Confirmed Eruption (Explosive / Effusive) VEI: 4
| Episode 1 | Eruption (Explosive / Effusive) | Rangitahua Crater | ||||||||||||||||||||||||||||||||||||||||||||||||
|---|---|---|---|---|---|---|---|---|---|---|---|---|---|---|---|---|---|---|---|---|---|---|---|---|---|---|---|---|---|---|---|---|---|---|---|---|---|---|---|---|---|---|---|---|---|---|---|---|---|
| 1630 ± 50 years - Unknown | Evidence from Isotopic: 14C (uncalibrated) | ||||||||||||||||||||||||||||||||||||||||||||||||
|
List of 8 Events for Episode 1 at Rangitahua Crater
|
|||||||||||||||||||||||||||||||||||||||||||||||||
1450 (?) Confirmed Eruption (Explosive / Effusive)
| Episode 1 | Eruption (Explosive / Effusive) | NE of Raoul Island (Meyer Islands) | ||||||||||||||||||
|---|---|---|---|---|---|---|---|---|---|---|---|---|---|---|---|---|---|---|---|
| 1450 (?) - Unknown | Evidence from Correlation: Tephrochronology | ||||||||||||||||||
|
List of 2 Events for Episode 1 at NE of Raoul Island (Meyer Islands)
|
|||||||||||||||||||
0850 (?) Confirmed Eruption (Explosive / Effusive) VEI: 4
| Episode 1 | Eruption (Explosive / Effusive) | Expedition Crater | |||||||||||||||||||||||
|---|---|---|---|---|---|---|---|---|---|---|---|---|---|---|---|---|---|---|---|---|---|---|---|---|
| 0850 (?) - Unknown | Evidence from Correlation: Tephrochronology | |||||||||||||||||||||||
|
List of 3 Events for Episode 1 at Expedition Crater
|
||||||||||||||||||||||||
0700 (?) Confirmed Eruption (Explosive / Effusive) VEI: 3
| Episode 1 | Eruption (Explosive / Effusive) | Pukekohu Crater | |||||||||||||||||||||||
|---|---|---|---|---|---|---|---|---|---|---|---|---|---|---|---|---|---|---|---|---|---|---|---|---|
| 0700 (?) - Unknown | Evidence from Correlation: Tephrochronology | |||||||||||||||||||||||
|
List of 3 Events for Episode 1 at Pukekohu Crater
|
||||||||||||||||||||||||
0550 (?) Confirmed Eruption (Explosive / Effusive) VEI: 4
| Episode 1 | Eruption (Explosive / Effusive) | Green Lake Pumice Crater | ||||||||||||||||||||||||||||||||||||||
|---|---|---|---|---|---|---|---|---|---|---|---|---|---|---|---|---|---|---|---|---|---|---|---|---|---|---|---|---|---|---|---|---|---|---|---|---|---|---|---|
| 0550 (?) - Unknown | Evidence from Isotopic: 14C (uncalibrated) | ||||||||||||||||||||||||||||||||||||||
|
List of 6 Events for Episode 1 at Green Lake Pumice Crater
|
|||||||||||||||||||||||||||||||||||||||
0400 (?) Confirmed Eruption (Explosive / Effusive) VEI: 4
| Episode 1 | Eruption (Explosive / Effusive) | S part Raoul Caldera, Raynor tephra | ||||||||||||||||||||||||||||
|---|---|---|---|---|---|---|---|---|---|---|---|---|---|---|---|---|---|---|---|---|---|---|---|---|---|---|---|---|---|
| 0400 (?) - Unknown | Evidence from Correlation: Tephrochronology | ||||||||||||||||||||||||||||
|
List of 4 Events for Episode 1 at S part Raoul Caldera, Raynor tephra
|
|||||||||||||||||||||||||||||
0100 (?) Confirmed Eruption (Explosive / Effusive) VEI: 4
| Episode 1 | Eruption (Explosive / Effusive) | N flank Moumoukai volcano, Judith tephra | |||||||||||||||||||||||||||||||||||||||||||
|---|---|---|---|---|---|---|---|---|---|---|---|---|---|---|---|---|---|---|---|---|---|---|---|---|---|---|---|---|---|---|---|---|---|---|---|---|---|---|---|---|---|---|---|---|
| 0100 (?) - Unknown | Evidence from Correlation: Tephrochronology | |||||||||||||||||||||||||||||||||||||||||||
|
List of 7 Events for Episode 1 at N flank Moumoukai volcano, Judith tephra
|
||||||||||||||||||||||||||||||||||||||||||||
0050 BCE (?) Confirmed Eruption (Explosive / Effusive) VEI: 3 (?)
| Episode 1 | Eruption (Explosive / Effusive) | Denham caldera?, Bell tephra | ||||||||||||||||||||||||||||
|---|---|---|---|---|---|---|---|---|---|---|---|---|---|---|---|---|---|---|---|---|---|---|---|---|---|---|---|---|---|
| 0050 BCE (?) - Unknown | Evidence from Correlation: Tephrochronology | ||||||||||||||||||||||||||||
|
List of 4 Events for Episode 1 at Denham caldera?, Bell tephra
|
|||||||||||||||||||||||||||||
0250 BCE ± 75 years Confirmed Eruption (Explosive / Effusive) VEI: 6
| Episode 1 | Eruption (Explosive / Effusive) | Denham caldera, Fleetwood tephra | ||||||||||||||||||||||||||||||||||||||||||||||||
|---|---|---|---|---|---|---|---|---|---|---|---|---|---|---|---|---|---|---|---|---|---|---|---|---|---|---|---|---|---|---|---|---|---|---|---|---|---|---|---|---|---|---|---|---|---|---|---|---|---|
| 0250 BCE ± 75 years - Unknown | Evidence from Isotopic: 14C (uncalibrated) | ||||||||||||||||||||||||||||||||||||||||||||||||
|
List of 8 Events for Episode 1 at Denham caldera, Fleetwood tephra
|
|||||||||||||||||||||||||||||||||||||||||||||||||
1200 BCE ± 150 years Confirmed Eruption (Explosive / Effusive) VEI: 4
| Episode 1 | Eruption (Explosive / Effusive) | SW part of Raoul caldera, Oneraki tephra | |||||||||||||||||||||||||||||||||||||||||||
|---|---|---|---|---|---|---|---|---|---|---|---|---|---|---|---|---|---|---|---|---|---|---|---|---|---|---|---|---|---|---|---|---|---|---|---|---|---|---|---|---|---|---|---|---|
| 1200 BCE ± 150 years - Unknown | Evidence from Isotopic: 14C (uncalibrated) | |||||||||||||||||||||||||||||||||||||||||||
|
List of 7 Events for Episode 1 at SW part of Raoul caldera, Oneraki tephra
|
||||||||||||||||||||||||||||||||||||||||||||
2000 BCE ± 100 years Confirmed Eruption (Explosive / Effusive) VEI: 4
| Episode 1 | Eruption (Explosive / Effusive) | SE Raoul caldera, Matatirohia tephra | ||||||||||||||||||||||||||||||||||||||
|---|---|---|---|---|---|---|---|---|---|---|---|---|---|---|---|---|---|---|---|---|---|---|---|---|---|---|---|---|---|---|---|---|---|---|---|---|---|---|---|
| 2000 BCE ± 100 years - Unknown | Evidence from Isotopic: 14C (uncalibrated) | ||||||||||||||||||||||||||||||||||||||
|
List of 6 Events for Episode 1 at SE Raoul caldera, Matatirohia tephra
|
|||||||||||||||||||||||||||||||||||||||
This compilation of synonyms and subsidiary features may not be comprehensive. Features are organized into four major categories: Cones, Craters, Domes, and Thermal Features. Synonyms of features appear indented below the primary name. In some cases additional feature type, elevation, or location details are provided.
Synonyms |
||||
| Recherche, La | Sunday Island | Boat Cove | ||||
Cones |
||||
| Feature Name | Feature Type | Elevation | Latitude | Longitude |
| Hutchison | Stratovolcano | |||
| Moumoukai | Stratovolcano | |||
Craters |
||||
| Feature Name | Feature Type | Elevation | Latitude | Longitude |
| Blue Lake | Crater | |||
| Denham Bay | Caldera | |||
| Expedition Crater | Crater | |||
| Green Lake Pumice Crater | Crater | |||
| Herald Islets | Crater | |||
| Pukekohu | Crater | |||
| Rangitahua | Crater | |||
| Smith Crater | Crater | |||
| Tui Lake | Crater | |||
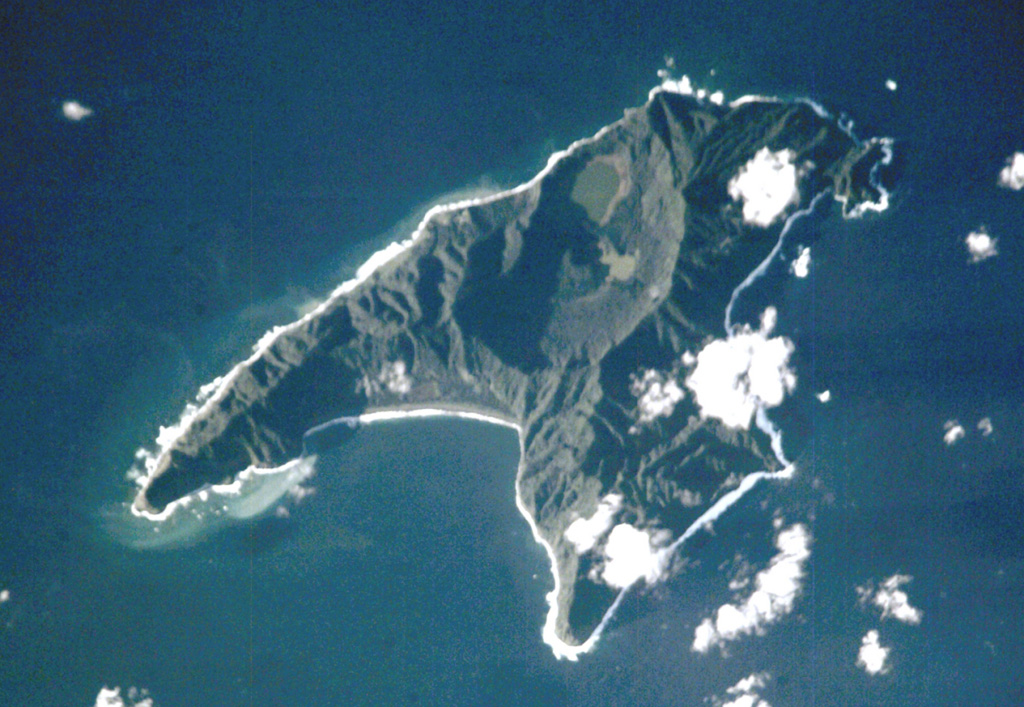
 Anvil-shaped Raoul Island is the largest and northernmost of the Kermadec Islands. Two calderas are prominent in this International Space Station view with N to the upper right. The 2.5 x 3.5 km caldera cuts the center of the island, and the E wall of the partially submerged Denham Bay caldera rises above the smooth coastline at the left-center. The 6.5 x 4 km wide Denham Bay caldera formed during a major dacitic explosive eruption about 2,200 years ago, which truncated the W side of the island.
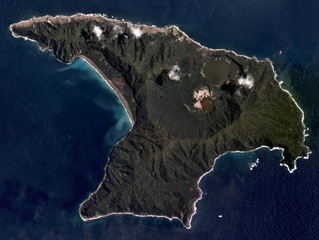 Raoul Island in the Kermadec Islands has two main calderas, one in the center of the island (Raoul Caldera) and one forming the linear western shoreline (Denham Caldera), shown in this November 2019 Planet Labs satellite image monthly mosaic (N is at the top; this image is approximately 11 km across). The Blue (upper) and Green (lower) lakes are within Raoul Caldera, with the 1964 crater along the NW edge of the Green Lake.
There are no samples for Raoul Island in the Smithsonian's NMNH Department of Mineral Sciences Rock and Ore collection.
| Copernicus Browser | The Copernicus Browser replaced the Sentinel Hub Playground browser in 2023, to provide access to Earth observation archives from the Copernicus Data Space Ecosystem, the main distribution platform for data from the EU Copernicus missions. |
| MIROVA | Middle InfraRed Observation of Volcanic Activity (MIROVA) is a near real time volcanic hot-spot detection system based on the analysis of MODIS (Moderate Resolution Imaging Spectroradiometer) data. In particular, MIROVA uses the Middle InfraRed Radiation (MIR), measured over target volcanoes, in order to detect, locate and measure the heat radiation sourced from volcanic activity. |
| MODVOLC Thermal Alerts | Using infrared satellite Moderate Resolution Imaging Spectroradiometer (MODIS) data, scientists at the Hawai'i Institute of Geophysics and Planetology, University of Hawai'i, developed an automated system called MODVOLC to map thermal hot-spots in near real time. For each MODIS image, the algorithm automatically scans each 1 km pixel within it to check for high-temperature hot-spots. When one is found the date, time, location, and intensity are recorded. MODIS looks at every square km of the Earth every 48 hours, once during the day and once during the night, and the presence of two MODIS sensors in space allows at least four hot-spot observations every two days. Each day updated global maps are compiled to display the locations of all hot spots detected in the previous 24 hours. There is a drop-down list with volcano names which allow users to 'zoom-in' and examine the distribution of hot-spots at a variety of spatial scales. |
|
WOVOdat
Single Volcano View Temporal Evolution of Unrest Side by Side Volcanoes |
WOVOdat is a database of volcanic unrest; instrumentally and visually recorded changes in seismicity, ground deformation, gas emission, and other parameters from their normal baselines. It is sponsored by the World Organization of Volcano Observatories (WOVO) and presently hosted at the Earth Observatory of Singapore.
GVMID Data on Volcano Monitoring Infrastructure The Global Volcano Monitoring Infrastructure Database GVMID, is aimed at documenting and improving capabilities of volcano monitoring from the ground and space. GVMID should provide a snapshot and baseline view of the techniques and instrumentation that are in place at various volcanoes, which can be use by volcano observatories as reference to setup new monitoring system or improving networks at a specific volcano. These data will allow identification of what monitoring gaps exist, which can be then targeted by remote sensing infrastructure and future instrument deployments. |
| Volcanic Hazard Maps | The IAVCEI Commission on Volcanic Hazards and Risk has a Volcanic Hazard Maps database designed to serve as a resource for hazard mappers (or other interested parties) to explore how common issues in hazard map development have been addressed at different volcanoes, in different countries, for different hazards, and for different intended audiences. In addition to the comprehensive, searchable Volcanic Hazard Maps Database, this website contains information about diversity of volcanic hazard maps, illustrated using examples from the database. This site is for educational purposes related to volcanic hazard maps. Hazard maps found on this website should not be used for emergency purposes. For the most recent, official hazard map for a particular volcano, please seek out the proper institutional authorities on the matter. |
| IRIS seismic stations/networks | Incorporated Research Institutions for Seismology (IRIS) Data Services map showing the location of seismic stations from all available networks (permanent or temporary) within a radius of 0.18° (about 20 km at mid-latitudes) from the given location of Raoul Island. Users can customize a variety of filters and options in the left panel. Note that if there are no stations are known the map will default to show the entire world with a "No data matched request" error notice. |
| UNAVCO GPS/GNSS stations | Geodetic Data Services map from UNAVCO showing the location of GPS/GNSS stations from all available networks (permanent or temporary) within a radius of 20 km from the given location of Raoul Island. Users can customize the data search based on station or network names, location, and time window. Requires Adobe Flash Player. |
| DECADE Data | The DECADE portal, still in the developmental stage, serves as an example of the proposed interoperability between The Smithsonian Institution's Global Volcanism Program, the Mapping Gas Emissions (MaGa) Database, and the EarthChem Geochemical Portal. The Deep Earth Carbon Degassing (DECADE) initiative seeks to use new and established technologies to determine accurate global fluxes of volcanic CO2 to the atmosphere, but installing CO2 monitoring networks on 20 of the world's 150 most actively degassing volcanoes. The group uses related laboratory-based studies (direct gas sampling and analysis, melt inclusions) to provide new data for direct degassing of deep earth carbon to the atmosphere. |
| Large Eruptions of Raoul Island | Information about large Quaternary eruptions (VEI >= 4) is cataloged in the Large Magnitude Explosive Volcanic Eruptions (LaMEVE) database of the Volcano Global Risk Identification and Analysis Project (VOGRIPA). |
| EarthChem | EarthChem develops and maintains databases, software, and services that support the preservation, discovery, access and analysis of geochemical data, and facilitate their integration with the broad array of other available earth science parameters. EarthChem is operated by a joint team of disciplinary scientists, data scientists, data managers and information technology developers who are part of the NSF-funded data facility Integrated Earth Data Applications (IEDA). IEDA is a collaborative effort of EarthChem and the Marine Geoscience Data System (MGDS). |

