The Pusat Vulkanologi dan Mitigasi Bencana Geologi (PVMBG) reported that elevated unrest continued at Tangkuban Parahu during 11-17 June. Activity included daily steam-and-gas emissions, along with ongoing fluctuations in seismicity. The Alert Level remained at 1 (on a scale of 1-4) and tourists were advised not to descend into the craters.
Source: Pusat Vulkanologi dan Mitigasi Bencana Geologi (PVMBG, also known as CVGHM)
Phreatic eruption on 27 July followed by intermittent explosions through to 17 September 2019
Tangkuban is located in the West Bandung and Subang Regencies in the West Java Province and has two main summit craters, Ratu and Upas (figure 3). Recent activity has largely consisted of phreatic explosions and gas-and-steam plumes at the Ratu crater. Prior to July 2019, the most recent activity occurred in 2012-2013, ending with a phreatic eruption on 5 October 2013 (BGVN 40:04). Background activity includes geothermal activity in the Ratu crater consisting of gas and steam emission (figure 4). This area is a tourist destination with infrastructure, and often people, overlooking the active crater. This report summarizes activity during 2014 through September 2019 and is based on official agency reports. Monitoring is the responsibility of Pusat Vulkanologi dan Mitigasi Bencana Geologi (PVMBG, also known as Indonesian Center for Volcanology and Geological Hazard Mitigation, CVGHM).
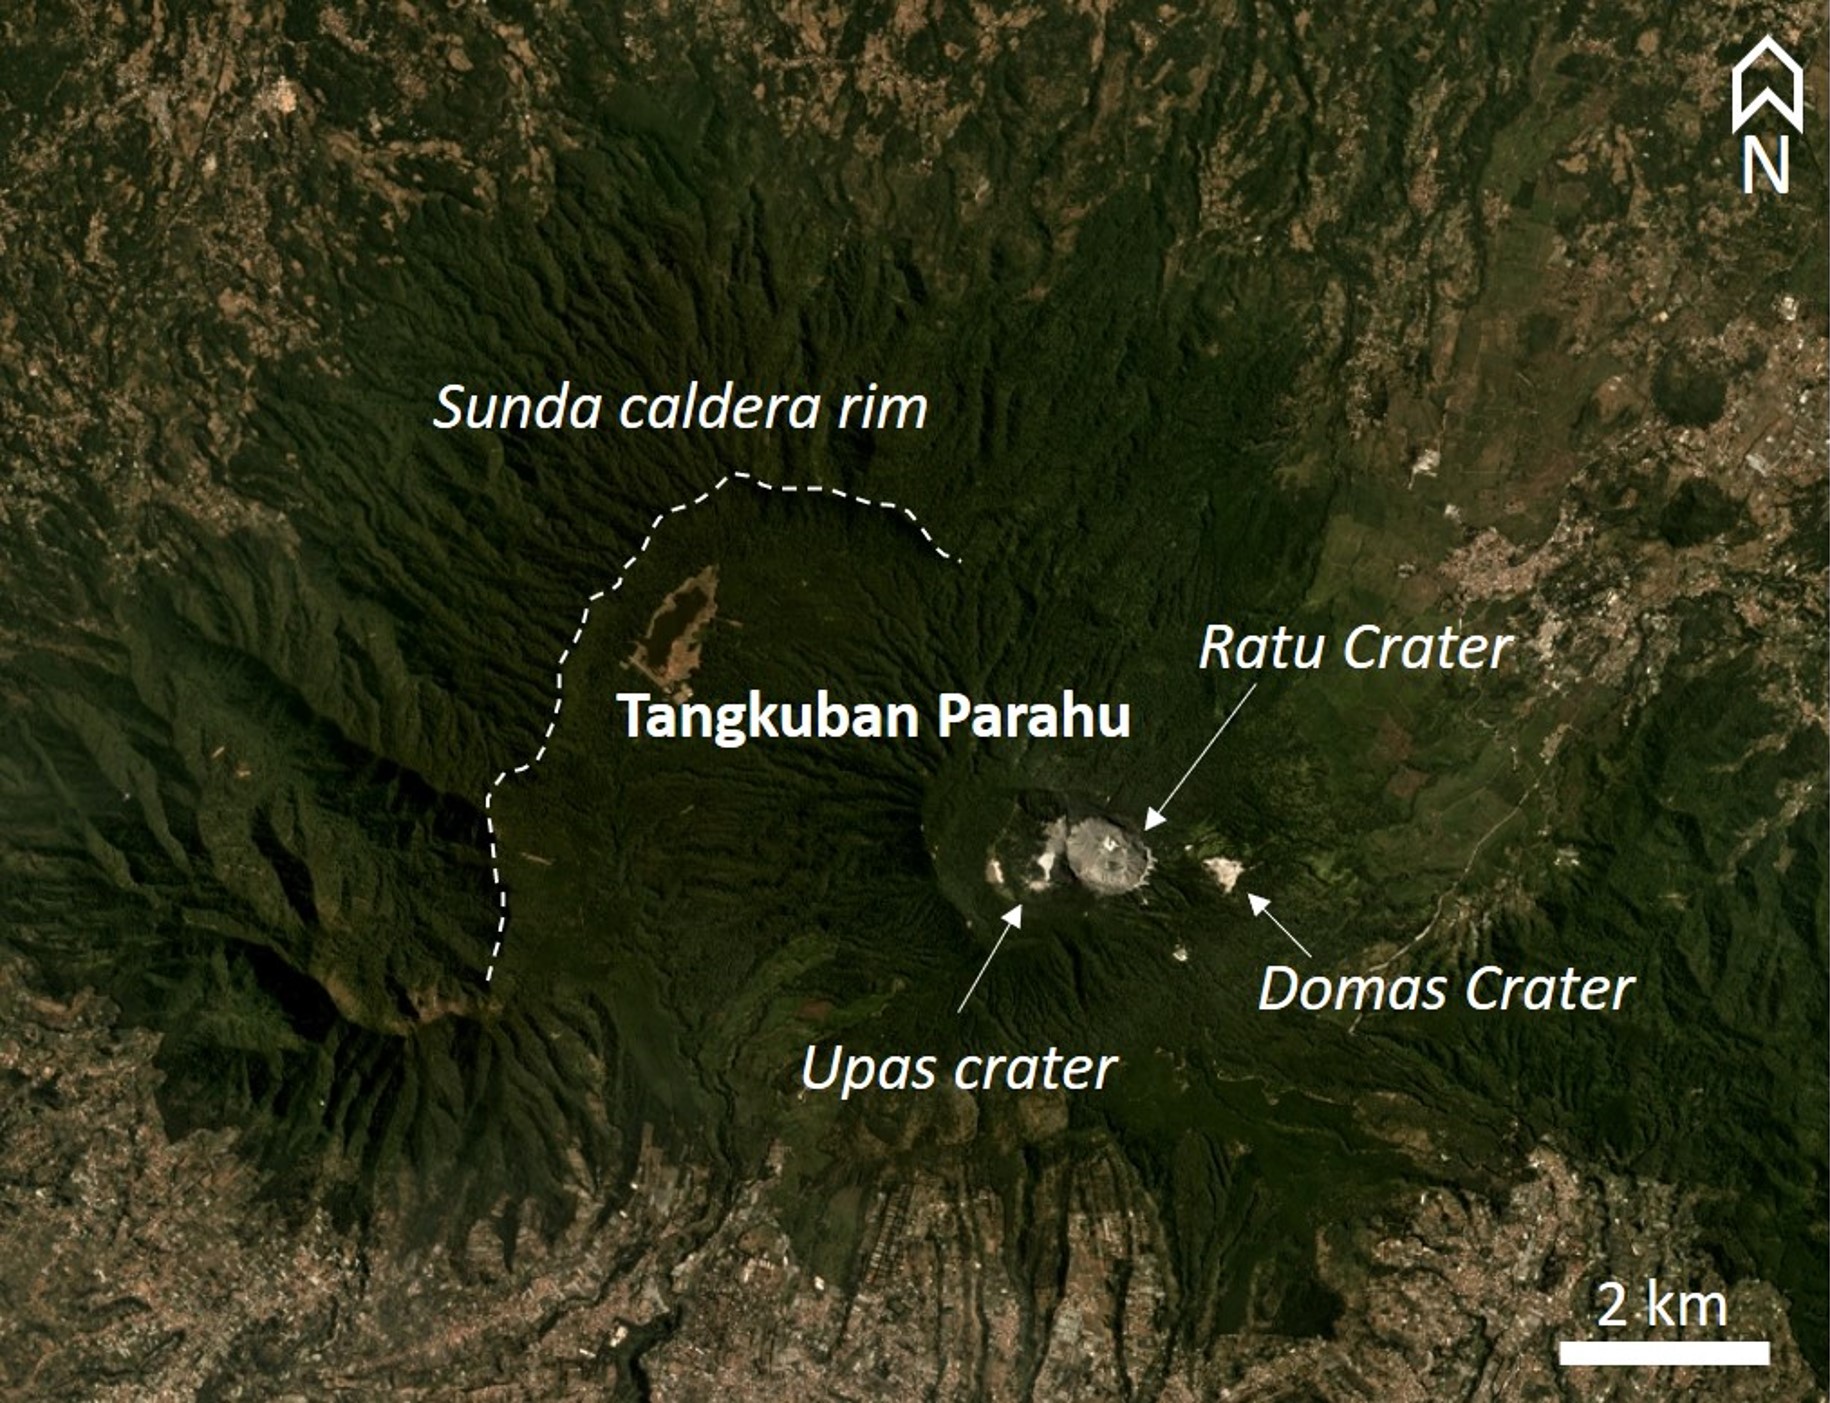 |
Figure 3. Map of Tangkuban Parahu showing the Sunda Caldera rim and the Ratu, Upas, and Domas craters. Basemap is the August 2019 mosaic, copyright 2019 Planet Labs, Inc. |
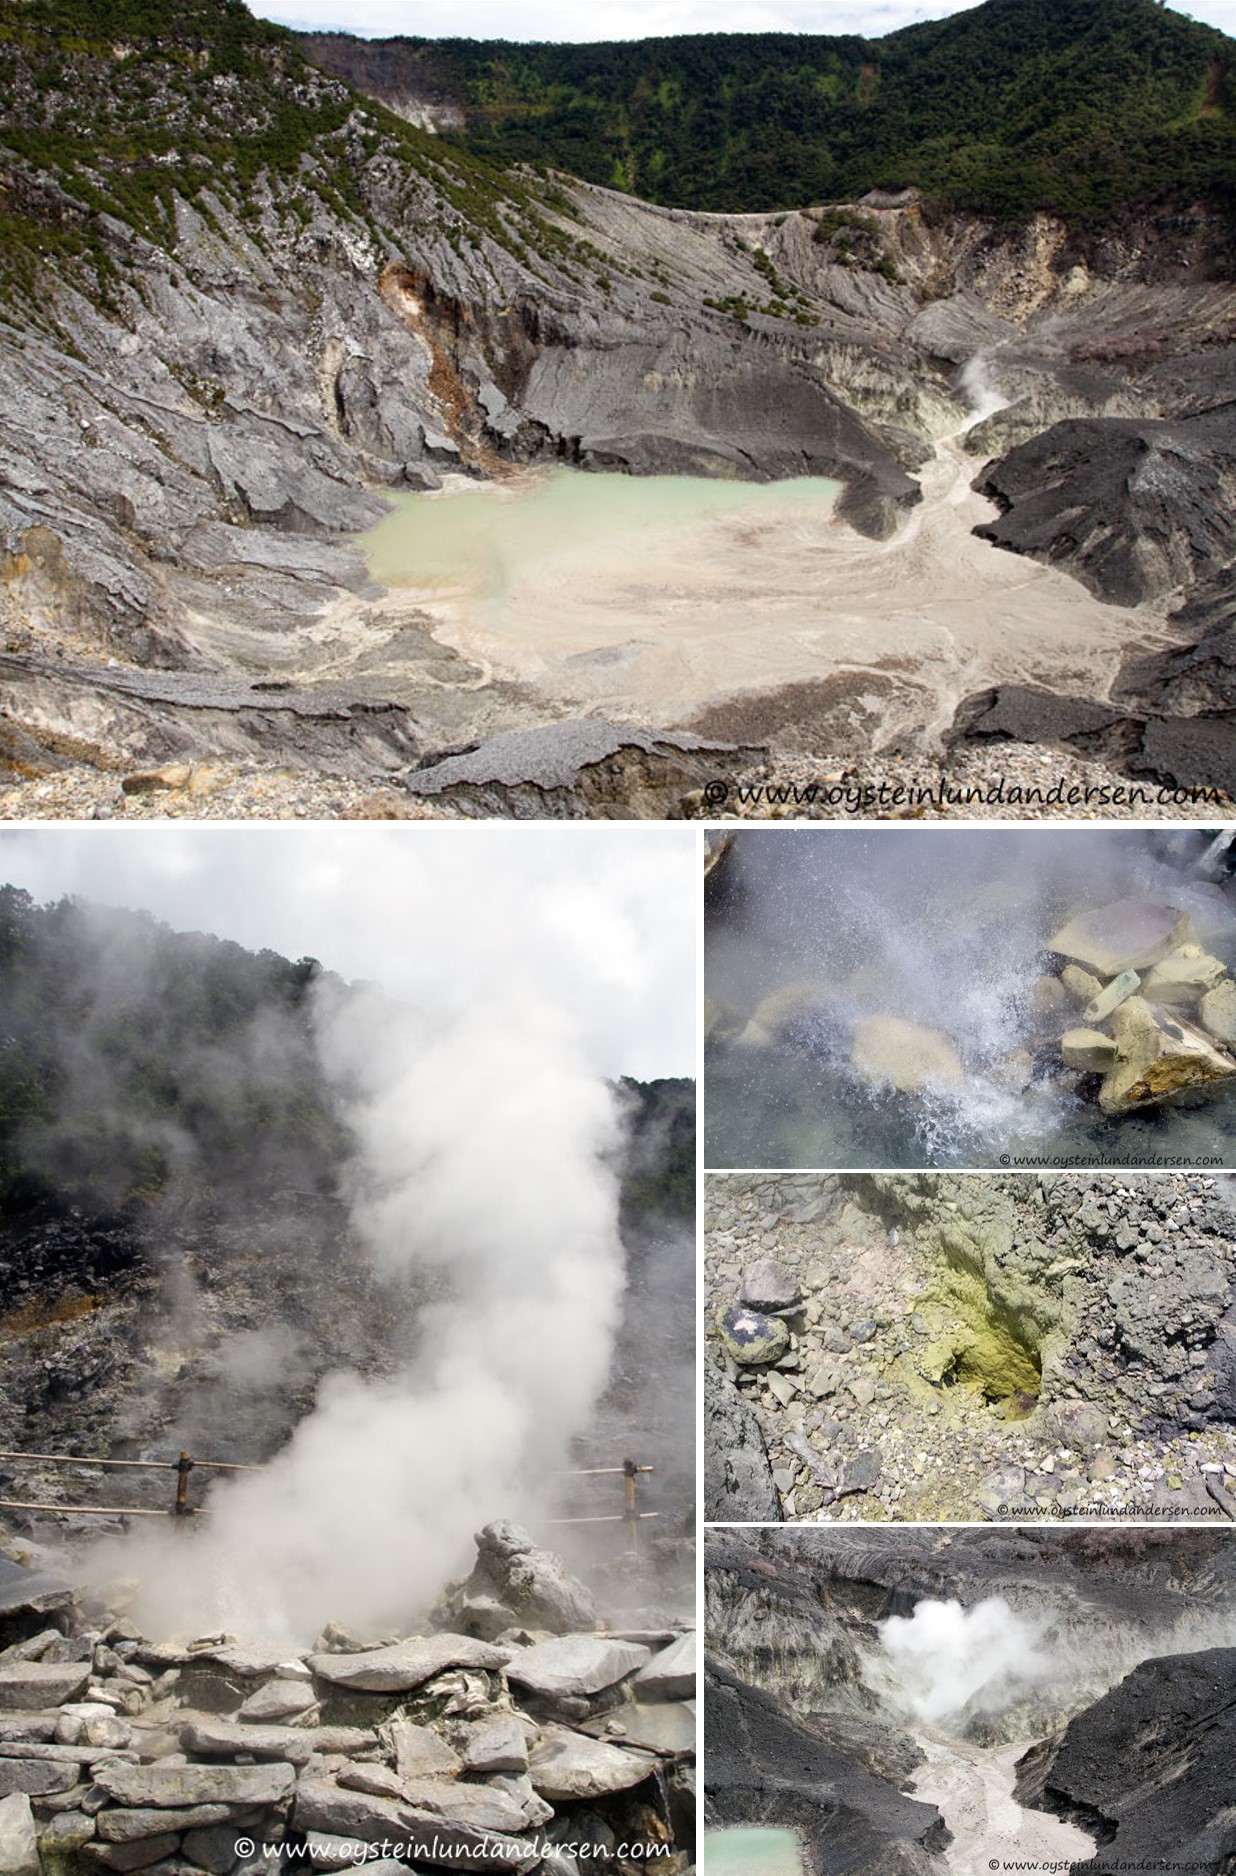 |
Figure 4. Background activity at the Ratu crater of Tangkuban Parahu is shown in these images from 1 May 2012. The top image is an overview of the crater and the bottom four images show typical geothermal activity. Copyrighted photos by Øystein Lund Andersen, used with permission. |
The first reported activity in 2014 consisted of gas-and-steam plumes during October-December, prompting PVMBG to increase the alert level from I to II on 31 December 2014. These white plumes reached a maximum of 50 m above the Ratu crater (figure 5) and were accompanied by elevated seismicity and deformation. This prompted the implementation of an exclusion zone with a radius of 1.5 km around the crater. The activity decreased and the alert level was lowered back to I on 8 January 2015. There was no further reported activity from January 2015 through mid-2019.
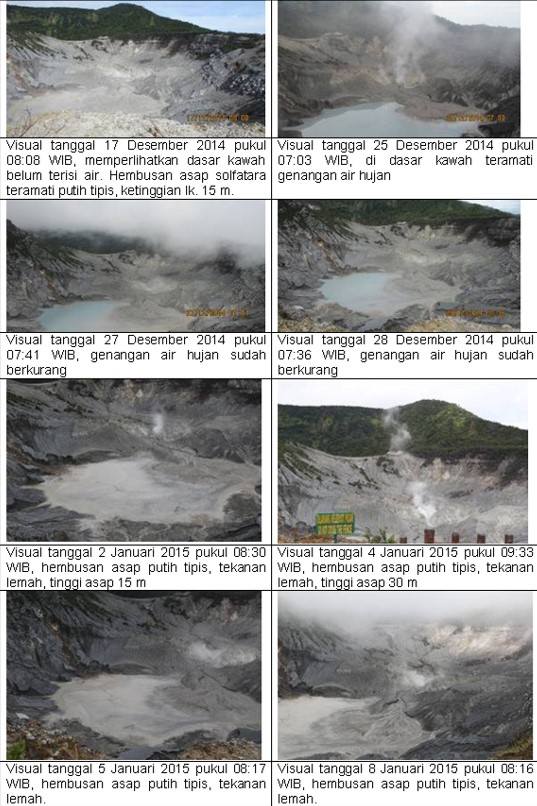 |
Figure 5. Changes at the Ratu crater of Tangkuban Parahu during 25 December 2014 to 8 January 2015. Rain water accumulated in the crater in December and intermittent gas-and-steam plumes were observed. Courtesy of PVMBG (8 January 2015 report). |
From 27 June 2019 an increase in activity was recorded in seismicity, deformation, gas chemistry, and visual observations. By 24 July the responsible government agencies had communicated that the volcano could erupt at any time. At 1548 on 26 July a phreatic (steam-driven) explosion ejected an ash plume that reached 200 m; a steam-rich plume rose to 600 m above the Ratu crater (figures 6, and 7). People were on the crater rim at the time and videos show a white plume rising from the crater followed by rapid jets of ash and sediment erupting through the first plume. Deposition of eruption material was 5-7 cm thick and concentrated within a 500 m radius from the point between the Rata and Upas craters, and wider deposition occurred within 2 km of the crater (figures 8 and 9). According to seismic data, the eruption lasted around 5 minutes and 30 seconds (figure 10). Videos show several pulses of ash that fell back into the crater, followed by an ash plume moving laterally towards the viewers.
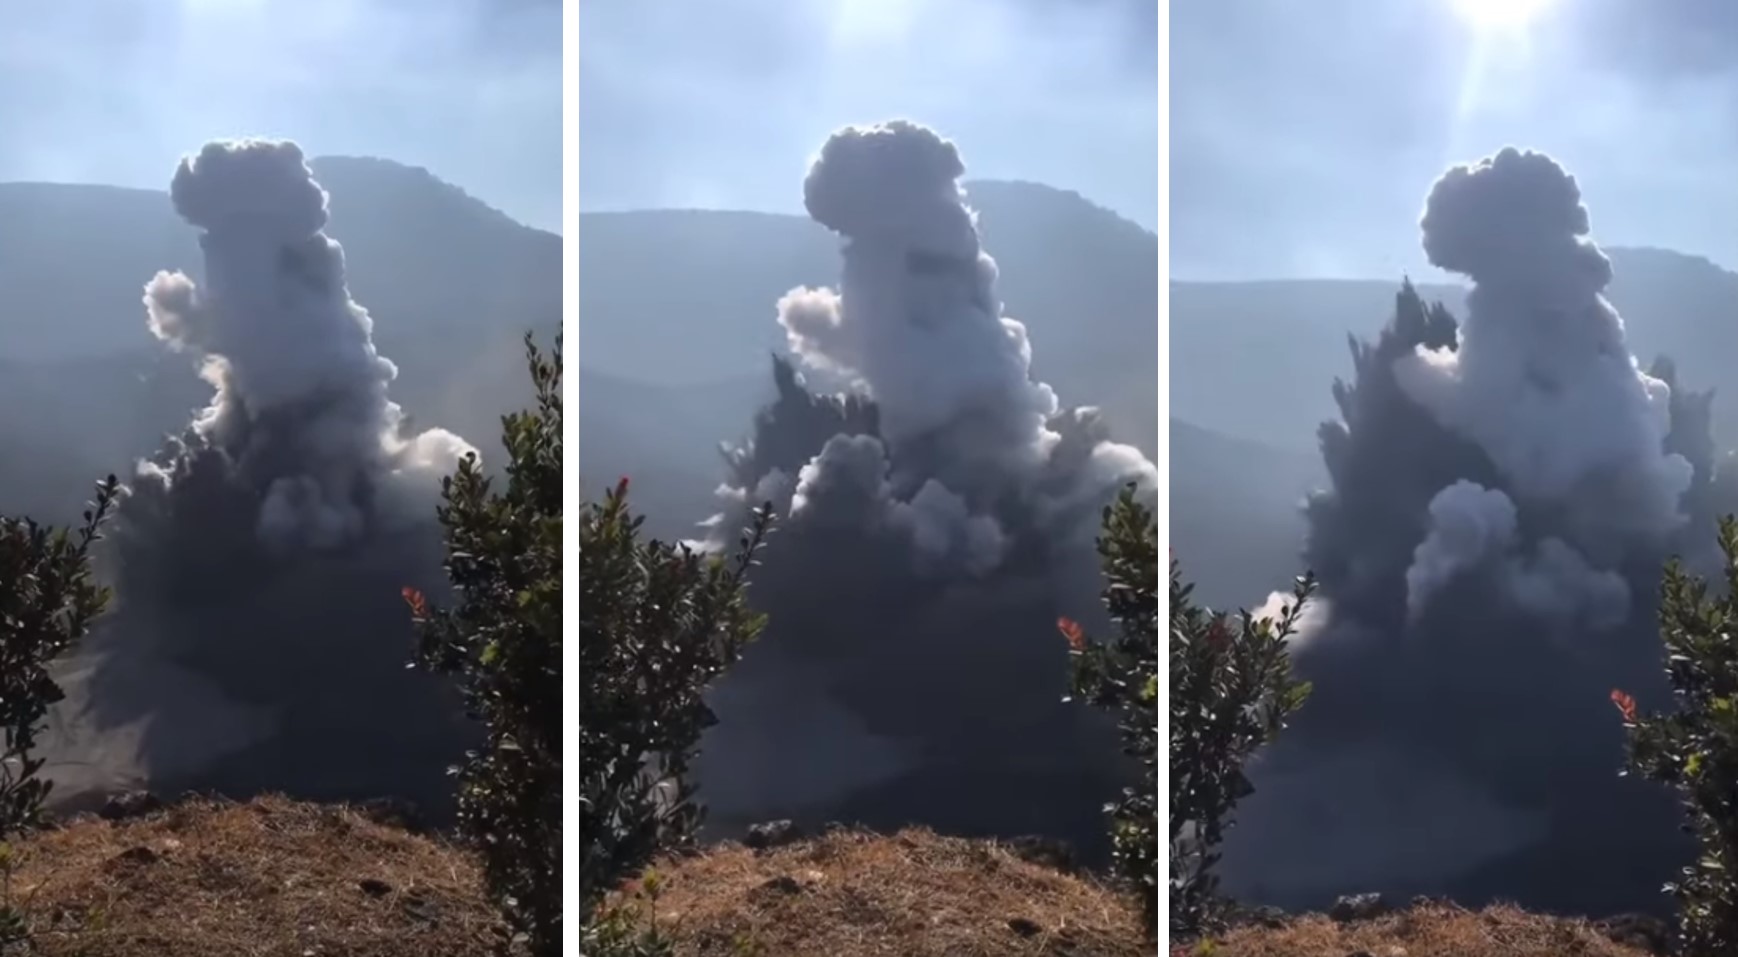 |
Figure 6. These screenshots are from a video taken from the Ratu crater rim at Tangkuban Parahu on 26 July 2019. Initially there is a white gas-and-steam plume rising from the crater, then a high-velocity black jet of ash and sediment rises through the plume. This video was widely shared across multiple social media platforms, but the original source could not be identified. |
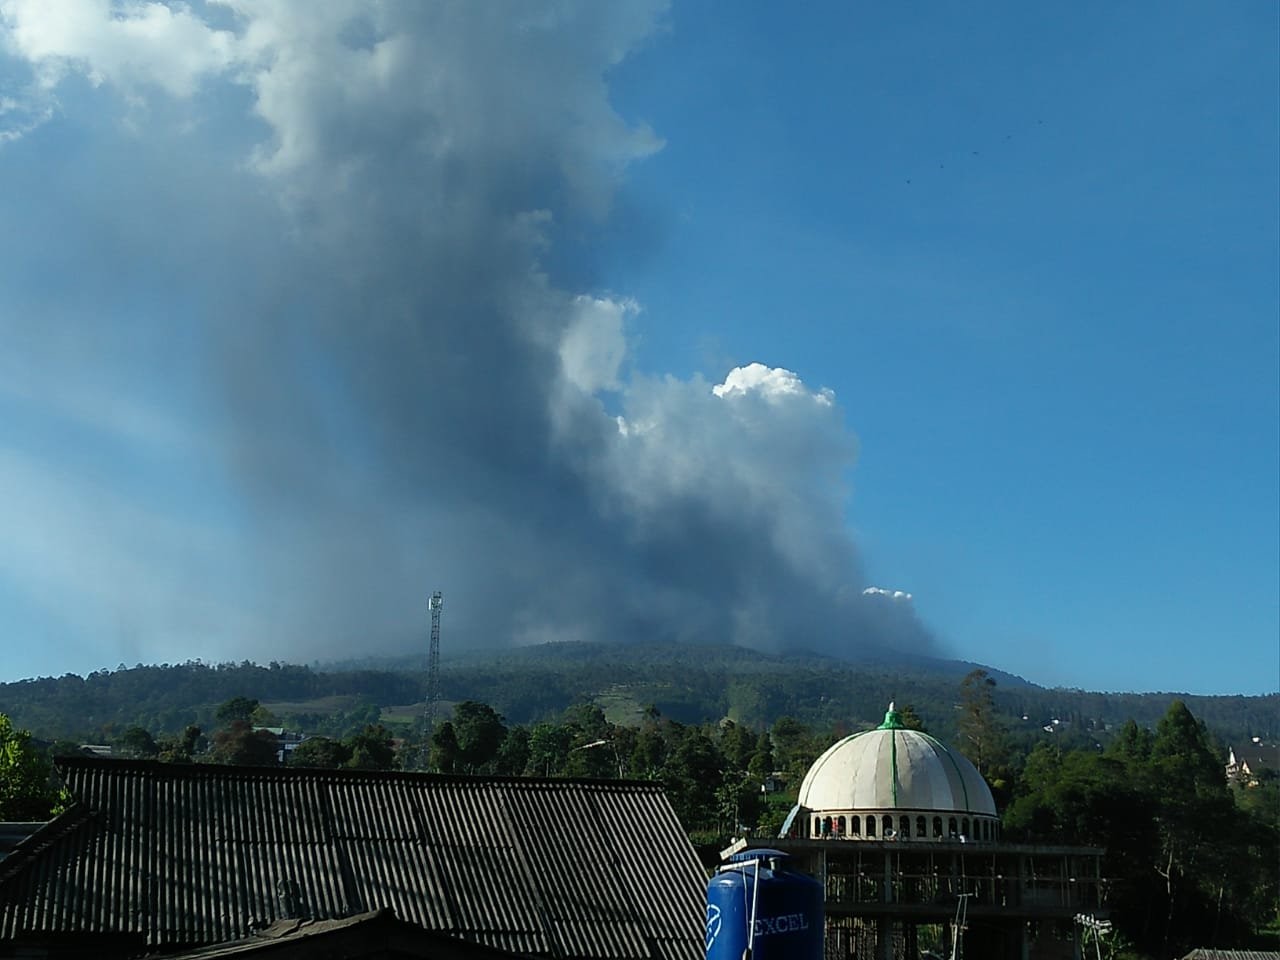 |
Figure 7. The ash plume at Tangkuban Parahu on 26 July 2019. Courtesy of BNPB. |
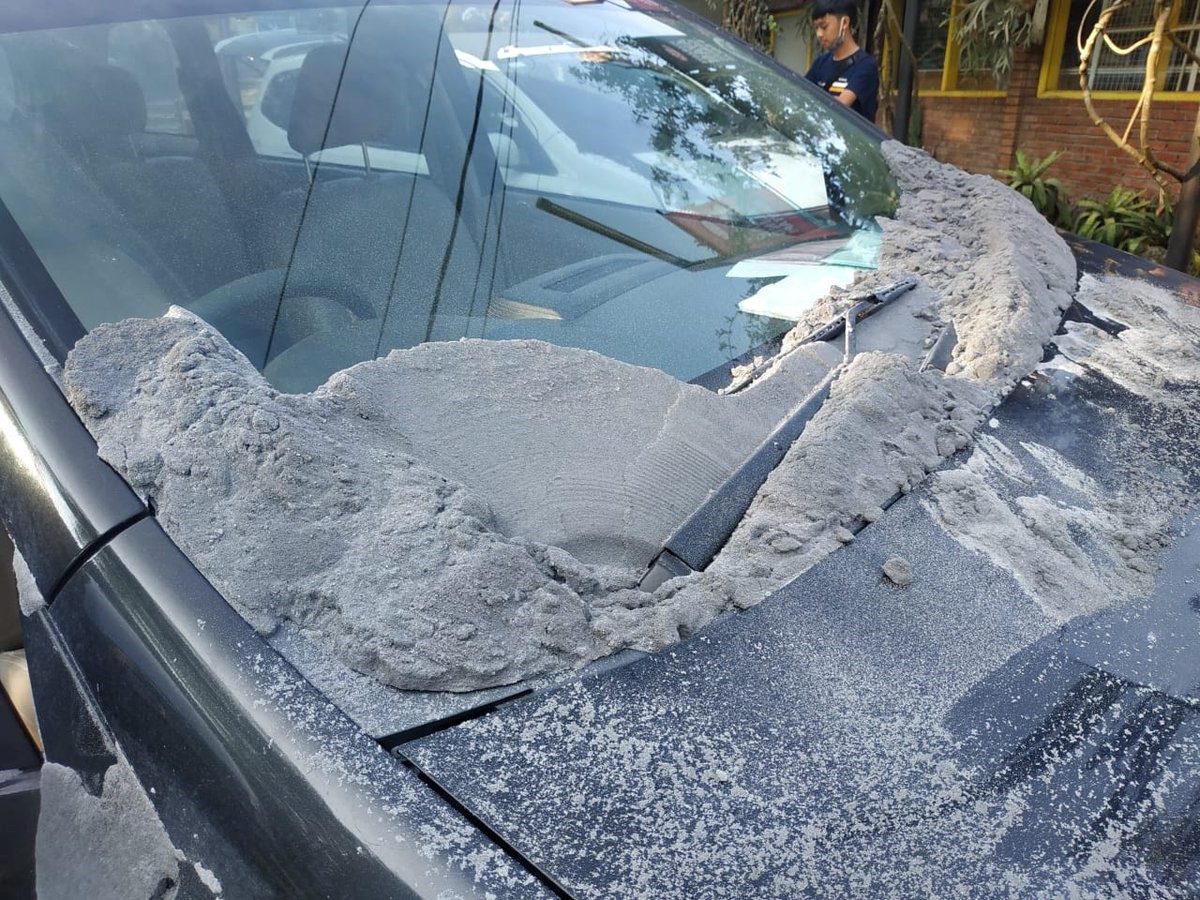 |
Figure 8. Volcanic ash and lapilli was deposited around the Ratu crater of Tangkuban Parahu during a phreatic eruption on 26 July 2019. Note that the deposits have slumped down the window and are thicker than the actual ashfall. Courtesy of BNPB. |
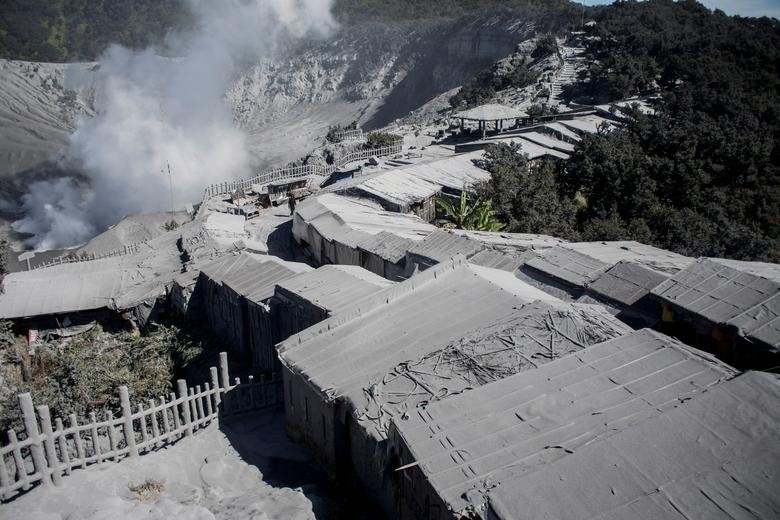 |
Figure 9. Ash was deposited on buildings that line the Ratu crater at Tangkuban Parahu during a phreatic eruption on 26 July 2019. Photo courtesy of Novrian Arbi/via Reuters. |
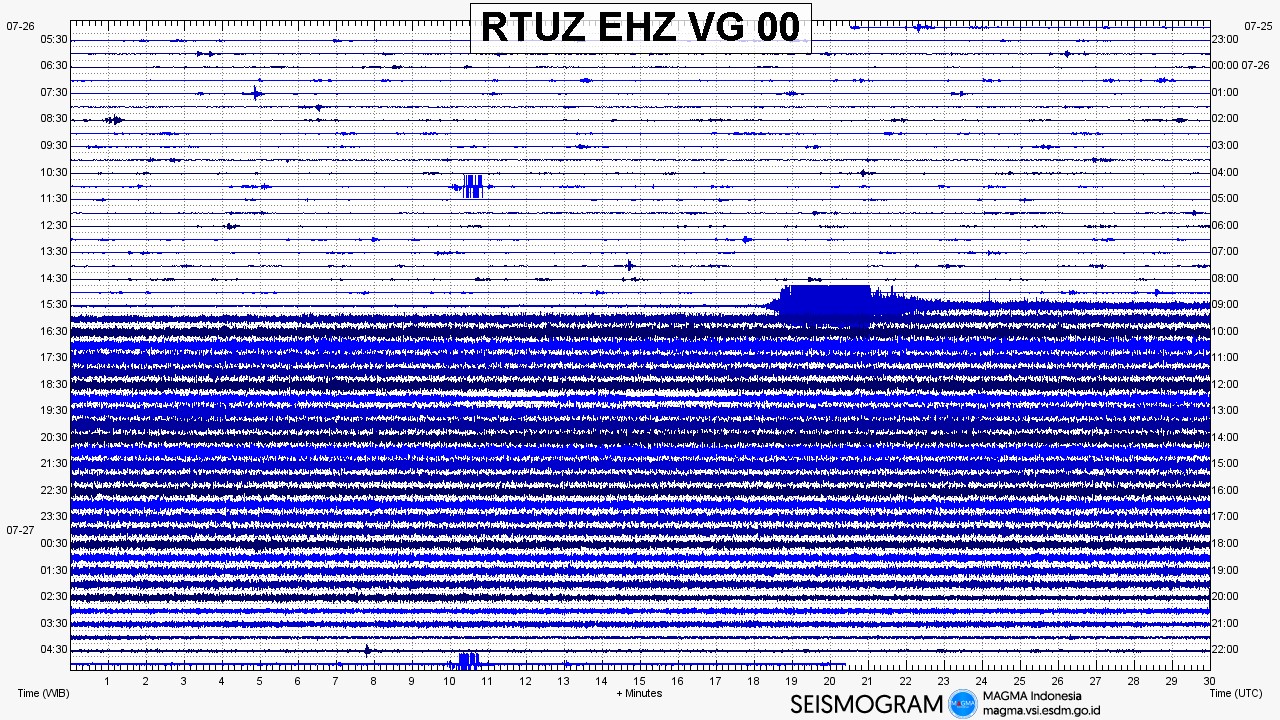 |
Figure 10. A seismogram showing the onset of the 26 July 2019 eruption of Tangkuban Parahu and the elevated seismicity following the event. Courtesy of PVMBG via Øystein Lund Andersen. |
On 27 July, the day after the eruption, Øystein Lund Andersen observed the volcano using a drone camera, operated from outside the restricted zone. Over a period of two hours the crater produced a small steam plume; ashfall and small blocks from the initial eruption are visible in and around the crater (figure 11). The ashfall is also visible in satellite imagery, which shows that deposition was restricted to the immediate vicinity to the SW of the crater (figure 12).
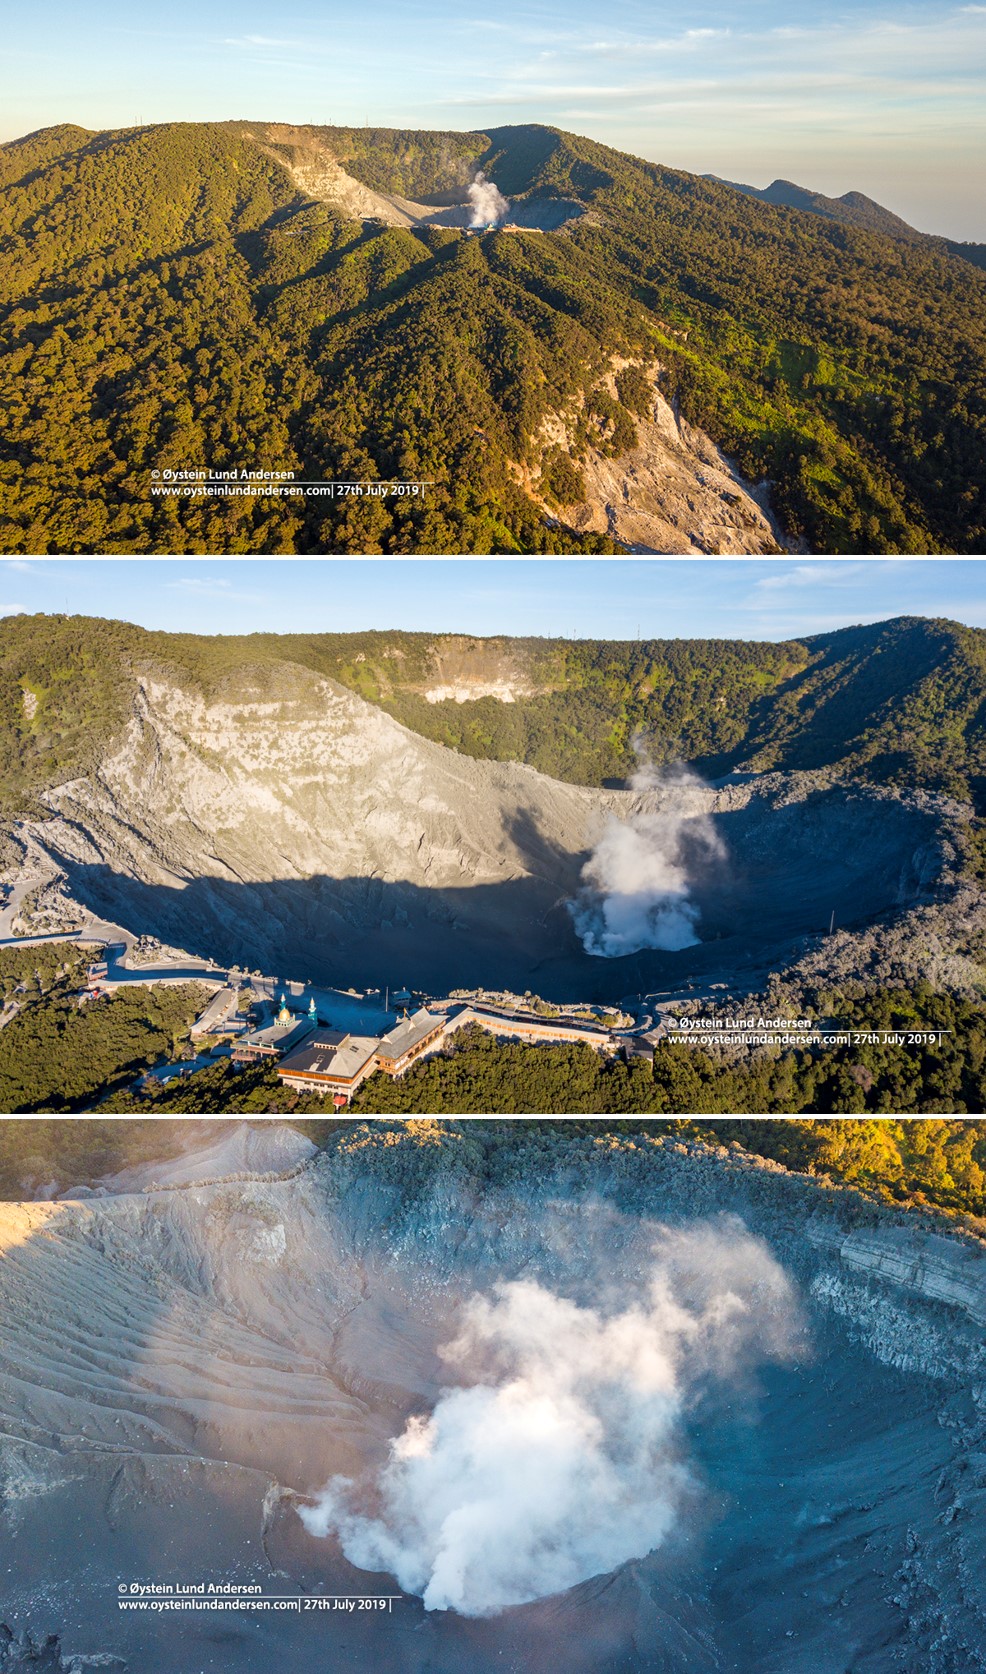 |
Figure 11. Photos of the Ratu crater of Tangkuban Parahu on 27 July 2019, the day after a phreatic eruption. A small steam plume continued through the day. Courtesy of Øystein Lund Andersen. |
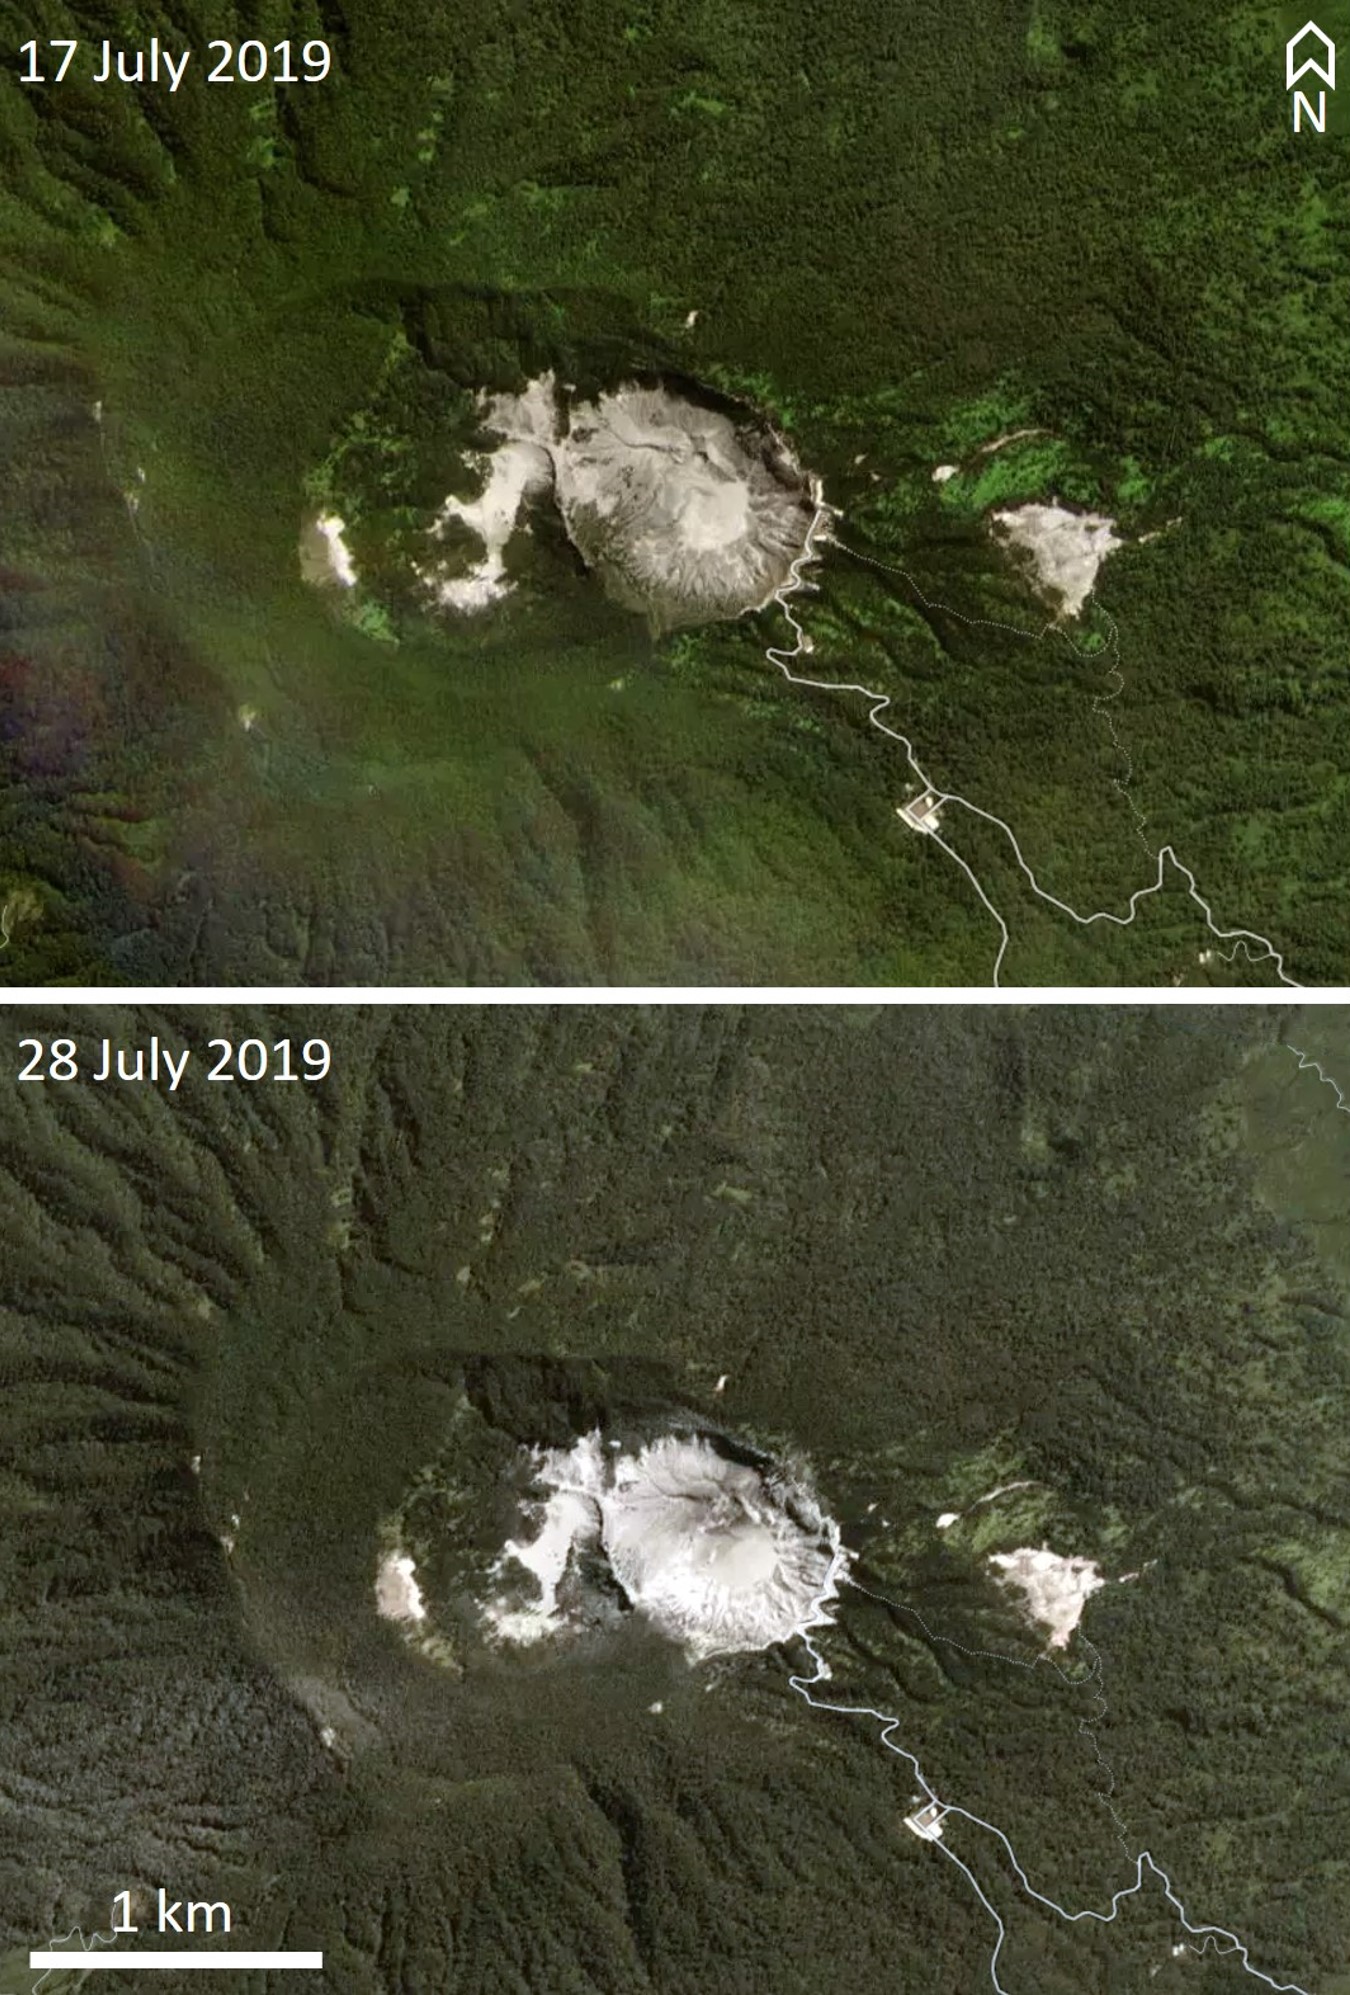 |
Figure 12. PlanetScope satellite images showing the Ratu crater of Tangkuban Parahu before (17 July 2019) and after (28 July 2019) the explosion that took place on 26 July 2019. Natural color PlanetScope Imagery, copyright 2019 Planet Labs, Inc. |
Another eruption occurred at 2046 on 1 August 2019 and lasted around 11 minutes, producing a plume up to 180 m above the vent. Additional explosions occurred at 0043 on 2 August, lasting around 3 minutes according to seismic data, but were not observed. Explosions continued to be recorded at 0145, 0357, and 0406 at the time of the PVMBG report when the last explosion was ongoing, and a photo shows an explosion at 0608 (figure 13). The explosions produced plumes that reached between 20 and 200 m above the vent. Due to elevated activity the Alert Level was increased to II on 2 August. Ash emission continued through the 4th. During 5-11 August events ejecting ash continued to produce plumes up to 80 m, and gas-and-steam plumes up to 200 m above the vent. Ashfall was localized around Ratu crater. The following week, 12-18 August, activity continued with ash and gas-and-steam plumes reaching 100-200 m above the vent. During 19-25 August, similar activity sent ash to 50-180 m, and gas-and-steam plumes to 200 m. A larger phreatic explosion occurred at 0930 on 31 August with an ash plume reaching 300 m, and a gas-and-steam plume reaching 600 m above the vent, depositing ash and sediment around the crater.
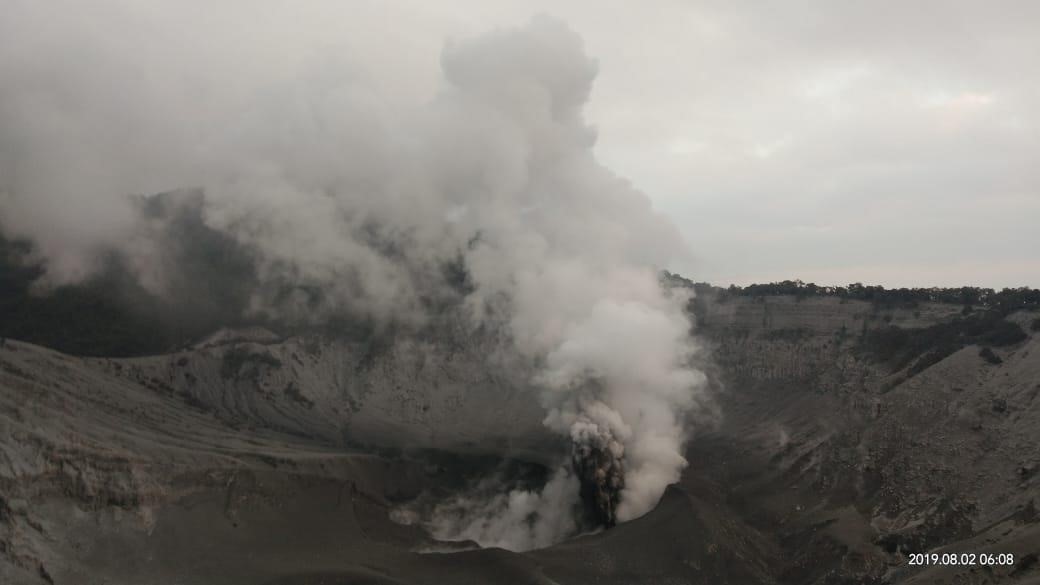 |
Figure 13. A small ash plume below a white gas-and-steam plume erupting from the Ratu crater of Tangkuban Parahu on 2 August 2019 at 0608. Courtesy of PVBMG (2 August 2019 report). |
In early September activity consisted of gas-and-steam plumes up to 100-180 m above the vent with some ash plumes observed (figure 14). Two larger explosions occurred at 1657 and 1709 on 7 September with ash reaching 180 m, and gas-and-steam up to 200 m above the vent. Ash and sediment deposited around the crater. Due to strong winds to the SSW, the smell of sulfur was reported around Cimahi City in West Bandung, although there was no detected increase in sulfur emissions. A phreatic explosion on 17 September produced an ash plume to 40 m and a steam plume to 200 m above the crater. Weak gas-and-steam emissions reaching 200 m above the vent continued through to the end of September.
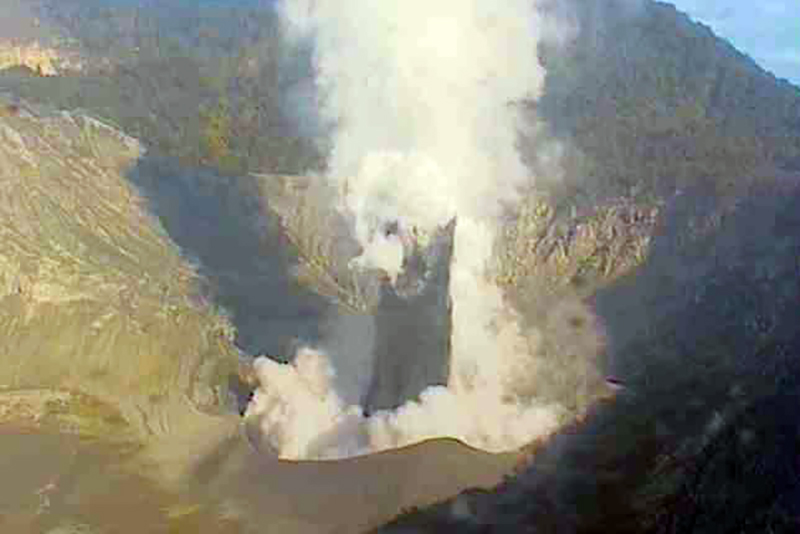 |
Figure 14. A phreatic explosion at Tangkuban Parahu in the Ratu crater at 0724 on 4 September 2019, lasting nearly one minute. The darker ash plume reached around 100 m above the vent. Courtesy of PVGHM (4 September 2019 report). |
Information Contacts: Pusat Vulkanologi dan Mitigasi Bencana Geologi (PVMBG, also known as Indonesian Center for Volcanology and Geological Hazard Mitigation, CVGHM), Jalan Diponegoro 57, Bandung 40122, Indonesia (URL: http://www.vsi.esdm.go.id/); Badan Nasional Penanggulangan Bencana (BNPB), National Disaster Management Agency, Graha BNPB - Jl. Scout Kav.38, East Jakarta 13120, Indonesia (URL: http://www.bnpb.go.id/); Øystein Lund Andersen (Twitter: @OysteinLAnderse, https://twitter.com/OysteinLAnderse, URL: https://www.oysteinlundandersen.com/tangkuban-prahu/tangkuban-prahu-volcano-west-java-one-day-after-the-26th-july-phreatic-eruption/); Reuters (URL: https://www.reuters.com/news/picture/editors-choice-pictures-idUSRTX71F3E); Planet Labs, Inc. (URL: https://www.planet.com/); .
2025: June
2023: February
2022: February
2019: July
| August
| September
| October
2014: December
2013: February
| March
| October
2012: August
| September
2005: April
2002: September
| October
The Pusat Vulkanologi dan Mitigasi Bencana Geologi (PVMBG) reported that elevated unrest continued at Tangkuban Parahu during 11-17 June. Activity included daily steam-and-gas emissions, along with ongoing fluctuations in seismicity. The Alert Level remained at 1 (on a scale of 1-4) and tourists were advised not to descend into the craters.
Source: Pusat Vulkanologi dan Mitigasi Bencana Geologi (PVMBG, also known as CVGHM)
The Pusat Vulkanologi dan Mitigasi Bencana Geologi (PVMBG) reported increased unrest at Tangkuban Parahu during late May-early June. Steam-and-gas plumes rose as high as 110 m above the vents in Ratu Crater. The seismic network recorded an increase in signals indicating gas venting to 21-37 events per day during 30 May-1 June and a total of 100 low-frequency events that suggested the movement of fluids to shallow depths. During 1-8 June steam-and-gas plumes rose as high as 150 m above the vents at Ratu Crater and 5-10 m above the vents at Ecoma Crater. Continuous tremor began at around 2200 on 5 June and was coincident with bubbling or boiling mud Ratu, where black mud deposits surrounded the pool. Thermal areas at both Ratu and Ecoma craters imaged by drone showed no enlargement of the thermal areas between 5 and 7 June. The seismic network recorded 16 and 3 low-frequency events on 7 and 8 June, respectively; seismicity remained elevated through 8 June. Deformation data indicted continuing inflation. As of 8 June the proportions of gas species had not shown notable changes, and gas concentrations were within normal limits. The Alert Level remained at 1 (on a scale of 1-4) and tourists were advised not to descend into the craters.
Source: Pusat Vulkanologi dan Mitigasi Bencana Geologi (PVMBG, also known as CVGHM)
PVMBG issued a special report based on recent observations of Tangkuban Parahu. Webcam images captured from 1830 on 9 February to 0300 on 10 February showed incandescence emanating from Ecoma Crater. A team of PVMBG scientists inspected the crater during 1900-2000 on 10 February to identify the source of the incandescence. They observed intense emissions rising from Ecoma Crater, heard roaring and rumbling, and detected a strong sulfur odor, but did not see incandescence. Remote measurements of solfatara temperatures in Ecoma Crater using thermal cameras show varying temperatures, with a maximum of 105 degrees Celsius, and were influenced by airflow conditions at the crater. A multi-gas detector did not record high concentrations of volcanic gases. Seismic data from June 2022 to February 2023 suggested variable rates of fluid movement and increased heating of the subsurface to the surface. Data from monitoring instruments and visual observations indicated that the incandescent was not caused by rising magma and instead by reactions of sulfur deposits around the vents; the Alert Level remained at 1 (on a scale of 1-4) and tourists were advised to avoid descending into the craters.
Source: Pusat Vulkanologi dan Mitigasi Bencana Geologi (PVMBG, also known as CVGHM)
PVMBG reported that during 30 January-13 February diffuse white steam-and-gas plumes from vents in Tangkuban Parahu's Ratu Crater did not rise above the crater rim. At 1143 on 12 February steam-and-gas venting from Ecoma Crater (within Ratu Crater) intensified, with bursts of emissions rising 100 m above a new vent. The emissions were less intense the next day, rising 20-60 m. Seismicity and deformation data, along with gas and temperature measurements, all indicated that the activity was the result of hydrothermal processes with no new magmatic intrusion. The Alert Level remained at 1 (on a scale of 1-4) and tourists were advised to avoid going into the crater.
Source: Pusat Vulkanologi dan Mitigasi Bencana Geologi (PVMBG, also known as CVGHM)
Diffuse white water-vapor plumes rose 40 m above the vent on Tangkubanparahu's Ratu Crater floor during 14-21 October. PVMBG lowered the Alert Level to 1 (on a scale of 1-4) on 21 October, noting that phreatic events had not been recorded for the past month, deformation data indicated no rising magma, and other data all suggested decreased activity. Tourists were advised to avoid going into the crater.
Source: Pusat Vulkanologi dan Mitigasi Bencana Geologi (PVMBG, also known as CVGHM)
PVMBG reported that during 30 September-6 October diffuse white water vapor plumes rose 150 m above the vent on Tangkubanparahu's Ratu Crater floor. The seismic network recorded continuous tremor. The Alert Level remained at 2 (on a scale of 1-4), and the public was warned to stay 1.5 km away from the active crater.
Source: Pusat Vulkanologi dan Mitigasi Bencana Geologi (PVMBG, also known as CVGHM)
PVMBG reported that during 23-29 September diffuse white water vapor plumes rose 200 m above the vent on Tangkubanparahu's Ratu Crater floor. The seismic network recorded continuous tremor. The Alert Level remained at 2 (on a scale of 1-4), and the public was warned to stay 1.5 km away from the active crater.
Source: Pusat Vulkanologi dan Mitigasi Bencana Geologi (PVMBG, also known as CVGHM)
PVMBG reported that the seismic network at Tangkubanparahu recorded continuous tremor during 16-22 September. A phreatic event at Ratu Crater on 17 September was accompanied by roaring. An ash plume rose as high as 40 m above the vent and steam plumes rose as high as 200 m. The Alert Level remained at 2 (on a scale of 1-4), and the public was warned to stay 1.5 km away from the active crater.
Source: Pusat Vulkanologi dan Mitigasi Bencana Geologi (PVMBG, also known as CVGHM)
PVMBG reported that phreatic events, accompanied by roaring, continued at Tangkubanparahu's Ratu Crater during 9-15 September, though no larger eruptions were recorded. Ash-and-steam emissions rose as high as 20 m above the vent and steam plumes rose as high as 200 m. The seismic network recorded continuous tremor. The Alert Level remained at 2 (on a scale of 1-4), and the public was warned to stay 1.5 km away from the active crater.
Source: Pusat Vulkanologi dan Mitigasi Bencana Geologi (PVMBG, also known as CVGHM)
PVMBG reported that during 2-8 September emissions at Tangkubanparahu's Ratu Crater were characterized by bursts white vapor plumes. At 0724 on 4 September a dense white-to-gray plume rose about 100 m above the vent and drifted S and SW. Two large eruptive events were recorded at 1657 and 1709 on 7 September. White water vapor plumes rose to 200 m above the vent and dense black tephra plumes rose as high as 180 m. Ashfall was localized around Ratu Crater. The seismic network recorded continuous tremor. The Alert Level remained at 2 (on a scale of 1-4), and the public was warned to stay 1.5 km away from the active crater.
Source: Pusat Vulkanologi dan Mitigasi Bencana Geologi (PVMBG, also known as CVGHM)
PVMBG reported that during 26 August-1 September emissions at Tangkubanparahu's Ratu Crater were characterized by puffs of dense black ash plumes rising as high as 20 m above the vent and white vapor plumes containing minor amounts of ash rising as high as 200 m. A larger event recorded at 0930 on 31 August generated a dense black tephra plume that rose 300 m and a white steam plume that rose 600 m. Ashfall was localized around Ratu Crater. The seismic network recorded continuous tremor. The Alert Level remained at 2 (on a scale of 1-4), and the public was warned to stay 1.5 km away from the active crater.
Source: Pusat Vulkanologi dan Mitigasi Bencana Geologi (PVMBG, also known as CVGHM)
PVMBG reported that during 19-25 August phreatic events at Tangkubanparahu's Ratu Crater continued to produce sometimes dense gray-to-white plumes that rose as high as 200 m above the vent, and dense black ash plumes that rose as high as 180 m. Ashfall was localized around Ratu Crater. The seismic network recorded continuous tremor. The Alert Level remained at 2 (on a scale of 1-4), and the public was warned to stay 1.5 km away from the active crater.
Source: Pusat Vulkanologi dan Mitigasi Bencana Geologi (PVMBG, also known as CVGHM)
PVMBG reported that during 12-18 August phreatic events at Tangkubanparahu's Ratu Crater continued to produce sometimes dense gray-to-white plumes that rose as high as 200 m above the vent, and dense black ash plumes that rose as high as 100 m. The emissions were accompanied by roaring. Ashfall was localized around Ratu Crater. The seismic network recorded continuous tremor. The Alert Level remained at 2 (on a scale of 1-4), and the public was warned to stay 1.5 km away from the active crater.
Source: Pusat Vulkanologi dan Mitigasi Bencana Geologi (PVMBG, also known as CVGHM)
PVMBG reported that during 5-11 August phreatic events at Tangkubanparahu's Ratu Crater continued to produced sometimes dense, gray-to-white plumes that rose as high as 200 m above the vent and ash plumes rose as high as 100 m. The emissions were accompanied by roaring. Ashfall was localized around Ratu Crater. The seismic network recorded continuous tremor. The Alert Level remained at 2 (on a scale of 1-4), and the public was warned to stay 1.5 km away from the active crater.
Source: Pusat Vulkanologi dan Mitigasi Bencana Geologi (PVMBG, also known as CVGHM)
PVMBG reported that an eruption at Tangkubanparahu's Ratu Crater, recorded at 2046 on 1 August, generated a dense black ash-and-sediment-laden plume that rose about 180 m from the bottom of the crater, and light-colored ash plumes mixed with water vapor that rose 200 m and drifted N and NE. The event lasted 11 minutes and 23 seconds based on seismic data. Ash and sediment fell in areas around the crater. Four eruptive events were recorded during the morning of 2 August, though ash emissions were not visually observed. The Alert Level was raised to 2 (on a scale of 1-4). A period of continuous ash emissions was recorded during 2-4 August.
Source: Pusat Vulkanologi dan Mitigasi Bencana Geologi (PVMBG, also known as CVGHM)
PVMBG reported that a phreatic eruption at Tangkubanparahu's Ratu Crater began at 1548 on 26 July and was recorded in seismic data for about five minutes and 30 seconds. Dense blackish-gray, sediment-laden plumes rose around 200 m above the lake surface, and a lighter-colored component containing fine ash rose 600 m and spread NE and S. Tephra fell in a concentrated area within 500 m of the vent, creating deposits 5-7 cm thick. Visitors to the Kawasan Wisata Gunung Tangkuban Parahu tourist area that borders a section of the E and SE crater rim immediately evacuated. BNPB reported that the local government closed the tourist area noting that ash fell within a 1-2 km radius, in Jayagiri Village, Lembang District, and areas of the West Bandung Regency. Activity decreased after the eruption; tremor amplitude decreased during 27-28 July, and diffuse white plumes rose from the vent.
PVMBG noted that during the previous month white plumes of variable density rose as high as 150 m above the crater floor. Small local inflation was recorded, and deformation data continued to indicate instability at least through 27 July. Hydrogen sulfide and sulfur dioxide concentrations began to increase on 10 July and then significantly declined at 1200 on 13 July. Measurements on 21 July indicated that gas emissions continued to fluctuate but decreased overall. The Alert Level remained at 1 (on a scale of 1-4).
Sources: Pusat Vulkanologi dan Mitigasi Bencana Geologi (PVMBG, also known as CVGHM); Badan Nacional Penanggulangan Bencana (BNPB)
PVMBG reported that white plumes rose at most 50 m above Tangkubanparahu's Ratu Crater during October-December 2014. Deformation data showed changes and seismicity increased. On 31 December the Alert Level was raised to 2 (on a scale of 1-4). Residents and tourists were warned not approach the crater within a radius of 1.5 km.
Source: Pusat Vulkanologi dan Mitigasi Bencana Geologi (PVMBG, also known as CVGHM)
PVMBG reported a phreatic eruption from Tangkubanparahu at 0621 on 5 October. The Alert Level was raised to 2 (on a scale of 1-4).
Source: Pusat Vulkanologi dan Mitigasi Bencana Geologi (PVMBG, also known as CVGHM)
CVGHM reported that phreatic eruptions from Tangkubanparahu's Ratu Crater occurred on 28 February and during 4-6 March, and generated ash plumes that rose up to 100 m above the crater. Sulfur dioxide emissions increased to a high level on 24 February and then decreased through 3 March. Sulfur dioxide emissions again increased during 5-9 March; CVGHM speculated that the increase was due to an enlargement of the eruptive vent, which had grown to a diameter of 20 m. Gas emissions decreased abruptly on 10 March and emission sounds stopped.
Seismicity had significantly increased on 22 February, marked by a growing number of daily events. A significant decrease was detected on 9 March. Deflation was detected from 24 February through early March, but was then stable during 7-14 March. On 18 March the Alert Level was lowered to 1 (on a scale of 1-4).
Source: Pusat Vulkanologi dan Mitigasi Bencana Geologi (PVMBG, also known as CVGHM)
According to news articles, an eruption from Tangkubanparahu on 4 March produced an ash plume that rose 500 m above the crater. An eight-minute-long eruption at 0559 on 7 March ejected ash 30 m above Ratu Crater.
Source: The Jakarta Post
CVGHM reported that on 21 February tremor increased at Tangkubanparahu and diffuse ash emissions rose from Ratu Crater. Based on the seismicity, visual observations, and temperature increases of the land around the crater, the Alert Level was raised to 2 (on a scale of 1-4) and visitors were reminded not to approach the crater within a radius of 1.5 km.
Source: Pusat Vulkanologi dan Mitigasi Bencana Geologi (PVMBG, also known as CVGHM)
CVGHM reported that during 23 August-21 September shallow volcanic earthquakes continued to be recorded at Tangkubanparahu but were less frequent. Other types of seismic signals also decreased. Based on seismicity, visual observations, deformation data, gas measurements, and soil and crater lake water temperatures, the Alert Level was lowered to 1 (on a scale of 1-4) on 21 September.
Source: Pusat Vulkanologi dan Mitigasi Bencana Geologi (PVMBG, also known as CVGHM)
CVGHM reported that seismicity at Tangkubanparahu had increased significantly on 13 August, then again on 23 August; seismicity fluctuated and remained elevated through 6 September. Earthquakes were located 0.5-4 km beneath Ratu Crater and in an area W at depths of 4-12 km. Soil temperatures at Ratu Crater showed an increasing trend on 31 August, but had gradually declined by 5 September. Sulfur dioxide gas emissions were high in an area NW of the crater, causing CVGHM to remind visitors not to approach the crater within a 1.5-km radius. Based on seismicity, visual observations, gas measurements, and crater lake water temperatures through 7 September, the Alert Level remained at 2 (on a scale of 1-4).
Source: Pusat Vulkanologi dan Mitigasi Bencana Geologi (PVMBG, also known as CVGHM)
CVGHM reported that seismicity at Tangkubanparahu increased significantly on 13 August; earthquakes continued to be recorded through 23 August. The Alert Level was raised to 2 (on a scale of 1-4). Visitors and residents were prohibited from going within a 1.5-km radius of the active crater.
Source: Pusat Vulkanologi dan Mitigasi Bencana Geologi (PVMBG, also known as CVGHM)
At Tangkubanparahu "white thin smoke" was emitted from Upas Baru crater and Ratu crater on 14 April, and from Upas Baru crater on 15 April. On 14 and 15 April shallow and deep volcanic earthquakes were recorded. During this time visitors were banned from the volcano. On 19 April the Alert Level was reduced from 3 to 2 (on a scale of 1-4) and the volcano was opened to the public, but access was restricted around Ratu crater and not permitted at the other craters.
Source: Pusat Vulkanologi dan Mitigasi Bencana Geologi (PVMBG, also known as CVGHM)
On 13 April at 0700 DVGHM raised the Alert Level at Tangkubanparahu to 2 (on a scale of 1-4) due to an increase in seismicity at the volcano. In addition to an increase in seismicity in comparison to the previous day, there was a strong scent of sulfur near Ratu crater. On the 13th at 1300 the Alert Level was raised to 3 due to a further increase in seismicity and the occurrence of tremor. No ash plume was observed. Visitors were banned from the summit and crater area.
Source: Pusat Vulkanologi dan Mitigasi Bencana Geologi (PVMBG, also known as CVGHM)
During 9 September to 6 October, seismicity at Tangkubanparahu was dominated by volcanic events. Also, thin ash plumes rose 2.5 m above the volcano. Tangkubanparahu remained at Alert Level 2 (on a scale of 1-4).
Source: Pusat Vulkanologi dan Mitigasi Bencana Geologi (PVMBG, also known as CVGHM)
On 2 September VSI raised the Alert Level at Tangkubanparahu from 1 to 2 (on a scale of 1-4). The number of daily earthquakes had been increasing for 2 weeks and the temperatures of Domas and Ratu craters were 2-4°C higher than normal. There were no surface changes at the volcano, but several animals from the forest near Ratu crater were found dead in the crater.
Source: Pusat Vulkanologi dan Mitigasi Bencana Geologi (PVMBG, also known as CVGHM)
Reports are organized chronologically and indexed below by Month/Year (Publication Volume:Number), and include a one-line summary. Click on the index link or scroll down to read the reports.
Increased seismicity; thermal activity; inflation
Tangkubanparahu has shown increased seismicity, thermal activity, and inflation during the past several months. A VSI seismograph recorded as many as seven shallow volcanic tremors/day in early June, 19/day by early August and 25/day the last week in August. At the beginning of September, seismicity increased sharply from an average of 14 to 60-74 events per day and by the middle of the month reached a daily average of 106-110. Epicenters were in the vicinity of Baru fumarolic field, on the W wall of Crater 3. No deep volcanic earthquakes have been detected. A telemetering seismograph (obtained through the VSI-USGS cooperative program) permitted monitoring from Bandung, 30 km S of the volcano.
Little change in surface activity was observed until September. Three fumarole fields (Baru, Ratu, and Upas) were monitored, with highest temperatures recorded at Baru, increasing to 98°C from an average of 94°C. On 13 September, a pair of white steam columns rose from Baru field for about 20 minutes each, reaching heights of 100-150 m. SO2 emission measured by COSPEC increased from 70 t/d in August to 80 t/d in September. Since July, dry tilt measurements have shown a consistent inflation centered on Baru fumarole field totaling about 20 µrad.
Civil authorities warned of the volcanic hazard and the National Park has issued an alert to tourists. Within a 3-km danger zone, camping and auto parking were forbidden.
Information Contacts: A. Sudradjat, VSI.
Seismicity continues to increase
Seismicity continued to increase through mid-October but no surface changes have been noted. Tectonic earthquakes and both A-and B-type microtremors were recorded. A-type events occurred irregularly, usually at 1-3 per day, but as many as five were detected on several days. B-type earthquakes increased substantially, as shown in table 1.
Table 1. Number of B-type events/day at Tangkubanparahu, May to mid-October 1983.
| Time Period | Daily Average | Maximum / day |
| May-Jul 1983 | 3 | 7 |
| Aug 1983 (first weeks) | 10 | 19 |
| Aug 1983 (last week) | 14 | 25 |
| Sep 1983 (first half) | 70 | 120 |
| Sep 1983 (second half) | 57 | 103 |
| Oct 1983 (first half) | 72 | 127 |
Ground deformation did not show regular changes. From 10 to 25 mm of irregular inflation and deflation were detected but their significance is doubtful. Fumarole temperatures remained stable at 96°C in the three fumarole fields (Baru, Ratu, and Upas). The previously declared forbidden zone of 3-km-radius remained in effect.
Information Contacts: A. Sudradjat, VSI.
Crater temperatures rise; seismicity unchanged
Temperatures in Kawah Baru, a small vent on the W side of the summit crater, active during the 1896 eruption, rose steadily from 90 to 140°C in the two weeks prior to 9 December. No changes have been detected in the volcano's continuing low-level background seismicity.
Information Contacts: T. Casadevall and L. Pardyanto, VSI.
Minor steam explosions
[Minor steam explosions were reported from Kawah Baru crater on 15 November 1985. The explosions were described as essentially phreatic, producing a 200-m-high eruption cloud. There was no mention of tephra ejection. After this event, temperatures in the Kawah Baru solfatara field increased from 95 to 168°C].
Information Contacts: A. Sudradjat, Kaswanda, and Tulus, VSI (as reported in BVE, no. 25, March 1988).
Elevated fumarole temperatures in December
Fumarole temperatures at Kawah Baru continued to climb through December, reaching a maximum of 171°C on 31 December. In January, temperatures have gradually declined to 148°C as of the 11th. No seismicity was recorded.
Information Contacts: Suparto S. and T. Casadevall, VSI.
Decreasing fumarole temperatures
"In November [1985], Tangkubanparahu showed increased activity with strong gas emission, thick white solfataric fume, and increased temperature at Kawah Baru, a small vent on the W side of the summit crater (10:11-12). Temperatures, normally 95-97°C, rose to 141°C on 30 November, increased progressively to 173°C on 3 January, then slowly decreased. At the end of January the temperature was 158°C. Seismic observations Nov-Jan showed no signs of changes. The average number of volcanic earthquakes was 2/day."
Information Contacts: A. Sudradjat, VSI.
Inflation; tremor; high fumarole temperatures
Fumaroles of the Kawah Baru field continued to have elevated temperatures that ranged from 152 to 158°C during March. Seismic tremor was recorded on the seismometer at Kawah Ratu on 17 March, from about 0900 until 2400. Tremor was again recorded briefly on 18 and 19 March.
"During March the complete EDM network was reoccupied for the first time since 1983. The results of the survey are consistent with long term inflation of Tangkubanparahu as detected by spirit level tilt measurements from 1981 through January 1986. The center of inflation . . . is located at Kawah Upas, ~500 m E of the Kawah Baru fumaroles. The epicentral area of the late 1983 seismic activity was in the S half of Kawah Upas, approximately coincident with the center of uplift determined from tilt measurements."
Information Contacts: Kaswanda, H. Said, A. Sudradjat, and T. Casadevall, VSI.
Fumarole temperatures remain high
Fumarole temperatures at Kawah Baru crater remained elevated, reaching 161°C during April, but no additional seismic tremor was observed during the month.
Information Contacts: Olas, Suratman, Suparto, Kaswanda, and A. Sudradjat, VSI.
Fumarole temperarures remain high
No additional seismic activity was reported [in May], but fumarole temperatures remained elevated.
Information Contacts: A. Sudradjat, L. Pardyanto, and T. Casadevall, VSI.
Fumarole temperatures still high
Fumaroles in the W crater continued to have elevated temperatures. The ephemeral lake in the E crater (Kawah Ecoma) has dried up, most likely the result of the end of the wet season.
Information Contacts: L. Pardyanto, Olas, Kaswanda, A. Sudradjat, and T. Casadevall, VSI.
Fumarole temperatures increase
"The only significant changes . . . during September were an increase in fumarole temperatures. As of 20 September, fumarole temperatures in Kawah Ratu crater had risen from their normal 97 to ~112°C, and had increased further in Kawah Baru crater to 189°C (from 161°C in April). No changes in seismicity or other activity were observed."
Information Contacts: L. Pardyanto, Olas, Kaswanda, Suratman, A. Sudradjat, and T. Casadevall, VSI.
Increased seismicity but no surface changes evident
Seismicity began to increase on 28 September. B-type earthquakes were continuing in early December, at rates of 47-204/week. None of the vents on the crater floor showed signs of unusual activity. Visitors are still advised to avoid descending to the bottom of the crater.
Information Contacts: W. Modjo, VSI.
First elevated seismicity since 1992
The Volcanological Survey of Indonesia (VSI) reported that Tangkubanparahu reactivated during late August 2002. On 2 September the Alert Level was raised to 2, following an elevated number of earthquakes that were registered during the previous two weeks. The temperatures of Domas and Ratu craters increased ~2-4°C; Domas crater was at 74-93°C and Ratu crater at 95-100°C. No visual changes accompanied the temperature increase inside the craters, but several animals were found dead in Ratu crater. Seismicity totals for the week of 26 August-1 September were three deep-volcanic (A-type), 172 shallow-volcanic (B-type), and 12 tectonic earthquakes. During 2-8 September, four A-type, 224 B-type, and two tectonic earthquakes were registered.
Information Contacts: Volcanological Survey of Indonesia (VSI), Jalan Diponegoro No. 57, Bandung 40122, Indonesia (URL: http://www.vsi.esdm.go.id/).
Elevated seismicity during August-October 2002
In August and September 2002 Tankubanparahu showed its first elevated seismicity since 1992 (BGVN 27:09). This activity continued in October of 2002. The volcano is at Alert Level 2.
From September through 6 October, volcanic events dominated seismicity, particularly during the week of 16-22 September, when there were 331 shallow volcanic [B-type] events. Crater fumarole temperatures of 92-95°C were recorded at Domas and Ratu craters; the hotspring temperature at Ciater was 47°C. H2S concentrations were above detections limits, ranging from 80 to more than 100 ppm at Ratu; more than 80 ppm H2S was also recorded at Jagal. A "thin white ash plume" was observed to rise 2.5 m, and a whizzing sound could be heard 50 m away. A strong sulfur smell and sulfur sublimation were noted.
Between 7 and 13 October, volcanic events again dominated seismic activity, but numbers were lower than the previous week, with 151 B-type events, down from 199, and four A-type events, down from five. Tectonic activity occurred at the same rate as the previous week, with 21 events. The following week volcanic activity again dropped, with 57 shallow volcanic (B-type) events. However, deep volcanic (A-type) events increased slightly, to 15. Observations during the week included a "white-thin ash plume" to 2 m and medium-strong gas pressure. A strong sulfur smell and yellow sublimation were also noted. The fumarole temperature at Ratu crater was 95°C.
Shallow volcanic earthquakes increased through the week of 21-27 October, with 123 events. Deep volcanic events dropped to 7, and tectonic activity again remained stable, with 19 events. On 25 October Upas crater was measured at 44°C; a "white-thin ash plume" was only noted to rise 0.5-1 m, and the sulfur smell was weak.
Information Contacts: Dali Ahmad, Volcanological Survey of Indonesia (VSI), Jalan Diponegoro No. 57, Bandung 40122, Indonesia (URL: http://www.vsi. esdm.go.id/).
Seismic unrest during 12-19 April 2005
Typically quiet, Tangkubanparahu went into a period of unrest from 12 to 19 April 2005. After that, it became relatively quiet again. The reports during this period did not in general cover an entire day, but rather only 6 or 12 hours. The reports chiefly discussed a seismic crisis and elevated SO2 fluxes. A brief review for this period follows.
Seismic activity increased dramatically beginning on 12 April 2005. Normally about two volcanic eruptions occurred daily. Volcanic earthquakes recorded on 12 April consisted of five deep (type-A events with peak-to-peak amplitudes of 7-24 mm) and 56 shallow (type-B events with peak-to-peak amplitudes of 3-10 mm), with numbers increasing throughout the day. About 8 hours of tremor on 13 April, a swarm of earthquakes took place, of which 111 were deep type-A events and 181 were shallow type-B events. The peak of the activity occurred on 14 April, when the deep events numbered 108 and the shallow events numbered 327. A located hypocenter was 1.6-1.9 km beneath the Domas crater.
Based on the above seismic data, the hazard status for the volcano was raised on 13 April 2005 at 0825 to Level 2, and then at 1300 to Level 3.
The SO2 measurement around Domas crater yielded about 10 metric tons/day (t/d) on 14 April. It was less than 2 t/d on 18 April.
The hazard status of the volcano was downgraded to Level 2 on 19 April 2005 at 1200, and the area was re-opened to the public. The other craters (Upas, Domas, Baru, Jarian) remained closed to the public.
Information Contacts: Directorate of Volcanology and Geological Hazard Mitigation (DVGHM), Jalan Diponegoro 57, Bandung 40122, Indonesia (URL: http://www.vsi.esdm.go.id/).
Earthquakes and hot gas emissions in August 2012
Our most recent report on Tangkubanparahu (also known as Tangkuban Perahu) described increased seismicity during April 2005, consisting primarily of volcanic earthquakes and tremor (BGVN 30:12). This report describes elevated seismicity during August-September 2012. The Center of Volcanology and Geological Hazard Mitigation (CVGHM) notes that at least three magmatic eruptions and four phreatic eruptions had occurred at Ratu Crater, the most active vent, during 1829-1994. Ratu Crater is about 30 km N of Bandung in W Java. Figure 1 indicates the general location of the volcano.
 |
Figure 1. Sketch maps of Indonesia and W Java indicating the location of Tangkubanparahu (Tangkuban Perahu). Courtesy of Kartadinata and others (2002). |
The next report we received on Tangkubanparahu described activity starting in August 2012. According to CVGHM, the frequency of earthquakes and tremor increased on both 13 and 23 August. Around this time, hot blasts of sulfuric gases, white in color, rose from Ratu Crater to heights of 50-400 m above the crater's floor. CVGHM reported that the temperature of emissions from Ratu Crater on 24 August was 246°C, compared to a measurement of 111°C on 18 August. On 23 August, the Alert Level was raised to 2 (on a scale of 1-4), and visitors and residents were prohibited within a 1.5-km radius of the active crater.
Seismic activity declined on 23 August; shallow volcanic earthquakes continued to be recorded but were less frequent through 21 September (table 2 provides data through 20 September). Hypocenters of volcanic tremors during this period were located beneath an area W of Ratu Crater at depths of 4-12 km. Soil temperatures at Ratu Crater were 30.5°C on 26 August, then were 35°C on 30 August, but then gradually declined during 31 August-21 September to ~34°C.
Table 2. Type and occurrence of earthquakes at Tangkubanparahu between 24 August and 20 September 2012. Courtesy of CVGHM.
| Date | Shallow Volcanic | Deep Volcanic | Distant Tectonic | Local Tectonic | Air Blast | Tremor episodes (amplitude; duration) |
| 24 Aug-30 Aug 2012 | 76 | 11 | 1 | 2 | -- | 1 (3-16 mm; 8,100 sec.) |
| 31 Aug-06 Sep 2012 | 66 | 12 | 8 | 3 | 19 | 3 (1-30 mm; 60-18,000 sec.) |
| 07 Sep-13 Sep 2012 | 42 | 6 | 3 | 2 | 53 | 7 (1-10 mm; 63-1,842 sec.) |
| 14 Sep-20 Sep 2012 | 27 | 19 | 13 | 4 | 33 | 5 (5-14 mm; 171-600 sec.) |
Between 5-11 September, sulfur dioxide gas emissions were elevated in an area NW of the crater associated with the plume, but in the latter part of September 2012 concentrations averaged4in Ratu Crater increased from 0.11 in December 2011 to ~4 on 24 August 2012 and remained at that level on 11 September 2012, which suggested to CVGHM that hot fluid was rising to the surface.
Based on seismicity, visual observations, deformation data, gas measurements, and soil and crater lake water temperatures, the Alert Level was lowered to 1 on 21 September 2012.
The eruptive history of Tangkubanparahu was described by Kartadinata and others (2002).
Reference. Kartadinata, M., Okuno, M., Nakamura, T., and Kobayashi, T., 2002, Eruptive history of Tangkuban Perahu volcano, West Java, Indonesia: A preliminary report, Journal of Geography, v. 111, issue 3, p. 404-409.
Information Contacts: Center of Volcanology and Geological Hazard Mitigation (CVGHM), Jalan Diponegoro 57, Bandung 40122, Indonesia (URL: http://www.vsi.esdm.go.id/).
West Java volcano issues very small eruption in March 2013; months of tremor and few volcanic earthquakes
Tangkubanparahu (Tankuban Parahu) erupted multiple times during the interval of reporting from February 2013 through December 2014. The eruptions were from Ratu crater and of quite small size (highest reported plumes only rose to 100 m tall). The vent grew in size as a result of these eruptions, reaching in early March 2013 a diameter of 20 m. The small eruptions contained minor ash but did not emit a dome or lava flows and accordingly did not lead to thermal anomalies detected via the MODVOLC satellite-based infrared detection system (and this is the case going back to at least the year 2010).
In past reports during the past few decades, Tangkubanparahu has largely been quiet but with occasional tremor and volcanic earthquakes (eg., late August-October 2002, 12-19 April 2005, and August-September 2012; BGVN 27:09, 28:08, 30:12, and 37:11). The location of the volcano in Java is shown in figure 1 of BGVN 37:11.
According to the Center of Volcanology and Geological Hazard Mitigation (CVGHM, also known as Pusat Vulkanologi dan Mitigasi Bencana Geologi, PVMBG), tremor increased on 21 February 2013 and diffuse ash emissions rose from Ratu Crater. Based on the seismicity, visual observations, and temperature increases of the land around the crater, CVGHM raised the Alert Level to 2 (on a scale of 1-4) and visitors were reminded not to approach the crater within a radius of 1.5 km.
CVGHM reported that phreatic eruptions from Tangkubanparahu's Ratu Crater occurred on 28 February and during 4-6 March 2013, and generated ash plumes that rose up to 100 m above the crater.
A news report (kompas.com) quoted CVGHM as stating that the March explosion was much stronger than the one on 21 February 2013. The news report said that the 6 March eruption lasted for ~8 minutes. The Jakarta Post also said that the 6 March eruption lasted ~8 minutes and ejected ash about 30 m above Ratu Crater. The Jakarta Post reported that on 18 March, CVGHM lowered the Alert Level to 1 (normal) because of a significant decrease in the tremor frequency. The article also quoted CVGHM as stating that deformation, using a Global Positioning System (GPS) and Electronic Distance Measurement (EDM), found at one or more stations a decline in relative elevation from 6.84 cm to a few millimeters by 18 March. Deflation was again detected from 24 February through early March 2013, but was stable during 7-14 March 2013.
According to CVGHM, sulfur dioxide emissions increased to 5.3 metric tons per day (t/d) on 24 February 2013, decreased through 3 March 2013 to 2.1 t/d, and then increased again during 5-9 March 2013 to 4.9 t/d. CVGHM speculated that the increase was due to an enlargement of the eruptive vent, which had grown to a diameter of 20 m.
Gas emissions decreased abruptly on 10 March 2013 to 2.1 t/d and emission sounds stopped. On 4 March 2013, a new solfatara vent opened, but SO2 levels could not be measured on that day because of weather conditions.
On 5 October 2013, a phreatic eruption occurred, causing CVHGM to raise the Alert Level to 2. Figure 2 is an image of Ratu Crater.
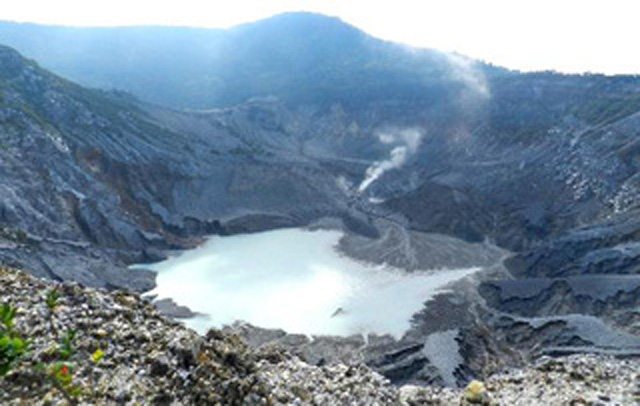 |
Figure 2. Photo of Tangkubanparahu's Ratu crater taken (or posted?) in June 2014. Ratu crater is the currently active crater and one of two large craters on the volcano; it is about 1 km in diameter and has a depth of about 400 m. CVGHM reporting notes that, overall, the volcano hosts 9 craters. Image courtesy of Marietha S as posted on Tripadvisor.com. |
CVGHM reported that during November-December 2014 white plumes rose up to 50 m above Ratu Crater. Deformation occurred and seismicity increased. On 31 December the Alert level rose to 2 (on a scale of 1-4), cautioning people to remain at least 1.5 km from the crater.
Seismicity. The CVGHM report discussing late 2014 features a plot of seismic data during December 2012 through December 2014, which the authors termed significant, the chief observation prompting a rise in alert level (to II).
Tremor was most prominent beginning mid-2013 to early March 2014. Both low-frequency and hybrid earthquakes were nearly absent except during a short sequence in late 2014 (each with over 100 earthquakes; see table below). Type-B earthquakes were common at levels from a few to ten events per 20-day interval, and like the low-frequency and hybrid earthquakes, peaked in latest December 2014 (~50 type-B events). Type-A earthquakes showed little or no tendency to cluster and remained below 5 events per 20 day interval and on many days they were absent.
Table 3 indicates the types and frequencies of seismic activity at Tangkubanparahu during selected, mostly active periods during 2013. Shallow volcanic earthquakes predominated during many of these periods. The number of tremor was high during the first week of March 2013, but significantly declined thereafter. The 25 September 2013-5 October 2013 period contained somewhat elevated seismicity, yet apparently lacked significant eruptive activity. Note the emergence of 513 low-frequency earthquakes during 1-31 December 2014 (lower right). That data is in the same year-end report (issued in early 2014 and written in Indonesian) and is also noteworthy in terms of the plot of distance (EDM) data to various reflectors around the crater during the entire year of 2013.
Table 3. A compilation of earthquake counts and tremor durations recorded at Tangkubanparahu for selected periods during 2012-2014. Definitions: -- signifies no data (presumably no episodes); VA, volcanic type-A earthquake; VB, type B (shallow volcanic earthquake); TJ, deep tectonic earthquake; BQ, an earthquake indicative of emissions; and TL, local tectonic earthquake. Courtesy of CVGHM.
| Date (day or days) | VA | VB | TJ | BQ | TL | Tremor (amplitude, duration) | Other data & kinds of earthquakes (EQs) |
| 22 Jun 2012-28 Feb 2013 | 5 | 20 | 2 | 4 | 2 | 13 (2-45 mm, 3-92 min) | Phreatic eruption on 21 Feb |
| 1-6 Mar 2013 | 14 | 32 | 2 | 41 | -- | 19 (2-30 mm, 3-92 min) | 4 eruptions during period (6-35 mm, 7-13 min) |
| 7-13 Mar 2013 | 2 | 25 | 4 | 6 | -- | 2 | No tremor 8-18 Mar |
| 14-18 Mar 2013 | 1 | 14 | 5 | -- | -- | 0 | -- |
| 25-30 Sep 2013 | 6 | 26 | 8 | -- | 1 | 1 | -- |
| 1-5 Oct 2013 | -- | 13 | 7 | 1 | -- | 2 | -- |
| 21 Oct 2013 | -- | 4 | 1 | -- | -- | Continuous (amp. 1-3 mm, 12 hr) | -- |
| 22 Oct 2013 | -- | 13 | 1 | -- | -- | 1 | 1 Low freq earthquake |
| 23 Oct 2013 | 1 | 12 | 7 | 1 | -- | 3 | 1 Low freq earthquake |
| 24 Oct 2013 | 2 | 9 | 2 | 5 | -- | -- | -- |
| 25 Oct 2013 | -- | 6 | 4 | 1 | -- | 2 (0.5-1 mm, less than 2 min) | -- |
| 26 Oct 2013 | 1 | 7 | 4 | -- | -- | 1 (0.5-1 mm, less than 2 min) | -- |
| 27 Oct 2013 (partial) | -- | 1 | 1 | -- | -- | -- | -- |
| 1-31 Oct 2014 | 9 | 126 | 45 | 50 | 12 | 10 cases | 6 low-frequency EQs, |
| 1-30 Nov | 6 | 146 | 35 | 185 | 6 | -- | 8 low-frequency EQs; 14 tornillo EQs |
| 1-31 Dec 2014 | 10 | 352 | 41 | 22 | 6 | -- | 1 tornillo EQ; 513 low-frequency EQs |
Information Contacts: Center of Volcanology and Geological Hazard Mitigation (CVGHM) (URL: http:proxy.vsi.esdm.go.id/index.php); kompas.com (URL: kompas.com); and The Jakarta Post (URL: http://www.thejakartapost.com/).
Phreatic eruption on 27 July followed by intermittent explosions through to 17 September 2019
Tangkuban is located in the West Bandung and Subang Regencies in the West Java Province and has two main summit craters, Ratu and Upas (figure 3). Recent activity has largely consisted of phreatic explosions and gas-and-steam plumes at the Ratu crater. Prior to July 2019, the most recent activity occurred in 2012-2013, ending with a phreatic eruption on 5 October 2013 (BGVN 40:04). Background activity includes geothermal activity in the Ratu crater consisting of gas and steam emission (figure 4). This area is a tourist destination with infrastructure, and often people, overlooking the active crater. This report summarizes activity during 2014 through September 2019 and is based on official agency reports. Monitoring is the responsibility of Pusat Vulkanologi dan Mitigasi Bencana Geologi (PVMBG, also known as Indonesian Center for Volcanology and Geological Hazard Mitigation, CVGHM).
|
Figure 3. Map of Tangkuban Parahu showing the Sunda Caldera rim and the Ratu, Upas, and Domas craters. Basemap is the August 2019 mosaic, copyright 2019 Planet Labs, Inc. |
|
Figure 4. Background activity at the Ratu crater of Tangkuban Parahu is shown in these images from 1 May 2012. The top image is an overview of the crater and the bottom four images show typical geothermal activity. Copyrighted photos by Øystein Lund Andersen, used with permission. |
The first reported activity in 2014 consisted of gas-and-steam plumes during October-December, prompting PVMBG to increase the alert level from I to II on 31 December 2014. These white plumes reached a maximum of 50 m above the Ratu crater (figure 5) and were accompanied by elevated seismicity and deformation. This prompted the implementation of an exclusion zone with a radius of 1.5 km around the crater. The activity decreased and the alert level was lowered back to I on 8 January 2015. There was no further reported activity from January 2015 through mid-2019.
|
Figure 5. Changes at the Ratu crater of Tangkuban Parahu during 25 December 2014 to 8 January 2015. Rain water accumulated in the crater in December and intermittent gas-and-steam plumes were observed. Courtesy of PVMBG (8 January 2015 report). |
From 27 June 2019 an increase in activity was recorded in seismicity, deformation, gas chemistry, and visual observations. By 24 July the responsible government agencies had communicated that the volcano could erupt at any time. At 1548 on 26 July a phreatic (steam-driven) explosion ejected an ash plume that reached 200 m; a steam-rich plume rose to 600 m above the Ratu crater (figures 6, and 7). People were on the crater rim at the time and videos show a white plume rising from the crater followed by rapid jets of ash and sediment erupting through the first plume. Deposition of eruption material was 5-7 cm thick and concentrated within a 500 m radius from the point between the Rata and Upas craters, and wider deposition occurred within 2 km of the crater (figures 8 and 9). According to seismic data, the eruption lasted around 5 minutes and 30 seconds (figure 10). Videos show several pulses of ash that fell back into the crater, followed by an ash plume moving laterally towards the viewers.
|
Figure 6. These screenshots are from a video taken from the Ratu crater rim at Tangkuban Parahu on 26 July 2019. Initially there is a white gas-and-steam plume rising from the crater, then a high-velocity black jet of ash and sediment rises through the plume. This video was widely shared across multiple social media platforms, but the original source could not be identified. |
|
Figure 7. The ash plume at Tangkuban Parahu on 26 July 2019. Courtesy of BNPB. |
|
Figure 8. Volcanic ash and lapilli was deposited around the Ratu crater of Tangkuban Parahu during a phreatic eruption on 26 July 2019. Note that the deposits have slumped down the window and are thicker than the actual ashfall. Courtesy of BNPB. |
|
Figure 9. Ash was deposited on buildings that line the Ratu crater at Tangkuban Parahu during a phreatic eruption on 26 July 2019. Photo courtesy of Novrian Arbi/via Reuters. |
|
Figure 10. A seismogram showing the onset of the 26 July 2019 eruption of Tangkuban Parahu and the elevated seismicity following the event. Courtesy of PVMBG via Øystein Lund Andersen. |
On 27 July, the day after the eruption, Øystein Lund Andersen observed the volcano using a drone camera, operated from outside the restricted zone. Over a period of two hours the crater produced a small steam plume; ashfall and small blocks from the initial eruption are visible in and around the crater (figure 11). The ashfall is also visible in satellite imagery, which shows that deposition was restricted to the immediate vicinity to the SW of the crater (figure 12).
|
Figure 11. Photos of the Ratu crater of Tangkuban Parahu on 27 July 2019, the day after a phreatic eruption. A small steam plume continued through the day. Courtesy of Øystein Lund Andersen. |
|
Figure 12. PlanetScope satellite images showing the Ratu crater of Tangkuban Parahu before (17 July 2019) and after (28 July 2019) the explosion that took place on 26 July 2019. Natural color PlanetScope Imagery, copyright 2019 Planet Labs, Inc. |
Another eruption occurred at 2046 on 1 August 2019 and lasted around 11 minutes, producing a plume up to 180 m above the vent. Additional explosions occurred at 0043 on 2 August, lasting around 3 minutes according to seismic data, but were not observed. Explosions continued to be recorded at 0145, 0357, and 0406 at the time of the PVMBG report when the last explosion was ongoing, and a photo shows an explosion at 0608 (figure 13). The explosions produced plumes that reached between 20 and 200 m above the vent. Due to elevated activity the Alert Level was increased to II on 2 August. Ash emission continued through the 4th. During 5-11 August events ejecting ash continued to produce plumes up to 80 m, and gas-and-steam plumes up to 200 m above the vent. Ashfall was localized around Ratu crater. The following week, 12-18 August, activity continued with ash and gas-and-steam plumes reaching 100-200 m above the vent. During 19-25 August, similar activity sent ash to 50-180 m, and gas-and-steam plumes to 200 m. A larger phreatic explosion occurred at 0930 on 31 August with an ash plume reaching 300 m, and a gas-and-steam plume reaching 600 m above the vent, depositing ash and sediment around the crater.
|
Figure 13. A small ash plume below a white gas-and-steam plume erupting from the Ratu crater of Tangkuban Parahu on 2 August 2019 at 0608. Courtesy of PVBMG (2 August 2019 report). |
In early September activity consisted of gas-and-steam plumes up to 100-180 m above the vent with some ash plumes observed (figure 14). Two larger explosions occurred at 1657 and 1709 on 7 September with ash reaching 180 m, and gas-and-steam up to 200 m above the vent. Ash and sediment deposited around the crater. Due to strong winds to the SSW, the smell of sulfur was reported around Cimahi City in West Bandung, although there was no detected increase in sulfur emissions. A phreatic explosion on 17 September produced an ash plume to 40 m and a steam plume to 200 m above the crater. Weak gas-and-steam emissions reaching 200 m above the vent continued through to the end of September.
|
Figure 14. A phreatic explosion at Tangkuban Parahu in the Ratu crater at 0724 on 4 September 2019, lasting nearly one minute. The darker ash plume reached around 100 m above the vent. Courtesy of PVGHM (4 September 2019 report). |
Information Contacts: Pusat Vulkanologi dan Mitigasi Bencana Geologi (PVMBG, also known as Indonesian Center for Volcanology and Geological Hazard Mitigation, CVGHM), Jalan Diponegoro 57, Bandung 40122, Indonesia (URL: http://www.vsi.esdm.go.id/); Badan Nasional Penanggulangan Bencana (BNPB), National Disaster Management Agency, Graha BNPB - Jl. Scout Kav.38, East Jakarta 13120, Indonesia (URL: http://www.bnpb.go.id/); Øystein Lund Andersen (Twitter: @OysteinLAnderse, https://twitter.com/OysteinLAnderse, URL: https://www.oysteinlundandersen.com/tangkuban-prahu/tangkuban-prahu-volcano-west-java-one-day-after-the-26th-july-phreatic-eruption/); Reuters (URL: https://www.reuters.com/news/picture/editors-choice-pictures-idUSRTX71F3E); Planet Labs, Inc. (URL: https://www.planet.com/); .
|
|
||||||||||||||||||||||||||
There is data available for 21 confirmed eruptive periods.
2019 Jul 26 - 2019 Sep 17 Confirmed Eruption (Explosive / Effusive) VEI: 1
| Episode 1 | Eruption (Explosive / Effusive) | ||||||||||||||
|---|---|---|---|---|---|---|---|---|---|---|---|---|---|---|
| 2019 Jul 26 - 2019 Sep 17 | Evidence from Observations: Reported | |||||||||||||
|
List of 1 Events for Episode 1
|
||||||||||||||
2013 Oct 5 - 2013 Oct 5 Confirmed Eruption (Phreatic) VEI: 1
| Episode 1 | Eruption (Phreatic) | Ratu Crater | ||||||||||||||||||
|---|---|---|---|---|---|---|---|---|---|---|---|---|---|---|---|---|---|---|---|
| 2013 Oct 5 - 2013 Oct 5 | Evidence from Observations: Reported | ||||||||||||||||||
|
List of 2 Events for Episode 1 at Ratu Crater
|
|||||||||||||||||||
2013 Feb 21 - 2013 Mar 6 Confirmed Eruption (Explosive / Effusive) VEI: 1
| Episode 1 | Eruption (Explosive / Effusive) | Ratu Crater | |||||||||||||||||||||||||||||||||||||||||||
|---|---|---|---|---|---|---|---|---|---|---|---|---|---|---|---|---|---|---|---|---|---|---|---|---|---|---|---|---|---|---|---|---|---|---|---|---|---|---|---|---|---|---|---|---|
| 2013 Feb 21 - 2013 Mar 6 | Evidence from Observations: Reported | |||||||||||||||||||||||||||||||||||||||||||
|
List of 7 Events for Episode 1 at Ratu Crater
|
||||||||||||||||||||||||||||||||||||||||||||
[ 1985 Nov 15 - 1985 Nov 15 ] Uncertain Eruption
| Episode 1 | Eruption (Explosive / Effusive) | Kawah Baru | ||||||||||||||||||
|---|---|---|---|---|---|---|---|---|---|---|---|---|---|---|---|---|---|---|---|
| 1985 Nov 15 - 1985 Nov 15 | Evidence from Unknown | ||||||||||||||||||
|
List of 2 Events for Episode 1 at Kawah Baru
|
|||||||||||||||||||
1983 Sep 14 Confirmed Eruption (Explosive / Effusive) VEI: 1
| Episode 1 | Eruption (Explosive / Effusive) | Kawah Ratu | |||||||||||||||||||||||
|---|---|---|---|---|---|---|---|---|---|---|---|---|---|---|---|---|---|---|---|---|---|---|---|---|
| 1983 Sep 14 - Unknown | Evidence from Observations: Reported | |||||||||||||||||||||||
|
List of 3 Events for Episode 1 at Kawah Ratu
|
||||||||||||||||||||||||
1969 Jul 20 - 1969 Oct 21 Confirmed Eruption (Explosive / Effusive) VEI: 1
| Episode 1 | Eruption (Explosive / Effusive) | Kawah Ecoma | ||||||||||||||||||||||||||||
|---|---|---|---|---|---|---|---|---|---|---|---|---|---|---|---|---|---|---|---|---|---|---|---|---|---|---|---|---|---|
| 1969 Jul 20 - 1969 Oct 21 | Evidence from Observations: Reported | ||||||||||||||||||||||||||||
|
List of 4 Events for Episode 1 at Kawah Ecoma
|
|||||||||||||||||||||||||||||
1967 Jul 16 ± 15 days - 1967 Jul 16 ± 15 days Confirmed Eruption (Explosive / Effusive) VEI: 1
| Episode 1 | Eruption (Explosive / Effusive) | Kawah Ecoma | ||||||||||||||||||
|---|---|---|---|---|---|---|---|---|---|---|---|---|---|---|---|---|---|---|---|
| 1967 Jul 16 ± 15 days - 1967 Jul 16 ± 15 days | Evidence from Observations: Reported | ||||||||||||||||||
|
List of 2 Events for Episode 1 at Kawah Ecoma
|
|||||||||||||||||||
1965 Oct 16 ± 15 days - 1965 Oct 16 ± 15 days Confirmed Eruption (Explosive / Effusive) VEI: 1
| Episode 1 | Eruption (Explosive / Effusive) | |||||||||||||||||||
|---|---|---|---|---|---|---|---|---|---|---|---|---|---|---|---|---|---|---|---|
| 1965 Oct 16 ± 15 days - 1965 Oct 16 ± 15 days | Evidence from Observations: Reported | ||||||||||||||||||
|
List of 2 Events for Episode 1
|
|||||||||||||||||||
1965 Feb 16 ± 15 days - 1965 Mar 16 ± 15 days Confirmed Eruption (Explosive / Effusive) VEI: 1
| Episode 1 | Eruption (Explosive / Effusive) | |||||||||||||||||||
|---|---|---|---|---|---|---|---|---|---|---|---|---|---|---|---|---|---|---|---|
| 1965 Feb 16 ± 15 days - 1965 Mar 16 ± 15 days | Evidence from Observations: Reported | ||||||||||||||||||
|
List of 2 Events for Episode 1
|
|||||||||||||||||||
1961 Jul 16 - 1961 Aug 1 Confirmed Eruption (Explosive / Effusive) VEI: 1
| Episode 1 | Eruption (Explosive / Effusive) | |||||||||||||||||||
|---|---|---|---|---|---|---|---|---|---|---|---|---|---|---|---|---|---|---|---|
| 1961 Jul 16 - 1961 Aug 1 | Evidence from Observations: Reported | ||||||||||||||||||
|
List of 2 Events for Episode 1
|
|||||||||||||||||||
1957 Jan 16 ± 15 days - 1957 Jan 16 ± 15 days Confirmed Eruption (Explosive / Effusive) VEI: 1
| Episode 1 | Eruption (Explosive / Effusive) | Kawah Baru | ||||||||||||||||||
|---|---|---|---|---|---|---|---|---|---|---|---|---|---|---|---|---|---|---|---|
| 1957 Jan 16 ± 15 days - 1957 Jan 16 ± 15 days | Evidence from Observations: Reported | ||||||||||||||||||
|
List of 2 Events for Episode 1 at Kawah Baru
|
|||||||||||||||||||
1952 Jul 4 (?) - 1952 Jul 11 Confirmed Eruption (Explosive / Effusive) VEI: 1
| Episode 1 | Eruption (Explosive / Effusive) | Kawah Ecoma | |||||||||||||||||||||||
|---|---|---|---|---|---|---|---|---|---|---|---|---|---|---|---|---|---|---|---|---|---|---|---|---|
| 1952 Jul 4 (?) - 1952 Jul 11 | Evidence from Observations: Reported | |||||||||||||||||||||||
|
List of 3 Events for Episode 1 at Kawah Ecoma
|
||||||||||||||||||||||||
1929 May 20 - 1929 May 20 Confirmed Eruption (Explosive / Effusive) VEI: 0
| Episode 1 | Eruption (Explosive / Effusive) | Kawah Ecoma | ||||||||||||||||||
|---|---|---|---|---|---|---|---|---|---|---|---|---|---|---|---|---|---|---|---|
| 1929 May 20 - 1929 May 20 | Evidence from Observations: Reported | ||||||||||||||||||
|
List of 2 Events for Episode 1 at Kawah Ecoma
|
|||||||||||||||||||
1926 Mar 1 - 1926 Jul 9 Confirmed Eruption (Explosive / Effusive) VEI: 1 (?)
| Episode 1 | Eruption (Explosive / Effusive) | Kawah Ecoma | |||||||||||||||||||||||||||||||||
|---|---|---|---|---|---|---|---|---|---|---|---|---|---|---|---|---|---|---|---|---|---|---|---|---|---|---|---|---|---|---|---|---|---|---|
| 1926 Mar 1 - 1926 Jul 9 | Evidence from Observations: Reported | |||||||||||||||||||||||||||||||||
|
List of 5 Events for Episode 1 at Kawah Ecoma
|
||||||||||||||||||||||||||||||||||
1910 Apr 7 - 1910 May Confirmed Eruption (Explosive / Effusive) VEI: 2
| Episode 1 | Eruption (Explosive / Effusive) | Kawah Ratu B | ||||||||||||||||||||||||||||||||||||||
|---|---|---|---|---|---|---|---|---|---|---|---|---|---|---|---|---|---|---|---|---|---|---|---|---|---|---|---|---|---|---|---|---|---|---|---|---|---|---|---|
| 1910 Apr 7 - 1910 May | Evidence from Observations: Reported | ||||||||||||||||||||||||||||||||||||||
|
List of 6 Events for Episode 1 at Kawah Ratu B
|
|||||||||||||||||||||||||||||||||||||||
1896 May 22 - 1896 May 23 Confirmed Eruption (Explosive / Effusive) VEI: 2
| Episode 1 | Eruption (Explosive / Effusive) | Kawah Baru | |||||||||||||||||||||||
|---|---|---|---|---|---|---|---|---|---|---|---|---|---|---|---|---|---|---|---|---|---|---|---|---|
| 1896 May 22 - 1896 May 23 | Evidence from Observations: Reported | |||||||||||||||||||||||
|
List of 3 Events for Episode 1 at Kawah Baru
|
||||||||||||||||||||||||
1846 May 27 Confirmed Eruption (Explosive / Effusive) VEI: 2
| Episode 1 | Eruption (Explosive / Effusive) | Kawah Ratu B | |||||||||||||||||||||||||||||||||||||||||||
|---|---|---|---|---|---|---|---|---|---|---|---|---|---|---|---|---|---|---|---|---|---|---|---|---|---|---|---|---|---|---|---|---|---|---|---|---|---|---|---|---|---|---|---|---|
| 1846 May 27 - Unknown | Evidence from Observations: Reported | |||||||||||||||||||||||||||||||||||||||||||
|
List of 7 Events for Episode 1 at Kawah Ratu B
|
||||||||||||||||||||||||||||||||||||||||||||
1842 Confirmed Eruption (Explosive / Effusive)
| Episode 1 | Eruption (Explosive / Effusive) | ||||||||||||||
|---|---|---|---|---|---|---|---|---|---|---|---|---|---|---|
| 1842 - Unknown | Evidence from Observations: Reported | |||||||||||||
|
List of 1 Events for Episode 1
|
||||||||||||||
1829 Apr 1 - 1829 Apr 4 (?) Confirmed Eruption (Explosive / Effusive) VEI: 2
| Episode 1 | Eruption (Explosive / Effusive) | Kawah Ratu and Kawah Domas | ||||||||||||||||||||||||||||||||||||||||||||||||
|---|---|---|---|---|---|---|---|---|---|---|---|---|---|---|---|---|---|---|---|---|---|---|---|---|---|---|---|---|---|---|---|---|---|---|---|---|---|---|---|---|---|---|---|---|---|---|---|---|---|
| 1829 Apr 1 - 1829 Apr 4 (?) | Evidence from Observations: Reported | ||||||||||||||||||||||||||||||||||||||||||||||||
|
List of 8 Events for Episode 1 at Kawah Ratu and Kawah Domas
|
|||||||||||||||||||||||||||||||||||||||||||||||||
1826 Oct 11 - 1826 Oct 11 Confirmed Eruption (Explosive / Effusive) VEI: 2
| Episode 1 | Eruption (Explosive / Effusive) | |||||||||||||||||||
|---|---|---|---|---|---|---|---|---|---|---|---|---|---|---|---|---|---|---|---|
| 1826 Oct 11 - 1826 Oct 11 | Evidence from Observations: Reported | ||||||||||||||||||
|
List of 2 Events for Episode 1
|
|||||||||||||||||||
7500 BCE ± 50 years Confirmed Eruption (Explosive / Effusive)
| Episode 1 | Eruption (Explosive / Effusive) | Tephra layer YT3 | ||||||||||||||||||
|---|---|---|---|---|---|---|---|---|---|---|---|---|---|---|---|---|---|---|---|
| 7500 BCE ± 50 years - Unknown | Evidence from Isotopic: 14C (uncalibrated) | ||||||||||||||||||
|
List of 2 Events for Episode 1 at Tephra layer YT3
|
|||||||||||||||||||
8020 BCE ± 50 years Confirmed Eruption (Explosive / Effusive)
| Episode 1 | Eruption (Explosive / Effusive) | Tephra layer YT2 | ||||||||||||||||||
|---|---|---|---|---|---|---|---|---|---|---|---|---|---|---|---|---|---|---|---|
| 8020 BCE ± 50 years - Unknown | Evidence from Isotopic: 14C (uncalibrated) | ||||||||||||||||||
|
List of 2 Events for Episode 1 at Tephra layer YT2
|
|||||||||||||||||||
This compilation of synonyms and subsidiary features may not be comprehensive. Features are organized into four major categories: Cones, Craters, Domes, and Thermal Features. Synonyms of features appear indented below the primary name. In some cases additional feature type, elevation, or location details are provided.
Synonyms |
||||
| Tangkubanparahu | Tangkoeban Prahoe | Tangkuban Perahu | ||||
Cones |
||||
| Feature Name | Feature Type | Elevation | Latitude | Longitude |
| Tunggul, Bukit | Stratovolcano | 6° 48' 0.00" S | 107° 46' 0.00" E | |
Craters |
||||
| Feature Name | Feature Type | Elevation | Latitude | Longitude |
| Badak, Kawah | Crater | |||
| Baru, Kawah | Crater | |||
| Domas, Kawah | Crater | 1760 m | ||
| Ecoma, Kawah | Crater | |||
| Jarian, Kawah
Djarian, Kawah |
Crater | 1540 m | ||
| Jurig, Kawah
Djurig, Kawah |
Crater | 1700 m | ||
| Malang | Crater | |||
| Panggujangan Badak
Pangguyangan Badak |
Crater | |||
| Ratu, Kawah | Crater | 1976 m | ||
| Siluman, Kawah | Crater | |||
| Sunda Caldera
Soenda Caldera |
Pleistocene caldera | |||
| Upas, Kawah
Lanang, Kawah |
Crater | 2075 m | ||
Thermal |
||||
| Feature Name | Feature Type | Elevation | Latitude | Longitude |
| Ciatur | Thermal | |||
| Maribaya | Thermal | |||
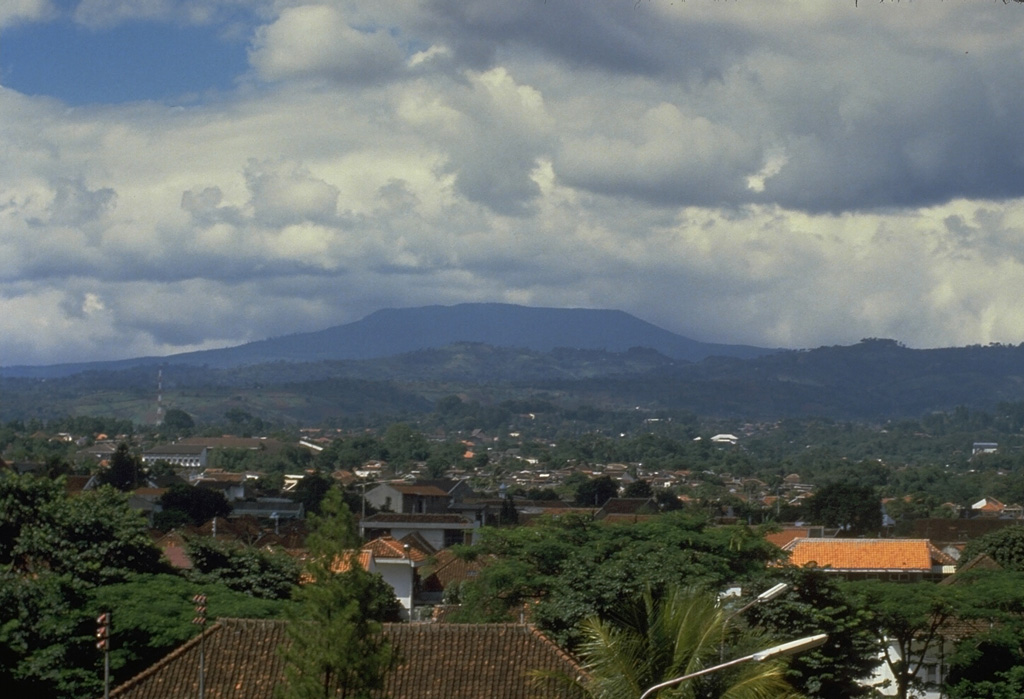
 Nine partially overlapping craters form an elliptical depression at the summit of Tangkubanparahu volcano, north of the city of Bandung. Numerous small phreatic eruptions have been recorded since the early 19th century. Tangkubanparahu is one the most visited tourist desitinations near the city of Bandung, Indonesia's third largest city.
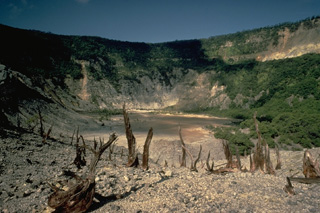 The crater floor of Tangkubanparahu volcano is an easily accessible tourist destination for visitors from Bandung. Small phreatic eruptions have occurred in historical time from several of the many overlapping craters at the summit of the volcano.
 The broad Tangkuban Parahu, known locally as the mountain of the "upturned boat," dominates the skyline immediately N of Indonesia's former capital city of Bandung. The volcano is truncated by the 6 x 8 km Pleistocene Sunda caldera. A series of nine overlapping craters form a 1 x 1.5 km wide elliptical depression at the summit of the post-caldera cone. Minor phreatic eruptions have occurred in historical time.
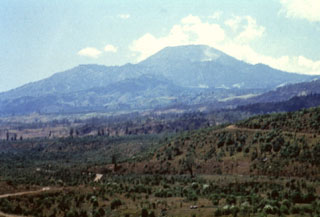 Tangkuban Parahu seen here from the E, forms the most prominent peak N of the city of Bandung. The summit overlooks a broad crater complex, whose southern rim forms the flat ridge left of the summit. Pyroclastic-flow deposits emplaced during the formation of a large caldera that preceded the construction of Tangkubanparahu are present around Bandung.
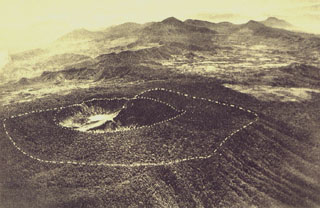 The broad summit of Tangkuban Parahu volcano is seen in this aerial view from the NW. The dashed line outlines an outer crater inside which a younger crater complex (dotted line) was constructed. Frequent phreatic eruptions have occurred during historical time from the central crater complex. Bukit Tunggul, an older volcano is the peak visible at the center of the horizon.
There are no samples for Tangkuban Parahu in the Smithsonian's NMNH Department of Mineral Sciences Rock and Ore collection.
| Copernicus Browser | The Copernicus Browser replaced the Sentinel Hub Playground browser in 2023, to provide access to Earth observation archives from the Copernicus Data Space Ecosystem, the main distribution platform for data from the EU Copernicus missions. |
| MIROVA | Middle InfraRed Observation of Volcanic Activity (MIROVA) is a near real time volcanic hot-spot detection system based on the analysis of MODIS (Moderate Resolution Imaging Spectroradiometer) data. In particular, MIROVA uses the Middle InfraRed Radiation (MIR), measured over target volcanoes, in order to detect, locate and measure the heat radiation sourced from volcanic activity. |
| MODVOLC Thermal Alerts | Using infrared satellite Moderate Resolution Imaging Spectroradiometer (MODIS) data, scientists at the Hawai'i Institute of Geophysics and Planetology, University of Hawai'i, developed an automated system called MODVOLC to map thermal hot-spots in near real time. For each MODIS image, the algorithm automatically scans each 1 km pixel within it to check for high-temperature hot-spots. When one is found the date, time, location, and intensity are recorded. MODIS looks at every square km of the Earth every 48 hours, once during the day and once during the night, and the presence of two MODIS sensors in space allows at least four hot-spot observations every two days. Each day updated global maps are compiled to display the locations of all hot spots detected in the previous 24 hours. There is a drop-down list with volcano names which allow users to 'zoom-in' and examine the distribution of hot-spots at a variety of spatial scales. |
|
WOVOdat
Single Volcano View Temporal Evolution of Unrest Side by Side Volcanoes |
WOVOdat is a database of volcanic unrest; instrumentally and visually recorded changes in seismicity, ground deformation, gas emission, and other parameters from their normal baselines. It is sponsored by the World Organization of Volcano Observatories (WOVO) and presently hosted at the Earth Observatory of Singapore.
GVMID Data on Volcano Monitoring Infrastructure The Global Volcano Monitoring Infrastructure Database GVMID, is aimed at documenting and improving capabilities of volcano monitoring from the ground and space. GVMID should provide a snapshot and baseline view of the techniques and instrumentation that are in place at various volcanoes, which can be use by volcano observatories as reference to setup new monitoring system or improving networks at a specific volcano. These data will allow identification of what monitoring gaps exist, which can be then targeted by remote sensing infrastructure and future instrument deployments. |
| Volcanic Hazard Maps | The IAVCEI Commission on Volcanic Hazards and Risk has a Volcanic Hazard Maps database designed to serve as a resource for hazard mappers (or other interested parties) to explore how common issues in hazard map development have been addressed at different volcanoes, in different countries, for different hazards, and for different intended audiences. In addition to the comprehensive, searchable Volcanic Hazard Maps Database, this website contains information about diversity of volcanic hazard maps, illustrated using examples from the database. This site is for educational purposes related to volcanic hazard maps. Hazard maps found on this website should not be used for emergency purposes. For the most recent, official hazard map for a particular volcano, please seek out the proper institutional authorities on the matter. |
| IRIS seismic stations/networks | Incorporated Research Institutions for Seismology (IRIS) Data Services map showing the location of seismic stations from all available networks (permanent or temporary) within a radius of 0.18° (about 20 km at mid-latitudes) from the given location of Tangkuban Parahu. Users can customize a variety of filters and options in the left panel. Note that if there are no stations are known the map will default to show the entire world with a "No data matched request" error notice. |
| UNAVCO GPS/GNSS stations | Geodetic Data Services map from UNAVCO showing the location of GPS/GNSS stations from all available networks (permanent or temporary) within a radius of 20 km from the given location of Tangkuban Parahu. Users can customize the data search based on station or network names, location, and time window. Requires Adobe Flash Player. |
| DECADE Data | The DECADE portal, still in the developmental stage, serves as an example of the proposed interoperability between The Smithsonian Institution's Global Volcanism Program, the Mapping Gas Emissions (MaGa) Database, and the EarthChem Geochemical Portal. The Deep Earth Carbon Degassing (DECADE) initiative seeks to use new and established technologies to determine accurate global fluxes of volcanic CO2 to the atmosphere, but installing CO2 monitoring networks on 20 of the world's 150 most actively degassing volcanoes. The group uses related laboratory-based studies (direct gas sampling and analysis, melt inclusions) to provide new data for direct degassing of deep earth carbon to the atmosphere. |
| Large Eruptions of Tangkuban Parahu | Information about large Quaternary eruptions (VEI >= 4) is cataloged in the Large Magnitude Explosive Volcanic Eruptions (LaMEVE) database of the Volcano Global Risk Identification and Analysis Project (VOGRIPA). |
| EarthChem | EarthChem develops and maintains databases, software, and services that support the preservation, discovery, access and analysis of geochemical data, and facilitate their integration with the broad array of other available earth science parameters. EarthChem is operated by a joint team of disciplinary scientists, data scientists, data managers and information technology developers who are part of the NSF-funded data facility Integrated Earth Data Applications (IEDA). IEDA is a collaborative effort of EarthChem and the Marine Geoscience Data System (MGDS). |

