
The Japan Meteorological Agency (JMA) reported that no signs of eruptive activity at the Kaitoku Seamount have been observed since discolored water and floating material were identified in January 2023. At 1100 on 14 February the “eruption warning” status was lowered to “eruption forecast” based on a two-level scale used for underwater volcanoes.
Source: Japan Meteorological Agency (JMA)
New eruption with strongly discolored water during August 2022-January 2023
Kaitoku Seamount is a three-peaked submarine volcano located about 1 km S of Tokyo, Japan. The base of the seamount has a diameter of 40 km and a height of 2.5 km above the ocean floor. The two peaks in the south are called Tokai Tokuba and Nishi Tokuba (figure 2). The most recent previous confirmed eruption was in 1984, when discolored water, gas-and-steam plumes, and floating pumice was reported (SEAN 09:10). Water discoloration was observed in December 1984 and June 1986, and the Japan Coast Guard (JCG) described activity in July 2001 which mainly consisted of bubbles. This report covers a new eruption that was characterized by strongly discolored water during August 2022 through January 2023 based on information from the Japan Meteorological Agency (JMA), Japan Coast Guard (JCG), and satellite data.
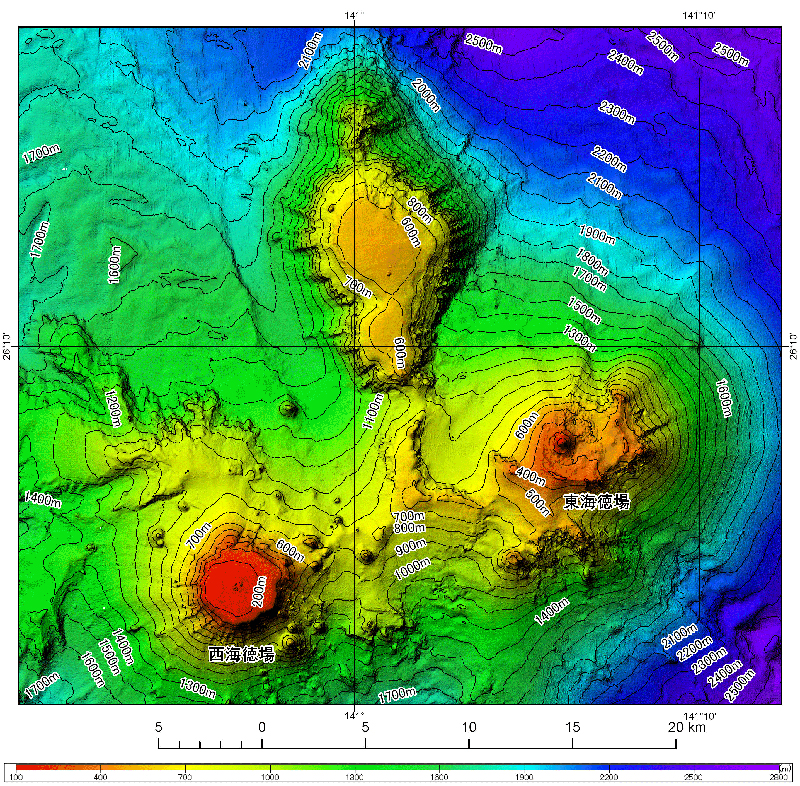 |
Figure 2. Submarine bathymetry map of Kaitoku Seamount. The island on the left is Nishi Tokuba (at a depth of 100 m) and the island on the right is Tokai Tokuba (depth of 97 m). The image date was not provided. Courtesy of JCG. |
The JCG received a report on 19 August that discolored water was observed near the volcano on 18 and 19 August. This was also visible in a Sentinel-2 satellite image (figure 3). According to aerial observations by the JCG on 23 and 28 August, both discolored water and floating material were observed. The discolored water was yellow-white, approximately 100 m in diameter, and located near the Tokai Tokuba peak. On 28 August multiple zones of white discolored water were observed directly above the volcano and floating material covered an area approximately 200-m-wide and 6-km-long to the SE (figure 4).
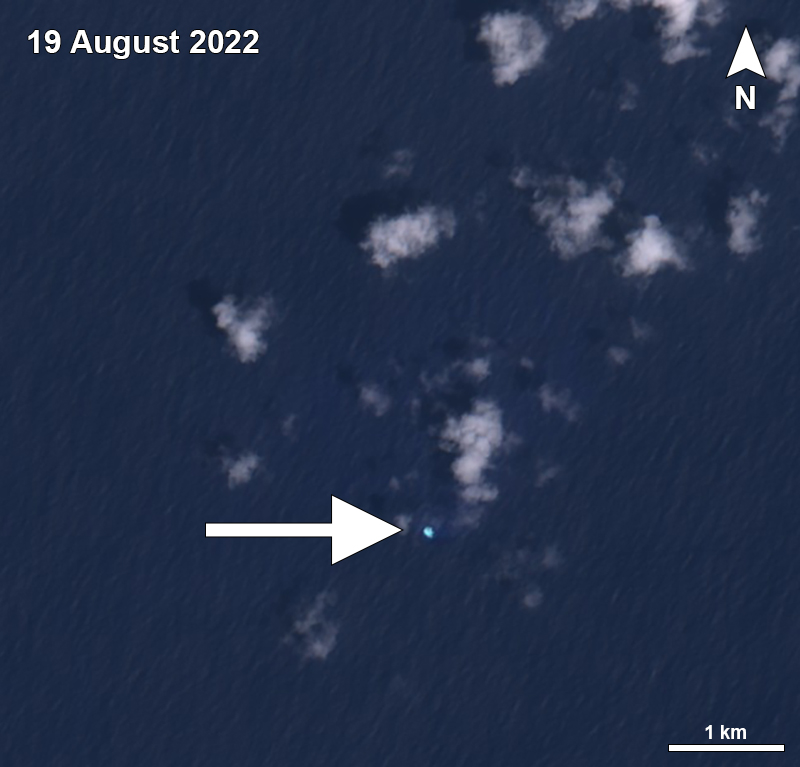 |
Figure 3. Sentinel-2 satellite image showing a small amount of discolored water (bright blue-white) above Kaitoku Seamount on 19 August 2022. Image with “Natural color” rendering (bands 4, 3, 2). Courtesy of Sentinel Hub Playground. |
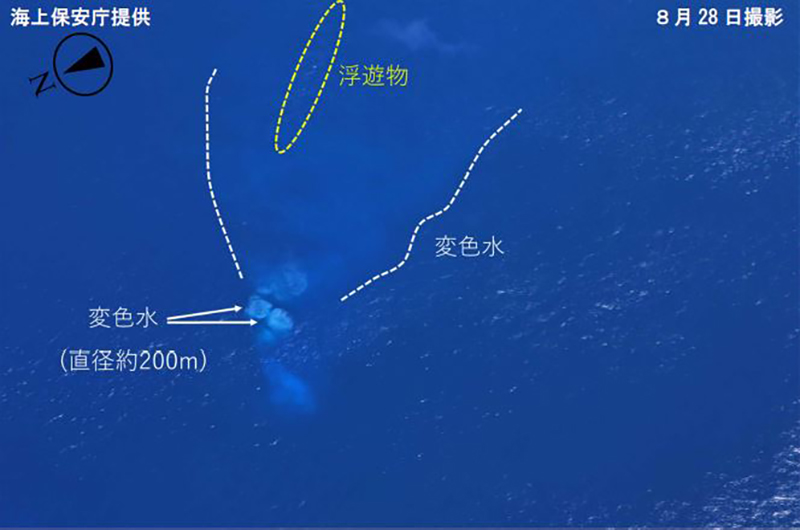 |
Figure 4. Multiple zones of white discolored water above Kaitoku Seamount were visible during aerial observations on 28 August 2022. The floating material (yellow dotted circle) was identified to the SE in an area approximately 200 m wide and 6 km long. Courtesy of JMA (monthly report of activity at Kaitoku Seamount, August 2022). |
Discolored water observations continued during September and October, which was interpreted as ongoing volcanic activity. Sentinel-2 satellite images showed small blue-white discolored plumes on 3, 8, 23, and 28 September that drifted SE, S, SW, and N from a single point. On 16 September an aerial observation conducted by JCG showed blue-white discolored water approximately 20 m wide and 30 m long (figure 5). Strong yellow-blue discolored water was visible on 28 September that mainly occurred around a single point, but a faint plume extended to the N. Though weather clouds sometimes prevented clear views of the vent area, discolored water plumes appeared more frequently in October. On 12 October there was a zone of dense yellow-white discolored water approximately 200 m in diameter; no floating material was observed (figure 6). Sentinel-2 satellite images captured discolored plumes on 3, 8, 13, 18, and 23 October, that mainly encompassed a single area. Part of the plumes extended SW, NW, E, and NE (figure 7).
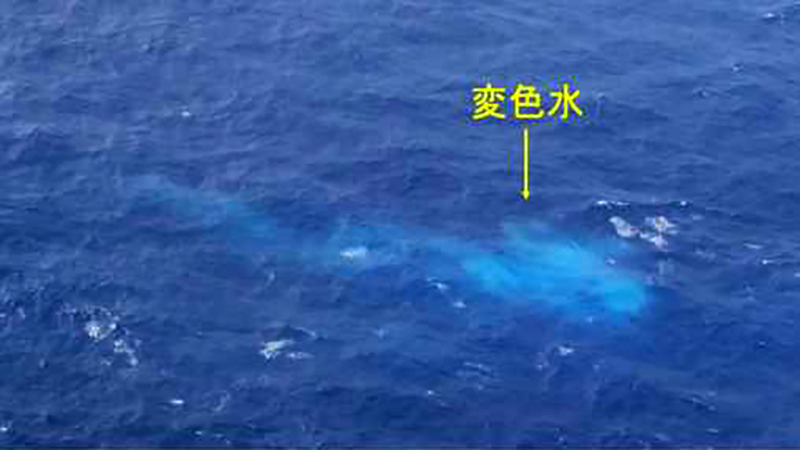 |
Figure 5. Blue-white discolored water was observed during an aerial overflight of Kaitoku Seamount that was approximately 20 m wide and 30 m long at 1422 on 16 September 2022. Photo has been color corrected. Courtesy of JMA (monthly report of activity at Kaitoku Seamount, September 2022). |
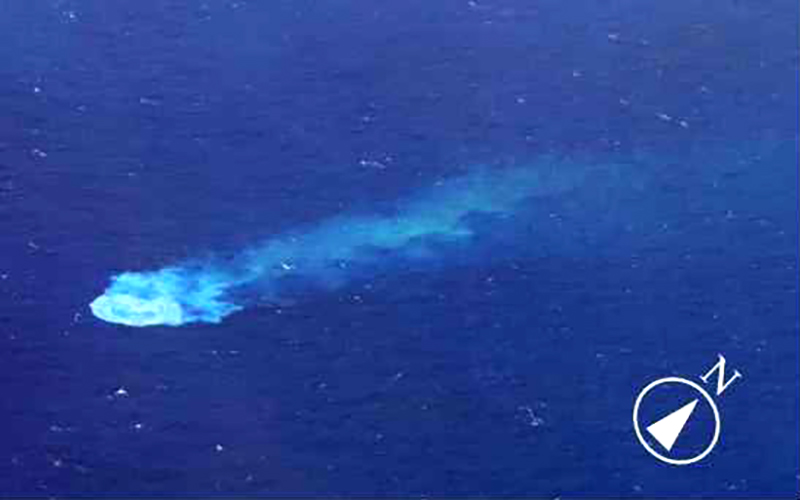 |
Figure 6. Aerial observation showing blue-white to green-yellow discolored water approximately 200 m in diameter at Kaitoku Seamount on 12 October 2022. Photo has been color corrected. Courtesy of JMA (monthly report of activity at Kaitoku Seamount, October 2022). |
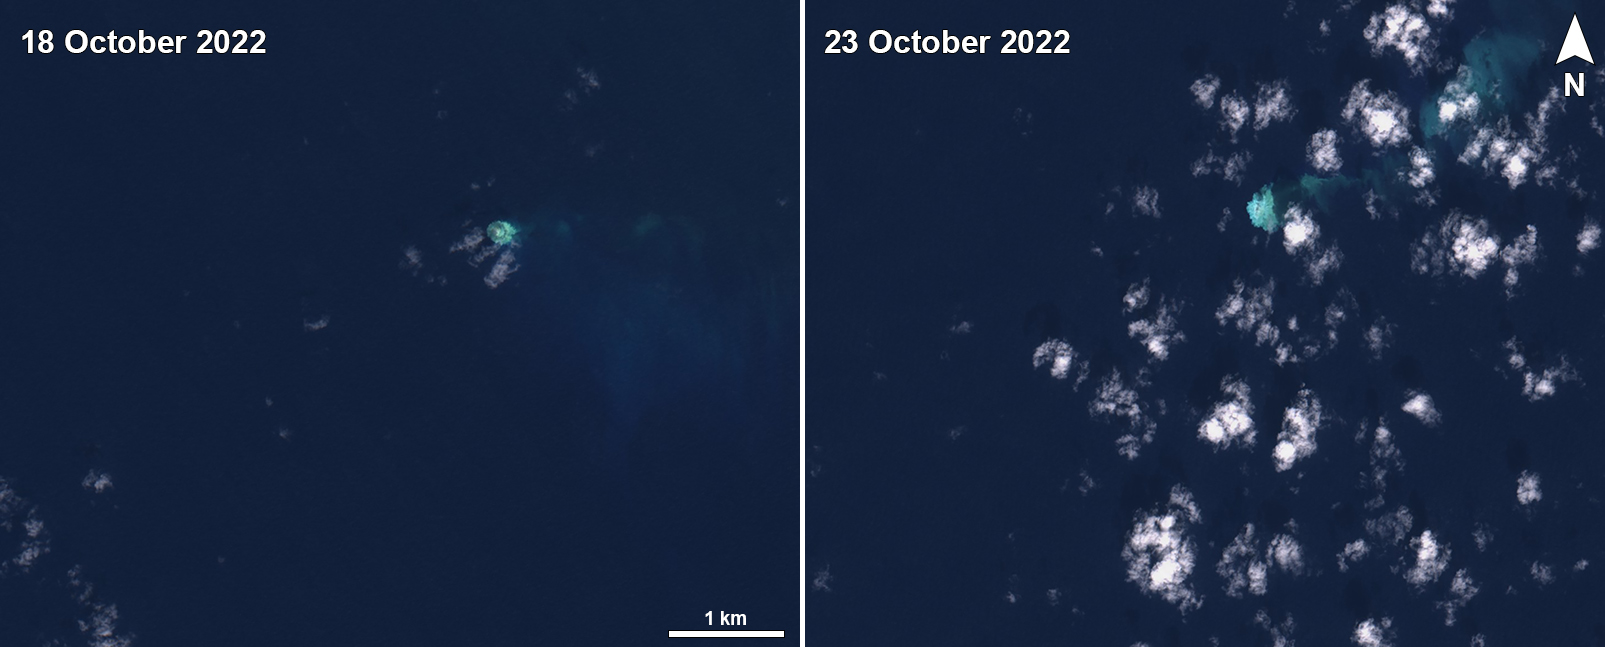 |
Figure 7. Bright blue-white to green-yellow discolored plumes at Kaitoku Seamount were visible in Sentinel-2 satellite images on 18 (left) and 23 (right) October 2022 that both drifted E and NE, respectively. The image taken on 18 October possibly captured material at the surface (darker circle). The white-and-gray irregular circles are atmospheric clouds, mostly seen in the 23 October image. Images with “Natural color” rendering (bands 4, 3, 2). Courtesy of Sentinel Hub Playground. |
During November 2022 through January 2023 occasional strongly discolored plumes persisted. Sentinel-2 satellite images captured green-yellow discolored plumes on 22 and 27 November that drifted several kilometers SW and SE (figure 8). An aerial observation conducted by JCG on 25 November showed a yellow-white circular shape of discolored water approximately 300 m in diameter (figure 9). Additionally, blue-white discolored water was observed extending 1 km SW from the volcano and was about 10 km in length. Strong green-yellow discolored plumes were visible in Sentinel-2 satellite images on 17 and 27 December that drifted SE and S as far as 10 km from the vent area (figure 10). Frequent strongly discolored plumes were captured in satellite imagery on 1, 6, 11, 16, and 26 January 2023 that drifted in different directions for several kilometers. On 1 and 16 January white bubbles were also visible around the vent area (figure 11).
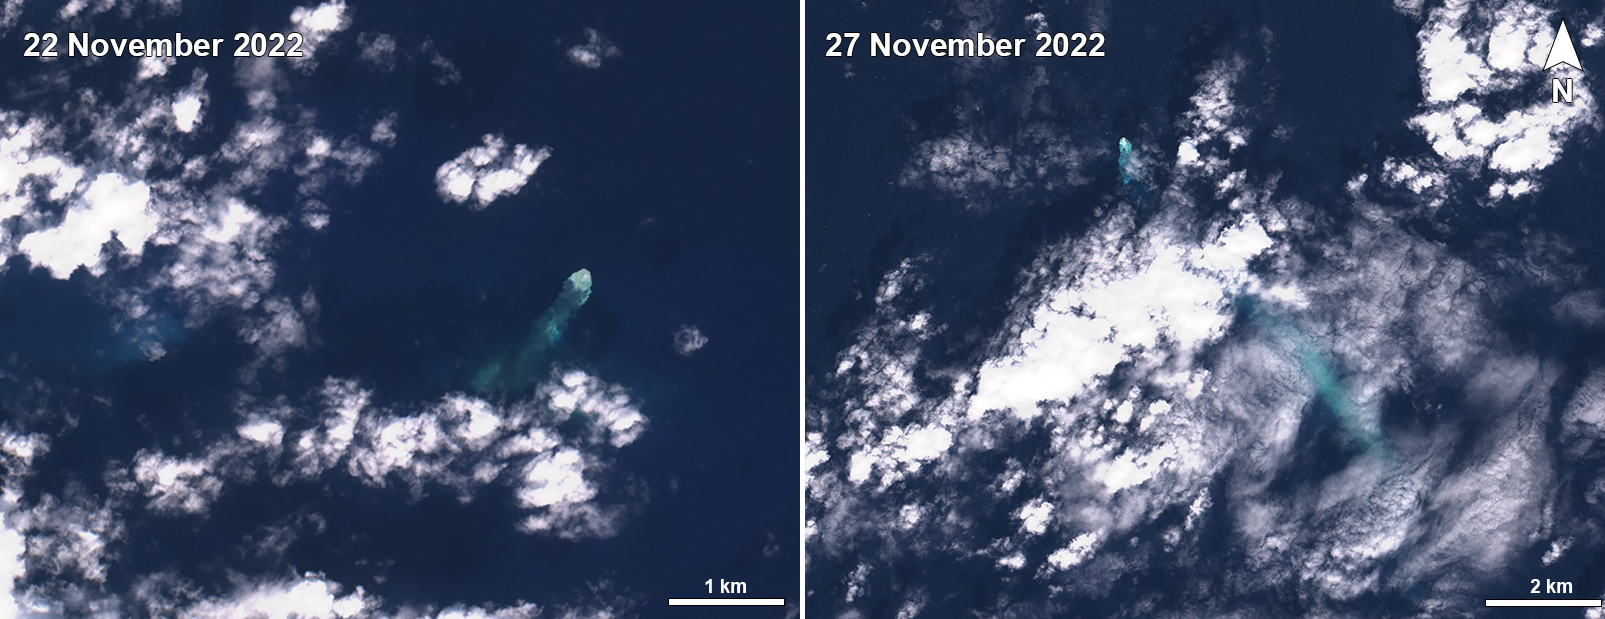 |
Figure 8. Sentinel-2 satellite images showing two strong green-yellow discolored plumes at Kaitoku Seamount on 22 (left) and 27 (right) November 2022. Some darker material may have also been captured at the sea surface accompanying the discoloration. The plume on 22 November drifted several kilometers SW and on 27 November a strong plume drifted SE for several tens of kilometers. Images with “Natural color” rendering (bands 4, 3, 2). Courtesy of Sentinel Hub Playground. |
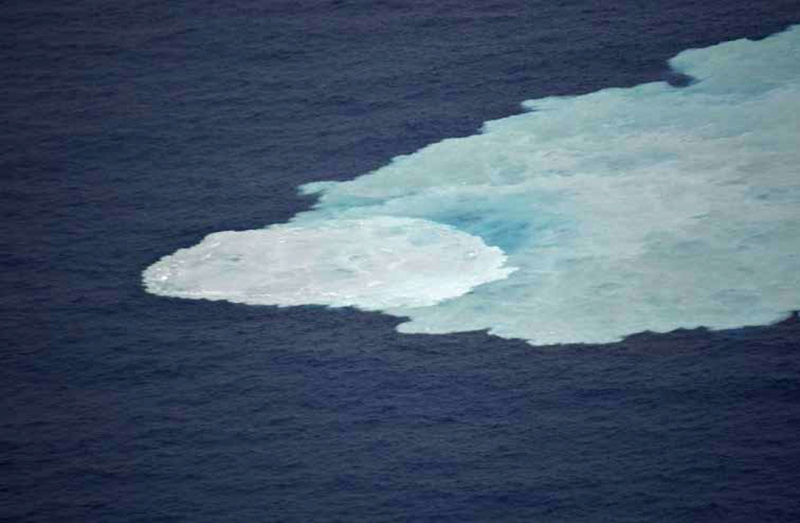 |
Figure 9. A bright plume of yellow-white discolored water approximately 300 m in diameter at Kaitoku Seamount at 1357 on 25 November 2022 was observed during an aerial overflight. Photo has been color corrected. Courtesy of JMA (monthly report of activity at Kaitoku Seamount, November 2022). |
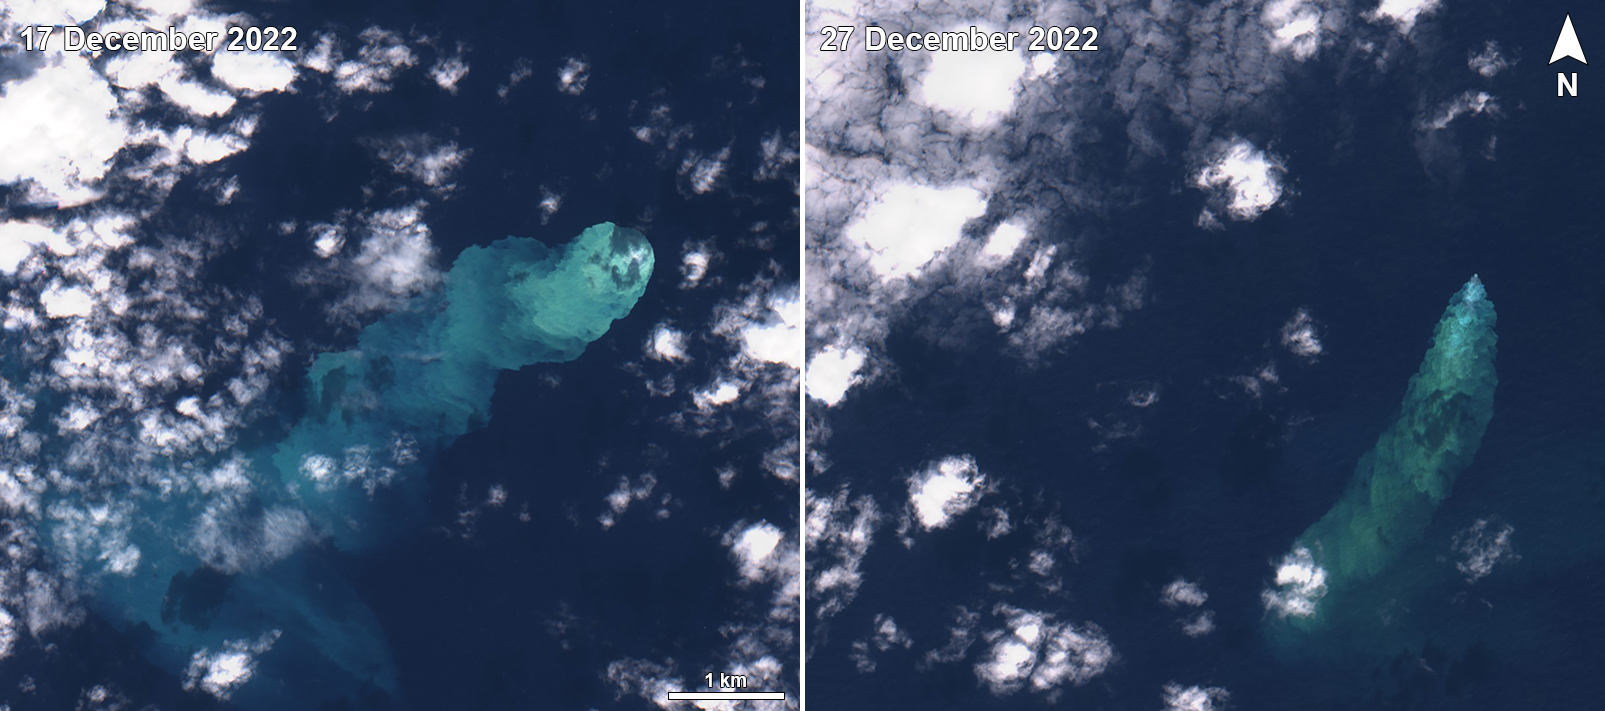 |
Figure 10. Green-yellow discolored water plumes captured in Sentinel-2 satellite images at Kaitoku Seamount on 17 (left) and 27 (right) December 2022 drifted SE and S, and extended as far as 10 km from the vent area. Images with “Natural color” rendering (bands 4, 3, 2). Courtesy of Sentinel Hub Playground. |
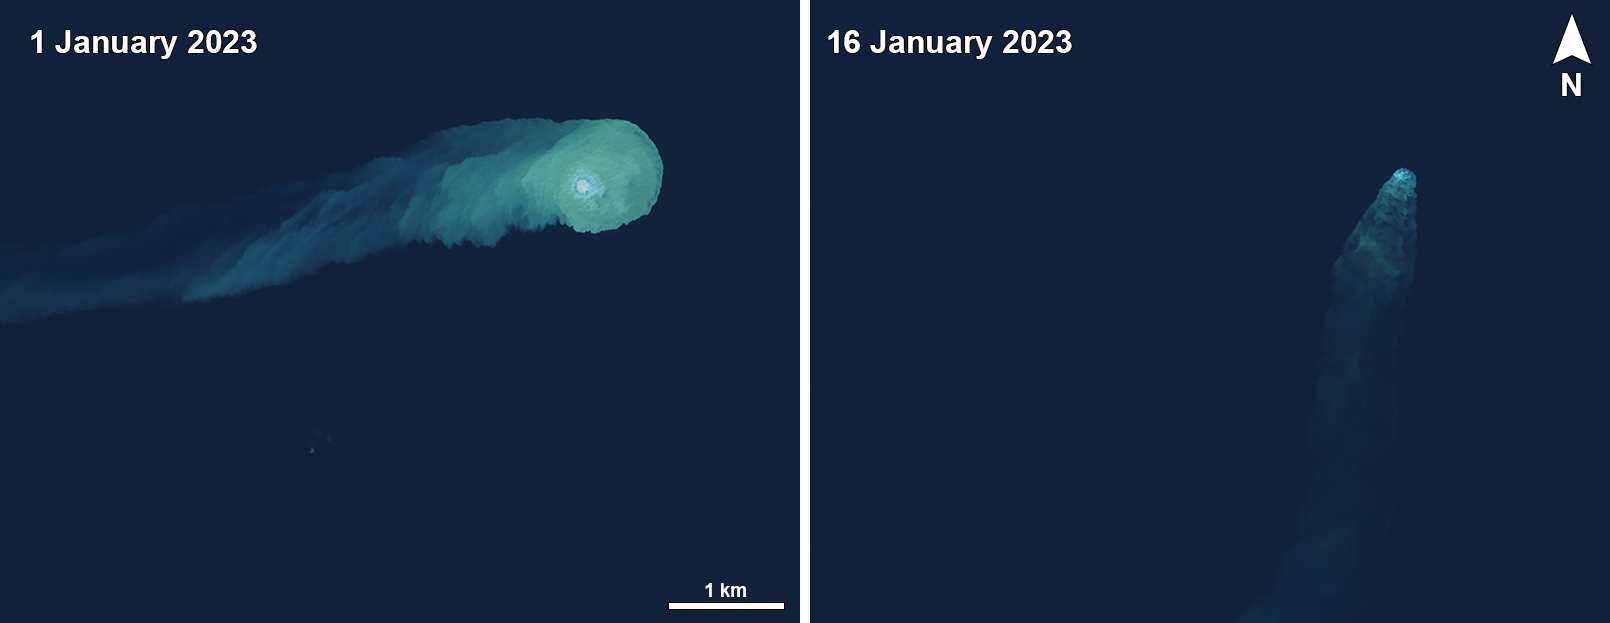 |
Figure 11. Sentinel-2 satellite imagery showing green-yellow discolored water plumes drifting W and S from the vent area of Kaitoku Seamount on 1 (left) and 16 (right) January 2023. White bubbles were also visible above the vent area on both days. Images with “Natural color” rendering (bands 4, 3, 2). Courtesy of Sentinel Hub Playground. |
Information Contacts: Japan Meteorological Agency (JMA), 1-3-4 Otemachi, Chiyoda-ku, Tokyo 100-8122, Japan (URL: http://www.jma.go.jp/jma/indexe.html); Japan Coast Guard (JCG) Volcano Database, Hydrographic and Oceanographic Department, 3-1-1, Kasumigaseki, Chiyoda-ku, Tokyo 100-8932, Japan (URL: https://www1.kaiho.mlit.go.jp/kaiikiDB/kaiyo20-2.htm); Sentinel Hub Playground (URL: https://www.sentinel-hub.com/explore/sentinel-playground).
2025: February
2023: January
2022: August
| December
The Japan Meteorological Agency (JMA) reported that no signs of eruptive activity at the Kaitoku Seamount have been observed since discolored water and floating material were identified in January 2023. At 1100 on 14 February the “eruption warning” status was lowered to “eruption forecast” based on a two-level scale used for underwater volcanoes.
Source: Japan Meteorological Agency (JMA)
Discolored water around the Kaitoku Seamount was visible in a 26 January Sentinel 2 satellite image. The plume was diffuse and dispersed a few kilometers E. No discolored water was visible in a 31 January image.
Source: Sentinel Hub
Discolored water around the Kaitoku Seamount was visible in 1 and 6 January Sentinel satellite images. Concentric circles of discolored water radiated out from the vent area and a plume drifted W. The plume of discolored water extended S in the 6 January image.
Source: Sentinel Hub
After JMA first reported new activity around the Kaitoku Seamount in August, discolored water continued to be periodically visible in Sentinel satellite images through 27 December. Though weather clouds sometimes prevented views of the vent area, and on occasion no activity was visible in clear images, plumes of discolored water drifting away from the vent area appeared to become more frequent in October. Images from 18 October, and 22 and 27 November possibly captured material at the surface or an eruption plume rising above the water. The Japan Coast Guard posted pictures of disturbed water around the vent in November. Recent Sentinel images on 17 and 27 December captured plumes of discolored water drifting as far as 10 km from the vent area.
Sources: Sentinel Hub; Japan Coast Guard
JMA reported that discolored water around the Kaitoku Seamount was visible during 18-19 August.
Sources: Japan Meteorological Agency (JMA); Japan Coast Guard
Reports are organized chronologically and indexed below by Month/Year (Publication Volume:Number), and include a one-line summary. Click on the index link or scroll down to read the reports.
Large area of discolored water; small plumes
On 7 March at 1230, the crew of a Japan Maritime Self-Defense Force (JMSDF) transport plane flying about 130 km N of Iwo-Jima observed a fan-shaped zone of discolored sea water that extended about [28] km WSW from a submarine vent. The maximum width of the discolored zone was about 9 km. A helicopter flew over the area shortly thereafter and its crew estimated that the extent of the reddish-brown water was roughly as large as Iwo Jima Island (about 5 x 8 km).
The next morning, JMSA personnel observed continuous submarine eruptive activity. Gray or yellowish brown water was ejected every 10 minutes and waves spread outward from the vents. The sea colors included gray, white, yellowish brown, and reddish brown. JMSA observers saw neither plumes nor floating ejecta, although small white plumes and rocks or reefs were seen during a flight by the JMSDF at about noon the same day. On 12 March, personnel aboard a JMSDF patrol plane again saw floating material, and a plume about 100 m above sea level. Only discoloration was found during a JMSA flight 13 March. As of the 13th, no new island had been observed at the eruption site.
The activity was located near the site of an eruption reported in 1543 at 26.00°N, 140.77°E.
Information Contacts: JMA.
Acoustic waves recorded in French Polynesia
RSP stations on Rangiroa, Tubuai, and Rikitéa recorded acoustic waves (T-phase) from a strong submarine volcanic eruption in the vicinity of the Izu Islands. Between 25 March and 30 April, more than 500 signals were received, 300 between 2 and 9 April. Most of the events were impulsive and of short duration, indicating explosive volcanic activity at a shallow depth. Some of the events were emergent and of longer duration indicating quiet emission of lava. J.M. Talandier noted that these events appear to be correlated with the submarine activity reported in 9:2.
Information Contacts: J. Talandier, Lab. de Géophysique, Tahiti.
Discolored water; floating lapilli; formal name
JMSA observations beginning 7 March indicated that eruptive activity was at its highest level in mid to late March, when floating ejecta and vapor plumes were nearly always seen. Beginning in April, activity subsided gradually. The area of discolored water decreased from 13 x 30 km in early March to 300 m in diameter in early May (table 1).
On either side of the submarine vent are two shallow areas, at 26.13°N, 141.10°E, and 26.05°N, 140.93°E (figure 1). JMSA has formally named the feature Kaitoku Kaizan (Kaitoku Seamount).
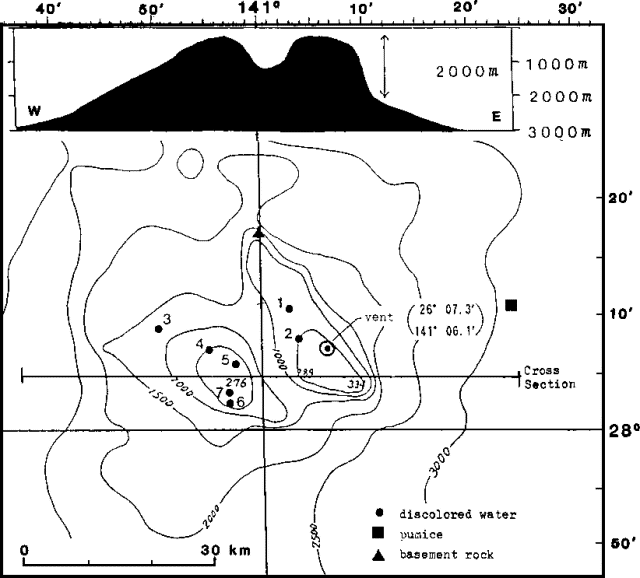 |
Figure 1. Cross-section (top) and bathymetry (bottom) at Kaitoku Seamount. Courtesy of JMSA. |
Information Contacts: JMA, Tokyo.
Discolored water after 3 months of quiet
JMSA reconnaissance revealed few signs of activity since the March eruption. Pumice was observed only around the eruption site; none washed up on shore.
Activity gradually declined. To the crew that overflew the area at noon on 9 April, the water discoloration was barely distinguishable, and no ejecta or plume was seen (table 1). JMSA and JMSDF saw no discolored water or other activity on 10 and 31 July, 1 August, and 6 and 26 September. However, the crew of the MV Emblem reported a 3.5-5-km area of upwelling and water discoloration on 15 October.
Table 1. JMSA observations at Kaitoku Seamount, March-June 1984. Courtesy of JMA.
| Date | Observation |
| 07 Mar 1984 | 9 x [28] km of discolored water |
| 08 Mar 1984 | Floating lapilli; 0.5-3 x 50 km of discolored water |
| 09 Mar 1984 | Seawater temperature at vent 0.5°C higher than floating lapilli; 9-13 x 30 km of discolored water |
| 12 Mar 1984 | Floating lapilli; discolored water |
| 13 Mar 1984 | Seawater near vent 0.5-1°C higher; floating lapilli; vapor plume |
| 15 Mar 1984 | Floating lapilli |
| 16-19 Mar 1984 | Floating lapilli; vapor plume |
| 22 Mar 1984 | Dark plume; luminescence at night |
| 23 Mar 1984 | Vapor plume; luminescence at night |
| 24-25 Mar 1984 | Vapor plume |
| 26 Mar 1984 | Floating lapilli |
| 09 Apr 1984 | 0.3 x 5 km of very weak water discoloration |
| 09-10 May 1984 | Area of discolored water 0.3 km in diameter |
| 15 May 1984 | White upwelling and discoloration, 3.5 km in diameter |
| 18 May 1984 | Milky white discoloration, 0.18 km wide |
| 09 Jun 1984 | Weak green discoloration, 0.15 x 0.05 km |
Further Reference. Tsuchide, M., Kato, S., Uchida, A., Sato, H., Konishi, N., Osaka, J., and Hirabayashi, J., 1985, Submarine volcanic activity at the Kaitoku seamount in 1984: Rep. Hydrograph. Res., v. 20, p. 47-82.
Information Contacts: JMA, Tokyo.
No water discoloration seen in 1990
No discolorations were observed at . . . Kaitoku . . . during 1990.
Information Contacts: Hydrographic Department, JMSA.
New eruption with strongly discolored water during August 2022-January 2023
Kaitoku Seamount is a three-peaked submarine volcano located about 1 km S of Tokyo, Japan. The base of the seamount has a diameter of 40 km and a height of 2.5 km above the ocean floor. The two peaks in the south are called Tokai Tokuba and Nishi Tokuba (figure 2). The most recent previous confirmed eruption was in 1984, when discolored water, gas-and-steam plumes, and floating pumice was reported (SEAN 09:10). Water discoloration was observed in December 1984 and June 1986, and the Japan Coast Guard (JCG) described activity in July 2001 which mainly consisted of bubbles. This report covers a new eruption that was characterized by strongly discolored water during August 2022 through January 2023 based on information from the Japan Meteorological Agency (JMA), Japan Coast Guard (JCG), and satellite data.
|
Figure 2. Submarine bathymetry map of Kaitoku Seamount. The island on the left is Nishi Tokuba (at a depth of 100 m) and the island on the right is Tokai Tokuba (depth of 97 m). The image date was not provided. Courtesy of JCG. |
The JCG received a report on 19 August that discolored water was observed near the volcano on 18 and 19 August. This was also visible in a Sentinel-2 satellite image (figure 3). According to aerial observations by the JCG on 23 and 28 August, both discolored water and floating material were observed. The discolored water was yellow-white, approximately 100 m in diameter, and located near the Tokai Tokuba peak. On 28 August multiple zones of white discolored water were observed directly above the volcano and floating material covered an area approximately 200-m-wide and 6-km-long to the SE (figure 4).
|
Figure 3. Sentinel-2 satellite image showing a small amount of discolored water (bright blue-white) above Kaitoku Seamount on 19 August 2022. Image with “Natural color” rendering (bands 4, 3, 2). Courtesy of Sentinel Hub Playground. |
|
Figure 4. Multiple zones of white discolored water above Kaitoku Seamount were visible during aerial observations on 28 August 2022. The floating material (yellow dotted circle) was identified to the SE in an area approximately 200 m wide and 6 km long. Courtesy of JMA (monthly report of activity at Kaitoku Seamount, August 2022). |
Discolored water observations continued during September and October, which was interpreted as ongoing volcanic activity. Sentinel-2 satellite images showed small blue-white discolored plumes on 3, 8, 23, and 28 September that drifted SE, S, SW, and N from a single point. On 16 September an aerial observation conducted by JCG showed blue-white discolored water approximately 20 m wide and 30 m long (figure 5). Strong yellow-blue discolored water was visible on 28 September that mainly occurred around a single point, but a faint plume extended to the N. Though weather clouds sometimes prevented clear views of the vent area, discolored water plumes appeared more frequently in October. On 12 October there was a zone of dense yellow-white discolored water approximately 200 m in diameter; no floating material was observed (figure 6). Sentinel-2 satellite images captured discolored plumes on 3, 8, 13, 18, and 23 October, that mainly encompassed a single area. Part of the plumes extended SW, NW, E, and NE (figure 7).
|
Figure 5. Blue-white discolored water was observed during an aerial overflight of Kaitoku Seamount that was approximately 20 m wide and 30 m long at 1422 on 16 September 2022. Photo has been color corrected. Courtesy of JMA (monthly report of activity at Kaitoku Seamount, September 2022). |
|
Figure 6. Aerial observation showing blue-white to green-yellow discolored water approximately 200 m in diameter at Kaitoku Seamount on 12 October 2022. Photo has been color corrected. Courtesy of JMA (monthly report of activity at Kaitoku Seamount, October 2022). |
|
Figure 7. Bright blue-white to green-yellow discolored plumes at Kaitoku Seamount were visible in Sentinel-2 satellite images on 18 (left) and 23 (right) October 2022 that both drifted E and NE, respectively. The image taken on 18 October possibly captured material at the surface (darker circle). The white-and-gray irregular circles are atmospheric clouds, mostly seen in the 23 October image. Images with “Natural color” rendering (bands 4, 3, 2). Courtesy of Sentinel Hub Playground. |
During November 2022 through January 2023 occasional strongly discolored plumes persisted. Sentinel-2 satellite images captured green-yellow discolored plumes on 22 and 27 November that drifted several kilometers SW and SE (figure 8). An aerial observation conducted by JCG on 25 November showed a yellow-white circular shape of discolored water approximately 300 m in diameter (figure 9). Additionally, blue-white discolored water was observed extending 1 km SW from the volcano and was about 10 km in length. Strong green-yellow discolored plumes were visible in Sentinel-2 satellite images on 17 and 27 December that drifted SE and S as far as 10 km from the vent area (figure 10). Frequent strongly discolored plumes were captured in satellite imagery on 1, 6, 11, 16, and 26 January 2023 that drifted in different directions for several kilometers. On 1 and 16 January white bubbles were also visible around the vent area (figure 11).
|
Figure 8. Sentinel-2 satellite images showing two strong green-yellow discolored plumes at Kaitoku Seamount on 22 (left) and 27 (right) November 2022. Some darker material may have also been captured at the sea surface accompanying the discoloration. The plume on 22 November drifted several kilometers SW and on 27 November a strong plume drifted SE for several tens of kilometers. Images with “Natural color” rendering (bands 4, 3, 2). Courtesy of Sentinel Hub Playground. |
|
Figure 9. A bright plume of yellow-white discolored water approximately 300 m in diameter at Kaitoku Seamount at 1357 on 25 November 2022 was observed during an aerial overflight. Photo has been color corrected. Courtesy of JMA (monthly report of activity at Kaitoku Seamount, November 2022). |
|
Figure 10. Green-yellow discolored water plumes captured in Sentinel-2 satellite images at Kaitoku Seamount on 17 (left) and 27 (right) December 2022 drifted SE and S, and extended as far as 10 km from the vent area. Images with “Natural color” rendering (bands 4, 3, 2). Courtesy of Sentinel Hub Playground. |
|
Figure 11. Sentinel-2 satellite imagery showing green-yellow discolored water plumes drifting W and S from the vent area of Kaitoku Seamount on 1 (left) and 16 (right) January 2023. White bubbles were also visible above the vent area on both days. Images with “Natural color” rendering (bands 4, 3, 2). Courtesy of Sentinel Hub Playground. |
Information Contacts: Japan Meteorological Agency (JMA), 1-3-4 Otemachi, Chiyoda-ku, Tokyo 100-8122, Japan (URL: http://www.jma.go.jp/jma/indexe.html); Japan Coast Guard (JCG) Volcano Database, Hydrographic and Oceanographic Department, 3-1-1, Kasumigaseki, Chiyoda-ku, Tokyo 100-8932, Japan (URL: https://www1.kaiho.mlit.go.jp/kaiikiDB/kaiyo20-2.htm); Sentinel Hub Playground (URL: https://www.sentinel-hub.com/explore/sentinel-playground).
|
|
||||||||||||||||||||||||||
There is data available for 2 confirmed eruptive periods.
2022 Aug 18 - 2023 Jan 26 Confirmed Eruption (Submarine)
| Episode 1 | Eruption (Submarine) | |||||||||||||||||||
|---|---|---|---|---|---|---|---|---|---|---|---|---|---|---|---|---|---|---|---|
| 2022 Aug 18 - 2023 Jan 26 | Evidence from Observations: Reported | ||||||||||||||||||
|
List of 2 Events for Episode 1
|
|||||||||||||||||||
[ 2001 Jul 20 - 2001 Jul 20 ] Uncertain Eruption
| Episode 1 | Eruption (Submarine) | ||||||||||||||
|---|---|---|---|---|---|---|---|---|---|---|---|---|---|---|
| 2001 Jul 20 - 2001 Jul 20 | Evidence from Observations: Reported | |||||||||||||
| Japan Coast Guard reported "Bubbles gushing out from the ocean floor near Tokai Tokuba" on 20 July 2001. | ||||||||||||||
|
List of 1 Events for Episode 1
|
||||||||||||||
[ 1986 Jun 18 - 1986 Jun 18 ] Uncertain Eruption
| Episode 1 | Eruption (Submarine) | |||||||||||||||||||
|---|---|---|---|---|---|---|---|---|---|---|---|---|---|---|---|---|---|---|---|
| 1986 Jun 18 - 1986 Jun 18 | Evidence from Unknown | ||||||||||||||||||
| Water discoloration was reported on 18 June 1986 (Kudo and Hoshizumi, 2006-). | |||||||||||||||||||
|
List of 2 Events for Episode 1
|
|||||||||||||||||||
[ 1984 Dec 23 - 1984 Dec 23 ] Uncertain Eruption
| Episode 1 | Eruption (Submarine) | |||||||||||||||||||
|---|---|---|---|---|---|---|---|---|---|---|---|---|---|---|---|---|---|---|---|
| 1984 Dec 23 - 1984 Dec 23 | Evidence from Unknown | ||||||||||||||||||
| Water discoloration was reported on 23 December 1984 (Kudo and Hoshizumi, 2006-). | |||||||||||||||||||
|
List of 2 Events for Episode 1
|
|||||||||||||||||||
1984 Mar 8 - 1984 Mar 26 (?) Confirmed Eruption (Submarine) VEI: 1
| Episode 1 | Eruption (Submarine) | Higashi-Kaitokuba | ||||||||||||||||||
|---|---|---|---|---|---|---|---|---|---|---|---|---|---|---|---|---|---|---|---|
| 1984 Mar 8 - 1984 Mar 26 (?) | Evidence from Observations: Reported | ||||||||||||||||||
| Following observation of discolored water on 7 March 1984 at the eastern summit of the seamount, submarine eruptions were reported on 8 March. No new island was seen, but vapor plumes and floating pumice ejecta were seen until 26 March. Intermittent water discoloration was reported from 29 March until 9 June (Tsuchide et al., 1985). | |||||||||||||||||||
|
List of 2 Events for Episode 1 at Higashi-Kaitokuba
|
|||||||||||||||||||
[ 1543 ] Uncertain Eruption
| Episode 1 | Eruption (Submarine) | WSW of Kaitoku summit area | |||||||||||||
|---|---|---|---|---|---|---|---|---|---|---|---|---|---|---|
| 1543 - Unknown | Evidence from Observations: Reported | |||||||||||||
| A submarine eruption was reported in 1543 CE at about 26°N, 140°46'E, with no details; Kuno (1962, CAVW) noted that Sapper (1927) mentioned "an eruption at this point." This approximate location is 20 km WSW of the Nishi Tokuba, the SW-most peak of the seamount complex at a depth of about 100 m. | ||||||||||||||
|
List of 1 Events for Episode 1 at WSW of Kaitoku summit area
|
||||||||||||||
This compilation of synonyms and subsidiary features may not be comprehensive. Features are organized into four major categories: Cones, Craters, Domes, and Thermal Features. Synonyms of features appear indented below the primary name. In some cases additional feature type, elevation, or location details are provided.
Synonyms |
||||
| Kaitoku Kaizan | Kaitoku-okanoba | ||||
Cones |
||||
| Feature Name | Feature Type | Elevation | Latitude | Longitude |
| Nishi Tokuba
Nishi-Kaitokuba |
Cone | -126 m | 26° 3' 35.00" N | 140° 56' 35.00" E |
| Tokai Tokuba
Higashi-Kaitokuba |
Cone | -340 m | 26° 6' 57.00" N | 141° 6' 22.00" E |
The Global Volcanism Program has no photographs available for Kaitoku Seamount.
There are no samples for Kaitoku Seamount in the Smithsonian's NMNH Department of Mineral Sciences Rock and Ore collection.
| Copernicus Browser | The Copernicus Browser replaced the Sentinel Hub Playground browser in 2023, to provide access to Earth observation archives from the Copernicus Data Space Ecosystem, the main distribution platform for data from the EU Copernicus missions. |
| MIROVA | Middle InfraRed Observation of Volcanic Activity (MIROVA) is a near real time volcanic hot-spot detection system based on the analysis of MODIS (Moderate Resolution Imaging Spectroradiometer) data. In particular, MIROVA uses the Middle InfraRed Radiation (MIR), measured over target volcanoes, in order to detect, locate and measure the heat radiation sourced from volcanic activity. |
| MODVOLC Thermal Alerts | Using infrared satellite Moderate Resolution Imaging Spectroradiometer (MODIS) data, scientists at the Hawai'i Institute of Geophysics and Planetology, University of Hawai'i, developed an automated system called MODVOLC to map thermal hot-spots in near real time. For each MODIS image, the algorithm automatically scans each 1 km pixel within it to check for high-temperature hot-spots. When one is found the date, time, location, and intensity are recorded. MODIS looks at every square km of the Earth every 48 hours, once during the day and once during the night, and the presence of two MODIS sensors in space allows at least four hot-spot observations every two days. Each day updated global maps are compiled to display the locations of all hot spots detected in the previous 24 hours. There is a drop-down list with volcano names which allow users to 'zoom-in' and examine the distribution of hot-spots at a variety of spatial scales. |
|
WOVOdat
Single Volcano View Temporal Evolution of Unrest Side by Side Volcanoes |
WOVOdat is a database of volcanic unrest; instrumentally and visually recorded changes in seismicity, ground deformation, gas emission, and other parameters from their normal baselines. It is sponsored by the World Organization of Volcano Observatories (WOVO) and presently hosted at the Earth Observatory of Singapore.
GVMID Data on Volcano Monitoring Infrastructure The Global Volcano Monitoring Infrastructure Database GVMID, is aimed at documenting and improving capabilities of volcano monitoring from the ground and space. GVMID should provide a snapshot and baseline view of the techniques and instrumentation that are in place at various volcanoes, which can be use by volcano observatories as reference to setup new monitoring system or improving networks at a specific volcano. These data will allow identification of what monitoring gaps exist, which can be then targeted by remote sensing infrastructure and future instrument deployments. |
| Volcanic Hazard Maps | The IAVCEI Commission on Volcanic Hazards and Risk has a Volcanic Hazard Maps database designed to serve as a resource for hazard mappers (or other interested parties) to explore how common issues in hazard map development have been addressed at different volcanoes, in different countries, for different hazards, and for different intended audiences. In addition to the comprehensive, searchable Volcanic Hazard Maps Database, this website contains information about diversity of volcanic hazard maps, illustrated using examples from the database. This site is for educational purposes related to volcanic hazard maps. Hazard maps found on this website should not be used for emergency purposes. For the most recent, official hazard map for a particular volcano, please seek out the proper institutional authorities on the matter. |
| IRIS seismic stations/networks | Incorporated Research Institutions for Seismology (IRIS) Data Services map showing the location of seismic stations from all available networks (permanent or temporary) within a radius of 0.18° (about 20 km at mid-latitudes) from the given location of Kaitoku Seamount. Users can customize a variety of filters and options in the left panel. Note that if there are no stations are known the map will default to show the entire world with a "No data matched request" error notice. |
| UNAVCO GPS/GNSS stations | Geodetic Data Services map from UNAVCO showing the location of GPS/GNSS stations from all available networks (permanent or temporary) within a radius of 20 km from the given location of Kaitoku Seamount. Users can customize the data search based on station or network names, location, and time window. Requires Adobe Flash Player. |
| DECADE Data | The DECADE portal, still in the developmental stage, serves as an example of the proposed interoperability between The Smithsonian Institution's Global Volcanism Program, the Mapping Gas Emissions (MaGa) Database, and the EarthChem Geochemical Portal. The Deep Earth Carbon Degassing (DECADE) initiative seeks to use new and established technologies to determine accurate global fluxes of volcanic CO2 to the atmosphere, but installing CO2 monitoring networks on 20 of the world's 150 most actively degassing volcanoes. The group uses related laboratory-based studies (direct gas sampling and analysis, melt inclusions) to provide new data for direct degassing of deep earth carbon to the atmosphere. |
| Large Eruptions of Kaitoku Seamount | Information about large Quaternary eruptions (VEI >= 4) is cataloged in the Large Magnitude Explosive Volcanic Eruptions (LaMEVE) database of the Volcano Global Risk Identification and Analysis Project (VOGRIPA). |
| EarthChem | EarthChem develops and maintains databases, software, and services that support the preservation, discovery, access and analysis of geochemical data, and facilitate their integration with the broad array of other available earth science parameters. EarthChem is operated by a joint team of disciplinary scientists, data scientists, data managers and information technology developers who are part of the NSF-funded data facility Integrated Earth Data Applications (IEDA). IEDA is a collaborative effort of EarthChem and the Marine Geoscience Data System (MGDS). |

