
Satellite images from 26 and 31 March showed areas of discolored water in the vicinity of Ioto (Iwo-jima). The discolored water expanded along the coastline to the NNE and WSW, and on 31 March the area of discolored water was about 600 m in diameter.
Source: Copernicus
Submarine eruption with discolored water, pumice, and gas emissions during July-December 2022
Ioto (Iwo-jima), located about 1,200 km S of Tokyo, lies within a 9-km-wide submarine caldera along the Izu-Bonin-Mariana volcanic arc. Previous eruptions date back to 1889 and have consisted of dominantly phreatic explosions, pumice deposits during 2001, and discolored water (figure 7). An eruption during February-May 2012 included small phreatic eruptions, mud ejections, tremor events, discolored water, and some gas-and-steam and ash emissions (BGVN 37:07). This report updates information since May 2012, covering multiple small events on the island and offshore, through the July-December 2022 submarine eruption that included pumice, black ejecta, and discolored water. Information primarily comes from the Japan Meteorological Association (JMA), the Japan Coast Guard (JCG), and satellite data.
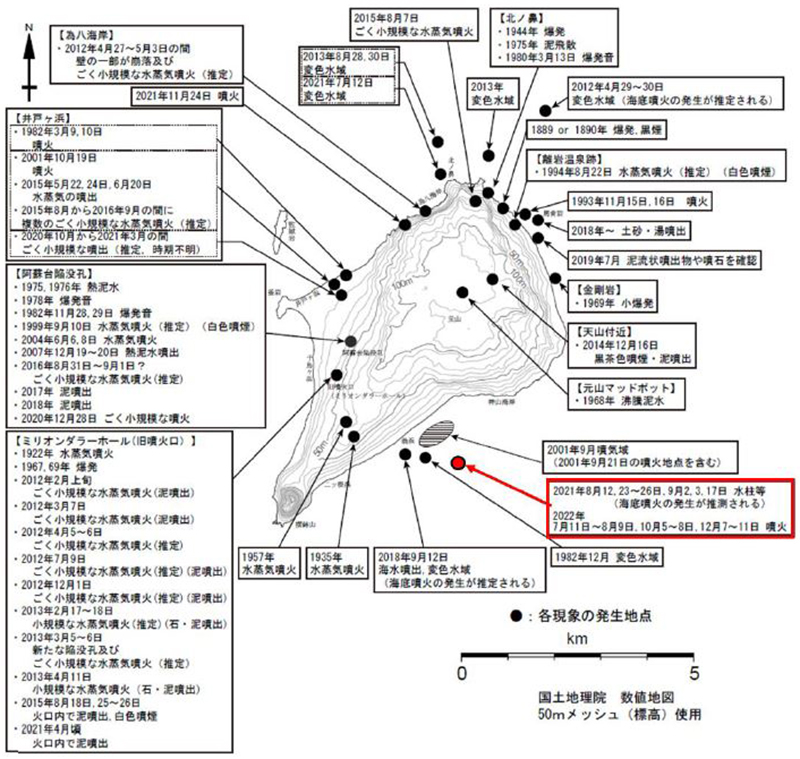 |
Figure 7. Map of Ioto showing the locations of recorded eruptions from 1889 through December 2022. The most recent eruption in 2022 is highlighted in red just off the SE coast of the island and E of the 2001 eruption site. From Ukawa et al. (2002), modified by JMA. |
Activity during June-December 2012. Activity was relatively quiet after May 2012, with occasional white fumaroles seen by the Japan Coast Guard (JCG). Intermittent volcanic earthquakes and tremors also occurred. On 9 July 2012 the Japan Maritime Self Defense Force (JMSDF) reported that a white volcanic plume rose 15 m high around 1215 on the W side of the island. At 1330 mud was ejected tens of meters high; JMA noted that this activity occurred due to a small phreatic explosion, and no associated earthquakes, shock waves, or volcanic tremors were recorded.
On 1 December 2012 JMSDF reported that there were traces of mud ejections in the same location as the July 2012 activity on the W side of the island, with deposits scattered about 10 m from the vent. JMA compared this event to activity during February-April 2012 and reported that it was also possibly a small phreatic explosion.
Activity during 2013. Reports from JMSDF noted that on 18 February 2013 mud had erupted around the former crater known as “Million Dollar Hole” (a depression along the Asodai fault) and included rocks with diameters up to 40 cm. The deposits were mainly scattered about 150 m W. JMSDF identified this event as a small phreatic explosion, similar but larger than those that occurred in 2012.
On 6 March an overflight by JMA allowed observations of a new depression in the Million Dollar Hole that measured about 15 m in diameter. Though no new deposits were visible around the depression, and the exact date and time of the event were unknown, larger volcanic earthquakes from 1800 on 5 March to 0600 on 6 March indicated a small phreatic explosion.
A black plume was visible rising about 400 m above Million Dollar Hole on the W side of the island at 1600 on 11 April, according to a report from JMSDF (figure 8). Volcanic material was also deposited, and volcanic tremor lasted about eight minutes and 50 seconds starting around 1559. These events indicated that a small phreatic explosion had occurred.
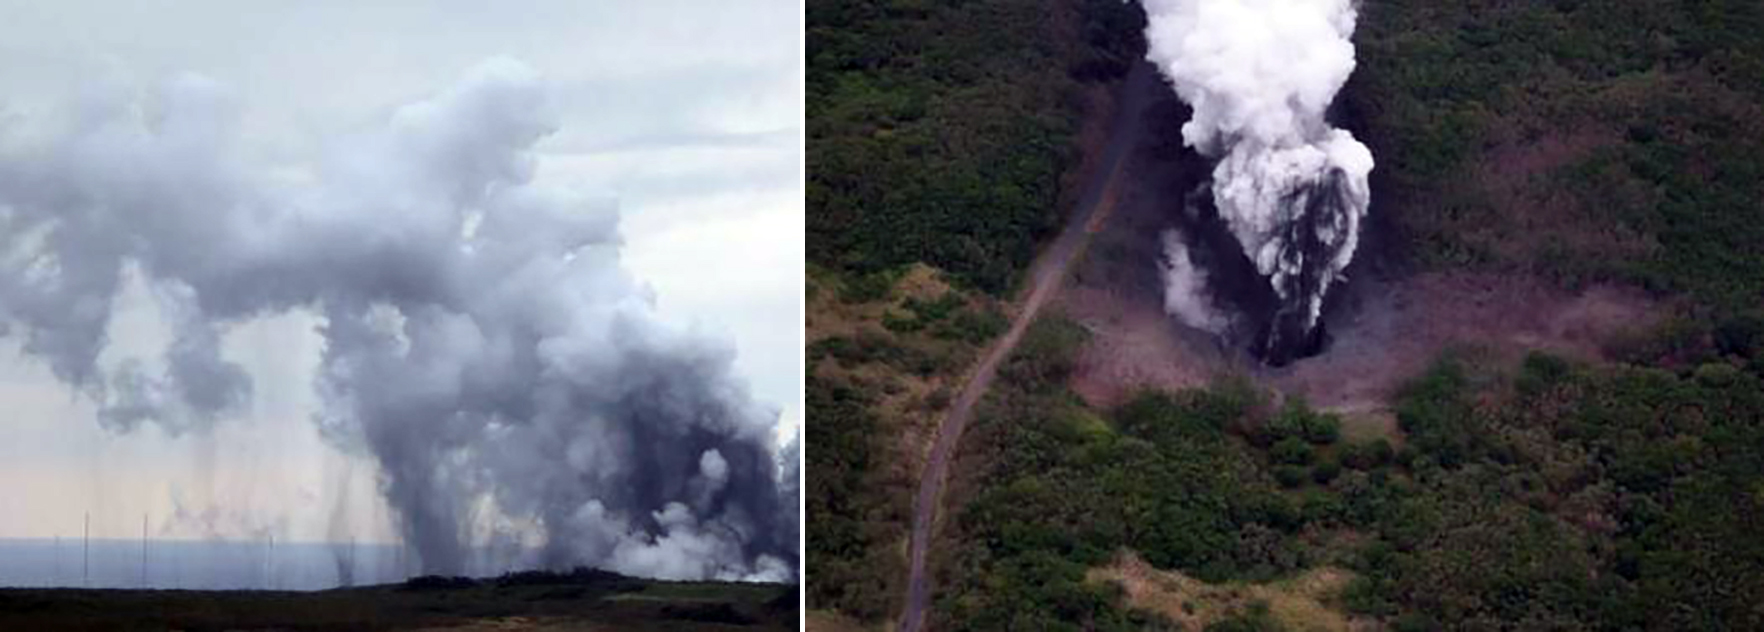 |
Figure 8. Photos of an eruption plume rising 400 m above Million Dollar Hole on the W side of Ioto on 11 April 2013. Around 1600 a small phreatic explosion occurred. Courtesy of JMSDF via JMA. |
Off the NE coast of the island near Kitanohana, aerial observations showed white discolored water on 21 August 2013. Further NW from this point, about 150 m off the coast and 300 m N of Kitanohana, on 28 and 30 August more discolored water was confirmed (figure 9).
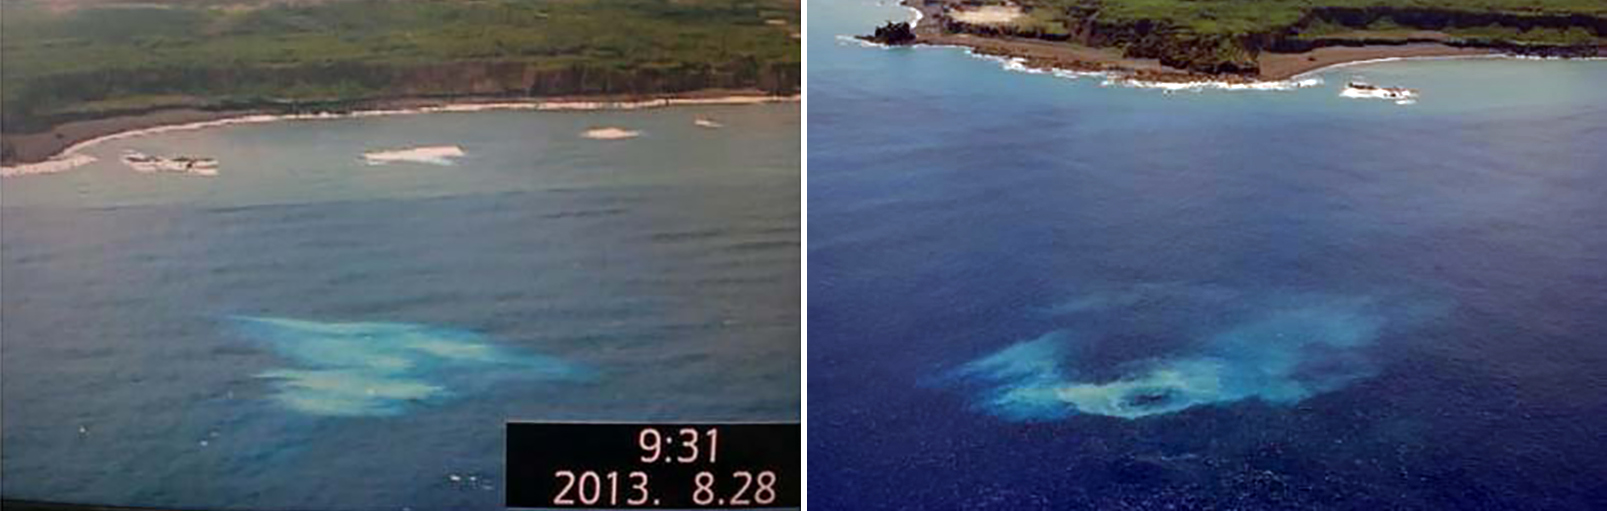 |
Figure 9. Photos of blue-yellow discolored water off the NE coast of Ioto near Kitanohana on 28 (left) and 30 (right) August 2013. Photo on the right has been color corrected. Courtesy of JMSDF via JMA. |
Activity during 2014-2019. Activity was relatively low during 2014-2019 with occasional seismicity, fumarolic activity, and small eruptions. On 22 May, 24 May, and 20 June 2015 gas-and-steam emissions rose 100-200 m high near the Idogahama Beach on the NW side of the island. Some fumarolic activity was also recorded up to 10 m at the Asodai Sinkhole. A small eruption was recorded near Kitanohana Beach on the N part of the island on 7 August 2015. Mud and rocks were scattered within about 27 m around the eruption vent.
Eruptive activity was reported by JMA during 31 August to 1 September 2016; the National Research Institute for Earth Science and Disaster Prevention confirmed that new volcanic blocks had been ejected about 50 m from the Asodai Sinkhole, accompanied by fumarolic activity. Intermittent fumarolic activity continued through December 2017.
JMA reported that during 8-14 September 2018 the number of volcanic earthquakes increased, and for the first time since April 2012 the daily number of earthquakes exceeded 600. The number of earthquakes decreased slightly after 8 September but remained high through the 14th. During a JMSDF overflight on 12 September 2018 seawater jetting was observed 5-10 m above the ocean surface on the S coast, which JMSDF suggested may have been a submarine eruption. In addition, discolored water was also visible.
Activity during 2020-June 2022. During 2020-2021, activity remained relatively low. An aerial observation conducted by JCG on 4 February 2020 reported that there was discolored water off the W (Chidorigahama) and SE (Okinahama) coasts of the island (figure 10). A small eruption occurred at the Asodai Sinkhole at 1948 on 28 December 2020, which generated a plume that rose 400 m high (figure 11). Volcanic tremors were detected around this time as well. A field survey conducted by JMSDF that night and the morning of 29 December identified volcanic blocks with diameters of 20 cm that had been ejected 50-100 m from the sinkhole; mud deposits were also noted.
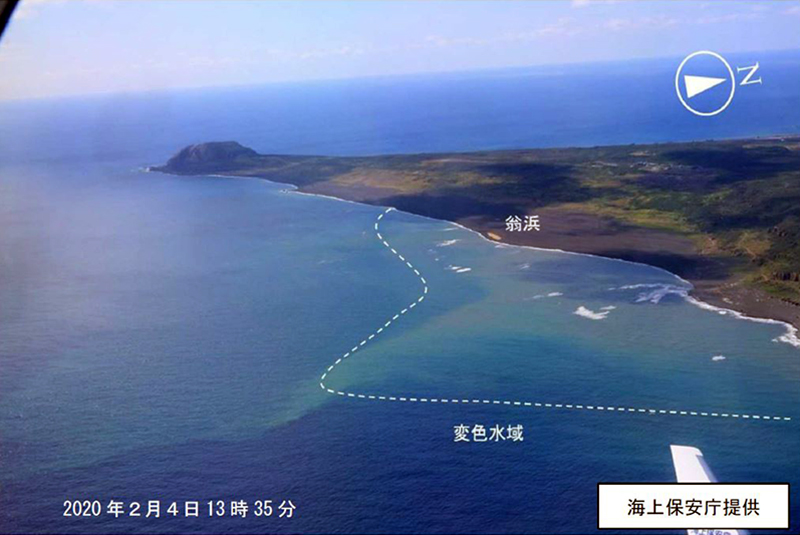 |
Figure 10. Photo of yellow discolored water off the SE coast of Ioto on 4 February 2020. Photo has been color corrected. Courtesy of JCG via JMA. |
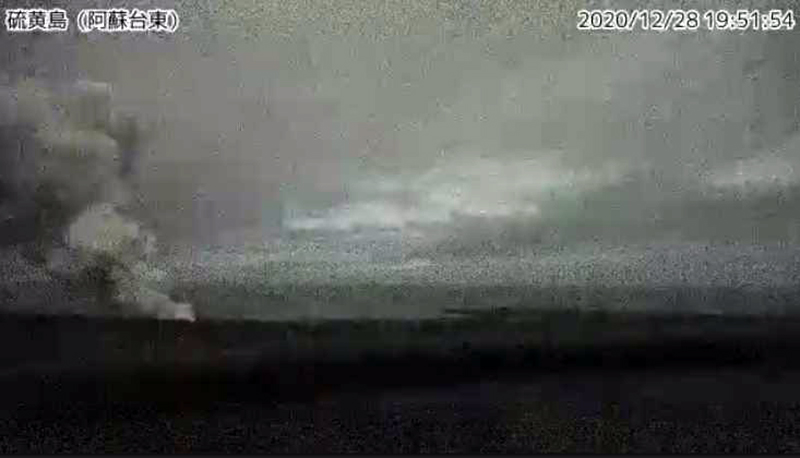 |
Figure 11. Webcam image showing an eruption plume rising 400 m above the Asodai Sinkhole on the NW side of Ioto at 1951 on 28 December 2020. Courtesy of JMA. |
A surveillance camera, located approximately 900 m ENE of the Asodai Sinkhole on the W side of the island, showed a fumarolic plume rising less than 200 m high on 6 January 2021. Then, on 1 February 2021 a gray eruption plume was detected rising 20 m high at 0905. Mud eruptions around this time were also confirmed at the Asodai Sinkhole. During March 2021 yellowish discolored water was observed near the SE coast. Based on information from JMSDF, a helicopter overflight on 5 April reported that there were dried traces of mud eruptions in the Million Dollar Hole. JMA suggested that several days had passed since the mud eruption occurred. Discolored water was observed during an overflight on 12 July 2021 off the northern NW (Tamehachi) coast.
Off the SE coast (Okinahama), columns of water were reported by JMSDF to be rising from several to tens of meters high during 12 August, 23-26 August, 2-3 September, and 17 September 2021. The JCG reported bluish-white discolored water, gray particles, and bubbles seen during an overflight on 26 August and 12 September off the SE coast (figure 12). On 24 November JMSDF reported that a white volcanic plume rose 60 m high around 0540 from the NW side of the island; occasional gray ejecta rose 20-30 m high that same day NE from the site of the white plume. This activity was accompanied by an increase in volcanic earthquakes and tremor during 23-26 November.
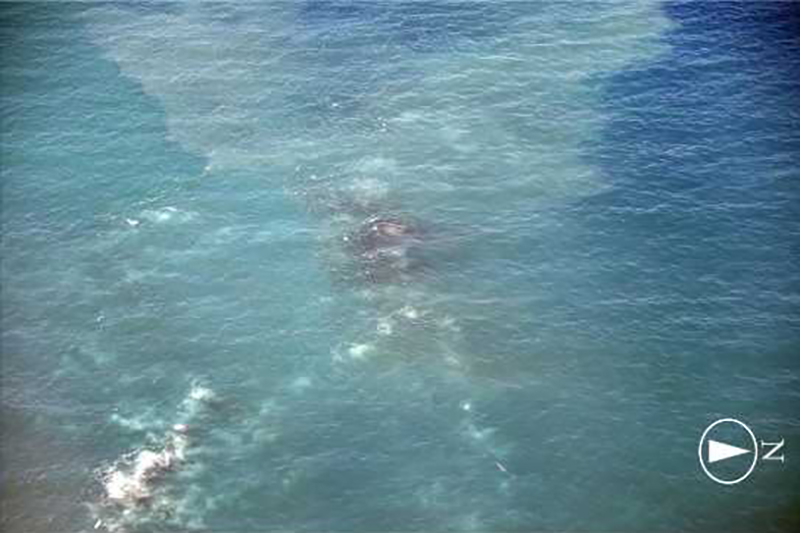 |
Figure 12. Photo of gray particles and discolored water observed off the SE (Okinahama) coast of Ioto on 26 August 2021. Courtesy of JMA. |
Activity during July-August 2022. JMA reported that minor eruptive activity, such as fumaroles, ejecta, and discolored plumes were observed off the SE coast of Ioto each day during 11-31 July 2022. JCG observed brown discolored water beginning on 11 July off the SE coast (figure 13). A column of water containing black ejecta rose meters to tens of meters at intervals of several minutes. On 14 July pumice clasts from the eruption washed onto shore at Okinahama and were photographed by the National Research Institute for Earth Science and Disaster Prevention during a field survey (figure 14). Aerial observations conducted by JCG on 15 July revealed bubbles near the eruptive vent. Additionally, a Sentinel-2 satellite image showed that on 15 July a dark spot off the SE coast near the 2001 vent location was the source of a green-yellow plume of discolored water that drifted NE (figure 15).
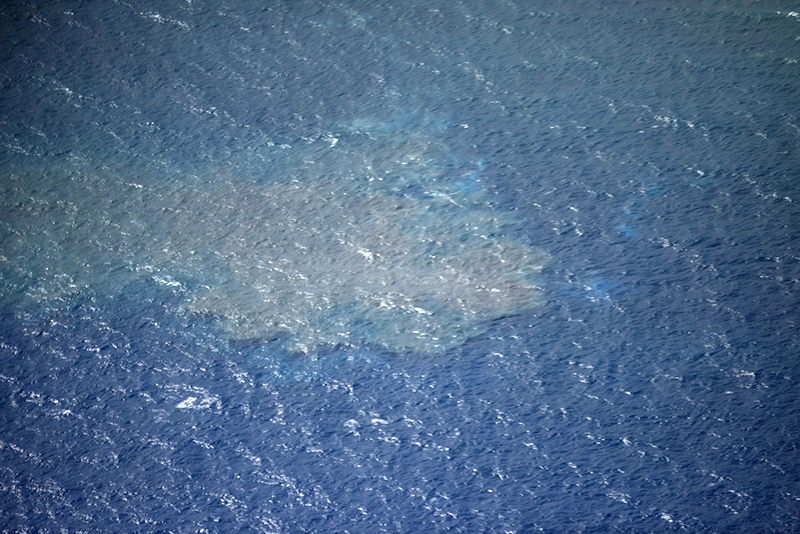 |
Figure 13. Photo showing brown discolored water first appearing off the SE (Okinahama) coast of Ioto on 11 July 2022. Photo has been color corrected. The scale of the affected area was not recorded. Courtesy of Japan Coast Guard. |
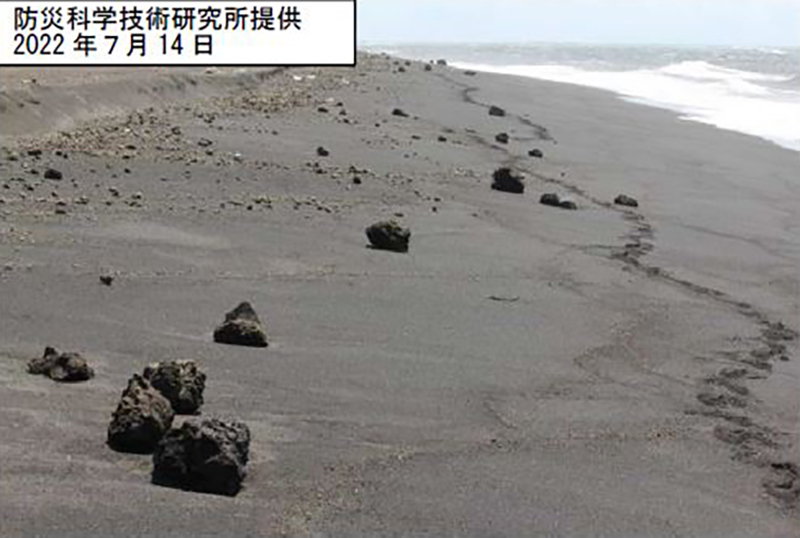 |
Figure 14. Photo of rocks on Okinahama (SE coast beach) thought to have originated from a submarine eruption of Ioto. Photo was taken on 14 July 2022 by the National Research Institute for Earth Science and Disaster Resilience. Courtesy of JMA. |
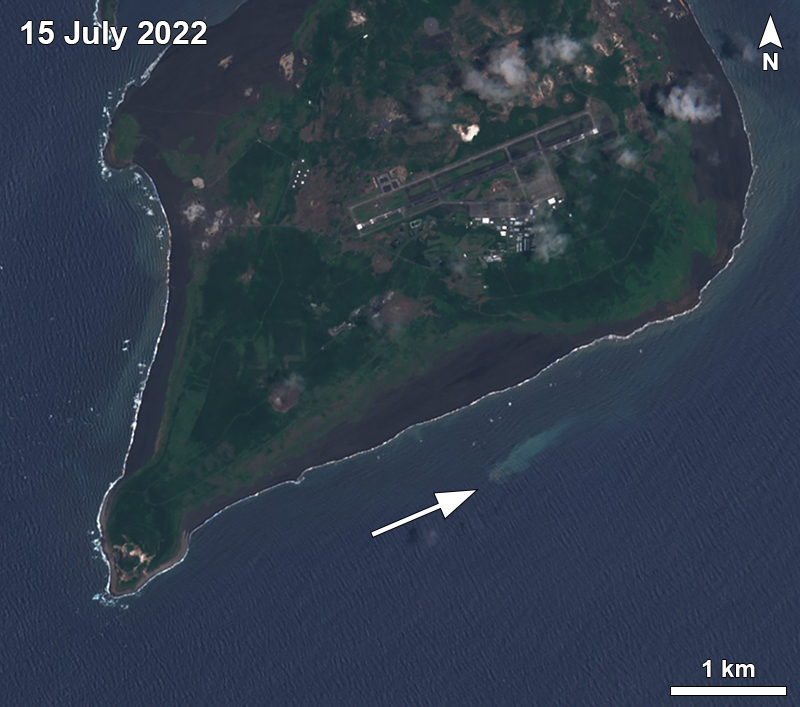 |
Figure 15. Sentinel-2 satellite image showing a dark spot of water off the SE coast of Ioto with a discolored plume drifting NE on 15 July 2022. The location of this activity was near the 2001 vent. Image with “Natural color” rendering (bands 4, 3, 2). Courtesy of Sentinel Hub Playground. |
Video taken around 25 July showed a white plume rising from the same location. Satellite images during 30-31 July showed small, rounded gray zones on the surface of the water (figure 16). JMA scientists visited the site on 31 July and confirmed pumice deposits on the beach (figure 17) and noted offshore eruptive activity every few minutes consisting of gray, tephra-laden columns of water rising 20-30 m above the ocean surface (figure 18). On 1 August a photo showed white gas-and-steam emissions rising above the submarine vent, accompanied by floating pumice deposits (figure 19). Another small, rounded gray zone in the water was also captured in a 4 August satellite image (figure 16); an associated discolored plume of water was visible drifting NE. Activity remained relatively low after 9 August, according to JMA, though disturbed water and a green-blue discolored plume in the same area was seen by the JCG on 23 August (figure 20).
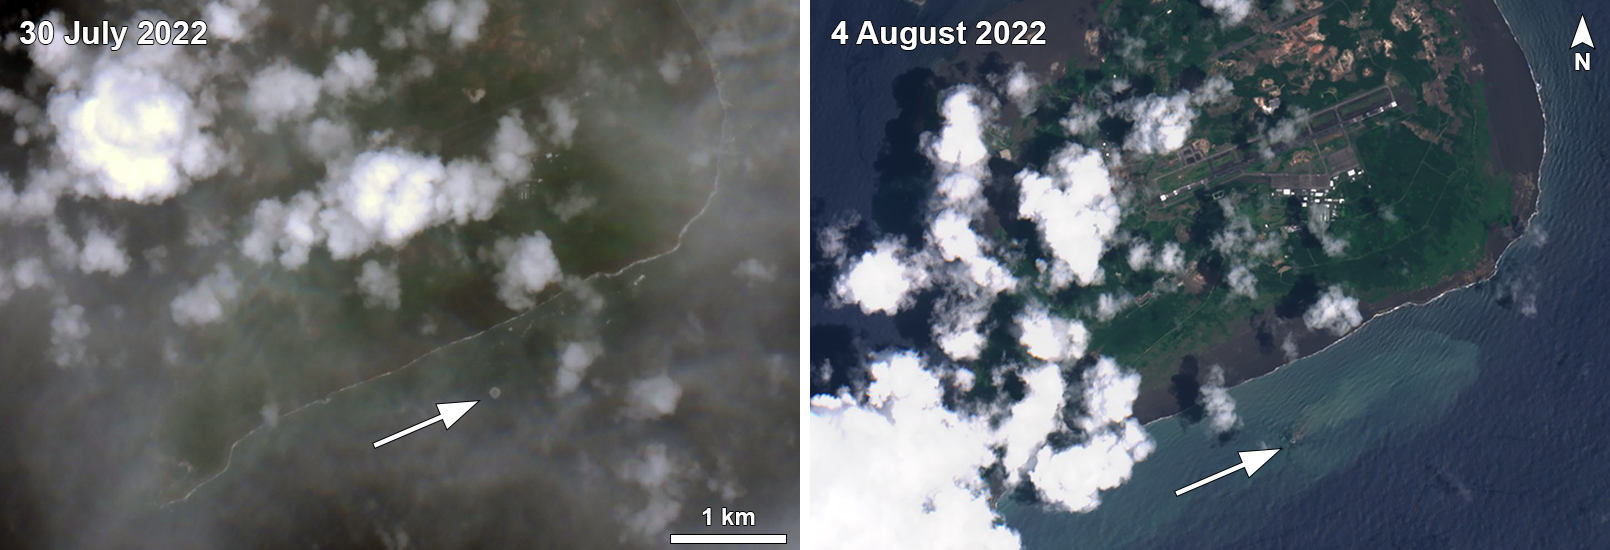 |
Figure 16. Sentinel-2 satellite image showing a small, rounded, gray zone at the surface of the water off the SE coast of Ioto on 30 July 2022 (left) and 4 August 2022 (right). A yellow-green discolored plume was visible on 4 August drifting NE. Image with “Natural color” rendering (bands 4, 3, 2). Image on the left has been color corrected due to cloud cover. Courtesy of Sentinel Hub Playground. |
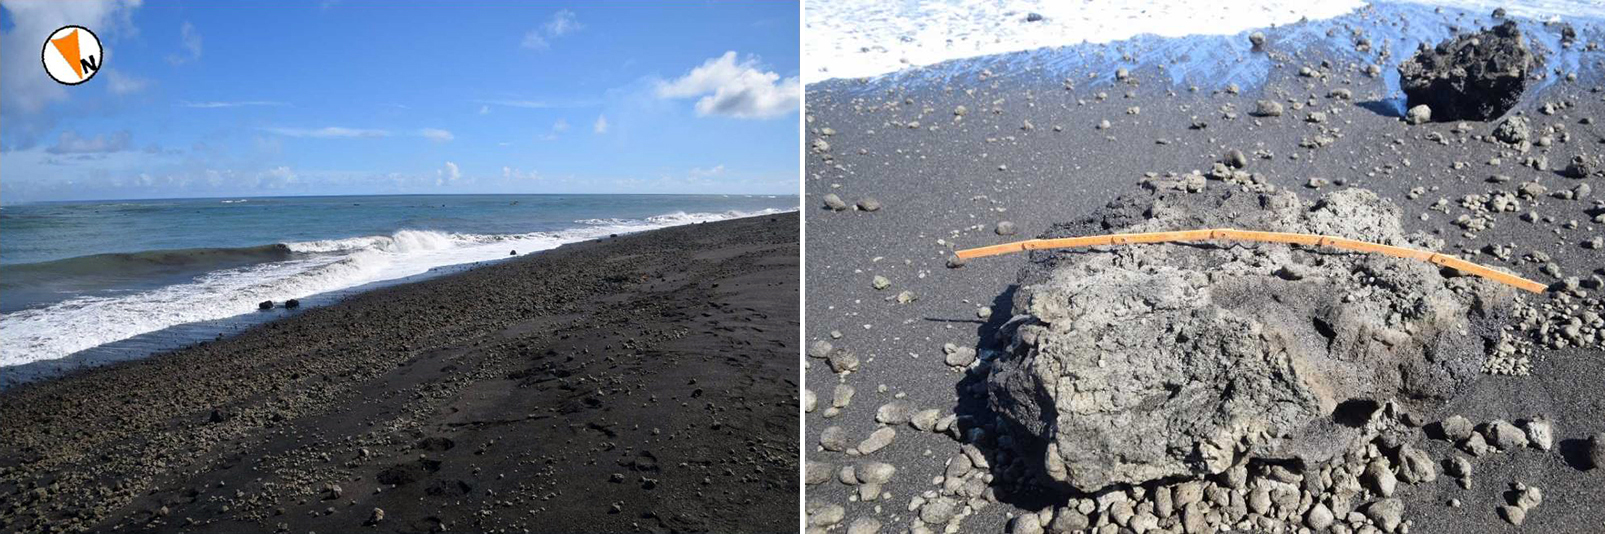 |
Figure 17. Photos showing pumice deposited on Okinahama (SE coast beach) from the Ioto submarine eruption on 31 July 2022. The size of the clast shown here on the right is 90 cm in length. Courtesy of JMA. |
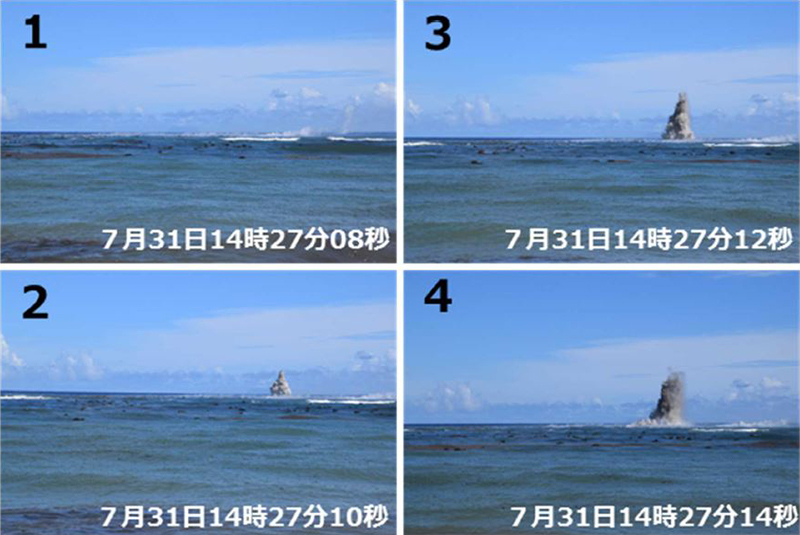 |
Figure 18. Photos showing the submarine eruption at Ioto taken from the SE coast of the island around 1427 on 31 July 2022. The dark water column was ejected 20-30 m high. Courtesy of JMA. |
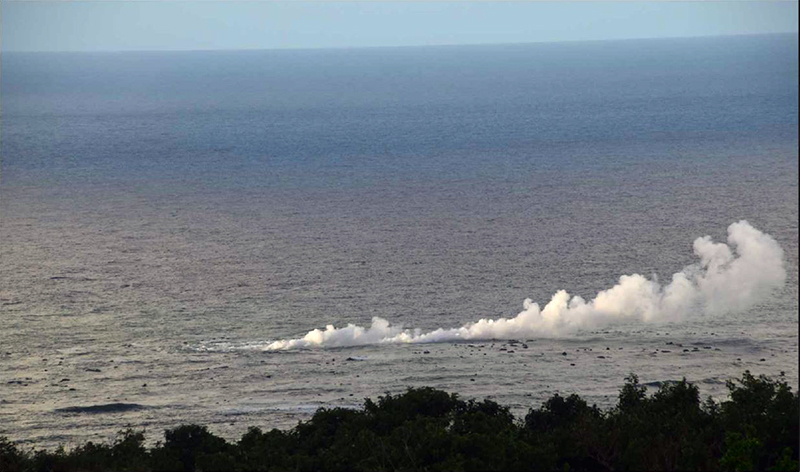 |
Figure 19. Photo of white gas-and-steam emissions on 1 August 2022 rising above the submarine eruptive vent off the SE coast of Ioto, accompanied by floating pumice deposits. Photo has been color corrected. Courtesy of JMA. |
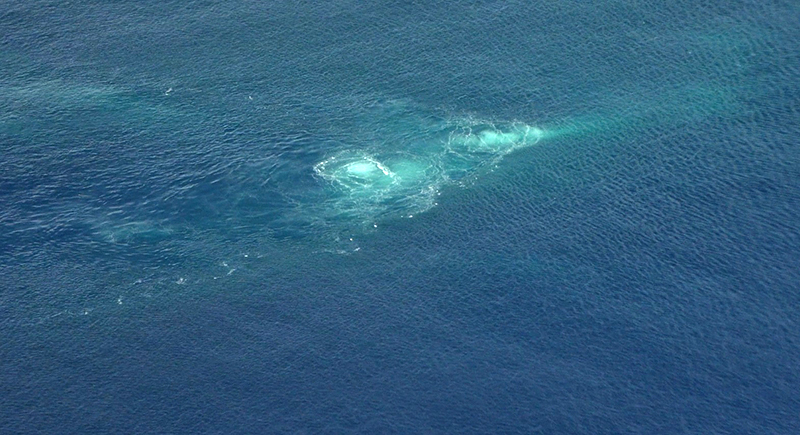 |
Figure 20. Photo of a blue-green discolored water plume off the SE (Okinahama) coast of Ioto on 23 August 2022. Photo has been color corrected. The scale of the affected area was not recorded. Courtesy of Japan Coast Guard. |
Activity during September-December 2022. JMSDF reported that discolored water on the evening of 4 October was visible off the SE coast, in the same location as the activity during July-August, which was followed by an eruption during 5-8 October. A column of water containing black ejecta rose meters to several tens of meters above the ocean surface at several minute intervals. An overflight on 12 October confirmed a discolored water plume off the SE coast (figure 21) that drifted NE from the same source as the July-August activity.
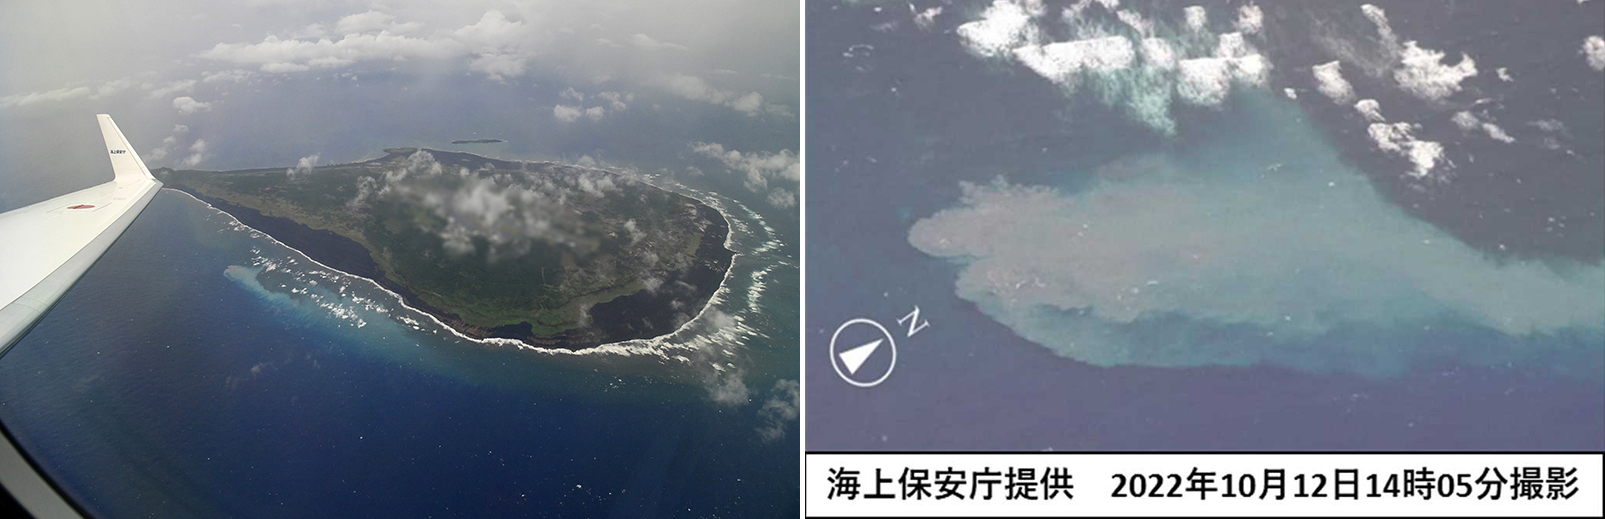 |
Figure 21. Photos of a strong discolored water plume off the coast of Ioto near Okinahama taken on 12 October 2022. Photo on the left has been color corrected. Courtesy of JCG (left) and JMA (right). |
According to JMSDF an eruption during 7-11 December 2022 included black ejecta rising to tens of meters above the ocean surface in about ten-minute intervals. On 9 December pumice clasts may have been spotted floating on the water. Discolored water was visible on 13 December near the same eruptive vent active during July-August and October.
References. Ukawa, M., Fujita, E., Kobayashi, T., 2002, Recent volcanic activity of Iwo Jima and the 2001 eruption, Monthly Chikyu, Extra No. 39, 157-164.
Information Contacts: Japan Meteorological Agency (JMA), 1-3-4 Otemachi, Chiyoda-ku, Tokyo 100-8122, Japan (URL: http://www.jma.go.jp/jma/indexe.html); Japan Coast Guard (JCG) Volcano Database, Hydrographic and Oceanographic Department, 3-1-1, Kasumigaseki, Chiyoda-ku, Tokyo 100-8932, Japan (URL: https://www1.kaiho.mlit.go.jp/GIJUTSUKOKUSAI/kaiikiDB/kaiyo22-2.htm); Sentinel Hub Playground (URL: https://www.sentinel-hub.com/explore/sentinel-playground).
2024: March
2023: October
| November
| December
2022: July
| August
2018: September
2012: April
2010: June
2001: September
| October
Satellite images from 26 and 31 March showed areas of discolored water in the vicinity of Ioto (Iwo-jima). The discolored water expanded along the coastline to the NNE and WSW, and on 31 March the area of discolored water was about 600 m in diameter.
Source: Copernicus
The Japan Coast Guard conducted an overflight of Ioto (Iwo-jima) on 13 February and observed no eruptive activity. A remnant part of the island remained that was about 25 m wide and 10 m high and in the shape of an arch. White fumarolic activity occurred at the S end of the island and hot water over the main vent area was observed. Eruptive activity in an area adjacent to the island was observed during an overflight on 16 March. A video posted with the report showed a roughly circular area of disturbed whitish water with several steaming rocks located around the margins. The report urged nearby ships to use caution in the area.
Source: Japan Coast Guard
The Japan Coast Guard conducted an overflight on 14 December of Ioto (Iwo-jima) to inspect the new island formed by an eruption from a submarine vent about 1 km off the SE coast at Okinahama. No eruptive activity was detected, but the shape of the island had notably changed due to erosion and wave action. During the previous 10 days deposits at the N part of the “J” shaped island had separated and migrated N, connecting to the Okinahama coast, and the curved part of the “J” had eroded into two smaller islands.
Sources: Japan Coast Guard; Copernicus Browser
According to a news article the eruption at Ioto (Iwo-jima), from a submarine vent about 1 km off the SE coast at Okinahama, continued on 4 December. During an overflight of the volcano passengers observed explosions that produced 100-m-high black plumes every few minutes. Ejected material combined with wave erosion transformed the shape of the island into a “J” shape, 500 m long and with the curved part about 200 m offshore of the main island. The island was covered with brown ash and blocks, and the surrounding water was green to brown in color and there were areas of floating pumice.
Source: NHK (Japan Broadcasting Corporation)
The Japan Coast Guard made observations during an overflight of Ioto (Iwo-jima) on 23 November. They posted video, photos, and infrared photos that showed explosions at the main vent producing dark, dense ash-and-steam plumes and ejecting large blocks that landed on the island and in the ocean.
Source: Japan Coast Guard
According to a news article the eruption at Ioto (Iwo-jima), from a submarine vent about 1 km off the SE coast at Okinahama, continued 17 November. During an overflight of the volcano passengers observed explosions that ejected material and white steam plumes above the vent every few minutes.
Source: Daily Yomiuri News
The eruption at Ioto (Iwo-jima), at a vent located about 1 km off the SE coast of Okinahama, continued during 1-3 November. A 2 November Sentinel satellite images showed a thermal anomaly at the SE end of the island which was elongated to the NNW-SSE. A white plume drifted about 400 m WSW. During an overflight on 3 November observers photographed the island and noted that a 169-m-high cone had formed at the SSE end according to news sources. Explosions occurred about every one minute that ejected dark material and incandescent material about 800 m above the vent. Floating, brown-colored pumice was present in the water around the island.
Sources: Asahi; Asahi; Sentinel Hub
According to a news source, an eruption at Ioto (Iwo-jima) occurred at a vent located about 1 km off the coast of Okinahama, on the SE side the island. During an overflight on 30 October observers recorded explosions every few minutes that ejected dark material about 20 m above the ocean. Ejecta from the vent built a black-colored island and floating pumice was present around the island.
Source: The Mainichi Daily News
JMA reported that minor eruptive activity off the coast at Ioto (Iwo-jima) had been visible daily during 11-31 July. On 14 July pumice pieces from the eruption washed up onto the shore at Onohama and were photographed during a field survey conducted by the National Research Institute for Earth Science and Disaster Prevention. JMA scientist visited the site on 31 July and confirmed the pumice deposits on the beach. They saw eruptive activity every few minutes, and gray, tephra-laden columns of water being ejected 20-30 m above the ocean’s surface. A satellite image on 4 August showed a small rounded gray zone at the water surface and a plume of discolored water drifting NE.
Sources: Japan Meteorological Agency (JMA); Sentinel Hub
Satellite images of Ioto (Iwo-jima) acquired on 15 July showed a darker area in the water along the SE coast, possibly above or near the 2001 vent, and a plume of discolored water drifting NE. Video taken on or around 25 July showed a white plume rising from the same area. Satellite images during 30-31 July showed small rounded gray zones at the water surface.
Sources: Sentinel Hub; Planet Labs
During an overflight of Ioto (Iwo-jima) on 12 September the Japan Maritime Self Defense Force observed seawater jetting 5-10 m above the sea surface on the S coast, suggestive of a submarine eruption.
Source: Japan Meteorological Agency (JMA)
According to a JMA report on 2 May, an eruption at Ioto (Iwo-jima) caused water discoloration to the NE. A new fumarole was also confirmed.
Source: Japan Meteorological Agency (JMA)
Based on a pilot observation, the Tokyo VAAC reported that an ash plume from Ioto (Iwo-jima) drifted more than 35 km N.
Source: Tokyo Volcanic Ash Advisory Center (VAAC)
On the morning of 19 October a small phreatic eruption was observed at Idogahama, a beach on the NW coast of Iwo-jima. The Japan Maritime Self Defense Force observed a grayish white-colored plume rising to 200-300 m above the beach surface for 2-3 minutes starting at about 0725. A similar plume was observed for 10 minutes starting at 0806. Observations during 1602-1715 revealed the crater that formed during the eruption was 10 m long and 2-15 m deep. Water inside the crater was dark colored, contained debris, and gushed approximately every 10 minutes. In addition, a steam plume rose up to 600 m above the surface.
Sources: Volcano Research Center-Earthquake Research Institute (University of Tokyo); Japan Meteorological Agency (JMA)
No volcanic activity was observed at Iwo-jima after 22 September, but discolored seawater was occasionally visible along the SE coast until at least 10 October. The area of discolored water was smaller than when the submarine eruption began on 21 September. During 20 to about 28 September many earthquakes and tremor were detected. Floating pumice collected along Iwo-jima's coast after the eruption is being analyzed to determine if the eruption was magmatic or hydrothermal.
Sources: National Research Institute for Earth Science and Disaster Prevention; Japan Meteorological Agency (JMA)
At 1015 on 21 September a submarine eruption began off of the SE coast of Iwo-jima, an island inhabited by U.S. and Japanese military personnel approximately 1,300 km S of Tokyo. The eruption was preceded by isolated and continuous tremor beginning on the evening of 20 September. Visible evidence of the eruption consisted of seawater gushing several meters above sea level near the island's coast and an area of discolored seawater extending 300-400 m in length. During 1000-1100 approximately 30 earthquakes occurred in the active area; the typical rate is one or two earthquakes per hour. The climax of the eruption occurred during 1200-1500. At about 1300 water gushed several ten's of meters above sea level and steam rose to 100-300 m above the sea. JMA personnel observed seawater rising intermittently during 1515-1715 at two points 50 m apart and 150-200 m from the island's SE coast. The temperatures at these points were 33-34 ºC and 50 ºC, while the surrounding water was at 27 ºC. By 1500 ten earthquakes were recorded per hour. During 1600-1700 three eruption sites were visible; at one a pyroclastic cone was slightly above the sea surface. JMA reported that by the next day volcanic and seismic activity returned to usual levels, with zero to four earthquakes occurring per hour and no tremor events.
Sources: Volcano Research Center-Earthquake Research Institute (University of Tokyo); Reuters; Japan Meteorological Agency (JMA)
Reports are organized chronologically and indexed below by Month/Year (Publication Volume:Number), and include a one-line summary. Click on the index link or scroll down to read the reports.
Possible submarine eruption 26 km NW of the island in January 1974
[A table of possible submarine eruptions based on aerial observations of water discoloration by the Japanese Maritime Safety Agency included an entry for 24.88°N, 141.17°E, in January 1974. This location is ~26 km NW of Iwo-jima.]
Information Contacts: AFP; U.S. Defense Mapping Agency.
Small phreatic explosions on NW flank
Five small phreatic explosions without detonations or recorded seismic events were reported by the Japanese National Research Center for Disaster Prevention. They occurred 9-10 March on the NW shore of the island, producing a new crater N of Asodai Crater (which erupted in 1967, 1969, 1976 and 1978) and "Million Dollar Hole." The three craters lie on the Asodai fault. The ejecta were no larger than 25 cm in diameter and were scattered within 300 m of the new crater. No juvenile material was found, only fragmented older rock.
Information Contacts: JMA.
Earthquake swarm, two weak steam explosions
The National Research Center for Disaster Prevention reported that two weak steam explosions from Asodai Crater 28-29 November 1982 were associated with an earthquake swarm 25-30 November. Among the 1,492 recorded seismic events were 13 felt shocks. Before the swarm, the maximum number of recorded seismic events for a 5-day period had been 104. The earthquakes cracked roads in some places.
Information Contacts: JMA.
In September, a submarine eruption; in October, a phreatic eruption pierces beach
A submarine eruption at Iwo-jima, off of the island's SE coast, on 21 September was the first reported volcanic activity since November 1982 when an earthquake swarm and weak steam explosions occurred at Asodai Crater (SEAN 08:04). Approximately 1 month after the submarine eruption on the SE side of the island, a small phreatic eruption occurred at Idogahama, a beach on the NW coast of the island.
At 1015 on 21 September a submarine eruption began off of the SE coast of Iwo-jima, an island inhabited by U.S. and Japanese military personnel approximately 1,250 km S of Tokyo. The Japan Maritime Self Defense Force stationed on Iwo-jima observed the eruption, which was preceded by isolated and continuous tremor beginning on 20 September at 2000. Visible evidence of the eruption consisted of seawater gushing several meters above sea level near the island's SE coast. In addition, the eruption was accompanied by an area of discolored seawater extending 300-400 m in length. During 1000-1100 approximately 30 earthquakes occurred in the active area; the typical rate is one or two earthquakes per hour.
The climax of the eruption occurred during 1300-1500. At about 1300 water gushed ~40 m above sea level and accompanying steam rose to 100-300 m. During 1515-1715, Japan Meteorological Agency (JMA) personnel observed seawater rising intermittently in two small dark-gray colored areas 50 m apart and 150-200 m from the island's SE coast (Okinahama beach). The two areas were surrounded by zones of bubbling, white-colored water. The water outside the bubbling zone was emerald green in color. A plume of water rose every few to ten minutes in the western-most area. Measurements with an infrared thermometer revealed that the temperatures in these two areas were 33-34°C and 50°C, while the surrounding water was at 27°C. An approximately 8-km-long and 500-m-wide area of discolored water stretched away from the two areas. By 1500 the number of earthquakes decreased from 30 per hour to about ten. During 1600-1700 three eruption sites were visible; at one a pyroclastic cone was slightly above the sea surface (figures 1 and 2).
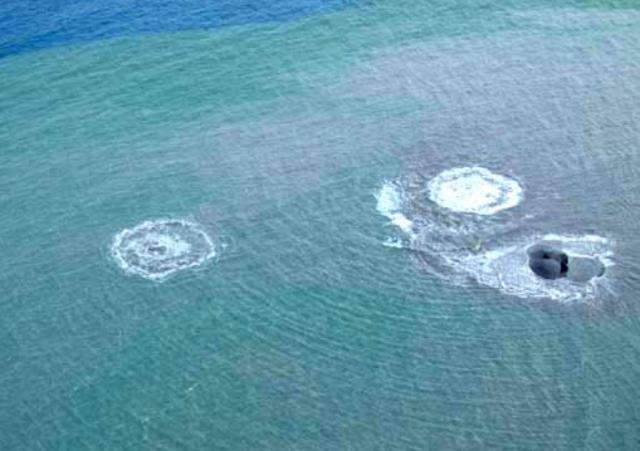 |
Figure 1. Photograph showing three activity sites off the SE coast of Iwo-jima on 21 September 2001 during 1600-1700. Water depth in this area is less than 10 m. A pyroclastic cone that rose above the sea surface is visible at the site furthest to the right; at sea level the diameter of the cone was ~10 m. The coast (Okinahama beach) is approximately 150-200 m to the W (right on the photo). Photo courtesy of Mr. Odai, JMA. |
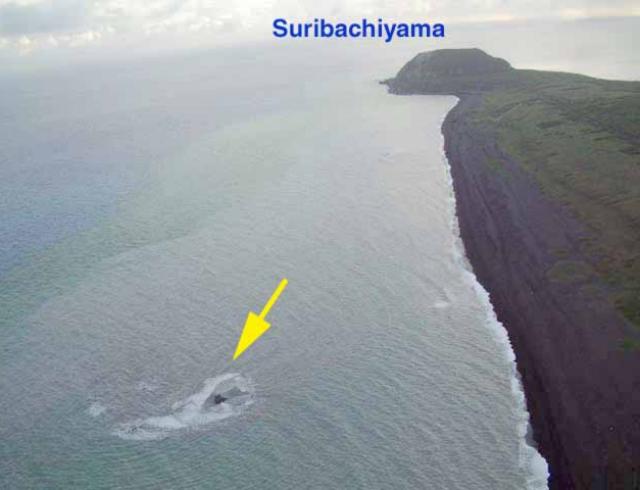 |
Figure 2. Submarine eruption off the SE coast of Iwo-jima on 21 September 2001 during 1600-1700. The arrow indicates the location of the bubbling water shown in figure 1. The photo was taken facing towards the SW coast of the island. Okinahama beach is visible to the right. Photo courtesy of Mr. Odai, JMA. |
JMA reported that the day after the eruption, 22 September, volcanic and seismic activity returned to usual levels, with no water plumes observed and 0-4 earthquakes per hour. In addition, the isolated and continuous tremor events that were recorded during the night of 20 September to the morning of 22 September temporarily ceased. After 21 September areas of discolored water were still visible (figure 3). Until about 28 September many earthquakes and tremor were detected. Results are pending from the analysis of floating pumice that was collected along Iwo-jima's coast after the eruption. Until at least 10 October areas of discolored water were occasionally seen; these were smaller than when the submarine eruption began on 21 September.
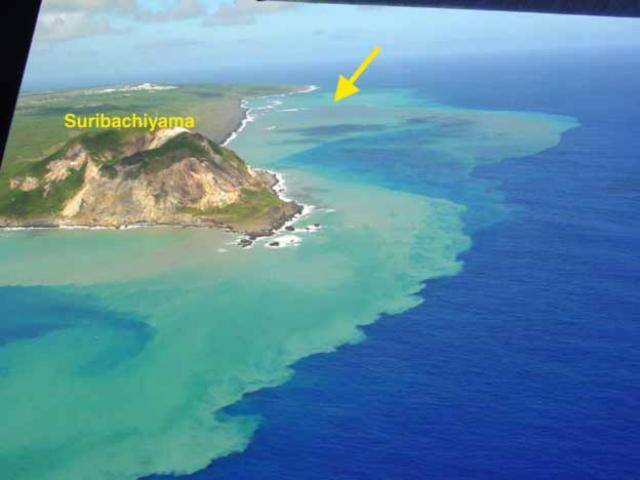 |
Figure 3. View of the SE side of Iwo-jima on 22 September during 1300-1400, about 27 hours after the start of a submarine eruption. The arrow indicates the location of bubbling water seen the day before. An area of green and tan discolored water (light water near the coast on the photo) is visible extending an unstated distance along and beyond the SE coast. Photo courtesy of Mr. Nakahori, JMA. |
After 21 September there was no volcanic activity at Iwo-jima until 19 October. On the morning of 19 October a small phreatic eruption was observed at Idogahama, a beach on the NW coast of the island. The last reported volcanic activity at Idogahama occurred in March 1982 and consisted of a small phreatic eruptions (SEAN 07:09). The Japan Maritime Self Defense Force observed a grayish-white colored plume rising to 200-300 m above the beach surface for 2-3 minutes starting at about 0725. Another similarly sized plume was observed for 10 minutes starting at 0806. JMA, with support from the Japan Maritime Self Defense Force and the Japan Air Self Defense Force, observed the eruption from a helicopter soon after it began.
JMA personnel observed the eruption during 1602-1715 and measured the temperature of the eruption site with an infrared camera. They estimated that the main crater formed during the eruption was about 10 m long and 2-3 m deep. Inside the crater, every 10 minutes intermittent gushing of black water and entrained debris was observed (figure 4). An accompanying white steam plume reached a maximum height of 600 m above the beach during the observations. The temperature inside the crater was 56°C.
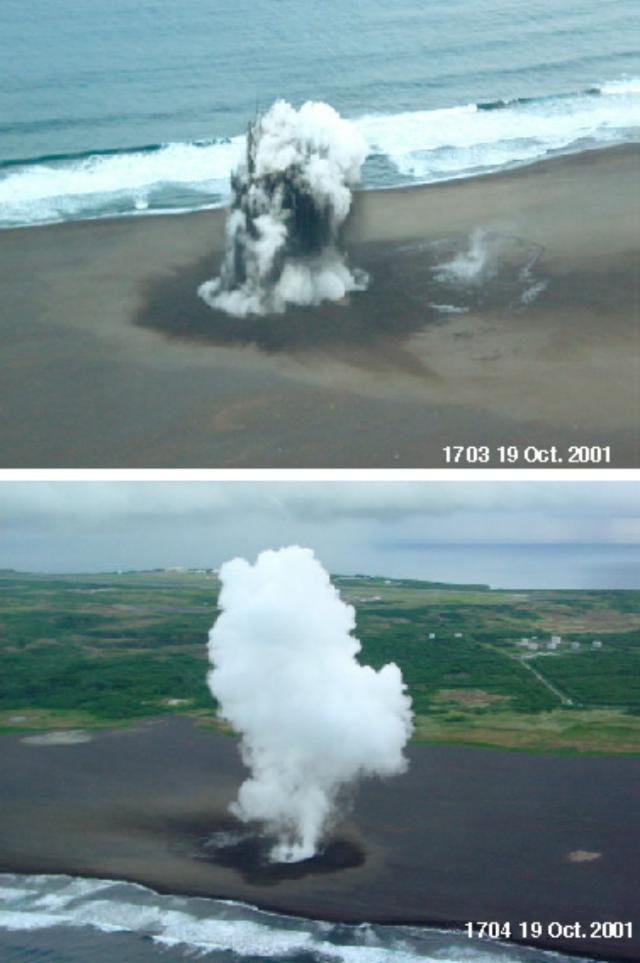 |
Figure 4. Small phreatic eruption at Idogahama, a beach on the NW coast of Iwo-jima, at 1703 (top) and 1704 (bottom) on 19 October 2001. The crater is about 10 m long and 2-3 m deep. The steam cloud rose to a maximum height of 600 m above the beach. Photo courtesy of Mr. Odai and Mr. Nakahori, JMA. |
Information Contacts: Setsuya Nakada, Volcano Research Center, Earthquake Research Institute, University of Tokyo, Yayoi 1-1-1, Bunkyo-ku, Tokyo 113-0032, Japan (URL: http://www.eri.u-tokyo.ac.jp/VRC/index_E.html); Mr. Odai, Mr. Nakahori, and Tomoyuki Kanno, Volcanological Division, Seismological and Volcanological Department, Japan Meteorological Agency (JMA), 1-3-4 Ote-machi, Chiyoda-ku, Tokyo 100 Japan (URL: http://www.jma.go.jp/).
Mud ejections and small phreatic eruptions during early 2012
This report first briefly notes an article discussing deformation at Ioto (also called Iwo-jima), an island located within a submerged caldera ~1,200 km S of Tokyo. Ozawa and others (2007) discuss both complex deformation measured during 2006-2007 and the extremely high rate of uplift during the last few hundred years. The rest of this report is devoted to observations by the Japan Meteorological Association (JMA) and other agencies at Ioto during October 2010 to May 2012, including more deformation, small emissions of hot mud and steam, and discolored seawater that suggested a NE flank submarine eruption.
Our previous report on Ioto (Iwo-jima), discussed a submarine eruption off the SE coast that occurred in September 2001, and a small phreatic eruption at Idogahama, a beach on the NW coast of the island, in October 2001 (BGVN 26:09). Ioto is mildly seismically active with many fumaroles and occasional phreatic explosions, but the volcano has not experienced a magmatic eruption in 400 years (Newhall and Dzurisin, 1988; Lowenstern and others, 2006; Yokoyama and Nazzaro, 2002; and Ukawa and others, 2006).
The locations of the major volcanoes of Japan, including the island of Ioto, are shown in figure 5. Figure 6 is a map of Ioto, summarizing its topography and past eruption sites.
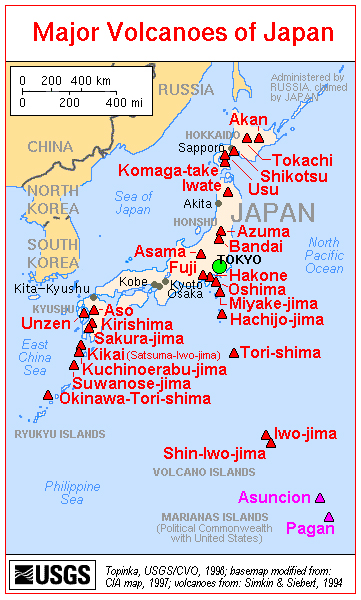 |
Figure 5. A map of the major volcanoes of Japan. Ioto (Iwo-jima) is shown in the lower right. Ioto is about 1,200 km SSE of Tokyo, in the Volcano Islands of the W Pacific Ocean. Courtesy of the U.S. Geological Survey. |
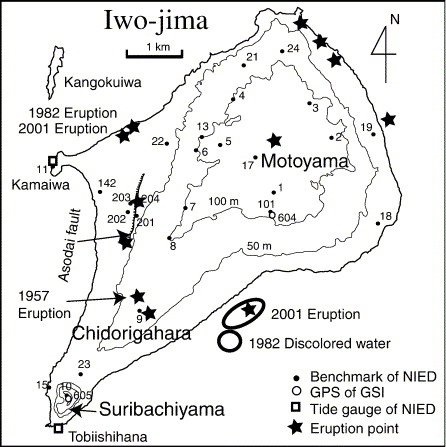 |
Figure 6. Map of Ioto showing topography, major features (including the Asodai fault), and past eruption sites. From Ukawa and others (2006). |
Deformation. Ozawa and others (2007) noted that the overall pattern of deformation seen in the last several hundred years averaged to ~0.25 m of uplift per year, but often exceeded uplift rates of 1 m per year. They plotted uplift and subsidence during January 2006-late 2007 from satellite radar interferometry. Concluding that the deformation pattern is very complicated both spatially and temporally, the authors noted that "In August of 2006, subsidence which had continued from 2003 rapidly changed to uplift, and an increase of seismicity was also observed simultaneously." They divided the uplift during August 2006-late 2007 into 3 stages. The authors used gravity and magnetic data to constrain the shape of the shallow intruding magma under the island's main edifice (Motoyama, also spelled Moto-yama) centered in the bulbous NE portion of the island (figure 6). They described the intruding magma body as having a funnel shape, narrowing towards the bottom and centered about the main topographic high. The authors' modeling suggested that the block of material trapped within the funnel was variously displaced during each of the deformation stages, shifting the block depending on where the magma pooled.
JMA reports. The following material summarizes activity from October 2010 to May 2012, based on monthly volcanic activity reports from JMA. JMA reports on Ioto between November 2001 and September 2010 are not available in English; translations into English resumed in October 2010.
In October 2010, Japan's National Research Institute for Earth Science and Disaster Prevention (NIED) reported that seismicity remained at a low level. GPS observations by the Geospatial Information Authority of Japan (GSI) indicated that an episode of uplift that had ceased around October 2009 resumed in May 2010. N-S baseline displacement (extension) accelerated during late September-early October 2010, accompanied by an eastward deformation in the central part of the island. The uplift slowed after mid-November 2010. This upheaval followed one that occurred during August 2006-October 2009.
During 29-30 January 2011, aerial observations were conducted in cooperation with the Japan Maritime Self-Defense Force (JMSDF). No change in the distribution of thermal anomalies or emissions was detected since the last observation in July 2010.
According to NIED and GSI, both shallow seismicity and the rate of uplift at Ioto increased in February 2011 and continued through at least January 2012. GPS measurements showed a rapid southward displacement at the S part of island. Moreover, between 26 August and 2 September 2011, a local westward displacement was observed SW and SE of Motoyama.
A field survey during 16-18 November 2011 revealed that the water level in Asodai crater (along the fault of the same name, figure 6) had risen compared with the last observation during 29-30 January 2011. The temperature of the muddy water at the bottom of the pit was estimated to be ~100°C, the same as that observed in January 2011. Associated discharges reached a maximum height of 20 m above the crater. No change in the distribution of thermal anomalies or emissions was detected since the last observation in January 2011.
On 10 February 2012, JMSDF reported a mud ejection at an old crater (another depression along the Asodai fault, a spot sometimes called "Million Dollar Hole"). According to field surveys on 14 and 15 February, three major ejection sites were aligned in the N-S direction, the deepest being about 13 m. Mud was ejected to distances of up to 100 m NE of the main vent. No seismicity was observed to be associated with this event, but JMA believed a very small phreatic explosion probably occurred during early February. The maximum temperature of the mud was 96.6°C. Another mud ejection occurred on 7 March in the same area, and mud was ejected up to 60 m WNW. Ash emissions also rose from Asodai, but not from Idogahama.
During another field survey from 7 to 9 March 2012, further mud ejections were noted from the same area as the previous events on the island's W side. In addition, a very small phreatic eruption was noted, with tremor (90-minute duration) and intermittent ejections of steam plumes, mud, and small rocks. Emissions rose 20 m above the crater, and small amounts of ash rose more than 10 m and scattered within 20 m in every direction. During that time, the water level in Asodai crater was higher than that observed during the 16-18 November observation.
During 5-6 April 2012, volcanic tremor and intermittent earthquakes were recorded, and two apparently very small phreatic eruptions were reported. This was accompanied by intermittent noises and emissions at the old crater to the W of the island. According to GSI, ground deformation and seismic activity were greater than usual during 27-28 April, but both subsided after 4 May.
During 29-30 April, the ocean NE of the island was discolored, suggesting an offshore underwater eruption. An aerial observation conducted by the Japan Coast Guard (JCG) on 16 May revealed that discoloration persisted, but in smaller areas. On the N part of the island, steam plumes rose to heights of up to 10 m on 30 April.
During May 2012, ground deformation was almost static. Seismic activity diminished, and no volcanic tremors were observed. Based on camera monitoring, emissions from Asodai crater were low, and no emissions were noted in Idogahama.
References. Lowenstern, J.B., Smith, R.B., and Hill, D.P., 2006, Monitoring super-volcanoes: geophysical and geochemical signals at Yellowstone and other large caldera systems, Phil. Trans. R. Soc. A 364, p. 2055-2072.
Yokoyama, I., and Nazzaro, A., 2002, Anomalous crustal movements with low seismic efficiency-Campi Flegrei, Italy and some examples in Japan, Annals of Geophysics, v. 45, no. 6, p. 709-722.
Newhall, C.G., and Dzurisin, D., 1988, Historical unrest at large calderas of the world, U.S. Geological Survey Bulletin 1855: 1108 p, 2 vol, pgs. 509-520.
Ukawa, M., Fujita, E., Ueda, H., Kumagai, T., Nakajima, H., and Morita, H., 2006, Long-term geodetic measurements of large scale deformation at Iwo-jima caldera, Japan, J. of Volcanology and Geothermal Research, v. 150, p. 98-118.
Ozawa, T., Ueda, H., Ukawa, M., and Miyazaki, S., 2007, Temporal change in crustal deformation related to volcanic activity of Iwo-jima observed by PALSAR/InSAR, Proceedings of the First Joint PI Symposium of ALOS, Data Nodes for ALOS Science Program (DIS 10).
Information Contacts: Japan Meteorological Agency (JMA), Otemachi, 1-3-4, Chiyoda-ku Tokyo 100-8122, Japan (URL: http://www.jma.go.jp/); Japan’s National Research Institute for Earth Science and Disaster Prevention (NIED), 3-1, Tennodai, Tsukuba, Ibaraki, 305-0006, Japan (URL: http://www.bosai.go.jp/e/); Geospatial Information Authority of Japan (GSI) (URL: http://www.gsi.go.jp/ENGLISH/); Japan Maritime Self-Defense Force (JMSDF) (URL: http://www.mod.go.jp/msdf/formal/english/index.html); Japan Coast Guard (JCG) (URL: http://www.kaiho.mlit.go.jp/e/index_e.htm).
Submarine eruption with discolored water, pumice, and gas emissions during July-December 2022
Ioto (Iwo-jima), located about 1,200 km S of Tokyo, lies within a 9-km-wide submarine caldera along the Izu-Bonin-Mariana volcanic arc. Previous eruptions date back to 1889 and have consisted of dominantly phreatic explosions, pumice deposits during 2001, and discolored water (figure 7). An eruption during February-May 2012 included small phreatic eruptions, mud ejections, tremor events, discolored water, and some gas-and-steam and ash emissions (BGVN 37:07). This report updates information since May 2012, covering multiple small events on the island and offshore, through the July-December 2022 submarine eruption that included pumice, black ejecta, and discolored water. Information primarily comes from the Japan Meteorological Association (JMA), the Japan Coast Guard (JCG), and satellite data.
|
Figure 7. Map of Ioto showing the locations of recorded eruptions from 1889 through December 2022. The most recent eruption in 2022 is highlighted in red just off the SE coast of the island and E of the 2001 eruption site. From Ukawa et al. (2002), modified by JMA. |
Activity during June-December 2012. Activity was relatively quiet after May 2012, with occasional white fumaroles seen by the Japan Coast Guard (JCG). Intermittent volcanic earthquakes and tremors also occurred. On 9 July 2012 the Japan Maritime Self Defense Force (JMSDF) reported that a white volcanic plume rose 15 m high around 1215 on the W side of the island. At 1330 mud was ejected tens of meters high; JMA noted that this activity occurred due to a small phreatic explosion, and no associated earthquakes, shock waves, or volcanic tremors were recorded.
On 1 December 2012 JMSDF reported that there were traces of mud ejections in the same location as the July 2012 activity on the W side of the island, with deposits scattered about 10 m from the vent. JMA compared this event to activity during February-April 2012 and reported that it was also possibly a small phreatic explosion.
Activity during 2013. Reports from JMSDF noted that on 18 February 2013 mud had erupted around the former crater known as “Million Dollar Hole” (a depression along the Asodai fault) and included rocks with diameters up to 40 cm. The deposits were mainly scattered about 150 m W. JMSDF identified this event as a small phreatic explosion, similar but larger than those that occurred in 2012.
On 6 March an overflight by JMA allowed observations of a new depression in the Million Dollar Hole that measured about 15 m in diameter. Though no new deposits were visible around the depression, and the exact date and time of the event were unknown, larger volcanic earthquakes from 1800 on 5 March to 0600 on 6 March indicated a small phreatic explosion.
A black plume was visible rising about 400 m above Million Dollar Hole on the W side of the island at 1600 on 11 April, according to a report from JMSDF (figure 8). Volcanic material was also deposited, and volcanic tremor lasted about eight minutes and 50 seconds starting around 1559. These events indicated that a small phreatic explosion had occurred.
|
Figure 8. Photos of an eruption plume rising 400 m above Million Dollar Hole on the W side of Ioto on 11 April 2013. Around 1600 a small phreatic explosion occurred. Courtesy of JMSDF via JMA. |
Off the NE coast of the island near Kitanohana, aerial observations showed white discolored water on 21 August 2013. Further NW from this point, about 150 m off the coast and 300 m N of Kitanohana, on 28 and 30 August more discolored water was confirmed (figure 9).
|
Figure 9. Photos of blue-yellow discolored water off the NE coast of Ioto near Kitanohana on 28 (left) and 30 (right) August 2013. Photo on the right has been color corrected. Courtesy of JMSDF via JMA. |
Activity during 2014-2019. Activity was relatively low during 2014-2019 with occasional seismicity, fumarolic activity, and small eruptions. On 22 May, 24 May, and 20 June 2015 gas-and-steam emissions rose 100-200 m high near the Idogahama Beach on the NW side of the island. Some fumarolic activity was also recorded up to 10 m at the Asodai Sinkhole. A small eruption was recorded near Kitanohana Beach on the N part of the island on 7 August 2015. Mud and rocks were scattered within about 27 m around the eruption vent.
Eruptive activity was reported by JMA during 31 August to 1 September 2016; the National Research Institute for Earth Science and Disaster Prevention confirmed that new volcanic blocks had been ejected about 50 m from the Asodai Sinkhole, accompanied by fumarolic activity. Intermittent fumarolic activity continued through December 2017.
JMA reported that during 8-14 September 2018 the number of volcanic earthquakes increased, and for the first time since April 2012 the daily number of earthquakes exceeded 600. The number of earthquakes decreased slightly after 8 September but remained high through the 14th. During a JMSDF overflight on 12 September 2018 seawater jetting was observed 5-10 m above the ocean surface on the S coast, which JMSDF suggested may have been a submarine eruption. In addition, discolored water was also visible.
Activity during 2020-June 2022. During 2020-2021, activity remained relatively low. An aerial observation conducted by JCG on 4 February 2020 reported that there was discolored water off the W (Chidorigahama) and SE (Okinahama) coasts of the island (figure 10). A small eruption occurred at the Asodai Sinkhole at 1948 on 28 December 2020, which generated a plume that rose 400 m high (figure 11). Volcanic tremors were detected around this time as well. A field survey conducted by JMSDF that night and the morning of 29 December identified volcanic blocks with diameters of 20 cm that had been ejected 50-100 m from the sinkhole; mud deposits were also noted.
|
Figure 10. Photo of yellow discolored water off the SE coast of Ioto on 4 February 2020. Photo has been color corrected. Courtesy of JCG via JMA. |
|
Figure 11. Webcam image showing an eruption plume rising 400 m above the Asodai Sinkhole on the NW side of Ioto at 1951 on 28 December 2020. Courtesy of JMA. |
A surveillance camera, located approximately 900 m ENE of the Asodai Sinkhole on the W side of the island, showed a fumarolic plume rising less than 200 m high on 6 January 2021. Then, on 1 February 2021 a gray eruption plume was detected rising 20 m high at 0905. Mud eruptions around this time were also confirmed at the Asodai Sinkhole. During March 2021 yellowish discolored water was observed near the SE coast. Based on information from JMSDF, a helicopter overflight on 5 April reported that there were dried traces of mud eruptions in the Million Dollar Hole. JMA suggested that several days had passed since the mud eruption occurred. Discolored water was observed during an overflight on 12 July 2021 off the northern NW (Tamehachi) coast.
Off the SE coast (Okinahama), columns of water were reported by JMSDF to be rising from several to tens of meters high during 12 August, 23-26 August, 2-3 September, and 17 September 2021. The JCG reported bluish-white discolored water, gray particles, and bubbles seen during an overflight on 26 August and 12 September off the SE coast (figure 12). On 24 November JMSDF reported that a white volcanic plume rose 60 m high around 0540 from the NW side of the island; occasional gray ejecta rose 20-30 m high that same day NE from the site of the white plume. This activity was accompanied by an increase in volcanic earthquakes and tremor during 23-26 November.
|
Figure 12. Photo of gray particles and discolored water observed off the SE (Okinahama) coast of Ioto on 26 August 2021. Courtesy of JMA. |
Activity during July-August 2022. JMA reported that minor eruptive activity, such as fumaroles, ejecta, and discolored plumes were observed off the SE coast of Ioto each day during 11-31 July 2022. JCG observed brown discolored water beginning on 11 July off the SE coast (figure 13). A column of water containing black ejecta rose meters to tens of meters at intervals of several minutes. On 14 July pumice clasts from the eruption washed onto shore at Okinahama and were photographed by the National Research Institute for Earth Science and Disaster Prevention during a field survey (figure 14). Aerial observations conducted by JCG on 15 July revealed bubbles near the eruptive vent. Additionally, a Sentinel-2 satellite image showed that on 15 July a dark spot off the SE coast near the 2001 vent location was the source of a green-yellow plume of discolored water that drifted NE (figure 15).
|
Figure 13. Photo showing brown discolored water first appearing off the SE (Okinahama) coast of Ioto on 11 July 2022. Photo has been color corrected. The scale of the affected area was not recorded. Courtesy of Japan Coast Guard. |
|
Figure 14. Photo of rocks on Okinahama (SE coast beach) thought to have originated from a submarine eruption of Ioto. Photo was taken on 14 July 2022 by the National Research Institute for Earth Science and Disaster Resilience. Courtesy of JMA. |
|
Figure 15. Sentinel-2 satellite image showing a dark spot of water off the SE coast of Ioto with a discolored plume drifting NE on 15 July 2022. The location of this activity was near the 2001 vent. Image with “Natural color” rendering (bands 4, 3, 2). Courtesy of Sentinel Hub Playground. |
Video taken around 25 July showed a white plume rising from the same location. Satellite images during 30-31 July showed small, rounded gray zones on the surface of the water (figure 16). JMA scientists visited the site on 31 July and confirmed pumice deposits on the beach (figure 17) and noted offshore eruptive activity every few minutes consisting of gray, tephra-laden columns of water rising 20-30 m above the ocean surface (figure 18). On 1 August a photo showed white gas-and-steam emissions rising above the submarine vent, accompanied by floating pumice deposits (figure 19). Another small, rounded gray zone in the water was also captured in a 4 August satellite image (figure 16); an associated discolored plume of water was visible drifting NE. Activity remained relatively low after 9 August, according to JMA, though disturbed water and a green-blue discolored plume in the same area was seen by the JCG on 23 August (figure 20).
|
Figure 16. Sentinel-2 satellite image showing a small, rounded, gray zone at the surface of the water off the SE coast of Ioto on 30 July 2022 (left) and 4 August 2022 (right). A yellow-green discolored plume was visible on 4 August drifting NE. Image with “Natural color” rendering (bands 4, 3, 2). Image on the left has been color corrected due to cloud cover. Courtesy of Sentinel Hub Playground. |
|
Figure 17. Photos showing pumice deposited on Okinahama (SE coast beach) from the Ioto submarine eruption on 31 July 2022. The size of the clast shown here on the right is 90 cm in length. Courtesy of JMA. |
|
Figure 18. Photos showing the submarine eruption at Ioto taken from the SE coast of the island around 1427 on 31 July 2022. The dark water column was ejected 20-30 m high. Courtesy of JMA. |
|
Figure 19. Photo of white gas-and-steam emissions on 1 August 2022 rising above the submarine eruptive vent off the SE coast of Ioto, accompanied by floating pumice deposits. Photo has been color corrected. Courtesy of JMA. |
|
Figure 20. Photo of a blue-green discolored water plume off the SE (Okinahama) coast of Ioto on 23 August 2022. Photo has been color corrected. The scale of the affected area was not recorded. Courtesy of Japan Coast Guard. |
Activity during September-December 2022. JMSDF reported that discolored water on the evening of 4 October was visible off the SE coast, in the same location as the activity during July-August, which was followed by an eruption during 5-8 October. A column of water containing black ejecta rose meters to several tens of meters above the ocean surface at several minute intervals. An overflight on 12 October confirmed a discolored water plume off the SE coast (figure 21) that drifted NE from the same source as the July-August activity.
|
Figure 21. Photos of a strong discolored water plume off the coast of Ioto near Okinahama taken on 12 October 2022. Photo on the left has been color corrected. Courtesy of JCG (left) and JMA (right). |
According to JMSDF an eruption during 7-11 December 2022 included black ejecta rising to tens of meters above the ocean surface in about ten-minute intervals. On 9 December pumice clasts may have been spotted floating on the water. Discolored water was visible on 13 December near the same eruptive vent active during July-August and October.
References. Ukawa, M., Fujita, E., Kobayashi, T., 2002, Recent volcanic activity of Iwo Jima and the 2001 eruption, Monthly Chikyu, Extra No. 39, 157-164.
Information Contacts: Japan Meteorological Agency (JMA), 1-3-4 Otemachi, Chiyoda-ku, Tokyo 100-8122, Japan (URL: http://www.jma.go.jp/jma/indexe.html); Japan Coast Guard (JCG) Volcano Database, Hydrographic and Oceanographic Department, 3-1-1, Kasumigaseki, Chiyoda-ku, Tokyo 100-8932, Japan (URL: https://www1.kaiho.mlit.go.jp/GIJUTSUKOKUSAI/kaiikiDB/kaiyo22-2.htm); Sentinel Hub Playground (URL: https://www.sentinel-hub.com/explore/sentinel-playground).
|
|
||||||||||||||||||||||||||
There is data available for 26 confirmed Holocene eruptive periods.
2023 Oct 18 - 2024 Mar 16 Confirmed Eruption (Submarine) VEI: 1
| Episode 1 | Eruption (Submarine) | ||||||||||||||||||||||||||||||
|---|---|---|---|---|---|---|---|---|---|---|---|---|---|---|---|---|---|---|---|---|---|---|---|---|---|---|---|---|---|---|
| 2023 Oct 18 - 2023 Dec 5 ± 1 days | Evidence from Observations: Satellite (visual) | |||||||||||||||||||||||||||||
|
List of 4 Events for Episode 1
|
||||||||||||||||||||||||||||||
| Episode 2 | Eruption (Submarine) | |||||||||||||||||||||||||
|---|---|---|---|---|---|---|---|---|---|---|---|---|---|---|---|---|---|---|---|---|---|---|---|---|---|
| 2024 Mar 1 - 2024 Mar 16 | Evidence from Observations: Satellite (visual) | ||||||||||||||||||||||||
|
List of 3 Events for Episode 2
|
|||||||||||||||||||||||||
2022 Jul 11 - 2022 Dec 11 Confirmed Eruption (Submarine) VEI: 1
| Episode 1 | Eruption (Submarine) | Off SE coast | |||||||||||||||||||
|---|---|---|---|---|---|---|---|---|---|---|---|---|---|---|---|---|---|---|---|---|
| 2022 Jul 11 - 2022 Aug 23 | Evidence from Observations: Reported | |||||||||||||||||||
|
List of 2 Events for Episode 1 at Off SE coast
|
||||||||||||||||||||
| Episode 2 | Eruption (Submarine) | Off SE coast | |||||||||||||||||||
|---|---|---|---|---|---|---|---|---|---|---|---|---|---|---|---|---|---|---|---|---|
| 2022 Oct 5 - 2022 Oct 8 | Evidence from Observations: Reported | |||||||||||||||||||
|
List of 2 Events for Episode 2 at Off SE coast
|
||||||||||||||||||||
| Episode 3 | Eruption (Submarine) | Off SE coast | |||
|---|---|---|---|---|
| 2022 Dec 7 - 2022 Dec 11 | Evidence from Observations: Reported | |||
2021 Aug 12 - 2021 Nov 24 Confirmed Eruption (Submarine) VEI: 1
| Episode 1 | Eruption (Submarine) | Off SE coast | |||||||||||||||||||||||||||||
|---|---|---|---|---|---|---|---|---|---|---|---|---|---|---|---|---|---|---|---|---|---|---|---|---|---|---|---|---|---|---|
| 2021 Aug 12 - 2021 Nov 24 | Evidence from Observations: Aviation | |||||||||||||||||||||||||||||
| Off the SE coast (Okinahama), columns of water were reported by JMSDF to be rising from several to tens of meters high during 12 August, 23-26 August, 2-3 September, and 17 September 2021. The JCG reported bluish-white discolored water, gray particles, and bubbles seen during an overflight on 26 August and 12 September off the SE coast (figure p). On 24 November JMSDF reported that a white volcanic plume rose 60 m high around 0540; occasional gray ejecta rose 20-30 m high. | ||||||||||||||||||||||||||||||
|
List of 4 Events for Episode 1 at Off SE coast
|
||||||||||||||||||||||||||||||
2020 Dec 28 - 2021 Apr 5 (?) Confirmed Eruption (Explosive / Effusive) VEI: 1
| Episode 1 | Eruption (Explosive / Effusive) | Asodai Sinkhole | ||||||||||||||
|---|---|---|---|---|---|---|---|---|---|---|---|---|---|---|---|
| 2020 Dec 28 - 2021 Apr 5 (?) | Evidence from Observations: Reported | ||||||||||||||
| A small eruption occurred at the Asodai Sinkhole at 1948 on 28 December 2020, which generated a plume that rose 400 m high. A field survey conducted by JMSDF that night and the morning of 29 December identified volcanic blocks with diameters of 20 cm that had been ejected 50-100 m from the sinkhole; mud deposits were also noted. | |||||||||||||||
|
List of 1 Events for Episode 1 at Asodai Sinkhole
|
|||||||||||||||
[ 2018 Sep 8 - 2018 Sep 14 ] Uncertain Eruption
| Episode 1 | Uncertain | Off the S coast | ||||||||||||||||||||||||
|---|---|---|---|---|---|---|---|---|---|---|---|---|---|---|---|---|---|---|---|---|---|---|---|---|---|
| 2018 Sep 8 - 2018 Sep 14 | Evidence from Observations: Seismicity | ||||||||||||||||||||||||
| JMA reported that during 8-14 September 2018 the number of volcanic earthquakes increased and since April 2012, the daily number of earthquakes exceeded 600. The number of earthquakes decreased slightly after 8 September but remained high through the 14th. JMSDF conducted an overflight on 12 September 2018. Seawater jetting was observed 5-10 m above the sea surface on the S coast, which JMSDF suggested may have been a submarine eruption. In addition, discolored water was also visible. | |||||||||||||||||||||||||
|
List of 3 Events for Episode 1 at Off the S coast
|
|||||||||||||||||||||||||
2016 Aug 31 - 2016 Sep 1 Confirmed Eruption (Phreatic) VEI: 1
| Episode 1 | Eruption (Phreatic) | Asodai Sinkhole | ||||||||||||||||||||||||
|---|---|---|---|---|---|---|---|---|---|---|---|---|---|---|---|---|---|---|---|---|---|---|---|---|---|
| 2016 Aug 31 - 2016 Sep 1 | Evidence from Observations: Reported | ||||||||||||||||||||||||
| JMA reported eruptive activity during 31 August to 1 September 2016; the National Research Institute for Earth Science and Disaster Prevention confirmed new volcanic blocks had been ejected about 50 m from the Asodai Sinkhole, accompanied by fumarolic activity. Intermittent fumaroles continued to be detected through December. | |||||||||||||||||||||||||
|
List of 3 Events for Episode 1 at Asodai Sinkhole
|
|||||||||||||||||||||||||
2015 Aug 7 - 2015 Aug 7 Confirmed Eruption (Phreatic) VEI: 1
| Episode 1 | Eruption (Phreatic) | Kianohana Beach (N part of the island) | |||||||||||||||||||
|---|---|---|---|---|---|---|---|---|---|---|---|---|---|---|---|---|---|---|---|---|
| 2015 Aug 7 - 2015 Aug 7 | Evidence from Observations: Reported | |||||||||||||||||||
| On 22 and 24 May, and 20 June 2015, gas-and-steam emissions rose 100-200 m high near the Idogahama Beach on the NW side of the island. Some fumarolic activity was also recorded up to 10 m at the Asodai Sinkhole. A small eruption was recorded near Kianohana Beach on the N part of the island on 7 August 2015. Mud and rocks were scattered around the eruption vent, affecting an area of about 27 m in diameter. | ||||||||||||||||||||
|
List of 2 Events for Episode 1 at Kianohana Beach (N part of the island)
|
||||||||||||||||||||
[ 2013 Aug 21 - 2013 Aug 30 ] Uncertain Eruption
| Episode 1 | Uncertain | Off the NE coast | |||||||||||||||||||
|---|---|---|---|---|---|---|---|---|---|---|---|---|---|---|---|---|---|---|---|---|
| 2013 Aug 21 - 2013 Aug 30 | Evidence from Observations: Reported | |||||||||||||||||||
| Off the NE coast of the island near Kitanohana, aerial observations showed white discolored water on 21 August. Further NW from this point, about 150 m off the coast and 300 m N of Kitanohana, on 28 and 30 August more discolored water was confirmed. | ||||||||||||||||||||
|
List of 2 Events for Episode 1 at Off the NE coast
|
||||||||||||||||||||
2012 Dec 1 - 2013 Apr 11 Confirmed Eruption (Phreatic) VEI: 1
| Episode 1 | Eruption (Phreatic) | Asodai | |||||||||||||||||||
|---|---|---|---|---|---|---|---|---|---|---|---|---|---|---|---|---|---|---|---|---|
| 2012 Dec 1 - 2012 Dec 1 | Evidence from Observations: Reported | |||||||||||||||||||
| On 1 December 2012 JMSDF reported that there were traces of mud ejections in the same location as the July 2012 activity on the W side of the island, with deposits scattered about 10 m from the vent. JMA reported that it was possibly a small phreatic explosion. | ||||||||||||||||||||
|
List of 2 Events for Episode 1 at Asodai
|
||||||||||||||||||||
| Episode 2 | Eruption (Phreatic) | Asodai | |||||||||||||||||||||||||||||||||||||||
|---|---|---|---|---|---|---|---|---|---|---|---|---|---|---|---|---|---|---|---|---|---|---|---|---|---|---|---|---|---|---|---|---|---|---|---|---|---|---|---|---|
| 2013 Feb 18 - 2013 Apr 11 | Evidence from Observations: Reported | |||||||||||||||||||||||||||||||||||||||
| JMSDF noted that on 18 February 2013 mud had erupted around the former crater known as “Million Dollar Hole” (a depression along the Asodai fault) and included rocks with diameters up to 40 cm. The deposits were mainly scattered about 150 m W. JMSDF identified this event as a small phreatic explosion, similar but larger than those that occurred in 2012. | ||||||||||||||||||||||||||||||||||||||||
|
List of 6 Events for Episode 2 at Asodai
|
||||||||||||||||||||||||||||||||||||||||
2012 Feb 10 - 2012 Jul 9 Confirmed Eruption (Phreatic) VEI: 1
This eruption has three episodes in different locations. During the first episode, a mud ejection on the Asodai fault was reported on 10 February 2012. Inspection a few days later indicated three major ejection sites, and JMSDF concluded a phreatic explosion had likely occurred. During 7-9 March another mud ejection was observed and a phreatic eruption with a small amount of ash occurred. Seismicity and small phreatic eruptions were reported during 5-6 April 2012. During the second episode on 29-30 April 2012, the ocean NE of the island was discolored, suggesting an offshore submarine eruption. An aerial observation conducted by the Japan Coast Guard on 16 May revealed that discoloration persisted, but in smaller areas. A final phreatic event took place on 9 July, with a mud ejection.
| Episode 1 | Eruption (Phreatic) | Asodai | |||||||||||||||||||||||||||||||||||||||||||||||||
|---|---|---|---|---|---|---|---|---|---|---|---|---|---|---|---|---|---|---|---|---|---|---|---|---|---|---|---|---|---|---|---|---|---|---|---|---|---|---|---|---|---|---|---|---|---|---|---|---|---|---|
| 2012 Feb 10 - 2012 Apr 6 | Evidence from Observations: Reported | |||||||||||||||||||||||||||||||||||||||||||||||||
| A mud ejection on the Asodai fault was reported on 10 February 2012. Inspection a few days later indicated three major ejection sites and JMSDF concluded a phreatic explosion had likely occurred. Mud was ejected to distances of up to 100 m NE of the main vent. During 7-9 March mud was ejected up to 60 m WNW and a phreatic eruption with a small amount of ash occurred. Seismicity and phreatic activity were reported during 5-6 April 2012. | ||||||||||||||||||||||||||||||||||||||||||||||||||
|
List of 8 Events for Episode 1 at Asodai
|
||||||||||||||||||||||||||||||||||||||||||||||||||
| Episode 2 | Eruption (Submarine) | Submarine NE flank | |||||||||||||||||||||||||||||
|---|---|---|---|---|---|---|---|---|---|---|---|---|---|---|---|---|---|---|---|---|---|---|---|---|---|---|---|---|---|---|
| 2012 Apr 29 - 2012 May 2 ± 2 days | Evidence from Observations: Reported | |||||||||||||||||||||||||||||
| During 29-30 April, the ocean NE of the island was discolored, suggesting an offshore submarine eruption. Aerial observations by the Japan Coast Guard on 16 May revealed that discoloration persisted, but in smaller areas. | ||||||||||||||||||||||||||||||
|
List of 4 Events for Episode 2 at Submarine NE flank
|
||||||||||||||||||||||||||||||
| Episode 3 | Eruption (Phreatic) | Asodai | |||||||||||||||||||
|---|---|---|---|---|---|---|---|---|---|---|---|---|---|---|---|---|---|---|---|---|
| 2012 Jul 9 - 2012 Jul 9 | Evidence from Observations: Reported | |||||||||||||||||||
| On 9 July 2012 the JMSDF reported that a while volcanic plume rose 15 m high around 1215 on the W side of the island. At 1330 mud was ejected tens of meters high; JMA noted that this activity occurred due to a small phreatic explosion. | ||||||||||||||||||||
|
List of 2 Events for Episode 3 at Asodai
|
||||||||||||||||||||
[ 2010 Jun 19 - 2010 Jun 19 ] Uncertain Eruption
| Episode 1 | Eruption (Explosive / Effusive) | ||||||||||||||||||||
|---|---|---|---|---|---|---|---|---|---|---|---|---|---|---|---|---|---|---|---|---|
| 2010 Jun 19 - 2010 Jun 19 | Evidence from Observations: Reported | |||||||||||||||||||
| Based on a pilot observation, the Tokyo VAAC reported that an ash plume on 19 June 2010 from Ioto (Iwo-jima) drifted more than 35 km N. | ||||||||||||||||||||
|
List of 2 Events for Episode 1
|
||||||||||||||||||||
[ 2004 Jun 6 - 2004 Jun 8 ] Uncertain Eruption
| Episode 1 | Eruption (Explosive / Effusive) | Asodai area | ||||||||||||||||||||||||
|---|---|---|---|---|---|---|---|---|---|---|---|---|---|---|---|---|---|---|---|---|---|---|---|---|---|
| 2004 Jun 6 - 2004 Jun 8 | Evidence from Unknown | ||||||||||||||||||||||||
| Minor phreatic eruptions took place near Asodai on 6 and 8 June 2004 with possible ash emission (Kudo and Hoshizumi, 2006-). | |||||||||||||||||||||||||
|
List of 3 Events for Episode 1 at Asodai area
|
|||||||||||||||||||||||||
2001 Sep 21 - 2001 Oct 23 Confirmed Eruption (Explosive / Effusive) VEI: 1
| Episode 1 | Eruption (Explosive / Effusive) | Off SE coast and Idogahama (NW coast) | |||||||||||||||||||||||||||||||||||||||||||||||||
|---|---|---|---|---|---|---|---|---|---|---|---|---|---|---|---|---|---|---|---|---|---|---|---|---|---|---|---|---|---|---|---|---|---|---|---|---|---|---|---|---|---|---|---|---|---|---|---|---|---|---|
| 2001 Sep 21 - 2001 Oct 23 | Evidence from Observations: Reported | |||||||||||||||||||||||||||||||||||||||||||||||||
| At 1015 on 21 September 2001 a submarine eruption began off the SE coast. Visible observations consisted of seawater gushing several meters above sea level. In addition, the eruption was accompanied by an area of discolored seawater extending 300-400 m long. During 1600-1700 three eruption sites were visible; at one a pyroclastic cone was slightly above the sea surface. There was no further eruptive activity until 19 October, when two small phreatic eruptions took place on the NW coast at Idogahama beach. Grayish-white plumes reached 200-300 m above the new 10-m-wide vent. The submarine eruption lasted until 23 October (kudo and Hoshizumi, 2006-). | ||||||||||||||||||||||||||||||||||||||||||||||||||
|
List of 8 Events for Episode 1 at Off SE coast and Idogahama (NW coast)
|
||||||||||||||||||||||||||||||||||||||||||||||||||
1999 Sep 10 - 1999 Sep 10 Confirmed Eruption (Explosive / Effusive) VEI: 1
| Episode 1 | Eruption (Explosive / Effusive) | Asodai area | |||||||||||||||||||
|---|---|---|---|---|---|---|---|---|---|---|---|---|---|---|---|---|---|---|---|---|
| 1999 Sep 10 - 1999 Sep 10 | Evidence from Observations: Reported | |||||||||||||||||||
| A small phreatic explosion took place in the Asodai area on 10 September 1999 (Nakano et al, 2001-). | ||||||||||||||||||||
|
List of 2 Events for Episode 1 at Asodai area
|
||||||||||||||||||||
1994 Aug 22 - 1994 Aug 22 Confirmed Eruption (Explosive / Effusive) VEI: 1
| Episode 1 | Eruption (Explosive / Effusive) | NE side | |||||||||||||||||||
|---|---|---|---|---|---|---|---|---|---|---|---|---|---|---|---|---|---|---|---|---|
| 1994 Aug 22 - 1994 Aug 22 | Evidence from Observations: Reported | |||||||||||||||||||
| A small phreatic explosion on the NE side of the island took place on 28 August 1994 (Nakano et al., 2001-). Notsu et al. (2005) and Kudo and Hoshizumi (2006-) listed this date as 22 August. | ||||||||||||||||||||
|
List of 2 Events for Episode 1 at NE side
|
||||||||||||||||||||
[ 1993 Oct 27 (?) - 1993 Nov 16 (?) ] Uncertain Eruption
| Episode 1 | Eruption (Explosive / Effusive) | Asodai area and NE of Iwo-jima | |||||||||||||||||||
|---|---|---|---|---|---|---|---|---|---|---|---|---|---|---|---|---|---|---|---|---|
| 1993 Oct 27 (?) - 1993 Nov 16 (?) | Evidence from Unknown | |||||||||||||||||||
| Rumblings and sulfur ejection were reported near Asodai on 27 October 1993, and water discoloration took place from a submarine cone off the NE coast on 15 November (Nakano et al., 2001-). Kudo and Hoshizumi (2006-) noted 15-16 November submarine water discoloration. | ||||||||||||||||||||
|
List of 2 Events for Episode 1 at Asodai area and NE of Iwo-jima
|
||||||||||||||||||||
1982 Nov 28 - 1982 Dec 16 (?) ± 15 days Confirmed Eruption (Explosive / Effusive) VEI: 1
| Episode 1 | Eruption (Explosive / Effusive) | West side (Asodai) | |||||||||||||||||||||||||||||
|---|---|---|---|---|---|---|---|---|---|---|---|---|---|---|---|---|---|---|---|---|---|---|---|---|---|---|---|---|---|---|
| 1982 Nov 28 - 1982 Dec 16 (?) ± 15 days | Evidence from Observations: Reported | |||||||||||||||||||||||||||||
| Two weak steam explosions during 28-29 November 1982 (SEAN). Kudo and Hoshizumi (2006-) also listed a possible submarine eruption in December. | ||||||||||||||||||||||||||||||
|
List of 4 Events for Episode 1 at West side (Asodai)
|
||||||||||||||||||||||||||||||
1982 Mar 9 - 1982 Mar 10 Confirmed Eruption (Explosive / Effusive) VEI: 1
| Episode 1 | Eruption (Explosive / Effusive) | NW side (Idogahama beach) | ||||||||||||||||||||||||
|---|---|---|---|---|---|---|---|---|---|---|---|---|---|---|---|---|---|---|---|---|---|---|---|---|---|
| 1982 Mar 9 - 1982 Mar 10 | Evidence from Observations: Reported | ||||||||||||||||||||||||
| Five small phreatic explosions, with no recorded seismic events, produced a new crater along the Aso-dai fault. No juvenile material. | |||||||||||||||||||||||||
|
List of 3 Events for Episode 1 at NW side (Idogahama beach)
|
|||||||||||||||||||||||||
1980 Mar 13 - 1980 Mar 13 Confirmed Eruption (Explosive / Effusive) VEI: 1
| Episode 1 | Eruption (Explosive / Effusive) | Kitanohara | |||||||||||||||||||
|---|---|---|---|---|---|---|---|---|---|---|---|---|---|---|---|---|---|---|---|---|
| 1980 Mar 13 - 1980 Mar 13 | Evidence from Observations: Reported | |||||||||||||||||||
| Small phreatic explosion (BVE). | ||||||||||||||||||||
|
List of 2 Events for Episode 1 at Kitanohara
|
||||||||||||||||||||
1978 Dec 11 - 1978 Dec 11 Confirmed Eruption (Explosive / Effusive) VEI: 1
| Episode 1 | Eruption (Explosive / Effusive) | West side (Asodai) | ||||||||||||||||||||||||
|---|---|---|---|---|---|---|---|---|---|---|---|---|---|---|---|---|---|---|---|---|---|---|---|---|---|
| 1978 Dec 11 - 1978 Dec 11 | Evidence from Observations: Reported | ||||||||||||||||||||||||
| Small phreatic explosion (BVE). | |||||||||||||||||||||||||
|
List of 3 Events for Episode 1 at West side (Asodai)
|
|||||||||||||||||||||||||
1976 Jan 16 ± 15 days Confirmed Eruption (Explosive / Effusive) VEI: 1
| Episode 1 | Eruption (Explosive / Effusive) | West side (Asodai) | |||||||||||||||||||
|---|---|---|---|---|---|---|---|---|---|---|---|---|---|---|---|---|---|---|---|---|
| 1976 Jan 16 ± 15 days - Unknown | Evidence from Observations: Reported | |||||||||||||||||||
| Asodai crater erupted in 1976 (SEAN). JMA (1996) listed mud ejection from a mudpot in November 1975 and mud ejection from Asodai in January 1976. | ||||||||||||||||||||
|
List of 2 Events for Episode 1 at West side (Asodai)
|
||||||||||||||||||||
[ 1974 Jan 16 ± 15 days - 1974 Feb 2 ] Uncertain Eruption
| Episode 1 | Eruption (Explosive / Effusive) | NW of Iwo-jima (Kaiseinishinoba) | ||||||||||||||
|---|---|---|---|---|---|---|---|---|---|---|---|---|---|---|---|
| 1974 Jan 16 ± 15 days - 1974 Feb 2 | Evidence from Unknown | ||||||||||||||
| Possible submarine eruption reported NW of the island in January 1974 at 24.88 N, 141.17 E (SEAN). Nakano et al. (2001-) listed a possible submarine eruption at this location on 2 February. | |||||||||||||||
|
List of 1 Events for Episode 1 at NW of Iwo-jima (Kaiseinishinoba)
|
|||||||||||||||
1969 Dec 1 ± 30 days - 1969 Dec 1 ± 30 days Confirmed Eruption (Explosive / Effusive) VEI: 1
| Episode 1 | Eruption (Explosive / Effusive) | ||||||||||||||||||||
|---|---|---|---|---|---|---|---|---|---|---|---|---|---|---|---|---|---|---|---|---|
| 1969 Dec 1 ± 30 days - 1969 Dec 1 ± 30 days | Evidence from Observations: Reported | |||||||||||||||||||
| A small explosion took place in November or December 1969 (JMA, 1996). | ||||||||||||||||||||
|
List of 2 Events for Episode 1
|
||||||||||||||||||||
1969 Jan 12 (?) - 1969 Jan 21 (?) Confirmed Eruption (Explosive / Effusive) VEI: 1
| Episode 1 | Eruption (Explosive / Effusive) | West side (Asodai) | |||||||||||||||||||
|---|---|---|---|---|---|---|---|---|---|---|---|---|---|---|---|---|---|---|---|---|
| 1969 Jan 12 (?) - 1969 Jan 21 (?) | Evidence from Observations: Reported | |||||||||||||||||||
| Small explosions took place during 8-12 January 1969 (JMA, 1996). Either phreatic explosions or fumarolic activity took place 12-21 January (BVE). Kudo and Hoshizumi (2006-) also listed a 12 January date for a phreatic eruption. | ||||||||||||||||||||
|
List of 2 Events for Episode 1 at West side (Asodai)
|
||||||||||||||||||||
1967 Dec 23 - 1967 Dec 23 Confirmed Eruption (Explosive / Effusive) VEI: 1
| Episode 1 | Eruption (Explosive / Effusive) | West side (Asodai) | |||||||||||||||||||
|---|---|---|---|---|---|---|---|---|---|---|---|---|---|---|---|---|---|---|---|---|
| 1967 Dec 23 - 1967 Dec 23 | Evidence from Observations: Reported | |||||||||||||||||||
| A steam explosion at Asodai on 23 December 1967 caused ejecta from "Million Dollar Hole" and covered a 100 x 200 m area (JMA, 1975). | ||||||||||||||||||||
|
List of 2 Events for Episode 1 at West side (Asodai)
|
||||||||||||||||||||
1957 Mar 28 - 1957 Mar 28 Confirmed Eruption (Explosive / Effusive) VEI: 1
| Episode 1 | Eruption (Explosive / Effusive) | Chidoriga-hara | ||||||||||||||||||||||||
|---|---|---|---|---|---|---|---|---|---|---|---|---|---|---|---|---|---|---|---|---|---|---|---|---|---|
| 1957 Mar 28 - 1957 Mar 28 | Evidence from Observations: Reported | ||||||||||||||||||||||||
| An eruption took place on 28 March 1957 from Chidoriga-hara; no juvenile material was ejected. | |||||||||||||||||||||||||
|
List of 3 Events for Episode 1 at Chidoriga-hara
|
|||||||||||||||||||||||||
1944 Dec Confirmed Eruption (Explosive / Effusive) VEI: 1
| Episode 1 | Eruption (Explosive / Effusive) | North and west sides near the coast | |||||||||||||||||||
|---|---|---|---|---|---|---|---|---|---|---|---|---|---|---|---|---|---|---|---|---|
| 1944 Dec - Unknown | Evidence from Observations: Reported | |||||||||||||||||||
| An eruption took place within several years preceding 1945 from vents on the N and W sides of the island near the coast (CAVW). JMA (1996) listed a phreatic explosion on December 1944. | ||||||||||||||||||||
|
List of 2 Events for Episode 1 at North and west sides near the coast
|
||||||||||||||||||||
1935 Confirmed Eruption (Explosive / Effusive) VEI: 1
| Episode 1 | Eruption (Explosive / Effusive) | SW side at Chidoriga-hara | |||||||||||||||||||
|---|---|---|---|---|---|---|---|---|---|---|---|---|---|---|---|---|---|---|---|---|
| 1935 - Unknown | Evidence from Observations: Reported | |||||||||||||||||||
| A phreatic explosion took place in 1935 on the SW side near Chidoriga-hara (JMA, 1996). | ||||||||||||||||||||
|
List of 2 Events for Episode 1 at SW side at Chidoriga-hara
|
||||||||||||||||||||
1930 (?) Confirmed Eruption (Explosive / Effusive) VEI: 1
| Episode 1 | Eruption (Explosive / Effusive) | NW side near the coast | |||||||||||||||||||
|---|---|---|---|---|---|---|---|---|---|---|---|---|---|---|---|---|---|---|---|---|
| 1930 (?) - Unknown | Evidence from Observations: Reported | |||||||||||||||||||
| An eruption took place in about 1930 from the NW side of the island near the coast (CAVW). | ||||||||||||||||||||
|
List of 2 Events for Episode 1 at NW side near the coast
|
||||||||||||||||||||
1922 Jul Confirmed Eruption (Explosive / Effusive) VEI: 1
| Episode 1 | Eruption (Explosive / Effusive) | West side (Asodai) | |||||||||||||||||||
|---|---|---|---|---|---|---|---|---|---|---|---|---|---|---|---|---|---|---|---|---|
| 1922 Jul - Unknown | Evidence from Observations: Reported | |||||||||||||||||||
| Steam explosion near Asodai (JMA, 1975). | ||||||||||||||||||||
|
List of 2 Events for Episode 1 at West side (Asodai)
|
||||||||||||||||||||
1889 Dec 31 ± 365 days Confirmed Eruption (Explosive / Effusive) VEI: 1
| Episode 1 | Eruption (Explosive / Effusive) | Chidoriga-ana | ||||||||||||||||||||||||
|---|---|---|---|---|---|---|---|---|---|---|---|---|---|---|---|---|---|---|---|---|---|---|---|---|---|
| 1889 Dec 31 ± 365 days - Unknown | Evidence from Observations: Reported | ||||||||||||||||||||||||
| A phreatic explosion in 1889 or 1890 formed a 50-m-wide crater (JMA, 1996). | |||||||||||||||||||||||||
|
List of 3 Events for Episode 1 at Chidoriga-ana
|
|||||||||||||||||||||||||
0850 BCE ± 50 years Confirmed Eruption (Explosive / Effusive)
| Episode 1 | Eruption (Explosive / Effusive) | Motoyama | ||||||||||||||||||||||||
|---|---|---|---|---|---|---|---|---|---|---|---|---|---|---|---|---|---|---|---|---|---|---|---|---|---|
| 0850 BCE ± 50 years - Unknown | Evidence from Isotopic: 14C (calibrated) | ||||||||||||||||||||||||
| Pumiceous tuffs at Motoyama were 14C dated at about 2,600 and 2,700-2,800 BP (Newhall and Dzurisin, 1988; Ukawa et al., 2006). A radiocarbon date of 2,650 ± 80 BP was assigned a calendar date of 850 ± 50 BCE by Kudo and Hoshizumi (2006-), who also noted a lava flow. | |||||||||||||||||||||||||
|
List of 3 Events for Episode 1 at Motoyama
|
|||||||||||||||||||||||||
This compilation of synonyms and subsidiary features may not be comprehensive. Features are organized into four major categories: Cones, Craters, Domes, and Thermal Features. Synonyms of features appear indented below the primary name. In some cases additional feature type, elevation, or location details are provided.
Synonyms |
||||
| Iwo-jima | Iwo-zima | Sulphur Island | Naka-Iwo-zima | Io-sima | Farallon a Fortuna | Ogasawara-Io-jima | ||||
Cones |
||||
| Feature Name | Feature Type | Elevation | Latitude | Longitude |
| Motoyama
Moto-yama |
Stratovolcano | 120 m | 24° 47' 0.00" N | 141° 20' 0.00" E |
| Suribachiyama
Suribati-yama Pipe, Mount Suribachi-yama |
Pyroclastic cone | 112 m | 24° 45' 3.00" N | 141° 17' 20.00" E |
Craters |
||||
| Feature Name | Feature Type | Elevation | Latitude | Longitude |
| Kaiseinishinoba | Submarine crater | -262 m | 24° 50' 39.00" N | 141° 9' 58.00" E |
There are no samples for Ioto in the Smithsonian's NMNH Department of Mineral Sciences Rock and Ore collection.
| Copernicus Browser | The Copernicus Browser replaced the Sentinel Hub Playground browser in 2023, to provide access to Earth observation archives from the Copernicus Data Space Ecosystem, the main distribution platform for data from the EU Copernicus missions. |
| MIROVA | Middle InfraRed Observation of Volcanic Activity (MIROVA) is a near real time volcanic hot-spot detection system based on the analysis of MODIS (Moderate Resolution Imaging Spectroradiometer) data. In particular, MIROVA uses the Middle InfraRed Radiation (MIR), measured over target volcanoes, in order to detect, locate and measure the heat radiation sourced from volcanic activity. |
| MODVOLC Thermal Alerts | Using infrared satellite Moderate Resolution Imaging Spectroradiometer (MODIS) data, scientists at the Hawai'i Institute of Geophysics and Planetology, University of Hawai'i, developed an automated system called MODVOLC to map thermal hot-spots in near real time. For each MODIS image, the algorithm automatically scans each 1 km pixel within it to check for high-temperature hot-spots. When one is found the date, time, location, and intensity are recorded. MODIS looks at every square km of the Earth every 48 hours, once during the day and once during the night, and the presence of two MODIS sensors in space allows at least four hot-spot observations every two days. Each day updated global maps are compiled to display the locations of all hot spots detected in the previous 24 hours. There is a drop-down list with volcano names which allow users to 'zoom-in' and examine the distribution of hot-spots at a variety of spatial scales. |
|
WOVOdat
Single Volcano View Temporal Evolution of Unrest Side by Side Volcanoes |
WOVOdat is a database of volcanic unrest; instrumentally and visually recorded changes in seismicity, ground deformation, gas emission, and other parameters from their normal baselines. It is sponsored by the World Organization of Volcano Observatories (WOVO) and presently hosted at the Earth Observatory of Singapore.
GVMID Data on Volcano Monitoring Infrastructure The Global Volcano Monitoring Infrastructure Database GVMID, is aimed at documenting and improving capabilities of volcano monitoring from the ground and space. GVMID should provide a snapshot and baseline view of the techniques and instrumentation that are in place at various volcanoes, which can be use by volcano observatories as reference to setup new monitoring system or improving networks at a specific volcano. These data will allow identification of what monitoring gaps exist, which can be then targeted by remote sensing infrastructure and future instrument deployments. |
| Volcanic Hazard Maps | The IAVCEI Commission on Volcanic Hazards and Risk has a Volcanic Hazard Maps database designed to serve as a resource for hazard mappers (or other interested parties) to explore how common issues in hazard map development have been addressed at different volcanoes, in different countries, for different hazards, and for different intended audiences. In addition to the comprehensive, searchable Volcanic Hazard Maps Database, this website contains information about diversity of volcanic hazard maps, illustrated using examples from the database. This site is for educational purposes related to volcanic hazard maps. Hazard maps found on this website should not be used for emergency purposes. For the most recent, official hazard map for a particular volcano, please seek out the proper institutional authorities on the matter. |
| IRIS seismic stations/networks | Incorporated Research Institutions for Seismology (IRIS) Data Services map showing the location of seismic stations from all available networks (permanent or temporary) within a radius of 0.18° (about 20 km at mid-latitudes) from the given location of Ioto. Users can customize a variety of filters and options in the left panel. Note that if there are no stations are known the map will default to show the entire world with a "No data matched request" error notice. |
| UNAVCO GPS/GNSS stations | Geodetic Data Services map from UNAVCO showing the location of GPS/GNSS stations from all available networks (permanent or temporary) within a radius of 20 km from the given location of Ioto. Users can customize the data search based on station or network names, location, and time window. Requires Adobe Flash Player. |
| DECADE Data | The DECADE portal, still in the developmental stage, serves as an example of the proposed interoperability between The Smithsonian Institution's Global Volcanism Program, the Mapping Gas Emissions (MaGa) Database, and the EarthChem Geochemical Portal. The Deep Earth Carbon Degassing (DECADE) initiative seeks to use new and established technologies to determine accurate global fluxes of volcanic CO2 to the atmosphere, but installing CO2 monitoring networks on 20 of the world's 150 most actively degassing volcanoes. The group uses related laboratory-based studies (direct gas sampling and analysis, melt inclusions) to provide new data for direct degassing of deep earth carbon to the atmosphere. |
| Large Eruptions of Ioto | Information about large Quaternary eruptions (VEI >= 4) is cataloged in the Large Magnitude Explosive Volcanic Eruptions (LaMEVE) database of the Volcano Global Risk Identification and Analysis Project (VOGRIPA). |
| EarthChem | EarthChem develops and maintains databases, software, and services that support the preservation, discovery, access and analysis of geochemical data, and facilitate their integration with the broad array of other available earth science parameters. EarthChem is operated by a joint team of disciplinary scientists, data scientists, data managers and information technology developers who are part of the NSF-funded data facility Integrated Earth Data Applications (IEDA). IEDA is a collaborative effort of EarthChem and the Marine Geoscience Data System (MGDS). |


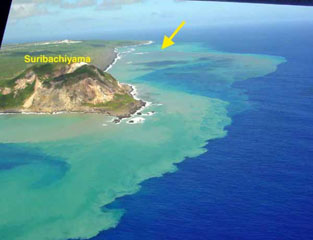 The discolored water seen here is from the September 2001 Ioto submarine eruption, with the vent marked by the yellow arrow. The island is located within a 9-km-wide submarine caldera and narrows toward its SW tip, where the Suribachiyama cone is located. Numerous phreatic eruptions and uplift over at least the past 700 years has accompanied resurgent doming of the caldera.