On 2 December SGC reported that an increase in seismicity was detected at Cerro Machín beginning at 1123 on 2 December, with signals indicating rock fracturing. By 1320 a total of 393 signal were counted. The largest event, a M 4.5 recorded at 1236, was located 900 m SSW of the main dome at a depth of 3 km and was felt in Cajamarca (14 km WSW), Ibagué (17 km ESE), and in other municipalities of Tolima. The Alert Level remained at 3 (Yellow; the second lowest level on a four-color scale).
Source: Servicio Geológico Colombiano (SGC)
Monitoring efforts and intermittent shaking from local earthquakes during 2011-2012
Elevated seismicity during January 2011 was discussed in our last report on Cerro Machín volcano (BGVN 36:04). Between September 2010 and January 2011, more than 800 volcano-tectonic (VT) earthquakes were detected per month and local residents reported shaking from these events, particularly during November 2010-February 2011. Here we describe trends in seismicity at Machín from January 2011 to November 2012 and the frequency of seismic swarms. We also include descriptions of monitoring efforts by the Volcanic and Seismological Observatory of Manizales at the Colombia Institute of Geology and Mining (INGEOMINAS) including two field campaigns focused on CO2 emissions from the crater.
Geophysical monitoring. Since January 2011, INGEOMINAS had been monitoring Cerro Machín with a network that included broadband and short-period seismometers, magnetometers, self potential, and an acoustic monitoring system (acoustic flow detection for early flood warning). The deformation network included electronic and dry tilt (longterm monitoring since 2005), and starting in November 2012, three GPS stations were also operating (figure 4). Electronic-distance measurements (EDM) were conducted in 2012 at seven stations (EDM data was available since 2008). Data from these monitoring efforts were available in the INGEOMINAS online technical reports.
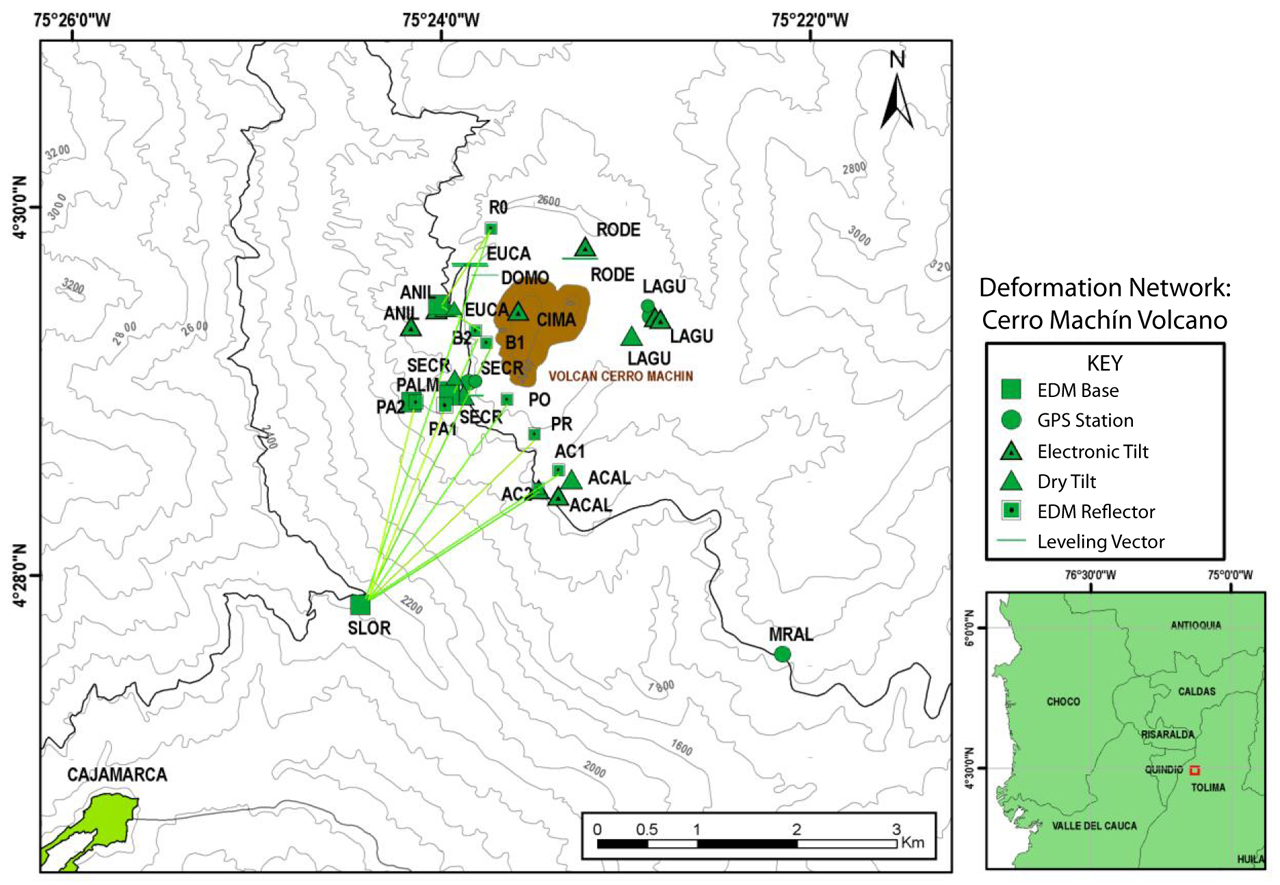 |
Figure 4. The deformation monitoring network at Cerro Machín in 2012 included three GPS stations and five electronic tilt stations. EDM measurements in September 2011 used three base stations (San Lorenzo, "SLOR;" La Palma, "PALM;" and Anillo, "ANIL") while measurements in October 2012 relied on one base station (San Lorenzo, "SLOR"). Courtesy of INGEOMINAS. |
Geochemical monitoring. Geochemical monitoring at Cerro Machín has been conducted within the circular crater and the central dome complex (figures 5 and 6). During 2011-2012, geochemical monitoring included diffuse CO2 detection, alkaline traps, and radon monitoring from soil emissions (13 stations were online in November 2012) as well as regular testing at fumarolic and hot spring locations.
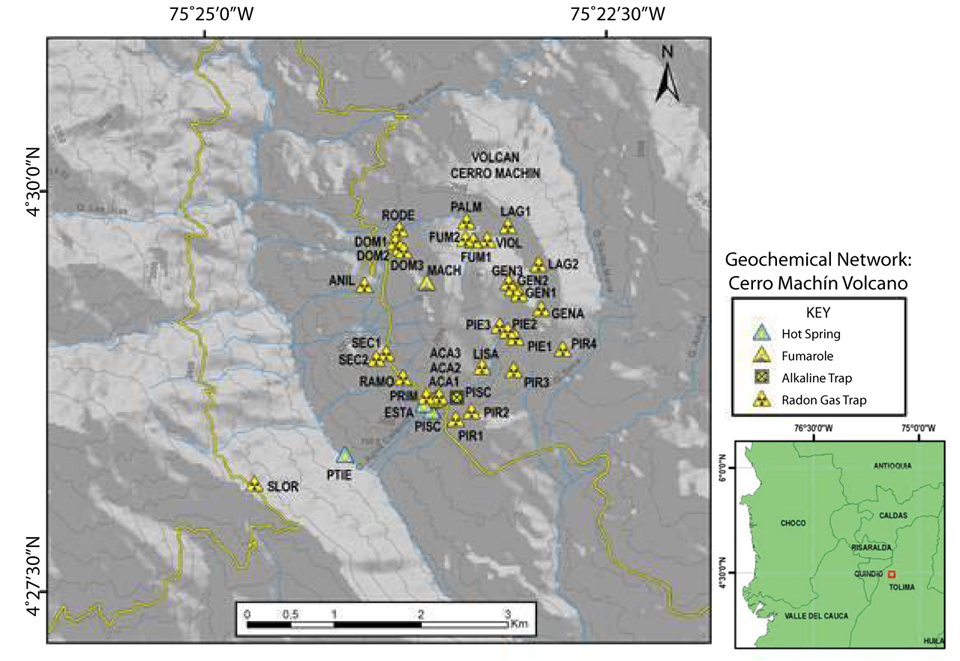 |
Figure 5. Geochemical monitoring during 2011-2012 at Cerro Machín included several dozen sampling sites mainly spread across the ~2-km diameter crater. INGEOMINAS released long-term datasets from radon-gas traps, an alkaline trap, and a fumarole in their monthly technical bulletins. Courtesy of INGEOMINAS. |
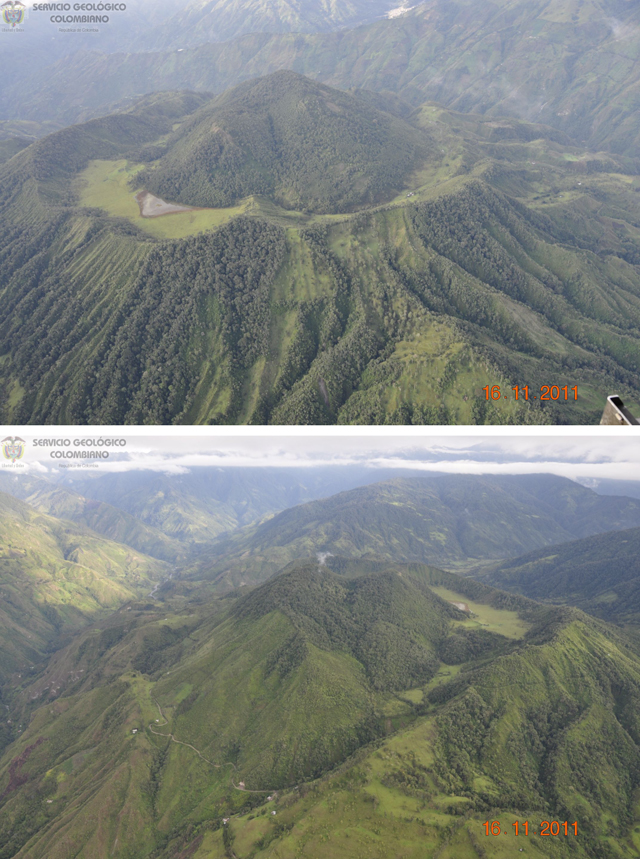 |
Figure 6. Two aerial views of Cerro Machín were captured during an overflight on 16 November 2011. (Top) In this view of the NE flank of Machín, the crater lake is visible near the left-hand side of the image within a moat-like region surrounding the dome. (Bottom) This view shows an access road along the breached, SW edge of the dome complex (lower center). This view also reveals a glimpse of the crater lake (appears gray) in the distant portion of the moat (right, from center). Courtesy of INGEOMINAS. |
In May and September 2012, INGEOMINAS conducted field surveys to measure diffuse carbon dioxide emissions (figure 7). With a mobile LICOR 820 monitoring device, INGEOMINAS technicians traversed the interior crater rim detecting CO2, air temperature, and pressure. The survey on 28 May determined baseline levels of CO2 flux at 28 points within the crater. The survey conducted during 19 and 20 September 2012 detected relatively high CO2 emissions from seven locations along a traverse within the crater. The highest CO2 fluxes ranged between 739 and 8,077 mol·m-2·day-1, and in their technical report, INGEOMINAS noted that future gas monitoring should focus on those sites with peak values.
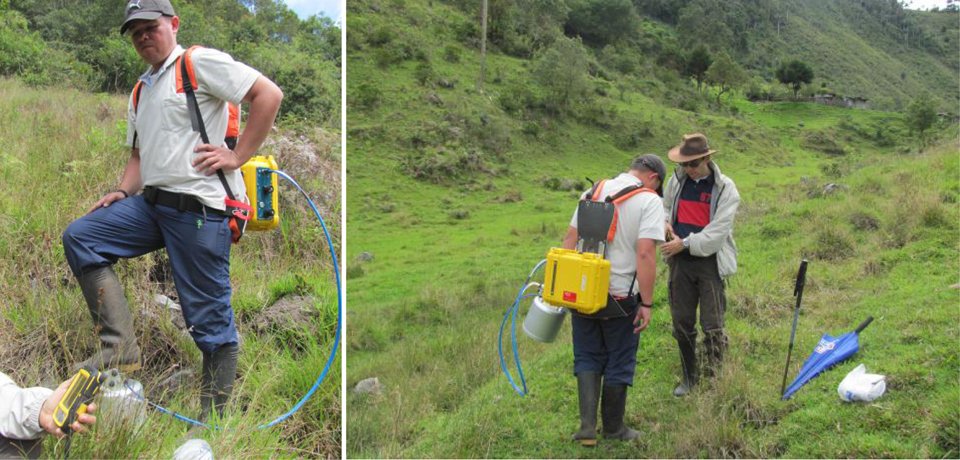 |
Figure 7. On 28 May 2012, INGEOMINAS conducted a CO2 campaign within the crater of Cerro Machín. Courtesy of INGEOMINAS. |
Seismicity in 2011. Elevated seismicity in late 2010 continued through early 2011 (BGVN 36:04) and local communities reported shaking in January and February 2011 (figure 8). For many months after May 2011, earthquakes per month had declined to below 400 per month. The clear exception to that trend took place during September 2011, a month with over 1,200 earthquakes.
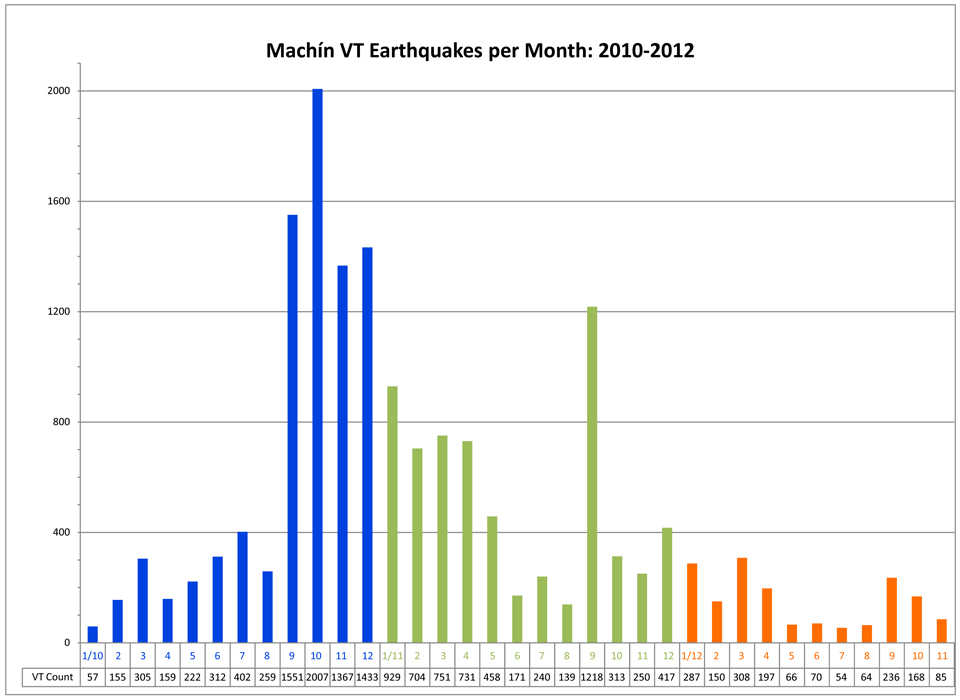 |
Figure 8. Volcano-tectonic (VT) seismicity at Cerro Machín abruptly increased in September 2010. This histogram shows time on the x-axis and number of earthquakes on the y-axis. Earthquake count per month decreased in January and February 2011 and reached low levels in August. Except for peaks in September and December 2011, the number of earthquakes remained below 400 events per month until November 2012. Courtesy of INGEOMINAS. |
Compared with 2010 activity, fewer seismic swarms were detected in 2011 and in the available record for 2012 (table 2). In 2011, swarms tended to cluster beneath the dome complex and in areas ~2 km S and SE. INGEOMINAS frequently noted earthquake epicenters in an area known as Moralito, a location SE of the volcano near the MRAL GPS station (see figure 4). Deeper earthquakes (frequently at depths between 7 and 18 km) were detected in that region and were attributed to displacements along a fault zone.
Table 2. Seismic swarms detected at Machín during 2010-2012. Days were counted and tallied based on whether one or more swarms occurred. For example, during January-February 2010 there were six swarms recorded. Courtesy of INGEOMINAS.
| Time Period | Days with swarms |
| Jan-Feb 2010 | 6 |
| Mar 2010 | 1 |
| Apr-Jun 2010 | 8 |
| Jul-Dec 2010 | 27 |
| Jan-May 2011 | 14 |
| Aug 2011 | 1 |
| Jan-Apr 2012 | 4 |
| Sep-Oct 2012 | 6 |
Local residents felt shaking from earthquakes in September 2011 when six occurred with magnitudes greater than 2.5. INGEOMINAS reported that this month had the largest combined free-energy release that year. The largest magnitude event of that group was an M 3.6 volcano-tectonic (VT) earthquake detected at 2013 on 12 September. The average depth of the earthquakes was 4.5 km with some events as deep as 13 km. Epicenters were primarily clustered in the area of Moralito (near the MORA seismic station, see figure 9).
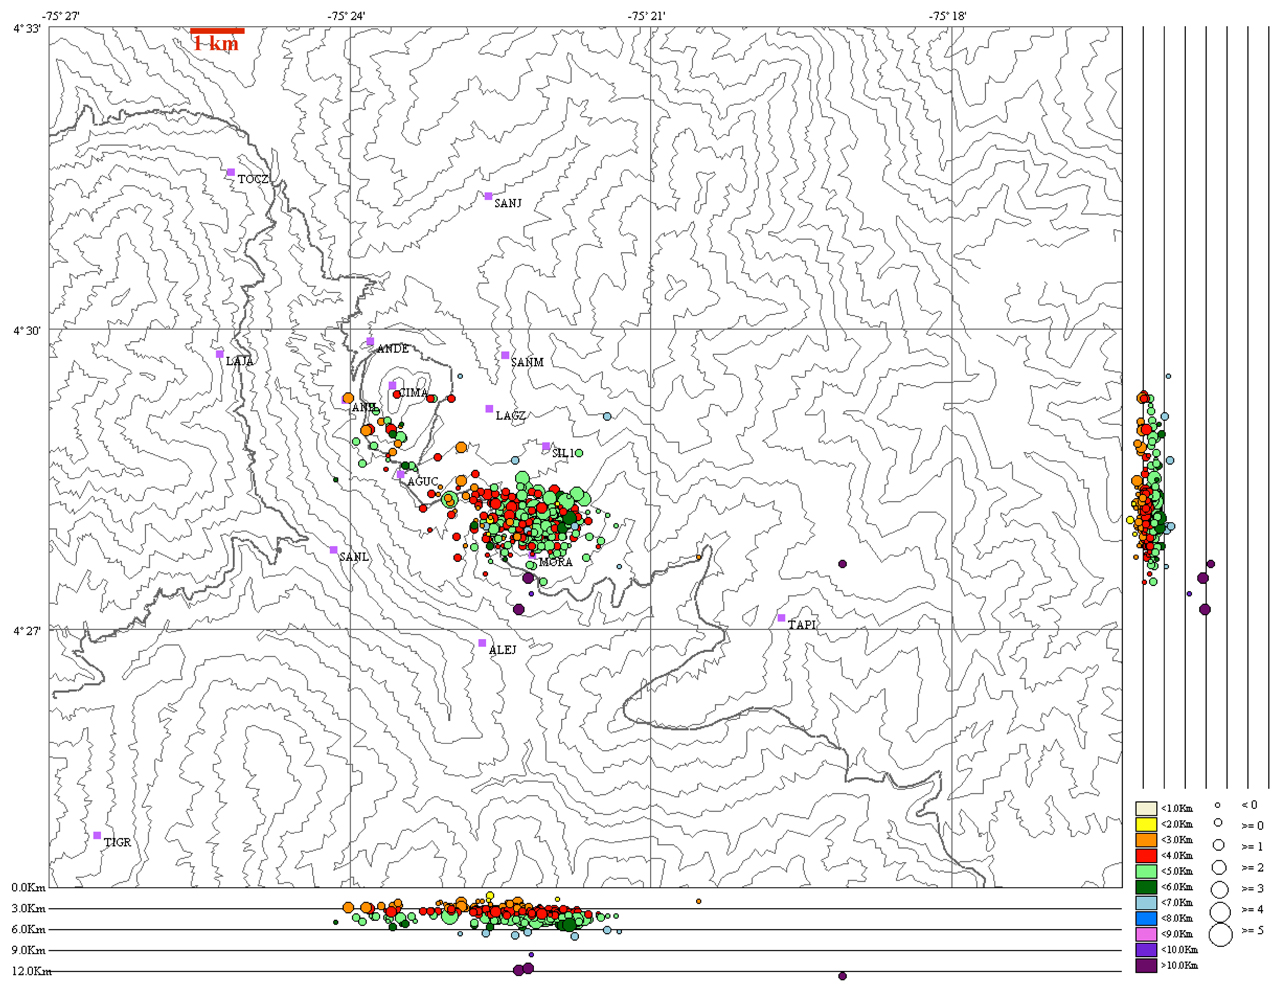 |
Figure 9. During September 2011, several moderate-sized earthquakes were located in an area SE of Cerro Machín. Seismic stations are labeled and located at purple squares. Note that the summit of Machín sits ~4 km NW of the clustered earthquakes, near the CIMA seismic station. Courtesy of INGEOMINAS. |
In December 2011, INGEOMINAS reported that rockfall-type seismic signals were detected within the area. A total of 19 signatures were counted on 11 December; some events had durations up to 73 seconds. The largest earthquake that month was an M 2.32 that occurred at 0542 on 1 December.
Seismicity from January to November 2012. Rockfall-type signatures were also recorded in January 2012. These events occurred on 10 January at 1556 and lasted up to 64 seconds. As frequently observed during previous months, VT earthquakes tended to occur beneath the dome, S, and SE in the area of Moralito.
From January to August 2012, seismic swarms occurred intermittently (table 2). Elevated seismicity occurred during April 2012 and was felt by local residents. During this time period, the largest earthquake was an M 2.8 VT detected on 11 April at 0655. In April, VT earthquakes clustered ~1 km S of the dome complex and were ~4 km deep.
During May-August 2012, earthquakes were rarely clustered and occurred at a wide range of depths (0-16 km). In August, several earthquakes were located ~8 km SE of the CIMA station at depths between 12-15 km. The largest earthquake that month was an M 1.45 detected at 2026 on 9 August.
During September-October, seismic swarms occurred on six days (table 2). Local residents in the municipalities of Cajamarca and Ibagué (locations appear in figure 2 of BGVN 36:04) as well as the nearby departments of Quindio, Risaralda, and Caldas reported shaking due to these earthquakes (locations of these districts appear in the regional map of figure 5 in this report). These events were clustered beneath the dome complex at depths between 2 and 5 km. In October, however, relatively large earthquakes were detected in an area ~8 km SE of the dome at depths around 13 km. The largest earthquakes were on 9 September (M 3.6) and on 7 October (M 4.6) prompting INGEOMINAS staff to visit residences and investigate the impact of the events (figure 10). The M 4.6 earthquake was one of several located SE of the dome (near the TAPI seismic station, see figure 9).
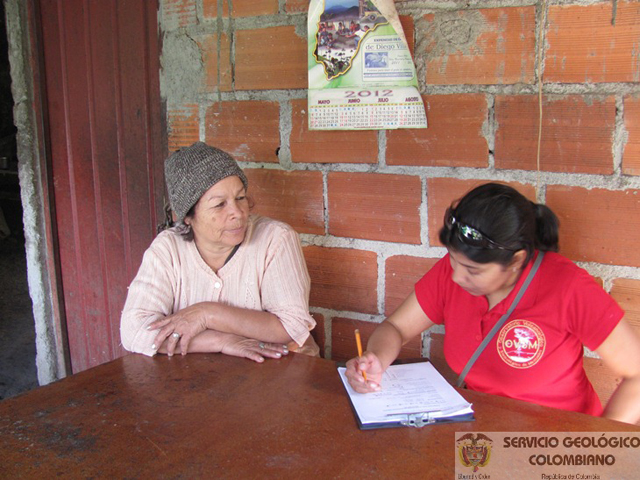 |
Figure 10. A visit to areas around Machín by INGEOMINAS staff in order to evaluate the possible damage from seismic unrest that was detected on 7 October 2012. Courtesy of INGEOMINAS. |
In November, INGEOMINAS reported that VT earthquakes continued to occur beneath the dome although at a reduced rate compared to October. Earthquakes tended to occur 2-5 km beneath the dome, and deeper events were detected to the SE at depths between 9 and 15 km. The largest earthquake detected was an M 2.8 on 20 November at 1754. This earthquake was located at a depth of 2.75 km and was ~2 km SW of the dome complex.
Information Contacts: Instituto Colombiano de Geologia y Mineria (INGEOMINAS), Observatorio Vulcanológico y Sismológico de Manizales, Manizales, Colombia (URL: https://www2.sgc.gov.co/volcanes/index.html).
2022: November
2012: September
2010: July
| September
| December
2008: January
| November
| December
2004: May
On 2 December SGC reported that an increase in seismicity was detected at Cerro Machín beginning at 1123 on 2 December, with signals indicating rock fracturing. By 1320 a total of 393 signal were counted. The largest event, a M 4.5 recorded at 1236, was located 900 m SSW of the main dome at a depth of 3 km and was felt in Cajamarca (14 km WSW), Ibagué (17 km ESE), and in other municipalities of Tolima. The Alert Level remained at 3 (Yellow; the second lowest level on a four-color scale).
Source: Servicio Geológico Colombiano (SGC)
According to INGEOMINAS, Observatory Vulcanológico and Sismológico de Manizales reported that at 0732 on 9 September a M 3.6 volcano-tectonic earthquake occurred below the main lava dome at Cerro Machín at a depth of 3.2 km, and was felt by nearby residents. The Alert Level remained at III (Yellow; "changes in the behavior of volcanic activity").
Source: Servicio Geológico Colombiano (SGC)
According to INGEOMINAS, Observatory Vulcanológico and Sismológico de Manizales reported a period of increased seismicity from Cerro Machín on 31 December. A total of 346 volcano-tectonic events no stronger than M 2.1 were located S and SW of the main lava dome. On 1 January seismicity again increased, and at the time of the report, 367 events had been detected. The low-magnitude events were located S and SW of the main dome at depths between 2.5 and 4.5 km. The largest event, M 2.3, was located S of the dome at a depth of about 3.3 km and felt by residents near the volcano and in the municipality of Cajamarca, 14 km WSW. The Alert level remained at III (Yellow; "changes in the behavior of volcanic activity").
Source: Servicio Geológico Colombiano (SGC)
According to INGEOMINAS, Observatory Vulcanológico and Sismológico de Manizales reported increased seismicity from Cerro Machín on 3 December. About 340 volcano-tectonic earthquakes with low magnitudes were located SW of the main lava dome, at an average depth of 4 km. The largest event, a M 3.7 earthquake located SW of the dome at a depth of about 3.5 km, was felt by local residents. The Alert level remained at III (Yellow; "changes in the behavior of volcanic activity").
Source: Servicio Geológico Colombiano (SGC)
According to INGEOMINAS, Observatory Vulcanológico and Sismológico de Manizales reported increased seismicity from Cerro Machín on 17 September. About 140 volcano-tectonic earthquakes as large as M 1.85 were located S and SW of the main lava dome at depths of 2-4 km. The Alert level remained at III (Yellow; "changes in the behavior of volcanic activity").
Source: Servicio Geológico Colombiano (SGC)
Observatory Vulcanológico and Sismológico de Manizales reported a seismic crisis at Cerro Machín on 24 July, characterized by volcano-tectonic earthquakes. One of the earthquakes was a M 2.6, located S of the main lava dome at a depth of 3.96 km. The next day a M 4.1 volcano-tectonic earthquake occurred 0.8 km S of the main dome at a depth of 3.88 km. On 29 July the number of volcano-tectonic events increased; the earthquakes were a maximum M 1.73 and between 3 and 4 km depth, S of the main dome. The Alert level remained at III (Yellow; "changes in the behavior of volcanic activity").
Source: Servicio Geológico Colombiano (SGC)
Observatory Vulcanológico and Sismológico de Manizales reported that a swarm of 98 earthquakes occurred at Machín on 17 December SE of the lava domes at depths of 2-6 km. The largest earthquake was M 2.6 at a depth of 3.8 km.
Source: Servicio Geológico Colombiano (SGC)
Observatory Vulcanológico and Sismológico de Manizales reported a seismic crisis at Cerro Machín on 9 November. The majority of the earthquakes occurred underneath the central and E parts of the lava dome complex in the summit caldera, at depths of 2.5-5 km. Fumarolic activity in the area increased, and cracks in the ground and damage to houses were reported. Seismicity decreased the next day. According to news articles, approximately 400-450 people evacuated to shelters or other safe areas and landslides blocked a highway.
Sources: Servicio Geológico Colombiano (SGC); Portafolio; Caracol Radio; El Tiempo
Observatory Vulcanológico and Sismológico de Manizales reported unusual seismicity at Machín during 6-8 January. Long-period earthquakes were detected S of the main lava dome. On 7 January, volcano-tectonic seismic signals were registered and occasionally felt and reported by near by residents. The simultaneous occurrence of both types of seismic signals was unusual for Machín.
Source: Servicio Geológico Colombiano (SGC)
According to news articles, the Observatory Vulcanológico and Sismológico de Manizales reported that there was an increase in seismicity at Machín in April. About 60 earthquakes were recorded daily, in comparison to the 1-10 earthquakes normally recorded. No surficial changes were seen at the volcano.
Reports are organized chronologically and indexed below by Month/Year (Publication Volume:Number), and include a one-line summary. Click on the index link or scroll down to read the reports.
Seismic and non-eruptive unrest detected in 2004, 2008, 2009, and again in 2010
This is the first Bulletin report on Cerro Machín volcano, the site of seismic unrest for many years, most recently, 1992, 1999, 2002, 2004, 2008, 2009, and 2010. This activity did not lead to eruptions. Instrumental monitoring by INGEOMINAS began in 1987 and has determined Machín's background seismicity ranged from 1 to10 earthquakes/day, but during intervals of unrest, seismicity sometimes reached several hundred earthquakes per day.
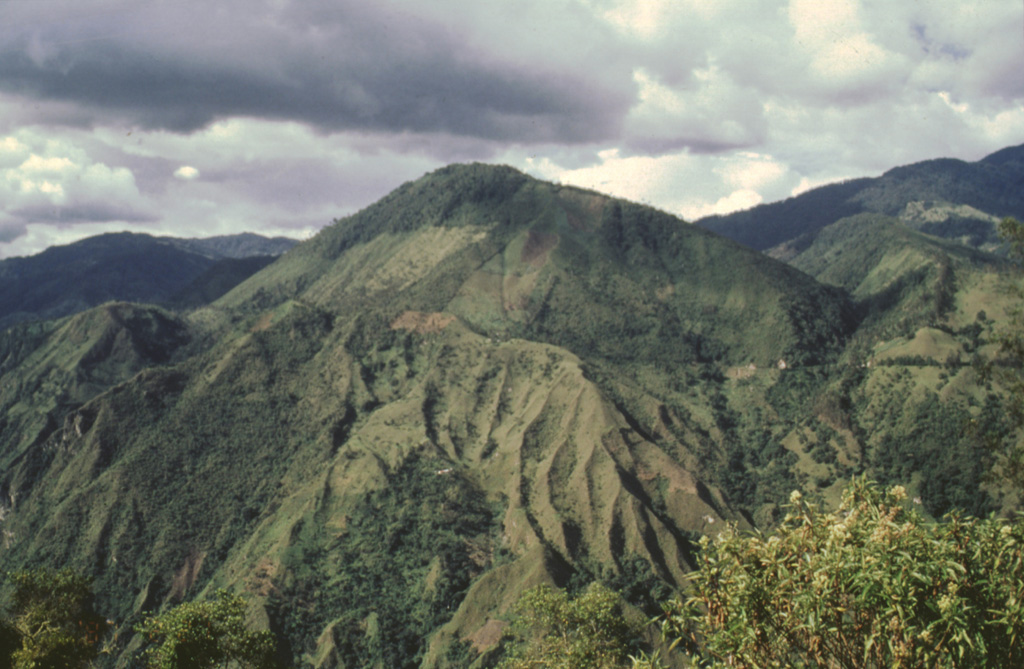
This is a small but explosive volcano located at the S end of the Ruiz-Tolima massif, 185 km NNE of the Nevado del Huila volcano and 147 km WSW of Bogotá, the capital (figure 1). (Tolima volcano, not shown, lies ~22 km NNE of Machín.)
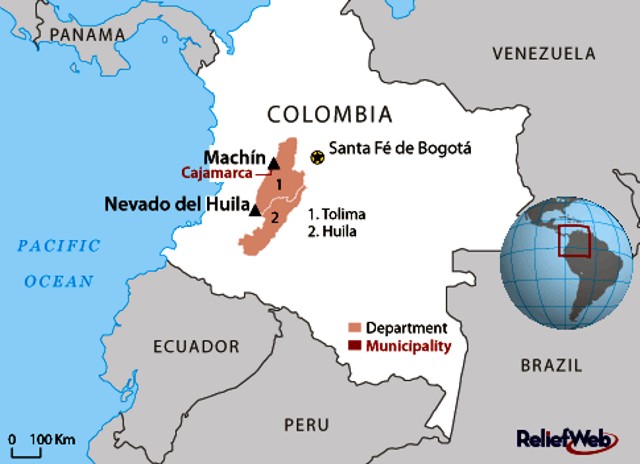 |
Figure 1. Map of Colombia showing the location of the Machín volcano. Note the Departments (states) of Tolima (1) and Huila (2) are shaded regions. Courtesy of the IFRC and Relief Web. |
Machín caldera contains three dacitic domes; the 3-km-wide caldera is breached to the S. According to Mendez and others (2002), there have been six eruptions within the past 10,000 years. In the same report, the authors noted geomorphological similarities between Machín and Pinatubo prior to its large 1991 eruption. The seismic events have drawn increased attention to Machín from the Volcanic and Seismological Observatory of Manizales, Colombia Institute of Geology and Mining (INGEOMINAS).
According to news articles published in mid-May 2004, INGEOMINAS reported that there had been an increase in seismicity at Machín in April. About 60 earthquakes were recorded daily (in comparison to the 1-10 earthquakes normally recorded); however, no surface changes were seen at that time at the volcano.
There was no further significant seismic activity until the first week of January 2008 when INGEOMINAS reported unusual seismicity at Machín during 6-8 January. Long-period earthquakes were detected S of the main lava dome. On 7 January, the volcano-tectonic seismic signals were occasionally felt and reported by nearby residents. The simultaneous occurrence of both types of seismic signals was unusual for Machín. Again, the activity diminished to the previous background levels until 9 November when INGEOMINAS reported a cluster of ~375 earthquakes, the majority of which were located towards the E sector and below the dome of the volcano with depths between 2.5 and 5 km. The earthquake activity occurred underneath the central and E parts of the lava dome complex in the summit caldera and fumarolic activity in the area increased. During 8-10 November 2008, Machín registered 1,210 volcano-tectonic earthquakes, 9 of which were M 2.5. According to news articles, approximately 400-450 people evacuated to shelters or other safe areas. There were also reports of landslides that blocked a highway.
Table 1 and figure 2 detail the local villages in proximity to Machín.
Table 1. Villages in proximity to Machín and the respective distances from the caldera (approximate). Taken from web sources such as Google Earth.
| Village/town | Crater distance (km) | Direction |
| El Rodeo | 96 | NNW |
| Santa Marte | 15 | NNE |
| Aguacaliente | 23 | SSW |
| Toche | 62 | NW |
| Cajamarca | 8 | SSW |
| Ibague | 17 | ESE |
| Salento | 24 | NW |
| Circasia | 31 | WNW |
| Calarca | 30 | W |
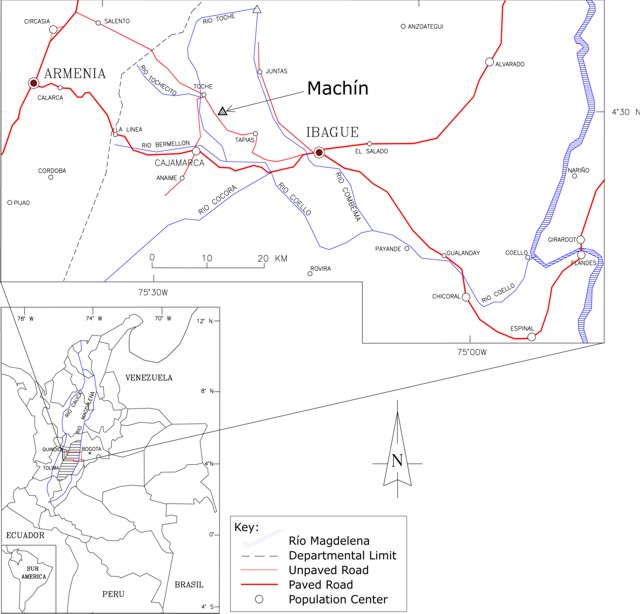 |
Figure 2. A regional map showing population centers and paved and unpaved roads. Courtesy of INGEOMINAS. |
On 10 November the seismic activity of the volcano diminished to background conditions. On 17 December INGEOMINAS reported that a swarm of 98 earthquakes occurred at Machín SE of the lava domes at depths of 2-6 km. The largest earthquake was M 2.6 at a depth of ~4 km.
There were two significant seismic events at Machín during 2009. On 31 July there was in increase in seismic activity, which consisted of ~200 events. Initially the increase was gradual, however, during the last hour the activity increased abruptly and included an earthquake of M 2.7. This subsided to a background level until early December when INGEOMINAS detected 54 earthquakes, some M ~ 1.3. Authorities issued a "Yellow" alert (Yellow; "changes in the behavior of volcanic activity") for Machín. The Tolima Regional Emergency Committee conducted evacuation training with local communities as a precaution.
INGEOMINAS reported that on 24 July 2010 a seismic crisis at Machín was characterized by volcano-tectonic earthquakes. An M 2.6 earthquake was located S of the main lava dome at a depth of ~4 km. The next day an M 4.1 volcano-tectonic earthquake occurred 0.8 km S of the main dome at a depth of ~3.9 km. The Yellow alert remained in effect following the increase in registered seismic activity in the area. On 29 July the number of volcano-tectonic events again increased; the earthquakes were a maximum M 1.7 and between 3 and 4 km depth, S of the main dome.
On 17 September 2010, INGEOMINAS again reported increased seismicity. About 140 volcano-tectonic earthquakes as large as M 1.85 were located S and SW of the main lava dome at depths of 2-4 km. On 4 October there was an M 3.5 tectonic earthquake located 0.37 km S of the main dome at a depth of ~4.14 km. Residents near the volcano felt this earthquake. The Alert Level remained at Yellow.
On 3 December 2010 about 340 volcano-tectonic earthquakes with low magnitudes were located SW of the main lava dome, at an average depth of 4 km. The largest event, a M 3.7 earthquake located SW of the dome at a depth of about 3.5 km, was felt by local residents. On 31 December INGEOMINAS reported a period of increased seismicity. A total of 346 volcano-tectonic events no stronger than M 2.1 were located S and SW of the main lava dome.
On 1 January 2011 seismicity again increased, and at the time of the report, 367 events had been detected. The low-magnitude events were located S and SW of the main dome at depths between 2.5 and 4.5 km. The largest event, M 2.3, was located S of the dome at a depth of about 3.3 km and felt by residents near the volcano and in the municipality of Cajamarca, 8 km SSW. On 13 January an increased number of earthquakes were located to the W and SW of the main dome at depth of 2.5-3.5 km. The largest event registered M ~2.6 and was reported to have been felt by residents near the volcano.
Since 1989, INGEOMINAS noted a gradual increase in seismicity has been following the events closely in order to report any changes on the volcano's activities (figure 3). All the local emergency committees were activated in the area near Machín volcano in addition to the regional emergency committees in Tolima District.
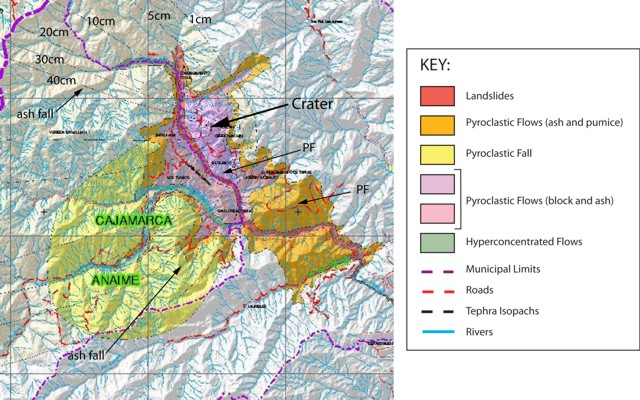 |
Figure 3. Map showing potential hazards from hypothetical future activity at Machín. Thicknesses of potential ash fall to the W are shown (in cm) as modeled by computer-aided dispersion modeling (VAFTAD); PF stands for pyroclastic flow deposits. Adaped from INGEOMINAS (2007). |
References. Méndez, RA; Cortés, GP; and Cepeda, H; [Calvache, ML, Project Chief], 2002, Evaluacíon de la Amenaza Volcánica Potencial del Cerro Machín (Departamento del Tolima, Colombia), Manizales, Sept. 2002, INGEOMINAS, 66 p. (in Spanish).
Méndez, RA, Cortés, GP, and Cepeda, H., 2007, Evaluacíon amenazas potencial de volcan Cerro Machín [Large map in Spanish taken from 2002 report of same name. Name in English, 'Evaluation of potenial hazards from volcan Cerro Machín'] Mapa Amenaza Volcán Machín, INGEOMINAS (URL: http://intranet.ingeominas.gov.co/manizales/images/5/55/MAPA_AMENAZA_VOLCAN_MACHIN.jpg)
Information Contacts: Instituto Colombiano de Geologia y Mineria (INGEOMINAS), Observatorio Vulcanológico y Sismológico de Manizales, Manizales, Colombia; Relief Web (URL: https://reliefweb.int/); International Federation of Red Cross And Red Crescent Societies (IFRC) (URL: http://www.ifrc.org/); Caracol Radio; El Tiempo:Portafolio (URL: http://columbiareports.com).
Monitoring efforts and intermittent shaking from local earthquakes during 2011-2012
Elevated seismicity during January 2011 was discussed in our last report on Cerro Machín volcano (BGVN 36:04). Between September 2010 and January 2011, more than 800 volcano-tectonic (VT) earthquakes were detected per month and local residents reported shaking from these events, particularly during November 2010-February 2011. Here we describe trends in seismicity at Machín from January 2011 to November 2012 and the frequency of seismic swarms. We also include descriptions of monitoring efforts by the Volcanic and Seismological Observatory of Manizales at the Colombia Institute of Geology and Mining (INGEOMINAS) including two field campaigns focused on CO2 emissions from the crater.
Geophysical monitoring. Since January 2011, INGEOMINAS had been monitoring Cerro Machín with a network that included broadband and short-period seismometers, magnetometers, self potential, and an acoustic monitoring system (acoustic flow detection for early flood warning). The deformation network included electronic and dry tilt (longterm monitoring since 2005), and starting in November 2012, three GPS stations were also operating (figure 4). Electronic-distance measurements (EDM) were conducted in 2012 at seven stations (EDM data was available since 2008). Data from these monitoring efforts were available in the INGEOMINAS online technical reports.
|
Figure 4. The deformation monitoring network at Cerro Machín in 2012 included three GPS stations and five electronic tilt stations. EDM measurements in September 2011 used three base stations (San Lorenzo, "SLOR;" La Palma, "PALM;" and Anillo, "ANIL") while measurements in October 2012 relied on one base station (San Lorenzo, "SLOR"). Courtesy of INGEOMINAS. |
Geochemical monitoring. Geochemical monitoring at Cerro Machín has been conducted within the circular crater and the central dome complex (figures 5 and 6). During 2011-2012, geochemical monitoring included diffuse CO2 detection, alkaline traps, and radon monitoring from soil emissions (13 stations were online in November 2012) as well as regular testing at fumarolic and hot spring locations.
|
Figure 5. Geochemical monitoring during 2011-2012 at Cerro Machín included several dozen sampling sites mainly spread across the ~2-km diameter crater. INGEOMINAS released long-term datasets from radon-gas traps, an alkaline trap, and a fumarole in their monthly technical bulletins. Courtesy of INGEOMINAS. |
|
Figure 6. Two aerial views of Cerro Machín were captured during an overflight on 16 November 2011. (Top) In this view of the NE flank of Machín, the crater lake is visible near the left-hand side of the image within a moat-like region surrounding the dome. (Bottom) This view shows an access road along the breached, SW edge of the dome complex (lower center). This view also reveals a glimpse of the crater lake (appears gray) in the distant portion of the moat (right, from center). Courtesy of INGEOMINAS. |
In May and September 2012, INGEOMINAS conducted field surveys to measure diffuse carbon dioxide emissions (figure 7). With a mobile LICOR 820 monitoring device, INGEOMINAS technicians traversed the interior crater rim detecting CO2, air temperature, and pressure. The survey on 28 May determined baseline levels of CO2 flux at 28 points within the crater. The survey conducted during 19 and 20 September 2012 detected relatively high CO2 emissions from seven locations along a traverse within the crater. The highest CO2 fluxes ranged between 739 and 8,077 mol·m-2·day-1, and in their technical report, INGEOMINAS noted that future gas monitoring should focus on those sites with peak values.
|
Figure 7. On 28 May 2012, INGEOMINAS conducted a CO2 campaign within the crater of Cerro Machín. Courtesy of INGEOMINAS. |
Seismicity in 2011. Elevated seismicity in late 2010 continued through early 2011 (BGVN 36:04) and local communities reported shaking in January and February 2011 (figure 8). For many months after May 2011, earthquakes per month had declined to below 400 per month. The clear exception to that trend took place during September 2011, a month with over 1,200 earthquakes.
|
Figure 8. Volcano-tectonic (VT) seismicity at Cerro Machín abruptly increased in September 2010. This histogram shows time on the x-axis and number of earthquakes on the y-axis. Earthquake count per month decreased in January and February 2011 and reached low levels in August. Except for peaks in September and December 2011, the number of earthquakes remained below 400 events per month until November 2012. Courtesy of INGEOMINAS. |
Compared with 2010 activity, fewer seismic swarms were detected in 2011 and in the available record for 2012 (table 2). In 2011, swarms tended to cluster beneath the dome complex and in areas ~2 km S and SE. INGEOMINAS frequently noted earthquake epicenters in an area known as Moralito, a location SE of the volcano near the MRAL GPS station (see figure 4). Deeper earthquakes (frequently at depths between 7 and 18 km) were detected in that region and were attributed to displacements along a fault zone.
Table 2. Seismic swarms detected at Machín during 2010-2012. Days were counted and tallied based on whether one or more swarms occurred. For example, during January-February 2010 there were six swarms recorded. Courtesy of INGEOMINAS.
| Time Period | Days with swarms |
| Jan-Feb 2010 | 6 |
| Mar 2010 | 1 |
| Apr-Jun 2010 | 8 |
| Jul-Dec 2010 | 27 |
| Jan-May 2011 | 14 |
| Aug 2011 | 1 |
| Jan-Apr 2012 | 4 |
| Sep-Oct 2012 | 6 |
Local residents felt shaking from earthquakes in September 2011 when six occurred with magnitudes greater than 2.5. INGEOMINAS reported that this month had the largest combined free-energy release that year. The largest magnitude event of that group was an M 3.6 volcano-tectonic (VT) earthquake detected at 2013 on 12 September. The average depth of the earthquakes was 4.5 km with some events as deep as 13 km. Epicenters were primarily clustered in the area of Moralito (near the MORA seismic station, see figure 9).
|
Figure 9. During September 2011, several moderate-sized earthquakes were located in an area SE of Cerro Machín. Seismic stations are labeled and located at purple squares. Note that the summit of Machín sits ~4 km NW of the clustered earthquakes, near the CIMA seismic station. Courtesy of INGEOMINAS. |
In December 2011, INGEOMINAS reported that rockfall-type seismic signals were detected within the area. A total of 19 signatures were counted on 11 December; some events had durations up to 73 seconds. The largest earthquake that month was an M 2.32 that occurred at 0542 on 1 December.
Seismicity from January to November 2012. Rockfall-type signatures were also recorded in January 2012. These events occurred on 10 January at 1556 and lasted up to 64 seconds. As frequently observed during previous months, VT earthquakes tended to occur beneath the dome, S, and SE in the area of Moralito.
From January to August 2012, seismic swarms occurred intermittently (table 2). Elevated seismicity occurred during April 2012 and was felt by local residents. During this time period, the largest earthquake was an M 2.8 VT detected on 11 April at 0655. In April, VT earthquakes clustered ~1 km S of the dome complex and were ~4 km deep.
During May-August 2012, earthquakes were rarely clustered and occurred at a wide range of depths (0-16 km). In August, several earthquakes were located ~8 km SE of the CIMA station at depths between 12-15 km. The largest earthquake that month was an M 1.45 detected at 2026 on 9 August.
During September-October, seismic swarms occurred on six days (table 2). Local residents in the municipalities of Cajamarca and Ibagué (locations appear in figure 2 of BGVN 36:04) as well as the nearby departments of Quindio, Risaralda, and Caldas reported shaking due to these earthquakes (locations of these districts appear in the regional map of figure 5 in this report). These events were clustered beneath the dome complex at depths between 2 and 5 km. In October, however, relatively large earthquakes were detected in an area ~8 km SE of the dome at depths around 13 km. The largest earthquakes were on 9 September (M 3.6) and on 7 October (M 4.6) prompting INGEOMINAS staff to visit residences and investigate the impact of the events (figure 10). The M 4.6 earthquake was one of several located SE of the dome (near the TAPI seismic station, see figure 9).
|
Figure 10. A visit to areas around Machín by INGEOMINAS staff in order to evaluate the possible damage from seismic unrest that was detected on 7 October 2012. Courtesy of INGEOMINAS. |
In November, INGEOMINAS reported that VT earthquakes continued to occur beneath the dome although at a reduced rate compared to October. Earthquakes tended to occur 2-5 km beneath the dome, and deeper events were detected to the SE at depths between 9 and 15 km. The largest earthquake detected was an M 2.8 on 20 November at 1754. This earthquake was located at a depth of 2.75 km and was ~2 km SW of the dome complex.
Information Contacts: Instituto Colombiano de Geologia y Mineria (INGEOMINAS), Observatorio Vulcanológico y Sismológico de Manizales, Manizales, Colombia (URL: https://www2.sgc.gov.co/volcanes/index.html).
|
|
||||||||||||||||||||||||||
There is data available for 7 confirmed eruptive periods.
1180 ± 150 years Confirmed Eruption (Explosive / Effusive)
| Episode 1 | Eruption (Explosive / Effusive) | |||||||||||||||||||
|---|---|---|---|---|---|---|---|---|---|---|---|---|---|---|---|---|---|---|---|
| 1180 ± 150 years - Unknown | Evidence from Isotopic: 14C (calibrated) | ||||||||||||||||||
|
List of 2 Events for Episode 1
|
|||||||||||||||||||
0750 (?) Confirmed Eruption (Explosive / Effusive)
| Episode 1 | Eruption (Explosive / Effusive) | ||||||||||||||
|---|---|---|---|---|---|---|---|---|---|---|---|---|---|---|
| 0750 (?) - Unknown | Evidence from Isotopic: 14C (uncalibrated) | |||||||||||||
|
List of 1 Events for Episode 1
|
||||||||||||||
0650 BCE (?) Confirmed Eruption (Explosive / Effusive)
| Episode 1 | Eruption (Explosive / Effusive) | ||||||||||||||||||||||||
|---|---|---|---|---|---|---|---|---|---|---|---|---|---|---|---|---|---|---|---|---|---|---|---|---|
| 0650 BCE (?) - Unknown | Evidence from Isotopic: 14C (uncalibrated) | |||||||||||||||||||||||
|
List of 3 Events for Episode 1
|
||||||||||||||||||||||||
2100 BCE ± 200 years Confirmed Eruption (Explosive / Effusive)
| Episode 1 | Eruption (Explosive / Effusive) | ||||||||||||||||||||||||
|---|---|---|---|---|---|---|---|---|---|---|---|---|---|---|---|---|---|---|---|---|---|---|---|---|
| 2100 BCE ± 200 years - Unknown | Evidence from Isotopic: 14C (calibrated) | |||||||||||||||||||||||
|
List of 3 Events for Episode 1
|
||||||||||||||||||||||||
2240 BCE ± 300 years Confirmed Eruption (Explosive / Effusive)
| Episode 1 | Eruption (Explosive / Effusive) | ||||||||||||||||||||||||
|---|---|---|---|---|---|---|---|---|---|---|---|---|---|---|---|---|---|---|---|---|---|---|---|---|
| 2240 BCE ± 300 years - Unknown | Evidence from Isotopic: 14C (calibrated) | |||||||||||||||||||||||
|
List of 3 Events for Episode 1
|
||||||||||||||||||||||||
2650 BCE (?) Confirmed Eruption (Explosive / Effusive)
| Episode 1 | Eruption (Explosive / Effusive) | ||||||||||||||
|---|---|---|---|---|---|---|---|---|---|---|---|---|---|---|
| 2650 BCE (?) - Unknown | Evidence from Isotopic: 14C (uncalibrated) | |||||||||||||
|
List of 1 Events for Episode 1
|
||||||||||||||
3800 BCE ± 150 years Confirmed Eruption (Explosive / Effusive)
| Episode 1 | Eruption (Explosive / Effusive) | ||||||||||||||||||||||||
|---|---|---|---|---|---|---|---|---|---|---|---|---|---|---|---|---|---|---|---|---|---|---|---|---|
| 3800 BCE ± 150 years - Unknown | Evidence from Isotopic: 14C (calibrated) | |||||||||||||||||||||||
|
List of 3 Events for Episode 1
|
||||||||||||||||||||||||
This compilation of synonyms and subsidiary features may not be comprehensive. Features are organized into four major categories: Cones, Craters, Domes, and Thermal Features. Synonyms of features appear indented below the primary name. In some cases additional feature type, elevation, or location details are provided.
Synonyms |
| Cerro Machín |
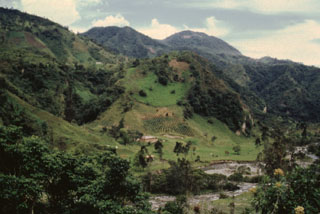 The terraces along the Toche River are composed of thick pyroclastic flow deposits produced during Holocene explosive eruptions of Cerro Machín. The summit lava domes are seen on the horizon in this view from the NNW. This small but explosive volcano is located at the southern end of the Ruiz-Tolima massif.
 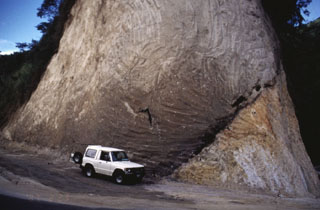 A road cut exposes a pyroclastic flow deposit (left) overlying older granite (lower right). The dark zone dipping away from the front of the jeep, at the base of the pyroclastic flow deposit, are trees charred by the hot pyroclastic flow. This site is located along the road that connects the cities of Ibague and Cajamarco, close to the town of El Boqueron, about 12 km from Cerro Machín volcano.
 Two central lava domes of Cerro Machín volcano are seen here from the SW. A 3-km-wide caldera, whose rim is the horizontal change in slope across the center of the photo, opens towards the south. Late-Holocene eruptions produced block-and-ash flows that traveled to the west and south, beyond the caldera. Deposits from some of these eruptions form the eroded slopes in the lower part of the photo along the valley of the Toche River.
There are no samples for Machín in the Smithsonian's NMNH Department of Mineral Sciences Rock and Ore collection.
| Copernicus Browser | The Copernicus Browser replaced the Sentinel Hub Playground browser in 2023, to provide access to Earth observation archives from the Copernicus Data Space Ecosystem, the main distribution platform for data from the EU Copernicus missions. |
| MIROVA | Middle InfraRed Observation of Volcanic Activity (MIROVA) is a near real time volcanic hot-spot detection system based on the analysis of MODIS (Moderate Resolution Imaging Spectroradiometer) data. In particular, MIROVA uses the Middle InfraRed Radiation (MIR), measured over target volcanoes, in order to detect, locate and measure the heat radiation sourced from volcanic activity. |
| MODVOLC Thermal Alerts | Using infrared satellite Moderate Resolution Imaging Spectroradiometer (MODIS) data, scientists at the Hawai'i Institute of Geophysics and Planetology, University of Hawai'i, developed an automated system called MODVOLC to map thermal hot-spots in near real time. For each MODIS image, the algorithm automatically scans each 1 km pixel within it to check for high-temperature hot-spots. When one is found the date, time, location, and intensity are recorded. MODIS looks at every square km of the Earth every 48 hours, once during the day and once during the night, and the presence of two MODIS sensors in space allows at least four hot-spot observations every two days. Each day updated global maps are compiled to display the locations of all hot spots detected in the previous 24 hours. There is a drop-down list with volcano names which allow users to 'zoom-in' and examine the distribution of hot-spots at a variety of spatial scales. |
|
WOVOdat
Single Volcano View Temporal Evolution of Unrest Side by Side Volcanoes |
WOVOdat is a database of volcanic unrest; instrumentally and visually recorded changes in seismicity, ground deformation, gas emission, and other parameters from their normal baselines. It is sponsored by the World Organization of Volcano Observatories (WOVO) and presently hosted at the Earth Observatory of Singapore.
GVMID Data on Volcano Monitoring Infrastructure The Global Volcano Monitoring Infrastructure Database GVMID, is aimed at documenting and improving capabilities of volcano monitoring from the ground and space. GVMID should provide a snapshot and baseline view of the techniques and instrumentation that are in place at various volcanoes, which can be use by volcano observatories as reference to setup new monitoring system or improving networks at a specific volcano. These data will allow identification of what monitoring gaps exist, which can be then targeted by remote sensing infrastructure and future instrument deployments. |
| Volcanic Hazard Maps | The IAVCEI Commission on Volcanic Hazards and Risk has a Volcanic Hazard Maps database designed to serve as a resource for hazard mappers (or other interested parties) to explore how common issues in hazard map development have been addressed at different volcanoes, in different countries, for different hazards, and for different intended audiences. In addition to the comprehensive, searchable Volcanic Hazard Maps Database, this website contains information about diversity of volcanic hazard maps, illustrated using examples from the database. This site is for educational purposes related to volcanic hazard maps. Hazard maps found on this website should not be used for emergency purposes. For the most recent, official hazard map for a particular volcano, please seek out the proper institutional authorities on the matter. |
| IRIS seismic stations/networks | Incorporated Research Institutions for Seismology (IRIS) Data Services map showing the location of seismic stations from all available networks (permanent or temporary) within a radius of 0.18° (about 20 km at mid-latitudes) from the given location of Machín. Users can customize a variety of filters and options in the left panel. Note that if there are no stations are known the map will default to show the entire world with a "No data matched request" error notice. |
| UNAVCO GPS/GNSS stations | Geodetic Data Services map from UNAVCO showing the location of GPS/GNSS stations from all available networks (permanent or temporary) within a radius of 20 km from the given location of Machín. Users can customize the data search based on station or network names, location, and time window. Requires Adobe Flash Player. |
| DECADE Data | The DECADE portal, still in the developmental stage, serves as an example of the proposed interoperability between The Smithsonian Institution's Global Volcanism Program, the Mapping Gas Emissions (MaGa) Database, and the EarthChem Geochemical Portal. The Deep Earth Carbon Degassing (DECADE) initiative seeks to use new and established technologies to determine accurate global fluxes of volcanic CO2 to the atmosphere, but installing CO2 monitoring networks on 20 of the world's 150 most actively degassing volcanoes. The group uses related laboratory-based studies (direct gas sampling and analysis, melt inclusions) to provide new data for direct degassing of deep earth carbon to the atmosphere. |
| Large Eruptions of Machín | Information about large Quaternary eruptions (VEI >= 4) is cataloged in the Large Magnitude Explosive Volcanic Eruptions (LaMEVE) database of the Volcano Global Risk Identification and Analysis Project (VOGRIPA). |
| EarthChem | EarthChem develops and maintains databases, software, and services that support the preservation, discovery, access and analysis of geochemical data, and facilitate their integration with the broad array of other available earth science parameters. EarthChem is operated by a joint team of disciplinary scientists, data scientists, data managers and information technology developers who are part of the NSF-funded data facility Integrated Earth Data Applications (IEDA). IEDA is a collaborative effort of EarthChem and the Marine Geoscience Data System (MGDS). |

