
Satellite surveys during May 1996-October 2000 indicate subsidence
A satellite-based interferometric synthetic aperture radar (InSAR) survey of the remote central Andes volcanic arc (Pritchard and Simons, 2002) revealed deformation in the Robledo caldera between May 1992 and October 2000 (figure 1). Subsidence was detected, with a maximum deformation rate in the radar line-of-sight of 2-2.5 cm/year. The subsidence rate seemed to be decreasing with time. The inferred source depth was 4.5-6 km below sea level. Additional details about the study and analysis are available in Pritchard and Simons (2002).
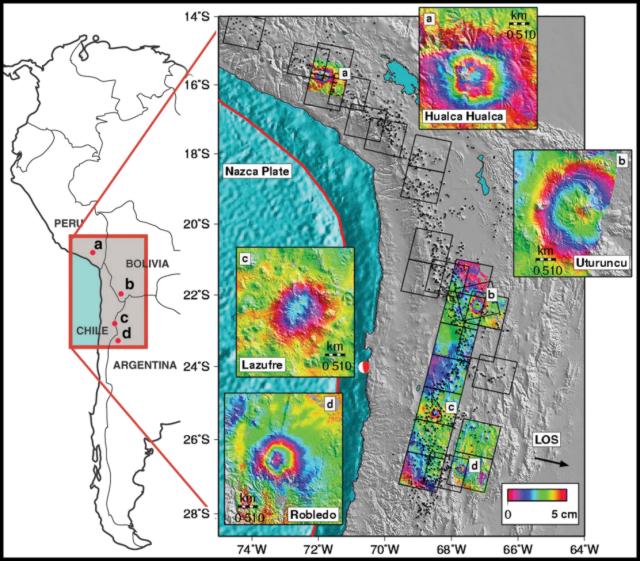 |
Figure 1. Shaded relief topographic map of the central Andes with insets showing areas of deformation detected by Pritchard and Simons (2002). Interferograms (draped over shaded relief) indicate active deformation; each color cycle corresponds to 5 cm of deformation in the radar line-of-sight (LOS). The LOS direction from ground to spacecraft (black arrow) is inclined 23° from the vertical. Black squares indicate radar frames, and black triangles show potential volcanic edifices. Courtesy of Matthew Pritchard. |
Reference. Pritchard, M., and Simons, M., 2002, A satellite geodetic survey of large-scale deformation of volcanic centres in the Central Andes: Nature, v. 418, p. 167-170.
Information Contacts: Matthew Pritchard and Mark Simons, Division of Geological and Planetary Sciences, California Institute of Technology, Pasadena, CA 91125, USA (URL: http://www.gps.caltech.edu/).
The Global Volcanism Program has no Weekly Reports available for Cerro Blanco.
Reports are organized chronologically and indexed below by Month/Year (Publication Volume:Number), and include a one-line summary. Click on the index link or scroll down to read the reports.
Satellite surveys during May 1996-October 2000 indicate subsidence
A satellite-based interferometric synthetic aperture radar (InSAR) survey of the remote central Andes volcanic arc (Pritchard and Simons, 2002) revealed deformation in the Robledo caldera between May 1992 and October 2000 (figure 1). Subsidence was detected, with a maximum deformation rate in the radar line-of-sight of 2-2.5 cm/year. The subsidence rate seemed to be decreasing with time. The inferred source depth was 4.5-6 km below sea level. Additional details about the study and analysis are available in Pritchard and Simons (2002).
|
Figure 1. Shaded relief topographic map of the central Andes with insets showing areas of deformation detected by Pritchard and Simons (2002). Interferograms (draped over shaded relief) indicate active deformation; each color cycle corresponds to 5 cm of deformation in the radar line-of-sight (LOS). The LOS direction from ground to spacecraft (black arrow) is inclined 23° from the vertical. Black squares indicate radar frames, and black triangles show potential volcanic edifices. Courtesy of Matthew Pritchard. |
Reference. Pritchard, M., and Simons, M., 2002, A satellite geodetic survey of large-scale deformation of volcanic centres in the Central Andes: Nature, v. 418, p. 167-170.
Information Contacts: Matthew Pritchard and Mark Simons, Division of Geological and Planetary Sciences, California Institute of Technology, Pasadena, CA 91125, USA (URL: http://www.gps.caltech.edu/).
|
|
||||||||||||||||||||||||||
There is data available for 1 confirmed Holocene eruptive periods.
2300 BCE ± 160 years Confirmed Eruption (Explosive / Effusive) VEI: 7
| Episode 1 | Eruption (Explosive / Effusive) | |||||||||||||||||||||||||||||||||||
|---|---|---|---|---|---|---|---|---|---|---|---|---|---|---|---|---|---|---|---|---|---|---|---|---|---|---|---|---|---|---|---|---|---|---|---|
| 2300 BCE ± 160 years - Unknown | Evidence from Isotopic: 14C (calibrated) | ||||||||||||||||||||||||||||||||||
|
List of 5 Events for Episode 1
|
|||||||||||||||||||||||||||||||||||
This compilation of synonyms and subsidiary features may not be comprehensive. Features are organized into four major categories: Cones, Craters, Domes, and Thermal Features. Synonyms of features appear indented below the primary name. In some cases additional feature type, elevation, or location details are provided.
Craters |
||||
| Feature Name | Feature Type | Elevation | Latitude | Longitude |
| Blanco, Cerro
Robledo |
Caldera | 4100 m | 26° 45' 37.00" S | 67° 44' 29.00" W |
Domes |
||||
| Feature Name | Feature Type | Elevation | Latitude | Longitude |
| Blanco del Robledo, Cerro | Dome | 4670 m | 26° 46' 51.00" S | 67° 45' 26.00" W |
There are no samples for Cerro Blanco in the Smithsonian's NMNH Department of Mineral Sciences Rock and Ore collection.
| Copernicus Browser | The Copernicus Browser replaced the Sentinel Hub Playground browser in 2023, to provide access to Earth observation archives from the Copernicus Data Space Ecosystem, the main distribution platform for data from the EU Copernicus missions. |
| MIROVA | Middle InfraRed Observation of Volcanic Activity (MIROVA) is a near real time volcanic hot-spot detection system based on the analysis of MODIS (Moderate Resolution Imaging Spectroradiometer) data. In particular, MIROVA uses the Middle InfraRed Radiation (MIR), measured over target volcanoes, in order to detect, locate and measure the heat radiation sourced from volcanic activity. |
| MODVOLC Thermal Alerts | Using infrared satellite Moderate Resolution Imaging Spectroradiometer (MODIS) data, scientists at the Hawai'i Institute of Geophysics and Planetology, University of Hawai'i, developed an automated system called MODVOLC to map thermal hot-spots in near real time. For each MODIS image, the algorithm automatically scans each 1 km pixel within it to check for high-temperature hot-spots. When one is found the date, time, location, and intensity are recorded. MODIS looks at every square km of the Earth every 48 hours, once during the day and once during the night, and the presence of two MODIS sensors in space allows at least four hot-spot observations every two days. Each day updated global maps are compiled to display the locations of all hot spots detected in the previous 24 hours. There is a drop-down list with volcano names which allow users to 'zoom-in' and examine the distribution of hot-spots at a variety of spatial scales. |
|
WOVOdat
Single Volcano View Temporal Evolution of Unrest Side by Side Volcanoes |
WOVOdat is a database of volcanic unrest; instrumentally and visually recorded changes in seismicity, ground deformation, gas emission, and other parameters from their normal baselines. It is sponsored by the World Organization of Volcano Observatories (WOVO) and presently hosted at the Earth Observatory of Singapore.
GVMID Data on Volcano Monitoring Infrastructure The Global Volcano Monitoring Infrastructure Database GVMID, is aimed at documenting and improving capabilities of volcano monitoring from the ground and space. GVMID should provide a snapshot and baseline view of the techniques and instrumentation that are in place at various volcanoes, which can be use by volcano observatories as reference to setup new monitoring system or improving networks at a specific volcano. These data will allow identification of what monitoring gaps exist, which can be then targeted by remote sensing infrastructure and future instrument deployments. |
| Volcanic Hazard Maps | The IAVCEI Commission on Volcanic Hazards and Risk has a Volcanic Hazard Maps database designed to serve as a resource for hazard mappers (or other interested parties) to explore how common issues in hazard map development have been addressed at different volcanoes, in different countries, for different hazards, and for different intended audiences. In addition to the comprehensive, searchable Volcanic Hazard Maps Database, this website contains information about diversity of volcanic hazard maps, illustrated using examples from the database. This site is for educational purposes related to volcanic hazard maps. Hazard maps found on this website should not be used for emergency purposes. For the most recent, official hazard map for a particular volcano, please seek out the proper institutional authorities on the matter. |
| IRIS seismic stations/networks | Incorporated Research Institutions for Seismology (IRIS) Data Services map showing the location of seismic stations from all available networks (permanent or temporary) within a radius of 0.18° (about 20 km at mid-latitudes) from the given location of Cerro Blanco. Users can customize a variety of filters and options in the left panel. Note that if there are no stations are known the map will default to show the entire world with a "No data matched request" error notice. |
| UNAVCO GPS/GNSS stations | Geodetic Data Services map from UNAVCO showing the location of GPS/GNSS stations from all available networks (permanent or temporary) within a radius of 20 km from the given location of Cerro Blanco. Users can customize the data search based on station or network names, location, and time window. Requires Adobe Flash Player. |
| DECADE Data | The DECADE portal, still in the developmental stage, serves as an example of the proposed interoperability between The Smithsonian Institution's Global Volcanism Program, the Mapping Gas Emissions (MaGa) Database, and the EarthChem Geochemical Portal. The Deep Earth Carbon Degassing (DECADE) initiative seeks to use new and established technologies to determine accurate global fluxes of volcanic CO2 to the atmosphere, but installing CO2 monitoring networks on 20 of the world's 150 most actively degassing volcanoes. The group uses related laboratory-based studies (direct gas sampling and analysis, melt inclusions) to provide new data for direct degassing of deep earth carbon to the atmosphere. |
| Large Eruptions of Cerro Blanco | Information about large Quaternary eruptions (VEI >= 4) is cataloged in the Large Magnitude Explosive Volcanic Eruptions (LaMEVE) database of the Volcano Global Risk Identification and Analysis Project (VOGRIPA). |
| EarthChem | EarthChem develops and maintains databases, software, and services that support the preservation, discovery, access and analysis of geochemical data, and facilitate their integration with the broad array of other available earth science parameters. EarthChem is operated by a joint team of disciplinary scientists, data scientists, data managers and information technology developers who are part of the NSF-funded data facility Integrated Earth Data Applications (IEDA). IEDA is a collaborative effort of EarthChem and the Marine Geoscience Data System (MGDS). |


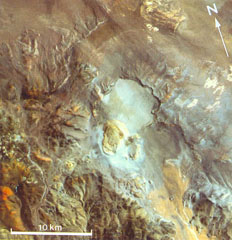 The circular light-colored area in the center of this Thematic Mapper image is the 6-km-wide Robledo caldera. The Cerro Blanco del Robledo rhyolitic lava dome on the southern rim of the caldera was extruded into a pumice cone (pale tones). The margins of pyroclastic flows erupted prior to extrusion of the lava dome are faintly visible on the caldera floor and on the NW flanks of the caldera. Satellite geodetic surveys in the central Andes showed subsidence of Robledo caldera in the 1990s.