On 18 March seismic activity at El Hierro sharply increased. Earthquakes were initially located around the NW tip of the island, at about 20 km depth, then later migrated W about 12-15 km offshore W of El Hierro Island, at similar depth. About 100 earthquakes of Mb 3.5 (body wave measurement) or greater had been located, many of them felt by residents. The biggest events occurred on 29 March (Mb 4.7) and 31 March (Mw 4.6, moment magnitude) both at 20 km depth. IGN's GPS data showed inflation of the island, with maximum deformation at the westernmost station of about 10 cm in the horizontal component and about 11 cm in the vertical. Deformation rates reached a maximum during 23-24 March. An increase in carbon dioxide flux was observed in the W area.
Rockfalls were reported on the steep slopes, especially during 26-29 March. On the evening of 27 March the Plan de Protección Civil por Riesgo Volcánico (PEVOLCA) raised the Volcanic Alert Code for the population to Yellow, and closed the access to the W part of the island.
Source: Instituto Geográfico Nacional (IGN)
Update on submarine eruption
[NOTE: The location shown on the summary page is that for the main summit of Hierro volcano on El Hierro Island. The location of the submarine vent of Hierro that erupted beginning in October 2011 was found to be at latitude 27°37.18' N and longitude 17° 59.58' W.]
In BGVN 36:10 we discussed a submarine eruption of a vent of Hierro volcano that began in early October 2011 S of La Restinga, a town at the southermost tip of El Hierro Island (figure 7). The eruption was preceded by increased seismicity, although this seismicity declined significantly by mid-November 2011 (figures 8 and 9). Based on seismic activity monitored by the Instituto Geográfico Nacional (IGN-National Geographic Institute), authorities for the Canary Islands decided in late March 2012 to shut down the web cameras at La Restinga. Volcanic tremor was still present, although at minimal levels, and some seismicity continued beneath the island. The patch of brown water over the submarine vent (location shown in figure 8) continued to be observed throughout both March and April (figure 10).
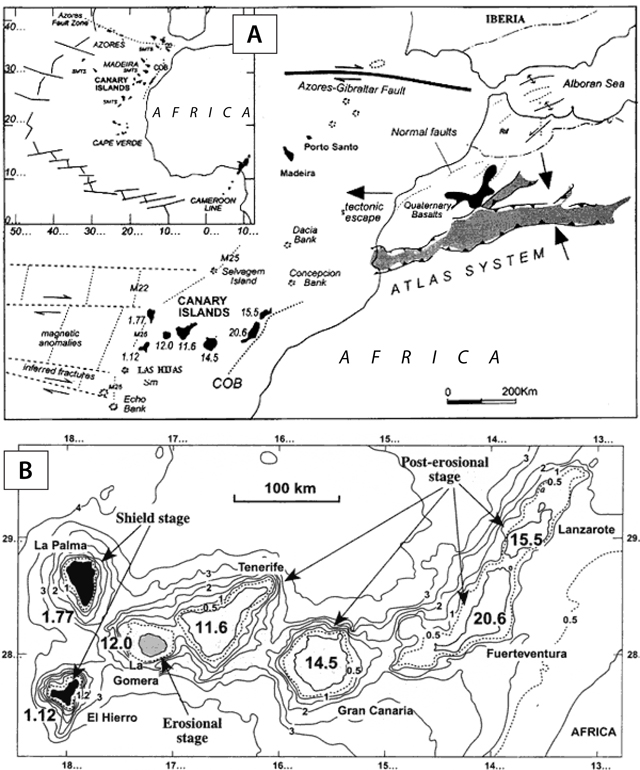 |
Figure 7. Location maps showing the Canary Islands, with volcanoes, and their intra-plate location with respect to plate boundaries. Information on the locations and latest eruptions of the volcanoes is found in table 1. El Hierro Island (and its volcano of the same name) appears on the SW margin of the archipelago. (a) Geographic and geodynamic setting of the NW African continental margin with the Canary Islands; numbers on the Canary Islands show the ages of the oldest surface volcanism, in millions of years before present (Ma). The Canary Islands developed in a geodynamic setting characterized by Jurassic oceanic lithosphere formed during the first stage of opening of the Atlantic at 180-150 Ma and lying close to a passive continental margin on the African plate. The archipelago lies adjacent to a region of intense deformation comprising the Atlas mountains, a part of the Alpine orogenic belt. The intraplate Canary Islands archipelago is within the African plate, bounded by the Azores-Gibralter fault on the north and the mid-Atlantic ridge on the west. (b) Close-up view of the Canary Islands, showing the names of the islands, and the ages of the oldest surface volcanism for each island. Courtesy of Viñuela (2012) and Carracedo and others (2002). |
Table 1. Background information on the six main Canary Islands and their volcanoes. Latest eruption dates are from Siebert and others (2010) and Smithsonian's Global Volcanism Program website. The volcano age indicates date of oldest volcanic rocks of each island (Carracedo and others, 2002).
| Volcano/island name | Location | Summit elevation (m) | Year(s) of latest eruption(s) | Volcano age (Ma) |
| Fuerteventura | 28.358°N 14.02°W | 529 | 1803-05 | 20.6 |
| Gran Canaria | 28.00°N 15.58°W | 1,950 | 1125 | 14.5 |
| Hierro/El Hierro | 27.23°N 18.03°W | 1,500 | 2011-12, 1793 | 1.12 |
| Lanzarote | 29.03°N 13.63°W | 670 | 1824, 1730 | 15.5 |
| La Palma | 28.57°N 17.83°W | 2,426 | 1971, 1949, 1712 | 1.77 |
| Tenerife | 28.271°N 16.641°W | 3,715 | 1909, 1798 | 11.6 |
 |
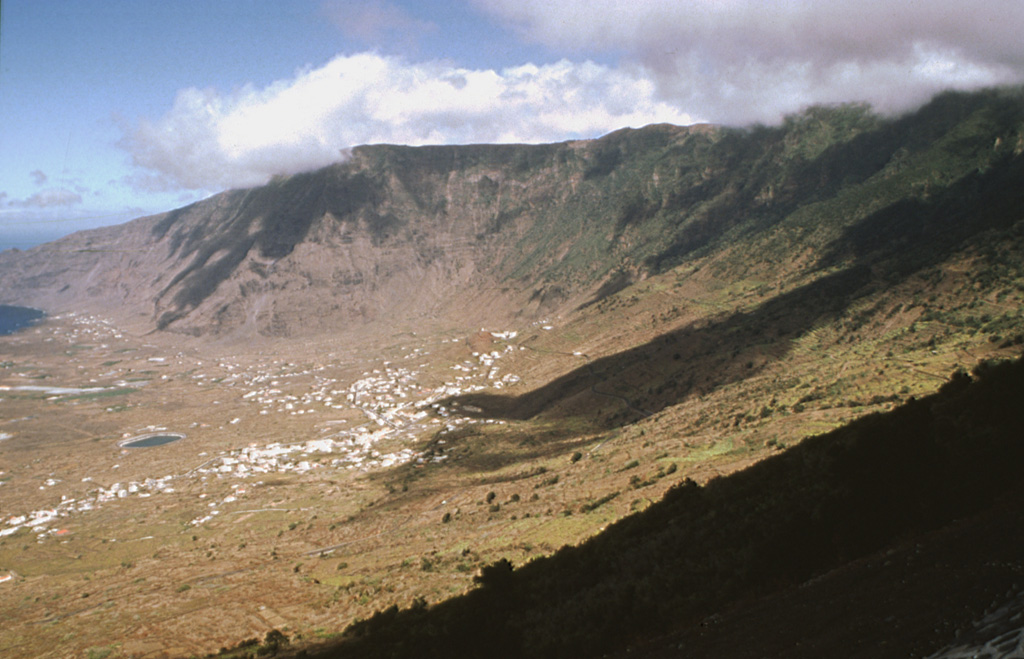
Figure 8. Topographic map of El Hierro Island showing the locations of IGN seismic monitoring stations. A small red triangle offshore of the southernmost tip of the island locates the submarine vent of Hierro that began erupting in October 2011. The pronounced curved form on the N side of the island resulted from lateral collapse; see figure 11b. Courtesy of IGN. |
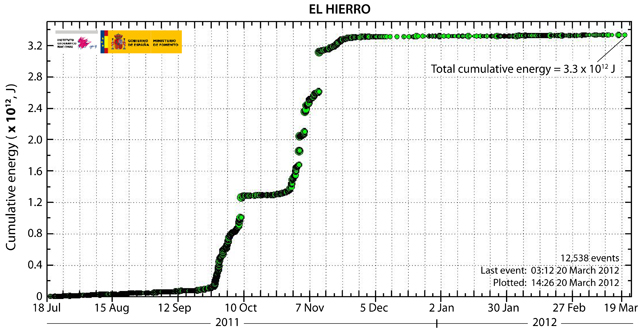 |
Figure 9. Cumulative energy (in joules) based on daily seismic monitoring at El Hierro island from 18 July 2011 through 19 March 2012. The sharp upturn in the curve occurred ~27 September 2011, leveled out ~9 October 2011, resumed to a sharp upturn on ~29 October 2011 to level out again ~21 November 2011. Since that time, the seismic energy has not increased measureably. Courtesy of IGN. |
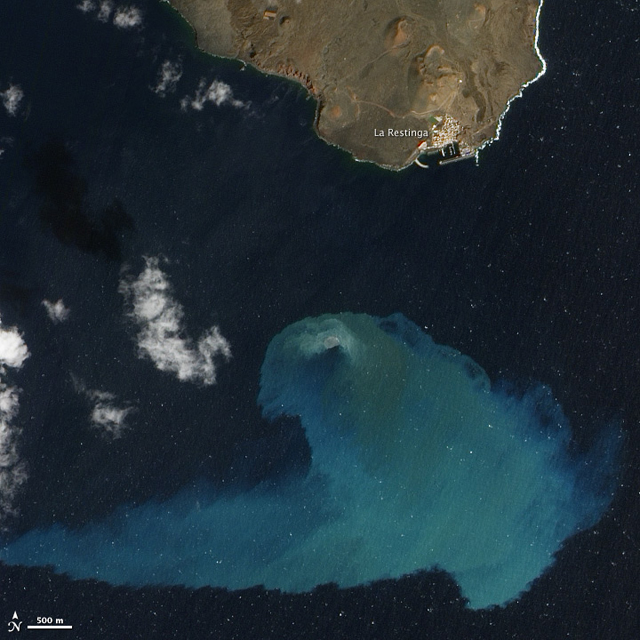 |
Figure 10. A natural-color satellite image collected on 10 February 2012 showed the site of the Hierro submarine vent eruption, offshore from the fishing village of La Restinga. Bright aquamarine-colored water indicated high concentrations of volcanic material in the water above the vent, which lies at a water depth of between 200 and 300 m. A patch of turbulent light brown water on the sea surface indicated the area most strongly affected. This image was acquired by the Advanced Land Imager (ALI) aboard the Earth Observing-1 (EO-1) satellite. NASA Earth Observatory image prepared by Jesse Allen and Robert Simmon, using EO-1 ALI data. |
Bathymetry and water chemistry. For 4 months following the eruption (a period from 22 October 2011 through 26 February 2012), the Instituto Oceanográfico Español (IOE-Spanish Oceanographic Institute) conducted 12 oceanographic cruise legs (called La Campaña Bimbache-Bimbache Campaign; Bimbache refers to native inhabitants of El Hierro), documenting the submarine morphology and water chemistry changes resulting from the eruption. Reports of these cruises on board the research vessel Ramon Margalef are found on the IEO web site; some highlights follow.
During the 7th leg, 8-12 January 2012, IEO scientists found that the volcano's summit was ~130 m below the water surface, 30 m more since its last survey on 2 December 2011. The diameter of the volcano's base was about 800 m, and its height ~200 m above the ocean floor. The total volume of material emitted since the eruption onset in October 2011 to the date of this cruise leg, calculated by bathymetry compared to 1998, was 145 x 106 m3. This volume included a new eruptive cone and associated lava flows. This new material nearly completely covered the W escarpment of the submarine canyon where the eruption was located. It was also found that a split in the top of the cone recorded in the bathymetric survey of 30 November 2011 no longer existed.
During the 9th leg, 6-8 February 2012, Hierro volcano was found to have grown somewhat more in height. The most significant differences between this and the 7th leg (January 2012) occurred at the top of the cone, including a slight increase in the elevation of its summit, which now reached to ~120 m below the water surface, and the emergence of a secondary cone, ~23 m high, attached to the side of the main cone, with a summit depth of 200 m. The emergence of the secondary cone and the greater mass of material on the volcano flank had caused a flattening of the structure. The slope ranged between 25° and 30° on the N flank, with slopes of up to 35° on the E and W flanks.
The 10th leg, 9-13 February 2012, was dedicated to water sampling. Observers found very high levels of hydrogen sulfide (H2.S), with a below normal pH, and very high partial pressure of CO2.
The IEO report of the 11th leg, 23-24 February 2012, notes that the coordinates of the main summit of the new volcano were: latitude 27°37.18' N and longitude 17° 59.58' W.
During a cruise from 5 to 9 April 2012 by researchers from IEO and the University of Las Palmas de Gran Canaria (ULPGC), 19 hydrographic stations were occupied. Data was collected on the physical-chemical properties of the water around the volcano (including temperature, salinity, depth, fluorescence, turbidity, dissolved oxygen, pH, alkalinity, total inorganic carbon, and CO2 partial pressure). The researchers intend to quantify the environmental impact caused by the volcano 7 months after the beginning of the eruption. The physical-chemical properties of the water column in an area of 500 m radius around the submarine volcanic cone where found to be still significantly affected. At this stage, the degassing of the volcano was fundamentally of CO2, with complete absence of sulfur compounds.
Remote submarine vessel observations. The University of Las Palmas de Gran Canaria (ULPGC) web site on 16 March 2012 reported initial filming of the submarine vent using the robot submarine vessel Atlantic Explorer. They reported particles of tephra in the mouth of the still-active vent. At a depth of 120 m, hot jets emerged from a vent, forming converging water convection cells reaching upwards to depths of ~40-60 m. From the same depths, some pyroclastic ejecta were seen in the form of large volcanic bombs. The SW flank of the main volcanic vent cone sloped steeply and was the resting place of many large pyroclastics, some of which are similar to the hollow volcanic bombs (lava balloons) that reached the ocean surface during November and December 2011. Marine life had returned to near the vent, and at a depth of ~170 m and under a rain of ash they observed a school of fish (possibly amberjack).
Geologic setting. Carracedo and others (2012a) provided further details on the geologic setting of El Hierro island and the 2011 vent eruption. They state that "As early as 1793, administrative records of El Hierro indicate that a swarm of earthquakes was felt by locals; fearing a greater volcanic catastrophe, the first evacuation plan of an entire island in the history of the Canaries was prepared. The 1793 eruption was probably submarine... over the next roughly 215 years the island was seismically quiet. Yet seismic and volcanic activity are expected on this youngest Canary Island due to its being directly above the presumed location of the Canary Island hot spot, a mantle plume that feeds upwelling magma just under the surface, similar to the Hawaiian Islands." Currently, roughly 10,000 people live on the island of El Hierro.
The report continued (references have been removed): "El Hierro, 1.12 million years old, is the youngest of the Canary Islands and rests on a nearly 3,500-m-deep ocean bed (figure 11a). According to stratigraphic data, two eruptions are known to have occurred on El Hierro, one ~4,000 years ago at Tanganasoga volcano complex and one 2,500 ± 70 years ago at Montaña Chamuscada cinder cone (figure 11b). The principal configuration of El Hierro is controlled by a three-armed rift zone system. The last stage of growth of El Hierro started some 158,000 years ago, characterized by volcanism that concentrated mainly at the crests of the three-armed rift system."
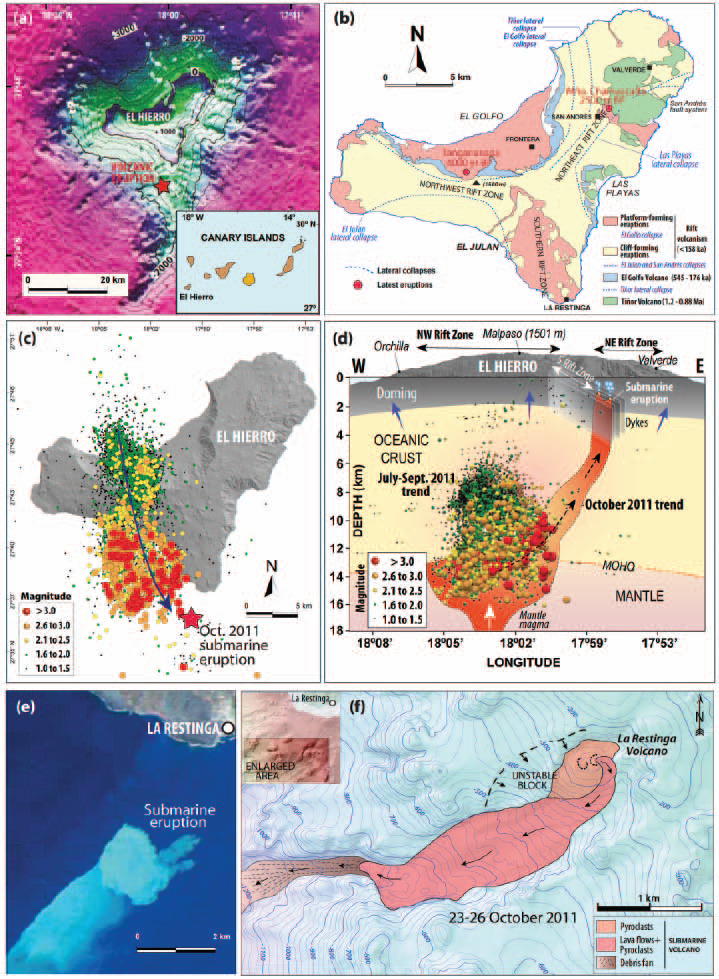 |
Figure 11. El Hierro maps and diagrams to illustrate the setting and context of the 2011 eruption. (a) Location of the submarine vent (red star); image from Masson and others (2002); inset shows the island’s location within the Canary Islands archipelago. (b) Simplified geological map of El Hierro, showcasing two recent eruptions. (c) Epicenter distribution migrating southward, 19 July to 8 October 2011 (data from IGN). (d) Hypocenter depths increased during 3 August to 9 October 2011, and then they became shallower (less than 3 km below sea level). (e) Plume of dissolved magmatic gases and suspended matter from the 11 October 2011 underwater eruption (satellite image by RapidEye); (f) Map of the submarine eruption between 23 and 26 October 2011 (bathymetry from the IEO). Courtesy of Carracedo and others (2012a). |
Carracedo and others (2012a) described the pattern of earthquakes detected by IGN's permanent seismic network. The pattern consisted of an event every few minutes and an average short-period body wave magnitude of about M 1-2. Though the most of these quakes were largely insignificant in terms of seismic hazards, they initially focused N of the island (figure 11c), concentrated within the lower oceanic crust at depths of 8 and 14 km, in agreement with petrological evidence of previous eruptions. The seismic and petrological data are thus in line with a scenario of a magma batch becoming trapped as an intrusion horizon near the base or within the oceanic crust. Shifting seismic foci suggested that magma progressively accumulated and expanded laterally in a southward direction along the southern rift zone, which caused a vertical surface deformation of ~40 mm based on GPS measurements.
The report continues: "Soon after the initial earthquake swarm was observed by the permanent seismometers associated with IGN, efforts were made to mobilize a more complete monitoring seismic and GPS array spaced roughly 2,000 m apart throughout the island. This expanded network, completely installed by September 2011, allowed scientists to follow the progress of the recent activity at El Hierro."
"The new instruments revealed that earthquakes and magma transport remained active but as of the beginning of October 2011 showed no sign of having breached the oceanic crust. Instead, magma continued to move south until, on 9 October, the magma apparently progressed rapidly toward the surface, as indicated by the first-time occurrence of shallow earthquakes (at depths of
"The eruption continued through 15 October, with the appearance of submarine volcanic 'bombs' with cores of white and porous pumice-like material encased in a fine coating of basaltic glass [figure 12; see figure 4 in BGVN 36:10 showing a cross-section view of a bomb]. These bombs are probably xenoliths from pre-island sedimentary rocks that were picked up and heated by the ascending magma, causing them to partially melt and vesiculate." According to Carracedo and others (2012b), "the interiors of these floating rocks are glassy and vesicular (similar to pumice), with frequent mingling between the pumice-like interior and the enveloping basaltic magma. These floating rocks have become known locally as 'restingolites' after the nearby village of La Restinga." Some 'restingolite' samples contain quartz crystals, jasper fragments, gypsum aggregates and carbonate relicts, materials more compatible with sedimentary rocks than with a purely igneous origin for the cores of the floating stones. Figure 13 shows one explanation for the formation these bombs.
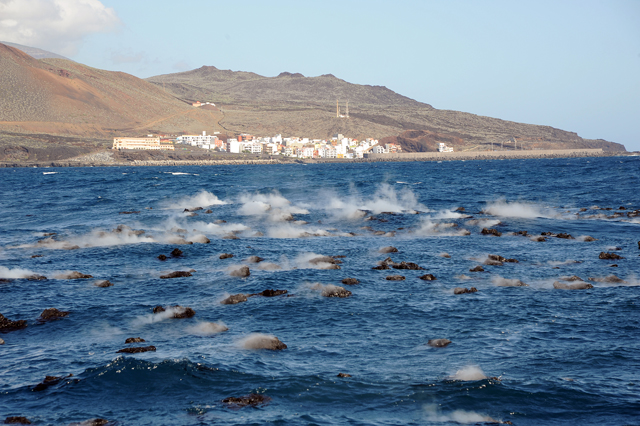 |
Figure 12. Lava fragments ('restingolites') floating on the sea surface about 2 km offshore from La Restinga village on 27 November 2011. At some times a few hundreds of these fragments were present. They arrived at the sea surface at high temperature and, while cooling, they vaporized sea water, suffered intense degassing, and, in some cases broke into small pieces. Courtesy of Alicia Rielo, IGN. |
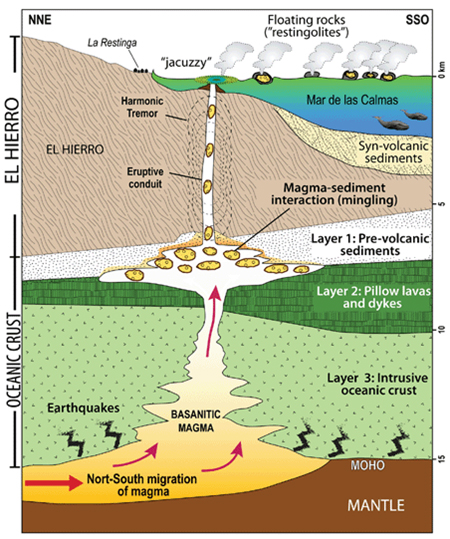 |
Figure 13. Sketch summarizing the inferred structure of El Hierro Island and the 2011 intrusive and extrusive events. Ascending magma that, according to the distribution of seismic events prior to eruption, moved sub-horizontally from N to S in the oceanic crust and contacted pre-volcanic sedimentary rocks. The floating blocks were attributed to magma-sediment interaction beneath the volcano. These blocks, called 'restingolites', were carried toward the ocean floor during eruption, being melted and vesiculated while immersed in magma. Once erupted onto the ocean floor, they separated from the erupting lava and floated on the sea surface due to their high vesicularity and low density (from Troll and others, 2011). Courtesy of Carracedo and others (2012b). |
2012 El Hierro Conference. A conference on the 2011-2012 submarine eruption will take place in the Canary Islands on 10-15 October 2012. The scientific program will cover a broad variety of topics related to volcanic risk management at oceanic island volcanoes and the balance between short-term hazards posed by volcanoes and benefits of volcanism over geologic time.
References. Carracedo, J-C., Perez-Torrado, F-J., Rodriguez-Gonzalez, A., Fernandez-Turiel, J-L., Klügel, A., Troll, V.R., and Wiesmaier, S., 2012a, The ongoing volcanic eruption of El Hierro, Canary Islands, Eos, Transactions, American Geophysical Union, v. 93, no. 9, pp. 89-90.
Carracedo, J.C., Torrado, F.P., González, A.R., Soler, V., Turiel, J.L.F., Troll, V.R., and Wiesmaier, S., 2012b, The 2011 submarine volcanic eruption in El Hierro (Canary Islands), Geology Today, v. 28, issue 2, pp. 53-58.
Carracedo, J.C., 2008, Canarian Volcanoes: La Palma, La Gomera and El Hierro, 213 pp., Editorial Rueda, Madrid.
Carracedo, J.C., Pérez, F.J., Ancochea, E., Meco J., Hernán, F., Cubas C.R., Casillas, R., Rodriguez, E., and Ahijado, A., 2002, Cenozoic volcanism II: The Canary Islands, in: The Geology of Spain, Gibbons, W., and Moreno, T., eds, The Geological Society of London, pp. 439-472.
Carracedo, J.C., Badiola, E.R., Guillou, H.J., de La Nuez, J., and Torrado, F.J.P., 2001, Geology and volcanology of La Palma and El Hierro, western Canaries, Estudios Geológicos, v. 57, no. 5-6, pp. 171-295.
Guillou, H., Carracedo, J.C., Torrado, F.P., and Badiola, E.R., 1996, K-Ar ages and magnetic stratigraphy of a hotspot-induced, fast grown oceanic island: El Hierro, Canary Islands, Journal of Volcanology and Geothermal Research, v. 73, no. 1-2, pp. 141-155.
Masson, D.G., Watts, A.B., Gee, M.J.R., Urgeles, R., Mitchell, N.C., Le Bas, T.P., and Canals, M., 2002, Slope failures on the flanks of the western Canary Islands, Earth-Science Reviews, v. 57, no. 1-2, pp. 1-35.
Siebert, L., Simkin, T., and Kimberly, P., 2010, Volcanoes of the World, Third Edition, Smithsonian Institution, Washington, D.C., and University of California Press, Berkeley, 551 pp.
Troll, V.R., Klügel, A., Longpré, M.-A., Burchardt, S., Deegan, F.M., Carracedo, J.C., Wiesmaier, S., Kueppers, U., Dahren, B., Blythe, L.S., Hansteen, T., Freda, C.D., Budd, A., Jolis, E.M., Jonsson, E., Meade, F., Berg, S., Mancini, L., and Polacci, M., 2011, Floating sandstones off El Hierro (Canary Islands, Spain): the peculiar case of the October 2011 eruption. Solid Earth Discussion, v. 3, pp. 975-999.
Viñuela, J.M., 2012, (online) The Canary Islands Hot Spot, www.mantleplumes.org/Canary.html, updated 21 December 2007, accessed 27 March 2012.
Information Contacts: Alicia Felpeto Rielo, Instituto Geográfico Nacional (IGN), General Ibáñez de Ibero, 3. 28003, Madrid, España (URL: http://www.ign.es/); Volcano Discovery (URL: http://www.volcanodiscovery.com); Earthquake Report (URL: http://www.earthquake-report.com); University of Las Palmas de Gran Canaria (ULPGC) (URL: http://www.ulpgc.es); Canaries News (URL: http://www.canariesnews.com); Instituto Oceanográfico Español (IEO) (URL: htp://www.ieo.es).
2013: March
2012: January
| February
| June
| July
2011: September
| October
| November
| December
On 18 March seismic activity at El Hierro sharply increased. Earthquakes were initially located around the NW tip of the island, at about 20 km depth, then later migrated W about 12-15 km offshore W of El Hierro Island, at similar depth. About 100 earthquakes of Mb 3.5 (body wave measurement) or greater had been located, many of them felt by residents. The biggest events occurred on 29 March (Mb 4.7) and 31 March (Mw 4.6, moment magnitude) both at 20 km depth. IGN's GPS data showed inflation of the island, with maximum deformation at the westernmost station of about 10 cm in the horizontal component and about 11 cm in the vertical. Deformation rates reached a maximum during 23-24 March. An increase in carbon dioxide flux was observed in the W area.
Rockfalls were reported on the steep slopes, especially during 26-29 March. On the evening of 27 March the Plan de Protección Civil por Riesgo Volcánico (PEVOLCA) raised the Volcanic Alert Code for the population to Yellow, and closed the access to the W part of the island.
Source: Instituto Geográfico Nacional (IGN)
Instituto Geográfico Nacional (IGN) reported that during 11-17 July both seismic activity and deformation at El Hierro decreased. There were 87 seismic events located, most of them offshore SW of El Hierro Island at about 20 km depth. Only six earthquakes were M 2.7 or higher, and the maximum magnitude recorded was 3.4, corresponding to two events: 14 July at 1952 and 17 July at 0746. The deformation rate decreased, with maximum values of less than 1 cm in the horizontal components.
Source: Instituto Geográfico Nacional (IGN)
On 11 July Instituto Geográfico Nacional (IGN) reported that seismic activity and deformation at Hierro had decreased since the previous week. During 4-10 July there were 650 seismic events located, most of them offshore SW of El Hierro Island at 20 km depth. The maximum magnitude recorded was 3.8, which occurred on 10 July at 0504, and 77 earthquakes were M 2.7 or higher. The total number of located events had reached more than 2,200 since the anomalous activity began on 24 June. The deformation during this period had maximum values of about 1.5 cm in the horizontal component and 1.5 cm of vertical displacement.
Source: Instituto Geográfico Nacional (IGN)
On the night of 24 June, a M 3.1 earthquake occurred offshore N of El Hierro island at a depth of 20 km. After that event, both the seismic activity and the deformation greatly increased. The seismicity, initially located N of the island in the El Golfo area, migrated S, then later to the W, along the E-W rift zone. On 27 June, the Plan de Protección Civil por Riesgo Volcánico (PEVOLCA) raised the Alert Level to Yellow (on a three-color, traffic-light scale) for areas near El Julan (along the SW coast) and La Dehesa; The Alert Level remained at Green for the rest of the island.
On 28 June, seismicity migrated to the SW in Las Calmas Sea and remained SW of the island, mainly offshore, until 3 July. The depth of the events was concentrated around 20 km. Since 24 June, more than 1,500 events have been located, and more than 250 of those events were M 2.7 and higher and often felt by residents. The biggest event was a M 4.4 that occurred on 2 July at 2242, located offshore SW the island, at 19 km depth. High deformation rates were measured by every GPS station on the island, reaching 8 cm in the horizontal component and about 10 cm of vertical displacement.
Source: Instituto Geográfico Nacional (IGN)
Instituto Geográfico Nacional (IGN) reported that during 29 February-6 March the seismic amplitude detected by every IGN station in El Hierro remained at very low values. Neither water discoloration nor activity was observed on the sea surface over the emission area. On 5 March, the Scientific Committee stated that the submarine eruption was over, but the volcanic process that started on mid July 2011 had not finished. The Canary Islands Government lowered the Volcanic Alert Code from Red to Yellow, maintaining a maritime exclusion zone around the emission area.
Thirty four seismic events were located, most of them in the central part of the island, extending offshore to the S. Depths of the hypocenters varied between 7 and 24 km, and magnitudes were 0.1-2.1 (twenty eight events were magnitudes equal to or greater than 1). One of these events was felt by residents and had a maximum intensity value of II (EMS-98). GPS data did not show persistent trends in any horizontal or vertical components.
Source: Instituto Geográfico Nacional (IGN)
Instituto Geográfico Nacional (IGN) reported that during 22-28 February the seismic amplitude recorded at every IGN station on El Hierro Island remained at very low values. Weak and intermittent discoloration was observed on the sea surface over the emission area. Only once were emitted lava fragments observed during the reported period.
One-hundred and seven seismic events were located, most of them in the central part of the island, with a few extending offshore to the S. Depths of the hypocenters varied between 8 and 20 km and magnitudes between 0.1 and 2.6 (46 events with magnitude 1 or greater). Three events were felt by residents with a maximum intensity value of III (EMS-98). GPS deformation analyses showed a slight trend to N in the stations located at the N of the island.
Source: Instituto Geográfico Nacional (IGN)
Instituto Geográfico Nacional (IGN) reported that during 15-16 February the amplitude of the tremor showed very low values, and after 17 February the tremor signal could not be clearly recognized in the seismic records. Very weak and intermittent discoloration was observed in the emission area. By the end of the reported period, there was no clear instrumental evidence of continuous eruptive activity.
One hundred and thirty-five seismic events were located, most of them in the central part of the island, with offshore events extending to the S. Depths of the hypocenters varied between 6 and 20 km and magnitudes between 0.2 and 2.5 (91 events with a magnitude equal or greater than 1). One event was felt by residents with a maximum intensity value of II (EMS-98). GPS data pointed to a slight uplift in some stations located at the N of the island.
Source: Instituto Geográfico Nacional (IGN)
Instituto Geográfico Nacional (IGN) reported that during 8-14 February the submarine eruption continued S of El Hierro Island. The mean amplitude of the tremor remained low overall, but was variable. Very few emissions of lava fragments were observed over the vent area.
Fifty seven seismic events were registered during this period, most of them located in the central part of the island, with offshore events extending to the S. Depths of the hypocenters varied mainly between 6 and 17 km and magnitudes between 0.6 and 2.2. GPS data pointed to a slight subsidence at some of the stations.
Source: Instituto Geográfico Nacional (IGN)
Instituto Geográfico Nacional (IGN) reported that during 1-7 February the submarine eruption continued S of El Hierro Island. The amplitude of the tremor signal started to increase on 1 February around 0700, maintaining significant values until 6 February, when it dropped again to almost no signal. On 7 February the amplitude values increased for a few hours. Scarce emissions of lava fragments were observed over the vent area.
Fifty seismic events were registered during this period, most of them located in the central part of the island, with offshore events extending mainly to the S. Three of them were felt by residents, with a maximum intensity value of III (EMS-98). Depths of the hypocenters varied between 6 and 23 km, and magnitudes between 0.6 and 3.2.
Source: Instituto Geográfico Nacional (IGN)
Instituto Geográfico Nacional (IGN) reported that during 25-31 January the submarine eruption continued S of El Hierro Island. Mean tremor amplitude maintained very low values during this report period. Frequent and persistent emissions of large steaming lava fragments were observed on the sea surface, some of them about 3 m wide.
Seventy-eight seismic events were registered during this period, most of them located in the central part of the island, with offshore events extending primary to the S. Depths of the hypocenters varied between 10 and 23 km, and magnitudes between 0.4 and 2.8. Analyses of GPS deformation showed stability both in vertical and horizontal components.
Source: Instituto Geográfico Nacional (IGN)
Instituto Geográfico Nacional (IGN) reported that during 18-24 January the submarine eruption continued S of El Hierro Island. Mean tremor amplitude has oscillated considerably since 19 January, including abrupt changes from rather high values to periods of almost no tremor which lasted a few hours. Emissions of large steaming lava fragments were observed every day of this report period.
Thirty-two seismic events were registered during this period, most of them located in the central part of the island, extending offshore to the S, at depths between 8 and 19 km with a maximum magnitude of 2.2. Analyses of GPS deformation showed stability both in vertical and horizontal components.
Source: Instituto Geográfico Nacional (IGN)
Instituto Geográfico Nacional (IGN) reported that during 11-17 January, the submarine eruption continued S of El Hierro Island. The mean amplitude of the tremor moderately increased during the week. Eighteen seismic events were located during this period, two of them felt by residents of the island. Most of the events were grouped in the central part of the island, extending offshore to the S, at depths between 6 and 29 km, with a maximum magnitude of 2.5. Analyses of GPS deformation showed stability both in vertical and horizontal components.
Source: Instituto Geográfico Nacional (IGN)
Instituto Geográfico Nacional (IGN) reported that during 4-10 January, the submarine eruption continued S of El Hierro Island. The mean amplitude of the tremor slightly increased during the week. During this period, large floating lava fragments were observed close to the vent area and generating steam. The production of these fragments was especially intense during 6-8 January.
Nineteen seismic events were located during this period, most of them were grouped in the central part of the island, extending offshore to the S, at depths between 10 and 18 km, with a maximum magnitude of 2.0. GPS data analyses showed little deformation, with a trend to subsidence in the stations at the S of the island.
Source: Instituto Geográfico Nacional (IGN)
Instituto Geográfic Nacional (IGN) reported that during 28 December-3 January, the submarine eruption continued S of El Hierro Island. The tremor signal almost disappeared for a few hours on 28 December, after three hours with pulses every 30 seconds. The tremor amplitude started increasing again at approximately 16:35. Most of the days, large lava fragments and fine material could be observed on the emission area.
Twenty-four seismic events were located during this period, most of them grouped in the central part of the island, extending offshore both to the N and S. The depth of most of these events ranged between 9 and 23 km, with a maximum magnitude of 2.5. GPS data analyses showed very little deformation, with a slight trend to the N in the stations located at the N of the island.
Source: Instituto Geográfico Nacional (IGN)
Instituto Geográfico Nacional (IGN) reported that during 21-27 December the submarine eruption continued S of El Hierro Island. The mean amplitude of the tremor signal remained stable during the week. Twelve seismic events were located during this period, most of them offshore, both to the N and S of the island, at depths between 12 and 26 km with a maximum magnitude of 2.8. GPS deformation data analyses showed stability in the horizontal components and trends to stability in the vertical component.
Source: Instituto Geográfico Nacional (IGN)
Instituto Geográfico Nacional (IGN) reported that during 14-20 December the submarine eruption continued S of El Hierro Island. During the beginning of the week, high-amplitude pulses were registered in the tremor signal every 5-10 minutes. On 15 December there were two long pulses around 7 minutes each, and after the second one the mean tremor amplitude values remained similar to those of previous weeks.
Six seismic events were located during this period, both offshore to the N and inland, at depths between 3 and 22 km. GPS deformation data analyses showed stability in the horizontal components and deflation in the vertical component.
Source: Instituto Geográfico Nacional (IGN)
Instituto Geográfico Nacional (IGN) reported that during 7-13 December the submarine eruption continued S of El Hierro Island, with steaming lava fragments sporadically observed floating on the sea. During this period, the mean tremor amplitude oscillated between decreasing and increasing trends during the first days of the week, and since 10 December high-amplitude pulses occurred every 5-10 minutes.
Only seven seismic events were located during this period, most of them offshore to the N of the island at depths of 17-23 km and with a maximum magnitude of 2.0. GPS data analyses showed stability in the horizontal components and trends to deflation in the vertical component.
Source: Instituto Geográfico Nacional (IGN)
Instituto Geográfico Nacional (IGN) reported that during 30 November-6 December the submarine eruption continued S of El Hierro Island, with lava balloons sporadically observed floating on the sea. During this period, the mean tremor amplitude was similar to the previous week. Twenty-eight seismic events were located, most of them offshore to the N of the island at depths of 15-24 km and with a maximum magnitude of 2.8. Only one of these events was felt by residents at a maximum intensity value of II using EMS-98 (European Macroseismic Scale). GPS data analyses showed stability in the horizontal components; the vertical component at stations located on the S and NE parts of the island showed subsidence.
Source: Instituto Geográfico Nacional (IGN)
Instituto Geográfico Nacional (IGN) reported that during 23-29 November the submarine eruption continued S of El Hierro Island. During this period, the mean amplitude of the tremor showed a slight increase. On 26 November large steaming fragments of lava appeared intermittently floating over the emission center. On 27 November, the emissions were more intense and a few hundred fragments could be observed floating simultaneously, with mean dimensions between 0.5 and 2 m. Some samples of the fragments were collected from a ship near the emission area.
During the period, 121 seismic events were located, most of them offshore to the N of the island at depths of 15-23 km and a maximum magnitude of 3.3. Seven of these events were felt by residents at a maximum intensity value of III using EMS-98 (European Macroseismic Scale). GPS data analyses trended towards stability in the horizontal components, while in the vertical component most of the stations showed subsidence while stations in the NE of the island also trended towards stability.
Source: Instituto Geográfico Nacional (IGN)
Instituto Geográfico Nacional (IGN) reported that during 16-22 November the submarine eruption continued S of El Hierro Island. During this period, the amplitude of the tremor showed two rapid changes, a decrease in amplitude at 2200 on 17 November and an increase at 1710 on 19 November. Seismic amplitudes decreased between late 20 November and mid-day on 21 November, and then remained stable at values similar to those noted during 19-25 October. Superficial activity over the emission center was rare, characterized by alternating days without seawater discoloration and days where there was minor gas and tephra content in the water and persistent discoloration.
During the period, 200 seismic events were located, most of them offshore to the N of the island at depths of 16-23 km and a maximum magnitude of 3.7. Seventeen of these events were felt by residents at a maximum intensity value of III using EMS-98 (European Macroseismic Scale). GPS data analyses showed little deformation in the horizontal components, while in the vertical component stations located in the N of the island showed uplift and the rest showed subsidence.
Source: Instituto Geográfico Nacional (IGN)
Instituto Geográfico Nacional (IGN) reported that during 9-15 November the submarine eruption continued S of El Hierro Island; mean amplitude of tremor was similar to that of the previous week. During the period, 245 seismic events were recorded, most of them located offshore to the N of the island, at depths of 16-23 km. Twenty one of these events were felt by residents at a maximum intensity value of IV-V using EMS-98 (European Macroseismic Scale). The maximum magnitude was 4.6, for an event located 2.5 km offshore to the N at 21 km depth on 11 November, and was the largest of the 11,604 total events detected since 16 July. GPS deformation analysis continued to show different behaviors between N and S stations; N stations showed deformations to the N up to the time of the M 4.6 event, when the deformation then changed to S. Stations located in the S showed deformation trends to the N.
On 9 November, access to two creeks (Tacorón and Punta Naos) in the S of the island was prohibited due to the possibility of significant concentration of volcanic gases. On 14 November, residents of La Restinga were allowed to return to their homes. That same day, many big steaming lava blocks (more than 1 m in diameter) were observed over the submarine emission center.
Source: Instituto Geográfico Nacional (IGN)
Instituto Geográfico Nacional (IGN) reported that during 2-8 November the submarine eruption continued S of El Hierro Island. Tremor amplitude reached higher values than during previous weeks, getting closer to the values detected during 11-12 October, just after the beginning of the eruption. During 3-4 November an increase of the activity could be observed over the submarine emission center, with large circles of light blue color on the sea surface, followed by foam rings and turbulent water with volcanic material. Close to sunset on 5 November, big bubbles rose to the sea surface and ejected sea water and volcanic material a few meters above the water. This activity continued during the following days.
During 2-8 November, 364 seismic events were recorded, most of them located offshore to the N of the island, at depths of 16-23 km. The maximum magnitude was 4.4, and 32 of these events were felt by residents at a maximum intensity value of V using EMS-98 (European Macroseismic Scale). The total number of located events since 17 July was 11,294. GPS deformation analysis showed trends towards no deformation during the first days of the reported period, and a slight trend towards deformation to the S at the stations located on the N side of the island in the last days.
During 4-5 November authorities evacuated about 80 residents from areas in Frontera due to landslide risks from seismic activity. Residents of La Restinga were evacuated on 5 November. According to a news article, ships and aircraft were banned from the area.
Sources: Instituto Geográfico Nacional (IGN); Associated Press; Gobierno de Canaries
Instituto Geográfico Nacional (IGN) reported that during 26 October-1 November tremor continued to be registered by every seismic station on El Hierro Island; 540 seismic events were registered and located, and the mean amplitude increased slightly during the last two days. Most of the events were located offshore to the N of the island, at depths of 16-23 km. The maximum magnitude was 3.9, and 36 of the total events were felt by residents at a maximum intensity value of IV using EMS-98 (European Macroseismic Scale). The total number of located events since 17 July was 10,930.
Preliminary analysis of GPS deformation data showed an inflation-deflation sequence at one station on the N side of the island, with the main deformation trending N-S and in vertical components. GPS stations located in the W and S showed different behavior, with mean deformations to the SW and NE, respectively.
Source: Instituto Geográfico Nacional (IGN)
Instituto Geográfico Nacional (IGN) reported that during 19-25 October tremor continued to be registered by every seismic station on El Hierro Island; 270 seismic events were registered and located. The mean amplitude was lower than during previous days but indicated that the submarine eruption continued. Since 21 October, most of the events were located in the N part of the island, aligned NNW-SSE from the center of the island to around 13 km offshore. Most of these earthquakes occurred around 20-25 km depth. Superficial analysis of GPS deformation data from the last few days of the reporting period showed different behaviors between the stations located at the N of the island and the station located at the S, close to the submarine eruptive vent.
Source: Instituto Geográfico Nacional (IGN)
Instituto Geográfico Nacional (IGN) reported that tremor, registered by every seismic station on El Hierro Island, continued during 12-18 October. Deformation decreased during this period, with significant inflation-deflation episodes registered by the stations located in the NW part of the island. On 12 October, at about 1430, the amplitude of the tremor signals abruptly decreased and smaller amplitudes persisted during the following days. During the afternoon of 12 October a large light-green colored area was observed in the sea to the S of La Restinga village (at the southernmost point of Hierro); the evolution of this anomaly was observed from land and by helicopter. The extension of the anomaly was controlled by the ocean currents, but a small area was detected as the emission center due to its intense discoloration and concentration. During a helicopter flight on 15 October, steamy lava fragments in this small area were observed. In the same area, during 15-17 October, frequent episodes of emission, forming big turbulent rings of gas and foaming, were observed on the sea surface. Since the night of 17 October, the amplitude of the tremor signal had decreased slowly. On 18 October, deformation further decreased and the sea-surface disruption from gases was not observed.
Source: Instituto Geográfico Nacional (IGN)
Instituto Geográfico Nacional (IGN) reported more than 700 new seismic events were detected at Hierro during 4-11 October, 52 of them were felt by residents. A M 4.3 earthquake was detected on 8 October, located 1.5 km from the SW coast of the island at 14 km depth. Following the event, the trend of the superficial deformation changed, suggesting deflation of the system. During the night of 8 October through the following day, low-magnitude seismic events occurred at depths of less than 2 km. Since 0515 on 10 October volcanic tremor was clearly recorded by all of the seismic stations on the island, with highest amplitudes recorded in the southernmost station. All data suggested a submarine eruption.
On 11 October at about 0700 the amplitude of the tremor increased. During that morning residents on the S of the island reported feeling vibrations. After midday, the Government of the Canary Islands raised the Alert Code to Red for Restinga village (at the southernmost point of Hierro) and evacuated the residents. A maritime exclusion zone extended about 4 nautical miles from Restinga.
Source: Instituto Geográfico Nacional (IGN)
Instituto Geográfico Nacional (IGN) reported a drastic increase in the seismic activity at Hierro during 27 September-3 October, with more than 1,100 new seismic events detected, 83 of them felt by residents, with a maximum intensity value of IV using EMS-98 (European Macroseismic Scale). Most of the hypocenters were located offshore, SW of the island, at around 14 km depth. The maximum magnitude recorded during this week was 3.8. The total number of located events had reached more than 9,300 since the anomalous activity began on 16 July. The superficial deformation measured by the GPS network had reached 35 mm.
Source: Instituto Geográfico Nacional (IGN)
Instituto Geográfico Nacional (IGN) reported more than 900 new seismic events at Hierro during 20-26 September, five of them felt by residents. The maximum magnitude recorded was 3.4. The total number of located events had reached more than 8,100 since the anomalous activity began on 16 July. The rates of both GPS deformation and seismic energy release had significantly increased during the previous seven days. On 23 September, the Canarian Autonomous Government raised the Alert Code to Yellow.
Source: Instituto Geográfico Nacional (IGN)
Instituto Geográfico Nacional (IGN) reported more than 900 seismic events at Hierro island during 8-19 September, three of them felt by residents. The total number of located earthquakes had reached more than 7,200 since anomalous activity began on 16 July, with patterns alternating between relatively calm and high-energy periods. The GPS local network showed similar deformation rates compared to previous weeks.
Source: Instituto Geográfico Nacional (IGN)
Instituto Geográfico Nacional (IGN) reported that since 16 July, seismicity at Hierro was high above the background levels. Until 7 September more than 6,200 events had been located, most of them in the El Golfo area with hypocenters that were 10 km deep, all magnitudes were below 3. The seismic activity alternated between relatively calm periods and high-energy periods. GPS local network stations showed deformations of about 2 cm. High rates of carbon dioxide flux were measured in the anomalous area.
Source: Instituto Geográfico Nacional (IGN)
Reports are organized chronologically and indexed below by Month/Year (Publication Volume:Number), and include a one-line summary. Click on the index link or scroll down to read the reports.
Precursors leading to a shallow submarine eruption in 2011
A submarine eruption at Hierro volcano, Canary Islands, Spain, represents the first documented historical activity, although a flank eruption may have occurred in 1793. A satellite photo shows El Hierro island and the sea surface expression of the submarine eruption on 26 October 2011 (figure 1). For clarification, the name "Hierro" refers to the volcano (as listed in the GVP database), while the name "El Hierro" refers to the island constructed by the volcano; this naming convention will be followed in this report. Unless otherwise noted, all data concerning the pre-eruptive and eruptive activity at Hierro was reported by Instituto Geográfico Nacional (IGN).
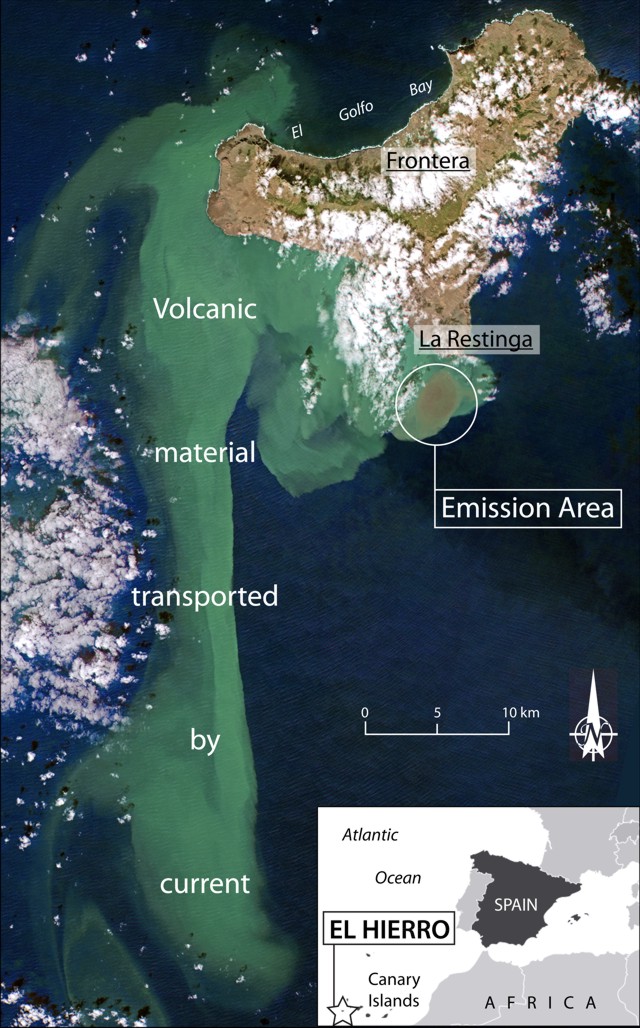 |
Figure 1. Annotated satellite photograph of El Hierro island on 26 October 2011 highlighting the emission area (discolored brown water, circled) and volcanic material transported by ocean currents, appearing light blue-green; settlement names are underlined. (Inset) Geographic location of El Hierro island, in the Canary Islands, off the W coast of Africa. Satellite image courtesy of RapidEye; index map modified from Mapsof.net. |
Pre-eruptive activity. Increased seismicity at El Hierro beginning 16 July 2011 marked the onset of pre-eruptive activity. More than 6,000 seismic events had occurred by the beginning of September; seismic events were less than M 3, and hypocenters were located at ~10 km depth beneath the area of the now-collapsed El Golfo volcano (El Golfo Bay, on the N side of the island; figure 1). The increased seismicity was accompanied by 2 cm of ground inflation and increased CO2 flux over the same time period. Following a significant increase in both seismic energy release rates (figure 2) and ground deformation rates, the Canarian Autonomous Government raised the Alert Level to Yellow on 23 September (on a 3 color scale; Green, Yellow, and Red).
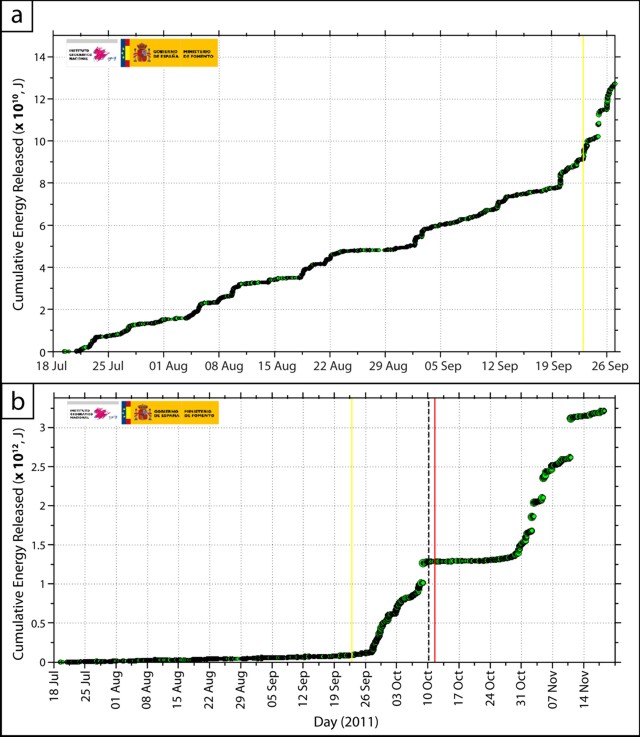 |
Figure 2. Cumulative energy (units of joules) registered by a seismometer monitoring El Hierro. a) Seismicity during 18 July-27 September 2011 highlighting pre-eruptive activity; yellow line indicates the beginning of Yellow Alert Level on 23 September. Slope increase around 20 September indicates increased seismicity. b) Seismicity during 18 July-18 November congruent with eruptive activity; yellow and red lines indicate the beginning of Yellow alert (23 September) and Red alert (11 October); dashed black line indicates the onset of volcanic tremor. Note the change in scale on the y-axis, from 1010 (a) to 1012 (b). Courtesy of Instituto Geográfico Nacional (IGN). |
In the first week of October, seismic hypocenters were located offshore SW of El Hierro island. The next week, an M 4.3 earthquake occurred on 8 October, 1.5 km offshore to the SW, at ~ 14 km depth. This was the largest magnitude precursory seismic event. During 8-9 October, following the 8 October earthquake, ground deformation trends changed, suggesting deflation. Coinciding low magnitude earthquakes occurred at 2 km depth to the SW of the island, and tremor commenced at about 0515 on 10 October, with the highest amplitudes measured at the S-most seismic station. IGN said, "data suggested a submarine eruption."
Red alert due to submarine eruption. At 0700 on 11 October, the amplitude of tremor increased; the same day, the Government of the Canary Islands raised the Alert Level to Red for La Restinga village (figure 1), and residents were evacuated. A maritime exclusion zone was extended to ~4 nautical miles from the coast on the S end of the island.
Within the next week, visual evidence of the eruption was observed. On 12 October, a large area of the ocean to the S of La Restinga village was discolored, and a small, intensely discolored area was identified as the emission area. On 15 October, viewers in a helicopter observed steaming lava fragments floating in the emission area (figures 3 and 4). Further emission episodes occurred as large, turbulent rings of gas or foam reached the sea surface. Contemporaneously, tremor amplitude and deformation decreased, but in the N part of the island, significant inflation-deflation episodes ensued. Seismic activity at the N of the island continued, highlighting a NNW-SSE trend extending ~13 km from the center of the island at 20-25 km depth.
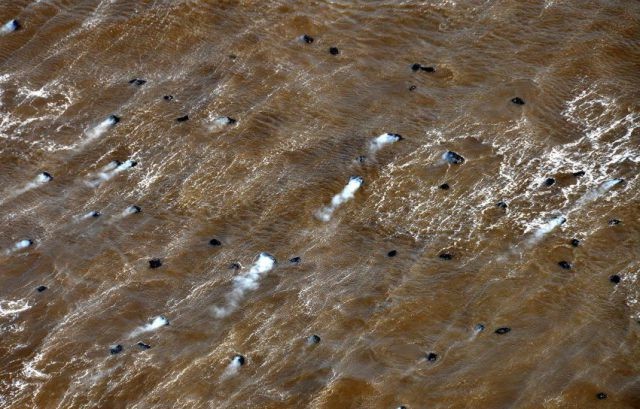 |
Figure 3. Steaming blocks of vesicular lava floating in the ocean after eruption at Hierro on 15 October. The water is discolored from the eruption. Courtesy of Instituto Geográfico Nacional (IGN). |
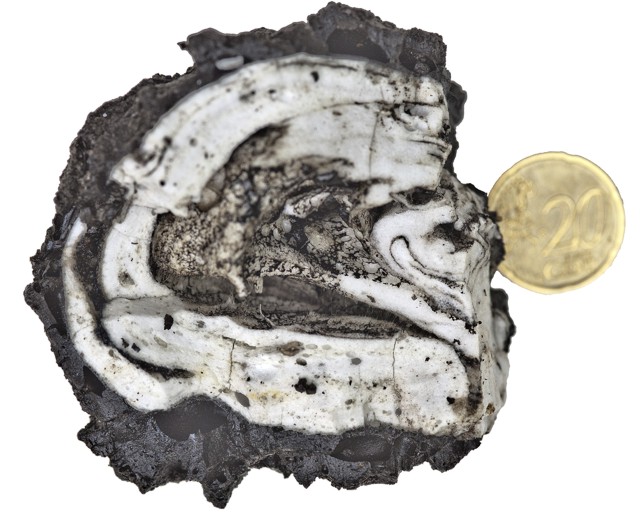 |
Figure 4. Sample of erupted material collected floating on the sea on 18 October 2011; coin for scale. According to Gobierno de Canarias, Plan de Protección Civil por Riesgo Volcánico (PEVOLCA) the pyroclasts were predominantly basalt (black) with lesser amounts of trachyte (white). Courtesy of Instituto Geográfico Nacional (IGN). |
Further emission episodes occurred during early November, with turbulent water, foam rings, and volcanic material again reaching the sea surface (figure 5). On 5 and 8 November, especially large bubbles rose to the surface, and they ejected sea water and volcanic material a few meters above the surface; video footage of this phenomenon was captured by Radio Televisión Canaria (RTVC) on 8 November and other dates.
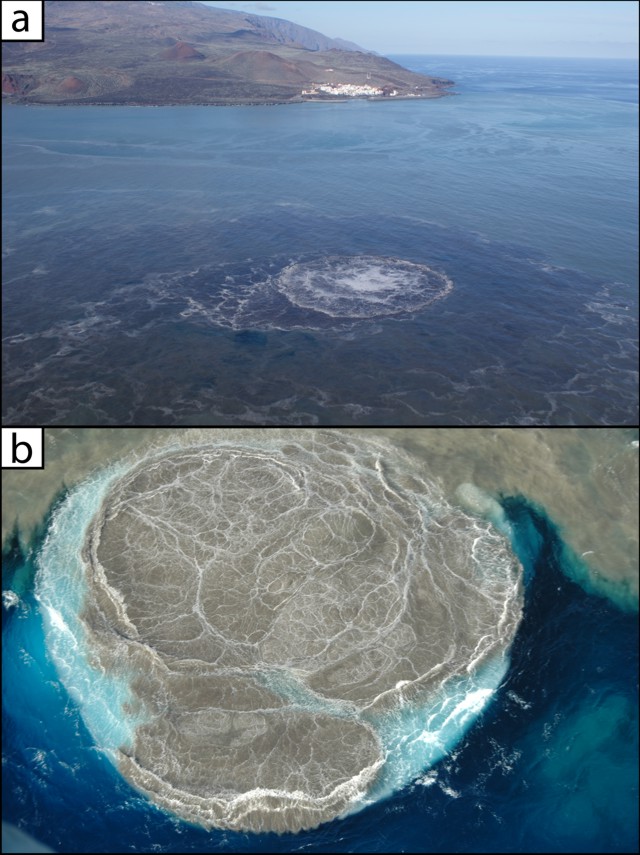 |
Figure 5. Photographs of large gas bubbles and foam reaching the sea surface at Hierro. a) Photograph taken on 8 November 2011, highlighting the proximity of the emission area (bubbles breaching the sea surface in foreground) to the village of La Restinga (background). b) Detail of a breaching gas bubble on 5 November 2011; upper peripheral parts of the image show intensely discolored seawater as compared with relatively uncontaminated seawater seen in the bottom peripheral parts of the image. Both photographs taken from helicopter flights. Courtesy of Instituto Geográfico Nacional (IGN). |
Increasing seismicity included an M 4.4 earthquake on 5 November (the eruptive episode's largest as of 8 November). The "Plan de Protección Civil por Riesgo Volcánico" (PEVOLCA) required the evacuation of 51 residents from the settlement Frontera (figure 1) due to landslide risks, and the evacuation of about 200 residents from La Restinga. On 14 November, authorities allowed residents of La Restinga to return to their homes, but children were to attend school in another town, El Pinar. Two buses remained in La Restinga for re-evacuation use, if necessary.
Lava composition, eruption rate, sea-water acidity and gas flux; fish kills. The lava erupted by Hierro was reported by Gobierna de Canarias (analyzed by PEVOLCA) to be predominantly basalt with lesser amounts of trachyte (an approximate basalt-to-trachyte ratio of 10:1; figure 4). They reported that the pyroclasts formed from magma mixing at the time of the eruption. They inferred that the lavas were physical mixtures.
According to Gobierno de Canarias, researchers for the Instituto Español de Oceanografia (IEO) acquired underwater Digital Terrain Maps (DTM; figure 6) during 24-28 October, and estimated that, in that short time, the volcano erupted nearly 5.5 x 10⁶ m3 of material. IEO also measured a decrease in seawater pH from 7.97 to 5.45 within 5 m of the sea surface in the area of the eruption. Furthermore, Gobierno de Canarias reported that Instituto Tecnológico y de Energías Renovables (ITER) estimated the release of CO2 and H2S into the atmosphere at up to 54 and 36 tons/day, respectively.
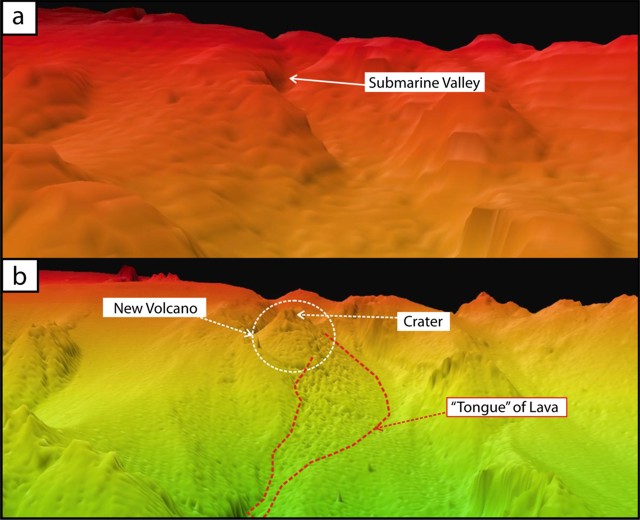 |
Figure 6. Underwater Digital Terrain Maps (DTM) a) acquired in 1998 and b) 24 October 2011, collectively highlighting morphologic changes in the submarine vent area offshore of El Hierro island. Further DTMs acquired through 28 October 2011 allowed the Instituto Español de Oceanografia (IEO) to estimate the mass eruption rate to be nearly 5.5 million m3 of material during 24-28 October. Courtesy of IEO. |
RTVC reported the death of fish that could not escape the eruption. IGN stated that "Preliminary reports of analyses... suggest that the cause of fish kills is related to the ongoing volcanic processes."
Editor's note: As this issue went to press, the Instituto Volcanologico de Canarias (INVOLCAN) announced a new video channel (Youtube, 2011).
Reference: Instituto Volcanologico de Canarias (INVOLCAN), 2011, Submarine eruption at El Hierro, Canary Islands (Spain), YouTube Video Channel (URL: http://www.youtube.com/user/INVOLCAN).
Information Contacts: Instituto Geográfico Nacional (IGN), C/ General Ibáñez de Ibero, 3. 28003, Madrid, España (URL: http://www. ign.es/); RapidEye, RapidEye AG, Molkenmarkt 30, 14776 Brandenburg an der Havel, Germany (URL: http://www.rapideye.de/); Mapsof.net (URL: http://mapsof.net/); Radio Televisión Canaria (URL: http://rtvc.es/); Gobierno de Canarias (URL: http://www.gobiernodecanarias.org/); Instituto Español de Oceanografia (IEO) (URL: http://www.ieo.es/).
Update on submarine eruption
[NOTE: The location shown on the summary page is that for the main summit of Hierro volcano on El Hierro Island. The location of the submarine vent of Hierro that erupted beginning in October 2011 was found to be at latitude 27°37.18' N and longitude 17° 59.58' W.]
In BGVN 36:10 we discussed a submarine eruption of a vent of Hierro volcano that began in early October 2011 S of La Restinga, a town at the southermost tip of El Hierro Island (figure 7). The eruption was preceded by increased seismicity, although this seismicity declined significantly by mid-November 2011 (figures 8 and 9). Based on seismic activity monitored by the Instituto Geográfico Nacional (IGN-National Geographic Institute), authorities for the Canary Islands decided in late March 2012 to shut down the web cameras at La Restinga. Volcanic tremor was still present, although at minimal levels, and some seismicity continued beneath the island. The patch of brown water over the submarine vent (location shown in figure 8) continued to be observed throughout both March and April (figure 10).
|
Figure 7. Location maps showing the Canary Islands, with volcanoes, and their intra-plate location with respect to plate boundaries. Information on the locations and latest eruptions of the volcanoes is found in table 1. El Hierro Island (and its volcano of the same name) appears on the SW margin of the archipelago. (a) Geographic and geodynamic setting of the NW African continental margin with the Canary Islands; numbers on the Canary Islands show the ages of the oldest surface volcanism, in millions of years before present (Ma). The Canary Islands developed in a geodynamic setting characterized by Jurassic oceanic lithosphere formed during the first stage of opening of the Atlantic at 180-150 Ma and lying close to a passive continental margin on the African plate. The archipelago lies adjacent to a region of intense deformation comprising the Atlas mountains, a part of the Alpine orogenic belt. The intraplate Canary Islands archipelago is within the African plate, bounded by the Azores-Gibralter fault on the north and the mid-Atlantic ridge on the west. (b) Close-up view of the Canary Islands, showing the names of the islands, and the ages of the oldest surface volcanism for each island. Courtesy of Viñuela (2012) and Carracedo and others (2002). |
Table 1. Background information on the six main Canary Islands and their volcanoes. Latest eruption dates are from Siebert and others (2010) and Smithsonian's Global Volcanism Program website. The volcano age indicates date of oldest volcanic rocks of each island (Carracedo and others, 2002).
| Volcano/island name | Location | Summit elevation (m) | Year(s) of latest eruption(s) | Volcano age (Ma) |
| Fuerteventura | 28.358°N 14.02°W | 529 | 1803-05 | 20.6 |
| Gran Canaria | 28.00°N 15.58°W | 1,950 | 1125 | 14.5 |
| Hierro/El Hierro | 27.23°N 18.03°W | 1,500 | 2011-12, 1793 | 1.12 |
| Lanzarote | 29.03°N 13.63°W | 670 | 1824, 1730 | 15.5 |
| La Palma | 28.57°N 17.83°W | 2,426 | 1971, 1949, 1712 | 1.77 |
| Tenerife | 28.271°N 16.641°W | 3,715 | 1909, 1798 | 11.6 |
|
Figure 8. Topographic map of El Hierro Island showing the locations of IGN seismic monitoring stations. A small red triangle offshore of the southernmost tip of the island locates the submarine vent of Hierro that began erupting in October 2011. The pronounced curved form on the N side of the island resulted from lateral collapse; see figure 11b. Courtesy of IGN. |
|
Figure 9. Cumulative energy (in joules) based on daily seismic monitoring at El Hierro island from 18 July 2011 through 19 March 2012. The sharp upturn in the curve occurred ~27 September 2011, leveled out ~9 October 2011, resumed to a sharp upturn on ~29 October 2011 to level out again ~21 November 2011. Since that time, the seismic energy has not increased measureably. Courtesy of IGN. |
|
Figure 10. A natural-color satellite image collected on 10 February 2012 showed the site of the Hierro submarine vent eruption, offshore from the fishing village of La Restinga. Bright aquamarine-colored water indicated high concentrations of volcanic material in the water above the vent, which lies at a water depth of between 200 and 300 m. A patch of turbulent light brown water on the sea surface indicated the area most strongly affected. This image was acquired by the Advanced Land Imager (ALI) aboard the Earth Observing-1 (EO-1) satellite. NASA Earth Observatory image prepared by Jesse Allen and Robert Simmon, using EO-1 ALI data. |
Bathymetry and water chemistry. For 4 months following the eruption (a period from 22 October 2011 through 26 February 2012), the Instituto Oceanográfico Español (IOE-Spanish Oceanographic Institute) conducted 12 oceanographic cruise legs (called La Campaña Bimbache-Bimbache Campaign; Bimbache refers to native inhabitants of El Hierro), documenting the submarine morphology and water chemistry changes resulting from the eruption. Reports of these cruises on board the research vessel Ramon Margalef are found on the IEO web site; some highlights follow.
During the 7th leg, 8-12 January 2012, IEO scientists found that the volcano's summit was ~130 m below the water surface, 30 m more since its last survey on 2 December 2011. The diameter of the volcano's base was about 800 m, and its height ~200 m above the ocean floor. The total volume of material emitted since the eruption onset in October 2011 to the date of this cruise leg, calculated by bathymetry compared to 1998, was 145 x 106 m3. This volume included a new eruptive cone and associated lava flows. This new material nearly completely covered the W escarpment of the submarine canyon where the eruption was located. It was also found that a split in the top of the cone recorded in the bathymetric survey of 30 November 2011 no longer existed.
During the 9th leg, 6-8 February 2012, Hierro volcano was found to have grown somewhat more in height. The most significant differences between this and the 7th leg (January 2012) occurred at the top of the cone, including a slight increase in the elevation of its summit, which now reached to ~120 m below the water surface, and the emergence of a secondary cone, ~23 m high, attached to the side of the main cone, with a summit depth of 200 m. The emergence of the secondary cone and the greater mass of material on the volcano flank had caused a flattening of the structure. The slope ranged between 25° and 30° on the N flank, with slopes of up to 35° on the E and W flanks.
The 10th leg, 9-13 February 2012, was dedicated to water sampling. Observers found very high levels of hydrogen sulfide (H2.S), with a below normal pH, and very high partial pressure of CO2.
The IEO report of the 11th leg, 23-24 February 2012, notes that the coordinates of the main summit of the new volcano were: latitude 27°37.18' N and longitude 17° 59.58' W.
During a cruise from 5 to 9 April 2012 by researchers from IEO and the University of Las Palmas de Gran Canaria (ULPGC), 19 hydrographic stations were occupied. Data was collected on the physical-chemical properties of the water around the volcano (including temperature, salinity, depth, fluorescence, turbidity, dissolved oxygen, pH, alkalinity, total inorganic carbon, and CO2 partial pressure). The researchers intend to quantify the environmental impact caused by the volcano 7 months after the beginning of the eruption. The physical-chemical properties of the water column in an area of 500 m radius around the submarine volcanic cone where found to be still significantly affected. At this stage, the degassing of the volcano was fundamentally of CO2, with complete absence of sulfur compounds.
Remote submarine vessel observations. The University of Las Palmas de Gran Canaria (ULPGC) web site on 16 March 2012 reported initial filming of the submarine vent using the robot submarine vessel Atlantic Explorer. They reported particles of tephra in the mouth of the still-active vent. At a depth of 120 m, hot jets emerged from a vent, forming converging water convection cells reaching upwards to depths of ~40-60 m. From the same depths, some pyroclastic ejecta were seen in the form of large volcanic bombs. The SW flank of the main volcanic vent cone sloped steeply and was the resting place of many large pyroclastics, some of which are similar to the hollow volcanic bombs (lava balloons) that reached the ocean surface during November and December 2011. Marine life had returned to near the vent, and at a depth of ~170 m and under a rain of ash they observed a school of fish (possibly amberjack).
Geologic setting. Carracedo and others (2012a) provided further details on the geologic setting of El Hierro island and the 2011 vent eruption. They state that "As early as 1793, administrative records of El Hierro indicate that a swarm of earthquakes was felt by locals; fearing a greater volcanic catastrophe, the first evacuation plan of an entire island in the history of the Canaries was prepared. The 1793 eruption was probably submarine... over the next roughly 215 years the island was seismically quiet. Yet seismic and volcanic activity are expected on this youngest Canary Island due to its being directly above the presumed location of the Canary Island hot spot, a mantle plume that feeds upwelling magma just under the surface, similar to the Hawaiian Islands." Currently, roughly 10,000 people live on the island of El Hierro.
The report continued (references have been removed): "El Hierro, 1.12 million years old, is the youngest of the Canary Islands and rests on a nearly 3,500-m-deep ocean bed (figure 11a). According to stratigraphic data, two eruptions are known to have occurred on El Hierro, one ~4,000 years ago at Tanganasoga volcano complex and one 2,500 ± 70 years ago at Montaña Chamuscada cinder cone (figure 11b). The principal configuration of El Hierro is controlled by a three-armed rift zone system. The last stage of growth of El Hierro started some 158,000 years ago, characterized by volcanism that concentrated mainly at the crests of the three-armed rift system."
|
Figure 11. El Hierro maps and diagrams to illustrate the setting and context of the 2011 eruption. (a) Location of the submarine vent (red star); image from Masson and others (2002); inset shows the island’s location within the Canary Islands archipelago. (b) Simplified geological map of El Hierro, showcasing two recent eruptions. (c) Epicenter distribution migrating southward, 19 July to 8 October 2011 (data from IGN). (d) Hypocenter depths increased during 3 August to 9 October 2011, and then they became shallower (less than 3 km below sea level). (e) Plume of dissolved magmatic gases and suspended matter from the 11 October 2011 underwater eruption (satellite image by RapidEye); (f) Map of the submarine eruption between 23 and 26 October 2011 (bathymetry from the IEO). Courtesy of Carracedo and others (2012a). |
Carracedo and others (2012a) described the pattern of earthquakes detected by IGN's permanent seismic network. The pattern consisted of an event every few minutes and an average short-period body wave magnitude of about M 1-2. Though the most of these quakes were largely insignificant in terms of seismic hazards, they initially focused N of the island (figure 11c), concentrated within the lower oceanic crust at depths of 8 and 14 km, in agreement with petrological evidence of previous eruptions. The seismic and petrological data are thus in line with a scenario of a magma batch becoming trapped as an intrusion horizon near the base or within the oceanic crust. Shifting seismic foci suggested that magma progressively accumulated and expanded laterally in a southward direction along the southern rift zone, which caused a vertical surface deformation of ~40 mm based on GPS measurements.
The report continues: "Soon after the initial earthquake swarm was observed by the permanent seismometers associated with IGN, efforts were made to mobilize a more complete monitoring seismic and GPS array spaced roughly 2,000 m apart throughout the island. This expanded network, completely installed by September 2011, allowed scientists to follow the progress of the recent activity at El Hierro."
"The new instruments revealed that earthquakes and magma transport remained active but as of the beginning of October 2011 showed no sign of having breached the oceanic crust. Instead, magma continued to move south until, on 9 October, the magma apparently progressed rapidly toward the surface, as indicated by the first-time occurrence of shallow earthquakes (at depths of
"The eruption continued through 15 October, with the appearance of submarine volcanic 'bombs' with cores of white and porous pumice-like material encased in a fine coating of basaltic glass [figure 12; see figure 4 in BGVN 36:10 showing a cross-section view of a bomb]. These bombs are probably xenoliths from pre-island sedimentary rocks that were picked up and heated by the ascending magma, causing them to partially melt and vesiculate." According to Carracedo and others (2012b), "the interiors of these floating rocks are glassy and vesicular (similar to pumice), with frequent mingling between the pumice-like interior and the enveloping basaltic magma. These floating rocks have become known locally as 'restingolites' after the nearby village of La Restinga." Some 'restingolite' samples contain quartz crystals, jasper fragments, gypsum aggregates and carbonate relicts, materials more compatible with sedimentary rocks than with a purely igneous origin for the cores of the floating stones. Figure 13 shows one explanation for the formation these bombs.
|
Figure 12. Lava fragments ('restingolites') floating on the sea surface about 2 km offshore from La Restinga village on 27 November 2011. At some times a few hundreds of these fragments were present. They arrived at the sea surface at high temperature and, while cooling, they vaporized sea water, suffered intense degassing, and, in some cases broke into small pieces. Courtesy of Alicia Rielo, IGN. |
|
Figure 13. Sketch summarizing the inferred structure of El Hierro Island and the 2011 intrusive and extrusive events. Ascending magma that, according to the distribution of seismic events prior to eruption, moved sub-horizontally from N to S in the oceanic crust and contacted pre-volcanic sedimentary rocks. The floating blocks were attributed to magma-sediment interaction beneath the volcano. These blocks, called 'restingolites', were carried toward the ocean floor during eruption, being melted and vesiculated while immersed in magma. Once erupted onto the ocean floor, they separated from the erupting lava and floated on the sea surface due to their high vesicularity and low density (from Troll and others, 2011). Courtesy of Carracedo and others (2012b). |
2012 El Hierro Conference. A conference on the 2011-2012 submarine eruption will take place in the Canary Islands on 10-15 October 2012. The scientific program will cover a broad variety of topics related to volcanic risk management at oceanic island volcanoes and the balance between short-term hazards posed by volcanoes and benefits of volcanism over geologic time.
References. Carracedo, J-C., Perez-Torrado, F-J., Rodriguez-Gonzalez, A., Fernandez-Turiel, J-L., Klügel, A., Troll, V.R., and Wiesmaier, S., 2012a, The ongoing volcanic eruption of El Hierro, Canary Islands, Eos, Transactions, American Geophysical Union, v. 93, no. 9, pp. 89-90.
Carracedo, J.C., Torrado, F.P., González, A.R., Soler, V., Turiel, J.L.F., Troll, V.R., and Wiesmaier, S., 2012b, The 2011 submarine volcanic eruption in El Hierro (Canary Islands), Geology Today, v. 28, issue 2, pp. 53-58.
Carracedo, J.C., 2008, Canarian Volcanoes: La Palma, La Gomera and El Hierro, 213 pp., Editorial Rueda, Madrid.
Carracedo, J.C., Pérez, F.J., Ancochea, E., Meco J., Hernán, F., Cubas C.R., Casillas, R., Rodriguez, E., and Ahijado, A., 2002, Cenozoic volcanism II: The Canary Islands, in: The Geology of Spain, Gibbons, W., and Moreno, T., eds, The Geological Society of London, pp. 439-472.
Carracedo, J.C., Badiola, E.R., Guillou, H.J., de La Nuez, J., and Torrado, F.J.P., 2001, Geology and volcanology of La Palma and El Hierro, western Canaries, Estudios Geológicos, v. 57, no. 5-6, pp. 171-295.
Guillou, H., Carracedo, J.C., Torrado, F.P., and Badiola, E.R., 1996, K-Ar ages and magnetic stratigraphy of a hotspot-induced, fast grown oceanic island: El Hierro, Canary Islands, Journal of Volcanology and Geothermal Research, v. 73, no. 1-2, pp. 141-155.
Masson, D.G., Watts, A.B., Gee, M.J.R., Urgeles, R., Mitchell, N.C., Le Bas, T.P., and Canals, M., 2002, Slope failures on the flanks of the western Canary Islands, Earth-Science Reviews, v. 57, no. 1-2, pp. 1-35.
Siebert, L., Simkin, T., and Kimberly, P., 2010, Volcanoes of the World, Third Edition, Smithsonian Institution, Washington, D.C., and University of California Press, Berkeley, 551 pp.
Troll, V.R., Klügel, A., Longpré, M.-A., Burchardt, S., Deegan, F.M., Carracedo, J.C., Wiesmaier, S., Kueppers, U., Dahren, B., Blythe, L.S., Hansteen, T., Freda, C.D., Budd, A., Jolis, E.M., Jonsson, E., Meade, F., Berg, S., Mancini, L., and Polacci, M., 2011, Floating sandstones off El Hierro (Canary Islands, Spain): the peculiar case of the October 2011 eruption. Solid Earth Discussion, v. 3, pp. 975-999.
Viñuela, J.M., 2012, (online) The Canary Islands Hot Spot, www.mantleplumes.org/Canary.html, updated 21 December 2007, accessed 27 March 2012.
Information Contacts: Alicia Felpeto Rielo, Instituto Geográfico Nacional (IGN), General Ibáñez de Ibero, 3. 28003, Madrid, España (URL: http://www.ign.es/); Volcano Discovery (URL: http://www.volcanodiscovery.com); Earthquake Report (URL: http://www.earthquake-report.com); University of Las Palmas de Gran Canaria (ULPGC) (URL: http://www.ulpgc.es); Canaries News (URL: http://www.canariesnews.com); Instituto Oceanográfico Español (IEO) (URL: htp://www.ieo.es).
|
|
||||||||||||||||||||||||||||
There is data available for 4 confirmed eruptive periods.
2011 Oct 10 - 2012 Mar 5 Confirmed Eruption (Submarine) VEI: 2
| Episode 1 | Eruption (Submarine) | Submarine S flank, Tagaro cone | |||||||||||||||||||||||||||||||||||||||||||||||||||||||||||||||||||||||||
|---|---|---|---|---|---|---|---|---|---|---|---|---|---|---|---|---|---|---|---|---|---|---|---|---|---|---|---|---|---|---|---|---|---|---|---|---|---|---|---|---|---|---|---|---|---|---|---|---|---|---|---|---|---|---|---|---|---|---|---|---|---|---|---|---|---|---|---|---|---|---|---|---|---|---|
| 2011 Oct 10 - 2012 Mar 5 | Evidence from Observations: Reported | |||||||||||||||||||||||||||||||||||||||||||||||||||||||||||||||||||||||||
|
List of 13 Events for Episode 1 at Submarine S flank, Tagaro cone
|
||||||||||||||||||||||||||||||||||||||||||||||||||||||||||||||||||||||||||
[ 1793 May - 1793 Jun ] Uncertain Eruption
| Episode 1 | Eruption (Explosive / Effusive) | NW rift (Volcán de Lomo Negro)? | |||||||||||||||||||||||||||||||||
|---|---|---|---|---|---|---|---|---|---|---|---|---|---|---|---|---|---|---|---|---|---|---|---|---|---|---|---|---|---|---|---|---|---|---|
| 1793 May - 1793 Jun | Evidence from Unknown | |||||||||||||||||||||||||||||||||
|
List of 5 Events for Episode 1 at NW rift (Volcán de Lomo Negro)?
|
||||||||||||||||||||||||||||||||||
[ 1692 ] Uncertain Eruption
| Episode 1 | Eruption (Explosive / Effusive) | ||||
|---|---|---|---|---|
| 1692 - Unknown | Evidence from Unknown | |||
[ 1677 ] Uncertain Eruption
| Episode 1 | Eruption (Explosive / Effusive) | ||||
|---|---|---|---|---|
| 1677 - Unknown | Evidence from Unknown | |||
0550 BCE ± 75 years Confirmed Eruption (Explosive / Effusive)
| Episode 1 | Eruption (Explosive / Effusive) | Montañas Chamuscada-Entremontañas | |||||||||||||
|---|---|---|---|---|---|---|---|---|---|---|---|---|---|---|
| 0550 BCE ± 75 years - Unknown | Evidence from Isotopic: 14C (uncalibrated) | |||||||||||||
|
List of 1 Events for Episode 1 at Montañas Chamuscada-Entremontañas
|
||||||||||||||
0950 BCE ± 150 years Confirmed Eruption (Explosive / Effusive)
| Episode 1 | Eruption (Explosive / Effusive) | East flank (Soliman) | ||||||||||||||||||||||||||||
|---|---|---|---|---|---|---|---|---|---|---|---|---|---|---|---|---|---|---|---|---|---|---|---|---|---|---|---|---|---|
| 0950 BCE ± 150 years - Unknown | Evidence from Isotopic: 14C (uncalibrated) | ||||||||||||||||||||||||||||
|
List of 4 Events for Episode 1 at East flank (Soliman)
|
|||||||||||||||||||||||||||||
4790 BCE (?) Confirmed Eruption (Explosive / Effusive)
| Episode 1 | Eruption (Explosive / Effusive) | ||||
|---|---|---|---|---|
| 4790 BCE (?) - Unknown | Evidence from Isotopic: 14C (uncalibrated) | |||
This compilation of synonyms and subsidiary features may not be comprehensive. Features are organized into four major categories: Cones, Craters, Domes, and Thermal Features. Synonyms of features appear indented below the primary name. In some cases additional feature type, elevation, or location details are provided.
Synonyms |
||||
| Ferro | ||||
Cones |
||||
| Feature Name | Feature Type | Elevation | Latitude | Longitude |
| Afosa, Montaña de | Pyroclastic cone | 1233 m | 27° 47' 0.00" N | 17° 58' 0.00" W |
| Asomada, Montaña de | Pyroclastic cone | 1371 m | ||
| Asomadas Negras, Montaña | Pyroclastic cone | 169 m | 27° 39' 0.00" N | 17° 58' 0.00" W |
| Campanario, El | Pyroclastic cone | 375 m | ||
| Chamuscada, Montaña | Pyroclastic cone | |||
| Cuevas, Montaña de las | Pyroclastic cone | 748 m | 27° 44' 0.00" N | 18° 7' 0.00" W |
| Entremontanas, Montaña | Pyroclastic cone | |||
| Frailes, Montaña de los | Pyroclastic cone | 1303 m | 27° 45' 0.00" N | 17° 58' 0.00" W |
| Golfo, El | Shield volcano | |||
| Hombre Muerto, Montaña del | Pyroclastic cone | 627 m | 27° 49' 0.00" N | 17° 55' 0.00" W |
| Humilladeros, Montaña de los | Pyroclastic cone | 1284 m | 27° 44' 0.00" N | 18° 5' 0.00" W |
| Jable, Montaña del | Pyroclastic cone | 359 m | 27° 40' 0.00" N | 17° 59' 0.00" W |
| Julan, Montañas de | Pyroclastic cone | 454 m | 27° 40' 0.00" N | 18° 0' 0.00" W |
| Llanillos, Los | Pyroclastic cone | |||
| Lomo Negro, Volcán de | Pyroclastic cone | |||
| Malpaso | Pyroclastic cone | 1500 m | 27° 44' 0.00" N | 18° 2' 0.00" W |
| Mercadel, Montaña de | Pyroclastic cone | 1252 m | 27° 43' 0.00" N | 18° 1' 0.00" W |
| Orchilla, Montaña de | Pyroclastic cone | 207 m | 27° 42' 0.00" N | 18° 9' 0.00" W |
| Restinga | Pyroclastic cone | 197 m | 27° 39' 0.00" N | 17° 59' 0.00" W |
| Rincón de la Cerca, El | Pyroclastic cone | 600 m | ||
| Roque Grande | Pyroclastic cone | 458 m | 27° 40' 0.00" N | 18° 0' 0.00" W |
| Rosas, Montaña de las | Pyroclastic cone | 1108 m | 27° 46' 0.00" N | 17° 57' 0.00" W |
| Sabinosa | Pyroclastic cone | |||
| Soliman | Pyroclastic cone | 1136 m | 27° 47' 0.00" N | 17° 57' 0.00" W |
| Tagaro | Submarine cone | -130 m | 27° 37' 11.00" N | 17° 59' 35.00" W |
| Tanganasoga | Pyroclastic cone | 1380 m | 27° 44' 0.00" N | 18° 3' 0.00" W |
| Tembargena, Montaña | Pyroclastic cone | 897 m | 27° 43' 0.00" N | 18° 7' 0.00" W |
| Tembergena | Pyroclastic cone | 774 m | 27° 41' 0.00" N | 17° 59' 0.00" W |
| Tenaca, Montaña | Pyroclastic cone | 624 m | 27° 44' 0.00" N | 18° 8' 0.00" W |
| Tenerife, Montaña | Pyroclastic cone | 1393 m | 27° 44' 0.00" N | 18° 1' 0.00" W |
| Tenesedra, Montaña | Pyroclastic cone | 571 m | 27° 49' 0.00" N | 17° 56' 0.00" W |
| Tesoro | Pyroclastic cone | 467 m | 27° 49' 0.00" N | 17° 54' 0.00" W |
| Timborombo, Montaña de | Pyroclastic cone | 1326 m | 27° 45' 0.00" N | 17° 58' 0.00" W |
| Tiñor | Shield volcano | |||
| Vina, La | Pyroclastic cone | 454 m | 27° 49' 0.00" N | 17° 59' 0.00" W |
| Virgen, Montaña de la | Pyroclastic cone | 718 m | 27° 44' 0.00" N | 18° 7' 0.00" W |
Craters |
||||
| Feature Name | Feature Type | Elevation | Latitude | Longitude |
| Hoya de Fileba | Crater | 1378 m | 27° 44' 0.00" N | 17° 59' 0.00" W |
| Mareta, Caldera de la | Crater | 1363 m | 27° 45' 0.00" N | 17° 59' 0.00" W |
There are no samples for Hierro in the Smithsonian's NMNH Department of Mineral Sciences Rock and Ore collection.
| Copernicus Browser | The Copernicus Browser replaced the Sentinel Hub Playground browser in 2023, to provide access to Earth observation archives from the Copernicus Data Space Ecosystem, the main distribution platform for data from the EU Copernicus missions. |
| MIROVA | Middle InfraRed Observation of Volcanic Activity (MIROVA) is a near real time volcanic hot-spot detection system based on the analysis of MODIS (Moderate Resolution Imaging Spectroradiometer) data. In particular, MIROVA uses the Middle InfraRed Radiation (MIR), measured over target volcanoes, in order to detect, locate and measure the heat radiation sourced from volcanic activity. |
| MODVOLC Thermal Alerts | Using infrared satellite Moderate Resolution Imaging Spectroradiometer (MODIS) data, scientists at the Hawai'i Institute of Geophysics and Planetology, University of Hawai'i, developed an automated system called MODVOLC to map thermal hot-spots in near real time. For each MODIS image, the algorithm automatically scans each 1 km pixel within it to check for high-temperature hot-spots. When one is found the date, time, location, and intensity are recorded. MODIS looks at every square km of the Earth every 48 hours, once during the day and once during the night, and the presence of two MODIS sensors in space allows at least four hot-spot observations every two days. Each day updated global maps are compiled to display the locations of all hot spots detected in the previous 24 hours. There is a drop-down list with volcano names which allow users to 'zoom-in' and examine the distribution of hot-spots at a variety of spatial scales. |
|
WOVOdat
Single Volcano View Temporal Evolution of Unrest Side by Side Volcanoes |
WOVOdat is a database of volcanic unrest; instrumentally and visually recorded changes in seismicity, ground deformation, gas emission, and other parameters from their normal baselines. It is sponsored by the World Organization of Volcano Observatories (WOVO) and presently hosted at the Earth Observatory of Singapore.
GVMID Data on Volcano Monitoring Infrastructure The Global Volcano Monitoring Infrastructure Database GVMID, is aimed at documenting and improving capabilities of volcano monitoring from the ground and space. GVMID should provide a snapshot and baseline view of the techniques and instrumentation that are in place at various volcanoes, which can be use by volcano observatories as reference to setup new monitoring system or improving networks at a specific volcano. These data will allow identification of what monitoring gaps exist, which can be then targeted by remote sensing infrastructure and future instrument deployments. |
| Volcanic Hazard Maps | The IAVCEI Commission on Volcanic Hazards and Risk has a Volcanic Hazard Maps database designed to serve as a resource for hazard mappers (or other interested parties) to explore how common issues in hazard map development have been addressed at different volcanoes, in different countries, for different hazards, and for different intended audiences. In addition to the comprehensive, searchable Volcanic Hazard Maps Database, this website contains information about diversity of volcanic hazard maps, illustrated using examples from the database. This site is for educational purposes related to volcanic hazard maps. Hazard maps found on this website should not be used for emergency purposes. For the most recent, official hazard map for a particular volcano, please seek out the proper institutional authorities on the matter. |
| IRIS seismic stations/networks | Incorporated Research Institutions for Seismology (IRIS) Data Services map showing the location of seismic stations from all available networks (permanent or temporary) within a radius of 0.18° (about 20 km at mid-latitudes) from the given location of Hierro. Users can customize a variety of filters and options in the left panel. Note that if there are no stations are known the map will default to show the entire world with a "No data matched request" error notice. |
| UNAVCO GPS/GNSS stations | Geodetic Data Services map from UNAVCO showing the location of GPS/GNSS stations from all available networks (permanent or temporary) within a radius of 20 km from the given location of Hierro. Users can customize the data search based on station or network names, location, and time window. Requires Adobe Flash Player. |
| DECADE Data | The DECADE portal, still in the developmental stage, serves as an example of the proposed interoperability between The Smithsonian Institution's Global Volcanism Program, the Mapping Gas Emissions (MaGa) Database, and the EarthChem Geochemical Portal. The Deep Earth Carbon Degassing (DECADE) initiative seeks to use new and established technologies to determine accurate global fluxes of volcanic CO2 to the atmosphere, but installing CO2 monitoring networks on 20 of the world's 150 most actively degassing volcanoes. The group uses related laboratory-based studies (direct gas sampling and analysis, melt inclusions) to provide new data for direct degassing of deep earth carbon to the atmosphere. |
| Large Eruptions of Hierro | Information about large Quaternary eruptions (VEI >= 4) is cataloged in the Large Magnitude Explosive Volcanic Eruptions (LaMEVE) database of the Volcano Global Risk Identification and Analysis Project (VOGRIPA). |
| EarthChem | EarthChem develops and maintains databases, software, and services that support the preservation, discovery, access and analysis of geochemical data, and facilitate their integration with the broad array of other available earth science parameters. EarthChem is operated by a joint team of disciplinary scientists, data scientists, data managers and information technology developers who are part of the NSF-funded data facility Integrated Earth Data Applications (IEDA). IEDA is a collaborative effort of EarthChem and the Marine Geoscience Data System (MGDS). |


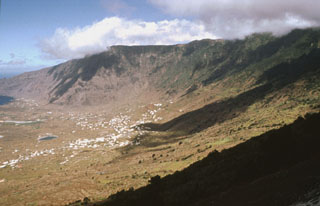 The massive El Hierro shield volcano is truncated by a large NW-facing escarpment, seen here, which formed as a result of gravitational collapse of the volcano. The steep-sided 1,500-m-high scarp towers above a low lava platform bordering 14-km-wide El Golfo Bay, which is barely visible at the extreme left. Holocene cones and flows are found both on the outer flanks and in the El Golfo depression. The latest subaerial eruption, during the 18th century, produced a lava flow from a cinder cone on the northwest side of El Golfo. A submarine eruption occurred in 2011-12 near the southern flank.