Recently Published Bulletin Reports
Ambrym (Vanuatu) New effusive eruption during January 2024
Popocatepetl (Mexico) Daily gas-and-ash emissions, ashfall, and occasional explosions during August-November 2023
Reventador (Ecuador) Daily explosions, gas-and-ash emissions, and incandescent avalanches during August-November 2023
Erta Ale (Ethiopia) Strong lava lake activity and lava overflows during June-November 2023
Ubinas (Peru) New eruption with explosions and ash plumes during June-December 2023
Kanaga (United States) Small explosion on 18 December 2023
Klyuchevskoy (Russia) New eruption consisting of Strombolian activity, lava flows and fountains, and ash plumes during June-December 2023
Agung (Indonesia) Three eruptive events reported in April, May, and December 2022
Saunders (United Kingdom) Persistent thermal anomalies from the summit crater lava lake during February 2023-January 2024
Tengger Caldera (Indonesia) Minor ash emission in December 2023; persistent weak thermal anomaly in the Bromo crater
Shishaldin (United States) New eruption with significant Strombolian explosions, ash plumes, and ashfall
Ioto (Japan) New eruption with discolored water, ejecta, and floating pumice during October-December 2023
Ambrym (Vanuatu) — February 2024  Cite this Report
Ambrym
Vanuatu
16.25°S, 168.12°E; summit elev. 1334 m
All times are local (unless otherwise noted)
New effusive eruption during January 2024
Ambrym contains a 12-km-wide caldera and is part of the New Hebrides Arc, located in the Vanuatu archipelago. The two currently active craters within the caldera are Benbow and Marum, both of which have produced lava lakes, explosions, lava flows, and gas-and-ash emissions. The previous eruption occurred during late January 2022 and was characterized by ash plumes, sulfur dioxide plumes, and crater incandescence (BGVN 47:05). This report covers a new, short eruption during January 2024, which consisted of a lava effusion and an explosion. Information comes from the Vanuatu Meteorology and Geohazards Department (VMGD) and satellite data.
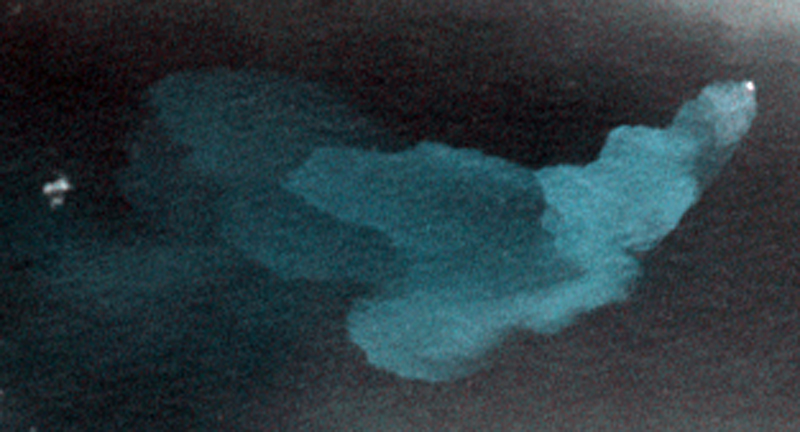
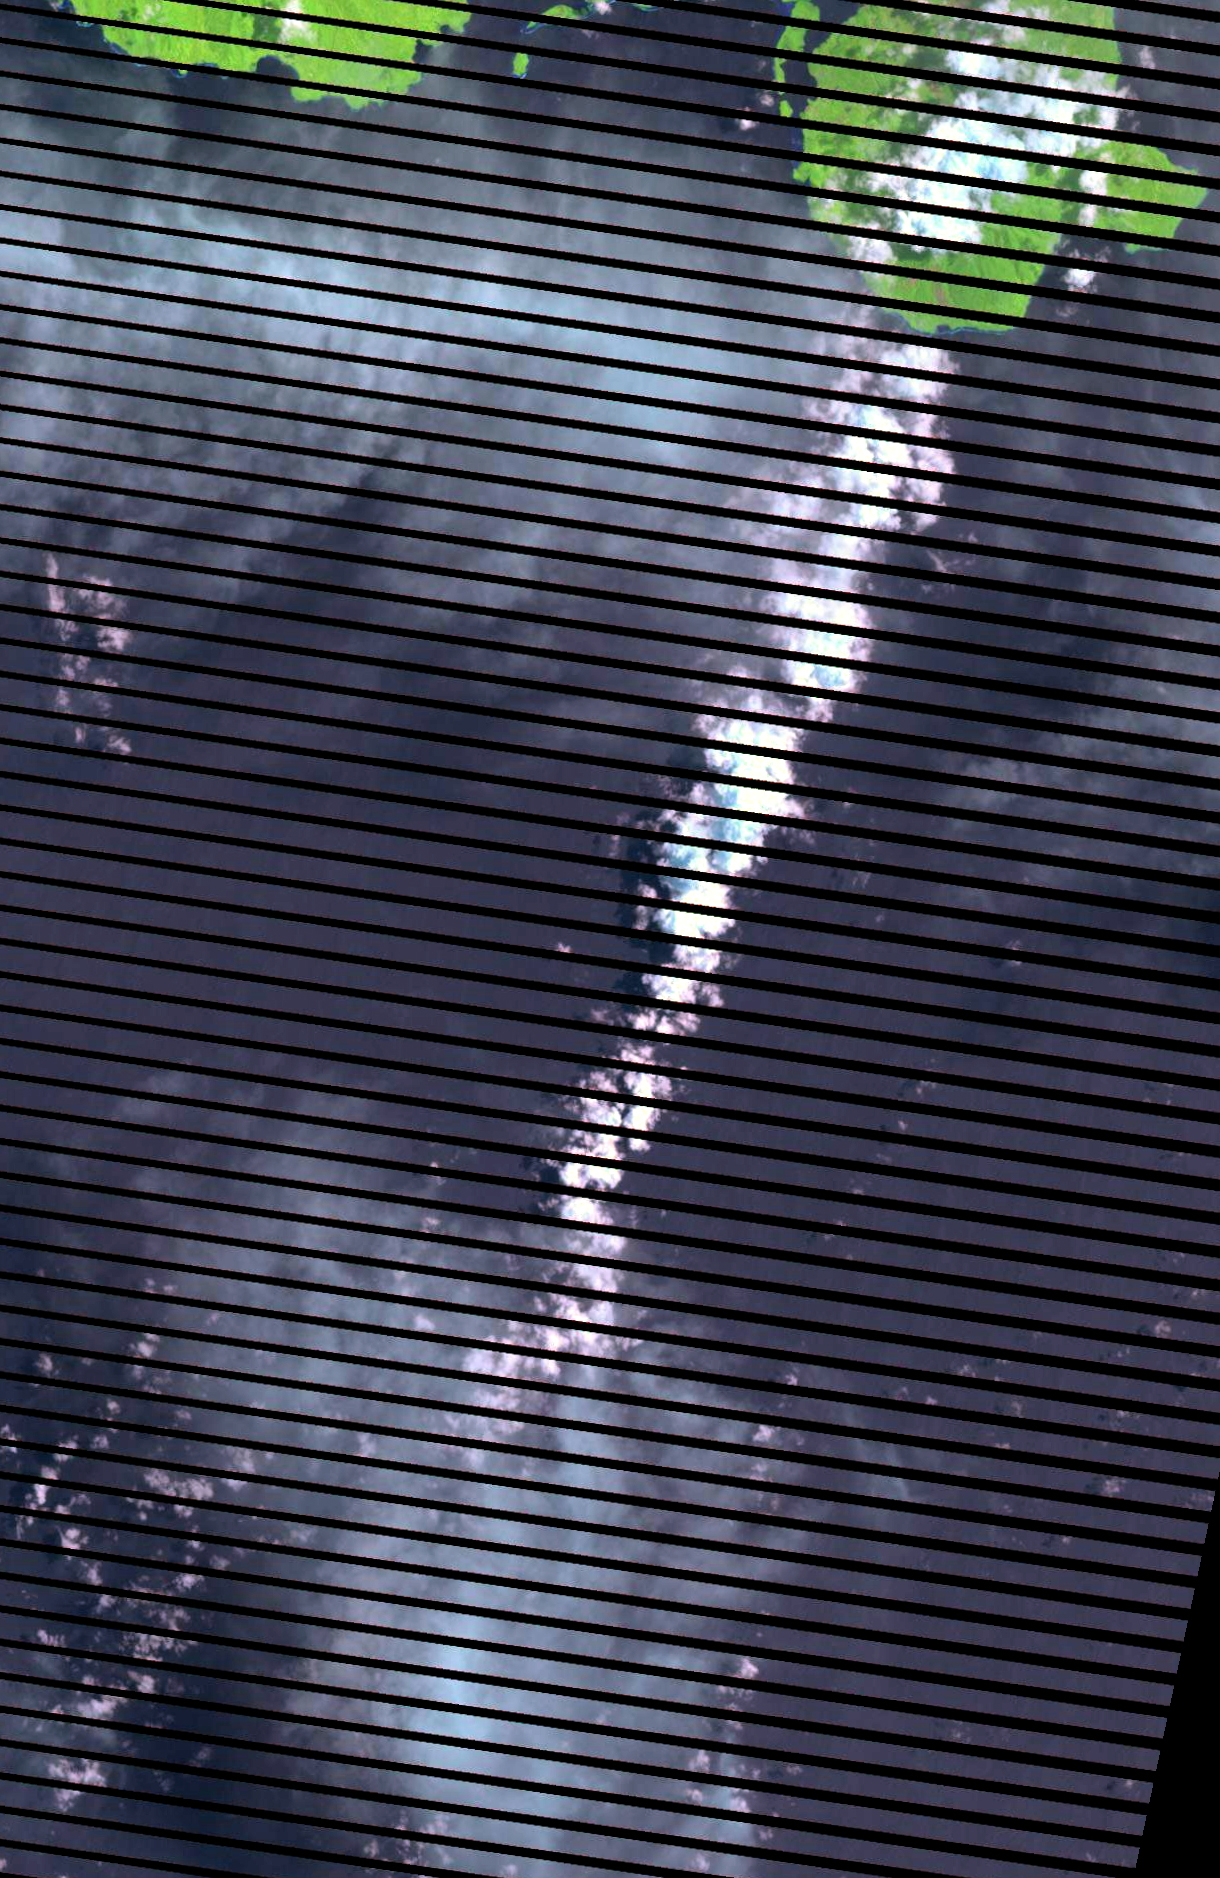
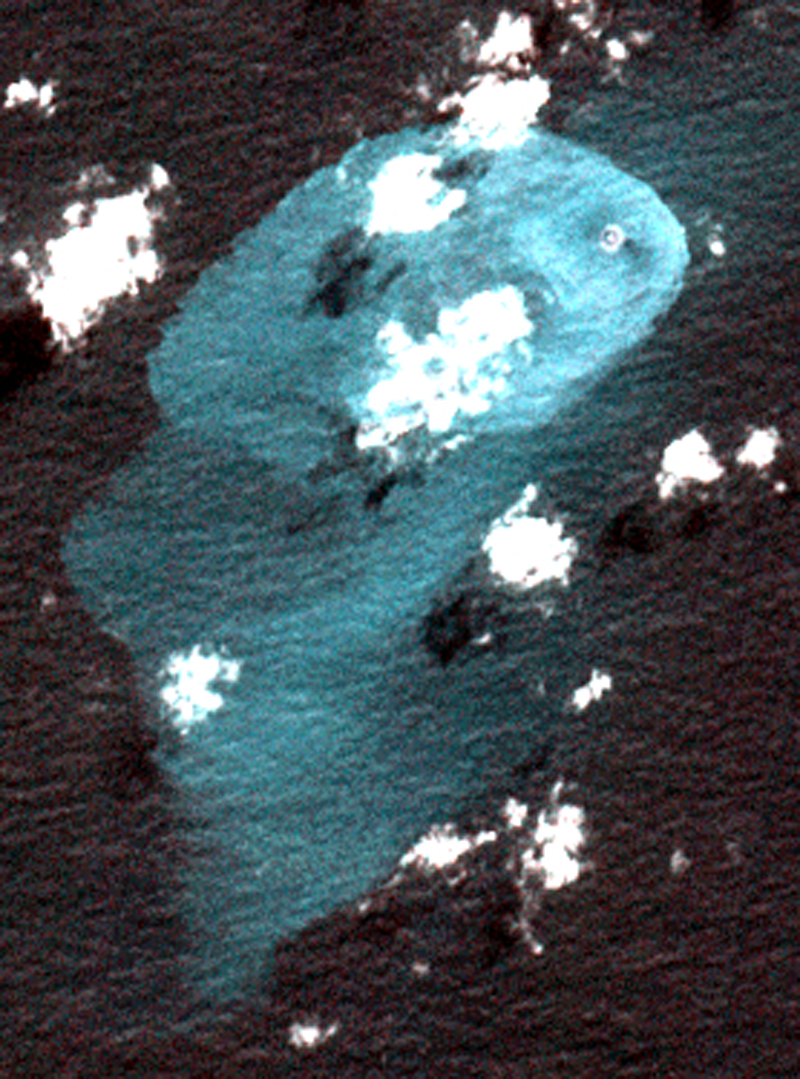
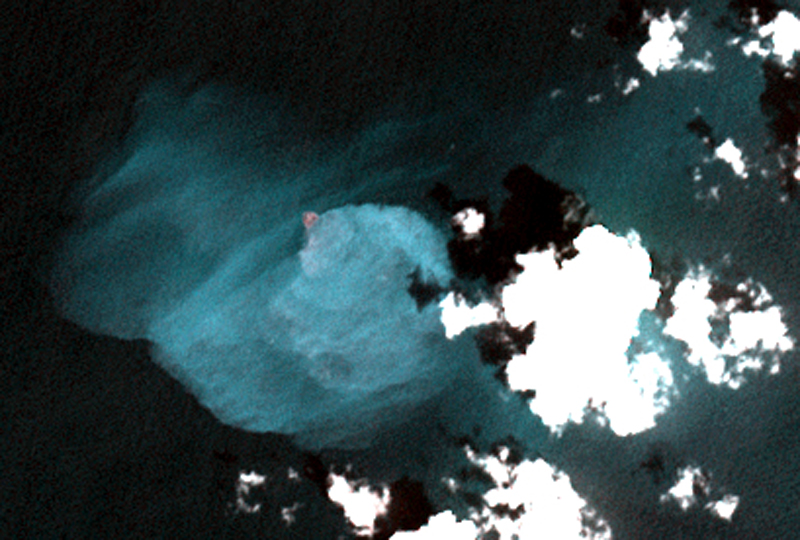
VMGD reported that at 2217 on 13 January an eruption began at Benbow Crater, based on webcam and seismic data. The eruption was characterized by a loud explosion, intense crater incandescence (figure 55), and gas-and-steam emissions. As a result, the Volcano Alert Level (VAL) was raised from 1 to 3 (on a scale of 0-5). A lava flow was reported in Benbow Crater, which lasted for four days. Satellite data showed that 1,116 tons of sulfur dioxide per day (t/d) were emitted on 14 January (figure 56). During the morning of 15 January, ground reports noted loud explosions and minor earthquakes. The sulfur dioxide flux on 15 January was 764 t/d. During 15-17 January activity decreased according to webcam images, seismic data, and field observations. No sulfur dioxide emissions were reported after 15 January. Gas-and-ash emissions also decreased, although they continued to be observed through 31 January, and crater incandescence was less intense (figure 57). The VAL was lowered to 2 on 17 January.
Geologic Background. Ambrym is a large basaltic volcano with a 12-km-wide caldera formed during a major Plinian eruption with dacitic pyroclastic flows about 1,900 years ago. A thick, almost exclusively pyroclastic sequence, initially dacitic then basaltic, overlies lava flows of a pre-caldera shield volcano. Post-caldera eruptions, primarily from Marum and Benbow cones, have partially filled the caldera floor and produced lava flows that ponded on the floor or overflowed through gaps in the caldera rim. Post-caldera eruptions have also formed a series of scoria cones and maars along a fissure system oriented ENE-WSW. Eruptions have been frequently reported since 1774, though mostly limited to extra-caldera eruptions that would have affected local populations. Since 1950 observations of eruptive activity from cones within the caldera or from flank vents have occurred almost yearly.
Information Contacts: Geo-Hazards Division, Vanuatu Meteorology and Geo-Hazards Department (VMGD), Ministry of Climate Change Adaptation, Meteorology, Geo-Hazards, Energy, Environment and Disaster Management, Private Mail Bag 9054, Lini Highway, Port Vila, Vanuatu (URL: http://www.vmgd.gov.vu/, https://www.facebook.com/VanuatuGeohazardsObservatory/); Copernicus Browser, Copernicus Data Space Ecosystem, European Space Agency (URL: https://dataspace.copernicus.eu/browser/).
Popocatepetl (Mexico) — January 2024 Cite this Report
Popocatepetl
Mexico
19.023°N, 98.622°W; summit elev. 5393 m
All times are local (unless otherwise noted)
Daily gas-and-ash emissions, ashfall, and occasional explosions during August-November 2023
Popocatépetl, located 70 km SE of Mexica City, Mexico, contains a 400 x 600 m-wide summit crater. Records of activity date back to the 14th century; three Plinian eruptions, the most recent of which took place about 800 CE, have occurred since the mid-Holocene, accompanied by pyroclastic flows and voluminous lahars that swept basins below the volcano. The current eruption period began in January 2005, characterized by numerous episodes of lava dome growth and destruction within the summit crater. Recent activity has been characterized by daily gas-and-ash emissions, ashfall, and explosions (BGVN 48:09). This report covers similar activity during August through November 2023, according to daily reports from Mexico's Centro Nacional de Prevención de Desastres (CENAPRED) and various satellite data.
Daily gas-and-steam emissions, containing some amount of ash, continued during August through November 2023. CENAPRED reported the number of low-intensity gas-and-ash emissions or “exhalations” and the minutes of tremor, which sometimes included harmonic tremor in their daily reports (figure 220). A total of 21 volcano-tectonic (VT) tremors were detected throughout the reporting period. The average number of exhalations was 117 per day, with a maximum number of 640 on 25 September. Frequent sulfur dioxide plumes that exceeded two Dobson Units (DU) and drifted in multiple directions were visible in satellite data from the TROPOMI instrument on the Sentinel-5P satellite (figure 221).
Activity during August was relatively low and mainly consisted of occasional explosions, ash emissions, and light ashfall. There were 30 explosions (25 minor explosions and four moderate explosions), and nine VT-type events detected. An average number of 60 exhalations occurred each day, which mostly consisted of water vapor, volcanic gases, and a small amount of ash. On 2 August the National Center for Communications and Civil Protection Operations (CENACOM) reported light ashfall in Ocuituco (22 km SW), Yecapixtla (31 km SW), Cuautla (43 km SW), and Villa de Ayala (47 km SW). On 7 August light ashfall was observed in Atlautla (16 km W). A minor explosion at 0305 on 11 August was accompanied by crater incandescence. Explosions at 0618 on 13 August produced a gas-and-ash plume that rose above the summit, and at 0736 another explosion produced a puff of gas-and-ash (figure 222). Two minor explosions were detected at 0223 and 0230 on 16 August that generated eruptive columns with low ash content rising 800 m and 700 m above the crater, respectively. On 24 August an eruptive event lasted 185 minutes and consisted of light ash emissions that did not exceed 300 m above the crater. According to the Washington VAAC, ash plumes identified in daily satellite images rose to 4.6-7.6 km altitude and drifted in multiple directions, the highest of which occurred on 29 August.
There was an average of 156 exhalations each day during September, a monthly total of seven VT-type events, and 29 explosions, 14 of which were minor and nine of which were moderate. A gas-and-ash plume rose to 2 km above the summit and drifted WSW at 1216 on 1 September. CENACOM reported at 1510 observations of ashfall in Ozumba (18 km W), Atlautla, Tepetlixpa (20 km W), and Ecatzingo (15 km SW), as well as in Morelos in Cuernavaca (65 km WSW), Temixco (67 km WSW), Huitzilac (67 km W), Tepoztlán (49 km W), and Jiutepec (59 km SW). The next day, gas-and-ash plumes rose to 2 km above the summit (figure 223). At 1100 ashfall was reported in Amecameca (15 km NW), Ayapango (24 km WNW), Ozumba, Juchitepec, Tenango del Aire (29 km WNW), Atlautla, and Tlalmanalco (27 km NW). A gas-and-ash plume rose to 1 km above the summit and drifted WNW at 1810. During 5-6, 8-9, 12, 14, 19, and 24-25 September ashfall was reported in Amecameca, Atlautla, Ozumba, Tenango del Aire, Tepetlixpa, Juchitepec, Cuernavaca, Ayala, Valle de Chalco (44 km NW), Ixtapaluca (42 km NW), La Paz (50 km NW), Chimalhuacán, Ecatepec, Nezahualcóyotl (60 km NW), Xochimilco (53 km SE), Huayapan, Tetela del Volcano (20 km SW), Yautepec (50 km WSW), Cuautla (43 km SW), Yecapixtla (30 km SW) and possibly Tlaltizapán (65 km SW), Tlaquiltenango, and Tepalcingo. According to the Washington VAAC, ash plumes identified in daily satellite images rose to 5.8-9.1 km altitude and drifted in multiple directions, the highest of which was identified during 1-2 August.
Activity during October and November was relatively low. An average of 179 exhalations consisting of gas-and-steam and ash emissions were reported during October and 73 during November. Only one VT-type event and two explosions were detected during October and four VT-type events and one explosion during November. A satellite image from 0101 on 14 October showed ash fanning out to the NW at 6.7 km altitude and an image from 0717 showed a continuously emitted ash plume drifting WNW and NW at the same altitude. Ash emissions at 1831 on 14 October were ongoing and visible in webcam images slowly drifting W at an altitude of 6.4 km altitude (figure 224). On 24 October a tremor sequence began at 0310 that generated a gas-and-ash plume that rose 800 m above the summit and drifted W. Another tremor sequence occurred during 1305-1900 on 25 October that consisted of continuous ash emissions. Ash plumes identified in daily satellite images rose to 5.5-8.5 km altitude and drifted in different directions during October, according to the Washington VAAC. The highest ash plume was detected on 23 October. During 10-13 November ash plumes rose to 6.7 km altitude and drifted N, NNW, NE, and NW. On 13 November a M 1.5 VT-type event was detected at 0339 and light ashfall was reported in Amecameca, Cocotitlán (34 km NW), and Tenango del Aire, and Ocuituco. On 14 November ash plumes rose to 6 km altitude and drifted N, NE, and SE and light ashfall was reported in Cuernavaca (64 km W). The Washington VAAC reported frequent ash plumes that rose to 5.8-7.9 km altitude and drifted in several directions; the highest ash plume was recorded on 28 November.
Satellite data. MODIS thermal anomaly data provided through MIROVA (Middle InfraRed Observation of Volcanic Activity) showed frequent low-to-moderate thermal anomalies during the reporting period (figure 225). The intensity of the anomalies was lower compared to previous months. According to data from MODVOLC thermal alerts, a total of ten hotspots were detected at the summit crater on 2 August and 2, 4, 9, 19, and 26 September. Thermal activity in the summit crater was visible in infrared satellite data and was sometimes accompanied by ash plumes, as shown on 17 November (figure 226).
Geologic Background. Volcán Popocatépetl, whose name is the Aztec word for smoking mountain, rises 70 km SE of Mexico City to form North America's 2nd-highest volcano. The glacier-clad stratovolcano contains a steep-walled, 400 x 600 m wide crater. The generally symmetrical volcano is modified by the sharp-peaked Ventorrillo on the NW, a remnant of an earlier volcano. At least three previous major cones were destroyed by gravitational failure during the Pleistocene, producing massive debris-avalanche deposits covering broad areas to the south. The modern volcano was constructed south of the late-Pleistocene to Holocene El Fraile cone. Three major Plinian eruptions, the most recent of which took place about 800 CE, have occurred since the mid-Holocene, accompanied by pyroclastic flows and voluminous lahars that swept basins below the volcano. Frequent historical eruptions, first recorded in Aztec codices, have occurred since Pre-Columbian time.
Information Contacts: Centro Nacional de Prevención de Desastres (CENAPRED), Av. Delfín Madrigal No.665. Coyoacan, México D.F. 04360, México (URL: http://www.cenapred.unam.mx/, Daily Report Archive https://www.gob.mx/cenapred/archivo/articulos); Washington Volcanic Ash Advisory Center (VAAC), Satellite Analysis Branch (SAB), NOAA/NESDIS OSPO, NOAA Science Center Room 401, 5200 Auth Rd, Camp Springs, MD 20746, USA (URL: www.ospo.noaa.gov/Products/atmosphere/vaac, archive at: http://www.ssd.noaa.gov/VAAC/archive.html); MIROVA (Middle InfraRed Observation of Volcanic Activity), a collaborative project between the Universities of Turin and Florence (Italy) supported by the Centre for Volcanic Risk of the Italian Civil Protection Department (URL: http://www.mirovaweb.it/); Hawai'i Institute of Geophysics and Planetology (HIGP) - MODVOLC Thermal Alerts System, School of Ocean and Earth Science and Technology (SOEST), Univ. of Hawai'i, 2525 Correa Road, Honolulu, HI 96822, USA (URL: http://modis.higp.hawaii.edu/); NASA Global Sulfur Dioxide Monitoring Page, Atmospheric Chemistry and Dynamics Laboratory, NASA Goddard Space Flight Center (NASA/GSFC), 8800 Greenbelt Road, Goddard, Maryland, USA (URL: https://so2.gsfc.nasa.gov/); Copernicus Browser, Copernicus Data Space Ecosystem, European Space Agency (URL: https://dataspace.copernicus.eu/browser/).
Reventador (Ecuador) — January 2024 Cite this Report
Reventador
Ecuador
0.077°S, 77.656°W; summit elev. 3562 m
All times are local (unless otherwise noted)
Daily explosions, gas-and-ash emissions, and incandescent avalanches during August-November 2023
Volcán El Reventador, located in Ecuador, is a stratovolcano with a 4-km-wide avalanche scarp open to the E that was formed by edifice collapse. The largest recorded eruption took place in 2002 producing a 17-km-high eruption column, pyroclastic flows that traveled as far as 8 km, and lava flows from summit and flank vents. Recorded eruptions date back to the 16th century and have been characterized by explosive events, lava flows, ash plumes, and lahars. Frequent lahars have built deposits on the scarp slope. The current eruption period began in July 2008 and has recently been characterized daily explosions, gas-and-ash emissions, and block avalanches (BGVN 48:08). This report covers similar activity during August through November 2023 using daily reports from Ecuador's Instituto Geofisico (IG-EPN) and satellite data.
During August through November 2023, IG-EPN reported daily explosions, gas-and-ash plumes that rose as high as 1.3 km above the crater, and frequent crater incandescence, often accompanied by incandescent block avalanches that affected one or multiple flanks. More daily explosions were detected during November, with an average total of 46 per day.
Table 19. Monthly summary of explosions and plume heights recorded at Reventador from August through November 2023. Data could not be collected for 29-30 September 2023 and 6-23 October 2023. Data courtesy of IG-EPN (August-November 2023 daily reports).
| Month |
Average number of explosions per day |
Max plume height above the crater rim (km) |
| Aug 2023 |
32 |
1.3 |
| Sep 2023 |
30 |
1 |
| Oct 2023 |
31 |
1.3 |
| Nov 2023 |
46 |
1.2 |
Activity during August consisted of 6-75 daily explosions, nighttime crater incandescence, and incandescent avalanches of material. Frequent seismicity was mainly characterized by long-period (LP) events, harmonic tremor (TRARM), tremor-type (TRE), and volcano tectonic (VT)-type events. Daily gas-and-ash emissions rose 200-1,300 m above the summit and drifted W, SW, NW, NE, N, and E, based on webcam and satellite images. The Washington VAAC also reported occasional ash plumes that rose 400-1,600 m above the crater and drifted NW. Avalanches of incandescent material were reported during 1-2, 6-7, 9-14, 16-17, 18-21, and 26-29 August, which traveled 500-900 m below the crater and affected multiple flanks (figure 180). During 24-25 August incandescent material was ejected 300 m above the crater.
Gas-and-ash emissions and seismicity characterized by LP, VT, TRARM, and TRE-type events continued during September; data were not available for 29-30 September. Daily gas-and-ash emissions rose 200-1,000 m above the crater and generally drifted W, NW, and SW (figure 181). Near-daily explosions ranged from 16-53 per day, often accompanied by incandescent avalanches, which affected one or multiple flanks and traveled 100-800 m below the crater. During 2-3 September incandescent material was ejected 200 m above the crater and was accompanied by blocks rolling down the flanks. During 16-17 September incandescent material was ejected 100-200 m above the crater and avalanches descended 600 m below the crater. During 21-22 and 24-26 September incandescent material was ejected 100-300 m above the crater. According to the Washington VAAC, ash plumes rose 700 m above the crater and drifted SW, W, and NW on 3, 16, and 20 September, respectfully.
During October, daily explosions, gas-and-ash plumes, and crater incandescence continued, with 16-40 explosions recorded each day (figure 182); data was not available for 6-23 October. Seismicity consisted of LP, TRE, and TRARM-type events. Gas-and-ash emissions rose 200-1,000 m above the crater and drifted W, SW, NW, SSW, NNW, and NE. The Washington VAAC reported that ash plumes rose 1-1.3 km above the crater and drifted W, SW, and NW during 1-5 October. During 30 September-1 October incandescent avalanches descended 700 m below the crater. Ejected material rose 200 m above the crater during 2-5 October and was accompanied by avalanches of material that traveled 250-600 m below the crater rim; incandescent avalanches were also reported during 23-29 October.
Daily explosions, LP, TRARM, VT, and TRE-type events, crater incandescence, and avalanches of material continued during November. There were 26-62 daily explosions detected throughout the month. Gas-and-ash emissions rose 300-1,200 m above the crater and drifted in different directions (figure 183). The Washington VAAC reported that ash plumes rose 700-1,620 m above the crater and drifted NW, W, WNW, SW, E, SE, and ESE. Frequent incandescent avalanches descended 500-1,000 m below the crater. Explosions ejected material 100-300 m above the crater during 4-7, 11-12, and 19-23 November.
Satellite data. MIROVA (Middle InfraRed Observation of Volcanic Activity) analysis of MODIS satellite data showed intermittent thermal anomalies of low-to-moderate power (figure 184). Thermal activity mainly consisted of incandescent avalanches descending the flanks due to the frequently detected explosions. The MODVOLC hotspot system identified a total of ten hotspots on 3 August, 7, 18, 12, 22, and 28 September, and 7, 9, and 19 November.
Geologic Background. Volcán El Reventador is the most frequently active of a chain of Ecuadorian volcanoes in the Cordillera Real, well east of the principal volcanic axis. The forested, dominantly andesitic stratovolcano has 4-km-wide avalanche scarp open to the E formed by edifice collapse. A young, unvegetated, cone rises from the amphitheater floor to a height comparable to the rim. It has been the source of numerous lava flows as well as explosive eruptions visible from Quito, about 90 km ESE. Frequent lahars in this region of heavy rainfall have left extensive deposits on the scarp slope. The largest recorded eruption took place in 2002, producing a 17-km-high eruption column, pyroclastic flows that traveled up to 8 km, and lava flows from summit and flank vents.
Information Contacts: Instituto Geofísico, Escuela Politécnica Nacional (IG-EPN), Casilla 17-01-2759, Quito, Ecuador (URL: http://www.igepn.edu.ec/); MIROVA (Middle InfraRed Observation of Volcanic Activity), a collaborative project between the Universities of Turin and Florence (Italy) supported by the Centre for Volcanic Risk of the Italian Civil Protection Department (URL: http://www.mirovaweb.it/); Hawai'i Institute of Geophysics and Planetology (HIGP) - MODVOLC Thermal Alerts System, School of Ocean and Earth Science and Technology (SOEST), Univ. of Hawai'i, 2525 Correa Road, Honolulu, HI 96822, USA (URL: http://modis.higp.hawaii.edu/).
Erta Ale (Ethiopia) — January 2024 Cite this Report
Erta Ale
Ethiopia
13.601°N, 40.666°E; summit elev. 585 m
All times are local (unless otherwise noted)
Strong lava lake activity and lava overflows during June-November 2023
Erta Ale in Ethiopia has a 50-km-wide edifice that rises more than 600 m from below sea level in the Danakil depression. The summit caldera is 0.7 x 1.6 km and contains at least two pit craters (North and South). Another larger 1.8 x 3.1-km-wide depression is located SE of the summit and is bounded by curvilinear fault scarps on the SE side. Lava flows from fissures have traveled into the caldera and locally overflowed the crater rim. The current eruption has been ongoing since 1967, with at least one long-term active lava lake present in the summit caldera. Recent fissure eruptions from 2017 have occurred on the SE flank (BGVN 42:07). Recent activity has been characterized by minor thermal activity at the S crater and an active lava lake at the N crater (BGVN 48:06). This report covers strong lava lake activity primarily at the N pit crater during June through November 2023 using information from satellite infrared data.
Infrared satellite images generally showed an active lava lake as the N pit crater and variable thermal activity at the S pit crater during the reporting period. On 7 June two strong thermal anomalies were detected at the S pit crater and two weaker anomalies were visible at the N pit crater. Those anomalies persisted throughout the month, although the intensity at each declined. On 2 July a possible lava lake was identified at the S pit crater, filling much of the crater. On 7 July both pit craters contained active lava lakes (figure 120). By 12 July the thermal activity decreased; two smaller anomalies were visible through the rest of the month at the S pit crater while the N pit crater showed evidence of cooling.
Renewed lava lake activity was identified at the N pit crater, based on a satellite image from 11 August, with two smaller anomalies visible at the S pit crater. By 16 August the lava lake in the N pit had begun to cool and only a small thermal anomaly was identified. Activity restarted on 21 August, filling much of the E and SE part of the N pit crater. The thermal activity at the N pit crater intensified on 31 August, particularly in the NW part of the crater. On 5 September lava filled much of the N pit crater, overflowing to the W and SW. During at least 10-20 September thermal activity at both craters were relatively low.
According to a satellite image on 25 September, strong thermal activity resumed when lava overflowed the N pit crater to the S, SW, and NE (figure 120). A satellite image taken on 5 October showed lava flows from the N had spilled into the S and begun to cool, accompanied by two weak thermal anomalies at the S pit crater. On 15 October lava flows again traveled SE and appeared to originate from the S pit crater (figure 120). Following these events, smaller thermal anomalies were visible on the SE rim of the N pit crater and within the S pit crater.
Lava was visible in the NW part of the N pit crater according to a satellite image taken on 4 November. By 9 November the intensity had decreased, and the lava appeared to cool through the rest of the month; young lava flows were visible along the W side of the S pit crater on 24 and 29 November. Lava flows occurred at the N pit crater trending NE-SW and along the E side on 29 November (figure 120).
During the reporting period, the MIROVA (Middle InfraRed Observation of Volcanic Activity) thermal detection system recorded consistent activity during the first half of 2023 (figure 121). Beginning in June 2023, thermal activity increased and remained variable in intensity through the end of the year indicating the presence of an active lava lake and lava flows. The MODVOLC thermal detection system registered a total of 63 anomalies during 7, 8, and 23 July, 10 and 18 August, 3, 5, 16, 23, 24, and 25 September, 15 and 20 October, and 21, 24, 26, 28, and 30 November. Some of these stronger thermal anomalies were also detected in Sentinel-2 infrared satellite images that showed an active lava lake at the N pit crater and subsequent lava overflows from both pit craters (figure 120).
Geologic Background. The Erta Ale basaltic shield volcano in Ethiopia has a 50-km-wide edifice that rises more than 600 m from below sea level in the Danakil depression. The volcano includes a 0.7 x 1.6 km summit crater hosting steep-sided pit craters. Another larger 1.8 x 3.1 km wide depression elongated parallel to the trend of the Erta Ale range is located SE of the summit and is bounded by curvilinear fault scarps on the SE side. Basaltic lava flows from these fissures have poured into the caldera and locally overflowed its rim. The summit caldera usually also holds at least one long-term lava lake that has been active since at least 1967, and possibly since 1906. Recent fissure eruptions have occurred on the N flank.
Information Contacts: MIROVA (Middle InfraRed Observation of Volcanic Activity), a collaborative project between the Universities of Turin and Florence (Italy) supported by the Centre for Volcanic Risk of the Italian Civil Protection Department (URL: http://www.mirovaweb.it/); Hawai'i Institute of Geophysics and Planetology (HIGP) - MODVOLC Thermal Alerts System, School of Ocean and Earth Science and Technology (SOEST), Univ. of Hawai'i, 2525 Correa Road, Honolulu, HI 96822, USA (URL: http://modis.higp.hawaii.edu/); Copernicus Browser, Copernicus Data Space Ecosystem, European Space Agency (URL: https://dataspace.copernicus.eu/browser/).
Ubinas
Peru
16.345°S, 70.8972°W; summit elev. 5608 m
All times are local (unless otherwise noted)
New eruption with explosions and ash plumes during June-December 2023
Ubinas, located in Peru, has had 24 eruptions since 1550, which more recently have been characterized by explosions, ash plumes, and lahars (BGVN 45:03). This report covers a new eruption during June through December 2023 based on reports from Instituto Geofisico del Peru (IGP), Instituto Geológico Minero y Metalúrgico (INGEMMET), and satellite data.
IGP reported that seismic unrest began on 17 May, followed by an increase in seismicity during the second half of the month. There were 168 volcano-tectonic (VT) earthquakes detected, which are associated with rock fracturing processes, and 171 long-period (LP) earthquakes recorded during 16-24 May, which are associated with the movement of volcanic fluid.
Seismicity and fumarolic activity at the crater level continued to increase during June. During 1-18 June there was an average of 631 VT-type earthquakes and 829 LP earthquakes recorded. Webcams showed gas-and-steam emissions rising 500 m above the summit and drifting SE. In addition, the maximum value of emitted sulfur dioxide during this period was 337 tons/day. During 19-22 June an average of 315 VT-type events and 281 LP-type events and tremor were reported. On 20 June the Gobierno Regional de Moquegua raised the Volcano Alert Level (VAL) to Yellow (the second level on a four-color scale), based on recommendations from IGP. Webcam images showed ash emissions rising 1 km above the summit and drifting E at 0011 on 22 June, which IGP reported marked the start of a new eruption. Sporadic and diffuse gas-and-ash emissions continued to rise 800-1,500 m above the summit through the rest of the month and drifted mainly E, N, NW, W, SW, and NE. During 23-25 June there was an average of 402 VT-type earthquakes and 865 LP-type events detected. During 26-28 June the earthquakes associated with ash emissions, which have been observed since 22 June, decreased, indicating the end of the phreatic phase of the eruption, according to IGP. A thermal anomaly was detected in the crater for the first time on 26 June and was periodically visible through 4 July (figure 61). During 29-30 June there was an average of 173 VT-type earthquakes and 351 LP-type events recorded, and sulfur dioxide values ranged between 600 t/d and 1,150 t/d. During this same time, seismicity significantly increased, with 173 VT-type earthquakes, 351 LP-type events, and harmonic tremor which signified rising magma. The Gobierno Regional de Moquegua raised the Alert Level to Orange (the third level on a four-color scale) on 30 June based on the recommendation from IGP and INGEMMET.
Activity during July consisted of continued seismicity and gas-and-ash emissions. Gas-and-ash emissions rose as high as 5 km above the summit and drifted as far as 40 km in different directions during 1, 4-6, 16, 20-23, 26, and 29 July, based on webcam and satellite images. During 1-2 July an average of 72 VT-type earthquakes and 114 LP-type events were detected. In addition, during that time, ashfall was reported in Ubinas (6.5 km SSE) and Querapi (4.5 km SE). During 2-3 July INGEMMET reported gas-and-ash plumes rose 400 m above the summit and drifted SW, causing ashfall in downwind areas as far as 5 km. During 3-4 July there was an average of 69 VT-type earthquakes and 96 LP-type events reported. On 4 July starting around 0316 there were 16 seismic signals associated with explosive activity and ash emissions detected (figure 62). According to INGEMMET an explosion ejected ballistics and generated a gas-and-ash plume that rose 5.5 km above the summit and drifted SW and S. Ashfall was recorded in Querapi, Ubinas, Sacohaya (7 km SSE), Anascapa (11 km SE), San Miguel (10 km SE), Tonohaya (7 km SSE), Huatahua, Huarina, Escacha (9 km SE), and Matalaque (17 km SSE), and was most significant within 5 km of the volcano. IGP noted that ash fell within a radius of 20 km and deposits were 1 mm thick in towns in the district of Ubinas.
During 5-9 July an average of 67 VT-type events and 47 LP-type events were reported. A period of continuous gas-and-ash emissions occurred on 5 July, with plumes drifting more than 10 km SE and E. A total of 11 seismic signals associated with explosions also detected on 6, 16, 17, and 22 July. On 6 July explosions recorded at 0747 and 2330 produced gas-and-ash plumes that rose as high as 3.5 km above the summit and drifted as far as 30 km NW, NE, SE, and S. According to the Washington VAAC the explosion at 0747 produced a gas-and-ash plume that rose to 9.1 km altitude and drifted SW, which gradually dissipated, while a lower-altitude plume rose to 7.6 km altitude and drifted NE. Gobierno Regional de Moquegua declared a state of emergency for districts in the Moquegua region, along with Coalaque Chojata, Icuña, Lloque, Matalaque, Ubinas, and Yunga of the General Sánchez Cerro province, to be in effect for 60 days. On 7 July an ash plume rose to 7.3 km altitude and drifted E at 0320. At 0900 and 1520 gas-and-steam plumes with diffuse ash rose to 6.7 km altitude and drifted SE. Small ash emissions were visible in satellite and webcam images at 0920 and 1520 on 8 July and rose as high as 6.4 km altitude and drifted SE. During 10-16 July there was an average of 80 VT-type earthquakes and 93 LP-type events reported. INGEMMET reported that during 9-11 July sulfur dioxide emissions were low and remained around 300 t/d.
During 17-23 July an average of 46 VT-type events and 122 LP-type events were detected. On 20 July at 0530 an explosion generated an ash plume that rose 3-4.5 km above the crater and drifted 65 km toward Arequipa. An explosion on 21 July at 0922 produced a gas-and-ash plume that rose 5 km above the summit (figure 63). Ashfall was reported in Querapi, Ubinas, Tonohaya, Anascapa, Sacohaya, San Miguel, Escacha, Huatagua (14 km SE), Huarina, Escacha (9 km SE), Matalaque, Logén, Santa Lucía de Salinas, and Salinas de Moche. An explosion on 22 July at 1323 generated an ash plume that rose 5.5 km above the summit and drifted NE, E, and SE. During 24-30 July there were five volcanic explosions detected and an average of 60 VT-type events and 117 LP-type events. An explosion on 29 July at 0957 produced an ash plume that rose 2.5 km above the summit and drifted as far as 40 km NE, E, and SE. As a result, significant ashfall was reported in Ubinas and Matalaque.
During August, explosions, gas-and-ash emissions, and seismic earthquakes persisted. During 31 July to 6 August there was an average of 115 VT-type events and 124 LP-type events reported. Gas-and-ash emissions were observed during 1, 6, 10, 13-14, 17-18, 21, and 23 August and they drifted as far as 20 km in different directions; on 14 and 18 August continuous ash emissions extended as far as 40 km S, SE, and NE. An explosion was detected at 2110 on 1 August, which generated a gas-and-ash plume that rose 5.4 km above the summit and drifted SE and E. The explosion ejected blocks and incandescent material as far as 3 km from the crater onto the SW, S, and SE flanks. Ashfall was reported in Ubinas and Chojata (19 km ESE). Gas-and-ash emissions rose as high as 2 km above the summit and drifted in different directions through 5 August, sometimes causing ashfall within a 15-km-radius. An explosion at 0009 on 6 August ejected blocks and produced a gas-and-ash plume that rose 1.4 km above the summit and drifted SE and E, which caused ashfall in Ubinas and Chojata and other areas within a 30-km radius. During 7-13 August there was an average of 102 VT-type events and 60 LP-type events detected. INGEMMET reported that sulfur dioxide emissions were low on 7 August and averaged 400 t/d.
One volcanic explosion that was recorded on 10 August, producing gas-and-ash emissions that rose 2.4 km above the summit and drifted as far as 25 km SE and E. Ashfall was observed in Ubinas, Matalaque, and Chojata. During 10-11 and 13-14 August sulfur dioxide values increased slightly to moderate levels of 2,400-3,700 t/d. The average number of VT-type events was 104 and the number of LP-type events was 71 during 14-21 August. Two explosions were detected at 0141 and 0918 on 21 August, which produced gas-and-ash emissions that rose 3.5 km above the summit and drifted 50 km N, NE, W, and NW (figure 64). The explosion at 0918 generated an ash plume that caused ashfall in different areas of San Juan de Tarucani. During 22-27 August the average number of VT-type events was 229 and the average number of LP-type events was 54. An explosion was reported at 1757 on 25 August, which generated a gas-and-ash plume that rose 4.2 km above the summit and drifted in multiple directions as far as 25 km. During 28 August through 3 September gas-and-ash emissions rose 600 m above the summit and drifted as far as 5 km E and SE. During this time, there was an average of 78 VT-type events and 42 LP-type events.
Gas-and-steam emissions rose 600-2,600 m above the summit and drifted as far as 15 km in multiple directions during September. During 4-10 and 11-17 September there was an average of 183 VT-type events and 27 LP-type events, and 114 VT-type events and 86 LP-type events occurred, respectively. On 14 September an explosion at 1049 generated a gas-and-ash plume that rose 2.6 km above the summit and drifted as far as 15 km E, NE, SE, and S (figure 65). During 14-16 September an average of three hours of seismic tremor related to ash emissions was recorded each day. During 18-24 September the average number of VT-type events was 187 and the average number of LP-type events was 45. During 25 September and 1 October, there was an average number of 129 VT-type events and 52 LP-type events detected.
Relatively low activity was reported during October; during 2-9 October there was an average number of 155 VT-type events and 27 LP-type events recorded. On 1 October at 1656 seismic signals associated with ash emissions were recorded for an hour and thirty minutes; the ash plumes rose as high as 1 km above the summit and drifted more than 10 km E, S, and SW. On 4 October IGP reported that an ash plume drifted more than 15 km SW and S. Sulfur dioxide emissions were 1,250 t/d on that day. On 7 October a gas-and-ash plume rose 1.9 km above the summit and drifted NE, E, and SE. On 4 October the amount of sulfur dioxide emissions was 1,250 t/d. During 10-15 October there was an average number of 225 VT-type events and 34 LP-type events recorded. On 11 October at 1555 a single seismic signal associated with an ash pulse was recorded; the gas-and-ash emissions rose 700 m above the summit and drifted SW and W. There was an average of 204 VT-type events and 25 LP-type events detected during 16-22 October and 175 VT-type events and 17 LP-type events during 23-29 October. On 27 October at 0043 a gas-and-ash emission rose 500 m above the summit and drifted SE and E. A minor thermal anomaly was visible on the crater floor. During 30 October to 5 November there was an average of 95 VT-type events and 24 LP-type events detected.
Activity remained relatively low during November and December and consisted mainly of gas-and-steam emissions and seismicity. Gas-and-steam emissions rose 900-1,100 m above the summit and drifted mainly E, SE, N, and NE. IGP detected an average of 166 VT-type events and 38 LP-type events during 6-15 November, 151 VT-type events and 17 LP-type events during 16-30 November, 143 VT-type events and 23 LP-type events during 1-15 December, and 129 VT-type events and 21 LP-type events during 16-31 December. No explosions or ash emissions were recorded during November. The VAL was lowered to Yellow (the second level on a four-color scale) during the first week of November. According to the Washington VAAC an ash emission was identified in a satellite image at 0040 on 11 December that rose to 5.5 km altitude and drifted NW. Webcam images at 0620 and 1220 showed continuous gas-and-steam emissions possibly containing some ash rising as high as 7 km altitude. Webcam images during 10-31 December showed continuous gas-and-ash emissions that rose as high as 2.5 km above the summit and drifted up to 5 km NW, W, and SW. On 12 December continuous ash emissions drifted more than 10 km N and NW.
Geologic Background. The truncated appearance of Ubinas, Perú's most active volcano, is a result of a 1.4-km-wide crater at the summit. It is the northernmost of three young volcanoes located along a regional structural lineament about 50 km behind the main volcanic front. The growth and destruction of Ubinas I was followed by construction of Ubinas II beginning in the mid-Pleistocene. The upper slopes of the andesitic-to-rhyolitic Ubinas II stratovolcano are composed primarily of andesitic and trachyandesitic lava flows and steepen to nearly 45°. The steep-walled, 150-m-deep summit crater contains an ash cone with a 500-m-wide funnel-shaped vent that is 200 m deep. Debris-avalanche deposits from the collapse of the SE flank about 3,700 years ago extend 10 km from the volcano. Widespread Plinian pumice-fall deposits include one from about 1,000 years ago. Holocene lava flows are visible on the flanks, but activity documented since the 16th century has consisted of intermittent minor-to-moderate explosive eruptions.
Information Contacts: Instituto Geofisico del Peru (IGP), Calle Badajoz N° 169 Urb. Mayorazgo IV Etapa, Ate, Lima 15012, Perú (URL: https://www.gob.pe/igp); Observatorio Volcanologico del INGEMMET (Instituto Geológical Minero y Metalúrgico), Barrio Magisterial Nro. 2 B-16 Umacollo - Yanahuara Arequipa, Peru (URL: http://ovi.ingemmet.gob.pe); Gobierno Regional Moquegua, Sede Principal De Moquegua, R377+5RR, Los Chirimoyos, Moquegua 18001, Peru (URL: https://www.gob.pe/regionmoquegua); Washington Volcanic Ash Advisory Center (VAAC), Satellite Analysis Branch (SAB), NOAA/NESDIS OSPO, NOAA Science Center Room 401, 5200 Auth Rd, Camp Springs, MD 20746, USA (URL: www.ospo.noaa.gov/Products/atmosphere/vaac, archive at: http://www.ssd.noaa.gov/VAAC/archive.html); MIROVA (Middle InfraRed Observation of Volcanic Activity), a collaborative project between the Universities of Turin and Florence (Italy) supported by the Centre for Volcanic Risk of the Italian Civil Protection Department (URL: http://www.mirovaweb.it/); Copernicus Browser, Copernicus Data Space Ecosystem, European Space Agency (URL: https://dataspace.copernicus.eu/browser/).
Kanaga (United States) — January 2024 Cite this Report
Kanaga
United States
51.923°N, 177.168°W; summit elev. 1307 m
All times are local (unless otherwise noted)
Small explosion on 18 December 2023
Kanaga lies within the Kanaton caldera at the northern tip of Kanaga Island. The caldera rim forms a 760-m-high arcuate ridge south and east of Kanaga; a lake occupies part of the SE caldera floor. Most of its previous recorded eruptions are poorly documented, although they date back to 1763. Fumarolic activity at Kanaga occurs in a circular, 200-m-wide, 60-m-deep summit crater and produces vapor plumes sometimes seen on clear days from Adak, 50 km to the east. Its most recent eruption occurred in February 2012, which consisted of numerous small earthquakes, a possible weak ash cloud, and gas-and-steam emissions (BGVN 38:03). This report covers a new eruption during December 2023, based on information from the Alaska Volcano Observatory (AVO).
A small explosion was detected in local infrasound and seismic data at 2231 on 18 December, followed by elevated seismicity. No ash emissions were visible in partly cloudy satellite images. On 19 December the Volcano Alert Level (VAL) was raised to Advisory (the second level on a four-level scale) and the Aviation Color Code (ACC) was raised to Yellow (the second color on a four-color scale). The rate of seismicity significantly declined after the 18th, although it remained elevated through 30 December. Small, daily earthquakes occurred during 19-28 December. Satellite observations following the event showed a debris flow extending 1.5 km down the NW flank. Possible minor gas-and-steam emissions were visible in a webcam image on 20 December. Weakly elevated surface temperatures were identified in satellite data during 23-26 December. A series of cracks extending from the inner crater to the upper SE flank and debris deposits on the upper flanks were observed in satellite images on 27 December. AVO reported that these were likely formed during the 18 December event. Local webcam and seismic data were temporarily offline due to a power failure during 4-28 January.
On 28 January connection to the seismic stations and webcams was restored and webcam images showed gas-and-steam emissions at the summit. Occasional earthquakes were also detected each day. A period of weak seismic tremor was observed on 31 January. During February, the number of earthquakes declined. On 27 February AVO lowered the VAL to Normal (the lowest level on a four-level scale) and the ACC to Green (the lowest color on a four-color scale) due to decreased levels of seismicity and no new surface changes or elevated temperatures based on satellite and webcam data.
Geologic Background. Symmetrical Kanaga stratovolcano is situated within the Kanaton caldera at the northern tip of Kanaga Island. The caldera rim forms a 760-m-high arcuate ridge south and east of Kanaga; a lake occupies part of the SE caldera floor. The volume of subaerial dacitic tuff is smaller than would typically be associated with caldera collapse, and deposits of a massive submarine debris avalanche associated with edifice collapse extend nearly 30 km to the NNW. Several fresh lava flows from historical or late prehistorical time descend the flanks of Kanaga, in some cases to the sea. Historical eruptions, most of which are poorly documented, have been recorded since 1763. Kanaga is also noted petrologically for ultramafic inclusions within an outcrop of alkaline basalt SW of the volcano. Fumarolic activity occurs in a circular, 200-m-wide, 60-m-deep summit crater and produces vapor plumes sometimes seen on clear days from Adak, 50 km to the east.
Information Contacts: Alaska Volcano Observatory (AVO), a cooperative program of a) U.S. Geological Survey, 4200 University Drive, Anchorage, AK 99508-4667 USA (URL: https://avo.alaska.edu/), b) Geophysical Institute, University of Alaska, PO Box 757320, Fairbanks, AK 99775-7320, USA, and c) Alaska Division of Geological & Geophysical Surveys, 794 University Ave., Suite 200, Fairbanks, AK 99709, USA (URL: http://dggs.alaska.gov/).
Klyuchevskoy (Russia) — January 2024 Cite this Report
Klyuchevskoy
Russia
56.056°N, 160.642°E; summit elev. 4754 m
All times are local (unless otherwise noted)
New eruption consisting of Strombolian activity, lava flows and fountains, and ash plumes during June-December 2023
Klyuchevskoy, located on the Kamchatka Peninsula, has produced frequent moderate-volume explosive and effusive eruptions and more than 100 flank eruptions have occurred during the past 3,000 years. Eruptions recorded since the late 17th century have resulted in frequent changes to the morphology of the 700-m-wide summit crater. Eruptions over the past 400 years have primarily originated from the summit crater, although numerous major explosive and effusive eruptions have also occurred from flank craters. The previous eruption ended in November 2022 and consisted of Strombolian activity (BGVN 47:12). This report covers a new eruption during June through December 2023, characterized by Strombolian explosions, lava flows, and ash plumes. Information primarily comes from weekly and daily reports from the Kamchatkan Volcanic Eruption Response Team (KVERT) and various satellite data.
KVERT reported that a Strombolian eruption began at 2323 on 22 June. A thermal anomaly was visible in satellite data starting on 22 June (figure 75). As a result, the Aviation Color Code (ACC) was raised to Yellow (the second lowest level on a four-color scale). During 4-6 and 13 July small ash clouds were occasionally observed over the crater. On 19 July a new lava flow began to effuse along the Apakhonchich drainage on the SE flank, which continued through 19 August. Lava fountaining was reported on 21 July in addition to the active lava flow, which continued through 23 August and during 27-30 August. During 22-23 and 27-30 August the lava flow was active along the Apakhonchich drainage on the SE flank.
Similar activity was observed during September. Lava fountaining resumed on 2 September and continued through 31 October. In addition, on 2 September a lava flow began to effuse along the Kozyrevsky drainage on the SW flank. During 3-5 September resuspended ash plumes rose to 3-3.5 km altitude and extended as far as 170 km E by 1940 on 4 September. The ACC was raised to Orange (the third level on a four-color scale) at 1240 on 4 September. The ACC was briefly lowered back to Yellow at 1954 that same day before returning to Orange during 1532-1808 on 5 September due to resuspended ash plumes that rose to 3 km altitude and drifted 120 km E at 1500. KVERT reported that Strombolian activity continued, feeding the lava flows advancing down the Apakhonchichsky and Kozyrevsky drainages through most of the month. During 25 September through 16 October the lava flow was only active in the Apakhonchichisky drainage (figure 76). During 9-12 September resuspended ash plumes rose to 1.5-4 km altitude and extended 550 km E and SE. On 22 September resuspended ash plumes rose to 2-2.5 km altitude and drifted 50-90 km E, which prompted KVERT to raise the ACC to Orange; the ACC was lowered back to Yellow on 24 September. On 29 September phreatic explosions generated ash plumes that rose to 5.2-5.3 km altitude.
Activity during October continued with lava fountains, lava flows, and ash plumes. Strombolian activity with lava fountains continued at the crater and active lava flows alternately descended the Apakhonchichisky and Kozyrevsky drainages on the SE and S flanks (figure 77). During 11-12 October gas-and-steam plumes containing some ash rose to 5.5-6 km altitude and extended as far as 65 km NE and SE. The ACC was raised to Orange on 11 October. According to observers at the Kamchatka Volcanological Station, lava effusion was almost continuous, and incandescent material was ejected as high as 300 m above the crater rim. On 13 October at 1420 an ash plume rose to 5-5.5 km altitude and drifted 90-100 km SE. During 14-16 October gas-and-steam plumes containing some ash rose to 4-6 km altitude and drifted 40-145 km ESE and E. On 16 October lava on the SE flank melted the snow and ice, causing phreatic explosions and large collapses of material from the margins of the flow. At 1500 an ash plume rose to 6.5-7 km altitude and drifted 70 km ENE. On 17 October an ash plume was reported extending 360 km NE. Gray-red ashfall was observed in Klyuchi at 0700; this ash was resuspended from older material.
During 22-31 October phreatic explosions generated ash plumes mainly containing ash from collapses of previously deposited pyroclastic material that rose to 7 km altitude and extended as far as 280 km NE, E, SW, and S on 23 and 29 October the ash plumes rose to 8 km altitude. Ash plumes during 27-29 October rose to 8 km altitude and drifted as far as 300 km SE, ESE, and E. Lava fountains rose up to 500 m above the crater during 27-31 October. Scientists from the Kamchatka Volcanological Station visited the volcano on 28 October and reported that the cinder cone at the summit had grown. They also observed advancing lava on the E flank that extended about 2 km from the summit to 2,700 m elevation, incandescent ejecta 500 m above the crater, and avalanches in the Apakhonchichsky drainage. On 31 October activity intensified, and lava flows were reported moving in the Kretovsky, Kozyrevsky, and Apakhonchichisky drainages on the NW, SW, and SE flanks. At 0930 an ash plume rose to 7 km altitude and at first drifted 169 km SW and then 646 km SE. KVERT reported ash plumes rose to 14 km altitude and extended as far as 1,500 km SSE. The ACC was raised to Red (the highest level on a four-color scale). During 31 October to 1 November ash plumes rose as high as 14 km altitude and drifted as far as 2,255 km ESE.
Activity on 1 November intensified. The lava fountains rose as high as 1 km above the summit (figure 78) and fed the lava flows that were active on the Kretovsky, Kozyrevsky, and Apakhonchichsky drainages on the NW, SW, and SE flanks. Ash plumes rose to 10-14 km altitude and drifted as far as 1,500 km SSE (figure 79). According to the Kamchatka Volcanological Station, observers reported pyroclastic flows descending the flanks. Lahars descended the Studenoy River, blocking the Kozyrevsky-Petropavlovsk federal highway and descended the Krutenkaya River, blocking the road E of Klyuchi. According to news articles the ash plumes caused some flight cancellations and disruptions in the Aleutians, British Columbia (Canada), and along flight paths connecting the Unites States to Japan and South Korea. Ash plumes containing old ash from collapses in the Apakhonchichsky drainage due to phreatic explosions rose to 9.5-9.8 km altitude and drifted 192 km SW at 1400 and to 8.7 km altitude and drifted 192 km SW at 1710 on 1 November.
On 2 November ash plumes rose to 6-14 km altitude; the ash plume that rose to 14 km altitude decreased to 6.5 km altitude and drifted NNE by 2000 and continued to drift more than 3,000 km ESE and E. The ACC was lowered to Orange. On 3 November ash plumes rose to 5-8.2 km altitude and drifted 72-538 km ENE, NNE, and ESE; at 0850 an ash plume rose to 6-6.5 km altitude and drifted more than 3,000 km ESE throughout the day. During 4-6 and 8-10 November resuspended ash plumes associated with collapses of old pyroclastic material from the sides of the Apakhonchichsky drainage due to phreatic explosions rose to 4.5-5.5 km altitude and extended 114-258 km NE, ENE, and E. KVERT reported that the eruption stopped on 5 November and the lava flows had begun to cool. Resuspended ash plumes rose to 5-6 km altitude and drifted 60 km E at 0820 on 13 November and to 5 km and 4.5 km altitude at 1110 and 1430 and drifted 140 km E and 150 km ESE, respectively. On 15 November the ACC was lowered to Green.
Activity was relatively low during most of December. On 27 December Strombolian activity resumed based on a thermal anomaly visible in satellite data. On 30 December an ash plume rose to 6 km altitude and extended 195 km NW. The ACC was raised to Orange. On 31 December video and satellite data showed explosions that generated ash plumes that rose to 5-6.5 km altitude and drifted 50-230 km WNW and NW. Though a thermal anomaly persisted through 1 January 2024, no explosions were detected, so the ACC was lowered to Yellow.
Satellite data. Thermal activity was strong throughout the reporting period due to frequent lava fountaining and lava flows. MODIS thermal anomaly data provided through MIROVA (Middle InfraRed Observation of Volcanic Activity) showed strong activity during the entire reporting period, resulting from lava fountaining and lava flows (figure 80). According to data from MODVOLC thermal alerts, a total of 336 hotspots were detected in June (3), July (30), August (11), September (52), October (217), and November (23). Thermal activity was also visible in infrared satellite images, often showing a strong thermal anomaly at the summit crater and a lava flow affecting primarily the SE and SW flanks (figure 81).
Geologic Background. Klyuchevskoy is the highest and most active volcano on the Kamchatka Peninsula. Since its origin about 6,000 years ago, this symmetrical, basaltic stratovolcano has produced frequent moderate-volume explosive and effusive eruptions without major periods of inactivity. It rises above a saddle NE of Kamen volcano and lies SE of the broad Ushkovsky massif. More than 100 flank eruptions have occurred during approximately the past 3,000 years, with most lateral craters and cones occurring along radial fissures between the unconfined NE-to-SE flanks of the conical volcano between 500 and 3,600 m elevation. Eruptions recorded since the late 17th century have resulted in frequent changes to the morphology of the 700-m-wide summit crater. These eruptions over the past 400 years have originated primarily from the summit crater, but have also included numerous major explosive and effusive eruptions from flank craters.
Information Contacts: Kamchatka Volcanic Eruptions Response Team (KVERT), Far Eastern Branch, Russian Academy of Sciences, 9 Piip Blvd., Petropavlovsk-Kamchatsky, 683006, Russia (URL: http://www.kscnet.ru/ivs/kvert/); Kamchatka Volcanological Station, Kamchatka Branch of Geophysical Survey, (KB GS RAS), Klyuchi, Kamchatka Krai, Russia (URL: http://volkstat.ru/); MIROVA (Middle InfraRed Observation of Volcanic Activity), a collaborative project between the Universities of Turin and Florence (Italy) supported by the Centre for Volcanic Risk of the Italian Civil Protection Department (URL: http://www.mirovaweb.it/); Hawai'i Institute of Geophysics and Planetology (HIGP) - MODVOLC Thermal Alerts System, School of Ocean and Earth Science and Technology (SOEST), Univ. of Hawai'i, 2525 Correa Road, Honolulu, HI 96822, USA (URL: http://modis.higp.hawaii.edu/); Copernicus Browser, Copernicus Data Space Ecosystem, European Space Agency (URL: https://dataspace.copernicus.eu/browser/).
Agung (Indonesia) — January 2024 Cite this Report
Agung
Indonesia
8.343°S, 115.508°E; summit elev. 2997 m
All times are local (unless otherwise noted)
Three eruptive events reported in April, May, and December 2022
Mount Agung, located on the E end of the island of Bali, Indonesia, rises above the SE rim of the Batur caldera. The summit area extends 1.5 km E-W, with the highest point on the W and a steep-walled 800-m-wide crater on the E. Recorded eruptions date back to the early 19th century. A large and deadly explosive and effusive eruption occurred during 1963-64, which was characterized by voluminous ashfall, pyroclastic flows, and lahars that caused extensive damage and many fatalities. More recent activity was documented during November 2017-June 2019 that consisted of multiple explosions, significant ash plumes, lava flows at the summit crater, and incandescent ejecta. This report covers activity reported during April-May 2022 and December 2022 based on data from the Darwin Volcanic Ash Advisory Center (VAAC).
Activity during 2022 was relatively low and mainly consisted of a few ash plumes during April-May and December. An ash plume on 3 April rising to 3.7 km altitude (700 m above the summit) and drifting N was reported in a Darwin VAAC notice based on a ground report, with ash seen in HIMAWARI-8 visible imagery. Another ash plume was reported at 1120 on 27 May that rose to 5.5 km altitude (2.5 m above the summit); the plume was not visible in satellite or webcam images due to weather clouds. An eruption was reported based on seismic data at 0840 on 13 December, with an estimated plume altitude of 3.7 km; however, no ash was seen using satellite imagery in clear conditions before weather clouds obscured the summit.
Geologic Background. Symmetrical Agung stratovolcano, Bali's highest and most sacred mountain, towers over the eastern end of the island. The volcano, whose name means "Paramount," rises above the SE rim of the Batur caldera, and the northern and southern flanks extend to the coast. The summit area extends 1.5 km E-W, with the high point on the W and a steep-walled 800-m-wide crater on the E. The Pawon cone is located low on the SE flank. Only a few eruptions dating back to the early 19th century have been recorded in historical time. The 1963-64 eruption, one of the largest in the 20th century, produced voluminous ashfall along with devastating pyroclastic flows and lahars that caused extensive damage and many fatalities.
Information Contacts: Darwin Volcanic Ash Advisory Centre (VAAC), Bureau of Meteorology, Northern Territory Regional Office, PO Box 40050, Casuarina, NT 0811, Australia (URL: http://www.bom.gov.au/info/vaac/).
Saunders (United Kingdom) — February 2024 Cite this Report
Saunders
United Kingdom
57.8°S, 26.483°W; summit elev. 843 m
All times are local (unless otherwise noted)
Persistent thermal anomalies from the summit crater lava lake during February 2023-January 2024
Saunders is one of eleven islands that comprise the South Sandwich Islands in the South Atlantic. The active Mount Michael volcano has been in almost continuous eruption since November 2014 (BGVN 48:02). Recent activity has resulted in intermittent thermal anomalies and gas-and-steam emissions (BGVN 47:03, 48:02). Visits are infrequent due to its remote location, and cloud cover often prevents satellite observations. Satellite thermal imagery and visual observation of incandescence during a research expedition in 2019 (BGVN 28:02 and 44:08) and a finding confirmed by a National Geographic Society research team that summited Michael in November 2022 reported the presence of a lava lake.
Although nearly constant cloud cover during February 2023 through January 2024 greatly limited satellite observations, thermal anomalies from the lava lake in the summit crater were detected on clear days, especially around 20-23 August 2023. Anomalies similar to previous years (eg. BGVN 48:02) were seen in both MIROVA (Middle InfraRed Observation of Volcanic Activity) data from MODIS instruments and in Sentinel 2 infrared imagery. The only notable sulfur dioxide plume detected near Saunders was on 25 September 2023, with the TROPOMI instrument aboard the Sentinel-5P satellite.
Geologic Background. Saunders Island consists of a large central volcanic edifice intersected by two seamount chains, as shown by bathymetric mapping (Leat et al., 2013). The young Mount Michael stratovolcano dominates the glacier-covered island, while two submarine plateaus, Harpers Bank and Saunders Bank, extend north. The symmetrical Michael has a 500-m-wide summit crater and a remnant of a somma rim to the SE. Tephra layers visible in ice cliffs surrounding the island are evidence of recent eruptions. Ash clouds were reported from the summit crater in 1819, and an effusive eruption was inferred to have occurred from a N-flank fissure around the end of the 19th century and beginning of the 20th century. A low ice-free lava platform, Blackstone Plain, is located on the north coast, surrounding a group of former sea stacks. A cluster of cones on the SE flank, the Ashen Hills, appear to have been modified since 1820 (LeMasurier and Thomson, 1990). Analysis of satellite imagery available since 1989 (Gray et al., 2019; MODVOLC) suggests frequent eruptive activity (when weather conditions allow), volcanic clouds, steam plumes, and thermal anomalies indicative of a persistent, or at least frequently active, lava lake in the summit crater. Due to this observational bias, there has been a presumption when defining eruptive periods that activity has been ongoing unless there is no evidence for at least 10 months.
Information Contacts: MIROVA (Middle InfraRed Observation of Volcanic Activity), a collaborative project between the Universities of Turin and Florence (Italy) supported by the Centre for Volcanic Risk of the Italian Civil Protection Department (URL: http://www.mirovaweb.it/); NASA Global Sulfur Dioxide Monitoring Page, Atmospheric Chemistry and Dynamics Laboratory, NASA Goddard Space Flight Center (NASA/GSFC), 8800 Greenbelt Road, Goddard MD 20771, USA (URL: https://so2.gsfc.nasa.gov/); Copernicus Browser (URL: https://dataspace.copernicus.eu/browser).
Tengger Caldera (Indonesia) — February 2024 Cite this Report
Tengger Caldera
Indonesia
7.942°S, 112.95°E; summit elev. 2329 m
All times are local (unless otherwise noted)
Minor ash emission in December 2023; persistent weak thermal anomaly in the Bromo crater
Tengger Caldera, located at the N end of a volcanic massif in Indonesia’s East Java, consists of five overlapping stratovolcanoes. The youngest and only active cone in the 16-km-wide caldera is Bromo, which typically produces gas-and-steam plumes, occasional ash plumes and explosions, and weak thermal signals (BGVN 44:05, 47:01). This report covers activity during January 2022-December 2023, consisting of mostly white gas-and-steam emissions and persistent weak thermal anomalies. Information was provided by the Pusat Vulkanologi dan Mitigasi Bencana Geologi (PVMBG, also known as Indonesian Center for Volcanology and Geological Hazard Mitigation, CVGHM) and satellite imagery. The Alert Level remained at 2 (on a scale of 1-4), and visitors were warned to stay at least 1 km from the crater.
Activity was generally low during the reporting period, similar to that in 2021. According to almost daily images from MAGMA Indonesia (a platform developed by PVMBG), white emissions and plumes rose from 50 to 900 m above the main crater during this period (figure 24). During several days in March and June 2022, white plumes reached heights of 1-1.2 km above the crater.
After an increase in activity at 2114 on 3 February 2023, a PVMBG team that was sent to observe white emissions rising as high as 300 m during 9-12 February and heard rumbling noises. A sulfur dioxide odor was also strong near the crater and measurements indicated that levels were above the healthy (non-hazardous) threshold of 5 parts per million; differential optical absorption spectroscopy (DOAS) measurements indicated an average flux of 190 metric tons per day on 11 February. Incandescence originating from a large fumarole in the NNW part of the crater was visible at night. The team observed that vegetation on the E caldera wall was yellow and withered. The seismic network recorded continuous tremor and deep and shallow volcanic earthquakes.
According to a PVMBG press release, activity increased on 13 December 2023 with white, gray, and brown emissions rising as high as 900 m above Bromo’s crater rim and drifting in multiple directions (figure 25). The report noted that tremor was continuous and was accompanied in December by three volcanic earthquakes. Deformation data indicated inflation in December. There was no observable difference in the persistent thermal anomaly in the crater between 11 and 16 December 2023.
All clear views of the Bromo crater throughout this time, using Sentinel-2 infrared satellite images, showed a weak persistent thermal anomaly; none of the anomalies were strong enough to cause MODVOLC Thermal Alerts. A fire in the SE part of the caldera in early September 2023 resulted in a brief period of strong thermal anomalies.
Geologic Background. The 16-km-wide Tengger caldera is located at the northern end of a volcanic massif extending from Semeru volcano. The massive volcanic complex dates back to about 820,000 years ago and consists of five overlapping stratovolcanoes, each truncated by a caldera. Lava domes, pyroclastic cones, and a maar occupy the flanks of the massif. The Ngadisari caldera at the NE end of the complex formed about 150,000 years ago and is now drained through the Sapikerep valley. The most recent of the calderas is the 9 x 10 km wide Sandsea caldera at the SW end of the complex, which formed incrementally during the late Pleistocene and early Holocene. An overlapping cluster of post-caldera cones was constructed on the floor of the Sandsea caldera within the past several thousand years. The youngest of these is Bromo, one of Java's most active and most frequently visited volcanoes.
Information Contacts: Pusat Vulkanologi dan Mitigasi Bencana Geologi (PVMBG, also known as Indonesian Center for Volcanology and Geological Hazard Mitigation, CVGHM), Jalan Diponegoro 57, Bandung 40122, Indonesia (URL: http://www.vsi.esdm.go.id/); MAGMA Indonesia, Kementerian Energi dan Sumber Daya Mineral (URL: https://magma.esdm.go.id/v1); Copernicus Browser, Copernicus Data Space Ecosystem, European Space Agency (URL: https://dataspace.copernicus.eu/browser/); Hawai'i Institute of Geophysics and Planetology (HIGP) - MODVOLC Thermal Alerts System, School of Ocean and Earth Science and Technology (SOEST), Univ. of Hawai'i, 2525 Correa Road, Honolulu, HI 96822, USA (URL: http://modis.higp.hawaii.edu/).
Shishaldin (United States) — December 2023 Cite this Report
Shishaldin
United States
54.756°N, 163.97°W; summit elev. 2857 m
All times are local (unless otherwise noted)
New eruption with significant Strombolian explosions, ash plumes, and ashfall
Shishaldin is located on the eastern half of Unimak Island, one of the Aleutian Islands. Frequent explosive activity, primarily consisting of Strombolian ash eruptions from the small summit crater, but sometimes producing lava flows, has been recorded since the 18th century. The previous eruption ended in May 2020 and was characterized by intermittent thermal activity, increased seismicity and surface temperatures, ash plumes, and ash deposits (BGVN 45:06). This report covers a new eruption during July through November 2023, which consisted of significant explosions, ash plumes, ashfall, and lava fountaining. Information comes from daily, weekly, and special reports from the Alaska Volcano Observatory (AVO) and various satellite data. AVO monitors the volcano using local seismic and infrasound sensors, satellite data, web cameras, and remote infrasound and lightning networks.
AVO reported that intermittent tremor and low-frequency earthquakes had gradually become more regular and consistent during 10-13 July. Strongly elevated surface temperatures at the summit were identified in satellite images during 10-13 July. On 11 July AVO raised the Aviation Color Code (ACC) to Yellow (the second color on a four-color scale) and Volcano Alert Level (VAL) to Advisory (the second level on a four-level scale) at 1439. Later in the day on 11 July summit crater incandescence was observed in webcam images. Observations of the summit suggested that lava was likely present at the crater, which prompted AVO to raise the ACC to Orange (the second highest color on a four-color scale) and the VAL to Watch (the second highest level on a four-level scale). The US Coast Guard conducted an overflight on 12 July and confirmed that lava was erupting from the summit. That same day, sulfur dioxide emissions were detected in satellite images.
A significant explosion began at 0109 on 14 July that produced an ash plume that rose to 9-12 km altitude and drifted S over the Pacific Ocean (figure 43). Webcam images and photos taken around 0700 from a ship SW off Unimak Island showed small lahar deposits, which were the result of the interaction of hot pyroclastic material and snow and ice on the flanks. There was also ashfall on the SW and N flanks. A smaller explosion at 0710 generated an ash plume that rose to 4.5 km altitude. Webcam images and pilot reports showed continued low-level ash emissions during the morning, rising to less than 4.6 km altitude; those emissions included a small ash plume near the summit around 1030 resulting from a small explosion.
Seismic tremor amplitude began increasing at around 1700 on 15 July; strongly elevated surface temperatures were also reported. An ash plume rose to 4.6 km altitude and drifted SSE at 2100, based on a satellite image. A continuous ash plume during 2150 through 2330 rose to 5 km altitude and extended 125 km S. At 2357 AVO raised the ACC to Red (the highest color on a four-color scale) and the VAL to Warning (the highest level on a four-level scale), noting that seismicity remained elevated for more than six hours and explosion signals were frequently detected by regional infrasound (pressure sensor) networks. Explosions generated an ash plume that rose to 4.9 km altitude and drifted as far as 500 km SE. Activity throughout the night declined and by 0735 the ACC was lowered to Orange and the VAL to Watch. High-resolution satellite images taken on 16 July showed pyroclastic deposits extending as far as 3 km from the vent; these deposits generated lahars that extended further down the drainages on the flanks. Ash deposits were mainly observed on the SSE flank and extended to the shore of Unimak Island. During 16-17 July lava continued to erupt at the summit, which caused strongly elevated surface temperatures that were visible in satellite imagery.
Lava effusion increased at 0100 on 18 July, as noted in elevated surface temperatures identified in satellite data, increasing seismic tremor, and activity detected on regional infrasound arrays. A significant ash plume at 0700 rose to 7 km altitude and continued until 0830, eventually reaching 9.1 km altitude and drifting SSE (figure 44). As a result, the ACC was raised to Red and the VAL to Warning. By 0930 the main plume detached, but residual low-level ash emissions continued for several hours, remaining below 3 km altitude and drifting S. The eruption gradually declined and by 1208 the ACC was lowered to Orange and the VAL was lowered to Watch. High-resolution satellite images showed ash deposits on the SW flank and pyroclastic deposits on the N, E, and S flanks, extending as far as 3 km from the vent; lahars triggered by the eruption extended farther down the flanks (figure 45). Lava continued to erupt from the summit crater on 19 July.
Elevated surface temperatures were detected in satellite images during 19-25 July, despite occasional weather cloud cover, which was consistent with increased lava effusion. During 22-23 July satellite observations acquired after the eruption from 18 July showed pyroclastic flow and lahar deposits extending as far as 3 km down the N, NW, and NE flanks and as far as 1.5 km down the S and SE flanks. Ash deposits covered the SW and NE flanks. No lava flows were observed outside the crater. On 22 July a sulfur dioxide plume was detected in satellite data midday that had an estimated mass of 10 kt. In a special notice issued at 1653 on 22 July AVO noted that eruptive activity had intensified over the previous six hours, which was characterized by an hours-long steady increase in seismic tremor, intermittent infrasound signals consistent with small explosions, and an increase in surface temperatures that were visible in satellite data. Pilots first reported low-level ash plumes at around 1900. At 2320 an ash plume had risen to 9 km altitude based on additional pilot reports and satellite images. The ACC was increased to Red and the VAL to Warning at 2343. Satellite images indicated growth of a significantly higher ash plume that rose to 11 km altitude continued until 0030 and drifted NE. During the early morning hours of 23 July ash plumes had declined to 4.6 k altitude. Seismic tremor peaked at 0030 on 23 July and began to rapidly decline at 0109; active ash emissions were no longer visible in satellite data by 0130. The ACC was lowered to Orange and the VAL to Watch at 0418; bursts of increased seismicity were recorded throughout the morning, but seismicity generally remained at low levels. Elevated surface temperatures were visible in satellite data until about 0600. On 24 July pilots reported seeing vigorous gas-and-steam plumes rising to about 3 km altitude; the plumes may have contained minor amounts of ash.
During 24-25 July low level seismicity and volcanic tremor were detected at low levels following the previous explosion on 23 July. Strongly elevated surface temperatures were observed at the summit crater in satellite data. Around 2200 on 25 July seismicity began to increase, followed by infrasound signals of explosions after 0200 on 26 July. An ash plume rose to 3 km altitude at 0500 and drifted ENE, along with an associated sulfur dioxide plume that drifted NE and had an estimated mass of 22 kt. Diffuse ash emissions were visible in satellite data and rose to 6.1-7.6 km altitude and extended 125 km from the volcano starting around 1130. These ash events were preceded by about seven hours of seismic tremor, infrasound detections of explosions, and five hours of increased surface temperatures visible in satellite data. Activity began to decline around 1327, which included low-frequency earthquakes and decreased volcanic tremor, and infrasound data no longer detected significant explosions. Surface temperatures remained elevated through the end of the month.
Seismicity, volcanic tremor, and ash emissions remained at low levels during early August. Satellite images on 1 August showed that some slumping had occurred on the E crater wall due to the recent explosive activity. Elevated surface temperatures continued, which was consistent with cooling lava. On 2 August small explosive events were detected, consistent with low-level Strombolian activity. Some episodes of volcanic tremor were reported, which reflected low-level ash emissions. Those ash emissions rose to less than 3 km altitude and drifted as far as 92.6 km N. Pilots that were located N of the volcano observed an ash plume that rose to 2.7 km altitude. Seismicity began to increase in intensity around 0900 on 3 August. Seismicity continued to increase throughout the day and through the night with strongly elevated surface temperatures, which suggested that lava was active at the surface.
An ash cloud that rose to 7.6-7.9 km altitude and drifted 60-75 km NE was visible in a satellite image at 0520 on 4 August. Pilots saw and reported the plume at 0836 (figure 46). By 0900 the plume had risen to 9.1 km altitude and extended over 100 km NE. AVO raised the ACC to Red and the VAL to Warning as a result. Seismic tremor levels peaked at 1400 and then sharply declined at 1500 to slightly elevated levels; the plume was sustained during the period of high tremor and drifted N and NE. The ACC was lowered to Orange and the VAL to Watch at 2055. During 5-14 August seismicity remained low and surface temperatures were elevated based on satellite data due to cooling lava. On 9 August a small lava flow was observed that extended from the crater rim to the upper NE flank. It had advanced to 55 m in length and appeared in satellite imagery on 11 August. Occasional gas-and-steam plumes were noted in webcam images. At 1827 AVO noted that seismic tremor had steadily increased during the afternoon and erupting lava was visible at the summit in satellite images.
Strong explosion signals were detected at 0200 on 15 August. An ash cloud that was visible in satellite data extended 100 km NE and may have risen as high as 11 km altitude around 0240. By 0335 satellite images showed the ash cloud rising to 7.6 km altitude and drifting NE. Significant seismicity and explosions were detected by the local AVO seismic and infrasound networks, and volcanic lightning was detected by the World Wide Lightning Location Network (WWLLN). A sulfur dioxide plume associated with the eruption drifted over the S Bering Sea and parts of Alaska and western Canada. Seismicity was significantly elevated during the eruption but had declined by 1322. A pilot reported that ash emissions continued, rising as high as 4.9 km altitude. Elevated surface temperatures detected in satellite data were caused by hot, eruptive material (pyroclastic debris and lava) that accumulated around the summit. Eruptive activity declined by 16 August and the associated sulfur dioxide plume had mostly dissipated; remnants continued to be identified in satellite images at least through 18 August. Surface temperatures remained elevated based on satellite images, indicating hot material on the upper parts of the volcano. Small explosions were detected in infrasound data on the morning of 19 August and were consistent with pilot reports of small, short-lived ash plumes that rose to about 4.3 km altitude. Low-level explosive activity was reported during 20-24 August, according to seismic and infrasound data, and weather clouds sometimes prevented views. Elevated surface temperatures were observed in satellite images, which indicated continued hot material on the upper parts of the volcano.
Seismic tremor began to increase at around 0300 on 25 August and was followed by elevated surface temperatures identified in satellite images, consistent with erupting lava. Small explosions were recorded in infrasound data. The ACC was raised to Red and the VAL to Warning at 1204 after a pilot reported an ash plume that rose to 9.1 km altitude. Seismicity peaked at 1630 and began to rapidly decline at around 1730. Ash plumes rose as high as 10 km altitude and drifted as far as 400 km NE. By 2020 the ash plumes had declined to 6.4 km altitude and continued to drift NE. Ash emissions were visible in satellite data until 0000 on 26 August and seismicity was at low levels. AVO lowered the ACC to Orange and the VAL to Watch at 0030. Minor explosive activity within the summit crater was detected during 26-28 August and strongly elevated surface temperatures were still visible in satellite imagery through the rest of the month. An AVO field crew working on Unimak Island observed a mass flow that descended the upper flanks beginning around 1720 on 27 August. The flow produced a short-lived ash cloud that rose to 4.5 km altitude and rapidly dissipated. The mass flow was likely caused by the collapse of spatter that accumulated on the summit crater rim.
Similar variable explosive activity was reported in September, although weather observations sometimes prevented observations. A moderate resolution satellite image from the afternoon of 1 September showed gas-and-steam emissions filling the summit crater and obscuring views of the vent. In addition, hot deposits from the previous 25-26 August explosive event were visible on the NE flank near the summit, based on a 1 September satellite image. On 2 and 4 September seismic and infrasound data showed signals of small, repetitive explosions. Variable gas-and-steam emissions from the summit were visible but there was no evidence of ash. Possible summit crater incandescence was visible in nighttime webcam images during 3-4 September.
Seismicity began to gradually increase at around 0300 on 5 September and activity escalated at around 0830. A pilot reported an ash plume that rose to 7.6 km altitude at 0842 and continued to rise as high as possibly 9.7 km altitude and drifted SSE based on satellite images (figure 47). The ACC was raised to Red and the VAL to Warning at 0900. In addition to strong tremor and sustained explosions, the eruption produced volcanic lightning that was detected by the WWLLN. Around 1100 seismicity decreased and satellite data confirmed that the altitude of the ash emissions had declined to 7.6 km altitude. By 1200 the lower-altitude portion of the ash plume had drifted 125 km E. Significant ash emissions ended by 1330 based on webcam images. The ACC was lowered to Orange and the VAL to Watch at 1440. Satellite images showed extensive pyroclastic debris flows on most of the flanks that extended 1.2-3.3 km from the crater rim.
During 6-13 September elevated surface temperatures continued to be observed in satellite data, seismicity remained elevated with weak but steady tremor, and small, low-frequency earthquakes and small explosions were reported, except on 12 September. On 6 September a low-level ash plume rose to 1.5-1.8 km altitude and drifted SSE. Occasional small and diffuse gas-and-steam emissions at the summit were visible in webcam images. Around 1800 on 13 September seismic tremor amplitudes began to increase, and small explosions were detected in seismic and infrasound data. Incandescent lava at the summit was seen in a webcam image taken at 0134 on 14 September during a period of elevated tremor. No ash emissions were reported during the period of elevated seismicity. Lava fountaining began around 0200, based on webcam images. Satellite-based radar observations showed that the lava fountaining activity led to the growth of a cone in the summit crater, which refilled most of the crater. By 0730 seismicity significantly declined and remained at low levels.
Seismic tremor began to increase around 0900 on 15 September and rapidly intensified. An explosive eruption began at around 1710, which prompted AVO to raise the ACC to Red and the VAL to Warning. Within about 30 minutes ash plumes drifted E below a weather cloud at 8.2 km altitude. The National Weather Service estimated that an ash-rich plume rose as high as 12.8 km altitude and produced volcanic lightning. The upper part of the ash plume detached from the vent around 1830 and drifted E, and was observed over the Gulf of Alaska. Around the same time, seismicity dramatically decreased. Trace ashfall was reported in the community of False Pass (38 km ENE) between 1800-2030 and also in King Cove and nearby marine waters. Activity declined at around 1830 although seismicity remained elevated, ash emissions, and ashfall continued until 2100. Lightning was again detected beginning around 1930, which suggested that ash emissions continued. Ongoing explosions were detected in infrasound data, at a lower level than during the most energetic phase of this event. Lightning was last detected at 2048. By 2124 the intensity of the eruption had decreased, and ash emissions were likely rising to less than 6.7 km altitude. Seismicity returned to pre-eruption levels. On 16 September the ACC was lowered to Orange and the VAL to Watch at 1244; the sulfur dioxide plume that was emitted from the previous eruption event was still visible over the northern Pacific Ocean. Elevated surface temperatures, gas-and-steam emissions from the vent, and new, small lahars were reported on the upper flanks based on satellite and webcam images. Minor deposits were reported on the flanks which were likely the result of collapse of previously accumulated lava near the summit crater.
Elevated seismicity with tremor, small earthquakes, and elevated surface temperatures were detected during 17-23 September. Minor gas-and-steam emissions were visible in webcam images. On 20 September small volcanic debris flows were reported on the upper flanks. On 21 September a small ash deposit was observed on the upper flanks extending to the NE based on webcam images. Seismic tremor increased significantly during 22-23 September. Regional infrasound sensors suggested that low-level eruptive activity was occurring within the summit crater by around 1800 on 23 September. Even though seismicity was at high levels, strongly elevated surface temperatures indicating lava at the surface were absent and no ash emissions were detected; weather clouds at 0.6-4.6 km altitude obscured views. At 0025 on 24 September AVO noted that seismicity continued at high levels and nearly continuous small infrasound signals began, likely from low-level eruptive activity. Strongly elevated surface temperatures were identified in satellite images by 0900 and persisted throughout the day; the higher temperatures along with infrasound and seismic data were consistent with lava erupting at the summit. Around 1700 similarly elevated surface temperatures were detected from the summit in satellite data, which suggested that more vigorous lava fountaining had started. Starting around 1800 low-level ash emissions rose to altitudes less than 4.6 km altitude and quickly dissipated.
Beginning at midnight on 25 September, a series of seismic signals consistent with volcanic flows were recorded on the N side of the volcano. A change in seismicity and infrasound signals occurred around 0535 and at 0540 a significant ash cloud formed and quickly reached 14 km altitude and drifted E along the Alaska Peninsula. The cloud generated at least 150 lightning strokes with thunder that could be heard by people in False Pass. Seismicity rapidly declined to near background levels around 0600. AVO increased the ACC to Red and the VAL to Warning at 0602. The ash cloud detached from the volcano at around 0700, rose to 11.6 km altitude, and drifted ESE. Trace to minor amounts of ashfall were reported by the communities of False Pass, King Cove, Cold Bay, and Sand Point around 0700. Ash emissions continued at lower altitudes of 6-7.6 km altitude at 0820. Small explosions at the vent area continued to be detected in infrasound data and likely represented low-level eruptive activity near the vent. Due to the significant decrease in seismicity and ash emissions the ACC was lowered to Orange and the VAL to Watch at 1234. Radar data showed significant collapses of the crater that occurred on 25 September. Satellite data also showed significant hot, degassing pyroclastic and lahar deposits on all flanks, including more extensive flows on the ENE and WSW sections below two new collapse scarps. Following the significant activity during 24-25 September, only low-level activity was observed. Seismicity decreased notably near the end of the strong activity on 25 September and continued to decrease through the end of the month, though tremor and small earthquakes were still reported. No explosive activity was detected in infrasound data through 2 October. Gas-and-steam emissions rose to 3.7 km altitude, as reported by pilots and seen in satellite images. Satellite data from 26 September showed that significant collapses had occurred at the summit crater and hot, steaming deposits from pyroclastic flows and lahars were present on all the flanks, particularly to the ENE and WSW. A small ash cloud was visible in webcam images on 27 September, likely from a collapse at the summit cone. High elevated surface temperatures were observed in satellite imagery during 27-28 September, which were likely the result of hot deposits on the flanks erupted on 25 September. Minor steaming at the summit crater and from an area on the upper flanks was visible in webcam images on 28 September.
During October, explosion events continued between periods of low activity. Seismicity significantly increased starting at around 2100 on 2 October; around the same time satellite images showed an increase in surface temperatures consistent with lava fountaining. Small, hot avalanches of rock and lava descended an unspecified flank. In addition, a distinct increase in infrasound, seismicity, and lightning detections was followed by an ash plume that rose to 12.2 km altitude and drifted S and E at 0520 on 3 October, based on satellite images. Nighttime webcam images showed incandescence due to lava fountaining at the summit and pyroclastic flows descending the NE flank. AVO reported that a notable explosive eruption started at 0547 and lasted until 0900 on 3 October, which prompted a rise in the ACC to Red and the VAL to Warning. Subsequent ash plumes rose to 6-7.6 km altitude by 0931. At 1036 the ACC was lowered back to Orange and the VAL to Watch since both seismic and infrasound data quieted substantially and were slightly above background levels. Gas-and-steam emissions were observed at the summit, based on webcam images. Trace amounts of ashfall were observed in Cold Bay. Resuspended ash was present at several kilometers altitude near the volcano. During the afternoon, low-level ash plumes were visible at the flanks, which appeared to be largely generated by rock avalanches off the summit crater following the explosive activity. These ash plumes rose to 3 km altitude and drifted W. Trace amounts of ashfall were reported by observers in Cold Bay and Unalaska and flights to these communities were disrupted by the ash cloud. Satellite images taken after the eruption showed evidence of pyroclastic flows and lahar deposits in drainages 2 km down the SW flank and about 3.2 km down the NE flank, and continued erosion of the crater rim. Small explosion craters at the end of the pyroclastic flows on the NE flank were noted for the first time, which may have resulted from gas-and-steam explosions when hot deposits interact with underlying ice.
During 4 October seismicity, including frequent small earthquakes, remained elevated, but was gradually declining. Ash plumes were produced for over eight hours until around 1400 that rose to below 3.7 km altitude. These ash plumes were primarily generated off the sides of the volcano where hot rock avalanches from the crater rim had entered drainages to the SW and NE. Two explosion craters were observed at the base of the NE deposits about 3.2 km from the crater rim. Webcam images showed the explosion craters were a source of persistent ash emissions; occasional collapse events also generated ash. Seismicity remained elevated with sulfur dioxide emissions that had a daily average of more than 1,000 tons per day, and frequent small earthquakes through the end of the month. Frequent elevated surface temperatures were identified in satellite images and gas-and-steam plumes were observed in webcam images, although weather conditions occasionally prevented clear views of the summit. Emissions were robust during 14-16 October and were likely generated by the interaction of hot material and snow and ice. During the afternoon of 21 October a strong gas-and-steam plume rose to 3-4.6 km altitude and extended 40 km WSW, based on satellite images and reports from pilots. On 31 October the ACC was lowered to Yellow and the VAL was lowered to Advisory.
Activity in November was characterized by elevated seismicity with ongoing seismic tremor and small, low-frequency earthquakes, elevated surface temperatures, and gas-and-steam emissions. There was an increase in seismic and infrasound tremor amplitudes starting at 1940 on 2 November. As a result, the ACC was again raised to Orange and the VAL was increased to Watch, although ash was not identified in satellite data. An ash cloud rose to 6.1 km altitude and drifted W according to satellite data at 2000. By 0831 on 3 November ash emissions were no longer visible in satellite images. On 6 and 9 November air pressure sensors detected signals consistent with small explosions. Small explosions were detected in infrasound data consistent with weak Strombolian activity on 19 and 21 November. Seismicity started to decrease on 21 November. On 25 November gas-and-steam emissions were emitted from the vent as well as from a scarp on the NE side of the volcano near the summit. A gas-and-steam plume extended about 50 km SSE and was observed in satellite and webcam images on 26 November. On 28 November small explosions were observed in seismic and local infrasound data and gas-and-steam emissions were visible from the summit and from the upper NE collapse scarp based on webcam images. Possible small explosions were observed in infrasound data on 30 November. Weakly elevated surface temperatures and a persistent gas-and-steam plume from the summit and collapse scarps on the upper flanks. A passing aircraft reported the gas-and-steam plume rose to 3-3.4 km altitude on 30 November, but no significant ash emissions were detected.
Satellite data. MODIS thermal anomaly data provided through MIROVA (Middle InfraRed Observation of Volcanic Activity) showed a strong pulse of thermal activity beginning in July 2023 that continued through November 2023 (figure 48). This strong activity was due to Strombolian explosions and lava fountaining events at the summit crater. According to data from MODVOLC thermal alerts, a total of 101 hotspots were detected near the summit crater in July (11-14, 16-19, 23-24 and 26), August (4, 25-26, and 29), September (5, 12, and 17), and October (3, 4, and 8). Infrared satellite data showed large lava flows descending primarily the northern and SE flanks during the reporting period (figure 49). Sulfur dioxide plumes often exceeded two Dobson Units (DUs) and drifted in different directions throughout the reporting period, based on satellite data from the TROPOMI instrument on the Sentinel-5P satellite (figure 50).
Geologic Background. The symmetrical glacier-covered Shishaldin in the Aleutian Islands is the westernmost of three large stratovolcanoes in the eastern half of Unimak Island. The Aleuts named the volcano Sisquk, meaning "mountain which points the way when I am lost." Constructed atop an older glacially dissected edifice, it is largely basaltic in composition. Remnants of an older edifice are exposed on the W and NE sides at 1,500-1,800 m elevation. There are over two dozen pyroclastic cones on its NW flank, which is covered by massive aa lava flows. Frequent explosive activity, primarily consisting of Strombolian ash eruptions from the small summit crater, but sometimes producing lava flows, has been recorded since the 18th century. A steam plume often rises from the summit crater.
Information Contacts: Alaska Volcano Observatory (AVO), a cooperative program of a) U.S. Geological Survey, 4200 University Drive, Anchorage, AK 99508-4667 USA (URL: https://avo.alaska.edu/), b) Geophysical Institute, University of Alaska, PO Box 757320, Fairbanks, AK 99775-7320, USA, and c) Alaska Division of Geological & Geophysical Surveys, 794 University Ave., Suite 200, Fairbanks, AK 99709, USA (URL: http://dggs.alaska.gov/); MIROVA (Middle InfraRed Observation of Volcanic Activity), a collaborative project between the Universities of Turin and Florence (Italy) supported by the Centre for Volcanic Risk of the Italian Civil Protection Department (URL: http://www.mirovaweb.it/); Hawai'i Institute of Geophysics and Planetology (HIGP) - MODVOLC Thermal Alerts System, School of Ocean and Earth Science and Technology (SOEST), Univ. of Hawai'i, 2525 Correa Road, Honolulu, HI 96822, USA (URL: http://modis.higp.hawaii.edu/); NASA Global Sulfur Dioxide Monitoring Page, Atmospheric Chemistry and Dynamics Laboratory, NASA Goddard Space Flight Center (NASA/GSFC), 8800 Greenbelt Road, Goddard, Maryland, USA (URL: https://so2.gsfc.nasa.gov/); Copernicus Browser, Copernicus Data Space Ecosystem, European Space Agency (URL: https://dataspace.copernicus.eu/browser/).
Ioto
Japan
24.751°N, 141.289°E; summit elev. 169 m
All times are local (unless otherwise noted)
New eruption with discolored water, ejecta, and floating pumice during October-December 2023
Ioto (Iwo-jima), located about 1,200 km S of Tokyo, lies within a 9-km-wide submarine caldera along the Izu-Bonin-Mariana volcanic arc. Previous eruptions date back to 1889 and have consisted of dominantly phreatic explosions, pumice deposits during 2001, and discolored water. A submarine eruption during July through December 2022 was characterized by discolored water, pumice deposits, and gas emissions (BGVN 48:01). This report covers a new eruption during October through December 2023, which consisted of explosions, black ejecta, discolored water, and floating pumice, based on information from the Japan Meteorological Association (JMA), the Japan Coast Guard (JCG), and satellite data.
JMA reported that an eruption had been occurring offshore of Okinahama on the SE side of the island since 21 October, which was characterized by volcanic tremor, according to the Japan Maritime Self-Defense Force (JMSDF) Iwo Jima Air Base (figure 22). According to an 18 October satellite image a plume of discolored water at the site of this new eruption extended NE (figure 23). During an overflight conducted on 30 October, a vent was identified about 1 km off the coast of Okinahama. Observers recorded explosions every few minutes that ejected dark material about 20 m above the ocean and as high as 150 m. Ejecta from the vent formed a black-colored island about 100 m in diameter, according to observations conducted from the air by the Earthquake Research Institute of the University of Tokyo in cooperation with the Mainichi newspaper (figure 24). Occasionally, large boulders measuring more than several meters in size were also ejected. Observations from the Advanced Land Observing Satellite Daichi-2 and Sentinel-2 satellite images also confirmed the formation of this island (figure 23). Brown discolored water and floating pumice were present surrounding the island.
The eruption continued during November. During an overflight on 3 November observers photographed the island and noted that material was ejected 169 m high, according to a news source. Explosions gradually became shorter, and, by the 3rd, they occurred every few seconds; dark and incandescent material were ejected about 800 m above the vent. On 4 November eruptions were accompanied by explosive sounds. Floating, brown-colored pumice was present in the water surrounding the island. There was a brief increase in the number of volcanic earthquakes during 8-14 November and 24-25 November. The eruption temporarily paused during 9-11 November and by 12 November eruptions resumed to the W of the island. On 10 November dark brown-to-dark yellow-green discolored water and a small amount of black floating material was observed (figure 25). A small eruption was reported on 18 November off the NE coast of the island, accompanied by white gas-and-steam plumes (figure 23). Another pause was recorded during 17-19 November, which then resumed on 20 November and continued erupting intermittently. According to a field survey conducted by the National Institute for Disaster Prevention Science and Technology on 19 November, a 30-m diameter crater was visible on the NE coast where landslides, hot water, and gray volcanic ash containing clay have occurred and been distributed previously. Erupted blocks about 10 cm in diameter were distributed about 90-120 m from the crater. JCG made observations during an overflight on 23 November and reported a phreatomagmatic eruption. Explosions at the main vent generated dark gas-and-ash plumes that rose to 200 m altitude and ejected large blocks that landed on the island and in the ocean (figure 26). Discolored water also surrounded the island. The size of the new island had grown to 450 m N-S x 200 m E-W by 23 November, according to JCG.
The eruption continued through 11 December, followed by a brief pause in activity, which then resumed on 31 December, according to JMA. Intermittent explosions produced 100-m-high black plumes at intervals of several minutes to 30 minutes during 1-10 December. Overflights were conducted on 4 and 15 December and reported that the water surrounding the new island was discolored to dark brown-to-dark yellow-green (figure 27). No floating material was reported during this time. In comparison to the observations made on 23 November, the new land had extended N and part of it had eroded away. In addition, analysis by the Geospatial Information Authority of Japan using SAR data from Daichi-2 also confirmed that the area of the new island continued to decrease between 4 and 15 December. Ejected material combined with wave erosion transformed the island into a “J” shape, 500-m-long and with the curved part about 200 m offshore of Ioto. The island was covered with brown ash and blocks, and the surrounding water was discolored to greenish-brown and contained an area of floating pumice. JCG reported from an overflight on 4 December that volcanic ash-like material found around the S vent on the NE part of the island was newly deposited since 10 November (figure 28). By 15 December the N part of the “J” shaped island had separated and migrated N, connecting to the Okinahama coast and the curved part of the “J” had eroded into two smaller islands (figure 27).
References. Ukawa, M., Fujita, E., Kobayashi, T., 2002, Recent volcanic activity of Iwo Jima and the 2001 eruption, Monthly Chikyu, Extra No. 39, 157-164.
Geologic Background. Ioto, in the Volcano Islands of Japan, lies within a 9-km-wide submarine caldera. The volcano is also known as Ogasawara-Iojima to distinguish it from several other "Sulfur Island" volcanoes in Japan. The triangular, low-elevation, 8-km-long island narrows toward its SW tip and has produced trachyandesitic and trachytic rocks that are more alkalic than those of other volcanoes in this arc. The island has undergone uplift for at least the past 700 years, accompanying resurgent doming of the caldera; a shoreline landed upon by Captain Cook's surveying crew in 1779 is now 40 m above sea level. The Motoyama plateau on the NE half of the island consists of submarine tuffs overlain by coral deposits and forms the island's high point. Many fumaroles are oriented along a NE-SW zone cutting through Motoyama. Numerous recorded phreatic eruptions, many from vents on the W and NW sides of the island, have accompanied the uplift.
Information Contacts: Japan Meteorological Agency (JMA), 1-3-4 Otemachi, Chiyoda-ku, Tokyo 100-8122, Japan (URL: http://www.jma.go.jp/jma/indexe.html); Japan Coast Guard (JCG) Volcano Database, Hydrographic and Oceanographic Department, 3-1-1, Kasumigaseki, Chiyoda-ku, Tokyo 100-8932, Japan (URL: https://www1.kaiho.mlit.go.jp/GIJUTSUKOKUSAI/kaiikiDB/kaiyo22-2.htm); Copernicus Browser, Copernicus Data Space Ecosystem, European Space Agency (URL: https://dataspace.copernicus.eu/browser/); Asahi, 5-3-2, Tsukiji, Chuo Ward, Tokyo, 104-8011, Japan (URL: https://www.asahi.com/ajw/articles/15048458).
Search Bulletin Archive by Publication Date
Select a month and year from the drop-downs and click "Show Issue" to have that issue displayed in this tab.
The default month and year is the latest issue available.
Bulletin of the Global Volcanism Network - Volume 42, Number 03 (March 2017)
Axial Seamount (Undersea Features)
Research cruise and new bathymetry reveals lava flows from the 2015 eruption
Barren Island (India)
Intermittent ash plumes and thermal anomalies continue from July 2014 through February 2017
Gamalama (Indonesia)
Weak explosion generates ash plumes during 3-4 August 2016
Kavachi (Solomon Islands)
Evidence of regular explosive activity during 2006-2016 from satellite and direct observations
Kuchinoerabujima (Japan)
Explosions on 3 August 2014, 29-30 May 2015 (with pyroclastic flow), and 18-19 June 2015
Manam (Papua New Guinea)
Large ash plume to 19.8 km on 31 July 2015; persistent thermal anomalies during 2014-2016
Pavlof (United States)
Ash plume to 11 km on 27 March 2016 that drifted 1,200 km NE; multiple smaller ash events through July 2016
Poas (Costa Rica)
Phreatic explosions from the crater lake in June-August 2016
Sheveluch (Russia)
Lava dome extrusion continues with occasional explosions and ash plumes through February 2016
Soputan (Indonesia)
Ash plumes to over 12 km altitude, lava flows, pyroclastic flows, and Strombolian activity during January-February 2016
Axial Seamount (Undersea Features) — March 2017 Cite this Report
Axial Seamount
Undersea Features
45.95°N, 130°W; summit elev. -1410 m
All times are local (unless otherwise noted)
Research cruise and new bathymetry reveals lava flows from the 2015 eruption
The submarine Axial Seamount volcano is located about 470 km offshore of the Oregon coast. An eruption inferred to have started at 2230 on 23 April 2015 with an earthquake swarm (BGVN 40:03) was confirmed during a 14-29 August 2015 research cruise by the R/V Thompson. According to a personal communication on 23 June 2015 from Bill Chadwick (Oregon State University and NOAA), the length of the eruption is unknown, but it was "very likely days to weeks since the deflation lasted for about 10 days and the temperature signals lasted about a month."
The research cruise revealed new lava flows observed from bathymetric data and observations made during a remotely operated underwater vehicle ROV Jason dive. This eruption "produced the largest volume of erupted lava since monitoring and mapping began in the mid-1980's" (Chadwick and others, 2016). Two large lava flows from the N rift zone (8-16 km N of the summit caldera) were at most 127 m thick; some of the thicker areas had drained collapse features indicating molten interiors when emplaced. The ROV traversed the flows for about 2 km. New, thinner lava flows (figure 13) were also identified in the NE summit caldera and on the NE rim.
Three recently published papers, Chadwick and others (2016), Nooner and Chadwick (2016), and Wilcock and others (2016), detail the results of eruptive activity in 1998, 2011, and 2015, based on new data from a research cruise conducted after the 2015 eruption (figures 14 and 15). Scientists from the Monterey Bay Aquarium Research Institute (MBARI) issued a new seafloor map (figure 16) of the area of Axial north of the one shown in figure 14, based on underwater surveys conducted in August 2016, uncovering a number of previously undocumented flows from the 2015 eruption (Phys.org, 2016). MBARI ran identical sets of autonomous underwater vehicles (AUV) survey lines across the entire Axial caldera in 2011, 2014, 2015, and 2016, and during the 2016 survey the AUV collected seafloor samples (figure 13).
According to Wilcock and others (2016), the earthquake rates increases from less than 500 per day to as many as about 2000 per day prior to the eruption on 24 April 2015, then decreased rapidly over the next month following the seismic crisis to a background level of 20 per day. During the eruption there were 600 earthquakes measured every hour, and the seafloor at Axial dropped suddenly by about 2.4 m.
Precise pressure sensors measure vertical movements of the seafloor that take place as the volcano gradually inflates (see figure 14). Deformation of the Axial volcano seafloor as measured by pressure sensors (figure 17) indicated gradual inflation followed by rapid deflation during the three most recent eruptions in 1998, 2011, and 2015.
References: Chadwick, W.W., Jr., Paduan, J.B., Clague, D.A., Dreyer, B.M., Merle, S.G., Bobbitt, A.M., Caress, D.W., Philip, B.T., Kelley, D.S., and Nooner, S.L., 2016 (15 December), Voluminous eruption from a zoned magma body after an increase in supply rate at Axial Seamount, Geophysical Research Letters, v. 43, issue 23, pp. 12,063-12,070; DOI: 10.1002/2016GL071327.
Nooner, S.L., and Chadwick, W.W., Jr., 2016 (16 December), Inflation-predictable behavior and co-eruption deformation at Axial Seamount, Science, v. 354, issue 6318, pp. 1399-1403; DOI: 10.1126/science.aah4666.
Phys.org, 2016 (15 Dec), MBARI's seafloor maps provide new information about 2015 eruption at Axial Seamount (URL: https://phys.org/news/2016-12-mbari-seafloor-eruption-axial-seamount.html).
Wilcock, W.S.D., Tolstoy, M., Waldhauser, F., Garcia, C., Tan, Y.J., Bohnenstiehl, D.R., Caplan-Auerbach, J., Dziak, R.P., Arnulf, A.F., and Mann, M.E., 2016 (16 Dec), Seismic constraints on caldera dynamics from the 2015 Axial Seamount eruption, Science, v. 354, issue 6318, pp. 1395-1399; DOI: 10.1126/science.aah5563.
Geologic Background. Axial Seamount rises 700 m above the mean level of the central Juan de Fuca Ridge crest about 480 km W of Cannon Beach, Oregon, to within about 1,400 m of the ocean surface. It is the most magmatically and seismically active site on the Juan de Fuca Ridge between the Blanco Fracture Zone and the Cobb offset. The summit is marked by an unusual rectangular-shaped caldera (3 x 8 km) that lies between two rift zones and is estimated to have formed about 31,000 years ago. The caldera is breached to the SE and is defined on three sides by boundary faults of up to 150 m relief. Hydrothermal vents with biological communities are located near the caldera fault and along the rift zones. Hydrothermal venting was discovered north of the caldera in 1983. Detailed mapping and sampling efforts have identified more than 50 lava flows emplaced since about 410 CE (Clague et al., 2013). Eruptions producing fissure-fed lava flows that buried previously installed seafloor instrumentation were detected seismically and geodetically in 1998 and 2011, and confirmed shortly after each eruption during submersible dives.
Information Contacts: William Chadwick, Cooperative Institute for Marine Resources Studies (CIMRS), Oregon State University, and NOAA/PMEL Earth-Ocean Interactions Program, Hatfield Marine Science Center, 2115 S.E. OSU Dr., Newport, OR 97365, USA (URL: http://www.pmel.noaa.gov/eoi/).
Barren Island (India) — March 2017 Cite this Report
Barren Island
India
12.278°N, 93.858°E; summit elev. 354 m
All times are local (unless otherwise noted)
Intermittent ash plumes and thermal anomalies continue from July 2014 through February 2017
The eruptive activity at Barren Island that began in October 2013 continued through at least mid-June 2014 (BGVN 39:07). Another eruptive cycle began in March 2015 and continued through 28 February 2016, based on MODIS/MODVOLC thermal anomalies. However, MIROVA hotspots were regular through mid-May 2016, and then sporadic throughout the rest of 2016. The next clear episode began on 15 January 2017 and continued through at least February 2017. Scientists aboard a research ship observed explosions, fire fountains, and lava flows in January 2017.
Activity during October 2013-June 2014. Evidence of renewed activity in the form of lava flows was seen in MODVOLC thermal anomaly data beginning on 12 October 2013. Thermal alert pixels were frequent through 12 February 2014, followed by single anomalies on 12 March and 20 April 2014. Ash plumes were also observed during January-April 2014. Thermal infrared MODIS data processed by the MIROVA system revealed frequent anomalies in April through early May 2014, and in late May to early June; another anomaly was seen in mid-June 2014.
Activity during July 2014-June 2015. No thermal anomalies were seen in MIROVA data for at least five weeks (figure 24), between early June and late July 2014, and then continuing intermittently through the first half of March 2015. The only reported plumes during this time were in the week of 3-9 September 2014 and 22-28 April 2015, but in each case as could not be identified in satellite imagery.
A strong thermal signature resumed on 17 March 2015 (figure 24) and continued for about three weeks before decreasing in intensity. Lower-level thermal activity continued through the first half of June. Thermal anomalies seen in MODVOLC data also resumed on 17 March, and were frequent through 12 June. Eruptions of ash were observed during 5-7 and 12-13 June 2015, with plumes rising to an altitude of 2-3 km and drifting up to 55 km downwind (table 5).
Table 5. Ash plumes at Barren Island, June 2015-February 2016. Legend: Satellite=analysis of satellite images, wind=wind data. Data provided by the Darwin Volcanic Ash Advisory Centre.
| Date |
Max. Altitude (km) |
Drift |
Basis of report |
| 2015 Jun 5-7 |
2.4-3 |
35-45 km NE, E |
Satellite, wind |
| 2015 Jun 12-13 |
2.1 |
25-55 km NE |
Pilot, satellite, wind |
| 2015 Aug 19 |
1.5 |
55 km E |
Satellite, wind |
| 2015 Sep 22 |
1.8 |
45 km E |
Satellite, wind |
| 2015 Oct 8-9 |
1.5-2.1 |
75-100 km NE |
Satellite, wind |
| 2016 Jan 3-4 |
1.5 |
85 km SW |
Satellite, wind |
| 2016 Jan 31-Feb 2 |
1.5 |
165 km SW |
Satellite, wind |
| 2016 Feb 14-15 |
1.5 |
Over 45 km W |
Satellite, wind |
Activity during July 2015-May 2016. Thermal activity paused again for approximately a month in the second half of June and first half of July 2015. Regular thermal anomalies in MODVOLC data stopped after 12 June and resumed on 16 July. Episodic clusters of anomalies with gaps of 1-3 weeks continued until 28 February 2016. Although MODVOLC data did not show thermal anomalies after February 2016, MIROVA data showed ongoing activity until approximately 17 May (figure 25).
A few ash plumes were seen during this period, on 19 August, 22 September, and 8-9 October 2015 (table 5). There were no reported plumes in November or December 2015, but were seen once again in January and February 2016. Plumes typically rose to an altitude of 1.5-2 km and drifted 45-100 km downwind; the longest plume extended 1665 km SW.
Activity during June 2016-February 2017. Eruptive activity apparently stopped around 16-17 May 2016 for at least seven weeks. MODIS thermal data captured by MIROVA showed a few anomalies (less than 20) from the second half of July through the first half of December 2016 (figure 25). Considering the remote location and rare direct observations at this island volcano, it is possible that the anomalies represent intermittent lava emissions. Regular thermal anomalies were recorded by both MIROVA and MODVOLC beginning on 15 January that were continuing at the end of February 2017.
The National Institute of Oceanography (NIO), part of the Indian Council of Scientific and Industrial Research (CSIR), reported activity on 23 January 2017. Scientists aboard a research vessel were collecting sea floor samples when they observed a sudden ash emission. The team moved closer, about 1.6 km from the volcano, and noted small eruptive episodes lasting 5-10 minutes. Ash emissions were visible in the daytime, and lava fountains feeding lava flows on the flanks were visible at night. The team revisited the volcano on 26 January and observed similar activity over four hours. They sampled sediments and water in the vicinity of the eruption and recovered volcanic ejecta.
Geologic Background. Barren Island, a possession of India in the Andaman Sea about 135 km NE of Port Blair in the Andaman Islands, is the only historically active volcano along the N-S volcanic arc extending between Sumatra and Burma (Myanmar). It is the emergent summit of a volcano that rises from a depth of about 2250 m. The small, uninhabited 3-km-wide island contains a roughly 2-km-wide caldera with walls 250-350 m high. The caldera, which is open to the sea on the west, was created during a major explosive eruption in the late Pleistocene that produced pyroclastic-flow and -surge deposits. Historical eruptions have changed the morphology of the pyroclastic cone in the center of the caldera, and lava flows that fill much of the caldera floor have reached the sea along the western coast.
Information Contacts: Darwin Volcanic Ash Advisory Centre (VAAC), Bureau of Meteorology, Northern Territory Regional Office, PO Box 40050, Casuarina, NT 0811, Australia (URL: http://www.bom.gov.au/info/vaac/); The National Institute of Oceanography (NIO), Council of Scientific and Industrial Research (CSIR), New Delhi, India (URL: http://www.nio.org/); Hawai'i Institute of Geophysics and Planetology (HIGP), MODVOLC Thermal Alerts System, School of Ocean and Earth Science and Technology (SOEST), Univ. of Hawai'i, 2525 Correa Road, Honolulu, HI 96822, USA (URL: http://modis.higp.hawaii.edu/); MIROVA (Middle InfraRed Observation of Volcanic Activity), a collaborative project between the Universities of Turin and Florence (Italy) supported by the Centre for Volcanic Risk of the Italian Civil Protection Department (URL: http://www.mirovaweb.it/).
Gamalama (Indonesia) — March 2017 Cite this Report
Gamalama
Indonesia
0.81°N, 127.3322°E; summit elev. 1714 m
All times are local (unless otherwise noted)
Weak explosion generates ash plumes during 3-4 August 2016
Intermittent weak explosions at Gamalama resulting in ash plumes have occurred for many decades, most recently in September 2012, December 2014, and July-September 2015 (BGVN 40:12). This report covers activity between 1 December 2015 and February 2017. Data were primarily drawn from reports issued by the Pusat Vulkanologi dan Mitigasi Bencana Geologi (PVMBG, also known as Center for Volcanology and Geological Hazard Mitigation) and the Darwin Volcanic Ash Advisory Centre (VAAC).
During 1 January-6 March 2016, PVMBG noted that seismicity fluctuated but decreased overall; shallow volcanic earthquakes and signals indicating emissions appeared on 3 March and a series of deep volcanic earthquakes were detected on 6 March. The Alert Level remained at 2 (on a scale of 1-4), and visitors and residents were warned not to approach the crater within a 1.5-km radius.
PVMBG reported that, at 0628 on 3 August 2016, a weak explosion generated an ash plume that rose 500-600 m above the crater and drifted SE and S. Ash emissions decreased at 0655. Consistent with this, the Darwin VAAC, based on analyses of satellite imagery and wind model data, and information from PVMBG, reported that ash plumes reached a maximum altitude of 2.7 km (summit elevation is 1.7 km) and drifted S, SE, E, and NE. Ashfall was reported in areas on the SSE flank, including the Ake Huda area.
A news account (Jakarta Globe) stated that the Babullah Airport in Ternate, North Maluku, was closed for a day while volcanic ash was cleared from the runway (about 6 km ENE of the volcano). On 5 August PVMBG noted that seismicity continued to be elevated, although inclement weather prevented visual observations.
Geologic Background. Gamalama is a near-conical stratovolcano that comprises the entire island of Ternate off the western coast of Halmahera, and is one of Indonesia's most active volcanoes. The island was a major regional center in the Portuguese and Dutch spice trade for several centuries, which contributed to the extensive documentation of activity. Three cones, progressively younger to the north, form the summit. Several maars and vents define a rift zone, parallel to the Halmahera island arc, that cuts the volcano; the S-flank Ngade maar formed after about 14,500–13,000 cal. BP (Faral et al., 2022). Eruptions, recorded frequently since the 16th century, typically originated from the summit craters, although flank eruptions have occurred in 1763, 1770, 1775, and 1962-63.
Information Contacts: Pusat Vulkanologi dan Mitigasi Bencana Geologi (PVMBG, also known as Center of Volcanology and Geological Hazard Mitigation (CVGHM), Jalan Diponegoro 57, Bandung 40122, Indonesia (URL: http://www.vsi.esdm.go.id/); Darwin Volcanic Ash Advisory Centre (VAAC), Bureau of Meteorology, Northern Territory Regional Office, PO Box 40050, Casuarina, NT 0811, Australia (URL: http://www.bom.gov.au/info/vaac/); Jakarta Globe (URL: http://jakartaglobe.id/).
Kavachi (Solomon Islands) — March 2017 Cite this Report
Kavachi
Solomon Islands
8.991°S, 157.979°E; summit elev. -20 m
All times are local (unless otherwise noted)
Evidence of regular explosive activity during 2006-2016 from satellite and direct observations
The submarine Kavachi volcano in the Solomon Islands south of Gatokae and Vangunu islands is frequently active but rarely observed. Consistent activity was reported for more than 4 years between November 1999 and August 2003. An 8-month period of quiet was broken with another explosive eruption above the ocean surface on 15 March 2004 (BGVN 30:03). No observations of ongoing activity are known over the next two years, though eruptions may have continued. Satellite imagery using the Advanced Spaceborne Thermal Emission and Reflection Radiometer (ASTER) during 2006-2016 frequently revealed evidence of activity, on at least 35 days, using the Visible Near Infrared (VNIR) bands. Very little ASTER imagery is available for Kavachi during 2001-2005.
ASTER images on 27 February and 24 March 2006 (figure 13) show renewed activity. Vigorous upwelling along with turbulent ash-laden water and a sulfur odor was witnessed on 6 April 2007 (BGVN 32:07). An ASTER image on 15 June 2007 (figure 14) showed pulses of discolored water originating from the vent, confirming ongoing activity. A small area of discolored water was next seen in satellite imagery on 12 December 2007. A small plume of discolored water appeared in ASTER imagery again on 26 February 2008. On 20 March 2008 the Landsat 7 Enhanced Thematic Mapper captured an image of an ash-and-steam eruption plume extending about 25 km NNE towards Gatokae (figure 15). The next satellite evidence of discolored water plumes were on 7 October 2008.
An image on 11 November 2009 showed a larger very bright spot above the summit, possibly indicating turbulent activity at the ocean surface. Evidence of activity became more frequent in 2010, with imagery showing plumes on 15 February, 19 March, 23 June, 11 September, and 30 November. Submarine plumes continued to be visible often in ASTER images the following year, on 1 January, 13 March, 9 May, and 16 October 2011. The next available satellite image with a discolored submarine plume from Kavachi was on 9 April 2012. Additional plumes were seen on 16 April, 3 June (figure 16), 31 August, and 26 November 2012.
Intermittent satellite evidence of ongoing activity continued in 2013 with a discolored water plumes on 28 April, 15 June, 8 July, 25 August, 10 September, and 8 December. On 24 September 2013, Brennan Phillips of the University of Rhode Island passed within 2 km of the main peak onboard the M/Y Alucia but "did not see any visual eruptive activity on the surface."
Although the imagery is not conclusive, many of the ASTER images after 3 June 2012 appeared to show a small island. On 9 January 2014 the ASTER imagery was much clearer, providing greater visual evidence that eruptive activity had built a small island from which discolored water plumes were emanating (figure 17). A few weeks later, on 29 January, the Earth Observing 1 (EO1) Advanced Land Imager (ALI) obtained an image of a submarine plume (BGVN 39:07) and turbulent source area similar to those seen in ASTER imagery. Additional activity was in evidence on 21 March and 8 May.
A cruise ship operated by EYOS Expeditions reported an eruption "at least four times" on 10 June 2014 (figure 18). The Expeditions' website noted that a staff member "spotted on the horizon discolored water and disturbances on the surface. As the vessel approached closer a few large plumes of water broke the surface about once every 10 minutes. Just before the ship left, however, [the] sea seemed to erupt and a massive plume of water and ash shot high into the air…." The island, or possibly an eruption exhibiting turbulence with abundant ash at the surface, appeared again on a 9 November 2014 image, and submarine plumes were evident in an 11 December 2014 image.
An expedition for National Geographic in January 2015 took place during a rare lull in volcanic activity that enabled access to the volcano for mapping and sampling. B. Phillips reported that no eruptive activity was seen while at the summit location on 12-14 and 18 January 2015, but there was a large surface plume and lots of off-gassing from the crater rim; ASTER imagery confirmed a plume of discolored water on 12 January. Autonomous cameras deployed directly into the crater observed sharks, reef fish, and what appear to larvaceans (National Geographic, 2015).
Satellite imagery showed discolored submarine plumes on 18 October 2015, but then not again until 26 August 2016. Eruptions were witnessed on a second visit by B. Phillips for National Geographic during 31 October-1 November 2016 (see National Geographic, 2017). Activity consisted of phreato-magmatic explosions approximately every 7 minutes that sent steam, ash, and incandescent tephra up to 50 m above the ocean surface. There was an occasional larger eruption roughly every hour. A remotely operated surface "drone" with a GoPro camera was right at the edge of the explosion but remained functional. Small lava particles stuck to the PVC hull of the vehicle itself were recovered and given to the Marine Geological Samples Laboratory (MGSL) of the Graduate School of Oceanography (GSO), University of Rhode Island."
Bathymetric survey. A paper by Phillips and others (2016) following the January 2015 visit included medium-resolution bathymetry of the main peak (figure 19), along with benthic imagery, biological observations, petrological and geochemical analysis of samples from the crater rim, measurement of water temperature and gas flux over the summit, and descriptions of the hydrothermal plume structure. Based on the bathymetry, the summit was described by Phillips and others (2016) as being oblong with a pockmarked crater measuring approximately 75 x 120 m, and a rim rising to an average of 24 m depth. The deepest soundings on the peak were about 70 m and indicated asymmetrical terrain surrounded by almost uniform flanks with 18° slopes that descend to depths greater than 1,000 m. They confirmed the existence of a "southwest extension," or secondary summit rising to 260 m depth 1.3 km SW of the main summit.
References: National Geographic, 2015, Sharks discovered inside underwater volcano (exclusive video) (URL: http://video.nationalgeographic.com/video/expedition-raw/150708-sciex-exraw-sharks-underwater-volcano; https://www.youtube.com/watch?v=0e3t18rrjOA).
National Geographic, 2017, Robot vs. Volcano: "Sometimes It's Just Fun to Blow Stuff Up" (exclusive) (URL: http://video.nationalgeographic.com/video/expedition-raw/170419-sciex-exraw-robot-vs-volcano-sometimes-just-fun-to-blow-stuff-up; https://www.youtube.com/watch?v=Ca0zAAIVK3E).
Phillips, B.T., Dunbabin, M., Henning, B., Howell, C., DeCiccio, A., Flinders, A., Kelley, K.A., Scott, J.J., Albert, S., Carey, S., Tsadok, R., and Grinham, A., 2016. Exploring the "Sharkcano": Biogeochemical observations of the Kavachi submarine volcano (Solomon Islands), Oceanography v. 29(4), p. 160-169 (https://doi.org/10.5670/oceanog.2016.85).
Geologic Background. Named for a sea-god of the Gatokae and Vangunu peoples, Kavachi is located in the Solomon Islands south of Vangunu Island. Sometimes referred to as Rejo te Kvachi ("Kavachi's Oven"), this shallow submarine basaltic-to-andesitic volcano has produced ephemeral islands up to 1 km long many times since its first recorded eruption during 1939. Residents of the nearby islands of Vanguna and Nggatokae (Gatokae) reported "fire on the water" prior to 1939, a possible reference to earlier eruptions. The roughly conical edifice rises from water depths of 1.1-1.2 km on the north and greater depths to the SE. Frequent shallow submarine and occasional subaerial eruptions produce phreatomagmatic explosions that eject steam, ash, and incandescent bombs. On a number of occasions lava flows were observed on the ephemeral islands.
Information Contacts: EYOS Expeditions, Knox House, 16-18 Finch Rd, Douglas, Isle of Man, IM1 2PT (URL: http://www.eyos-expeditions.com/2014/07/kavachi-volcano/, https://my.yb.tl/eyosexpeditions/1604/); Brennan Phillips, Harvard University, Wyss Institute for Biologically Inspired Engineering, Wood Lab, 60 Oxford St., Cambridge, MA 02138 USA; Image Database for Volcanoes, Geological Survey of Japan, National Institute of Advanced Industrial Science and Technology (AIST) (URL: https://gbank.gsj.jp/vsidb/image/index-E.html, https://gbank.gsj.jp/vsidb/image/Kavachi/aster_p1.html); USGS LandsatLook Viewer (URL: https://landsatlook.usgs.gov/).
Kuchinoerabujima (Japan) — March 2017 Cite this Report
Kuchinoerabujima
Japan
30.443°N, 130.217°E; summit elev. 657 m
All times are local (unless otherwise noted)
Explosions on 3 August 2014, 29-30 May 2015 (with pyroclastic flow), and 18-19 June 2015
Intermittent ash explosions during the last century have characterized activity at Japan's Kuchinoerabujima volcano, located at the northern end of the Ryukyu Islands approximately 260 km S of Nagasaki, Japan. Brief periods of higher seismicity had been detected in the last approximately 30 years, although no explosions had been recorded since 1980 (BGVN 35:11 and 38:01). A new explosion occurred on 3 August 2014, and activity remained elevated through June 2015. Information on the latest activity is provided by the Japan Meteorological Agency (JMA) monthly reports and aviation alerts are from the Tokyo Volcanic Ash Advisory Center (VAAC).
A modest explosion from Shindake crater on 3 August 2014 caused JMA to increase the Alert Level at the volcano. Activity decreased shortly after the explosion, and only steam plumes, fumarolic activity, and occasional incandescence were observed for the next nine months. A large explosion on 29 May 2015 generated a gray-black ash plume that rose to over 9 km altitude and sent pyroclastic flows down the flanks; JMA increased the Alert Level and ordered evacuation of local residents. Activity declined after a few days, and Shindake remained quiet until a smaller explosion on 18 June 2015. The ash plume did not exceed 1 km, but ashfall was reported in towns on neighboring islands and in areas up to 80 km E. Two additional smaller explosions were reported on 18 and 19 June. Seismicity decreased significantly after the 19 June explosion, but SO2 emissions remained elevated until October 2015. The JMA did not lower the Alert Level until June 2016.
Activity during August 2014-February 2015. JMA reported an eruption from the vicinity of Shindake crater around noon local time on 3 August 2014, with a gray plume rising more than 800 m above the crater rim. This led to an increase in the Alert Level from 1 (Normal) to 3 (Do not approach the volcano) on a 5-level scale. An overflight confirmed traces of ash on the W flank. The Tokyo VAAC reported that the plume rose to an altitude greater than 1.5 km and drifted N. On 5 August, seismicity decreased, and views from a remote web camera showed a white plume rising 50 m above the crater rim. For the rest of August, seismicity remained low and steam plumes rose 50 to 800 m above the crater.
During September 2014, white plumes were generally observed 200-800 m above the crater when visibility was not obscured by weather; seismicity remained low. Scientists conducting a field survey on 12 September found SO2 emissions at 300 metric tons per day (t/d), higher than the background value of 60 t/d measured on 21 May 2014. Occasional earthquakes were recorded in October 2014, and the volume of gas emissions remained relatively high compared with before the August eruption; steam-and-gas plumes rose to 600 m above the crater rim. During field surveys on 7 and 8 October scientists measured SO2 emissions of 500 t/d. Gas emissions rose from within the Shindake crater, around a thermally anomalous fissure at the W edge of the crater, as well as from a new fumarole on the SW flank of the crater. In November, plumes continued to rise as high as 1,000 m above the crater. In another survey on 9 December 2014, scientists found that SO2 levels had increased to 1,700 t/d.
Emissions of SO2 remained high during the second half of January 2015, ranging from 1,100 to 3,100 t/d. A M 2.2 seismic event located 5 km beneath the island was recorded on 24 January. Observations made during field surveys in February confirmed continued steam emissions, and thermal anomalies from the W crater rim fissure and the new fissure on the SW flank. SO2 emissions decreased slightly from January levels to a range of 400 to 2,700 t/d in February, and steam plumes continued to rise 400-700 m above the crater.
Activity during March-June 2015. Incandescence at night was first recorded at the Shindake Crater from 24 to 31 March 2015 with a high-sensitivity camera. Aerial observation on 25 March by JMA and JCG (Japan Coast Guard) indicated a temperature rise and continued fumarolic activity around the thermal anomaly W of the crater rim. SO2 emissions remained high in March (1,000 to 3,700 t/d) and April (900 to 2,600 t/d), and steam plumes rose to 1 km above the crater. Incandescence was occasionally observed at night during April and again during 18-22 May; fumarolic activity continued along with a rise in temperature at the W and SW fissures. Steam plumes were observed rising to 600 m above the crater in May.
According to JMA, at 0959 local time on 29 May 2015, a large explosive phreatomagmatic eruption generated a gray-black ash plume that rose to over 9 km altitude and drifted ESE (figure 5). The plume was reported by the Tokyo VAAC to be at 10.9 km altitude about an hour after the eruption. The largest of several pyroclastic flows descended NW from the SW side of the crater in the Mukaehama district and reached the coast. Based on these events, JMA raised the Volcanic Alert Level to 5 (Evacuate). Aerial observation conducted on the same day (in collaboration with the Kyushu Regional Bureau of the Ministry of Land, Infrastructure, Transport and Tourism) revealed additional pyroclastic flows moving in nearly all directions from the Shindake crater (figure 6) including flows reaching halfway down the mountain to the SW and SE of the crater. Seismicity increased immediately after the eruption, but had decreased by midday.
According to a news article (The Japan Times), all residents and visitors (141 people) were safely evacuated by a ferry, coast guard ship, and helicopter to neighboring Yakushima Island (25 km SE). A resident of Yakushima reported that ash reached the island. Later that day, ash plumes rose 200 m and drifted SW.
Ash plumes continued the next day, 30 May, rising only 1.2 km. A field team observed discolored trees on the SE and SW flanks, and fallen trees near the coast on the NW flank. Cloud cover prevented views of the eruption area, but the team was able to confirm continued fumarolic activity and incandescence in the W part of the crater. Seismicity continued at low levels, and during the first week of June white plumes rose 100-400 m above the crater rim.
Another smaller eruption on 18 June 2015 caused lapilli and ash to fall on the E side of the island. Ash was reported in Yakushima Town (44 km ESE on Yakushima Island), Nishinoomote City (80 km NE on Tanegashima Island), and Nakatane Town (72 km E on Tanegashima). Small eruptions also occurred at 1631 on 18 June and at 0943 on 19 June. Tokyo VAAC reported the larger 18 June eruption, but plume heights were below 1 km, and not observed on satellite. Aerial observations on 20 June by JMA revealed no traces of new pyroclastic-flow deposits around the crater or on the flanks.
Post-eruption observations through June 2016. Emissions of SO2 remained elevated during June 2015 (800-1,700 t/d), and decreased somewhat in July to 500-700 t/d. They decreased further to 200-300 t/d in August. Increased seismicity was recorded briefly from 1-3 and 6-11 August. SO2 emissions continued to decline in September, except for a spike of 700 t/d on 10 September. Thermal infrared observations taken during a field survey in October 2015 indicated a decrease in temperature around the fissure W of the crater rim since the 29 May eruption. Emissions of SO2 remained below 300 t/d for the remainder of 2015 and no further activity was reported, although the Alert Level remained at 5. On 14 June 2016, JMA lowered the Alert Level to 3; seismic activity and SO2 flux values were below levels detected prior to the May-June 2015 eruption.
Geologic Background. A group of young stratovolcanoes forms the eastern end of the irregularly shaped island of Kuchinoerabujima in the northern Ryukyu Islands, 15 km W of Yakushima. The Furudake, Shindake, and Noikeyama cones were erupted from south to north, respectively, forming a composite cone with multiple craters. All historical eruptions have occurred from Shindake, although a lava flow from the S flank of Furudake that reached the coast has a very fresh morphology. Frequent explosive eruptions have taken place from Shindake since 1840; the largest of these was in December 1933. Several villages on the 4 x 12 km island are located within a few kilometers of the active crater and have suffered damage from eruptions.
Information Contacts: Japan Meteorological Agency (JMA), Otemachi, 1-3-4, Chiyoda-ku Tokyo 100-8122, Japan (URL: http://www.jma.go.jp/); Tokyo Volcanic Ash Advisory Center (VAAC), 1-3-4 Otemachi, Chiyoda-ku, Tokyo, Japan (URL: http://ds.data.jma.go.jp/svd/vaac/data/); Google Earth (URL: https://www.google.com/earth/); The Japan Times (URL: http://www.japantimes.co.jp/news/2015/05/29/national/volcano-erupts-isle-kagoshima-prompting-evacuation-order/).
Manam (Papua New Guinea) — March 2017 Cite this Report
Manam
Papua New Guinea
4.08°S, 145.037°E; summit elev. 1807 m
All times are local (unless otherwise noted)
Large ash plume to 19.8 km on 31 July 2015; persistent thermal anomalies during 2014-2016
The remote island of Manam, 13 km off the northern coast of mainland Papua New Guinea is a basaltic-andesitic stratovolcano that has a 400-year history of recorded evidence for recurring low-level ash plumes and occasional Strombolian emissions, lava flows, pyroclastic avalanches, and large ash plumes. Pyroclastic flows and Strombolian activity during much of 2012 and 2013 were accompanied by numerous ash plumes rising a few kilometers above the summit (BGVN 38:06, 39:08). Activity between January 2014 and January 2017, described below, includes persistent thermal anomalies during most of this time, and a major ash plume rising to nearly 20 km altitude on 31 July 2015.
Monitoring is done by Papua New Guinea's Rabaul Volcano Observatory (RVO), part of the Department of Mineral Policy and Geohazards Management (DMPGM). This information is supplemented with aviation alerts from the Darwin Volcanic Ash Advisory Center (VAAC). MODIS thermal anomaly satellite data is recorded by the University of Hawai'i's MODVOLC thermal alert recording system, and the Italian MIROVA system.
MIROVA thermal anomaly data suggests Manam was intermittently active from at least late June 2014 through the end of the year. A single ash plume was reported on 6 September and two more were observed on 21 and 22 December. The appearance of MODVOLC thermal anomalies in late January 2015 that grew more frequent through April indicated increasing activity along with sporadic low-level ash plumes in late February and late April. Persistent levels of thermal anomalies and ash plume reports continued in May through early July.
On 31 July 2015 at about 1130 local time a large explosion sent an ash plume to nearly 20 km altitude, spreading volcanic blocks and ash over a wide area, and injuring two people. A second substantial ash plume rose to 6.4 km on 8 August. This was followed by three more small plumes in August, one in September, and two in October 2015 (on 8 and 29) before the volcano quieted down for a few months.
Thermal anomalies were present at the end of January 2016, and an ash plume was observed on 4 March 2016. New thermal anomalies intensified until June and then tapered off in early July. Persistent but more intermittent thermal anomalies continued throughout the year and were ongoing as of early January 2017.
Activity during 2014. Numerous explosions during 2013 tapered off at the end of the year, with the last ash emissions reported on 15 December 2013. In January 2014, RSAM values were lower but still fluctuating above background levels. A report from RVO in early April noted that both summit craters remained quiet through March 2014, with no audible noises or incandescence visible at night. The seismicity remained within background levels of 160-180 RSAM and daily volcanic event counts ranged from 830 to 920. Tiltmeter data showed no significant short-term changes, but over the previous three months there was a gradual inflationary trend towards the summit area. The Alert Level was lowered to Stage 1.
A thermal anomaly appears at the very end of June 2014 in the first available MIROVA LRP data (figure 30). This is followed by additional thermal anomalies in August, October, and November. The Darwin VAAC reported a small ash plume on 6 September 2014 that rose to 2.1 km altitude (300 m above the summit) and drifted 37 km NW. It was visible on infrared satellite imagery for a few hours before dissipating. In their report for October 2014, RVO noted that Manam remained quiet for the month with no audible noises or incandescence; seismicity remained at low to moderate levels, and daily volcanic-event counts ranged between 860 and 920. They also observed that the long-term inflationary trend at the summit observed since the beginning of 2014 continued. Small amounts of white-gray ash drifting SE were reported by RVO on 21 and 22 December from the Southern Crater, with a plume height of only 200 m. They also noted continued E-W inflation.
Activity during 2015. RVO noted incandescence from the Main Crater beginning on 19 January 2015, growing stronger during the last week of the month, matching observations in the MIROVA data (figure 30). A MODVOLC thermal alert pixel appeared on 23 January. Seismicity also changed after the middle of the month when RSAM values rose above 200 on 16 January and went as high as 500 on 31 January, after which they declined rapidly and remained low during February.
In February 2015, seismicity was characterized by small to moderate sub-continuous and continuous volcanic tremors. Increased incandescence was also evident from the Main Crater during February. RVO reported weak-to-bright steady incandescence during 7-10, 21, and 26 February. MODVOLC captured two thermal alert pixels on 8 February, and MIROVA reported an anomaly at the end of the first week and during the last week of the month. An ash plume was observed in satellite data by the Darwin VAAC on 24 February; the plume rose to 3 km altitude (1.2 km above the summit) and drifted 37 km W. RSAM values rising to 500 by 18 March led RVO to raise the Alert Level that day to Stage 2. Visual observations were difficult due to weather during much of the month, but MODVOLC reported thermal alert pixels on 19 and 26 March, and MIROVA captured several anomalies at the beginning of a period of increased frequency and intensity of thermal anomalies that lasted through mid-June (figure 30).
RVO reported that during April 2015 both craters released variable amounts of white vapor. Clearer skies revealed incandescence from the Southern Crater during nine nights of the month and seven times from the Main Crater. This is consistent with satellite thermal anomaly observations by MODVOLC on six different days, with four of them being multiple pixel alerts, and numerous anomalies captured by MIROVA. Two ash eruptions were reported by the Darwin VAAC on 27 and 30 April. The first low-level plume rose to 2.4 km and was observed in satellite imagery extending over 100 km to the W before dissipating on 28 April. The second plume was observed at the same altitude drifting 150 km NW. Seismicity remained high during April, still characterized by discreet small to moderate low-frequency earthquakes, and RSAM values ranged between 300 and 650, increasing during the month. Ground deformation GPS measurements at the end of April confirmed the continuing inflationary trend recorded by the electronic tiltmeters since the last measurements taken in May 2013 (figure 31).
Multiple sources of satellite data confirmed that Manam was active during May 2015. MODVOLC thermal alert pixels were reported from MODIS data captured on 6 and 22 May; MIROVA thermal anomalies were frequent. Ash plumes were reported from visible satellite imagery by the Darwin VAAC on 13 May at 3 km altitude drifting 37 km NE; SO2 plumes were captured by NASA's OMI instrument on the Aura satellite on 2, 12, 13, and 20 May (figure 32).
During June and early July 2015 there were four series of Volcanic Ash advisory reports from the Darwin VAAC. The first, on 21 and 22 June, reported a 3-km-altitude ash plume that extended over 35 km N and NW. The second, from 28 to 30 June, had altitudes that started at 2.4 and rose to 3 km, and drifted 75 km NE. A third plume emerged late on 30 June and lasted through 1 July, drifting 130 km E at 2.4 km altitude. A fourth plume reported on 2 July was confirmed by RVO as only a steam plume with no ash, and was seen in satellite imagery drifting 45 km E at 2.4 km altitude. A single MODVOLC thermal alert pixel was recorded on 7 July.
RVO reported a significant eruption on 31 July 2015 from the Southern Crater beginning about 1130 local time. They observed that low roaring noises marked the onset of the explosion followed by continuous ejection of scoria until about 1330. Fist-sized volcanic debris was reported at Warisi village on the E side of the island. At Baliau on the N side, clasts were about 10-20 cm in diameter. Two people were reportedly knocked unconscious from the falling scoria. Strong emissions of dark gray ash clouds followed the ejection of scoria and continued into the early afternoon. By 1740 emissions consisted of light gray ash clouds. The news source One Papua New Guinea reported that fine ash began to fall over Bogia (25 km SW on the mainland) around 1245 local time.
The ash plume was initially observed in satellite imagery by the Darwin VAAC at 19.8 km altitude spreading out in all direction for 100 km. It was captured by the Japanese Himawari-8 satellite (figure 33); an animation of the imagery showing the eruption was provided by Miller et al. (2016). Four hours later, the plume was visible 370 km to the SW. A lower-altitude ash plume at 6.7 km was observed the next day extending over 100 km SW. A significant SO2 plume was partially captured by the Aura instrument on the OMI satellite the next day, and measured an SO2 mass of 3.206 kilotons.
The Darwin VAAC reported a new small ash plume on 6 August 2015 rising to 2.7 km drifting around 40 km to the NW, and another large ash plume on 8 August that initially rose to 6.4 km and drifted SSW. Pilots reported the ash at 5.8 km altitude about 90 km W of Kiunga Airport which is located 475 km SW of Manam. About 24 hours later, pilots reported another ash plume at 6 km altitude 150 km SE of the volcano. A hot spot was observed at the summit on 9 August; two MODVOLC thermal alert pixels appeared that day, and another one appeared on 15 August. A small plume was reported on 21 August, only rising to 2.1 km and drifting about 8 km ESE. This was followed two hours later by an ash plume observed 16 km NW at the same altitude, which continued to drift NW to 75 km before dissipating. Additional ash plumes were reported from 26-28 August rising to 2.4 km and drifting from 35 to 75 km, first NE, then N and NW; a small plume was reported on 31 August at 2.1 km drifting 75 km N before dissipating that day.
A single MODVOLC thermal alert pixel on 4 September was the last recorded in 2015. The next plume on 7 September was small, rising only to 2.1 km and drifting 75 km NW, briefly observed in one satellite before dissipating. It was a month until the next ash plume on 8 October 2015, when Darwin VAAC made a satellite observation of a plume at 1.8 km drifting 45 km NW. The last ash plume of 2015 was captured in satellite images on 29 October between 2.1 and 2.4 km altitude around 35 km NW.
Activity during 2016. The MIROVA data recorded thermal activity on about 29 January 2016 that increased in intensity and frequency in early March (figure 34). A small ash plume on 4 March rose to 3 km altitude and drifted about 90 km SE according to the Darwin VAAC. Increased thermal activity was recorded in MODVOLC thermal alert pixels and MIROVA data from early March through mid-July. There were no reports from the RVO during this time. The first MODVOLC alert was recorded on 7 March and they were persistent, almost every week, through the second week of July. On 13 July, an ash plume was observed by the Darwin VAAC in satellite imagery at 3 km altitude drifting 55 km W for a few hours before dissipating. After that, single-pixel MODVOLC thermal alerts were recorded on 20 September and 6 October. The MIROVA analysis of the MODIS data records a similar picture with a clear increase in the frequency and intensity of anomalies between early March and mid-July (figure 34); continuing pulses of thermal anomalies are present every month into January 2017.
Reference: Miller S D, Schmit T L, Seaman C J, Lindsey D T, Gunshor M M, Kohrs R A, Sumida Y, Hillger D, 2016, A Sight for Sore Eyes: The Return of True Color to Geostationary Satellites, Bulletin of the American Meteorological Society, vol. 97, no. 10. DOI: http://dx.doi.org/10.1175/BAMS-D-15-00154.1. Animated imagery of the 31 July 2015 eruption can be viewed at http://journals.ametsoc.org/doi/suppl/10.1175/BAMS-D-15-00154.1/suppl_file/10.1175_BAMS-D-15-00154.2.html .
Geologic Background. The 10-km-wide island of Manam, lying 13 km off the northern coast of mainland Papua New Guinea, is one of the country's most active volcanoes. Four large radial valleys extend from the unvegetated summit of the conical basaltic-andesitic stratovolcano to its lower flanks. These valleys channel lava flows and pyroclastic avalanches that have sometimes reached the coast. Five small satellitic centers are located near the island's shoreline on the northern, southern, and western sides. Two summit craters are present; both are active, although most observed eruptions have originated from the southern crater, concentrating eruptive products during much of the past century into the SE valley. Frequent eruptions, typically of mild-to-moderate scale, have been recorded since 1616. Occasional larger eruptions have produced pyroclastic flows and lava flows that reached flat-lying coastal areas and entered the sea, sometimes impacting populated areas.
Information Contacts: Rabaul Volcano Observatory (RVO), Geohazards Management Division, Department of Mineral Policy and Geohazards Management (DMPGM), PO Box 3386, Kokopo, East New Britain Province, Papua New Guinea;
Darwin Volcanic Ash Advisory Centre (VAAC), Bureau of Meteorology, Northern Territory Regional Office, PO Box 40050, Casuarina, NT 0811, Australia (URL: http://www.bom.gov.au/info/vaac/);
Hawai'i Institute of Geophysics and Planetology (HIGP), MODVOLC Thermal Alerts System, School of Ocean and Earth Science and Technology (SOEST), Univ. of Hawai'i, 2525 Correa Road, Honolulu, HI 96822, USA (URL: http://modis.higp.hawaii.edu/, http://modis.higp.hawaii.edu/);
MIROVA (Middle InfraRed Observation of Volcanic Activity), a collaborative project between the Universities of Turin and Florence (Italy) supported by the Centre for Volcanic Risk of the Italian Civil Protection Department (URL: http://www.mirovaweb.it/);
NASA Goddard Space Flight Center (NASA/GSFC), Global Sulfur Dioxide Monitoring Page, Atmospheric Chemistry and Dynamics Laboratory, Goddard, Maryland, USA (URL: https://so2.gsfc.nasa.gov/);
Regional and Mesoscale Meteorology Branch (RAMMB) / Cooperative Institute for Research in the Atmosphere (CIRA), NOAA/NESDIS, Colorado State University, Fort Collins, CO 80523-1375, USA (URL: http://rammb.cira.colostate.edu/);
One Papua New Guinea (URL: http://www.onepng.com/2015/07/manam-volcano-erupts.html).
Pavlof (United States) — March 2017 Cite this Report
Pavlof
United States
55.417°N, 161.894°W; summit elev. 2493 m
All times are local (unless otherwise noted)
Ash plume to 11 km on 27 March 2016 that drifted 1,200 km NE; multiple smaller ash events through July 2016
Pavlof volcano, near the end of the Alaska Peninsula 970 km SW of Anchorage, frequently produces explosive eruptions from the summit vents and occasional lava flows. The largest confirmed historical eruption took place in 1911 when a fissure opened on the N flank; it has erupted more than 25 times since then. The last reported eruption in mid-November 2014 included lava fountaining from a vent just N of the summit, and flows of rock debris and ash descending the N flank, along with an ash plume that rose to around 9 km altitude and drifted 300 km NW. Pavlof was quiet in 2015, but then abruptly renewed activity in late March 2016. It is monitored primarily by the Alaska Volcano Observatory (AVO) and the Anchorage Volcanic Ash Advisory Center (VAAC).
A sudden vigorous eruption that began on 27 March 2016 lasted for about 20 hours, sending ash to 11 km altitude, producing a plume dispersed NE for 1,200 km, and a similarly large SO2 plume. The volcano was then quiet until a short-lived, smaller ash emission occurred in mid-May for eight days. Intermittent low-level ctivity picked up again from late June through late July 2016, characterized by minor emissions of dark-colored ash and steam rising to 4.5 km altitude. Fallout of ash was limited to the flanks of the volcano and the immediate area around Pavlof. The last report of ash emissions was on 30 July, although low-amplitude tremors and steam plumes persisted through August, and intermittent thermal anomalies from the summit continued through the end of 2016.
After a short and intense eruption between 12 and 15 November 2014 (BGVN 40:04), activity decreased quickly to background levels. The AVO had reduced the Aviation Color Code (ACC) from Red (highest) to Orange on 16 November, and from Orange to Yellow on 25 November. Seismicity remained slightly above background levels until early January. On 15 January 2015 the AVO reduced the ACC to the lowest level of Green where it remained for over a year until it was changed abruptly to Red on 28 March 2016 at the start of a new eruption.
AVO reported that seismicity began to increase at 1553 on 27 March 2016, characterized by a quick onset of continuous tremor. An ash plume rose to an altitude of 6.1 km, and by 1618 was drifting N (figure 13). During the night, lava fountaining from the summit crater was observed by mariners, pilots, and residents of nearby Cold Bay (60 km SW).
On 28 March, tremor levels remained high; lightning in the ash plume was detected in the morning, and infrasound data from a sensor network in Dillingham (470 km NE) indicated sustained ash emissions. At 0700 a continuous ash plume was evident in satellite images drifting more than 650 km NE, and a MODIS image captured at midday revealed the extent and substantial thickness of the cloud (figure 14). A SIGMET (significant meteorological information notice) issued by the National Weather Service (NWS) Alaska Aviation Weather Unit indicated that the maximum ash-cloud altitude was approaching 11 km. Strongly elevated surface temperatures also suggested the presence of lava flows.
The energetic ash-producing phase of the eruption lasted from 1600 AKDT (00:00 UTC) on 27 March until about 1230 AKDT (20:30 UTC) on 28 March, and produced an ash cloud that stretched NE over Bristol Bay and interior Alaska for over 1,200 km. As a result, over 40 Alaska Airlines flights to and from Fairbanks, Alaska, were cancelled according to NBC News. Minor ashfall (0.8 to 6.3 mm or 1/32 to 1/4 in) was reported in the nearby community of Nelson Lagoon (80 km NW) and trace ashfall (less than 0.8 mm) was confirmed near Dillingham (470 km NE). A large SO2 plume also drifted NE from the volcano extending all the way across Alaska to Yukon Territory and British Columbia in Canada (figure 15).
Seismicity and infrasound signals had decreased to low enough levels by 1230 on 28 March that the AVO lowered the Aviation Color Code to Orange and the Volcano Alert Level to Watch. However, seismic tremor remained above background levels. Ash emissions decreased through the night and were barely visible in a satellite image acquired at 0625 AKDT on 29 March. Remnant ash continued to drift over Bristol Bay and areas of interior Alaska. The webcam at Cold Bay recorded intermittent, low-level ash plumes rising as high as 4.6 km.
Thermal anomalies, measured by MODIS satellite sensors and analyzed by MODVOLC, appeared from 28 March (0025 UTC) through 29 March 2016 (1360 UTC), with 20 pixels recorded on 28 March. The MIROVA system also recorded an abrupt spike to 'Very High' thermal anomaly levels on 28 March, dropping slightly in the next two days (figure 16) and then disappearing a few days later. Low-power anomalies were detected on 2 and 6 April, and then ceased for several months.
The AVO reported that the intensity of the eruption greatly decreased during 29-30 March, although The Canadian Press reported that ash from the eruption had caused flights in and out of Yellowknife and Regina, Canada, to be cancelled on those dates. Elevated surface temperatures identified in satellite data and visual observations of low-level, intermittent ash plumes were noted during brief breaks in poor weather conditions during these days. Airwave signals, indicative of small explosions at the summit, were recorded on 3 April, but tremors had ceased by the next day. On 6 April AVO noted no signs of ash emissions or lava effusion during the previous week, and seismicity was at low levels. Thermal anomalies at the summit were occasionally visible, though likely indicating cooling processes of previously erupted lava. AVO lowered the Aviation Color Code to Yellow and Volcano Alert Level to Advisory on 6 April. After two more weeks of no activity, the ACC was lowered to Green/Normal on 22 April 2016.
On 13 May 2016 the AVO raised the Aviation Color Code back to Orange as a result of increased seismicity typically associated with minor eruptive activity. Four minor ash eruptive episodes were inferred from seismic data between 13 and 16 May. On 14 May, local observers in Cold Bay reported ash emissions below 5 km in the vicinity of the volcano. According to the Anchorage VAAC, on 15 May a minor eruption was noted on the Cold Bay web camera, but volcanic ash was not visible in satellite data. Elevated surface temperatures were detected in satellite data on 15 May. Periods of elevated volcanic tremor and a small explosion associated with minor ash emissions was noted on 17 May; observers in Cold Bay and Sand Point (90 km E) reported ash emissions interspersed with steam emissions. The Anchorage VAAC noted that strong winds caused resuspension of volcanic ash on the lee side of Pavlof on 17 and 18 May. The AVO lowered the ACC to Yellow on 20 May and noted that all volcanic ash clouds produced during the 13-17 May event were below 4.5 km altitude, and that no lava effusion or fountaining was detected. Weak seismic tremor and small explosions were observed on 21 May, after which activity ceased. The AVO lowered the ACC to Green on 17 June.
Seismic activity increased again on 30 June for about a week, prompting the AVO to raise the ACC to Yellow on 1 July 2016; minor steam emissions were also observed in the web camera. AVO technicians installed a new web camera in the Black Hills area north of the volcano near the Bering Sea coast in early July. On 11 July, weakly elevated surface temperatures were observed at the summit in satellite imagery and a steam and gas cloud extended SW for about 80 km. Minor ash emissions reaching a few tens of meters above the summit were observed that afternoon extending a few kilometers to the SW. Small ash emissions were again observed on 18 July along with an increase in seismic tremor for about 48 hours.
On 28 July a low-intensity eruption with vigorous degassing produced a steam-rich plume and minor ash emissions. As a result, the AVO raised the ACC to Orange. The drifting steam and ash cloud was below 4.6 km above sea level and dissipated rapidly. The Anchorage VAAC reported steam and minor ash emissions continuing through 30 July.
A decline in activity led AVO to lower the ACC to Yellow on 4 August. Periods of low-amplitude tremor continued, but no plumes or thermal signals at the summit were detected. Elevated surface temperatures at the summit were observed in satellite data on 8 August, and a low-level but persistent steam plume was visible in web camera images on 11 August. A large steam plume was noted by observers in Sand Point on 15 August. Elevated surface temperatures were detected through cloud cover in satellite data on 20 and 25 August. Low-level unrest continued through the fall with persistent degassing from the summit and elevated surface temperatures detected in satellite data. A robust steam plume on 31 August reached 4.6 km, but there was no evidence of ash and it dissipated rapidly.
Several times during late September during clear views, webcam images showed a persistent steam plume from the summit crater. Elevated surface temperatures in the summit crater were observed in satellite images on 25, 28, and 29 September, and again during 4-6, 13-14, and 16 October. In early November, the AVO determined that the summit crater was larger and more centrally located than before, as a result of the March 2016 explosion. The new crater geometry possibly allowed satellite sensors to more easily detect emissions of hot gases from the vent. Ongoing observations of moderately elevated surface temperatures (figure 16) likely reflect this change in the crater, and do not indicate new eruptive activity or rising magma. Seismicity remained slightly above background levels through the end of 2016, and the ACC remained at Yellow.
Geologic Background. The most active volcano of the Aleutian arc, Pavlof is a Holocene stratovolcano that was constructed along a line of vents extending NE from the Emmons Lake caldera. Pavlof and Pavlof Sister to the NE form a dramatic pair of symmetrical, glacier-covered stratovolcanoes that overlook Pavlof and Volcano bays. Little Pavlof is a smaller cone on the SW flank of Pavlof volcano, near the rim of Emmons Lake caldera. Unlike Pavlof Sister, eruptions have frequently been reported from Pavlof, typically Strombolian to Vulcanian explosive eruptions from the summit vents and occasional lava flows. The active vents lie near the summit on the north and east sides. The largest recorded eruption took place in 1911, at the end of a 5-year-long eruptive episode, when a fissure opened on the N flank, ejecting large blocks and issuing lava flows.
Information Contacts: Alaska Volcano Observatory (AVO), a cooperative program of a) U.S. Geological Survey, 4200 University Drive, Anchorage, AK 99508-4667 USA (URL: http://www.avo.alaska.edu/), b) Geophysical Institute, University of Alaska, PO Box 757320, Fairbanks, AK 99775-7320, USA, and c) Alaska Division of Geological & Geophysical Surveys, 794 University Ave., Suite 200, Fairbanks, AK 99709, USA (URL: http://www.dggs.alaska.gov/); Anchorage Volcanic Ash Advisory Center (VAAC), Alaska Aviation Weather Unit, NWS NOAA US Dept of Commerce, 6930 Sand Lake Road, Anchorage, AK 99502-1845(URL: http://www.ssd.noaa.gov/); Hawai'i Institute of Geophysics and Planetology (HIGP), MODVOLC Thermal Alerts System, School of Ocean and Earth Science and Technology (SOEST), Univ. of Hawai'i, 2525 Correa Road, Honolulu, HI 96822, USA (URL: http://modis.higp.hawaii.edu/); MIROVA (Middle InfraRed Observation of Volcanic Activity), a collaborative project between the Universities of Turin and Florence (Italy) supported by the Centre for Volcanic Risk of the Italian Civil Protection Department (URL: http://www.mirovaweb.it/); NASA Goddard Space Flight Center (NASA/GSFC), Global Sulfur Dioxide Monitoring Page, Atmospheric Chemistry and Dynamics Laboratory, Goddard, Maryland, USA (URL: https://so2.gsfc.nasa.gov/); NASA Earth Observatory, EOS Project Science Office, NASA Goddard Space Flight Center, Goddard, Maryland, USA (URL: http://earthobservatory.nasa.gov/); Colt Snapp (URL: https://twitter.com/colt_snapp/status/714345047173369856); The Canadian Press, via Vancouver Observer (URL: http://www.vancouverobserver.com/news/environment/flights-cancelled-and-out-regina-yellowknife-after-volcano-alaska); NBC News (URL: http://www.nbcnews.com/news/weather/pavlof-volcano-erupts-covering-400-miles-alaska-ash-n546956).
Poas
Costa Rica
10.2°N, 84.233°W; summit elev. 2697 m
All times are local (unless otherwise noted)
Phreatic explosions from the crater lake in June-August 2016
Poás is characterized by intermittent explosions from its hot crater lake. Several occurred in 2014 (BGVN 40:11). This report covers activity from 1 January 2015 through February 2017. There were no reports of activity during 2015 through May 2016. Phreatic eruptions were recorded between 5 June and 16 August 2016.
According to news articles (La Prensa Libre, Prensa Latina), phreatic explosions from the hot crater lake occurred multiple times in June 2016. Explosions at 0900 on 5 June, at 1854 on 13 June, and at 1952 on 14 June ejected water and steam many meters above the lake's surface. Three small explosions, lasting about five seconds each based on the seismic signals, occurred during 0600-0603 on 18 June and ejected water, steam, and debris no more than 50 m above the lake's surface. Phreatic explosions were also registered on 19 June.
According to the Observatorio Vulcanologico y Sismologico de Costa Rica-Universidad Nacional (OVSICORI-UNA), a small phreatic explosion from the lake was recorded at 0819 on 25 July 2016. The explosion ejected material 50 m above the lake surface.
News accounts (Q Costa Rica, La Prensa Libre) reported that at 1409 local time on 16 August 2016 an explosion sent a column of gas to a height of 100 m above the crater; the activity lasted 2 minutes. An OVSICORI-UNA video of this explosion was posted in the news articles.
Geologic Background. The broad vegetated edifice of Poás, one of the most active volcanoes of Costa Rica, contains three craters along a N-S line. The frequently visited multi-hued summit crater lakes of the basaltic-to-dacitic volcano are easily accessible by vehicle from the nearby capital city of San José. A N-S-trending fissure cutting the complex stratovolcano extends to the lower N flank, where it has produced the Congo stratovolcano and several lake-filled maars. The southernmost of the two summit crater lakes, Botos, last erupted about 7,500 years ago. The more prominent geothermally heated northern lake, Laguna Caliente, is one of the world's most acidic natural lakes, with a pH of near zero. It has been the site of frequent phreatic and phreatomagmatic eruptions since an eruption was reported in 1828. Eruptions often include geyser-like ejections of crater-lake water.
Information Contacts: Observatorio Vulcanologico Sismologica de Costa Rica-Universidad Nacional (OVSICORI-UNA), Apartado 86-3000, Heredia, Costa Rica (URL: http://www.ovsicori.una.ac.cr/); La Prensa Libre (URL: https://www.laprensalibre.cr/); Prensa Latina (URL: http://www.plenglish.com/); Q Costa Rica News (URL: http://qcostarica.com/).
Sheveluch
Russia
56.653°N, 161.36°E; summit elev. 3283 m
All times are local (unless otherwise noted)
Lava dome extrusion continues with occasional explosions and ash plumes through February 2016
An eruption at Sheveluch has been ongoing since 1999, and recent activity there was previously described through August 2015 (BGVN 42:02). During September 2015-February 2016, the same type of activity prevailed, with lava dome extrusion, incandescence, hot block avalanches, fumarolic activity, and occasional strong explosions that generated ash plumes. The following data comes from Kamchatka Volcanic Eruption Response Team (KVERT) reports. During this period the Aviation Color Code remained at Orange (the second highest level on a four-color scale).
KVERT reported that during 1 September 2015-28 February 2016, lava-dome extrusion onto the N flank was accompanied by fumarolic activity, dome incandescence, hot avalanches, and ash explosions. Satellite images detected an almost daily, and sometimes intense, thermal anomaly over the dome. Ash plumes generated by occasional explosions, hot avalanches, and sometimes strong winds rose to altitudes of 2.5-7 km and drifted primarily SE during September-December 2015 (up to 185 km) and in more variable directions (up to 200 km) during January-March 2016. A series of photos taken in late 2015 shows characteristic types of activity, including small explosions and hot avalanches on 28 October (figure 39), an explosion and pyroclastic flow on 22 November (figure 40), and incandescence on 25 November (figure 41).
Thermal anomalies based on MODIS satellite instruments analyzed using the MODVOLC algorithm were frequent during the current reporting period, in contrast to March-August 2015 (BGVN 42:02). From September 2015-February 2016, thermal anomalies were detected 10-15 days each month. On 22 November, seven pixels were recorded.
Geologic Background. The high, isolated massif of Sheveluch volcano (also spelled Shiveluch) rises above the lowlands NNE of the Kliuchevskaya volcano group. The 1,300 km3 andesitic volcano is one of Kamchatka's largest and most active volcanic structures, with at least 60 large eruptions during the Holocene. The summit of roughly 65,000-year-old Stary Shiveluch is truncated by a broad 9-km-wide late-Pleistocene caldera breached to the south. Many lava domes occur on its outer flanks. The Molodoy Shiveluch lava dome complex was constructed during the Holocene within the large open caldera; Holocene lava dome extrusion also took place on the flanks of Stary Shiveluch. Widespread tephra layers from these eruptions have provided valuable time markers for dating volcanic events in Kamchatka. Frequent collapses of dome complexes, most recently in 1964, have produced debris avalanches whose deposits cover much of the floor of the breached caldera.
Information Contacts: Kamchatka Volcanic Eruptions Response Team (KVERT), Far East Division, Russian Academy of Sciences, 9 Piip Blvd., Petropavlovsk-Kamchatsky, 683006, Russia (URL: http://www.kscnet.ru/ivs/kvert/); Institute of Volcanology and Seismology, Far Eastern Branch, Russian Academy of Sciences (IVS FEB RAS), 9 Piip Blvd., Petropavlovsk-Kamchatsky 683006, Russia (URL: http://www.kscnet.ru/ivs/eng/); Hawai'i Institute of Geophysics and Planetology (HIGP), MODVOLC Thermal Alerts System, School of Ocean and Earth Science and Technology (SOEST), Univ. of Hawai'i, 2525 Correa Road, Honolulu, HI 96822, USA (URL: http://modis.higp.hawaii.edu/).
Soputan (Indonesia) — March 2017 Cite this Report
Soputan
Indonesia
1.112°N, 124.737°E; summit elev. 1785 m
All times are local (unless otherwise noted)
Ash plumes to over 12 km altitude, lava flows, pyroclastic flows, and Strombolian activity during January-February 2016
Soputan stratovolcano on the northern tip of Indonesia's island of Sulawesi has had historically observed eruptions since the 18th century, possibly earlier. The locus of eruptions has included both the summit crater and a NE-flank vent that was active during 1906-1924. Since the 1980's, continuing lava-dome growth has been punctuated by ash explosions, lava flows, and Strombolian eruptions every few years. When these events last occurred between January and March 2015, they were accompanied by strong thermal anomalies and elevated seismicity which continued into early July 2015 (BGVN 41:05). This report covers the period from July 2015 through September 2016.
Increased seismicity in November 2015 signaled the beginning of a new eruptive episode, with explosions in January and February 2016. Soputan is monitored by PVMBG (Pusat Vulkanologi dan Mitigasi Bencana Geologi), Badan Nasional Penanggulangan Bencana (BNPB) which is the Indonesian National Disaster Management Agency, and aviation alerts are managed by the Darwin VAAC (Volcanic Ash Advisory Center). Information is also provided by the University of Hawaii's MODVOLC Thermal Alert System and the MIROVA project, an Italian collaboration; both groups analyze the MODIS satellite data for thermal anomalies related to volcanoes.
Soputan erupted a significant ash plume to over 12 km altitude on 4 January 2016 after a few months of increasing seismicity. Lava flows, Strombolian eruptions, and a pyroclastic flow were observed the next day. Another large ash plume to 13 km altitude occurred on 14 January. A series of explosions beginning on 6 February resulted in more ash plumes, lava flows, and Strombolian eruptions for about 24 hours, after which activity decreased significantly. Several villages within 20 km reported ashfall from these events. The last reported activity was on 7 February 2016, although thermal anomaly data extended well into April. Seismicity had declined significantly by mid-April when the Alert Level was lowered.
Activity during July-November 2015. PVMBG lowered the Alert Level to II (second lowest on a four-level scale) on 3 July 2015, citing reduced harmonic tremor and stable RSAM (Real-time Seismic amplitude measurements) at background levels compared with the eruptive activity between January and March 2015. They did not issue another update until 3 November 2015.
MODVOLC thermal alert information from MODIS (Moderate Resolution Imaging Spectroradiometer) satellite data indicated anomalies in the vicinity of Soputan twice in September and four times in October 2015, but the locations were far enough from the volcano to suggest that they were not related to volcanic activity. This is corroborated with the MIROVA (Middle InfraRed Observation of Volcanic Activity) data from this same period which also recorded increases in Volcanic Radiative Power (VRP) in September and October. The locations indicated by MIROVA are mostly greater than 5 km from the summit, also suggesting a non-volcanic source (figure 12).
Additional thermal anomaly signals in the MIROVA data from mid-September through early December 2015 appear to be sourced within 5 km of the summit (figure 12), but their origin is unknown. PVMBG makes no mention of active eruptions or ash plumes during this time. PVMBG maintained the Level II alert status and documented clear skies with diffuse white steam plumes rising between 20 and 200 m from the summit crater during the last half of October and November, unchanged since July. They noted, however, that the frequency of several types of earthquakes began a gradual increase in the middle of October.
Activity during January-September 2016. Elevated seismicity continued until 4 January 2016. Photos taken on 3 and 4 January showed an increase in the density of the white-to-light-gray emissions rising to 300 m above the summit (figure 13).
Dense reddish-white emissions rose 300 m above the summit early in the day on 4 January. A thermal image taken that day indicated that lava was present at the summit; PVMBG raised the Alert Level to III. Seismic amplitude (RSAM) values had also increased sharply in the preceding 12 hours, and tilt measurement data indicated significant inflation of the volcano. BNPB reported an ash eruption at 2053 local time, with a plume rising 2 km from the summit and drifting SE, and incandescent lava flowing down the E flank. Minor ashfall was reported in Langowan (12 km NE) in the Minahasa District. The Darwin VAAC raised the Aviation Color Code (ACC) to Red at 2230 local time and reported an ash plume at 12.8 km altitude drifting west 30 minutes later. This was followed in the next 24 hours by two more plumes that rose to 10.6 km and drifted NW to NE (figure 14). Continuous emissions rising to about 3.7 km were observed until early 7 January.
A Strombolian phase early on 5 January lasted about 40 minutes and sent incandescent material 250 m high, according to BNPB. Sounds resembling thunder followed, and then a pyroclastic flow traveled 2.5 km down the ENE flank. An ash cloud rose 6.5 km above the summit crater rim (8.3 km altitude) and drifted W. Several villages in the districts of West Langowan (8 km E), Tompaso (11 km NE), and East Ratahan (14 km SE) reported ashfall.
MODVOLC thermal alert pixels likely associated with the eruption were reported during 6-8 January. A small cluster on 10 January located on the NE flank possibly indicated flowing or cooling lava. The Darwin VAAC reported another large ash plume on 14 January that rose to 13.7 km and drifted 45 km NE before dissipating.
A new series of explosions began on 6 February 2016. Ash plumes rose to 7 km altitude, later dropping to the range of 4.3-6 km, with continuous emissions drifting up to 75 km WSW through the next day. PVMBG reported lava flows on the N and E flanks; Strombolian explosions witnessed from the observation post in the village of Silian (about 10 km from the volcano) ejected material 300 m high. BNPB reported Strombolian activity on 7 February with ejected material as high as 1,000 m above the summit crater. Pyroclastic flows were also observed moving up to 2 km down the E flank. Seismic amplitudes remained high, indicating the active movement of magma within the volcano. Ashfall was reported in multiple districts including Pasan (5 km SSE), Tombatu (16 km SSW), Belang (17 km SSE), and Ratatotok (20 km S). The MODIS thermal anomaly data resulted in a very strong (32 pixel) MODVOLC thermal alert on 6 February. This corresponded with the Volcanic Radiative Power (VRP) spike presented in the MIROVA information for the same period (figure 12).
For the rest of February, only diffuse white steam plumes rose 75 m, except for a 700-m-high plume reported on 12 February by PVMBG; three MODVOLC thermal alert pixels were recorded on 11 and one on 13 February. Minor steam emissions rose to 100 m at the end of March, but the frequency of earthquakes associated with avalanches and low-frequency earthquakes were still elevated above background levels. The intensity of the avalanche-related earthquakes began to decline in the second week in April according to PVMBG. No incandescence was observed at the summit by the third week of April, and the decreasing frequency and amplitude of the earthquakes led PVMBG to lower the Alert Level to II on 21 April 2016. Between May and mid-September 2016, emissions from the volcano were characterized by white plumes of variable density ranging from 20 to 300 m above the crater and seismicity remained low (figure 15). The Alert Level remained at II.
Geologic Background. The Soputan stratovolcano on the southern rim of the Quaternary Tondano caldera on the northern arm of Sulawesi Island is one of Sulawesi's most active volcanoes. The youthful, largely unvegetated volcano is the only active cone in the Sempu-Soputan volcanic complex, which includes the Soputan caldera, Rindengan, and Manimporok (3.5 km ESE). Kawah Masem maar was formed in the W part of the caldera and contains a crater lake; sulfur has been extracted from fumarolic areas in the maar since 1938. Recent eruptions have originated at both the summit crater and Aeseput, a prominent NE-flank vent that formed in 1906 and was the source of intermittent major lava flows until 1924.
Information Contacts: Pusat Vulkanologi dan Mitigasi Bencana Geologi (PVMBG, also known as Indonesian Center for Volcanology and Geological Hazard Mitigation, CVGHM), Jalan Diponegoro 57, Bandung 40122, Indonesia (URL: http://www.vsi.esdm.go.id/); Badan Nasional Penanggulangan Bencana (BNPB), National Disaster Management Agency, Graha BNPB - Jl. Scout Kav.38 East Jakarta 13120 (URL: http://www.bnpb.go.id/); Darwin Volcanic Ash Advisory Centre (VAAC), Bureau of Meteorology, Northern Territory Regional Office, PO Box 40050, Casuarina, NT 0811, Australia (URL: http://www.bom.gov.au/info/vaac/); Hawai'i Institute of Geophysics and Planetology (HIGP), MODVOLC Thermal Alerts System, School of Ocean and Earth Science and Technology (SOEST), Univ. of Hawai'i, 2525 Correa Road, Honolulu, HI 96822, USA (URL: http://modis.higp.hawaii.edu/); MIROVA (Middle InfraRed Observation of Volcanic Activity), a collaborative project between the Universities of Turin and Florence (Italy) supported by the Centre for Volcanic Risk of the Italian Civil Protection Department (URL: http://www.mirovaweb.it/).