Recently Published Bulletin Reports
Ambrym (Vanuatu) New effusive eruption during January 2024
Popocatepetl (Mexico) Daily gas-and-ash emissions, ashfall, and occasional explosions during August-November 2023
Reventador (Ecuador) Daily explosions, gas-and-ash emissions, and incandescent avalanches during August-November 2023
Erta Ale (Ethiopia) Strong lava lake activity and lava overflows during June-November 2023
Ubinas (Peru) New eruption with explosions and ash plumes during June-December 2023
Kanaga (United States) Small explosion on 18 December 2023
Klyuchevskoy (Russia) New eruption consisting of Strombolian activity, lava flows and fountains, and ash plumes during June-December 2023
Agung (Indonesia) Three eruptive events reported in April, May, and December 2022
Saunders (United Kingdom) Persistent thermal anomalies from the summit crater lava lake during February 2023-January 2024
Tengger Caldera (Indonesia) Minor ash emission in December 2023; persistent weak thermal anomaly in the Bromo crater
Shishaldin (United States) New eruption with significant Strombolian explosions, ash plumes, and ashfall
Ioto (Japan) New eruption with discolored water, ejecta, and floating pumice during October-December 2023
Ambrym (Vanuatu) — February 2024  Cite this Report
Ambrym
Vanuatu
16.25°S, 168.12°E; summit elev. 1334 m
All times are local (unless otherwise noted)
New effusive eruption during January 2024
Ambrym contains a 12-km-wide caldera and is part of the New Hebrides Arc, located in the Vanuatu archipelago. The two currently active craters within the caldera are Benbow and Marum, both of which have produced lava lakes, explosions, lava flows, and gas-and-ash emissions. The previous eruption occurred during late January 2022 and was characterized by ash plumes, sulfur dioxide plumes, and crater incandescence (BGVN 47:05). This report covers a new, short eruption during January 2024, which consisted of a lava effusion and an explosion. Information comes from the Vanuatu Meteorology and Geohazards Department (VMGD) and satellite data.
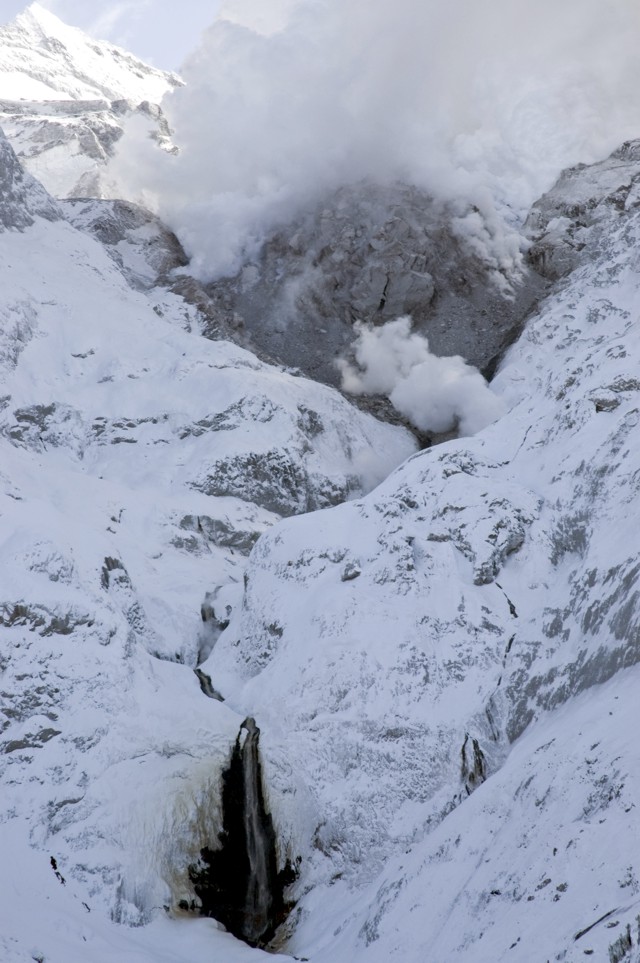
VMGD reported that at 2217 on 13 January an eruption began at Benbow Crater, based on webcam and seismic data. The eruption was characterized by a loud explosion, intense crater incandescence (figure 55), and gas-and-steam emissions. As a result, the Volcano Alert Level (VAL) was raised from 1 to 3 (on a scale of 0-5). A lava flow was reported in Benbow Crater, which lasted for four days. Satellite data showed that 1,116 tons of sulfur dioxide per day (t/d) were emitted on 14 January (figure 56). During the morning of 15 January, ground reports noted loud explosions and minor earthquakes. The sulfur dioxide flux on 15 January was 764 t/d. During 15-17 January activity decreased according to webcam images, seismic data, and field observations. No sulfur dioxide emissions were reported after 15 January. Gas-and-ash emissions also decreased, although they continued to be observed through 31 January, and crater incandescence was less intense (figure 57). The VAL was lowered to 2 on 17 January.
Geologic Background. Ambrym is a large basaltic volcano with a 12-km-wide caldera formed during a major Plinian eruption with dacitic pyroclastic flows about 1,900 years ago. A thick, almost exclusively pyroclastic sequence, initially dacitic then basaltic, overlies lava flows of a pre-caldera shield volcano. Post-caldera eruptions, primarily from Marum and Benbow cones, have partially filled the caldera floor and produced lava flows that ponded on the floor or overflowed through gaps in the caldera rim. Post-caldera eruptions have also formed a series of scoria cones and maars along a fissure system oriented ENE-WSW. Eruptions have been frequently reported since 1774, though mostly limited to extra-caldera eruptions that would have affected local populations. Since 1950 observations of eruptive activity from cones within the caldera or from flank vents have occurred almost yearly.
Information Contacts: Geo-Hazards Division, Vanuatu Meteorology and Geo-Hazards Department (VMGD), Ministry of Climate Change Adaptation, Meteorology, Geo-Hazards, Energy, Environment and Disaster Management, Private Mail Bag 9054, Lini Highway, Port Vila, Vanuatu (URL: http://www.vmgd.gov.vu/, https://www.facebook.com/VanuatuGeohazardsObservatory/); Copernicus Browser, Copernicus Data Space Ecosystem, European Space Agency (URL: https://dataspace.copernicus.eu/browser/).
Popocatepetl (Mexico) — January 2024 Cite this Report
Popocatepetl
Mexico
19.023°N, 98.622°W; summit elev. 5393 m
All times are local (unless otherwise noted)
Daily gas-and-ash emissions, ashfall, and occasional explosions during August-November 2023
Popocatépetl, located 70 km SE of Mexica City, Mexico, contains a 400 x 600 m-wide summit crater. Records of activity date back to the 14th century; three Plinian eruptions, the most recent of which took place about 800 CE, have occurred since the mid-Holocene, accompanied by pyroclastic flows and voluminous lahars that swept basins below the volcano. The current eruption period began in January 2005, characterized by numerous episodes of lava dome growth and destruction within the summit crater. Recent activity has been characterized by daily gas-and-ash emissions, ashfall, and explosions (BGVN 48:09). This report covers similar activity during August through November 2023, according to daily reports from Mexico's Centro Nacional de Prevención de Desastres (CENAPRED) and various satellite data.
Daily gas-and-steam emissions, containing some amount of ash, continued during August through November 2023. CENAPRED reported the number of low-intensity gas-and-ash emissions or “exhalations” and the minutes of tremor, which sometimes included harmonic tremor in their daily reports (figure 220). A total of 21 volcano-tectonic (VT) tremors were detected throughout the reporting period. The average number of exhalations was 117 per day, with a maximum number of 640 on 25 September. Frequent sulfur dioxide plumes that exceeded two Dobson Units (DU) and drifted in multiple directions were visible in satellite data from the TROPOMI instrument on the Sentinel-5P satellite (figure 221).
Activity during August was relatively low and mainly consisted of occasional explosions, ash emissions, and light ashfall. There were 30 explosions (25 minor explosions and four moderate explosions), and nine VT-type events detected. An average number of 60 exhalations occurred each day, which mostly consisted of water vapor, volcanic gases, and a small amount of ash. On 2 August the National Center for Communications and Civil Protection Operations (CENACOM) reported light ashfall in Ocuituco (22 km SW), Yecapixtla (31 km SW), Cuautla (43 km SW), and Villa de Ayala (47 km SW). On 7 August light ashfall was observed in Atlautla (16 km W). A minor explosion at 0305 on 11 August was accompanied by crater incandescence. Explosions at 0618 on 13 August produced a gas-and-ash plume that rose above the summit, and at 0736 another explosion produced a puff of gas-and-ash (figure 222). Two minor explosions were detected at 0223 and 0230 on 16 August that generated eruptive columns with low ash content rising 800 m and 700 m above the crater, respectively. On 24 August an eruptive event lasted 185 minutes and consisted of light ash emissions that did not exceed 300 m above the crater. According to the Washington VAAC, ash plumes identified in daily satellite images rose to 4.6-7.6 km altitude and drifted in multiple directions, the highest of which occurred on 29 August.
There was an average of 156 exhalations each day during September, a monthly total of seven VT-type events, and 29 explosions, 14 of which were minor and nine of which were moderate. A gas-and-ash plume rose to 2 km above the summit and drifted WSW at 1216 on 1 September. CENACOM reported at 1510 observations of ashfall in Ozumba (18 km W), Atlautla, Tepetlixpa (20 km W), and Ecatzingo (15 km SW), as well as in Morelos in Cuernavaca (65 km WSW), Temixco (67 km WSW), Huitzilac (67 km W), Tepoztlán (49 km W), and Jiutepec (59 km SW). The next day, gas-and-ash plumes rose to 2 km above the summit (figure 223). At 1100 ashfall was reported in Amecameca (15 km NW), Ayapango (24 km WNW), Ozumba, Juchitepec, Tenango del Aire (29 km WNW), Atlautla, and Tlalmanalco (27 km NW). A gas-and-ash plume rose to 1 km above the summit and drifted WNW at 1810. During 5-6, 8-9, 12, 14, 19, and 24-25 September ashfall was reported in Amecameca, Atlautla, Ozumba, Tenango del Aire, Tepetlixpa, Juchitepec, Cuernavaca, Ayala, Valle de Chalco (44 km NW), Ixtapaluca (42 km NW), La Paz (50 km NW), Chimalhuacán, Ecatepec, Nezahualcóyotl (60 km NW), Xochimilco (53 km SE), Huayapan, Tetela del Volcano (20 km SW), Yautepec (50 km WSW), Cuautla (43 km SW), Yecapixtla (30 km SW) and possibly Tlaltizapán (65 km SW), Tlaquiltenango, and Tepalcingo. According to the Washington VAAC, ash plumes identified in daily satellite images rose to 5.8-9.1 km altitude and drifted in multiple directions, the highest of which was identified during 1-2 August.
Activity during October and November was relatively low. An average of 179 exhalations consisting of gas-and-steam and ash emissions were reported during October and 73 during November. Only one VT-type event and two explosions were detected during October and four VT-type events and one explosion during November. A satellite image from 0101 on 14 October showed ash fanning out to the NW at 6.7 km altitude and an image from 0717 showed a continuously emitted ash plume drifting WNW and NW at the same altitude. Ash emissions at 1831 on 14 October were ongoing and visible in webcam images slowly drifting W at an altitude of 6.4 km altitude (figure 224). On 24 October a tremor sequence began at 0310 that generated a gas-and-ash plume that rose 800 m above the summit and drifted W. Another tremor sequence occurred during 1305-1900 on 25 October that consisted of continuous ash emissions. Ash plumes identified in daily satellite images rose to 5.5-8.5 km altitude and drifted in different directions during October, according to the Washington VAAC. The highest ash plume was detected on 23 October. During 10-13 November ash plumes rose to 6.7 km altitude and drifted N, NNW, NE, and NW. On 13 November a M 1.5 VT-type event was detected at 0339 and light ashfall was reported in Amecameca, Cocotitlán (34 km NW), and Tenango del Aire, and Ocuituco. On 14 November ash plumes rose to 6 km altitude and drifted N, NE, and SE and light ashfall was reported in Cuernavaca (64 km W). The Washington VAAC reported frequent ash plumes that rose to 5.8-7.9 km altitude and drifted in several directions; the highest ash plume was recorded on 28 November.
Satellite data. MODIS thermal anomaly data provided through MIROVA (Middle InfraRed Observation of Volcanic Activity) showed frequent low-to-moderate thermal anomalies during the reporting period (figure 225). The intensity of the anomalies was lower compared to previous months. According to data from MODVOLC thermal alerts, a total of ten hotspots were detected at the summit crater on 2 August and 2, 4, 9, 19, and 26 September. Thermal activity in the summit crater was visible in infrared satellite data and was sometimes accompanied by ash plumes, as shown on 17 November (figure 226).
Geologic Background. Volcán Popocatépetl, whose name is the Aztec word for smoking mountain, rises 70 km SE of Mexico City to form North America's 2nd-highest volcano. The glacier-clad stratovolcano contains a steep-walled, 400 x 600 m wide crater. The generally symmetrical volcano is modified by the sharp-peaked Ventorrillo on the NW, a remnant of an earlier volcano. At least three previous major cones were destroyed by gravitational failure during the Pleistocene, producing massive debris-avalanche deposits covering broad areas to the south. The modern volcano was constructed south of the late-Pleistocene to Holocene El Fraile cone. Three major Plinian eruptions, the most recent of which took place about 800 CE, have occurred since the mid-Holocene, accompanied by pyroclastic flows and voluminous lahars that swept basins below the volcano. Frequent historical eruptions, first recorded in Aztec codices, have occurred since Pre-Columbian time.
Information Contacts: Centro Nacional de Prevención de Desastres (CENAPRED), Av. Delfín Madrigal No.665. Coyoacan, México D.F. 04360, México (URL: http://www.cenapred.unam.mx/, Daily Report Archive https://www.gob.mx/cenapred/archivo/articulos); Washington Volcanic Ash Advisory Center (VAAC), Satellite Analysis Branch (SAB), NOAA/NESDIS OSPO, NOAA Science Center Room 401, 5200 Auth Rd, Camp Springs, MD 20746, USA (URL: www.ospo.noaa.gov/Products/atmosphere/vaac, archive at: http://www.ssd.noaa.gov/VAAC/archive.html); MIROVA (Middle InfraRed Observation of Volcanic Activity), a collaborative project between the Universities of Turin and Florence (Italy) supported by the Centre for Volcanic Risk of the Italian Civil Protection Department (URL: http://www.mirovaweb.it/); Hawai'i Institute of Geophysics and Planetology (HIGP) - MODVOLC Thermal Alerts System, School of Ocean and Earth Science and Technology (SOEST), Univ. of Hawai'i, 2525 Correa Road, Honolulu, HI 96822, USA (URL: http://modis.higp.hawaii.edu/); NASA Global Sulfur Dioxide Monitoring Page, Atmospheric Chemistry and Dynamics Laboratory, NASA Goddard Space Flight Center (NASA/GSFC), 8800 Greenbelt Road, Goddard, Maryland, USA (URL: https://so2.gsfc.nasa.gov/); Copernicus Browser, Copernicus Data Space Ecosystem, European Space Agency (URL: https://dataspace.copernicus.eu/browser/).
Reventador (Ecuador) — January 2024 Cite this Report
Reventador
Ecuador
0.077°S, 77.656°W; summit elev. 3562 m
All times are local (unless otherwise noted)
Daily explosions, gas-and-ash emissions, and incandescent avalanches during August-November 2023
Volcán El Reventador, located in Ecuador, is a stratovolcano with a 4-km-wide avalanche scarp open to the E that was formed by edifice collapse. The largest recorded eruption took place in 2002 producing a 17-km-high eruption column, pyroclastic flows that traveled as far as 8 km, and lava flows from summit and flank vents. Recorded eruptions date back to the 16th century and have been characterized by explosive events, lava flows, ash plumes, and lahars. Frequent lahars have built deposits on the scarp slope. The current eruption period began in July 2008 and has recently been characterized daily explosions, gas-and-ash emissions, and block avalanches (BGVN 48:08). This report covers similar activity during August through November 2023 using daily reports from Ecuador's Instituto Geofisico (IG-EPN) and satellite data.
During August through November 2023, IG-EPN reported daily explosions, gas-and-ash plumes that rose as high as 1.3 km above the crater, and frequent crater incandescence, often accompanied by incandescent block avalanches that affected one or multiple flanks. More daily explosions were detected during November, with an average total of 46 per day.
Table 19. Monthly summary of explosions and plume heights recorded at Reventador from August through November 2023. Data could not be collected for 29-30 September 2023 and 6-23 October 2023. Data courtesy of IG-EPN (August-November 2023 daily reports).
| Month |
Average number of explosions per day |
Max plume height above the crater rim (km) |
| Aug 2023 |
32 |
1.3 |
| Sep 2023 |
30 |
1 |
| Oct 2023 |
31 |
1.3 |
| Nov 2023 |
46 |
1.2 |
Activity during August consisted of 6-75 daily explosions, nighttime crater incandescence, and incandescent avalanches of material. Frequent seismicity was mainly characterized by long-period (LP) events, harmonic tremor (TRARM), tremor-type (TRE), and volcano tectonic (VT)-type events. Daily gas-and-ash emissions rose 200-1,300 m above the summit and drifted W, SW, NW, NE, N, and E, based on webcam and satellite images. The Washington VAAC also reported occasional ash plumes that rose 400-1,600 m above the crater and drifted NW. Avalanches of incandescent material were reported during 1-2, 6-7, 9-14, 16-17, 18-21, and 26-29 August, which traveled 500-900 m below the crater and affected multiple flanks (figure 180). During 24-25 August incandescent material was ejected 300 m above the crater.
Gas-and-ash emissions and seismicity characterized by LP, VT, TRARM, and TRE-type events continued during September; data were not available for 29-30 September. Daily gas-and-ash emissions rose 200-1,000 m above the crater and generally drifted W, NW, and SW (figure 181). Near-daily explosions ranged from 16-53 per day, often accompanied by incandescent avalanches, which affected one or multiple flanks and traveled 100-800 m below the crater. During 2-3 September incandescent material was ejected 200 m above the crater and was accompanied by blocks rolling down the flanks. During 16-17 September incandescent material was ejected 100-200 m above the crater and avalanches descended 600 m below the crater. During 21-22 and 24-26 September incandescent material was ejected 100-300 m above the crater. According to the Washington VAAC, ash plumes rose 700 m above the crater and drifted SW, W, and NW on 3, 16, and 20 September, respectfully.
During October, daily explosions, gas-and-ash plumes, and crater incandescence continued, with 16-40 explosions recorded each day (figure 182); data was not available for 6-23 October. Seismicity consisted of LP, TRE, and TRARM-type events. Gas-and-ash emissions rose 200-1,000 m above the crater and drifted W, SW, NW, SSW, NNW, and NE. The Washington VAAC reported that ash plumes rose 1-1.3 km above the crater and drifted W, SW, and NW during 1-5 October. During 30 September-1 October incandescent avalanches descended 700 m below the crater. Ejected material rose 200 m above the crater during 2-5 October and was accompanied by avalanches of material that traveled 250-600 m below the crater rim; incandescent avalanches were also reported during 23-29 October.
Daily explosions, LP, TRARM, VT, and TRE-type events, crater incandescence, and avalanches of material continued during November. There were 26-62 daily explosions detected throughout the month. Gas-and-ash emissions rose 300-1,200 m above the crater and drifted in different directions (figure 183). The Washington VAAC reported that ash plumes rose 700-1,620 m above the crater and drifted NW, W, WNW, SW, E, SE, and ESE. Frequent incandescent avalanches descended 500-1,000 m below the crater. Explosions ejected material 100-300 m above the crater during 4-7, 11-12, and 19-23 November.
Satellite data. MIROVA (Middle InfraRed Observation of Volcanic Activity) analysis of MODIS satellite data showed intermittent thermal anomalies of low-to-moderate power (figure 184). Thermal activity mainly consisted of incandescent avalanches descending the flanks due to the frequently detected explosions. The MODVOLC hotspot system identified a total of ten hotspots on 3 August, 7, 18, 12, 22, and 28 September, and 7, 9, and 19 November.
Geologic Background. Volcán El Reventador is the most frequently active of a chain of Ecuadorian volcanoes in the Cordillera Real, well east of the principal volcanic axis. The forested, dominantly andesitic stratovolcano has 4-km-wide avalanche scarp open to the E formed by edifice collapse. A young, unvegetated, cone rises from the amphitheater floor to a height comparable to the rim. It has been the source of numerous lava flows as well as explosive eruptions visible from Quito, about 90 km ESE. Frequent lahars in this region of heavy rainfall have left extensive deposits on the scarp slope. The largest recorded eruption took place in 2002, producing a 17-km-high eruption column, pyroclastic flows that traveled up to 8 km, and lava flows from summit and flank vents.
Information Contacts: Instituto Geofísico, Escuela Politécnica Nacional (IG-EPN), Casilla 17-01-2759, Quito, Ecuador (URL: http://www.igepn.edu.ec/); MIROVA (Middle InfraRed Observation of Volcanic Activity), a collaborative project between the Universities of Turin and Florence (Italy) supported by the Centre for Volcanic Risk of the Italian Civil Protection Department (URL: http://www.mirovaweb.it/); Hawai'i Institute of Geophysics and Planetology (HIGP) - MODVOLC Thermal Alerts System, School of Ocean and Earth Science and Technology (SOEST), Univ. of Hawai'i, 2525 Correa Road, Honolulu, HI 96822, USA (URL: http://modis.higp.hawaii.edu/).
Erta Ale (Ethiopia) — January 2024 Cite this Report
Erta Ale
Ethiopia
13.601°N, 40.666°E; summit elev. 585 m
All times are local (unless otherwise noted)
Strong lava lake activity and lava overflows during June-November 2023
Erta Ale in Ethiopia has a 50-km-wide edifice that rises more than 600 m from below sea level in the Danakil depression. The summit caldera is 0.7 x 1.6 km and contains at least two pit craters (North and South). Another larger 1.8 x 3.1-km-wide depression is located SE of the summit and is bounded by curvilinear fault scarps on the SE side. Lava flows from fissures have traveled into the caldera and locally overflowed the crater rim. The current eruption has been ongoing since 1967, with at least one long-term active lava lake present in the summit caldera. Recent fissure eruptions from 2017 have occurred on the SE flank (BGVN 42:07). Recent activity has been characterized by minor thermal activity at the S crater and an active lava lake at the N crater (BGVN 48:06). This report covers strong lava lake activity primarily at the N pit crater during June through November 2023 using information from satellite infrared data.
Infrared satellite images generally showed an active lava lake as the N pit crater and variable thermal activity at the S pit crater during the reporting period. On 7 June two strong thermal anomalies were detected at the S pit crater and two weaker anomalies were visible at the N pit crater. Those anomalies persisted throughout the month, although the intensity at each declined. On 2 July a possible lava lake was identified at the S pit crater, filling much of the crater. On 7 July both pit craters contained active lava lakes (figure 120). By 12 July the thermal activity decreased; two smaller anomalies were visible through the rest of the month at the S pit crater while the N pit crater showed evidence of cooling.
Renewed lava lake activity was identified at the N pit crater, based on a satellite image from 11 August, with two smaller anomalies visible at the S pit crater. By 16 August the lava lake in the N pit had begun to cool and only a small thermal anomaly was identified. Activity restarted on 21 August, filling much of the E and SE part of the N pit crater. The thermal activity at the N pit crater intensified on 31 August, particularly in the NW part of the crater. On 5 September lava filled much of the N pit crater, overflowing to the W and SW. During at least 10-20 September thermal activity at both craters were relatively low.
According to a satellite image on 25 September, strong thermal activity resumed when lava overflowed the N pit crater to the S, SW, and NE (figure 120). A satellite image taken on 5 October showed lava flows from the N had spilled into the S and begun to cool, accompanied by two weak thermal anomalies at the S pit crater. On 15 October lava flows again traveled SE and appeared to originate from the S pit crater (figure 120). Following these events, smaller thermal anomalies were visible on the SE rim of the N pit crater and within the S pit crater.
Lava was visible in the NW part of the N pit crater according to a satellite image taken on 4 November. By 9 November the intensity had decreased, and the lava appeared to cool through the rest of the month; young lava flows were visible along the W side of the S pit crater on 24 and 29 November. Lava flows occurred at the N pit crater trending NE-SW and along the E side on 29 November (figure 120).
During the reporting period, the MIROVA (Middle InfraRed Observation of Volcanic Activity) thermal detection system recorded consistent activity during the first half of 2023 (figure 121). Beginning in June 2023, thermal activity increased and remained variable in intensity through the end of the year indicating the presence of an active lava lake and lava flows. The MODVOLC thermal detection system registered a total of 63 anomalies during 7, 8, and 23 July, 10 and 18 August, 3, 5, 16, 23, 24, and 25 September, 15 and 20 October, and 21, 24, 26, 28, and 30 November. Some of these stronger thermal anomalies were also detected in Sentinel-2 infrared satellite images that showed an active lava lake at the N pit crater and subsequent lava overflows from both pit craters (figure 120).
Geologic Background. The Erta Ale basaltic shield volcano in Ethiopia has a 50-km-wide edifice that rises more than 600 m from below sea level in the Danakil depression. The volcano includes a 0.7 x 1.6 km summit crater hosting steep-sided pit craters. Another larger 1.8 x 3.1 km wide depression elongated parallel to the trend of the Erta Ale range is located SE of the summit and is bounded by curvilinear fault scarps on the SE side. Basaltic lava flows from these fissures have poured into the caldera and locally overflowed its rim. The summit caldera usually also holds at least one long-term lava lake that has been active since at least 1967, and possibly since 1906. Recent fissure eruptions have occurred on the N flank.
Information Contacts: MIROVA (Middle InfraRed Observation of Volcanic Activity), a collaborative project between the Universities of Turin and Florence (Italy) supported by the Centre for Volcanic Risk of the Italian Civil Protection Department (URL: http://www.mirovaweb.it/); Hawai'i Institute of Geophysics and Planetology (HIGP) - MODVOLC Thermal Alerts System, School of Ocean and Earth Science and Technology (SOEST), Univ. of Hawai'i, 2525 Correa Road, Honolulu, HI 96822, USA (URL: http://modis.higp.hawaii.edu/); Copernicus Browser, Copernicus Data Space Ecosystem, European Space Agency (URL: https://dataspace.copernicus.eu/browser/).
Ubinas
Peru
16.345°S, 70.8972°W; summit elev. 5608 m
All times are local (unless otherwise noted)
New eruption with explosions and ash plumes during June-December 2023
Ubinas, located in Peru, has had 24 eruptions since 1550, which more recently have been characterized by explosions, ash plumes, and lahars (BGVN 45:03). This report covers a new eruption during June through December 2023 based on reports from Instituto Geofisico del Peru (IGP), Instituto Geológico Minero y Metalúrgico (INGEMMET), and satellite data.
IGP reported that seismic unrest began on 17 May, followed by an increase in seismicity during the second half of the month. There were 168 volcano-tectonic (VT) earthquakes detected, which are associated with rock fracturing processes, and 171 long-period (LP) earthquakes recorded during 16-24 May, which are associated with the movement of volcanic fluid.
Seismicity and fumarolic activity at the crater level continued to increase during June. During 1-18 June there was an average of 631 VT-type earthquakes and 829 LP earthquakes recorded. Webcams showed gas-and-steam emissions rising 500 m above the summit and drifting SE. In addition, the maximum value of emitted sulfur dioxide during this period was 337 tons/day. During 19-22 June an average of 315 VT-type events and 281 LP-type events and tremor were reported. On 20 June the Gobierno Regional de Moquegua raised the Volcano Alert Level (VAL) to Yellow (the second level on a four-color scale), based on recommendations from IGP. Webcam images showed ash emissions rising 1 km above the summit and drifting E at 0011 on 22 June, which IGP reported marked the start of a new eruption. Sporadic and diffuse gas-and-ash emissions continued to rise 800-1,500 m above the summit through the rest of the month and drifted mainly E, N, NW, W, SW, and NE. During 23-25 June there was an average of 402 VT-type earthquakes and 865 LP-type events detected. During 26-28 June the earthquakes associated with ash emissions, which have been observed since 22 June, decreased, indicating the end of the phreatic phase of the eruption, according to IGP. A thermal anomaly was detected in the crater for the first time on 26 June and was periodically visible through 4 July (figure 61). During 29-30 June there was an average of 173 VT-type earthquakes and 351 LP-type events recorded, and sulfur dioxide values ranged between 600 t/d and 1,150 t/d. During this same time, seismicity significantly increased, with 173 VT-type earthquakes, 351 LP-type events, and harmonic tremor which signified rising magma. The Gobierno Regional de Moquegua raised the Alert Level to Orange (the third level on a four-color scale) on 30 June based on the recommendation from IGP and INGEMMET.
Activity during July consisted of continued seismicity and gas-and-ash emissions. Gas-and-ash emissions rose as high as 5 km above the summit and drifted as far as 40 km in different directions during 1, 4-6, 16, 20-23, 26, and 29 July, based on webcam and satellite images. During 1-2 July an average of 72 VT-type earthquakes and 114 LP-type events were detected. In addition, during that time, ashfall was reported in Ubinas (6.5 km SSE) and Querapi (4.5 km SE). During 2-3 July INGEMMET reported gas-and-ash plumes rose 400 m above the summit and drifted SW, causing ashfall in downwind areas as far as 5 km. During 3-4 July there was an average of 69 VT-type earthquakes and 96 LP-type events reported. On 4 July starting around 0316 there were 16 seismic signals associated with explosive activity and ash emissions detected (figure 62). According to INGEMMET an explosion ejected ballistics and generated a gas-and-ash plume that rose 5.5 km above the summit and drifted SW and S. Ashfall was recorded in Querapi, Ubinas, Sacohaya (7 km SSE), Anascapa (11 km SE), San Miguel (10 km SE), Tonohaya (7 km SSE), Huatahua, Huarina, Escacha (9 km SE), and Matalaque (17 km SSE), and was most significant within 5 km of the volcano. IGP noted that ash fell within a radius of 20 km and deposits were 1 mm thick in towns in the district of Ubinas.
During 5-9 July an average of 67 VT-type events and 47 LP-type events were reported. A period of continuous gas-and-ash emissions occurred on 5 July, with plumes drifting more than 10 km SE and E. A total of 11 seismic signals associated with explosions also detected on 6, 16, 17, and 22 July. On 6 July explosions recorded at 0747 and 2330 produced gas-and-ash plumes that rose as high as 3.5 km above the summit and drifted as far as 30 km NW, NE, SE, and S. According to the Washington VAAC the explosion at 0747 produced a gas-and-ash plume that rose to 9.1 km altitude and drifted SW, which gradually dissipated, while a lower-altitude plume rose to 7.6 km altitude and drifted NE. Gobierno Regional de Moquegua declared a state of emergency for districts in the Moquegua region, along with Coalaque Chojata, Icuña, Lloque, Matalaque, Ubinas, and Yunga of the General Sánchez Cerro province, to be in effect for 60 days. On 7 July an ash plume rose to 7.3 km altitude and drifted E at 0320. At 0900 and 1520 gas-and-steam plumes with diffuse ash rose to 6.7 km altitude and drifted SE. Small ash emissions were visible in satellite and webcam images at 0920 and 1520 on 8 July and rose as high as 6.4 km altitude and drifted SE. During 10-16 July there was an average of 80 VT-type earthquakes and 93 LP-type events reported. INGEMMET reported that during 9-11 July sulfur dioxide emissions were low and remained around 300 t/d.
During 17-23 July an average of 46 VT-type events and 122 LP-type events were detected. On 20 July at 0530 an explosion generated an ash plume that rose 3-4.5 km above the crater and drifted 65 km toward Arequipa. An explosion on 21 July at 0922 produced a gas-and-ash plume that rose 5 km above the summit (figure 63). Ashfall was reported in Querapi, Ubinas, Tonohaya, Anascapa, Sacohaya, San Miguel, Escacha, Huatagua (14 km SE), Huarina, Escacha (9 km SE), Matalaque, Logén, Santa Lucía de Salinas, and Salinas de Moche. An explosion on 22 July at 1323 generated an ash plume that rose 5.5 km above the summit and drifted NE, E, and SE. During 24-30 July there were five volcanic explosions detected and an average of 60 VT-type events and 117 LP-type events. An explosion on 29 July at 0957 produced an ash plume that rose 2.5 km above the summit and drifted as far as 40 km NE, E, and SE. As a result, significant ashfall was reported in Ubinas and Matalaque.
During August, explosions, gas-and-ash emissions, and seismic earthquakes persisted. During 31 July to 6 August there was an average of 115 VT-type events and 124 LP-type events reported. Gas-and-ash emissions were observed during 1, 6, 10, 13-14, 17-18, 21, and 23 August and they drifted as far as 20 km in different directions; on 14 and 18 August continuous ash emissions extended as far as 40 km S, SE, and NE. An explosion was detected at 2110 on 1 August, which generated a gas-and-ash plume that rose 5.4 km above the summit and drifted SE and E. The explosion ejected blocks and incandescent material as far as 3 km from the crater onto the SW, S, and SE flanks. Ashfall was reported in Ubinas and Chojata (19 km ESE). Gas-and-ash emissions rose as high as 2 km above the summit and drifted in different directions through 5 August, sometimes causing ashfall within a 15-km-radius. An explosion at 0009 on 6 August ejected blocks and produced a gas-and-ash plume that rose 1.4 km above the summit and drifted SE and E, which caused ashfall in Ubinas and Chojata and other areas within a 30-km radius. During 7-13 August there was an average of 102 VT-type events and 60 LP-type events detected. INGEMMET reported that sulfur dioxide emissions were low on 7 August and averaged 400 t/d.
One volcanic explosion that was recorded on 10 August, producing gas-and-ash emissions that rose 2.4 km above the summit and drifted as far as 25 km SE and E. Ashfall was observed in Ubinas, Matalaque, and Chojata. During 10-11 and 13-14 August sulfur dioxide values increased slightly to moderate levels of 2,400-3,700 t/d. The average number of VT-type events was 104 and the number of LP-type events was 71 during 14-21 August. Two explosions were detected at 0141 and 0918 on 21 August, which produced gas-and-ash emissions that rose 3.5 km above the summit and drifted 50 km N, NE, W, and NW (figure 64). The explosion at 0918 generated an ash plume that caused ashfall in different areas of San Juan de Tarucani. During 22-27 August the average number of VT-type events was 229 and the average number of LP-type events was 54. An explosion was reported at 1757 on 25 August, which generated a gas-and-ash plume that rose 4.2 km above the summit and drifted in multiple directions as far as 25 km. During 28 August through 3 September gas-and-ash emissions rose 600 m above the summit and drifted as far as 5 km E and SE. During this time, there was an average of 78 VT-type events and 42 LP-type events.
Gas-and-steam emissions rose 600-2,600 m above the summit and drifted as far as 15 km in multiple directions during September. During 4-10 and 11-17 September there was an average of 183 VT-type events and 27 LP-type events, and 114 VT-type events and 86 LP-type events occurred, respectively. On 14 September an explosion at 1049 generated a gas-and-ash plume that rose 2.6 km above the summit and drifted as far as 15 km E, NE, SE, and S (figure 65). During 14-16 September an average of three hours of seismic tremor related to ash emissions was recorded each day. During 18-24 September the average number of VT-type events was 187 and the average number of LP-type events was 45. During 25 September and 1 October, there was an average number of 129 VT-type events and 52 LP-type events detected.
Relatively low activity was reported during October; during 2-9 October there was an average number of 155 VT-type events and 27 LP-type events recorded. On 1 October at 1656 seismic signals associated with ash emissions were recorded for an hour and thirty minutes; the ash plumes rose as high as 1 km above the summit and drifted more than 10 km E, S, and SW. On 4 October IGP reported that an ash plume drifted more than 15 km SW and S. Sulfur dioxide emissions were 1,250 t/d on that day. On 7 October a gas-and-ash plume rose 1.9 km above the summit and drifted NE, E, and SE. On 4 October the amount of sulfur dioxide emissions was 1,250 t/d. During 10-15 October there was an average number of 225 VT-type events and 34 LP-type events recorded. On 11 October at 1555 a single seismic signal associated with an ash pulse was recorded; the gas-and-ash emissions rose 700 m above the summit and drifted SW and W. There was an average of 204 VT-type events and 25 LP-type events detected during 16-22 October and 175 VT-type events and 17 LP-type events during 23-29 October. On 27 October at 0043 a gas-and-ash emission rose 500 m above the summit and drifted SE and E. A minor thermal anomaly was visible on the crater floor. During 30 October to 5 November there was an average of 95 VT-type events and 24 LP-type events detected.
Activity remained relatively low during November and December and consisted mainly of gas-and-steam emissions and seismicity. Gas-and-steam emissions rose 900-1,100 m above the summit and drifted mainly E, SE, N, and NE. IGP detected an average of 166 VT-type events and 38 LP-type events during 6-15 November, 151 VT-type events and 17 LP-type events during 16-30 November, 143 VT-type events and 23 LP-type events during 1-15 December, and 129 VT-type events and 21 LP-type events during 16-31 December. No explosions or ash emissions were recorded during November. The VAL was lowered to Yellow (the second level on a four-color scale) during the first week of November. According to the Washington VAAC an ash emission was identified in a satellite image at 0040 on 11 December that rose to 5.5 km altitude and drifted NW. Webcam images at 0620 and 1220 showed continuous gas-and-steam emissions possibly containing some ash rising as high as 7 km altitude. Webcam images during 10-31 December showed continuous gas-and-ash emissions that rose as high as 2.5 km above the summit and drifted up to 5 km NW, W, and SW. On 12 December continuous ash emissions drifted more than 10 km N and NW.
Geologic Background. The truncated appearance of Ubinas, Perú's most active volcano, is a result of a 1.4-km-wide crater at the summit. It is the northernmost of three young volcanoes located along a regional structural lineament about 50 km behind the main volcanic front. The growth and destruction of Ubinas I was followed by construction of Ubinas II beginning in the mid-Pleistocene. The upper slopes of the andesitic-to-rhyolitic Ubinas II stratovolcano are composed primarily of andesitic and trachyandesitic lava flows and steepen to nearly 45°. The steep-walled, 150-m-deep summit crater contains an ash cone with a 500-m-wide funnel-shaped vent that is 200 m deep. Debris-avalanche deposits from the collapse of the SE flank about 3,700 years ago extend 10 km from the volcano. Widespread Plinian pumice-fall deposits include one from about 1,000 years ago. Holocene lava flows are visible on the flanks, but activity documented since the 16th century has consisted of intermittent minor-to-moderate explosive eruptions.
Information Contacts: Instituto Geofisico del Peru (IGP), Calle Badajoz N° 169 Urb. Mayorazgo IV Etapa, Ate, Lima 15012, Perú (URL: https://www.gob.pe/igp); Observatorio Volcanologico del INGEMMET (Instituto Geológical Minero y Metalúrgico), Barrio Magisterial Nro. 2 B-16 Umacollo - Yanahuara Arequipa, Peru (URL: http://ovi.ingemmet.gob.pe); Gobierno Regional Moquegua, Sede Principal De Moquegua, R377+5RR, Los Chirimoyos, Moquegua 18001, Peru (URL: https://www.gob.pe/regionmoquegua); Washington Volcanic Ash Advisory Center (VAAC), Satellite Analysis Branch (SAB), NOAA/NESDIS OSPO, NOAA Science Center Room 401, 5200 Auth Rd, Camp Springs, MD 20746, USA (URL: www.ospo.noaa.gov/Products/atmosphere/vaac, archive at: http://www.ssd.noaa.gov/VAAC/archive.html); MIROVA (Middle InfraRed Observation of Volcanic Activity), a collaborative project between the Universities of Turin and Florence (Italy) supported by the Centre for Volcanic Risk of the Italian Civil Protection Department (URL: http://www.mirovaweb.it/); Copernicus Browser, Copernicus Data Space Ecosystem, European Space Agency (URL: https://dataspace.copernicus.eu/browser/).
Kanaga (United States) — January 2024 Cite this Report
Kanaga
United States
51.923°N, 177.168°W; summit elev. 1307 m
All times are local (unless otherwise noted)
Small explosion on 18 December 2023
Kanaga lies within the Kanaton caldera at the northern tip of Kanaga Island. The caldera rim forms a 760-m-high arcuate ridge south and east of Kanaga; a lake occupies part of the SE caldera floor. Most of its previous recorded eruptions are poorly documented, although they date back to 1763. Fumarolic activity at Kanaga occurs in a circular, 200-m-wide, 60-m-deep summit crater and produces vapor plumes sometimes seen on clear days from Adak, 50 km to the east. Its most recent eruption occurred in February 2012, which consisted of numerous small earthquakes, a possible weak ash cloud, and gas-and-steam emissions (BGVN 38:03). This report covers a new eruption during December 2023, based on information from the Alaska Volcano Observatory (AVO).
A small explosion was detected in local infrasound and seismic data at 2231 on 18 December, followed by elevated seismicity. No ash emissions were visible in partly cloudy satellite images. On 19 December the Volcano Alert Level (VAL) was raised to Advisory (the second level on a four-level scale) and the Aviation Color Code (ACC) was raised to Yellow (the second color on a four-color scale). The rate of seismicity significantly declined after the 18th, although it remained elevated through 30 December. Small, daily earthquakes occurred during 19-28 December. Satellite observations following the event showed a debris flow extending 1.5 km down the NW flank. Possible minor gas-and-steam emissions were visible in a webcam image on 20 December. Weakly elevated surface temperatures were identified in satellite data during 23-26 December. A series of cracks extending from the inner crater to the upper SE flank and debris deposits on the upper flanks were observed in satellite images on 27 December. AVO reported that these were likely formed during the 18 December event. Local webcam and seismic data were temporarily offline due to a power failure during 4-28 January.
On 28 January connection to the seismic stations and webcams was restored and webcam images showed gas-and-steam emissions at the summit. Occasional earthquakes were also detected each day. A period of weak seismic tremor was observed on 31 January. During February, the number of earthquakes declined. On 27 February AVO lowered the VAL to Normal (the lowest level on a four-level scale) and the ACC to Green (the lowest color on a four-color scale) due to decreased levels of seismicity and no new surface changes or elevated temperatures based on satellite and webcam data.
Geologic Background. Symmetrical Kanaga stratovolcano is situated within the Kanaton caldera at the northern tip of Kanaga Island. The caldera rim forms a 760-m-high arcuate ridge south and east of Kanaga; a lake occupies part of the SE caldera floor. The volume of subaerial dacitic tuff is smaller than would typically be associated with caldera collapse, and deposits of a massive submarine debris avalanche associated with edifice collapse extend nearly 30 km to the NNW. Several fresh lava flows from historical or late prehistorical time descend the flanks of Kanaga, in some cases to the sea. Historical eruptions, most of which are poorly documented, have been recorded since 1763. Kanaga is also noted petrologically for ultramafic inclusions within an outcrop of alkaline basalt SW of the volcano. Fumarolic activity occurs in a circular, 200-m-wide, 60-m-deep summit crater and produces vapor plumes sometimes seen on clear days from Adak, 50 km to the east.
Information Contacts: Alaska Volcano Observatory (AVO), a cooperative program of a) U.S. Geological Survey, 4200 University Drive, Anchorage, AK 99508-4667 USA (URL: https://avo.alaska.edu/), b) Geophysical Institute, University of Alaska, PO Box 757320, Fairbanks, AK 99775-7320, USA, and c) Alaska Division of Geological & Geophysical Surveys, 794 University Ave., Suite 200, Fairbanks, AK 99709, USA (URL: http://dggs.alaska.gov/).
Klyuchevskoy (Russia) — January 2024 Cite this Report
Klyuchevskoy
Russia
56.056°N, 160.642°E; summit elev. 4754 m
All times are local (unless otherwise noted)
New eruption consisting of Strombolian activity, lava flows and fountains, and ash plumes during June-December 2023
Klyuchevskoy, located on the Kamchatka Peninsula, has produced frequent moderate-volume explosive and effusive eruptions and more than 100 flank eruptions have occurred during the past 3,000 years. Eruptions recorded since the late 17th century have resulted in frequent changes to the morphology of the 700-m-wide summit crater. Eruptions over the past 400 years have primarily originated from the summit crater, although numerous major explosive and effusive eruptions have also occurred from flank craters. The previous eruption ended in November 2022 and consisted of Strombolian activity (BGVN 47:12). This report covers a new eruption during June through December 2023, characterized by Strombolian explosions, lava flows, and ash plumes. Information primarily comes from weekly and daily reports from the Kamchatkan Volcanic Eruption Response Team (KVERT) and various satellite data.
KVERT reported that a Strombolian eruption began at 2323 on 22 June. A thermal anomaly was visible in satellite data starting on 22 June (figure 75). As a result, the Aviation Color Code (ACC) was raised to Yellow (the second lowest level on a four-color scale). During 4-6 and 13 July small ash clouds were occasionally observed over the crater. On 19 July a new lava flow began to effuse along the Apakhonchich drainage on the SE flank, which continued through 19 August. Lava fountaining was reported on 21 July in addition to the active lava flow, which continued through 23 August and during 27-30 August. During 22-23 and 27-30 August the lava flow was active along the Apakhonchich drainage on the SE flank.
Similar activity was observed during September. Lava fountaining resumed on 2 September and continued through 31 October. In addition, on 2 September a lava flow began to effuse along the Kozyrevsky drainage on the SW flank. During 3-5 September resuspended ash plumes rose to 3-3.5 km altitude and extended as far as 170 km E by 1940 on 4 September. The ACC was raised to Orange (the third level on a four-color scale) at 1240 on 4 September. The ACC was briefly lowered back to Yellow at 1954 that same day before returning to Orange during 1532-1808 on 5 September due to resuspended ash plumes that rose to 3 km altitude and drifted 120 km E at 1500. KVERT reported that Strombolian activity continued, feeding the lava flows advancing down the Apakhonchichsky and Kozyrevsky drainages through most of the month. During 25 September through 16 October the lava flow was only active in the Apakhonchichisky drainage (figure 76). During 9-12 September resuspended ash plumes rose to 1.5-4 km altitude and extended 550 km E and SE. On 22 September resuspended ash plumes rose to 2-2.5 km altitude and drifted 50-90 km E, which prompted KVERT to raise the ACC to Orange; the ACC was lowered back to Yellow on 24 September. On 29 September phreatic explosions generated ash plumes that rose to 5.2-5.3 km altitude.
Activity during October continued with lava fountains, lava flows, and ash plumes. Strombolian activity with lava fountains continued at the crater and active lava flows alternately descended the Apakhonchichisky and Kozyrevsky drainages on the SE and S flanks (figure 77). During 11-12 October gas-and-steam plumes containing some ash rose to 5.5-6 km altitude and extended as far as 65 km NE and SE. The ACC was raised to Orange on 11 October. According to observers at the Kamchatka Volcanological Station, lava effusion was almost continuous, and incandescent material was ejected as high as 300 m above the crater rim. On 13 October at 1420 an ash plume rose to 5-5.5 km altitude and drifted 90-100 km SE. During 14-16 October gas-and-steam plumes containing some ash rose to 4-6 km altitude and drifted 40-145 km ESE and E. On 16 October lava on the SE flank melted the snow and ice, causing phreatic explosions and large collapses of material from the margins of the flow. At 1500 an ash plume rose to 6.5-7 km altitude and drifted 70 km ENE. On 17 October an ash plume was reported extending 360 km NE. Gray-red ashfall was observed in Klyuchi at 0700; this ash was resuspended from older material.
During 22-31 October phreatic explosions generated ash plumes mainly containing ash from collapses of previously deposited pyroclastic material that rose to 7 km altitude and extended as far as 280 km NE, E, SW, and S on 23 and 29 October the ash plumes rose to 8 km altitude. Ash plumes during 27-29 October rose to 8 km altitude and drifted as far as 300 km SE, ESE, and E. Lava fountains rose up to 500 m above the crater during 27-31 October. Scientists from the Kamchatka Volcanological Station visited the volcano on 28 October and reported that the cinder cone at the summit had grown. They also observed advancing lava on the E flank that extended about 2 km from the summit to 2,700 m elevation, incandescent ejecta 500 m above the crater, and avalanches in the Apakhonchichsky drainage. On 31 October activity intensified, and lava flows were reported moving in the Kretovsky, Kozyrevsky, and Apakhonchichisky drainages on the NW, SW, and SE flanks. At 0930 an ash plume rose to 7 km altitude and at first drifted 169 km SW and then 646 km SE. KVERT reported ash plumes rose to 14 km altitude and extended as far as 1,500 km SSE. The ACC was raised to Red (the highest level on a four-color scale). During 31 October to 1 November ash plumes rose as high as 14 km altitude and drifted as far as 2,255 km ESE.
Activity on 1 November intensified. The lava fountains rose as high as 1 km above the summit (figure 78) and fed the lava flows that were active on the Kretovsky, Kozyrevsky, and Apakhonchichsky drainages on the NW, SW, and SE flanks. Ash plumes rose to 10-14 km altitude and drifted as far as 1,500 km SSE (figure 79). According to the Kamchatka Volcanological Station, observers reported pyroclastic flows descending the flanks. Lahars descended the Studenoy River, blocking the Kozyrevsky-Petropavlovsk federal highway and descended the Krutenkaya River, blocking the road E of Klyuchi. According to news articles the ash plumes caused some flight cancellations and disruptions in the Aleutians, British Columbia (Canada), and along flight paths connecting the Unites States to Japan and South Korea. Ash plumes containing old ash from collapses in the Apakhonchichsky drainage due to phreatic explosions rose to 9.5-9.8 km altitude and drifted 192 km SW at 1400 and to 8.7 km altitude and drifted 192 km SW at 1710 on 1 November.
On 2 November ash plumes rose to 6-14 km altitude; the ash plume that rose to 14 km altitude decreased to 6.5 km altitude and drifted NNE by 2000 and continued to drift more than 3,000 km ESE and E. The ACC was lowered to Orange. On 3 November ash plumes rose to 5-8.2 km altitude and drifted 72-538 km ENE, NNE, and ESE; at 0850 an ash plume rose to 6-6.5 km altitude and drifted more than 3,000 km ESE throughout the day. During 4-6 and 8-10 November resuspended ash plumes associated with collapses of old pyroclastic material from the sides of the Apakhonchichsky drainage due to phreatic explosions rose to 4.5-5.5 km altitude and extended 114-258 km NE, ENE, and E. KVERT reported that the eruption stopped on 5 November and the lava flows had begun to cool. Resuspended ash plumes rose to 5-6 km altitude and drifted 60 km E at 0820 on 13 November and to 5 km and 4.5 km altitude at 1110 and 1430 and drifted 140 km E and 150 km ESE, respectively. On 15 November the ACC was lowered to Green.
Activity was relatively low during most of December. On 27 December Strombolian activity resumed based on a thermal anomaly visible in satellite data. On 30 December an ash plume rose to 6 km altitude and extended 195 km NW. The ACC was raised to Orange. On 31 December video and satellite data showed explosions that generated ash plumes that rose to 5-6.5 km altitude and drifted 50-230 km WNW and NW. Though a thermal anomaly persisted through 1 January 2024, no explosions were detected, so the ACC was lowered to Yellow.
Satellite data. Thermal activity was strong throughout the reporting period due to frequent lava fountaining and lava flows. MODIS thermal anomaly data provided through MIROVA (Middle InfraRed Observation of Volcanic Activity) showed strong activity during the entire reporting period, resulting from lava fountaining and lava flows (figure 80). According to data from MODVOLC thermal alerts, a total of 336 hotspots were detected in June (3), July (30), August (11), September (52), October (217), and November (23). Thermal activity was also visible in infrared satellite images, often showing a strong thermal anomaly at the summit crater and a lava flow affecting primarily the SE and SW flanks (figure 81).
Geologic Background. Klyuchevskoy is the highest and most active volcano on the Kamchatka Peninsula. Since its origin about 6,000 years ago, this symmetrical, basaltic stratovolcano has produced frequent moderate-volume explosive and effusive eruptions without major periods of inactivity. It rises above a saddle NE of Kamen volcano and lies SE of the broad Ushkovsky massif. More than 100 flank eruptions have occurred during approximately the past 3,000 years, with most lateral craters and cones occurring along radial fissures between the unconfined NE-to-SE flanks of the conical volcano between 500 and 3,600 m elevation. Eruptions recorded since the late 17th century have resulted in frequent changes to the morphology of the 700-m-wide summit crater. These eruptions over the past 400 years have originated primarily from the summit crater, but have also included numerous major explosive and effusive eruptions from flank craters.
Information Contacts: Kamchatka Volcanic Eruptions Response Team (KVERT), Far Eastern Branch, Russian Academy of Sciences, 9 Piip Blvd., Petropavlovsk-Kamchatsky, 683006, Russia (URL: http://www.kscnet.ru/ivs/kvert/); Kamchatka Volcanological Station, Kamchatka Branch of Geophysical Survey, (KB GS RAS), Klyuchi, Kamchatka Krai, Russia (URL: http://volkstat.ru/); MIROVA (Middle InfraRed Observation of Volcanic Activity), a collaborative project between the Universities of Turin and Florence (Italy) supported by the Centre for Volcanic Risk of the Italian Civil Protection Department (URL: http://www.mirovaweb.it/); Hawai'i Institute of Geophysics and Planetology (HIGP) - MODVOLC Thermal Alerts System, School of Ocean and Earth Science and Technology (SOEST), Univ. of Hawai'i, 2525 Correa Road, Honolulu, HI 96822, USA (URL: http://modis.higp.hawaii.edu/); Copernicus Browser, Copernicus Data Space Ecosystem, European Space Agency (URL: https://dataspace.copernicus.eu/browser/).
Agung (Indonesia) — January 2024 Cite this Report
Agung
Indonesia
8.343°S, 115.508°E; summit elev. 2997 m
All times are local (unless otherwise noted)
Three eruptive events reported in April, May, and December 2022
Mount Agung, located on the E end of the island of Bali, Indonesia, rises above the SE rim of the Batur caldera. The summit area extends 1.5 km E-W, with the highest point on the W and a steep-walled 800-m-wide crater on the E. Recorded eruptions date back to the early 19th century. A large and deadly explosive and effusive eruption occurred during 1963-64, which was characterized by voluminous ashfall, pyroclastic flows, and lahars that caused extensive damage and many fatalities. More recent activity was documented during November 2017-June 2019 that consisted of multiple explosions, significant ash plumes, lava flows at the summit crater, and incandescent ejecta. This report covers activity reported during April-May 2022 and December 2022 based on data from the Darwin Volcanic Ash Advisory Center (VAAC).
Activity during 2022 was relatively low and mainly consisted of a few ash plumes during April-May and December. An ash plume on 3 April rising to 3.7 km altitude (700 m above the summit) and drifting N was reported in a Darwin VAAC notice based on a ground report, with ash seen in HIMAWARI-8 visible imagery. Another ash plume was reported at 1120 on 27 May that rose to 5.5 km altitude (2.5 m above the summit); the plume was not visible in satellite or webcam images due to weather clouds. An eruption was reported based on seismic data at 0840 on 13 December, with an estimated plume altitude of 3.7 km; however, no ash was seen using satellite imagery in clear conditions before weather clouds obscured the summit.
Geologic Background. Symmetrical Agung stratovolcano, Bali's highest and most sacred mountain, towers over the eastern end of the island. The volcano, whose name means "Paramount," rises above the SE rim of the Batur caldera, and the northern and southern flanks extend to the coast. The summit area extends 1.5 km E-W, with the high point on the W and a steep-walled 800-m-wide crater on the E. The Pawon cone is located low on the SE flank. Only a few eruptions dating back to the early 19th century have been recorded in historical time. The 1963-64 eruption, one of the largest in the 20th century, produced voluminous ashfall along with devastating pyroclastic flows and lahars that caused extensive damage and many fatalities.
Information Contacts: Darwin Volcanic Ash Advisory Centre (VAAC), Bureau of Meteorology, Northern Territory Regional Office, PO Box 40050, Casuarina, NT 0811, Australia (URL: http://www.bom.gov.au/info/vaac/).
Saunders (United Kingdom) — February 2024 Cite this Report
Saunders
United Kingdom
57.8°S, 26.483°W; summit elev. 843 m
All times are local (unless otherwise noted)
Persistent thermal anomalies from the summit crater lava lake during February 2023-January 2024
Saunders is one of eleven islands that comprise the South Sandwich Islands in the South Atlantic. The active Mount Michael volcano has been in almost continuous eruption since November 2014 (BGVN 48:02). Recent activity has resulted in intermittent thermal anomalies and gas-and-steam emissions (BGVN 47:03, 48:02). Visits are infrequent due to its remote location, and cloud cover often prevents satellite observations. Satellite thermal imagery and visual observation of incandescence during a research expedition in 2019 (BGVN 28:02 and 44:08) and a finding confirmed by a National Geographic Society research team that summited Michael in November 2022 reported the presence of a lava lake.
Although nearly constant cloud cover during February 2023 through January 2024 greatly limited satellite observations, thermal anomalies from the lava lake in the summit crater were detected on clear days, especially around 20-23 August 2023. Anomalies similar to previous years (eg. BGVN 48:02) were seen in both MIROVA (Middle InfraRed Observation of Volcanic Activity) data from MODIS instruments and in Sentinel 2 infrared imagery. The only notable sulfur dioxide plume detected near Saunders was on 25 September 2023, with the TROPOMI instrument aboard the Sentinel-5P satellite.
Geologic Background. Saunders Island consists of a large central volcanic edifice intersected by two seamount chains, as shown by bathymetric mapping (Leat et al., 2013). The young Mount Michael stratovolcano dominates the glacier-covered island, while two submarine plateaus, Harpers Bank and Saunders Bank, extend north. The symmetrical Michael has a 500-m-wide summit crater and a remnant of a somma rim to the SE. Tephra layers visible in ice cliffs surrounding the island are evidence of recent eruptions. Ash clouds were reported from the summit crater in 1819, and an effusive eruption was inferred to have occurred from a N-flank fissure around the end of the 19th century and beginning of the 20th century. A low ice-free lava platform, Blackstone Plain, is located on the north coast, surrounding a group of former sea stacks. A cluster of cones on the SE flank, the Ashen Hills, appear to have been modified since 1820 (LeMasurier and Thomson, 1990). Analysis of satellite imagery available since 1989 (Gray et al., 2019; MODVOLC) suggests frequent eruptive activity (when weather conditions allow), volcanic clouds, steam plumes, and thermal anomalies indicative of a persistent, or at least frequently active, lava lake in the summit crater. Due to this observational bias, there has been a presumption when defining eruptive periods that activity has been ongoing unless there is no evidence for at least 10 months.
Information Contacts: MIROVA (Middle InfraRed Observation of Volcanic Activity), a collaborative project between the Universities of Turin and Florence (Italy) supported by the Centre for Volcanic Risk of the Italian Civil Protection Department (URL: http://www.mirovaweb.it/); NASA Global Sulfur Dioxide Monitoring Page, Atmospheric Chemistry and Dynamics Laboratory, NASA Goddard Space Flight Center (NASA/GSFC), 8800 Greenbelt Road, Goddard MD 20771, USA (URL: https://so2.gsfc.nasa.gov/); Copernicus Browser (URL: https://dataspace.copernicus.eu/browser).
Tengger Caldera (Indonesia) — February 2024 Cite this Report
Tengger Caldera
Indonesia
7.942°S, 112.95°E; summit elev. 2329 m
All times are local (unless otherwise noted)
Minor ash emission in December 2023; persistent weak thermal anomaly in the Bromo crater
Tengger Caldera, located at the N end of a volcanic massif in Indonesia’s East Java, consists of five overlapping stratovolcanoes. The youngest and only active cone in the 16-km-wide caldera is Bromo, which typically produces gas-and-steam plumes, occasional ash plumes and explosions, and weak thermal signals (BGVN 44:05, 47:01). This report covers activity during January 2022-December 2023, consisting of mostly white gas-and-steam emissions and persistent weak thermal anomalies. Information was provided by the Pusat Vulkanologi dan Mitigasi Bencana Geologi (PVMBG, also known as Indonesian Center for Volcanology and Geological Hazard Mitigation, CVGHM) and satellite imagery. The Alert Level remained at 2 (on a scale of 1-4), and visitors were warned to stay at least 1 km from the crater.
Activity was generally low during the reporting period, similar to that in 2021. According to almost daily images from MAGMA Indonesia (a platform developed by PVMBG), white emissions and plumes rose from 50 to 900 m above the main crater during this period (figure 24). During several days in March and June 2022, white plumes reached heights of 1-1.2 km above the crater.
After an increase in activity at 2114 on 3 February 2023, a PVMBG team that was sent to observe white emissions rising as high as 300 m during 9-12 February and heard rumbling noises. A sulfur dioxide odor was also strong near the crater and measurements indicated that levels were above the healthy (non-hazardous) threshold of 5 parts per million; differential optical absorption spectroscopy (DOAS) measurements indicated an average flux of 190 metric tons per day on 11 February. Incandescence originating from a large fumarole in the NNW part of the crater was visible at night. The team observed that vegetation on the E caldera wall was yellow and withered. The seismic network recorded continuous tremor and deep and shallow volcanic earthquakes.
According to a PVMBG press release, activity increased on 13 December 2023 with white, gray, and brown emissions rising as high as 900 m above Bromo’s crater rim and drifting in multiple directions (figure 25). The report noted that tremor was continuous and was accompanied in December by three volcanic earthquakes. Deformation data indicated inflation in December. There was no observable difference in the persistent thermal anomaly in the crater between 11 and 16 December 2023.
All clear views of the Bromo crater throughout this time, using Sentinel-2 infrared satellite images, showed a weak persistent thermal anomaly; none of the anomalies were strong enough to cause MODVOLC Thermal Alerts. A fire in the SE part of the caldera in early September 2023 resulted in a brief period of strong thermal anomalies.
Geologic Background. The 16-km-wide Tengger caldera is located at the northern end of a volcanic massif extending from Semeru volcano. The massive volcanic complex dates back to about 820,000 years ago and consists of five overlapping stratovolcanoes, each truncated by a caldera. Lava domes, pyroclastic cones, and a maar occupy the flanks of the massif. The Ngadisari caldera at the NE end of the complex formed about 150,000 years ago and is now drained through the Sapikerep valley. The most recent of the calderas is the 9 x 10 km wide Sandsea caldera at the SW end of the complex, which formed incrementally during the late Pleistocene and early Holocene. An overlapping cluster of post-caldera cones was constructed on the floor of the Sandsea caldera within the past several thousand years. The youngest of these is Bromo, one of Java's most active and most frequently visited volcanoes.
Information Contacts: Pusat Vulkanologi dan Mitigasi Bencana Geologi (PVMBG, also known as Indonesian Center for Volcanology and Geological Hazard Mitigation, CVGHM), Jalan Diponegoro 57, Bandung 40122, Indonesia (URL: http://www.vsi.esdm.go.id/); MAGMA Indonesia, Kementerian Energi dan Sumber Daya Mineral (URL: https://magma.esdm.go.id/v1); Copernicus Browser, Copernicus Data Space Ecosystem, European Space Agency (URL: https://dataspace.copernicus.eu/browser/); Hawai'i Institute of Geophysics and Planetology (HIGP) - MODVOLC Thermal Alerts System, School of Ocean and Earth Science and Technology (SOEST), Univ. of Hawai'i, 2525 Correa Road, Honolulu, HI 96822, USA (URL: http://modis.higp.hawaii.edu/).
Shishaldin (United States) — December 2023 Cite this Report
Shishaldin
United States
54.756°N, 163.97°W; summit elev. 2857 m
All times are local (unless otherwise noted)
New eruption with significant Strombolian explosions, ash plumes, and ashfall
Shishaldin is located on the eastern half of Unimak Island, one of the Aleutian Islands. Frequent explosive activity, primarily consisting of Strombolian ash eruptions from the small summit crater, but sometimes producing lava flows, has been recorded since the 18th century. The previous eruption ended in May 2020 and was characterized by intermittent thermal activity, increased seismicity and surface temperatures, ash plumes, and ash deposits (BGVN 45:06). This report covers a new eruption during July through November 2023, which consisted of significant explosions, ash plumes, ashfall, and lava fountaining. Information comes from daily, weekly, and special reports from the Alaska Volcano Observatory (AVO) and various satellite data. AVO monitors the volcano using local seismic and infrasound sensors, satellite data, web cameras, and remote infrasound and lightning networks.
AVO reported that intermittent tremor and low-frequency earthquakes had gradually become more regular and consistent during 10-13 July. Strongly elevated surface temperatures at the summit were identified in satellite images during 10-13 July. On 11 July AVO raised the Aviation Color Code (ACC) to Yellow (the second color on a four-color scale) and Volcano Alert Level (VAL) to Advisory (the second level on a four-level scale) at 1439. Later in the day on 11 July summit crater incandescence was observed in webcam images. Observations of the summit suggested that lava was likely present at the crater, which prompted AVO to raise the ACC to Orange (the second highest color on a four-color scale) and the VAL to Watch (the second highest level on a four-level scale). The US Coast Guard conducted an overflight on 12 July and confirmed that lava was erupting from the summit. That same day, sulfur dioxide emissions were detected in satellite images.
A significant explosion began at 0109 on 14 July that produced an ash plume that rose to 9-12 km altitude and drifted S over the Pacific Ocean (figure 43). Webcam images and photos taken around 0700 from a ship SW off Unimak Island showed small lahar deposits, which were the result of the interaction of hot pyroclastic material and snow and ice on the flanks. There was also ashfall on the SW and N flanks. A smaller explosion at 0710 generated an ash plume that rose to 4.5 km altitude. Webcam images and pilot reports showed continued low-level ash emissions during the morning, rising to less than 4.6 km altitude; those emissions included a small ash plume near the summit around 1030 resulting from a small explosion.
Seismic tremor amplitude began increasing at around 1700 on 15 July; strongly elevated surface temperatures were also reported. An ash plume rose to 4.6 km altitude and drifted SSE at 2100, based on a satellite image. A continuous ash plume during 2150 through 2330 rose to 5 km altitude and extended 125 km S. At 2357 AVO raised the ACC to Red (the highest color on a four-color scale) and the VAL to Warning (the highest level on a four-level scale), noting that seismicity remained elevated for more than six hours and explosion signals were frequently detected by regional infrasound (pressure sensor) networks. Explosions generated an ash plume that rose to 4.9 km altitude and drifted as far as 500 km SE. Activity throughout the night declined and by 0735 the ACC was lowered to Orange and the VAL to Watch. High-resolution satellite images taken on 16 July showed pyroclastic deposits extending as far as 3 km from the vent; these deposits generated lahars that extended further down the drainages on the flanks. Ash deposits were mainly observed on the SSE flank and extended to the shore of Unimak Island. During 16-17 July lava continued to erupt at the summit, which caused strongly elevated surface temperatures that were visible in satellite imagery.
Lava effusion increased at 0100 on 18 July, as noted in elevated surface temperatures identified in satellite data, increasing seismic tremor, and activity detected on regional infrasound arrays. A significant ash plume at 0700 rose to 7 km altitude and continued until 0830, eventually reaching 9.1 km altitude and drifting SSE (figure 44). As a result, the ACC was raised to Red and the VAL to Warning. By 0930 the main plume detached, but residual low-level ash emissions continued for several hours, remaining below 3 km altitude and drifting S. The eruption gradually declined and by 1208 the ACC was lowered to Orange and the VAL was lowered to Watch. High-resolution satellite images showed ash deposits on the SW flank and pyroclastic deposits on the N, E, and S flanks, extending as far as 3 km from the vent; lahars triggered by the eruption extended farther down the flanks (figure 45). Lava continued to erupt from the summit crater on 19 July.
Elevated surface temperatures were detected in satellite images during 19-25 July, despite occasional weather cloud cover, which was consistent with increased lava effusion. During 22-23 July satellite observations acquired after the eruption from 18 July showed pyroclastic flow and lahar deposits extending as far as 3 km down the N, NW, and NE flanks and as far as 1.5 km down the S and SE flanks. Ash deposits covered the SW and NE flanks. No lava flows were observed outside the crater. On 22 July a sulfur dioxide plume was detected in satellite data midday that had an estimated mass of 10 kt. In a special notice issued at 1653 on 22 July AVO noted that eruptive activity had intensified over the previous six hours, which was characterized by an hours-long steady increase in seismic tremor, intermittent infrasound signals consistent with small explosions, and an increase in surface temperatures that were visible in satellite data. Pilots first reported low-level ash plumes at around 1900. At 2320 an ash plume had risen to 9 km altitude based on additional pilot reports and satellite images. The ACC was increased to Red and the VAL to Warning at 2343. Satellite images indicated growth of a significantly higher ash plume that rose to 11 km altitude continued until 0030 and drifted NE. During the early morning hours of 23 July ash plumes had declined to 4.6 k altitude. Seismic tremor peaked at 0030 on 23 July and began to rapidly decline at 0109; active ash emissions were no longer visible in satellite data by 0130. The ACC was lowered to Orange and the VAL to Watch at 0418; bursts of increased seismicity were recorded throughout the morning, but seismicity generally remained at low levels. Elevated surface temperatures were visible in satellite data until about 0600. On 24 July pilots reported seeing vigorous gas-and-steam plumes rising to about 3 km altitude; the plumes may have contained minor amounts of ash.
During 24-25 July low level seismicity and volcanic tremor were detected at low levels following the previous explosion on 23 July. Strongly elevated surface temperatures were observed at the summit crater in satellite data. Around 2200 on 25 July seismicity began to increase, followed by infrasound signals of explosions after 0200 on 26 July. An ash plume rose to 3 km altitude at 0500 and drifted ENE, along with an associated sulfur dioxide plume that drifted NE and had an estimated mass of 22 kt. Diffuse ash emissions were visible in satellite data and rose to 6.1-7.6 km altitude and extended 125 km from the volcano starting around 1130. These ash events were preceded by about seven hours of seismic tremor, infrasound detections of explosions, and five hours of increased surface temperatures visible in satellite data. Activity began to decline around 1327, which included low-frequency earthquakes and decreased volcanic tremor, and infrasound data no longer detected significant explosions. Surface temperatures remained elevated through the end of the month.
Seismicity, volcanic tremor, and ash emissions remained at low levels during early August. Satellite images on 1 August showed that some slumping had occurred on the E crater wall due to the recent explosive activity. Elevated surface temperatures continued, which was consistent with cooling lava. On 2 August small explosive events were detected, consistent with low-level Strombolian activity. Some episodes of volcanic tremor were reported, which reflected low-level ash emissions. Those ash emissions rose to less than 3 km altitude and drifted as far as 92.6 km N. Pilots that were located N of the volcano observed an ash plume that rose to 2.7 km altitude. Seismicity began to increase in intensity around 0900 on 3 August. Seismicity continued to increase throughout the day and through the night with strongly elevated surface temperatures, which suggested that lava was active at the surface.
An ash cloud that rose to 7.6-7.9 km altitude and drifted 60-75 km NE was visible in a satellite image at 0520 on 4 August. Pilots saw and reported the plume at 0836 (figure 46). By 0900 the plume had risen to 9.1 km altitude and extended over 100 km NE. AVO raised the ACC to Red and the VAL to Warning as a result. Seismic tremor levels peaked at 1400 and then sharply declined at 1500 to slightly elevated levels; the plume was sustained during the period of high tremor and drifted N and NE. The ACC was lowered to Orange and the VAL to Watch at 2055. During 5-14 August seismicity remained low and surface temperatures were elevated based on satellite data due to cooling lava. On 9 August a small lava flow was observed that extended from the crater rim to the upper NE flank. It had advanced to 55 m in length and appeared in satellite imagery on 11 August. Occasional gas-and-steam plumes were noted in webcam images. At 1827 AVO noted that seismic tremor had steadily increased during the afternoon and erupting lava was visible at the summit in satellite images.
Strong explosion signals were detected at 0200 on 15 August. An ash cloud that was visible in satellite data extended 100 km NE and may have risen as high as 11 km altitude around 0240. By 0335 satellite images showed the ash cloud rising to 7.6 km altitude and drifting NE. Significant seismicity and explosions were detected by the local AVO seismic and infrasound networks, and volcanic lightning was detected by the World Wide Lightning Location Network (WWLLN). A sulfur dioxide plume associated with the eruption drifted over the S Bering Sea and parts of Alaska and western Canada. Seismicity was significantly elevated during the eruption but had declined by 1322. A pilot reported that ash emissions continued, rising as high as 4.9 km altitude. Elevated surface temperatures detected in satellite data were caused by hot, eruptive material (pyroclastic debris and lava) that accumulated around the summit. Eruptive activity declined by 16 August and the associated sulfur dioxide plume had mostly dissipated; remnants continued to be identified in satellite images at least through 18 August. Surface temperatures remained elevated based on satellite images, indicating hot material on the upper parts of the volcano. Small explosions were detected in infrasound data on the morning of 19 August and were consistent with pilot reports of small, short-lived ash plumes that rose to about 4.3 km altitude. Low-level explosive activity was reported during 20-24 August, according to seismic and infrasound data, and weather clouds sometimes prevented views. Elevated surface temperatures were observed in satellite images, which indicated continued hot material on the upper parts of the volcano.
Seismic tremor began to increase at around 0300 on 25 August and was followed by elevated surface temperatures identified in satellite images, consistent with erupting lava. Small explosions were recorded in infrasound data. The ACC was raised to Red and the VAL to Warning at 1204 after a pilot reported an ash plume that rose to 9.1 km altitude. Seismicity peaked at 1630 and began to rapidly decline at around 1730. Ash plumes rose as high as 10 km altitude and drifted as far as 400 km NE. By 2020 the ash plumes had declined to 6.4 km altitude and continued to drift NE. Ash emissions were visible in satellite data until 0000 on 26 August and seismicity was at low levels. AVO lowered the ACC to Orange and the VAL to Watch at 0030. Minor explosive activity within the summit crater was detected during 26-28 August and strongly elevated surface temperatures were still visible in satellite imagery through the rest of the month. An AVO field crew working on Unimak Island observed a mass flow that descended the upper flanks beginning around 1720 on 27 August. The flow produced a short-lived ash cloud that rose to 4.5 km altitude and rapidly dissipated. The mass flow was likely caused by the collapse of spatter that accumulated on the summit crater rim.
Similar variable explosive activity was reported in September, although weather observations sometimes prevented observations. A moderate resolution satellite image from the afternoon of 1 September showed gas-and-steam emissions filling the summit crater and obscuring views of the vent. In addition, hot deposits from the previous 25-26 August explosive event were visible on the NE flank near the summit, based on a 1 September satellite image. On 2 and 4 September seismic and infrasound data showed signals of small, repetitive explosions. Variable gas-and-steam emissions from the summit were visible but there was no evidence of ash. Possible summit crater incandescence was visible in nighttime webcam images during 3-4 September.
Seismicity began to gradually increase at around 0300 on 5 September and activity escalated at around 0830. A pilot reported an ash plume that rose to 7.6 km altitude at 0842 and continued to rise as high as possibly 9.7 km altitude and drifted SSE based on satellite images (figure 47). The ACC was raised to Red and the VAL to Warning at 0900. In addition to strong tremor and sustained explosions, the eruption produced volcanic lightning that was detected by the WWLLN. Around 1100 seismicity decreased and satellite data confirmed that the altitude of the ash emissions had declined to 7.6 km altitude. By 1200 the lower-altitude portion of the ash plume had drifted 125 km E. Significant ash emissions ended by 1330 based on webcam images. The ACC was lowered to Orange and the VAL to Watch at 1440. Satellite images showed extensive pyroclastic debris flows on most of the flanks that extended 1.2-3.3 km from the crater rim.
During 6-13 September elevated surface temperatures continued to be observed in satellite data, seismicity remained elevated with weak but steady tremor, and small, low-frequency earthquakes and small explosions were reported, except on 12 September. On 6 September a low-level ash plume rose to 1.5-1.8 km altitude and drifted SSE. Occasional small and diffuse gas-and-steam emissions at the summit were visible in webcam images. Around 1800 on 13 September seismic tremor amplitudes began to increase, and small explosions were detected in seismic and infrasound data. Incandescent lava at the summit was seen in a webcam image taken at 0134 on 14 September during a period of elevated tremor. No ash emissions were reported during the period of elevated seismicity. Lava fountaining began around 0200, based on webcam images. Satellite-based radar observations showed that the lava fountaining activity led to the growth of a cone in the summit crater, which refilled most of the crater. By 0730 seismicity significantly declined and remained at low levels.
Seismic tremor began to increase around 0900 on 15 September and rapidly intensified. An explosive eruption began at around 1710, which prompted AVO to raise the ACC to Red and the VAL to Warning. Within about 30 minutes ash plumes drifted E below a weather cloud at 8.2 km altitude. The National Weather Service estimated that an ash-rich plume rose as high as 12.8 km altitude and produced volcanic lightning. The upper part of the ash plume detached from the vent around 1830 and drifted E, and was observed over the Gulf of Alaska. Around the same time, seismicity dramatically decreased. Trace ashfall was reported in the community of False Pass (38 km ENE) between 1800-2030 and also in King Cove and nearby marine waters. Activity declined at around 1830 although seismicity remained elevated, ash emissions, and ashfall continued until 2100. Lightning was again detected beginning around 1930, which suggested that ash emissions continued. Ongoing explosions were detected in infrasound data, at a lower level than during the most energetic phase of this event. Lightning was last detected at 2048. By 2124 the intensity of the eruption had decreased, and ash emissions were likely rising to less than 6.7 km altitude. Seismicity returned to pre-eruption levels. On 16 September the ACC was lowered to Orange and the VAL to Watch at 1244; the sulfur dioxide plume that was emitted from the previous eruption event was still visible over the northern Pacific Ocean. Elevated surface temperatures, gas-and-steam emissions from the vent, and new, small lahars were reported on the upper flanks based on satellite and webcam images. Minor deposits were reported on the flanks which were likely the result of collapse of previously accumulated lava near the summit crater.
Elevated seismicity with tremor, small earthquakes, and elevated surface temperatures were detected during 17-23 September. Minor gas-and-steam emissions were visible in webcam images. On 20 September small volcanic debris flows were reported on the upper flanks. On 21 September a small ash deposit was observed on the upper flanks extending to the NE based on webcam images. Seismic tremor increased significantly during 22-23 September. Regional infrasound sensors suggested that low-level eruptive activity was occurring within the summit crater by around 1800 on 23 September. Even though seismicity was at high levels, strongly elevated surface temperatures indicating lava at the surface were absent and no ash emissions were detected; weather clouds at 0.6-4.6 km altitude obscured views. At 0025 on 24 September AVO noted that seismicity continued at high levels and nearly continuous small infrasound signals began, likely from low-level eruptive activity. Strongly elevated surface temperatures were identified in satellite images by 0900 and persisted throughout the day; the higher temperatures along with infrasound and seismic data were consistent with lava erupting at the summit. Around 1700 similarly elevated surface temperatures were detected from the summit in satellite data, which suggested that more vigorous lava fountaining had started. Starting around 1800 low-level ash emissions rose to altitudes less than 4.6 km altitude and quickly dissipated.
Beginning at midnight on 25 September, a series of seismic signals consistent with volcanic flows were recorded on the N side of the volcano. A change in seismicity and infrasound signals occurred around 0535 and at 0540 a significant ash cloud formed and quickly reached 14 km altitude and drifted E along the Alaska Peninsula. The cloud generated at least 150 lightning strokes with thunder that could be heard by people in False Pass. Seismicity rapidly declined to near background levels around 0600. AVO increased the ACC to Red and the VAL to Warning at 0602. The ash cloud detached from the volcano at around 0700, rose to 11.6 km altitude, and drifted ESE. Trace to minor amounts of ashfall were reported by the communities of False Pass, King Cove, Cold Bay, and Sand Point around 0700. Ash emissions continued at lower altitudes of 6-7.6 km altitude at 0820. Small explosions at the vent area continued to be detected in infrasound data and likely represented low-level eruptive activity near the vent. Due to the significant decrease in seismicity and ash emissions the ACC was lowered to Orange and the VAL to Watch at 1234. Radar data showed significant collapses of the crater that occurred on 25 September. Satellite data also showed significant hot, degassing pyroclastic and lahar deposits on all flanks, including more extensive flows on the ENE and WSW sections below two new collapse scarps. Following the significant activity during 24-25 September, only low-level activity was observed. Seismicity decreased notably near the end of the strong activity on 25 September and continued to decrease through the end of the month, though tremor and small earthquakes were still reported. No explosive activity was detected in infrasound data through 2 October. Gas-and-steam emissions rose to 3.7 km altitude, as reported by pilots and seen in satellite images. Satellite data from 26 September showed that significant collapses had occurred at the summit crater and hot, steaming deposits from pyroclastic flows and lahars were present on all the flanks, particularly to the ENE and WSW. A small ash cloud was visible in webcam images on 27 September, likely from a collapse at the summit cone. High elevated surface temperatures were observed in satellite imagery during 27-28 September, which were likely the result of hot deposits on the flanks erupted on 25 September. Minor steaming at the summit crater and from an area on the upper flanks was visible in webcam images on 28 September.
During October, explosion events continued between periods of low activity. Seismicity significantly increased starting at around 2100 on 2 October; around the same time satellite images showed an increase in surface temperatures consistent with lava fountaining. Small, hot avalanches of rock and lava descended an unspecified flank. In addition, a distinct increase in infrasound, seismicity, and lightning detections was followed by an ash plume that rose to 12.2 km altitude and drifted S and E at 0520 on 3 October, based on satellite images. Nighttime webcam images showed incandescence due to lava fountaining at the summit and pyroclastic flows descending the NE flank. AVO reported that a notable explosive eruption started at 0547 and lasted until 0900 on 3 October, which prompted a rise in the ACC to Red and the VAL to Warning. Subsequent ash plumes rose to 6-7.6 km altitude by 0931. At 1036 the ACC was lowered back to Orange and the VAL to Watch since both seismic and infrasound data quieted substantially and were slightly above background levels. Gas-and-steam emissions were observed at the summit, based on webcam images. Trace amounts of ashfall were observed in Cold Bay. Resuspended ash was present at several kilometers altitude near the volcano. During the afternoon, low-level ash plumes were visible at the flanks, which appeared to be largely generated by rock avalanches off the summit crater following the explosive activity. These ash plumes rose to 3 km altitude and drifted W. Trace amounts of ashfall were reported by observers in Cold Bay and Unalaska and flights to these communities were disrupted by the ash cloud. Satellite images taken after the eruption showed evidence of pyroclastic flows and lahar deposits in drainages 2 km down the SW flank and about 3.2 km down the NE flank, and continued erosion of the crater rim. Small explosion craters at the end of the pyroclastic flows on the NE flank were noted for the first time, which may have resulted from gas-and-steam explosions when hot deposits interact with underlying ice.
During 4 October seismicity, including frequent small earthquakes, remained elevated, but was gradually declining. Ash plumes were produced for over eight hours until around 1400 that rose to below 3.7 km altitude. These ash plumes were primarily generated off the sides of the volcano where hot rock avalanches from the crater rim had entered drainages to the SW and NE. Two explosion craters were observed at the base of the NE deposits about 3.2 km from the crater rim. Webcam images showed the explosion craters were a source of persistent ash emissions; occasional collapse events also generated ash. Seismicity remained elevated with sulfur dioxide emissions that had a daily average of more than 1,000 tons per day, and frequent small earthquakes through the end of the month. Frequent elevated surface temperatures were identified in satellite images and gas-and-steam plumes were observed in webcam images, although weather conditions occasionally prevented clear views of the summit. Emissions were robust during 14-16 October and were likely generated by the interaction of hot material and snow and ice. During the afternoon of 21 October a strong gas-and-steam plume rose to 3-4.6 km altitude and extended 40 km WSW, based on satellite images and reports from pilots. On 31 October the ACC was lowered to Yellow and the VAL was lowered to Advisory.
Activity in November was characterized by elevated seismicity with ongoing seismic tremor and small, low-frequency earthquakes, elevated surface temperatures, and gas-and-steam emissions. There was an increase in seismic and infrasound tremor amplitudes starting at 1940 on 2 November. As a result, the ACC was again raised to Orange and the VAL was increased to Watch, although ash was not identified in satellite data. An ash cloud rose to 6.1 km altitude and drifted W according to satellite data at 2000. By 0831 on 3 November ash emissions were no longer visible in satellite images. On 6 and 9 November air pressure sensors detected signals consistent with small explosions. Small explosions were detected in infrasound data consistent with weak Strombolian activity on 19 and 21 November. Seismicity started to decrease on 21 November. On 25 November gas-and-steam emissions were emitted from the vent as well as from a scarp on the NE side of the volcano near the summit. A gas-and-steam plume extended about 50 km SSE and was observed in satellite and webcam images on 26 November. On 28 November small explosions were observed in seismic and local infrasound data and gas-and-steam emissions were visible from the summit and from the upper NE collapse scarp based on webcam images. Possible small explosions were observed in infrasound data on 30 November. Weakly elevated surface temperatures and a persistent gas-and-steam plume from the summit and collapse scarps on the upper flanks. A passing aircraft reported the gas-and-steam plume rose to 3-3.4 km altitude on 30 November, but no significant ash emissions were detected.
Satellite data. MODIS thermal anomaly data provided through MIROVA (Middle InfraRed Observation of Volcanic Activity) showed a strong pulse of thermal activity beginning in July 2023 that continued through November 2023 (figure 48). This strong activity was due to Strombolian explosions and lava fountaining events at the summit crater. According to data from MODVOLC thermal alerts, a total of 101 hotspots were detected near the summit crater in July (11-14, 16-19, 23-24 and 26), August (4, 25-26, and 29), September (5, 12, and 17), and October (3, 4, and 8). Infrared satellite data showed large lava flows descending primarily the northern and SE flanks during the reporting period (figure 49). Sulfur dioxide plumes often exceeded two Dobson Units (DUs) and drifted in different directions throughout the reporting period, based on satellite data from the TROPOMI instrument on the Sentinel-5P satellite (figure 50).
Geologic Background. The symmetrical glacier-covered Shishaldin in the Aleutian Islands is the westernmost of three large stratovolcanoes in the eastern half of Unimak Island. The Aleuts named the volcano Sisquk, meaning "mountain which points the way when I am lost." Constructed atop an older glacially dissected edifice, it is largely basaltic in composition. Remnants of an older edifice are exposed on the W and NE sides at 1,500-1,800 m elevation. There are over two dozen pyroclastic cones on its NW flank, which is covered by massive aa lava flows. Frequent explosive activity, primarily consisting of Strombolian ash eruptions from the small summit crater, but sometimes producing lava flows, has been recorded since the 18th century. A steam plume often rises from the summit crater.
Information Contacts: Alaska Volcano Observatory (AVO), a cooperative program of a) U.S. Geological Survey, 4200 University Drive, Anchorage, AK 99508-4667 USA (URL: https://avo.alaska.edu/), b) Geophysical Institute, University of Alaska, PO Box 757320, Fairbanks, AK 99775-7320, USA, and c) Alaska Division of Geological & Geophysical Surveys, 794 University Ave., Suite 200, Fairbanks, AK 99709, USA (URL: http://dggs.alaska.gov/); MIROVA (Middle InfraRed Observation of Volcanic Activity), a collaborative project between the Universities of Turin and Florence (Italy) supported by the Centre for Volcanic Risk of the Italian Civil Protection Department (URL: http://www.mirovaweb.it/); Hawai'i Institute of Geophysics and Planetology (HIGP) - MODVOLC Thermal Alerts System, School of Ocean and Earth Science and Technology (SOEST), Univ. of Hawai'i, 2525 Correa Road, Honolulu, HI 96822, USA (URL: http://modis.higp.hawaii.edu/); NASA Global Sulfur Dioxide Monitoring Page, Atmospheric Chemistry and Dynamics Laboratory, NASA Goddard Space Flight Center (NASA/GSFC), 8800 Greenbelt Road, Goddard, Maryland, USA (URL: https://so2.gsfc.nasa.gov/); Copernicus Browser, Copernicus Data Space Ecosystem, European Space Agency (URL: https://dataspace.copernicus.eu/browser/).
Ioto
Japan
24.751°N, 141.289°E; summit elev. 169 m
All times are local (unless otherwise noted)
New eruption with discolored water, ejecta, and floating pumice during October-December 2023
Ioto (Iwo-jima), located about 1,200 km S of Tokyo, lies within a 9-km-wide submarine caldera along the Izu-Bonin-Mariana volcanic arc. Previous eruptions date back to 1889 and have consisted of dominantly phreatic explosions, pumice deposits during 2001, and discolored water. A submarine eruption during July through December 2022 was characterized by discolored water, pumice deposits, and gas emissions (BGVN 48:01). This report covers a new eruption during October through December 2023, which consisted of explosions, black ejecta, discolored water, and floating pumice, based on information from the Japan Meteorological Association (JMA), the Japan Coast Guard (JCG), and satellite data.
JMA reported that an eruption had been occurring offshore of Okinahama on the SE side of the island since 21 October, which was characterized by volcanic tremor, according to the Japan Maritime Self-Defense Force (JMSDF) Iwo Jima Air Base (figure 22). According to an 18 October satellite image a plume of discolored water at the site of this new eruption extended NE (figure 23). During an overflight conducted on 30 October, a vent was identified about 1 km off the coast of Okinahama. Observers recorded explosions every few minutes that ejected dark material about 20 m above the ocean and as high as 150 m. Ejecta from the vent formed a black-colored island about 100 m in diameter, according to observations conducted from the air by the Earthquake Research Institute of the University of Tokyo in cooperation with the Mainichi newspaper (figure 24). Occasionally, large boulders measuring more than several meters in size were also ejected. Observations from the Advanced Land Observing Satellite Daichi-2 and Sentinel-2 satellite images also confirmed the formation of this island (figure 23). Brown discolored water and floating pumice were present surrounding the island.
The eruption continued during November. During an overflight on 3 November observers photographed the island and noted that material was ejected 169 m high, according to a news source. Explosions gradually became shorter, and, by the 3rd, they occurred every few seconds; dark and incandescent material were ejected about 800 m above the vent. On 4 November eruptions were accompanied by explosive sounds. Floating, brown-colored pumice was present in the water surrounding the island. There was a brief increase in the number of volcanic earthquakes during 8-14 November and 24-25 November. The eruption temporarily paused during 9-11 November and by 12 November eruptions resumed to the W of the island. On 10 November dark brown-to-dark yellow-green discolored water and a small amount of black floating material was observed (figure 25). A small eruption was reported on 18 November off the NE coast of the island, accompanied by white gas-and-steam plumes (figure 23). Another pause was recorded during 17-19 November, which then resumed on 20 November and continued erupting intermittently. According to a field survey conducted by the National Institute for Disaster Prevention Science and Technology on 19 November, a 30-m diameter crater was visible on the NE coast where landslides, hot water, and gray volcanic ash containing clay have occurred and been distributed previously. Erupted blocks about 10 cm in diameter were distributed about 90-120 m from the crater. JCG made observations during an overflight on 23 November and reported a phreatomagmatic eruption. Explosions at the main vent generated dark gas-and-ash plumes that rose to 200 m altitude and ejected large blocks that landed on the island and in the ocean (figure 26). Discolored water also surrounded the island. The size of the new island had grown to 450 m N-S x 200 m E-W by 23 November, according to JCG.
The eruption continued through 11 December, followed by a brief pause in activity, which then resumed on 31 December, according to JMA. Intermittent explosions produced 100-m-high black plumes at intervals of several minutes to 30 minutes during 1-10 December. Overflights were conducted on 4 and 15 December and reported that the water surrounding the new island was discolored to dark brown-to-dark yellow-green (figure 27). No floating material was reported during this time. In comparison to the observations made on 23 November, the new land had extended N and part of it had eroded away. In addition, analysis by the Geospatial Information Authority of Japan using SAR data from Daichi-2 also confirmed that the area of the new island continued to decrease between 4 and 15 December. Ejected material combined with wave erosion transformed the island into a “J” shape, 500-m-long and with the curved part about 200 m offshore of Ioto. The island was covered with brown ash and blocks, and the surrounding water was discolored to greenish-brown and contained an area of floating pumice. JCG reported from an overflight on 4 December that volcanic ash-like material found around the S vent on the NE part of the island was newly deposited since 10 November (figure 28). By 15 December the N part of the “J” shaped island had separated and migrated N, connecting to the Okinahama coast and the curved part of the “J” had eroded into two smaller islands (figure 27).
References. Ukawa, M., Fujita, E., Kobayashi, T., 2002, Recent volcanic activity of Iwo Jima and the 2001 eruption, Monthly Chikyu, Extra No. 39, 157-164.
Geologic Background. Ioto, in the Volcano Islands of Japan, lies within a 9-km-wide submarine caldera. The volcano is also known as Ogasawara-Iojima to distinguish it from several other "Sulfur Island" volcanoes in Japan. The triangular, low-elevation, 8-km-long island narrows toward its SW tip and has produced trachyandesitic and trachytic rocks that are more alkalic than those of other volcanoes in this arc. The island has undergone uplift for at least the past 700 years, accompanying resurgent doming of the caldera; a shoreline landed upon by Captain Cook's surveying crew in 1779 is now 40 m above sea level. The Motoyama plateau on the NE half of the island consists of submarine tuffs overlain by coral deposits and forms the island's high point. Many fumaroles are oriented along a NE-SW zone cutting through Motoyama. Numerous recorded phreatic eruptions, many from vents on the W and NW sides of the island, have accompanied the uplift.
Information Contacts: Japan Meteorological Agency (JMA), 1-3-4 Otemachi, Chiyoda-ku, Tokyo 100-8122, Japan (URL: http://www.jma.go.jp/jma/indexe.html); Japan Coast Guard (JCG) Volcano Database, Hydrographic and Oceanographic Department, 3-1-1, Kasumigaseki, Chiyoda-ku, Tokyo 100-8932, Japan (URL: https://www1.kaiho.mlit.go.jp/GIJUTSUKOKUSAI/kaiikiDB/kaiyo22-2.htm); Copernicus Browser, Copernicus Data Space Ecosystem, European Space Agency (URL: https://dataspace.copernicus.eu/browser/); Asahi, 5-3-2, Tsukiji, Chuo Ward, Tokyo, 104-8011, Japan (URL: https://www.asahi.com/ajw/articles/15048458).
Search Bulletin Archive by Publication Date
Select a month and year from the drop-downs and click "Show Issue" to have that issue displayed in this tab.
The default month and year is the latest issue available.
Bulletin of the Global Volcanism Network - Volume 34, Number 04 (April 2009)
Apoyeque (Nicaragua)
Repose continues, punctuated by occasional seismic swarms in 2001 and 2007
Asamayama (Japan)
The forecasted, 2 February 2009 eruption and waning eruptions into May
Colima (Mexico)
Persisting lava dome growth into at least mid-2009
Dieng Volcanic Complex (Indonesia)
Landslide triggers sudden, small, phreatic eruption on 15 January 2009
Fernandina (Ecuador)
Lava flows from a 10-28 April fissure eruption reach the sea
Lewotobi (Indonesia)
Drops in steaming and seismicity during March 2009
Obituary Notices (Unknown)
Death of Tom Simkin, founder and Director of the Global Volcanism Program until 1995
Redoubt (United States)
First eruption since 1989-1990; over19 explosions; growth of new lava dome
Apoyeque (Nicaragua) — April 2009 Cite this Report
Apoyeque
Nicaragua
12.242°N, 86.342°W; summit elev. 518 m
All times are local (unless otherwise noted)
Repose continues, punctuated by occasional seismic swarms in 2001 and 2007
Seismic swarms took place during 2001 and 2007. The last overview of Apoyeque (BGVN14:04) reported slight variations of the crater lake's surface temperature of between 25 and 30°C (which began to rise in 1988). Faint sulfurous odors were noted as well as some active fumaroles.
Swarms were reported by INETER (Instituto Nicarag?ense de Estudios Territoriales) in a 23 September 2007 report. The first swarm, during January 2001, included earthquakes up to MR 5.2. This swarm was felt strongly in the cities of Managua (~ 8 km away) and in Ciudad Sandino. No damage was reported. The second swarm began on 21 September 2007, becoming more intense on 23 September, by which time there had been 10 earthquakes up to MR 2.8. Scores of smaller earthquakes were also detected at a seismometer in Apoyeque's crater.
INETER stated that, based on past cases at this volcano, such swarms can continue for days and might reach M 4-M 5 (as they had in January 2001). The typical pattern is for a series of smaller volcanic earthquakes to precede one or more larger ones. This is in contrast to earthquakes associated with the subduction of the Cocos plate, where larger earthquakes often precede substantially smaller ones.
Apoyeque remains in repose without documented historical eruptions. Tephrochronology (the study of ash layers, in this case including radiometric dating) indicates the most recent eruption here was large and took place about 50 BC (? 100 years) depositing the Chiltepe tephra. That tephra deposit has an estimated 4 km3 on-land volume and a total volume (including the offshore component) of about 18 km3(Kutterolf and others, 2008).
Reference. Kutterolf, S., Freundt, A., and Perez, W., 2008, Pacific offshore record of Plinian arc volcanism in Central America: 2. Tephra Volumes and erupted masses: Geochemistry, Geophysics, Geosystems (G3), v. 8, Q02S02, doi: 10.1029/2007GC001791.
Geologic Background. The Apoyeque volcanic complex occupies the broad Chiltepe Peninsula, which extends into south-central Lake Managua. The peninsula is part of the Chiltepe pyroclastic shield volcano, one of three large ignimbrite shields on the Nicaraguan volcanic front. A 2.8-km wide, 400-m-deep, lake-filled caldera whose floor lies near sea level truncates the low Apoyeque edifice, which rises only about 500 m above the lake shore. The caldera was the source of a thick deposit of dacitic pumice that covers the surrounding area. The 2.5 x 3 km lake-filled Xiloá (Jiloá) maar is located immediately SE of Apoyeque. The Talpetatl lava dome was constructed between Laguna Xiloá and Lake Managua. Pumiceous pyroclastic flows from Laguna Xiloá were erupted about 6,100 years ago and overlie deposits of comparable age from the Masaya Plinian eruption.
Information Contacts: Instituto Nicaraguense de Estudios Territoriales (INETER), Apartado Postal 2110, Managua, Nicaragua.
Asamayama
Japan
36.406°N, 138.523°E; summit elev. 2568 m
All times are local (unless otherwise noted)
The forecasted, 2 February 2009 eruption and waning eruptions into May
As we previously reported (BGVN33:12), Asama erupted in January and February 2009. As reported there, scientists noted that sulfur-dioxide fluxes suddenly rose during late 2008 from more than two years of very low values, that yellow sublimates subsequently appeared, and that thin ash fell on the rim of the summit crater by 21 January. Our statement that high seismicity began 1 January 2009 is clarified in this report, where we present long-baseline seismic data. A larger eruption followed on 2 February, reaching 2 km above the summit and dropping minor ash on parts of Tokyo (~140 km SE of the vent) and beyond.
This report begins with a brief mention of a satellite image from the 2004 eruption, and then continues with descriptions of the 2009 behavior chronicled in a previous report (BGVN33:12). Much of this information has come from the Japan Meteorological Agency (JMA). Translations of those detailed and informative reports from the original Japanese were provided by Yukio Hayakawa.
Satellite image of 2004 activity. An annotated satellite image not included in Bulletin reports on the 2004 eruption (BGVN29:08, 29:10; 30:01; 30:02) has come to light (figure 35). On 16 September 2004, a plume at ~3,700 m altitude (indicated on the figure in aviation parlance as "FL120," flight level 12,000 feet) traveled due S leaving a thin ash deposit.
Multi-year eruptions and seismicity.Seismicity recorded at Asama between June 2002 and February 2009 (figure 36) included a number of different types of signals (figure 37). Eruptions are indicated by arrows of variable length corresponding to very small to medium eruptions as they occurred during 2003, 2004, 2008, and 2009.
As brief background, seismic signals at volcanoes are often described using some common terms (Minakami, 1960; McNutt, 2000). Tremor consists of semi-continuous signal with durations of minutes to days or longer. Tremor's dominant frequencies are 1-5 Hz (often 2-3 Hz). Many investigators have concluded that tremor is akin to a series of low-frequency earthquakes occurring every few seconds. Explosion earthquakes accompany explosions and feature compressional, first P-wave arrivals. Some of the explosion energy enters the air where it travels much more slowly than through rocks, propagating as an acoustic wave that may be recorded by microphones or barographs. This air wave also couples back into the ground, allowing detection by a seismometer.
B-type earthquakes sometimes lack clear S waves, generally feature low frequency signals, but may include high-frequency signals as well. The types BL and BH respectively stand for low- and high-frequency (but the two types may also grade from one to the other).
Type A earthquakes are also called tectonic and volcano-tectonic. Their signals display clear P- and S-wave arrivals and are often thought to represent processes such as slip on a fault or breaking rock associated with intrusions.
Prior to the 2009 eruptions, tremor had been somewhat elevated at times during the latter half of 2007 and more consistently during the latter half of 2008. BL-Explosion earthquakes became scarce during late 2006, and from then until about mid-2008 they fluctuated to occasionally somewhat higher daily numbers. After mid-2008, these BL-Explosion earthquakes grew dramatically in number, peaking with the 2009 eruption. This pattern was similar to seismicity associated with the September 2004 eruption.
BH earthquakes generally stood at background after mid-2006 until just before the 2008 eruption. In the middle to latter months of 2008 they again grew, often remaining elevated until the start of 2009, when they increased still further.
Type-A earthquakes remained consistently small in number through 2007 onwards until their numbers peaked suddenly 2 February 2009. They were, however, present on more days approaching the 2009 eruptions.
The 2004, 2008, and 2009 eruptions included conspicuous increases in tremor, BL-Explosion earthquakes, and to some extent, BH earthquakes. Least diagnostic were type-A earthquakes, though they were present on more days with approach to the point of the 2009 eruption.
The predicted 2 February 2009 eruption.Sufficient precursory data were available for JMA to confidently announce the elevation of the hazard status to Level 3 (on a scale where the highest level is 5) at 1300 on 1 February 2009. In discussing the situation at a meeting around that time, a JMA officer said that an eruption similar to that of 2004 would take place within 2 days. Accordingly, authorities closed a vulnerable, 7-km stretch of Oni-oshi highway. It reopened the day after the 2 February eruption.
The volcano is heavily instrumented, and those maintained by JMA's Asamayama observatory are shown on figure 38. Precursory data used as a basis for the forecast included seismicity (figure 36), sulfur-dioxide fluxes (BGVN33:12), and tilt (e.g., figure 39).
In accord with JMA's precursory warnings, representatives of Komoro City decided to close the mountain hut 2 km W of the summit. The afternoon of 1 February, the resident and official observer there, Keisuke Kanda, readied the hut for closure. After that, he went to bed, planning to climb down the mountain the next morning. At the time of the eruption (0151) he neither felt nor heard any disturbance. At 0200 (about 9 minutes after the eruption began), he was awakened by his ringing cell phone.
The eruption that started at 0151 on 2 February generated a plume that rose to 2,000 m above the summit (to an altitude of ~ 4.6 km). Volcanic bombs were thrown to the N as far as 1 km. An air wave observed at Oiwake, 8 km SSE, had a pressure of 7 Pa. For comparison, the eruption of 1 September 2004 had a recorded air wave of 205 Pa. Cities recording ashfall included Karuizawa, Kamogawa, Tomioka, Chichibu, and in the broader Tokyo metropolitan area, Kawasaki, and Yokohama.
Aviation sources suggested that the 2 February eruption only lasted until 0800 (that is equivalent to 1 February during 1651-2300 UTC). Charles Holliday noted airport weather data. Downtown, at Tokyo International Airport (RJTT), meteorologists reported 'Volcanic Ash Cloud' during 0530-0636 on 2 February. Meteorologists at Narita International airport (RJAA) had one report interval where they noted volcanic cloud, at 1300 local time (~ 3 km altitude with ~ 9 km visibility), but this cloud did not cause local ashfall.
A US Air Force video clip noted that on 2 February ash fell on Yokota Air Base, 105 km SE of Asama. The video said that Yokota received 3-5 mm of ashfall but the features in the field of view appeared to show considerably less, perhaps suggesting some areas of thickened ash deposition. Holliday noted that ash fell at the Base hours after the eruption; although he was unable to establish the exact start time there, ashfall ended at 0800.
During the eruption, Masakatsu Umeda, working in a French restaurant 7 km N of the summit, felt small but continuous shaking and saw a red plume rising from the summit crater. He heard a far softer sound than he did on 1 September 2004 but then he was 4 km NE of the summit at Rokurigahara parking lot.
An 18 February JMA report presented a sequence of night photos capturing incandescent explosions on 2 February at 0200 and for the next 15 minutes (figure 40). These photos portray the eruptive stage often termed the jet- or gas-thrust phase (see diagrams and models on a website by Camp, 2009).
Waning eruptions during next few months.A series of small eruptions followed, including those on 9, 10, 11, 16, and 17 February, 15 and 23 March, and at least as late as 2 May. The hazard status, initially raised to 3 on 1 February, dropped to 2 on 7 April.
JMA said that on 9 February at 0746, a plume rose 400 m above the summit; at 1700, a plume was 1,000 m above the summit. A trace of ashfall blew NE, to Kitakaruizawa. As of 0200 on 10 February, the plume height was 600 m above the summit; at 0500, it was 1400 m. As of 2300 on 10 February the plume height was 300 m above the summit. Takayuki Nagai, a teacher at a middle school 12 km N of Asama's summit; said that few students arriving there appeared to recognize that the eruption continued. One had seen a gray ash plume.
As of 2100 on 11 February, the eruption apparently continued, but JMA could not see plumes, probably because of bad weather. The eruption determination was seemingly based on elevated seismicity. The Tokyo Volcanic Ash Advisory Center (VAAC) indicated plumes in the range of 3-3.7 km altitude during 11-12 and 16-17 February. JMA noted an eruption during 1310-1400 on 16 February. A colored plume rose to 400 m above the summit and moved E.
Asama again erupted at 1833 on 17 February. A plume bearing ash rose to 400 m above the summit, and moved to E. Web cameras disclosed crater glow.
The Tokyo VAAC noted a plume to 3 km altitude on 15 March. JMA reported incandescence from the crater on 23 March, and an observer 50 km E at Maebashi saw strong steam plumes on 30 March. Although authorities had lowered the alert level, similar eruptions continued (with plumes to 3.4 km altitude) as late as 2 May. This was the last eruption clearly noted in available reports through the end of May.
2 February eruption's minimum mass.Several detailed maps of the SE-trending, elongate (cigar-shaped) 2009 deposits were compiled in the days after the 2009 eruptions. Such detailed maps (figure 41) enabled scientists to estimate the mass of material that fell on Honshu Island.
For the map in the proximal region (inset), traverses were made across portions of the 2009 tephra deposits in early February at approximate distances of 5, 10, and 13 km from the crater. Besides showing points with measurable ash (solid circles), the maps disclose considerable points where the ash was absent or negligible (open circles). The investigators took many measurements at ~ 5 km near the axis of the deposit. Such deposits are often ephemeral, owing to post-depositional processes such as wind and particularly rainfall, which frequently strip the tephra away before detailed measurements.
For the map including the medial to more distal regions (figure 41), trace amounts of Asama tephra extended beyond Tokyo's large bay (Tokyo-wan) to the coastline of the Chiba Peninsula, ~ 220 km SE. Additional fine ash clearly blew beyond the coastline, settling over the adjacent Pacific Ocean. The GSJ estimated the erupted mass falling on Honshu Island at 20,000-30,000 metric tons (20-30 Gg).
Figure 42 illustrates the near-source deposit's mass assessment (for figure 41 inset). This yielded an erupted-mass estimate of about 2.0-2.4 metric tons. Various other maps and solutions for contours exist.
Figure 43 presents basic grain-size information on the deposit. The photo shows some of the larger grains found at distance from the vent. The grains consisted largely of pre-existing rocks. Investigators found very few examples of juvenile glass grains (less than 1%). These juvenile grains were rhyolitic to dacitic.
Few thin ash blankets have been assessed in more detail than the one shown here. The relevance of these efforts include understanding the character and size of the eruption and calibrating ashfall with satellite observations. Volcanic Ash Advisory Centers (VAACs) regularly model eruptions such as this in order to forecast the transport of ash in the atmosphere. This is based in part on the height of ash plumes and on meteorological observations such as wind-velocity profiles. One goal of those ash transport models is to steer aircraft clear of ash in the atmosphere. Volcanic ash plumes can reach higher altitudes than commercial aircraft can fly, and encounters with ash may lead to severe engine damage.
Reference.Camp, V., 2009, Eruption model (online): Department of Geological Sciences, San Diego State University (URL: http://www.geology.sdsu.edu/how_volcanoes_work/).
Minakami, T., 1960. Fundamental research for predicting volcanic eruptions (part 1); Earthquakes and crustal deformations originating from volcanic activities: Bull. Earthquake Res. Ins., v. 38, p. 497?544.
McNutt, S., 2000, Volcanic seismicity, in Encyclopedia of Volcanoes, Sigurdsson, H., Houghton, B., McNutt, S., Rymer, H, and Stix, J. (eds.), Academic Press, San Diego, p. 1015-1034
Geologic Background. Asamayama, Honshu's most active volcano, overlooks the resort town of Karuizawa, 140 km NW of Tokyo. The volcano is located at the junction of the Izu-Marianas and NE Japan volcanic arcs. The modern Maekake cone forms the summit and is situated east of the remnant of an older andesitic volcano, Kurofuyama, which was destroyed by a late-Pleistocene landslide about 20,000 years before present (BP). Growth of a dacitic shield volcano was accompanied by pumiceous pyroclastic flows, the largest of which occurred about 14,000-11,000 BP, and by growth of the Ko-Asamayama lava dome on the east flank. Maekake, capped by the Kamayama pyroclastic cone that forms the present summit, is probably only a few thousand years old and has observed activity dating back at least to the 11th century CE. Maekake has had several major Plinian eruptions, the last two of which occurred in 1108 (Asamayama's largest Holocene eruption) and 1783 CE.
Information Contacts: Japan Meteorological Agency (JMA), Otemachi, 1-3-4, Chiyoda-ku Tokyo 100-8122, Japan (URL: http://www.jma.go.jp/); Volcano Research Center, Earthquake Research Institute (ERI), University of Tokyo, Yayoi 1-1-1, Bunkyo-ku, Tokyo 113, Japan (URL: http://www.eri.u-tokyo.ac.jp/topics/ASAMA2004/index-e.html); Charles Holliday, (US) Air Force Weather Agency (AFWA); Yukio Hayakawa, Gunma University, Faculty of Education, Aramaki 4-2, Maebashi 371-8510, Japan; Ministry of Land, Infrastructure, Transport and Tourism (URL: http://www.mlit.go.jp/tonesui/).
Colima
Mexico
19.514°N, 103.62°W; summit elev. 3850 m
All times are local (unless otherwise noted)
Persisting lava dome growth into at least mid-2009
Our most recent reports on Colima (BGVN 33:04 and 33:10) discussed new dome growth between February 2007 and November 2008. This report provides an update on the dome growth through May 2009.
According to a report from the Colima Observatory, the slow growth of Colima's new lava dome continued (figure 90). By March 2009, the volume was about 1,400,000 m3, roughly 80% of the total crater volume. Since the beginning of October 2007 the mean effusion rate has been ~ 0.03 m3/s. During the last two years, dome growth has been accompanied by 5-10 small explosions daily without significant variations (figure 91).
To improve monitoring of the dome growth and any lava flows, pyroclastic flows, and explosive columns, the video station Nevado has been upgraded with two additional video cameras. These cameras allow digital images of the crater and the whole volcanic edifice of Colima to be taken every 4 seconds (figure 92). The station is situated at ~ 4,000 m elevation, below the summit of Nevado de Colima and 5.8 km N of the Volcán de Colima crater.
Table 18 contains a condensation of reports on Colima ash plumes and selected eruptions during 4 January 2006 though 25 May 2009.
Table 18. Ash plumes from Colima seen between 4 January 2006 and May 2009. The plume altitudes (height above mean sea level) are approximate and indicate the highest plume during the specified period. Incandescent ejections are meters above the summit. Data from the Washington Volcanic Ash Advisory Center, Universidad de Colima, Gobierno del Estado de Colima, and news articles.
| Date |
Max plume altitude (km) |
Plume drift direction |
Remarks |
| 04 Jan-09 Jan 2006 |
6.7 |
NE, SW |
-- |
| 11 Jan-15 Jan 2006 |
9.1 |
ENE |
-- |
| 04 Feb-07 Feb 2006 |
8.5 |
-- |
-- |
| 22 Feb-26 Feb 2006 |
9.1 |
NE |
-- |
| 26 Mar-27 Mar 2006 |
6.1 |
-- |
-- |
| 01 Apr-03 Apr 2006 |
7.9 |
-- |
-- |
| 08 Jul 2006 |
-- |
-- |
Ash emission to unknown height. |
| 29 Oct 2006 |
6.1 |
S |
-- |
| 06 Nov 2006 |
6.1 |
NE |
-- |
| 19 Nov 2006 |
5.5 |
W, SW |
-- |
| 30 Nov 2006 |
6.7 |
SE, NE |
-- |
| 15 Dec 2006 |
-- |
SE, W |
Continuous ash-and-steam emissions. |
| 21 Mar-27 Mar 2007 |
5.2 |
NE |
Incandescent material to 50-150 m. |
| 11 Apr-16 Apr 2007 |
6.1 |
W |
Multiple, sometimes continuous ash-and-steam emissions. |
| 26 Apr 2007 |
-- |
NW |
-- |
| 28 and 30 Apr 2007 |
-- |
-- |
Incandescent material to 100 m. |
| 31 May 2007 |
-- |
S, SW |
-- |
| 19 Sep-23 Sep 2007 |
4-4.9 |
Various |
-- |
| 31 Oct-01 Nov 2007 |
4.5 |
N |
-- |
| 26 Nov-29 Nov 2007 |
7.3 |
W, NNE |
Multiple steam and steam-and-ash plumes to 3.9-4.6 km. |
| 03 Dec-04 Dec 2007 |
-- |
-- |
Multiple steam and steam-and-ash plumes to 3.9-4.6 km. |
| 12 Dec-18 Dec 2007 |
4-4.4 |
Various |
Multiple plumes. |
| 20 Dec-25 Dec 2007 |
4.3-4.7 |
-- |
-- |
| 29 Dec-30 Dec 2007 |
4-4.3 |
Various |
Incandescent material ejected. |
| 14 Feb-19 Feb 2008 |
4.4 |
Various |
-- |
| 12 Mar-18 Mar 2008 |
3.9-4.8 |
Various |
-- |
| 01 Apr-07 Apr 2008 |
4.2-6.4 |
Various |
Multiple plumes; incandescent material ejected 150 m; incandescent avalanches. |
| 08 Apr-15 Apr 2008 |
4.5-4.9 |
Various |
Multiple plumes; incandescent material ejected 50 m. |
| 13 May 2008 |
-- |
NW |
-- |
| 03 Jun-09 Jun 2008 |
4-4.8 |
Various |
-- |
| 13 Aug-18 Aug 2008 |
4-4.7 |
Various |
Multiple plumes. |
| 22 Oct-28 Oct 2008 |
3.9-4.5 |
Various |
Multiple plumes. |
| 30 Oct-31 Oct 2008 |
4.1-4.3 |
-- |
White plumes. |
| 02 Nov 2008 |
4.6 |
SW, E |
Gray plumes. |
| 03 Dec-08 Dec 2008 |
6.4 |
-- |
Gray plumes and white plumes. |
| 09 Dec-16 Dec 2008 |
3.9-5.8 |
SE, N |
-- |
| 02 Jan 2009 |
4.1 |
-- |
Incandescent material ejected 100 m. |
| 03 Jan-05 Jan 2009 |
4-4.2 |
Various |
Multiple gray and white plumes. |
| 03 Feb-10 Feb 2009 |
3.9-4.9 |
-- |
Multiple gray and white plumes; incandescent material ejected 50 m. |
| 25 Feb-03 Mar 2009 |
3.9-4.5 |
-- |
Multiple gray and white plumes. |
| 25 Mar-31 Mar 2009 |
3.9-4.6 |
Various |
Multiple gray and white plumes. |
| 08 Apr-13 Apr 2009 |
3.9-5.2 |
Various |
Multiple gray and white plumes. |
| 21 May-25 May 2009 |
3.9-4.2 |
E, SE, S |
Multiple gray and white plumes. |
Geologic Background. The Colima complex is the most prominent volcanic center of the western Mexican Volcanic Belt. It consists of two southward-younging volcanoes, Nevado de Colima (the high point of the complex) on the north and the historically active Volcán de Colima at the south. A group of late-Pleistocene cinder cones is located on the floor of the Colima graben west and east of the complex. Volcán de Colima (also known as Volcán Fuego) is a youthful stratovolcano constructed within a 5-km-wide scarp, breached to the south, that has been the source of large debris avalanches. Major slope failures have occurred repeatedly from both the Nevado and Colima cones, producing thick debris-avalanche deposits on three sides of the complex. Frequent recorded eruptions date back to the 16th century. Occasional major explosive eruptions have destroyed the summit (most recently in 1913) and left a deep, steep-sided crater that was slowly refilled and then overtopped by lava dome growth.
Information Contacts: Observatorio Vulcanológico de la Universidad de Colima, Colima, Col., 28045, México (URL: https://portal.ucol.mx/cueiv/); Washington Volcanic Ash Advisory Center (VAAC), Satellite Analysis Branch (SAB), NOAA/NESDIS E/SP23, NOAA Science Center Room 401, 5200 Auth Rd, Camp Springs, MD 20746, USA (URL: http://www.ospo.noaa.gov/Products/atmosphere/vaac/); Gobierno del Estado de Colima (URL: http://www.colima-estado.gob.mx/2006/index.php).
Dieng Volcanic Complex (Indonesia) — April 2009 Cite this Report
Dieng Volcanic Complex
Indonesia
7.2°S, 109.879°E; summit elev. 2565 m
All times are local (unless otherwise noted)
Landslide triggers sudden, small, phreatic eruption on 15 January 2009
This report discusses a small phreatic eruption at Dieng from Sibanteng crater in January 2009. The Dieng complex covers more than 80 km2 in Central Java NW of Yogyakarta. The volcanic field trends E and contains two or more stratovolcanoes, more than 20 craters and cones, several crater lakes, a caldera, and active thermal features (van Bergen and others, 2000). Phreatic eruptions are those that eject both magmatic gasses and steam, and contain fragments of pre-existing solid rock from the volcanic conduit or vent, but without primary erupted magma. Many of these eruptions are attributed to subsurface interaction between magma and groundwater (Germanovich and Lowell, 1995). Some are precursors to phreatomagmatic and magmatic eruptions.
Recent reports discussed mud ejected from the active Sileri crater in July 2003 associated with a modest increase in seismicity and steam plumes during April-July 2002 and August 2003 (BGVN 27:05, 28:06, 28:07, and 28:09). A May 2005 pilot report of a steam plume turned out to be caused by pipe maintenance at Dieng's geothermal site.
January 2009 landslide and eruption. This event began when, after three days of heavy rain, one or more landslides broke loose in steep volcanic terrain at about the 1900- to 2000-m elevation at 0800 on 15 January 2009. Landslide debris covered the floor of Sibanteng crater, sealing the vent there. At 0830 a sudden and short-lived phreatic eruption took place. The alert level was raised to 2 (on a scale of 1 to 4).
Much of these and other details were learned by an emergency response team from the Center of Volcanology and Geological Hazard Mitigation (CVGHM), who conducted a field investigation between 16-21 January. The team's findings are discussed below (as extracted from the CVGHM report dated 22 January 2009 ("Tanggap Darurat G. Dieng Kab. Wonosobo, Prov. Jawa Tengah, tanggal 16-21 Januari 2009").
The eruption left an explosion crater about 50 m in diameter and deposited the bulk of the erupted material in a ~ 50 m radius. The erupted deposits consisted of material from the landslide and vent area. This relationship indicated that the landslide preceded the phreatic eruption. The landslides covered an area 100 x 200 m, with an estimated 40,000 m3 of debris. In places, the landslide debris created temporary dams. One blocked the Kali Putih River, and downstream, the Kali Tulis River.
On 17 January, four additional seismic stations were installed. Three were in the vicinity of the Sibanteng and Sikidang craters and one was near the thermally active colored lake Telaga Warna. Earthquakes and tremor were both absent on the seismographic record at Timbang crater during 17-20 January following the phreatic eruption.
The team reported that witnesses in the field had heard two explosions. The first came from the landslide; the second, the phreatic eruption. During their visit, the eruption vent emitted a white plume 5 m high. The vent was largely covered by landslide debris from Sibanteng crater's upper wall. In Sibanteng and other craters temperature ranges were 93.2-93.6° C, values similar to previous data.
The concentrations of gases, including hydrogen sulfide (H2S), sulfur dioxide (SO2), methane (CH4), carbon dioxide (CO2), and carbon monoxide (CO) were reported for eight locations. The CO and CO2 concentrations were below ~ 1 ppm. H2S concentrations were under ~ 7 ppm, with the highest value seen near a thermal feature at Skikdang, but a 6 ppm value near a bulletin board in a tourist area. The eight SO2 concentrations were under 18 ppm. CH4 concentrations ranged between 5 and 17 ppm. (More detailed data are available in the 22 January CVGHM report.)
The investigation indicated that the phreatic eruption was preceded by one or more landslides that covered the floor of Sibanteng crater. The team suggested that the sealing action and pressure buildup due to the landslide caused the phreatic eruption. They concluded that the phreatic eruption posed no danger to the public because the Sibanteng crater is not close to an inhabited area. However, they noted that landslide debris was still unstable and could be easily dislodged and transported by rainwater.
Reference. Germanovich, L.N., and Lowell, R.P., 1995, The mechanism of phreatic eruptions: J. Geophys. Res., v. 100 (B5), p. 8417-8434.
van Bergen, M.J., Bernard, A., Sumarti, S., Sriwana, T., and Sitorus, K., 2000, Crater lakes of Java: Dieng, Kelud and Ijen, Excursion Guidebook, IAVCEI General Assembly, Bali 2000 (URL: www.ulb.ac.be/sciences/cvl/DKIPART1.pdf).
Geologic Background. The Dieng plateau in the highlands of central Java is renowned both for the variety of its volcanic scenery and as a sacred area housing Java's oldest Hindu temples, dating back to the 9th century CE. The Dieng Volcanic Complex consists of multiple stratovolcanoes and more than 20 small Pleistocene-to-Holocene craters and cones over a 6 x 14 km area. Prahu stratovolcano was truncated by a large Pleistocene caldera, which was subsequently filled by a series of cones, lava domes, and craters, many containing lakes. Lava flows cover much of the plateau, but observed activity has been restricted to minor phreatic eruptions. Gas emissions are a hazard at several craters and have caused fatalities. There are abundant thermal features and high heat flow across the area.
Information Contacts: Center of Volcanology and Geological Hazard Mitigation (CVGHM), Jalan Diponegoro 57, Bandung 40122, Indonesia (URL: http://vsi.esdm.go.id/).
Fernandina (Ecuador) — April 2009 Cite this Report
Fernandina
Ecuador
0.37°S, 91.55°W; summit elev. 1476 m
All times are local (unless otherwise noted)
Lava flows from a 10-28 April fissure eruption reach the sea
In early April 2009, Fernandina (also known as La Cumbre volcano) erupted. According to the Ecuador Institute of Geophysics (IG), satellite data suggested that the eruption began sometime between 2200 on 10 April and 0030 on 11 April. The seismic station at Puerto Ayora, on the nearby island of Santa Cruz, recorded no earthquakes associated with this eruption. High numbers of thermal anomalies ended after 28 April. Although no report is available, photos posted by the IG show steam rising from the eruptive fissure, but no active lava emission, on 1 May.
On the morning of 11 April an eruptive column was seen by both a passing tourist boat and Galápagos National Park rangers located on Canal Bolívar. Authorities at the National Park reported both lava flows and ash plumes. A true-color MODIS image taken on the morning of 11 April showed an ash-and-steam plume rising from the area of active lava flows (figure 7).
Galápagos National Park Rangers conducted a flyover on 13 April 2009 (figure 8) and found the eruption's intensity undiminished. The eruption source was a fissure on the SW flank, in an area ~ 500 m from the summit crater near the site of the 2005 eruption. The fissure was ~ 200 m long and 10 m wide, and ejected lava fountains 15 m high. A gas-and-ash plume drifted SW. Lava traveled several kilometers in a single flow, then downslope it divided into three branches. Further downslope it merged into two flows, both of which reached the ocean. A large column of steam rose where lava poured into the ocean.
During an overflight on the morning of 15 April, personnel from the Galapagos National Park Service (GNPS) verified that the eruption continued, but with less intensity. Three vents at ~ 400 m elevation on the southwest flank along the radial fissure were active (figure 9), feeding a lava flow up to 10 m wide. The area was free of clouds, making it possible to observe a band of hot water along the coastline of the island, near the point at which the lava enters the ocean. According to a preliminary report from the research vessel sent by the GNPS to the eruption site, the lava has caused deaths among different species of fish and killed several fur seals. During 15-16 April gas-and-steam plumes from Fernandina drifted up to 555 km W.
Satellite imagery. Satellite images posted by NASA Earth Observatory showed ash plumes on 11, 12, and 27 April in MODIS imagery. All of the plumes were moving W and interpreted as ash-bearing. Based on analysis of satellite imagery, the Washington VAAC reported that during 11-14 April, gas and possible ash plumes expanded laterally up to both 300 km W and 270 km N. The eruption also produced a substantial plume of sulfur dioxide (SO2) seen in Ozone Monitoring Instrument (OMI) imagery that extended far W of the islands over the Pacific Ocean (figure 10). The Aura image indicated a tentative mass of 1.47 x 10⁵metric tons. NASA's Cloud-Aerosol Lidar and Infrared Pathfinder Satellite Observations (CALIPSO) also detected a substantial low-altitude sulfate aerosol plume at an altitude of ~ 3 km.
MODVOLC Thermal Alerts.Thermal anomalies detected by the MODVOLC system were measured from 11 April to at least 12 May 2009 (figure 11). After the initial widespread pixels on 11 April, the thermal alerts were all located on the SW flank below the caldera, and extended down to the ocean. From 11-28 April, the number of the alerts during any satellite pass was rather large, ranging from 45 pixels at the onset of the eruption to 20 pixels after two weeks. Intermittent anomalies were detected through 21 May 2009.
Geologic Background. Fernandina, the most active of Galápagos volcanoes and the one closest to the Galápagos mantle plume, is a basaltic shield volcano with a deep 5 x 6.5 km summit caldera. The volcano displays the classic "overturned soup bowl" profile of Galápagos shield volcanoes. Its caldera is elongated in a NW-SE direction and formed during several episodes of collapse. Circumferential fissures surround the caldera and were instrumental in growth of the volcano. Reporting has been poor in this uninhabited western end of the archipelago, and even a 1981 eruption was not witnessed at the time. In 1968 the caldera floor dropped 350 m following a major explosive eruption. Subsequent eruptions, mostly from vents located on or near the caldera boundary faults, have produced lava flows inside the caldera as well as those in 1995 that reached the coast from a SW-flank vent. Collapse of a nearly 1 km3 section of the east caldera wall during an eruption in 1988 produced a debris-avalanche deposit that covered much of the caldera floor and absorbed the caldera lake.
Information Contacts: Geophysical Institute (IG), Escuela Politécnica Nacional, Apartado 17-01-2759, Quito, Ecuador (URL: http://www.igepn.edu.ec/); Galápagos National Park Service, Ministry of the Environment, Isla Santa Cruz, Galápagos, Ecuador (URL: http://www.galapagospark.org/); Galapagos Conservancy, 11150 Fairfax Blvd, Suite 408, Fairfax, VA 22030, USA (URL: http://www.galapagos.org/); Washington Volcanic Ash Advisory Center (VAAC), Satellite Analysis Branch, NOAA/NESDIS E/SP23, NOAA Science Center Room 401, 5200 Auth Road, Camp Springs, MD 20746, USA (URL: http://www.ssd.noaa.gov/); Hawai'i Institute of Geophysics and Planetology (HIGP) Thermal Alerts System, School of Ocean and Earth Science and Technology (SOEST), Univ. of Hawai'i, 2525 Correa Road, Honolulu, HI 96822, USA (URL: http://modis.higp.hawaii.edu/); Simon Carn, Dept of Geological and Mining Engineering and Sciences, Michigan Technological University, 1400 Townsend Dr., Houghton, MI 49931, USA (URL: https://so2.gsfc.nasa.gov/); NASA Earth Observatory (URL: http://earthobservatory.nasa.gov/).
Lewotobi (Indonesia) — April 2009 Cite this Report
Lewotobi
Indonesia
8.542°S, 122.775°E; summit elev. 1703 m
All times are local (unless otherwise noted)
Drops in steaming and seismicity during March 2009
Unrest caused authorities to elevate the alert level here to 2 in May 2008 (BGVN 34:01). No ash emissions were reported, as has been the case since 2003 (BGVN28:06, 28:10, 34:01).
On 23 March 2009, the Center for Volcanology and the Mitigation of Geologic Disaster (CVGHM) lowered the alert level on Lewotobi from 2 to 1 (on a scale of 1-4). This shift was based on visual observations and decreased seismicity during March. Rarely seen diffuse white plumes rose 25 m above the crater and drifted E. Visitors and residents continued to be advised not to approach the crater.
Over the period 1-23 March 2009 a cluster of shallow volcanic earthquakes occurred. Their initial numbers, 5-25 daily, soon declined to 1-5 occurrences per day. The total number of deep volcanic earthquakes did not change, averaging 1-3 daily. No tremor had been recorded since 1 February 2009 and at least as late as mid-2009.
Geologic Background. The Lewotobi edifice in eastern Flores Island is composed of the two adjacent Lewotobi Laki-laki and Lewotobi Perempuan stratovolcanoes (the "husband and wife"). Their summits are less than 2 km apart along a NW-SE line. The conical Laki-laki to the NW has been frequently active during the 19th and 20th centuries, while the taller and broader Perempuan has had observed eruptions in 1921 and 1935. Small lava domes have grown during the 20th century in both of the summit craters, which are open to the north. A prominent cone, Iliwokar, occurs on the E flank of Perampuan.
Information Contacts: Center of Volcanology and Geological Hazard Mitigation (CVGHM), Jalan Diponegoro 57, Bandung 40122, Indonesia (URL: http://vsi.esdm.go.id/); Hawai'i Institute of Geophysics and Planetology (HIGP) Thermal Alerts System, School of Ocean and Earth Science and Technology (SOEST), Univ. of Hawai'i, 2525 Correa Road, Honolulu, HI 96822, USA (URL: http://modis.higp.hawaii.edu/); Darwin Volcanic Ash Advisory Centre (VAAC), Bureau of Meteorology, Northern Territory Regional Office, PO Box 40050, Casuarina, NT 0811, Australia (URL: http://www.bom.gov.au/info/vaac/); Agence France-Presse (URL: http://www.afp.com/); Jakarta Post (URL: http://www.thejakartapost.com/).
Obituary Notices (Unknown) — April 2009 Cite this Report
Obituary Notices
Unknown
Unknown, Unknown; summit elev. m
All times are local (unless otherwise noted)
Death of Tom Simkin, founder and Director of the Global Volcanism Program until 1995
Tom Simkin, who founded and for 28 years served as director of the Global Volcanism Program, died on 10 June at the age of 75 from complications after surgery for esophageal cancer, an ailment diagnosed ~6 months earlier. Tom saw our reporting on Earth's volcanism evolve from brief reports transmitted by postcard to its current formats in print and in various forms on the web. He began by incorporating previous databases, and enlisting volcano watchers to share their observations with the Smithsonian. This led to the most comprehensive database available on global volcanism during the past 10,000 years (the Holocene). This allowed Tom to write authoritative, pioneering papers describing the pace and character of active global volcanism. He authored two editions of the sought-after reference book, Volcanoes of the World, and had been collaborating in retirement on the third edition, an effort that will continue in his absence.
He received a bachelors degree from Swarthmore College and a Ph.D. from Princeton University and was known for his field studies on both North Skye in the U.K. and Fernandina and other Galápagos Islands volcanoes. He edited books commemorating the Krakatau 1883 eruption and the Parícutin 1943-52 eruption. He led efforts to create the popular wall map This Dynamic Planet, which plots earthquakes, volcanoes, meteorite impacts, and tectonic plate parameters; the map's latest (2006) edition features a companion website enabling users to prepare customized images. In recognition of his contributions to volcanology, Tom received the Krafft Medal (IAVCEI) in 2004 and was recently awarded the Jefferson Medal from the Virginia Museum of Natural History for 2010.
Geologic Background. Obituary notices for volcanologists are sometimes written when scientists are killed during an eruption or have had a special relationship with the Global Volcanism Program.
Information Contacts:
Redoubt (United States) — April 2009 Cite this Report
Redoubt
United States
60.485°N, 152.742°W; summit elev. 3108 m
All times are local (unless otherwise noted)
First eruption since 1989-1990; over19 explosions; growth of new lava dome
The previous eruption of Redoubt that began on 14 December 1989 (SEAN 14:11) lasted until June 1990. On 15 March 2009, an eruption again occurred, after changes in gas emissions, seismicity, and heat output were noted during the previous 8 months (BGVN 33:11).
As background, in late July 2008, Alaska Volcano Observatory (AVO) crews working near the summit smelled hydrogen sulfide (H2S) gas. About a month later, a pilot reported a strong sulfur-dioxide (SO2) odor, and nearby residents heard noises coming from the direction of Redoubt. Scientists also observed several fractures and circular openings in the upper Drift Glacier, and they found fumaroles atop the 1968 and 1990 lava domes more vigorous than when last observed in mid-August 2008. On 13 October 2008, satellite instruments detected warming at the summit, and on 2 November a slushy debris-flow originated near the 1966-68 vent. On 16 December 2008 a short-lived steam cloud rose no higher than the volcano's summit.
The rest of this report discusses unrest starting in late January 2009, and gives a brief overview of the eruption from the first ash-bearing explosions detected on 15 March, through those continuing during mid-May. Figure 18 shows a map of the area; the volcano sits along the Cook Inlet ~ 80 km WSW of Anchorage (see also figure 12 in BGVN 15:04; and Waythomas and others, 1998).
During 24-25 January 2009, Redoubt's seismicity increased markedly and steam and sulfurous gases were noted. On 25 January, tremor became sustained and amplitude increased notably. Steaming increased at previously identified vent areas in the snow and ice cover, which also emitted sulfurous gas. An overflight on 26 January revealed elevated SO2 emissions from the summit and new outflows of muddy debris along the glacier that is downslope of the summit. Seismicity was variable during the last few days of January extending into early March, but it remained above background levels. Observations revealed increased fumarolic activity, enlarged melt features in the summit glacier, and increased runoff from along the margins of the Drift glacier, which feeds the river system of the same name down Redoubt's N-flank (figure 18). Steam plumes within the summit crater were seen on the web camera.
The 2009 eruption began with a minor ash-and-steam explosion just after 1300 on 15 March; major explosions began at about 2240. The emissions originated from a new vent, located just S of the 1990 lava dome and W of the prominent ice collapse feature near the N edge of the summit crater. A sediment-laden flow occurred from a small area in the ice on the upper part of Drift glacier (figure 19).
During 15 March-4 April, AVO recorded more than 19 separate explosions and reported that ash plumes exceeded altitudes of 15.2 km. The largest explosion occurred at 0555 on 4 April. This explosion lasted more than 30 minutes, and was comparable in size to the largest event of the 1989-1990 eruption. The explosion produced an ash plume that rose to an altitude of 15.2 km and drifted SE. [However, the highest plume during this time rose to almost 20 km altitude, on 26 March.]
The eruptions caused melting of the Drift Glacier and greatly increased discharge, causing lahars in the Drift River that traveled more than 35 km, reaching the Cook Inlet. On 23 March, AVO staff saw large lahar and flood deposits in the Drift River valley. In the middle to upper Drift River valley, high-water marks reached 6-8 m above the valley floor. Some of these deposits were observed on 30 April (figure 20).
Several of the explosions resulted in ashfall in several populated areas, as far away as Delta Junction (~ 545 km NE). More significant ashfall occurred in more contiguous areas, including the Matanuska-Susitna Valley, the Kenai Peninsula and the Anchorage bowl. Satellite images showed a broad layer of volcanic haze that extended over these areas. On 22 March, ashfall was reported in areas 190-250 km NE. According to a 29 March Associated Press article, flights in and out of Anchorage and other local areas were canceled or diverted during 24-28 March. As many as 185 Alaska Airlines flights had been canceled since the beginning of the eruption; airports and other airlines also experienced service disruptions. The maximum thickness of ashfall measured in a populated area was about 1.5 mm near Seldovia, following the 4 April explosion. A measurement of about 3 mm, following the explosion on 26 March, was recorded near Silver Salmon Creek Lodge, about 48 km S. Trace ashfall was also observed between explosive events, during times when the volcano emitted continuous low-altitude (under 4.6 km) gas-and-ash plumes.
On 30 March a thermal anomaly at the vent seen on satellite imagery was caused by the extrusion of a lava dome in the summit crater (confirmed by AVO on 3 April). Observers also recognized that the dome had already began spilling occasional avalanches of hot blocks a short distance down the N flank. Observations on 9 April determined that the lava dome, which had grown in the same location as the previous one, was circular in shape, and 400 m in diameter. By 16 April, the lava dome was estimated to be about 500 x 700 m across and at least 50 m thick (figure 21). A volume estimate of the still-expanding dome made during 29 April-5 May suggested a volume of 25-30 million cubic meters.
After the last explosion detected on 4 April and until mid-May, small steam-and-gas plumes occasionally containing some ash were seen on satellite imagery and on the web camera. Elevated seismicity and satellite imagery indicated that the lava dome continued to grow. SO2 plumes were also detected by satellite imagery. Occasional rockfalls originating from the lava dome's flanks were observed on the web camera.
Reference. Waythomas, C.F., Dorava, J.M., Miller, T.M., Neal, C.A., and McGimsey, R.A., 1998, Preliminary volcano-hazard assessment for Redoubt volcano, Alaska: USGS Open File report 97-857, plate 1.
Geologic Background. Redoubt is a glacier-covered stratovolcano with a breached summit crater in Lake Clark National Park about 170 km SW of Anchorage. Next to Mount Spurr, Redoubt has been the most active Holocene volcano in the upper Cook Inlet. The volcano was constructed beginning about 890,000 years ago over Mesozoic granitic rocks of the Alaska-Aleutian Range batholith. Collapse of the summit 13,000-10,500 years ago produced a major debris avalanche that reached Cook Inlet. Holocene activity has included the emplacement of a large debris avalanche and clay-rich lahars that dammed Lake Crescent on the south side and reached Cook Inlet about 3,500 years ago. Eruptions during the past few centuries have affected only the Drift River drainage on the north. Historical eruptions have originated from a vent at the north end of the 1.8-km-wide breached summit crater. The 1989-90 eruption had severe economic impact on the Cook Inlet region and affected air traffic far beyond the volcano.
Information Contacts: Alaska Volcano Observatory (AVO), a cooperative program of a) U.S. Geological Survey, 4200 University Drive, Anchorage, AK 99508-4667, USA (URL: http://www.avo.alaska.edu/), b) Geophysical Institute, University of Alaska, PO Box 757320, Fairbanks, AK 99775-7320, USA, and c) Alaska Division of Geological & Geophysical Surveys, 794 University Ave., Suite 200, Fairbanks, AK 99709, USA; Associated Press (URL: http://www.ap.org/).